creatinine standardization - dr. taraiacld.com/dl/co/10/creatininestandardizationdrtara.pdf · the...
TRANSCRIPT

Creatinine standardizationCreatinine standardizationThe most important expectation ofThe most important expectation of
Nephrologists All physicians
Patients
Health care system
Policy makers
World health leaders
Researchers
Drug manufacturerDrug manufacturer
Clinical laboratories
from Iranian laboratory systemIranian laboratory system

LAB TESTS AS LAB TESTS AS In modern medicine
LAB TESTS AS LAB TESTS AS DOUBLEDOUBLE--EDGED EDGED SWORDSWORDSWORDSWORD

An example :An example :An example :An example :
One recent study in the United States:y◦ laboratory calibration errors that affect the
accuracy of calcium test results is costing $66 to $199 million dollars per year as a result of the costs of the clinical decisions that were
d i t th i t l i made in response to the inaccurate calcium test results
Downer K: How much does test calibration error cost? NIST report suggests $60-$199M for calcium testing alone. Clin Lab News 30(4): 1, 8–9, 2004
NONCOMMUNICABLENONCOMMUNICABLENONCOMMUNICABLENONCOMMUNICABLEDISEASE IS THE PROBLEM DISEASE IS THE PROBLEM OF DEVELOPED AND OF DEVELOPED AND OF DEVELOPED AND OF DEVELOPED AND DEVELOPING COUNTRIESDEVELOPING COUNTRIES

Chronic kidney disease (CKD) is a Chronic kidney disease (CKD) is a worldwide public health problemworldwide public health problem
Number of end-stage renal disease (ESRD) Medicare-funded patients in US:( S ) e ca e u e pat e ts US:From 86,354 in 1983, to 547,982 as of 2008Medicare costs per person per year is $66,000Medicare costs per person per year is $66,000
The estimated number of people with earlier stages of CKD is 19 millionearlier stages of CKD is 19 million
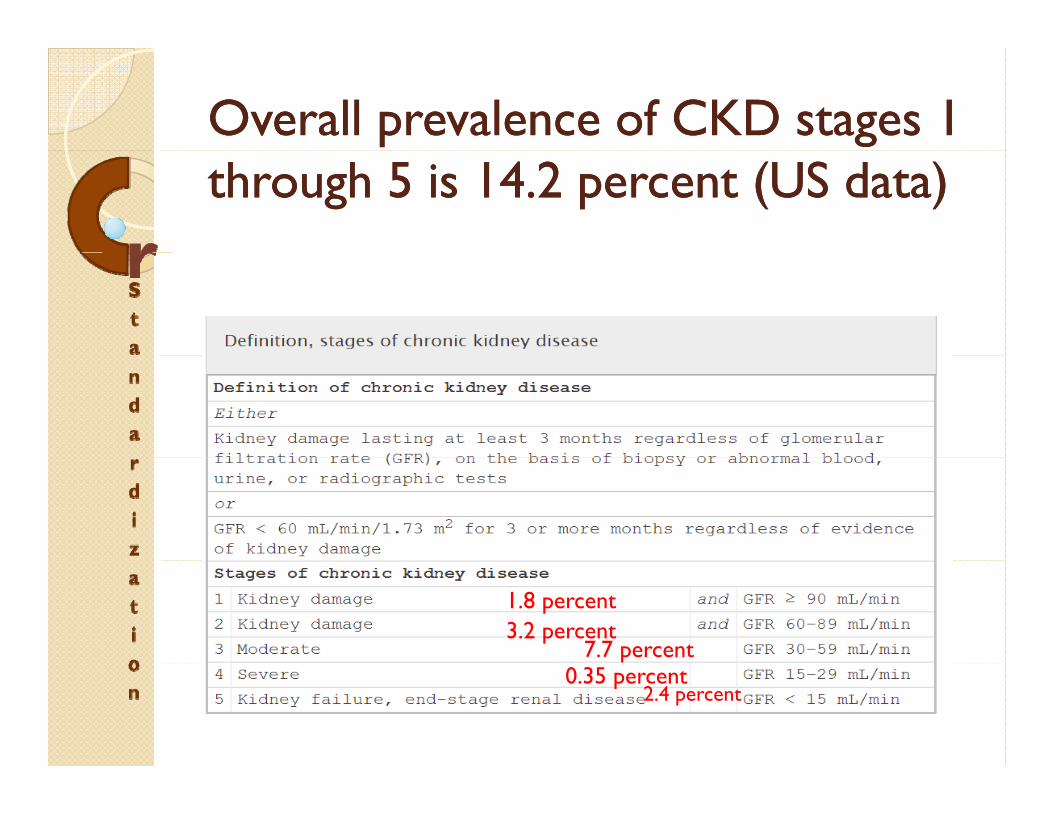
Overall prevalence of CKD stages 1 Overall prevalence of CKD stages 1 through 5 is 14.2 percent (US data)through 5 is 14.2 percent (US data)
1.8 percent 3.2 percent
7.7 percent0.35 percent
2.4 percent

IRAN IRAN CKDCKD STATISTICSSTATISTICSIRAN IRAN CKDCKD STATISTICSSTATISTICS
پيشگيری از بيماری ھای کليوی در ایران
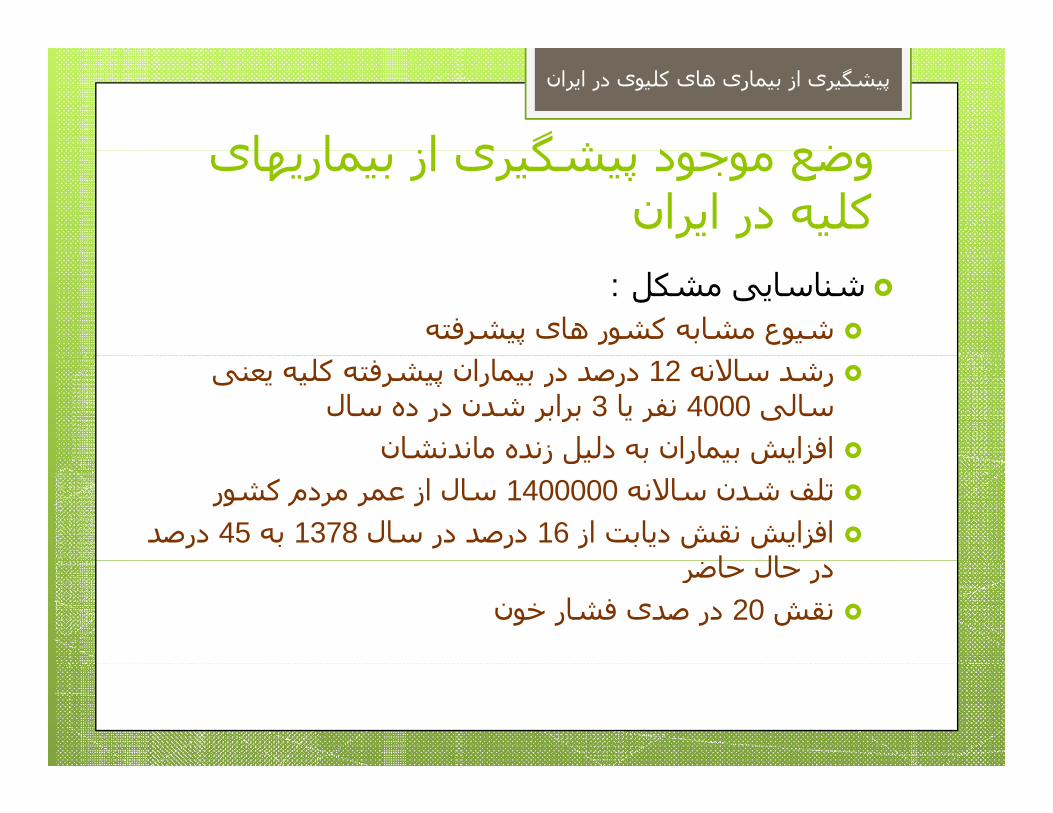
ای ا از ی شگ د وضع موجود پيشگيری از بيماریھای ضعایرانکليه در
:شناسایی مشکل پيشرفتهشيوع مشابه کشور ھای
درصد در بيماران پيشرفته کليه یعنی 12رشد ساالنهسالبرابر شدن در ده 3نفر یا 4000سالی
زنده دليل به بيماران ماندنشانافزایش ماندنشانافزایش بيماران به دليل زندهکشورسال از عمر مردم 1400000تلف شدن ساالنه
درصد 45به 1378درصد در سال 16افزایش نقش دیابت از اال حاضردر حالخونفشار صدیدر 20نقش
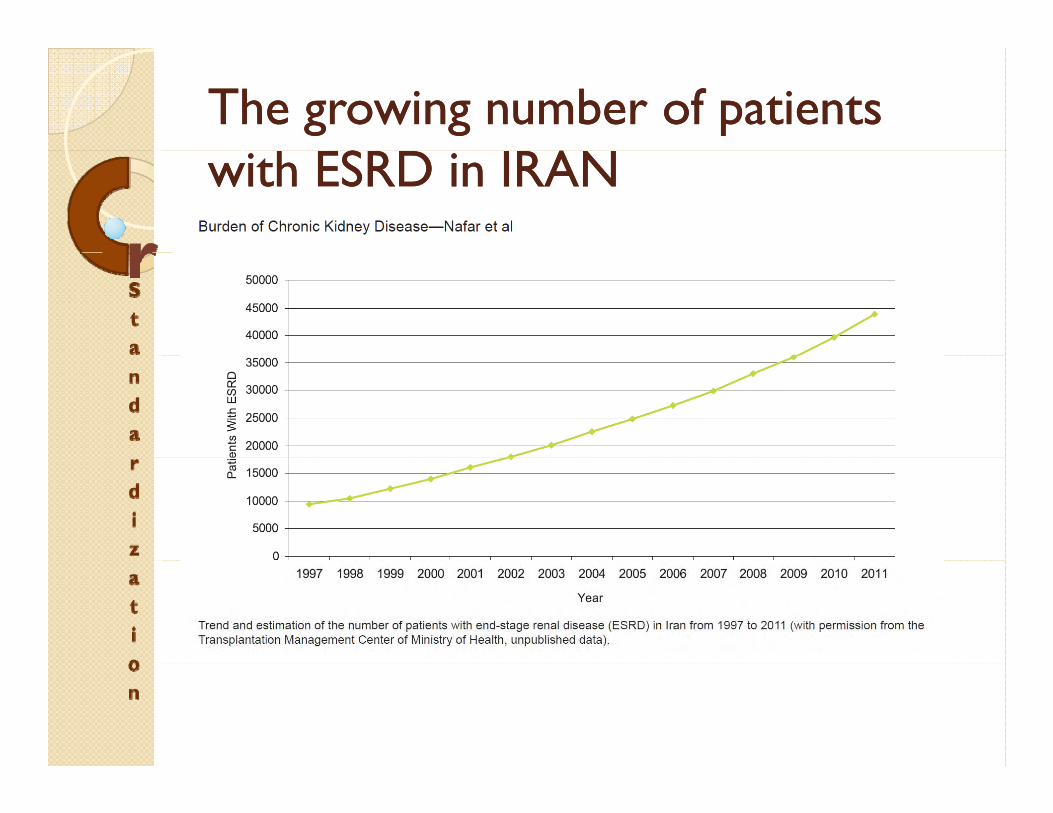
The growing number of patients The growing number of patients with ESRD in IRANwith ESRD in IRAN
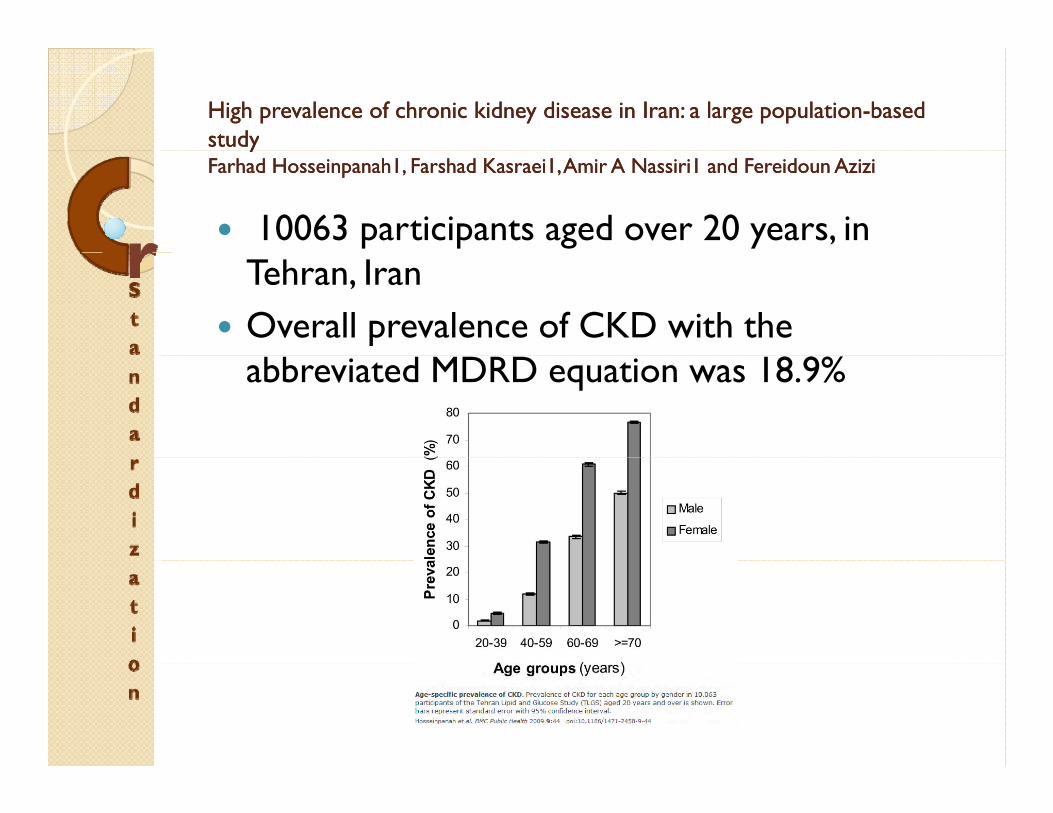
High prevalence of chronic kidney disease in Iran: a large populationHigh prevalence of chronic kidney disease in Iran: a large population--based based studystudyyyFarhadFarhad HosseinpanahHosseinpanah11, , FarshadFarshad KasraeiKasraei11, Amir A Nassiri, Amir A Nassiri1 1 and and FereidounFereidoun AziziAzizi
10063 participants aged over 20 years, in Tehran, IranOverall prevalence of CKD with the abbreviated MDRD equation was 18.9%
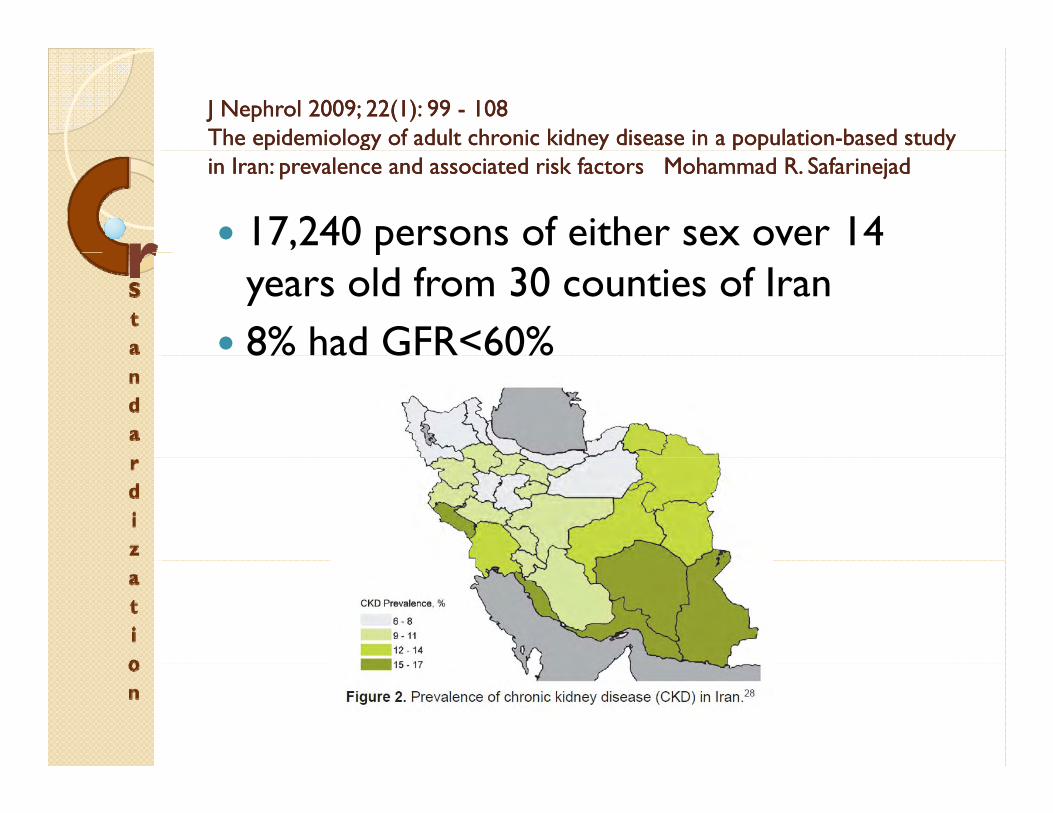
J J NephrolNephrol 20092009; ; 2222((11): ): 99 99 -- 108108The epidemiology of adult chronic kidney disease in a populationThe epidemiology of adult chronic kidney disease in a population--based study based study p gy y p pp gy y p p yyin Iran: prevalence and associated risk in Iran: prevalence and associated risk factors Mohammad R. factors Mohammad R. SafarinejadSafarinejad
17,240 persons of either sex over 14 pyears old from 30 counties of Iran 8% had GFR<60%8% a G 60%

Prevalence of Chronic Kidney Disease and its Associated Risk Factors: Prevalence of Chronic Kidney Disease and its Associated Risk Factors: The First Report from Iran Using Both Micro albuminuria and Urine The First Report from Iran Using Both Micro albuminuria and Urine p gp gSediment Sediment IrajIraj NajafiNajafi , et al , et al 20122012
1557 enrolled subjects in this study(8.89%) were categorized as CKD stages III-V
3591 participants (≥18 years old)Prevalence of CKD stages 3 to 5 (CKD–g (S3-5), i.e., GFR <60 mL/min/1.73 m2, was 4.6%

A high serum creatinine level was gconsidered 1.5 mg/dL or higher in men and 1.3 mg/dL or higher in womeng gA high serum creatinine level was demonstrated in 343 participants (37.9%),p p ( ),

Screening for decreased renal function in taxi drivers in Tehran, Iran.Screening for decreased renal function in taxi drivers in Tehran, Iran.MahdaviMahdavi--MazdehMazdeh M, M, SaeedSaeed HashemiHashemi NazriNazri S, S, HajghasemiHajghasemi E, E, NozariNozari B, B, ZinatZinat Nadia H, Mahdavi A.Nadia H, Mahdavi A.SourceSourceDepartment of Nephrology, Tehran University of Medical Sciences; Research Center of Iranian Tissue Department of Nephrology, Tehran University of Medical Sciences; Research Center of Iranian Tissue Bank, Tehran, Iran.Bank, Tehran, Iran.
The survey covered 31,999 taxi driver yacross TehranUsing the MDRD equation, overall Us g t e equat o , ove a prevalence of eGFR <60 mL/min/1.73 m(2) was 6.5%( )
MANAGEMENT OF MANAGEMENT OF MANAGEMENT OF MANAGEMENT OF CRISIS CRISIS

The main steps in CKD crisis The main steps in CKD crisis managementmanagement1. Epidemiologic studies (Spec. in high risk p g ( p g
groups)2. Defining the burden of CKD. e g t e bu e o C3. Classification and guideline development4 Clinical researches4. Clinical researches5. Comparative studies6. Primary and secondary prevention

No Cr Std = Fail to reach finish lineNo Cr Std = Fail to reach finish lineNo Cr Std. = Fail to reach finish lineNo Cr Std. = Fail to reach finish line

LABORATORY TESTS LABORATORY TESTS LABORATORY TESTS LABORATORY TESTS OF KIDNEY PROBLEMSOF KIDNEY PROBLEMS
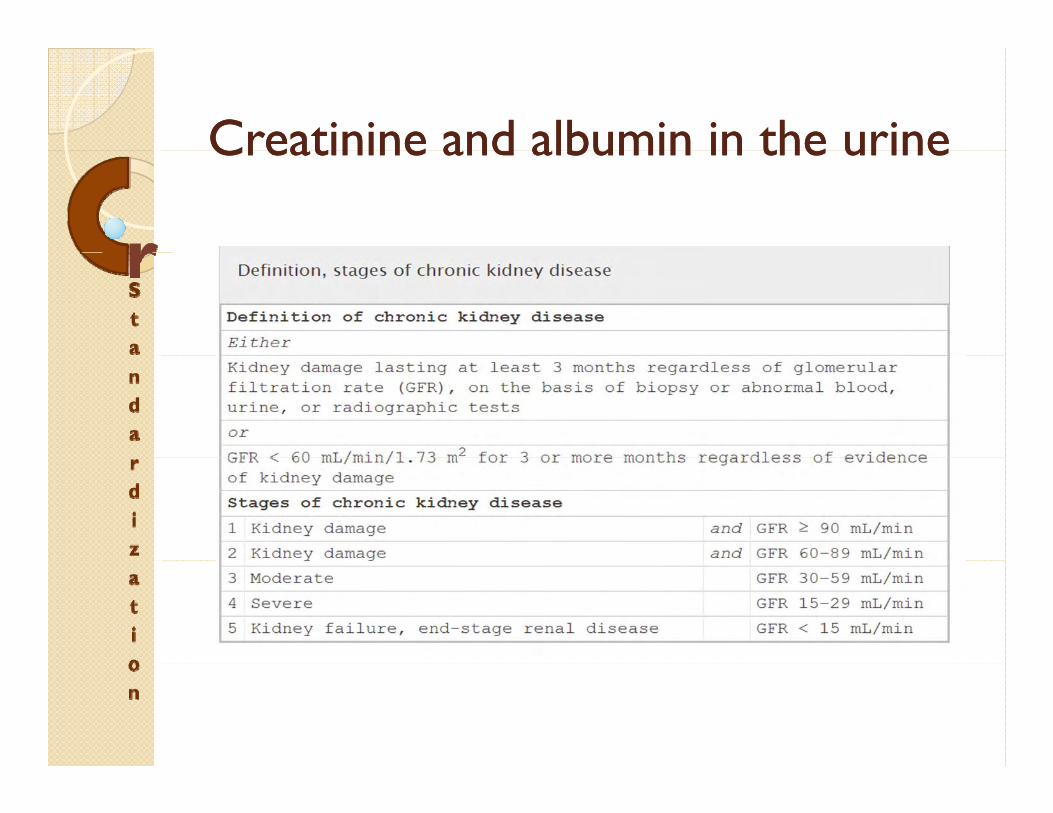
Creatinine and albumin in the urineCreatinine and albumin in the urineCreatinine and albumin in the urineCreatinine and albumin in the urine

GFRGFRGFRGFRTESTS AND FORMULASTESTS AND FORMULAS
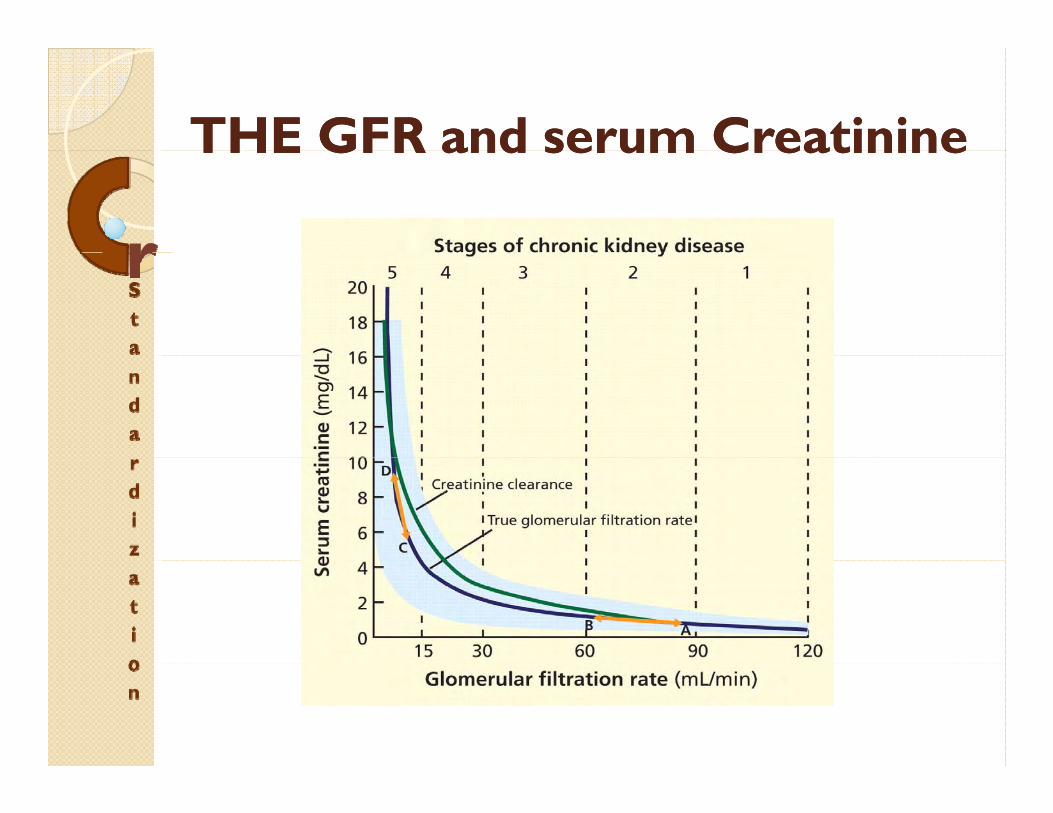
THE GFR and serum CreatinineTHE GFR and serum CreatinineTHE GFR and serum CreatinineTHE GFR and serum Creatinine
Gold standards tests for Gold standards tests for GFR GFR mesearmentmesearment
The urinary clearance of the exogenous y gsubstance inulin is considered the gold standard methodRadioisotopes such as iothalamate and other markers have replaced inulin in pclinical laboratoriesThese methods are expensive time-These methods are expensive, timeconsuming, and not widely available

ESTIMATING THE GFR(eGFR)ESTIMATING THE GFR(eGFR)ESTIMATING THE GFR(eGFR)ESTIMATING THE GFR(eGFR)
Measuring 24-hour creatinine clearanceg◦ Burdensome for the patient◦ The results are not always reliable because of y
variations in collection technique◦ Using the creatinine clearance does not
resolve problems with using the serum creatinine concentration, such as tubular
i d i i f GFRsecretion and overestimation of GFR.CCr = [urine creatinine (mg per dL) x urine volume (mL per 24 hour)] /[serum Cr (mg per dL) x 1, 440 minute]( g p ) ]

The CockcroftThe Cockcroft--GaultGault equationequationGFR GFR = [([= [([140 140 —— age (years)] x lean body weight in age (years)] x lean body weight in kg)/(serum Cr x kg)/(serum Cr x 7272)] x ()] x (00..85 85 if female)if female)
Its main drawbacks:◦ It was developed to model creatinine It was developed to model creatinine
clearance, itself an imperfect estimation of GFR ◦ It depends heavily on the accuracy of the
value for “lean” body weight used in the equation.

MDRD MDRD MDRD MDRD • Modified MDRD formula
GFR in mL per minute per 1 73 m2 = 186 3 x (serum Cr-1.134)GFR, in mL per minute per 1.73 m2 186.3 x (serum Cr 1.134)x (age-0.203) x (0.742 if female)
x (1.21 if black)
• The MDRD e ati n has n lar el re laced the C ckcr ft Ga lt• The MDRD equation has now largely replaced the Cockcroft-Gaultequation
• it is normalized to a standard body surface area (1.73 m2), obviating the need to determine ideal body weight
• can be reported directly with any laboratory report
• The main drawback of the MDRD equation is that it tends to • The main drawback of the MDRD equation is that it tends to underestimate GFRunderestimate GFR at higher ranges of kidney function, ie, higher than 60 mL/min/1.73 m2)
• less accurate at racial and ethnic groups outside of North America, Europe, and Australia

The CKDThe CKD--EPI equationEPI equationThe CKDThe CKD EPI equationEPI equationThe Chronic Kidney Disease Epidemiology Collaboration study (CKD EPI) equation (2009 ) Collaboration study (CKD-EPI) equation, (2009,) is expected to eventually replace the currently used MDRD equation, as it performs better at higher ranges of GFRhigher ranges of GFRIt was developed with the objective of reporting a specific value even when the estimated GFR is
h 60 L/ i /1 73 2greater than 60 mL/min/1.73 m2
Schwartz Schwartz andandthe the CounahanCounahan––Barratt equations Barratt equations
For estimating GFR in childrengThe MDRD contributes to substantial uncertainty in estimating GFR in childreny g
MDRD or CKDMDRD or CKD--EPIEPIMDRD or CKDMDRD or CKD EPIEPI
Neither the CKD-EPI nor the MDRD Study equation is optimal for all populations and GFR rangesp p gA general practice and public health perspective favors the CKD-EPI equationp p qFor nephrology practices and transplant patients the MDRD is better patients the MDRD is better
eGFR ReportingeGFR ReportingeGFR ReportingeGFR Reporting
Estimates of glomerular filtration rate g(GFR) from serum creatinine levels are now reported by more than 80% of p yclinical laboratories in the United States ◦ staging chronic kidney disease g g y◦ determining drug dosages◦ stratifying risk y g

TRUENESS OF CRTRUENESS OF CRTRUENESS OF CRTRUENESS OF CRPRECISION AND PRECISION AND STANDARDISATIONSTANDARDISATIONSTANDARDISATIONSTANDARDISATION
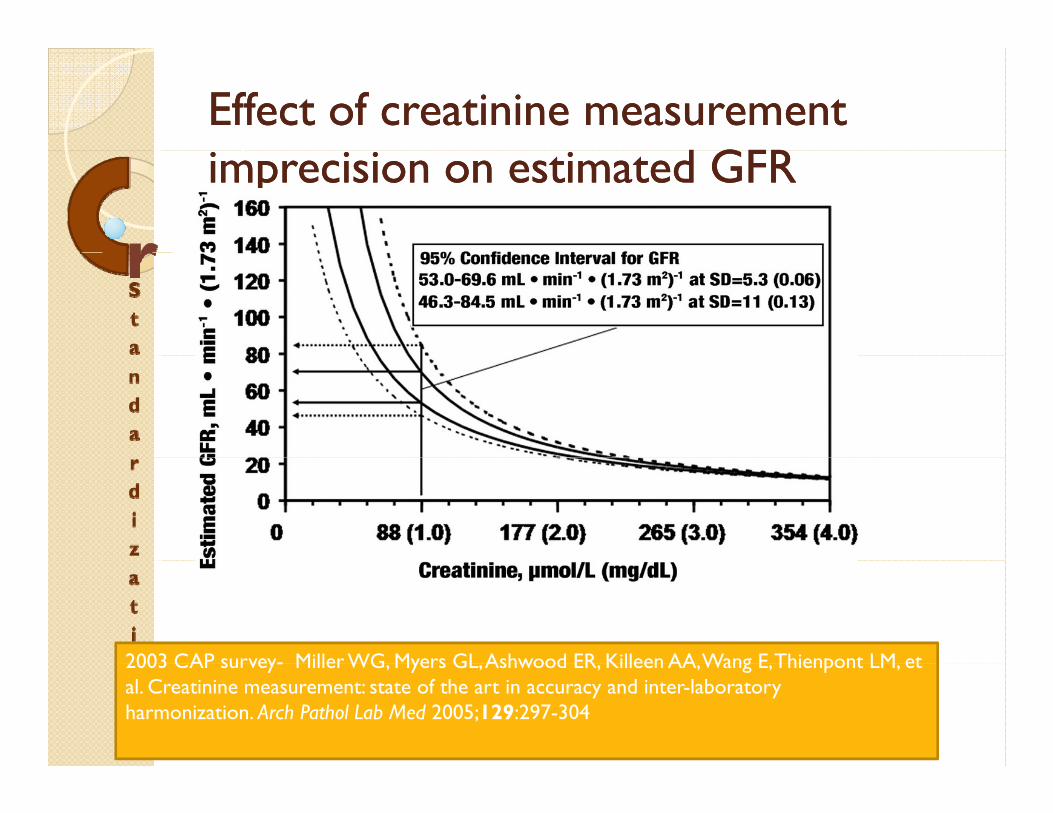
Effect of creatinine measurement Effect of creatinine measurement d GFR d GFRimprecision on estimated GFRimprecision on estimated GFR
2003 CAP survey- Miller WG Myers GL Ashwood ER Killeen AA Wang E Thienpont LM et 2003 CAP survey- Miller WG, Myers GL, Ashwood ER, Killeen AA, Wang E, Thienpont LM, et al. Creatinine measurement: state of the art in accuracy and inter-laboratory harmonization. Arch Pathol Lab Med 2005;129:297-304

Clinical LaboratoryClinical Laboratory––Based Analytical Based Analytical Systems for Measuring Serum Creatinine Systems for Measuring Serum Creatinine to Assess GFRto Assess GFR
The methods most widely used to measure serum creatinine:◦ alkaline picrate methods◦ enzymatic or partially enzymatic assays◦ HPLC methods
Isotope-dilution mass spectrometry (IDMS) high-order reference methods have been developed for assignment of reference materials but are available in only a few hi hl i li d l b i ld idhighly specialized laboratories worldwide.

alkaline picrate methodsalkaline picrate methodsalkaline picrate methodsalkaline picrate methodsThe method of Jaffe
Th f f ◦ The presence of interfering substances, particularly proteins, in serum can lead to the overestimation of serum creatinine by
h 15% 25% b i J ff as much as 15%–25% by various Jaffe methodologic applications◦ Interferences from glucose and acetoacetate are
particularly important◦ by measuring several hundred serum pools by
gas chromatography (GC)-IDMS and the Jaffe g g p y ( ) Jmethod
Results indicated that to get agreement with the enzymatic method, an offset of 0.234 mg/dL was y gnecessary

enzymatic methodsenzymatic methodsenzymatic methodsenzymatic methods
Although the enzymatic methods have g ybeen reported to have generally fewer interferences than the Jaffe Jmethods, there have been reports of various substances that do interfere

HPLC proceduresHPLC proceduresHPLC proceduresHPLC procedures
HPLC appears to provide an excellent pp pdesignated comparison method for in-house use by manufacturersy
msms--based proceduresbased proceduresmsms based proceduresbased procedures
GC-IDMS is considered the method of choice for establishing the true concentration of creatinine in serum because of its excellent specificity and relative SD <0.3%

ISO for ISO for tracebilitytracebility of Lab resultsof Lab resultsISO for ISO for tracebilitytracebility of Lab resultsof Lab resultsA unified effort is requiredEstablishing measurement traceability is an important tool Establishing measurement traceability is an important tool This effort must involve international cooperation among the in vitro diagnostic (IVD) manufacturers, clinical laboratories, professional organizations, government , p g , gagencies, and EQAS/PT providers.To achieve improved accuracy of creatinine results requires that the values assigned by manufacturers to calibrators and
l i l bl hi h d f control materials are traceable to high-order reference measurement procedures and reference materials. The international organization for standardization (iso) has developed a written standard that details a pathway for developed a written standard that details a pathway for establishing traceability of clinical laboratory measurement results
We are not too late if we began todayWe are not too late if we began todayWe are not too late if we began todayWe are not too late if we began today
In 2006, a serum matrix standard reference material (SRM) was prepared by the National Institute of Standards and Technology and submitted to the Joint C itt T bilit i L b t M di i Committee on Traceability in Laboratory Medicine Use of this material, in combination with the isotope-dilution mass spectrometry reference method, was i d d i f i hi i intended to assist reagent manufacturers in achieving better consensus among methods By the end of 2009, the calibration of most clinical l b h d bl h SRM d laboratory methods was traceable to the SRM and isotope-dilution mass spectrometry

THE BRITISH COLOMBIA THE BRITISH COLOMBIA THE BRITISH COLOMBIA THE BRITISH COLOMBIA STANDARDIZATION STANDARDIZATION PROGRAMPROGRAMPROGRAMPROGRAM
J A S N h l 19 164 169 2008 d i 10 1681/ASN 2007020156J Am Soc Nephrol 19: 164–169, 2008. doi: 10.1681/ASN.2007020156

AbstractAbstractAbstractAbstract107 laboratories, which tested creatinine on 124 analyzers from six different manufacturers, voluntarily participatedfrom six different manufacturers, voluntarily participatedEach laboratory received a correction factor to standardize them to the isotope dilution mass spectrometry reference methodThe adjusted values were then used to calculate eGFR using the Modification of Diet in Renal Disease (MDRD) equationThe standardization program reduced the average total error i h f i i f 23 9 8 7% d h in the measurement of creatinine from 23.9 to 8.7% and the average analytical bias from 16.5 to 2.7%Implementing this program on a larger scale could reduce the rate of incorrect classification of stage 3 chronic kidney the rate of incorrect classification of stage 3 chronic kidney disease by 84%
IntroductionIntroductionIntroductionIntroductionSerum creatinine test results can vary significantly between clinical laboratories, a fact that is often not well recognized by health care professionalshealth care professionalsThis variation is greater in the normal and near-normal range of creatinine near normal range of creatinine measurementsRegional initiatives to implement eGFR g preporting must first take steps to standardize the Cr

Location of studyLocation of studyLocation of studyLocation of studyBritish Columbia introduced eGFR reporting in October 2003, and in March 2004, a provincial program was introduced to standardize the measurement of creatininestandardize the measurement of creatinineBritish Columbia is a province in Canada with a population of approximately 4.1 with a population of approximately 4.1 million people.The provincial creatinine standardization pprogram is a voluntary project, which was carried out in partnership with the Canadian E l Q li A L bExternal Quality Assessment Laboratory

ResultsResultsResultsResults
funded centrally and operates on a y pvoluntary basisThe majority (94%) of clinical laboratories e ajo ty (9 %) o c ca abo ato es in British Columbia are participating
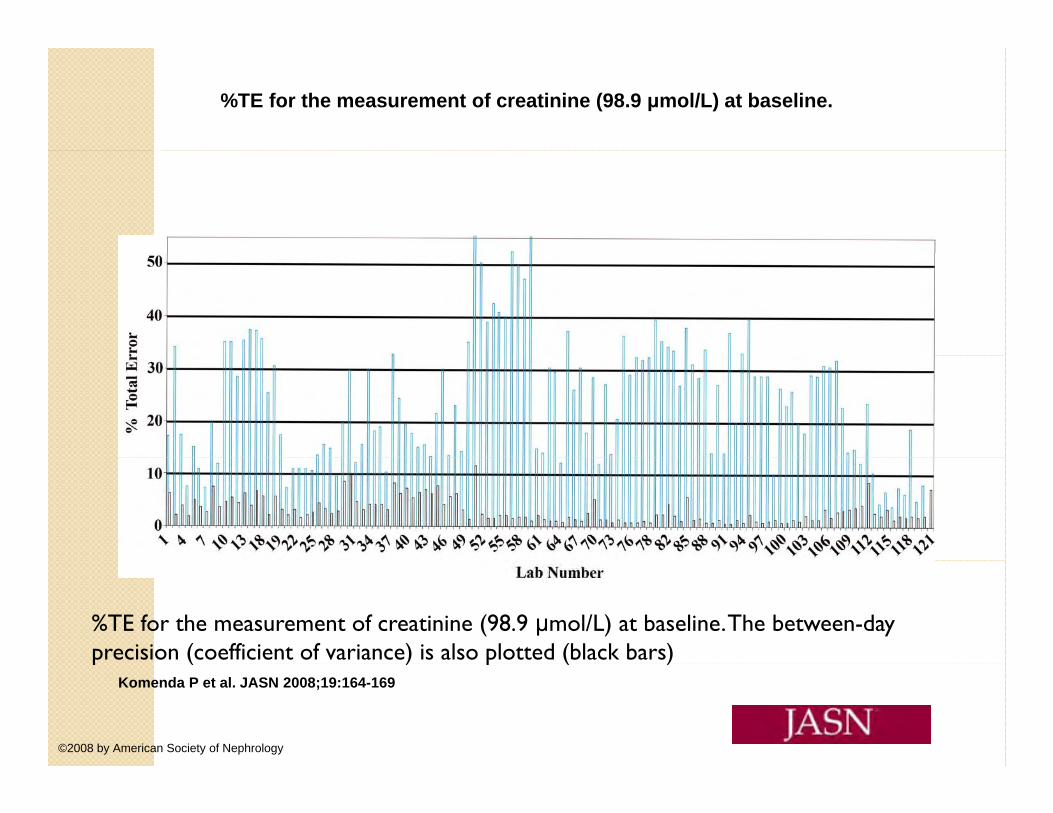
%TE for the measurement of creatinine (98.9 μmol/L) at baseline.
%TE for the measurement of creatinine (98.9 μmol/L) at baseline. The between-day precision (coefficient of variance) is also plotted (black bars)
Komenda P et al. JASN 2008;19:164-169
©2008 by American Society of Nephrology
p ( ) p ( )
The percentage total error (%TE) ranged f 4 t 54% ith ll i i l from 4 to 54% with an overall provincial average of 23.9%if a serum sample with a true creatinine if a serum sample with a true creatinine concentration of 100 μmol/L were to be measured in the best laboratory in the province then the reported result would fall province, then the reported result would fall between 96 and 104 μmol/L 95% of the time; if it were tested in the worst l b h h d l ld laboratory, then the reported result would be fall between 45 and 154 μmol/L 95% of the time

(A) Unadjusted creatinine performed on one test sample from each of the 107 laboratories in the province as compared with the reference sample.
The average calibration bias for the measurement of creatinine across the province was 16.5% (positive)(positive)
Komenda P et al. JASN 2008;19:164-169
©2008 by American Society of Nephrology


Program CostProgram CostProgram CostProgram CostDuring year 1 of the program, the first and second components and one monitoring cycle of the third components and one monitoring cycle of the third component were conductedThe cost of this “launch” phase was $335,000This fee covered the costs associated with acquisition of the qsample sets for the program, screening of these samples for viral pathogens, shipping of samples to Belgium for assignment of target values by IDMS, shipping of the samples to participating laboratories on dry ice data acquisition and to participating laboratories on dry ice, data acquisition, and performance reporting together with telephone and e-mail follow-up plus ongoing administrative costsThe third component of the program, composed of the p p g , pongoing monitoring and auditing of the participating laboratories three times per year, costs $135,000 per year

This finding indicates that, in real terms, a g%TE performance goal of 11.4% is certainly achievable once the ymanufacturers have revised their calibration processes to be traceable to pthe IDMS reference method
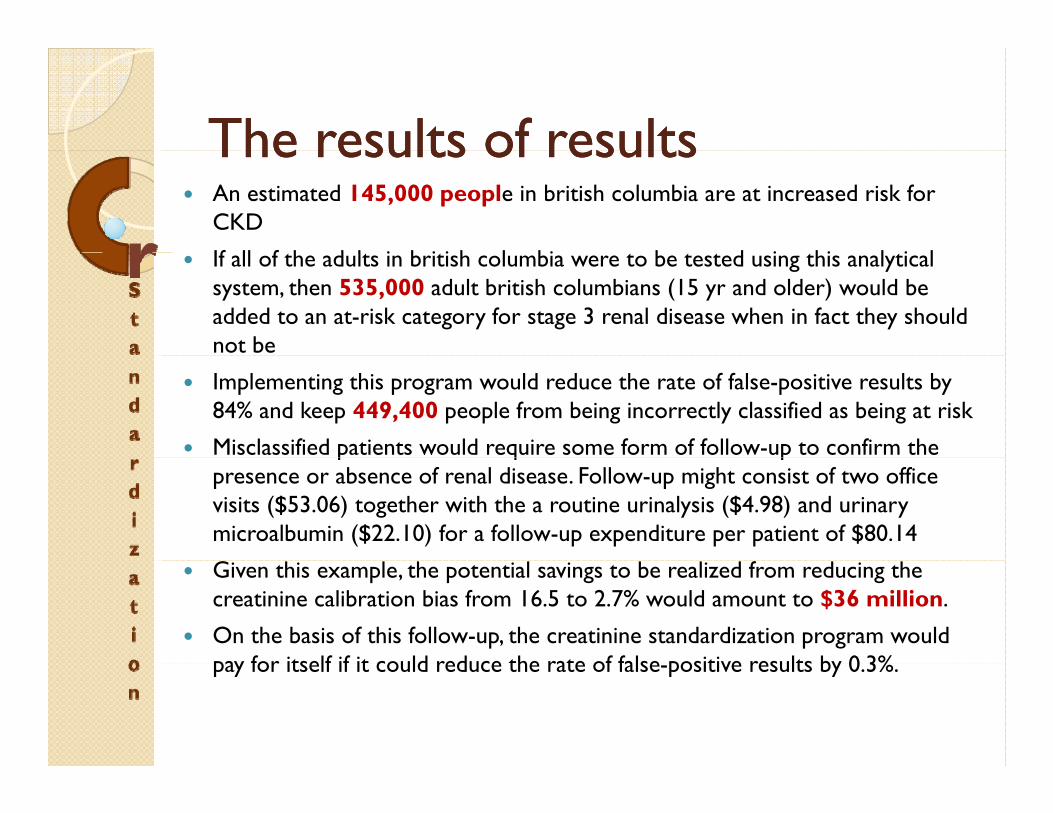
The results of resultsThe results of resultsThe results of resultsThe results of resultsAn estimated 145,000 people in british columbia are at increased risk for CKD
If ll f h d l i b i i h l bi b d i hi l i l If all of the adults in british columbia were to be tested using this analytical system, then 535,000 adult british columbians (15 yr and older) would be added to an at-risk category for stage 3 renal disease when in fact they should not be
Implementing this program would reduce the rate of false-positive results by 84% and keep 449,400 people from being incorrectly classified as being at risk
Misclassified patients would require some form of follow-up to confirm the p q ppresence or absence of renal disease. Follow-up might consist of two office visits ($53.06) together with the a routine urinalysis ($4.98) and urinary microalbumin ($22.10) for a follow-up expenditure per patient of $80.14
Given this example, the potential savings to be realized from reducing the creatinine calibration bias from 16.5 to 2.7% would amount to $36 million.
On the basis of this follow-up, the creatinine standardization program would pay for itself if it could reduce the rate of false positive results by 0 3%pay for itself if it could reduce the rate of false-positive results by 0.3%.

RECOMMENDATIONSRECOMMENDATIONSRECOMMENDATIONSRECOMMENDATIONSFOR FUTURE FOR FUTURE NEXT ACTION PLANNEXT ACTION PLAN