creating value in times of low commodity prices - … · creating value in times of low commodity...
TRANSCRIPT

2012-10-24 Classification: Internal
Creating value in times of low commodity prices Statoil gas seminar, 18 February 2016, London Jens Økland, EVP, Marketing, Midstream & Processing (MMP)

Our industry is in a challenging situation
• Low oil and gas prices
• High costs
• Oil and gas in a decarbonising world
Climate Commodity prices
Costs
0
20
40
60
80
100
120
140
2013 2014 2015 2016
USD
/boe
Oil Gas (NBP)
Sources: Platts, Heren, IHS 2

Statoil’s mid- and downstream business is adding value
• With low commodity prices, the relative importance of our mid- and downstream activity increases
• Through Asset Backed Trading, the value of our products can be increased
• MMP earnings in 2015 exceeds NOK 20 billion and accounts for nearly 30% of Statoil’s adjusted earnings
MMP1) - adjusted earnings2)
0
5
10
15
20
25
2012 2013 2014 2015
Billio
n N
OK
MMP
1) Marketing, Midstream & Processing (MMP). Before 2015: Marketing, Processing and Renewables (MPR) 2) Before tax Source: Statoil
3

Asset Backed Trading – an extensive toolbox for value creation
1) Before tax Source: Statoil
Adjusted earnings 1) MMP - 2015
Natural gas Europe Natural gas USLiquids Other
• Our most successful trading activities imply use of physical infrastructure or contractual assets
− Storages
− Refineries
− Terminals
− Shipping
− Rail
− Capacity bookings
• Active use of assets add flexibility and optionality to our portfolio and increase our competitiveness
4

Resetting costs in MMP
Continue efforts to become more competitive
A sustained culture of continuous improvement
Respond to complexity with simplicity
5

Opportunities in European gas markets
• Europe has a large and growing supply gap
• Norwegian gas is well placed as a cost-efficient supply source for the long term
• Due to its cleanness and versatility, gas will remain a key part of European energy supply
Outlook for Norwegian gas production Outlook for EU demand and indigenous supply
6
0
100
200
300
400
500
600
2012 2020 2025 2030
Norway
Indigenous
EC reference
EC 2030 policies
IEA WEO 2015
Import needs
Sources: IEA, European Commission, Norwegian Petroleum Directorate

7

2012-10-24 Classification: Internal
European gas market outlook Statoil gas seminar, 18 February 2016, London Olav Kolbeinstveit, Vice President, Statoil Market Analysis

European gas price drivers – more than oil
Forward prices*
1) Forward prices as of 15 February 2016, NYMEX Henry Hub Forward 12 February 2016 2) Sources: Platts, ICE, NYMEX, Statoil ASA
Price fall less severe than for oil
Key European gas market drivers Demand
• Competing fuels
• Temperature
Supply
• Flexible long-term contracts
• LNG supply
0
5
10
15
20
25
2010 2011 2012 2013 2014 2015 2016 2017 2018Japan - Korea Spot LNG NBP spot (UK)Henry Hub (US) Brent
FW market1)
Brent and global gas prices USD/MMBtu
9

Growing global LNG liquefaction capacity
0
100
200
300
400
500
600
2010 2015 2020
Existing capacity Australia US Others
US LNG exports:
Limited volumes in 2016
Significant volumes contracted by portfolio players
Tolling contracts
Current LNG price level does not justify new investments
Source: IHS CERA, Pira, Statoil ASA
The LNG market is cyclical LNG production capacity
BCM
10

JKM Shipping HH Shipping/Regas NBP
Asia USD/MMBtu
Europe USD/MMBtu
North America USD/MMBtu
2.7*
0.4 4.8 - 6.1 4.1 - 4.6
US LNG will flow according to price signals – or at all?
1 - 1.5 1.7 - 3
* NYMEX Henry Hub Forward curve for Calendar 2017 12 February 2016 ** ICE NBP Forward curve for Calendar 2017 15 February 2016 and Platts JKM spot Source: NYMEX, ICE, Platts, Pira, Statoil ASA
Short-run marginal cost ranges for US LNG supply to Asia and Europe
4.5**
5.3**
US LNG currently on the margin in Europe
11

Financial Times 3 February 2016
US LNG most expensive source to Europe
12

EU28 gas consumption has bottomed out
0
100
200
300
400
500
600
2005 2010 2014 2015 2016E
Buildings Industry Others Electricity/CHP/Heat Plants
Historic drop in consumption mainly related to gas to power
No growth expected in the buildings sector
Stable demand in the industry sector
Sources: European TSO’s, ENTSOG, Eurostat, IEA,
EU 28 gas demand per sector BCM
Gas to power is expected to recover
13

CCGTs1) in the UK competitive with coal plants
0
10
20
30
40
50
60
70
80
90
100
0
10
20
30
40
50
60
70
80
90
100
2010 2011 2012 2013 2014 2015 2016 2017 2018
mcm/d p/th
Coal Switching Range (LHS) Gas-to-power consumption (RHS) NBP (LHS)
FW market2)
Gas to power demand is price sensitive
Growing political willingness to curb use of coal
Carbon tax drives gas to power recovery
1) Combined Cycle Gas Turbine (CCGT) 2) Forward prices as of 15 February 2016 Sources: ICIS Heren, ICE, Statoil ASA
UK Coal switching range and gas-to-power consumption
14

EU 28 natural gas imports increasing
Sources: European TSO’s, Eurostat, IEA, PIRA
Record low indigenous production in 2015 Indigenous production EU 28
BCM
50%
60%
70%
80%
90%
0
100
200
300
400
2005 2010 2014 2015 2016ELNG North AfricaRussia NorwayImports in % of consumption
EU 28 gas imports BCM
0
50
100
150
200
250
2005 2010 2014 2015 2016E
15

Dutch gas production capped
0
20
40
60
2005 2010 2014 2015 2016E
Groningen
• Production cap 27 bcm
• Was key source of flexibility
Flexible Norwegian gas important
Source: NAM, Dutch Energy ministry
0
2
4
6
8
Jan Feb Mar Apr May Jun Jul Aug Sep Oct Nov Dec
Min-Max 5Y
5Y Average
2015
Seasonal flexibility hit Groningen production
BCM
Seasonal output BCM/month
16
Concluding remarks
Challenging period – risks to the upside LNG connecting regional markets Increasing import needs to Europe
17

18

2012-10-24 Classification: Internal
Capturing business opportunities Statoil gas seminar, 18 February 2016, London Tor Martin Anfinnsen, Senior Vice President, Marketing and Trading

A major gas player with Europe as gravity point
NCS
• Largest gas producer on NCS1)
• Pipeline gas to North West Europe
• Melkøya LNG facility
USA
• Shale gas production in Marcellus
• Deliveries of gas to Toronto and New York City
US shale gas
NCS
Statoil offices with natural gas business activities
Melkøya LNG
20 1) Norwegian continental shelf (NCS)

Statoil’s gas is well positioned in Europe
Proximity to markets Access to an integrated and flexible pipeline infrastructure
Large gas resource potential on the NCS
1922
625
1450
Reserves *Contingent resources in fields/discoveriesUndiscovered
bn Sm3
* Statoil share of NCS reserves ~34% Source: Norwegian Petroleum Directorate (NPD) resource account as of 31.12.2014 21
Nyhamna
Europipe II Europipe I
Norpipe
Emden/ Dornum
Åsgard transport
Franpipe Zeebrugge
Zeepipe
St Fergus
Vesterled Kårstø
Kollsnes
Ormen Lange
Easington
Langeled
Ekofisk
Sleipner
Troll
Dunkerque
Tampen Link
Draupner
Polarled
Norway
Pipeline LNG
Russia
Algeria
400 – 1200 km
~3000 km
6000 – 7000km
Caspian Region
~4000 km

Our marketing strategy
• Developments in gas market give new sales channels and opportunities
− Transformation away from oil-indexing
− Unbundling of the value chain and third party access
− Development of liquid hubs
• Long-term contracts are still important, but take on a modernised form
European gas prices are converging
Source: ICIS Heren
Statoil’s contract portfolio has changed
2010 2014
Oil indexed
Gas indexed
Other
22
0
10
20
30
40
50
60
70
2011 2012 2013 2014 2015 2016
EUR
/MW
h DEITUKNL

Optimising production in time, volume and geography
Keep volume commitments and safeguard cash flow
Execute optimisation strategies and trade around total portfolio
Capturing value at the trading desk
Manage risk in contract portfolio
Monetise total portfolio through trading
Capitalise on NCS equity gas position
23
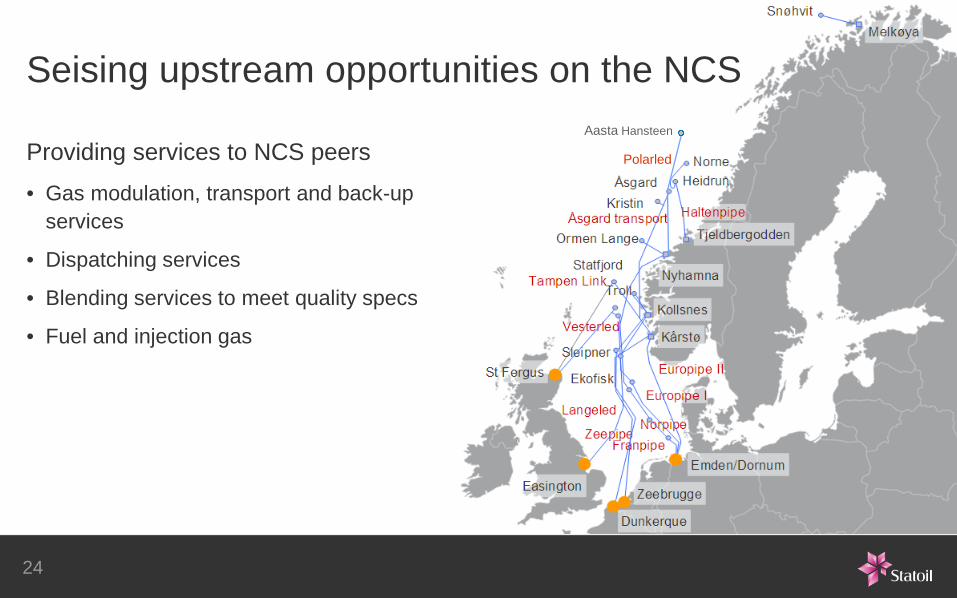
Seising upstream opportunities on the NCS
Providing services to NCS peers
• Gas modulation, transport and back-up services
• Dispatching services
• Blending services to meet quality specs
• Fuel and injection gas
24
Polarled
Aasta Hansteen

Taking opportunities in a global LNG market
• Highly flexible LNG portfolio creating new business opportunities
• The LNG protfolio is made up predominantly of equtiy volumes combined with third party volumes
• The global LNG market provides trading opportunities for our LNG portfolio
25

Gas meets UK’s energy needs
• Coal phase out and falling indigenous production is creating an energy gap
• Gas is key to a stable energy solution
Growing UK import need
020406080
100120
2000 2005 2010 2015 2020 2025 2030bc
mNet gas production Net gas demand
Coal phase out gives energy gap in UK
0%
20%
40%
60%
80%
100%
2013/2014 Late 2020s
Generation gapCoalImportsOtherGasRenewablesNuclear
26
?

Concluding remarks
Despite current market prices, our outlook for gas in Europe remains positive
Statoil’s gas activity has an extensive toolbox of value-creating options
Coal phase out in the UK is giving new opportunities for gas
27

28

2012-10-24 Classification: Internal
Longer-term gas market perspectives Statoil gas seminar, 18 February 2016, London Eirik Wærness, Senior Vice President and Chief Economist

Short-term volatility – long-term trends, across different scenarios Long-term Energy Perspectives
2012 Renewal, 2.9%
Reform, 2.8%
Rivalry, 2%
Source: Thomson Reuters Datastream 30
0
200
400
600
800
1997 2002 2007 2012
BrentHHNBPCoal
Commodity prices (real Dec 2015, indexed Feb 1997=100)

New renewables set for rapid growth, robust gas demand across scenarios It takes decades to change the global fuel mix
World fuel mix 1972 - 2040
Source: IEA (history), Statoil (projections)
0 %
20 %
40 %
60 %
80 %
100 %
1972 2012 Reform Renewal Rivalry
New renewables
Biomass & waste
Hydro
Nuclear
Gas
Oil
Solid fuels
2040
Economic growth and structure
Energy efficiency improvements
Demography, urbanisation
Energy and climate policies
Geopolitics, energy security
Fuel costs, availability, prices
Technological evolution, costs
Consumer preferences
31

Paris COP21 – a breakthrough?
Significant improvement: common target
Several scenarios possible − The outcome is NOT given
Implications for natural gas: − Good news, if implemented
− INDCs1) typically not concrete on gas
− Replacement of coal required
− Carbon emission schemes revitalised?
Achieving the targets entails a significant role for natural gas
32 1) Intended Nationally Determined Contributions (INDC)

* Excl. Bio-fuels Source: IEA (history), Statoil (projections)
Oil and gas are here to stay Considerable supply gap in all scenarios, and gas demand increases in all
Oil demand*, supply from existing fields Mbd
Gas demand, supply from existing fields Bcm
0
20
40
60
80
100
120
2012 2020 2030 2040
Demand range Supply gapDecline Production range
0
1000
2000
3000
4000
5000
2012 2020 2030 2040
Demand range Supply gapDecline Production range
33

Gas demand development Bcm
Source: IEA (history), Statoil (projections)
Non-OECD Asia drives global markets, ~500-750 bcm demand growth Regional variation in long-term demand outlook
0
1 000
2 000
3 000
4 000
5 000
2000 2012 2020 2040
OECD Russia/FSU Non-OECD Asia Middle East Other
3 000
3 500
4 000
4 500
5 000
2012 2040
Reform
Reform
Renewal Rivalry
Mature markets
Mature markets: OECD & Russia / FSU
34
Gas demand growth by region Reform case, Bcm

Source: European Commission, IEA, Statoil, Eurogas
Europe’s gas imports will grow EU has to pursue a policy making Europe attractive for gas suppliers
35
0
100
200
300
400
500
600
2012 2020 2025 2030
NorwayIndigenousEC referenceEC 2030 policiesIEA WEO 2015
EU gas import requirements
bcm
Demand

Key long-term issues in summary
It takes decades to change the fuel mix
COP21 an important milestone
Gas demand increases in all scenarios
Demand driven by Non-OECD Asia
Europe needs more gas imports
Regional gas pricing globally linked
36

37

Conclusions
Statoil MMP is an important value driver for Statoil
Our asset backed trading model is an important tool for generating value
We maintain a positive view on the long-term outlook for gas in Europe
38
39

Forward-looking statements These forward-looking statements reflect current views about future events and are, by their nature, subject to significant risks and uncertainties because they relate to events and depend on circumstances that will occur in the future. There are a number of factors that could cause actual results and developments to differ materially from those expressed or implied by these forward-looking statements, including levels of industry product supply, demand and pricing; price and availability of alternative fuels; currency exchange rate and interest rate fluctuations; the political and economic policies of Norway and other oil-producing countries; EU directives; general economic conditions; political and social stability and economic growth in relevant areas of the world; the sovereign debt situation in Europe; global political events and actions, including war, terrorism and sanctions; security breaches; situation in Ukraine; changes or uncertainty in or non-compliance with laws and governmental regulations; the timing of bringing new fields on stream; an inability to exploit growth or investment opportunities; material differences from reserves estimates; unsuccessful drilling; an inability to find and develop reserves; ineffectiveness of crisis management systems; adverse changes in tax regimes; the development and use of new technology; geological or technical difficulties; operational problems; operator error; inadequate insurance coverage; the lack of necessary transportation infrastructure when a field is in a remote location and other transportation problems; the actions of competitors; the actions of field partners; the actions of governments (including the Norwegian state as majority shareholder); counterparty defaults; natural disasters and adverse weather conditions, climate change, and other changes to business conditions; an inability to attract and retain personnel; relevant governmental approvals; industrial actions by workers and other factors discussed elsewhere in this report. Additional information, including information on factors that may affect Statoil's business, is contained in Statoil's Annual Report on Form 20-F for the year ended December 31, 2014, filed with the U.S. Securities and Exchange Commission, which can be found on Statoil's website at www.statoil.com.
Although we believe that the expectations reflected in the forward-looking statements are reasonable, we cannot assure you that our future results, level of activity, performance or achievements will meet these expectations. Moreover, neither we nor any other person assumes responsibility for the accuracy and completeness of the forward-looking statements. Unless we are required by law to update these statements, we will not necessarily update any of these statements after the date of this report, either to make them conform to actual results or changes in our expectations.
40
This presentation contains certain forward-looking statements that involve risks and uncertainties. In some cases, we use words such as "ambition", "continue", "could", "estimate", "expect", "focus", "likely", "may", "outlook", "plan", "strategy", "will", "guidance" and similar expressions to identify forward-looking statements. All statements other than statements of historical fact, including, among others, statements regarding future financial position, results of operations and cash flows; changes in the fair value of derivatives; future financial ratios and information; future financial or operational portfolio or performance; future market position and conditions; business strategy; growth strategy; future impact of accounting policy judgments; sales, trading and market strategies; research and development initiatives and strategy; projections and future impact related to efficiency programs, market outlook and future economic projections and assumptions; competitive position; projected regularity and performance levels; expectations related to our recent transactions and projects, completion and results of acquisitions, disposals and other contractual arrangements; reserve information; future margins; projected returns; future levels, timing or development of capacity, reserves or resources; future decline of mature fields; planned maintenance (and the effects thereof); oil and gas production forecasts and reporting; domestic and international growth, expectations and development of production, projects, pipelines or resources; estimates related to production and development levels and dates; operational expectations, estimates, schedules and costs; exploration and development activities, plans and expectations; projections and expectations for upstream and downstream activities; oil, gas, alternative fuel and energy prices; oil, gas, alternative fuel and energy supply and demand; natural gas contract prices; timing of gas off-take; technological innovation, implementation, position and expectations; projected operational costs or savings; projected unit of production cost; our ability to create or improve value; future sources of financing; exploration and project development expenditure; effectiveness of our internal policies and plans; our ability to manage our risk exposure; our liquidity levels and management; estimated or future liabilities, obligations or expenses and how such liabilities, obligations and expenses are structured; expected impact of currency and interest rate fluctuations; expectations related to contractual or financial counterparties; capital expenditure estimates and expectations; projected outcome, objectives of management for future operations; impact of PSA effects; projected impact or timing of administrative or governmental rules, standards, decisions, standards or laws (including taxation laws); estimated costs of removal and abandonment; estimated lease payments, gas transport commitments and future impact of legal proceedings are forward-looking statements. You should not place undue reliance on these forward-looking statements. Our actual results could differ materially from those anticipated in the forward-looking statements for many reasons.