creating value in an increasingly connected world · steve hatfield-dodds australian bureau of...
TRANSCRIPT
Creating value in
an increasingly
connected world
Steve Hatfield-DoddsAustralian Bureau of Agriculturaland Resource Economics and Sciences
6 - 7 March 2018
Research by the Australian Bureau of Agricultural and Resource Economics and Sciences

Value of Australian agricultural production has increased steadily over recent years
Real gross value of agricultural productionf ABARES forecast. z ABARES projection.Source: ABARES; Australian Bureau of Statistics

… and we’re forecasting the gross value of production to be around $63 billion in 2022-23
Real gross value of agricultural productionf ABARES forecast. z ABARES projection.Source: ABARES; Australian Bureau of Statistics
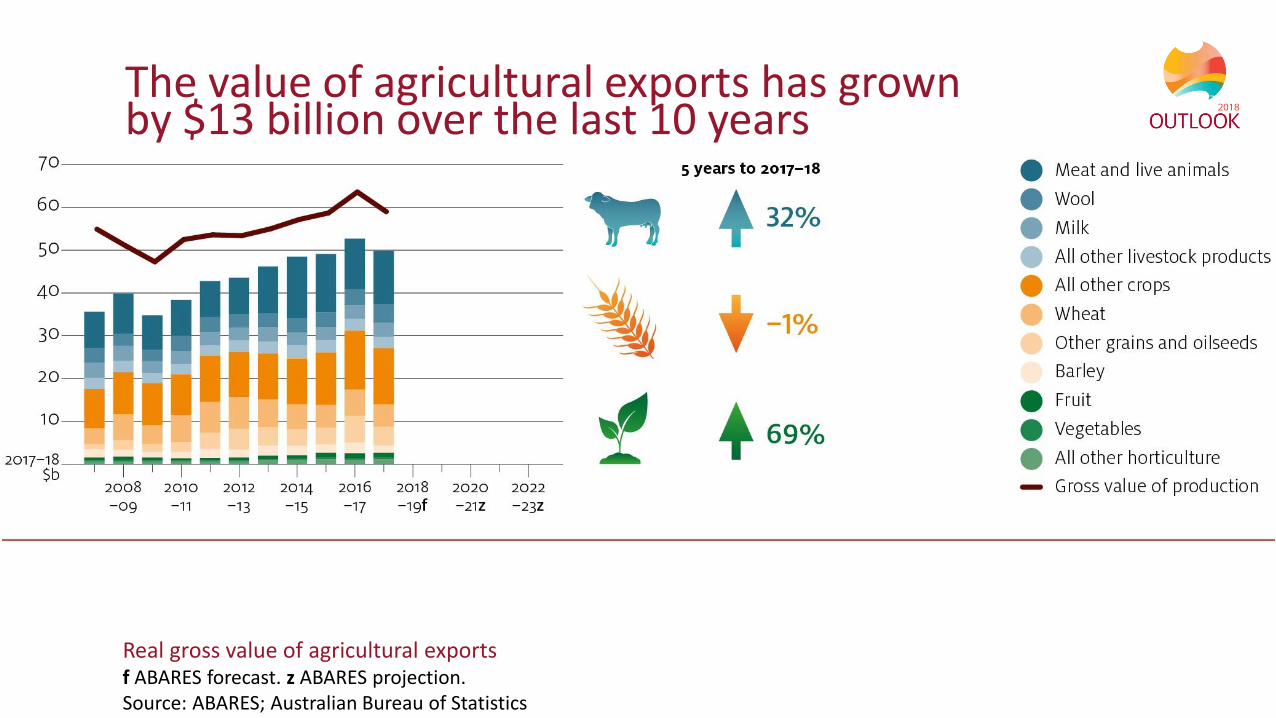
The value of agricultural exports has grown by $13 billion over the last 10 years
Real gross value of agricultural exports f ABARES forecast. z ABARES projection.Source: ABARES; Australian Bureau of Statistics
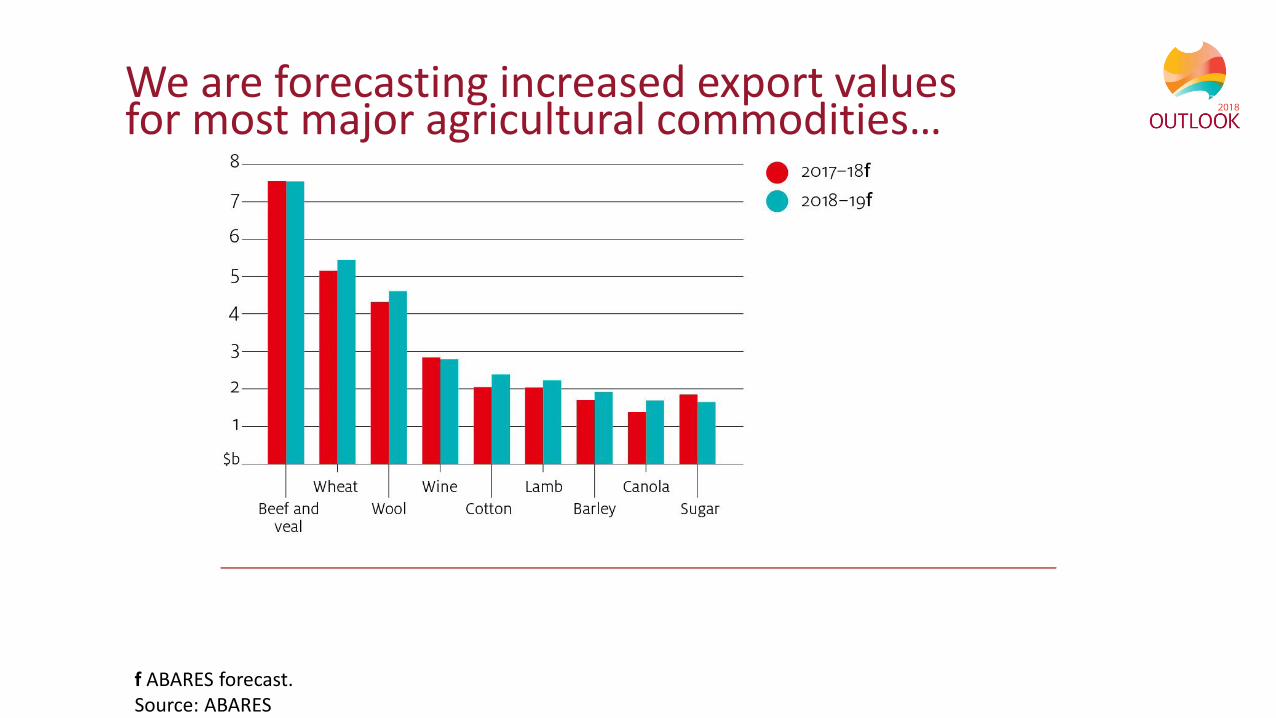
We are forecasting increased export values for most major agricultural commodities…
f ABARES forecast.Source: ABARES
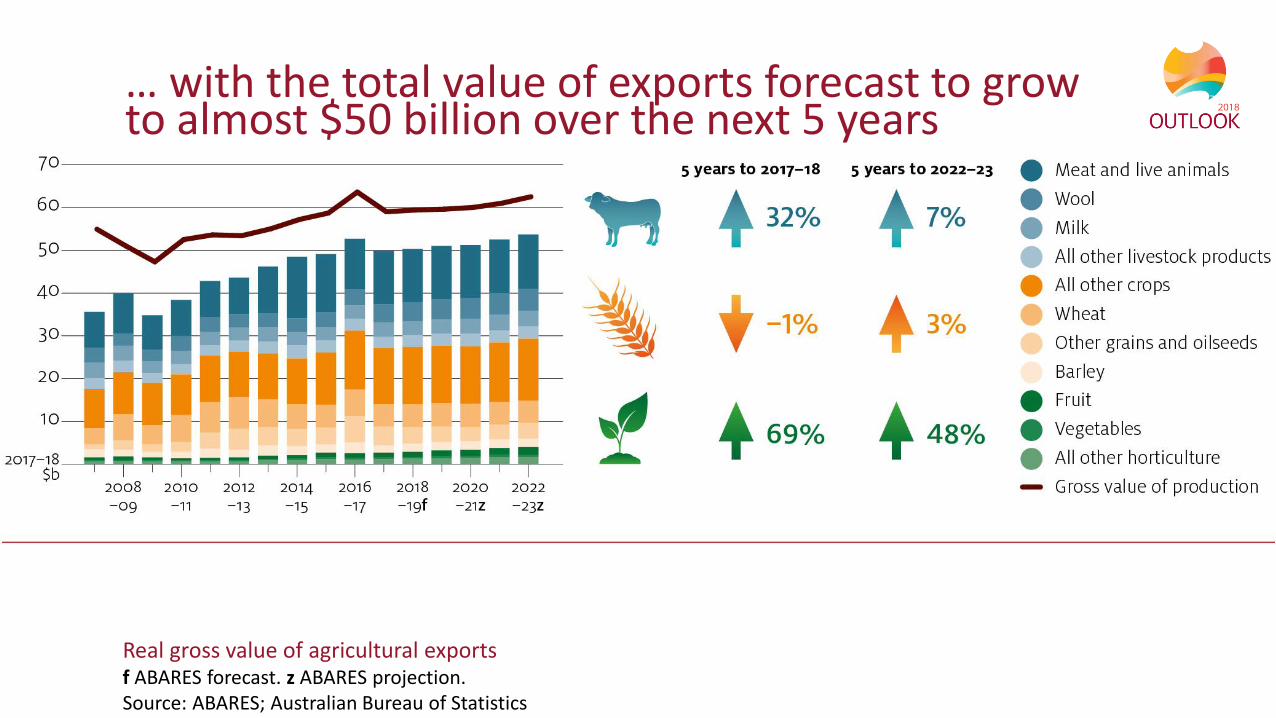
… with the total value of exports forecast to grow to almost $50 billion over the next 5 years
Real gross value of agricultural exports f ABARES forecast. z ABARES projection.Source: ABARES; Australian Bureau of Statistics

Global economic growth recovered in 2017 and is assumed to accelerate over the next few years…
a ABARES assumption. b includes China.Source: ABARES; International Monetary Fund

…and the Australian dollar is assumed to weaken over the outlook period
a ABARES assumption. Note: Historical data based on monthly average.Source: ABARES; Reserve Bank of Australia
US$0.782017-18
US$0.762018-19
US$0.742019-20 to 2022-23

Snapshot
Contributions of Australian Agriculture
Agriculture as a share of national totalSource: ABARES; Australian Bureau of Statistics; Geoscience Australia

Total value of food exports was $43 billion in 2016-17Source: ABARES; Australian Bureau of Statistics
Snapshot
Contributions through value added exportsis larger than the value of raw commodities

Snapshot
Context of Australian agricultureWe manage highly variable climate, with low producer support
Note: Departure from mean rainfall calculated as a probability density function, which shows the spread of possible values around the mean. Source: The World Bank Group – Climate Change Knowledge Portal
Rainfall variability index Departure from mean rainfall (%), 1970-2015
Snapshot
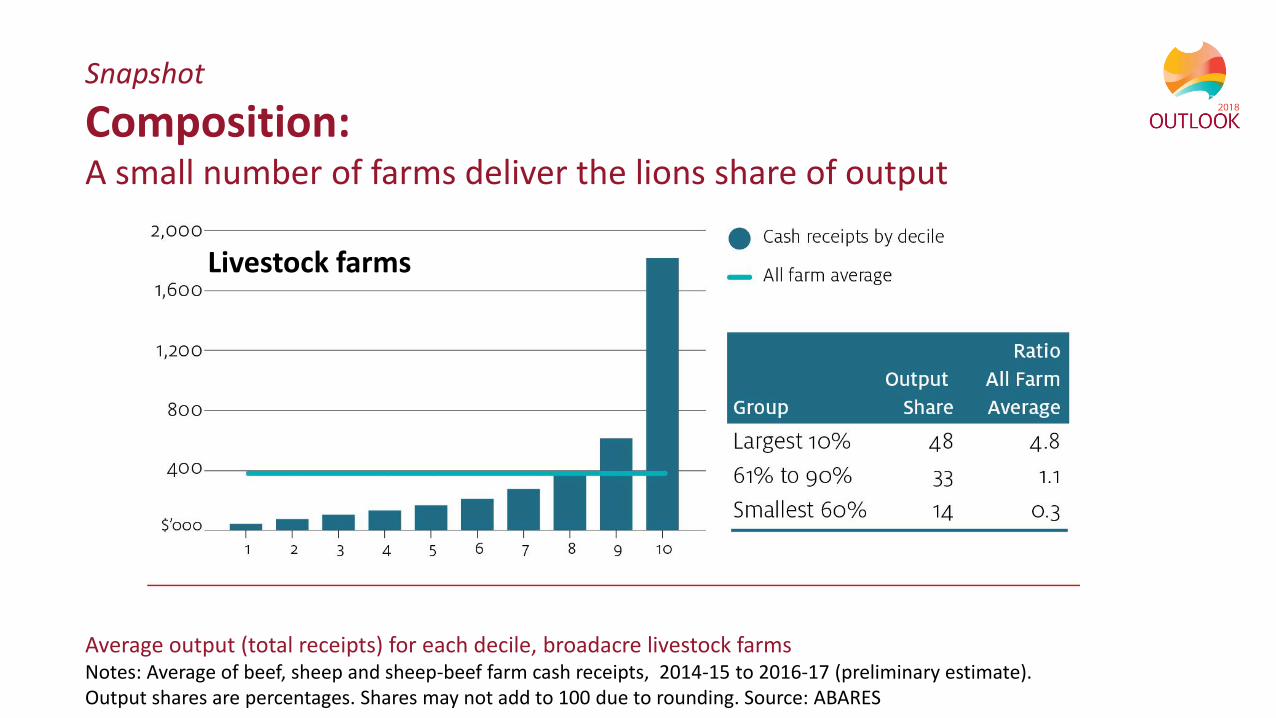
Composition:A small number of farms deliver the lions share of output
Livestock farms
Average output (total receipts) for each decile, broadacre livestock farmsNotes: Average of beef, sheep and sheep-beef farm cash receipts, 2014-15 to 2016-17 (preliminary estimate). Output shares are percentages. Shares may not add to 100 due to rounding. Source: ABARES

Snapshot
Composition:A small number of farms deliver the lions share of output
Cropping farms
Average output (total receipts) for each decile, broadacre cropping farmsNotes: Average of cropping farm cash receipts, 2014-15 to 2016-17 (preliminary estimate). Output shares are percentages. Shares may not add to 100 due to rounding. Source: ABARES

Key challenges each involving threats and opportunities for agriculture

Asia re-emergesWell over 3 billion people in high income nations by 2050, driven by Asia.
Distribution of historical and projected real global GDP per capita by countries and regions, 2015 and 2050Notes: High income threshold US $12,000 GDP per capita (World Bank (2014); a Includes Asian nations Japan and South Korea, and non OECD countries Bulgaria, Croatia, Lithuania and Romania; b Emerging and developing Asia; c Brazil, Russia and South Africa. Source: Data from Hatfield-Dodds, Schandl et al. 2017

Nominal Producer Support estimate ratio, selected countries Notes: PSE is calculated as the difference between the value of gross farm receipts at the farm gate relative to farm output valued at border prices. Percentages at right indicate change from 1996 to 2016.Source: OECD 2018
–14%+15%
–4%
Competitiveness raceProducer support is trending up in key emerging markets

Competitiveness raceAustralian productivity growth is keeping pace with advanced economies, but emerging producers are catching up
Source: US Department of Agriculture Economic Research Service 2017
Change in productivity from base year, selected countriesNotes: Index of total factor productivity at constant real prices. Average of 1962 to 1967 = 100.

Increase in gross value of production (nominal), and contributions of price and volumeNote: Index of cumulative change in output value from base period, calculated as average for 1994-95 to 1998-99 = 1.Numbers in parenthesis in key indicate index value in final year.Source: ABARES
Competitiveness racePrice has made a bigger contribution than volume over last two decade
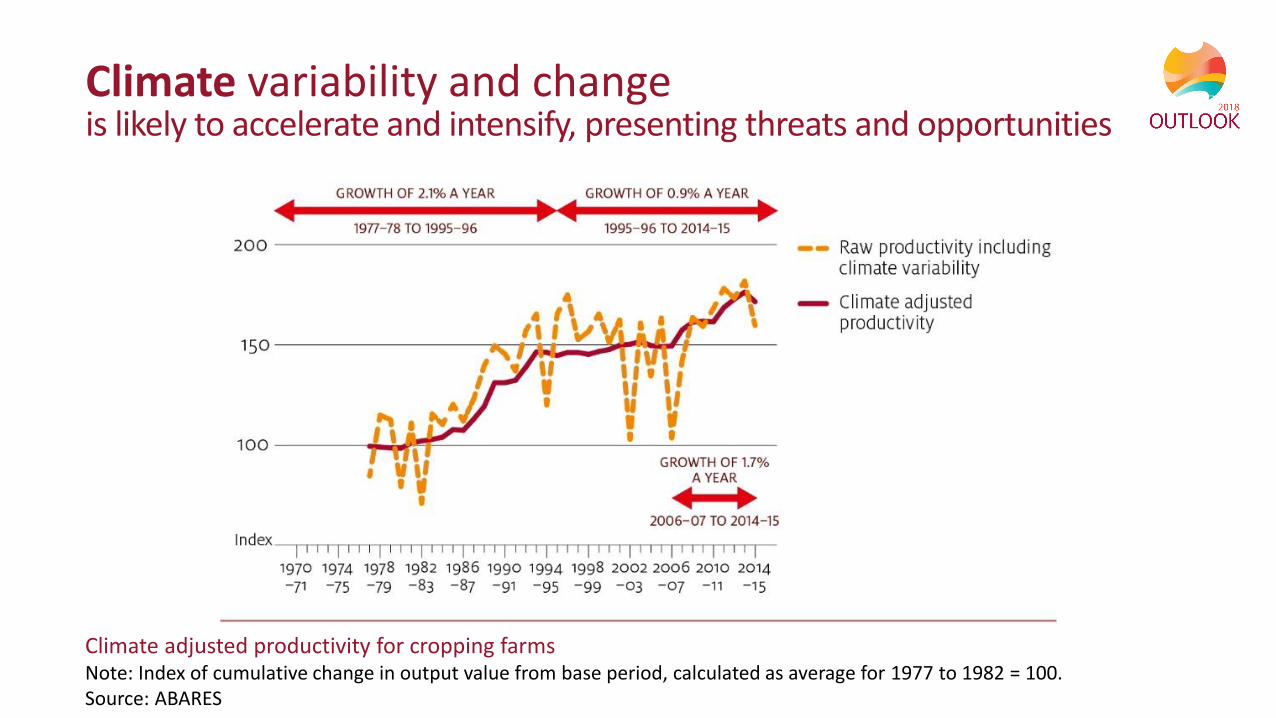
Climate variability and change is likely to accelerate and intensify, presenting threats and opportunities
Climate adjusted productivity for cropping farmsNote: Index of cumulative change in output value from base period, calculated as average for 1977 to 1982 = 100.Source: ABARES
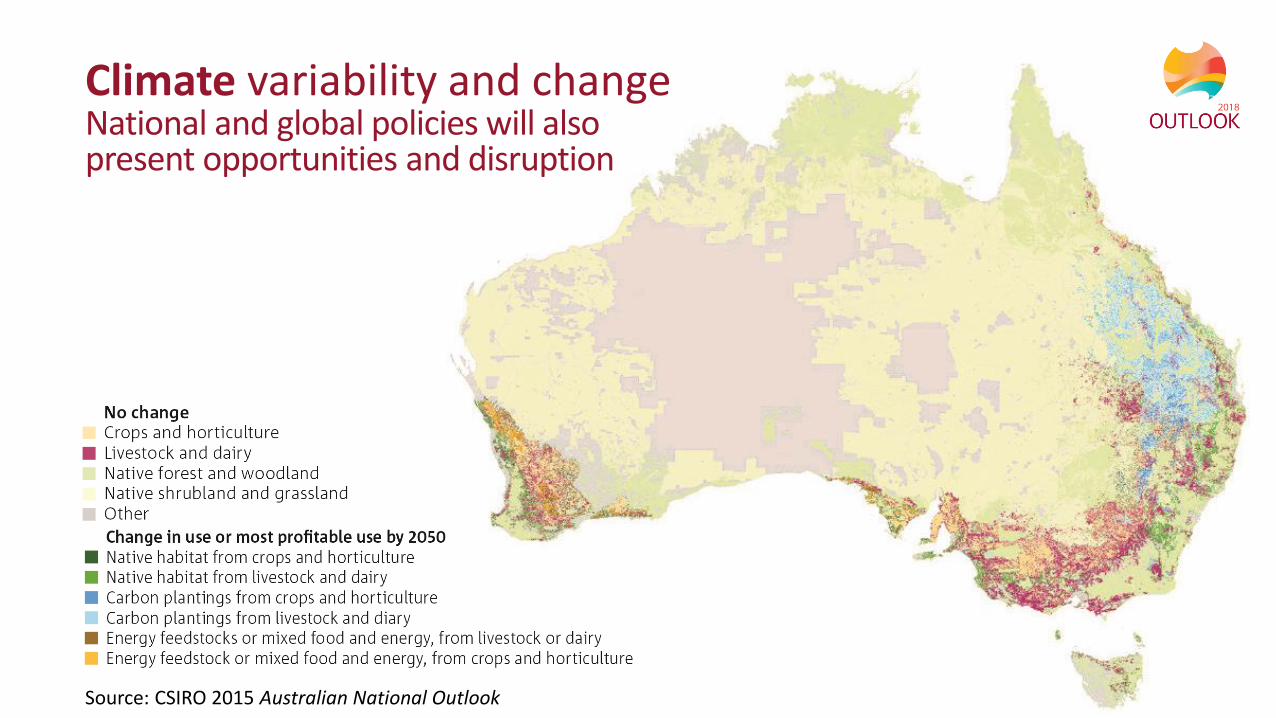
Source: CSIRO 2015 Australian National Outlook
Climate variability and change National and global policies will also present opportunities and disruption

Resource scarcity“Buy land, they’re not making it anymore”
Source: Shutterstock 2018
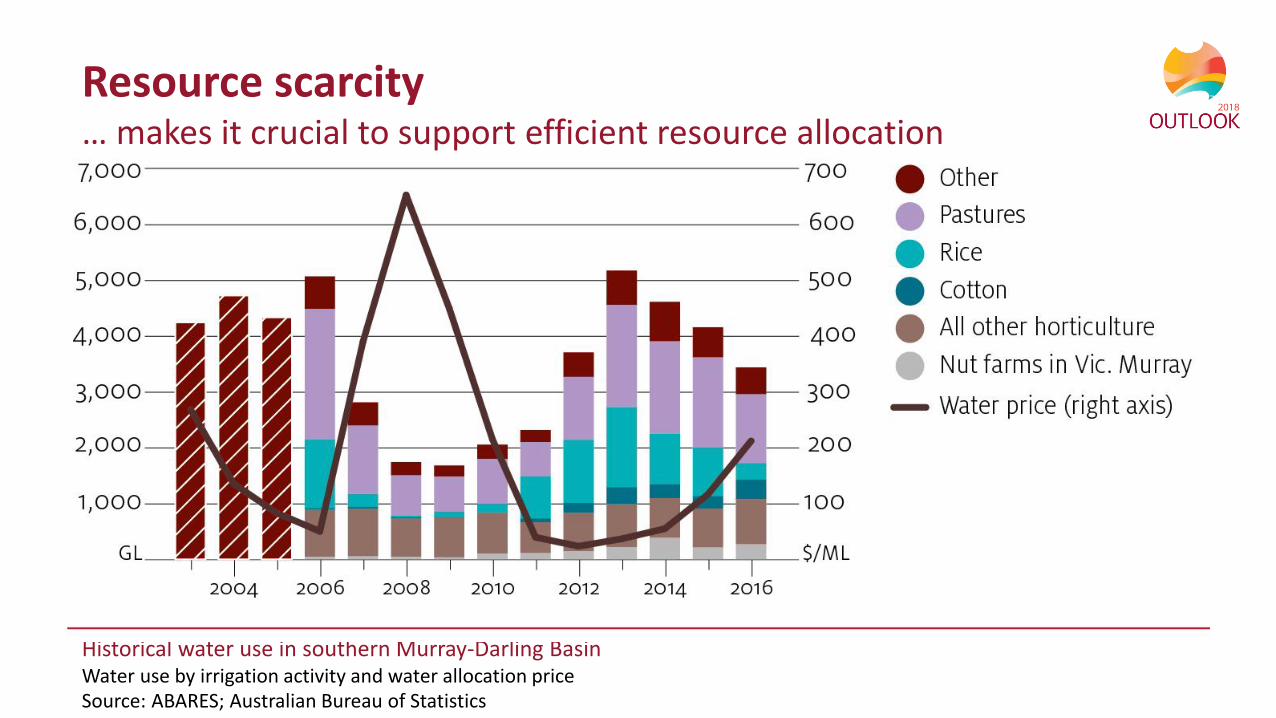
Resource scarcity… makes it crucial to support efficient resource allocation
Source: ABARES; Australian Bureau of Statistics
Historical water use in southern Murray-Darling BasinWater use by irrigation activity and water allocation price

Modelled long-run change Change in underlying water demand and use by irrigation activitySource: ABARES
Resource scarcity… makes it crucial to support efficient resource allocation

Consumer preferencesReputation is a common property resource
Fire crews respond to BP’s Deepwater Horizon fire and oil spill, 2010Source: Shutterstock 2018

Source: Edelman Trust Barometer 2015
29%
35%
8%
8%
1%
19%
Consumer preferencesAttitudes are complex and will continue to evolve
… mapped to GDP in 2050Dominant concerns today
Source: Dominant concerns from Edelman (2015) applied to projected GDP in 2050 from Hatfield-Dodds, Schandl et al. (2015)
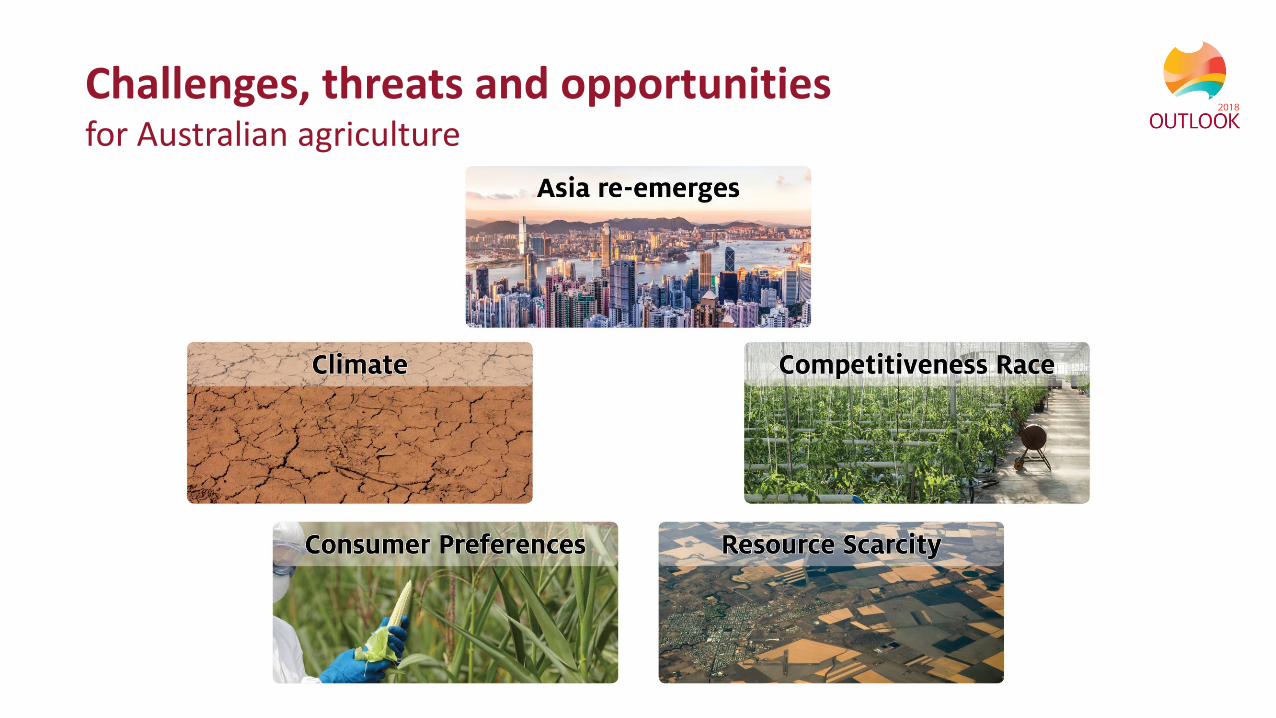
Challenges, threats and opportunities for Australian agriculture
agriculture.gov.au/abares