creating - fusion microfinance fusion microfinance private limited is headquartered in new delhi and...
TRANSCRIPT

ANNUALREPORT 2013/14
CREATING OPPORTUNITIESFusion Microfinance Private Limited

FORWARD-LOOKING STATEMENTIn this annual report, we have disclosed forward-looking information
to enable investors to comprehend our prospects and take informed
investment decisions. This report and other statements – written and
oral –that we periodically make contain forward-looking statements
that set out anticipated results based on the management’s plans
and assumptions. We have tried wherever possible to identify such
statements by using words such as ‘anticipates’, ‘estimates’, ‘expects’,
‘projects’, ‘intends’, ‘plans’, ‘believes’ and words of similar substance
in connection with any discussion of future performance.
We cannot guarantee that these forward-looking statements will
be realised, although we believe we have been prudent in our
assumptions. The achievement of these results is subject to risks,
uncertainties and even inaccurate assumptions. Should known or
unknown risks or uncertainties materialise, or should underlying
assumptions prove inaccurate, actual results could vary materially
from those anticipated, estimated or projected.
We undertake no obligation to publicly update any forward-looking
statements, whether as a result of new information, future events or
otherwise.
DOCUMENT MILESTONES
02 Corporate identity
06 Creating opportunities 20 Boad
Member
16 Competitive advantage
14 Management’s statement
18The microfinance sector04 Financial
performance
21Statutory Section

IN INDIA 93% OF ALL WORKERS ARE SELF EMPLOYED. WOMEN CONSTITUTE MORE THAN HALF OF THIS WORKFORCE AND MORE THAN 96% OF WOMEN WORKERS ARE SELF EMPLOYED. A LARGE NUMBER OF THESE INDIVIDUALS POSSESS THE DRIVE TO EARN A LIVING COUPLED WITH THE INSIGHT THAT COULD MAKE THIS POSSIBLE.
WHAT THEY LACK IS ACCESS TO PRECIOUS CAPITAL TO GET THEM INTO A TRADE OR BUSINESS.
THESE FACTS MAKE IT IMPERATIVE TO FINANCIALLY EMPOWER WOMEN SO AS TO ENABLE THEM TO MAKE MEANINGFUL CONTRIBUTIONS TOWARDS THE DEVELOPMENT OF THE ECONOMY.
AT FUSION MICROFINANCE PRIVATE LIMITED, WE IDENTIFY THE MOST PROMISING CASES AND PROVIDE THEM WITH ALL-IMPORTANT SEED AND GROWTH CAPITAL.
IN DOING SO, WE CREATE GROWTH OPPORTUNITIES FOR INDIVIDUALS, FAMILIES, COMMUNITIES AND THE COUNTRY.
ANNUAL REPORT 2013-14 > 1PB

FUSION MICROFINANCE PRIVATE LIMITED. …ONE OF THE FASTEST GROWING MFI (IN THE CATEGORY OF C1 BN - C5 BN) …POSSESS MFI2 GRADING FROM CARE RATING (APRIL 2014).
FUSION MICROFINANCE PRIVATE LIMITED

Presence
Fusion Microfinance Private Limited is
headquartered in New Delhi and enjoys a
growing presence in Uttar Pradesh, Madhya
Pradesh, Uttarakhand and Delhi.
18.87%
42
137.79
24.96
341
3.01
Promoters’ holding
(March 31, 2014)
Branches
(March 31, 2014)
Outstanding loan portfolio
(C crore) (March 31, 2014)
Revenue (C crore)
(March 31, 2014)
Team size
(March 31, 2014)
Profit for the year (C crore)
(March 31, 2014)
WOMEN ARE THE REAL ARCHITECTS OF SOCIETY.Harriet Beecher Stowe
Business
Fusion Microfinance Private Limited finances the
growing needs of Indian women entrepreneurs
in Northern and Central India with the objective
of facilitating their financial empowerment
leading to enhanced social respect.
ANNUAL REPORT 2013-14 > 32

ENABLING THE CAUSE OF FINANCIAL INCLUSION IS GOOD FOR THE SOCIETY, THE COUNTRY AND FOR COMPANIES PROVIDING THE FINANCE.
2011-12 2012-13 2013-14
6.85
10.8
6
24.9
6
(C crore)
Revenue2011-12 2012-13 2013-14
0.15 0.
28
3.01
(C crore)
Net profit 2011-12 2012-13 2013-14
12.3
6
37.3
4
40.3
5
(C crore)
Net worth 2011-12 2012-13 2013-14
0.56
0.49
2.67
(%)
Return on assets
FUSION MICROFINANCE PRIVATE LIMITED
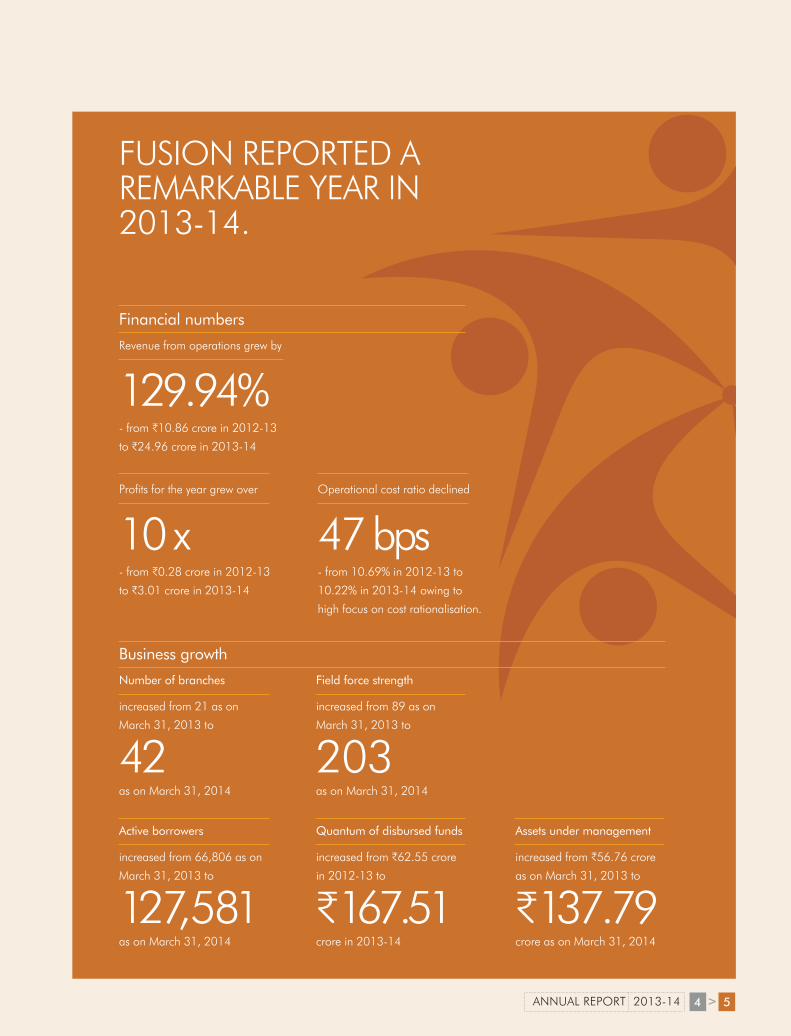
Financial numbers
Business growth
Revenue from operations grew by
129.94% - from C10.86 crore in 2012-13
to C24.96 crore in 2013-14
Number of branches
increased from 21 as on
March 31, 2013 to
42as on March 31, 2014
Active borrowers
increased from 66,806 as on
March 31, 2013 to
127,581 as on March 31, 2014
Field force strength
increased from 89 as on
March 31, 2013 to
203as on March 31, 2014
Quantum of disbursed funds
increased from C62.55 crore
in 2012-13 to
C167.51 crore in 2013-14
Assets under management
increased from C56.76 crore
as on March 31, 2013 to
C137.79 crore as on March 31, 2014
Profits for the year grew over
10 x - from C0.28 crore in 2012-13
to C3.01 crore in 2013-14
FUSION REPORTED A REMARKABLE YEAR IN 2013-14.
Operational cost ratio declined
47 bps - from 10.69% in 2012-13 to
10.22% in 2013-14 owing to
high focus on cost rationalisation.
ANNUAL REPORT 2013-14 > 54

FUSION MICROFINANCE PRIVATE LIMITED

March2012
March2013
March2014
Outstanding loan portfolio
(C crore)
137.
79
56.7
6
37.2
4At Fusion, our purpose is to create opportunities in a manner that our borrowers enjoy a superior ‘return on life’.
This is what we have to report for our
intent and implementation.
We identified key microfinance needs
in rural and semi-urban locations across
Northern and Central India
We funded women at the bottom
of the social pyramid who were keen
on entering new ventures or already
managing existing businesses
We educated customers so that
they could manage their cash flows
more efficiently thereby expanding
opportunities and spreading smiles
Since inception in 2010, we have
touched the lives of more than 288,139
women, helping them emerge from the
peripheries of the society to the centre of
attention.
The result is that Fusion has acquired
a position of respect in India’s
microfinance industry.
SURVIVING TO THRIVING
IF YOU WANT SOMETHING SAID, ASK A MAN; IF YOU WANT SOMETHING DONE, ASK A WOMAN.Margaret Thatcher
ANNUAL REPORT 2013-14 > 76

FUSION MICROFINANCE PRIVATE LIMITED

March2012
March2013
March2014
Outstanding loan portfolio per field officer
(C crore)
0.69
0.64
0.60
At Fusion, we believe that the building block of our growth is the learning opportunity that we provide, empowering fledgling homemakers to go out and make a name for themselves.
Over the years, we made relevant
investments that have helped us fortify
their knowledge base.
We strengthened our training calendar;
we provided 10 man days per person of
training across our organisation in the
area of soft skills and business processes
in the last 24 months.
We provided an opportunity for our
members to work on cutting-edge IT
systems and applications by investing
in end-to-end IT platforms that
strengthened data mining and enhanced
efficiency.
We benchmarked our team with a best-
in-class risk management framework
that was created in consultation with the
International Finance Corporation (IFC).
We helped transform select middle
and senior managerial personnel into
entrepreneurs by providing them with the
opportunity to invest in our Company.
Through these initiatives, Fusion evolved
into an earning and learning destination,
which helped moderate operating costs
from 18% of revenues in 2011-12 to
10.3% in 2013-14 on the one hand and
facilitated a corresponding improvement
in ROE from 1.25% to 7.75% on the
other.
EARNINGAND LEARNING
THE FASTEST WAY TO CHANGE SOCIETY IS TO MOBILISE THE WOMEN OF THE WORLD.Charles Malik
ANNUAL REPORT 2013-14 > 98

FUSION MICROFINANCE PRIVATE LIMITED

At Fusion, our goal is to instil a sense of trust that makes it possible to create diverse opportunities for our stakeholders.
As a means to this aforementioned, the
Company has embarked on a number of
initiatives.
Enlisted KPMG, one of the top four
global auditing firms, to audit our
financial statements.
Strengthened our five-member Board of
Directors with a balance of shareholders
and broader stakeholder interests; our
Board comprises one Independent
Director and two Nominee Directors.
Institutionalised a decision-ratifying
process in which all strategic decisions
were screened by the Risk Committee
before being sanctioned by the Board
Enriched our governance platform,
ensuring multi-level checks coupled with
surprise visits that ensured adherence
with institutionalised systems and
processes.
One of the visible manifestations of these
initiatives was an improvement in our
grading to MFI2 in April 2014.
ASPIRINGAND INSPIRING
34.5 Capital infusion (C crore)
in Fusion between 2010
and 2013
THERE IS A GROWING STRENGTH IN WOMEN BUT IT’S IN THE FOREHEAD, NOT THE FOREARM.Beverly Sills
ANNUAL REPORT 2013-14 > 1110

CREATING OPPORTUNITIES.WIDENING SMILES.
ANGOORI BAI, 45, Misrod village(About 15 kilometres from
Bhopal)
When Angoori Bai’s husband walked out
on her after ten years of marriage, he left
her with an assurance to provide C10,000
a year and a three-room house.
Illiterate. Unequipped. Disempowered.
Angoori Bai responded the only way
she knew. She worked as a farmhand,
housemaid and caretaker.
However, Angoori Bai’s life transformed
when Fusion entered her village Misrod in
June 2010.
Angoori Bai had identified an opening
in marketing cosmetics and imitation
jewellery. She approached Fusion for a
loan of C10,000, purchased wares for
C5,000, began to market home to home
on Sundays and liquidated her stock in
three months. Her surplus: C1,000.
Encouraged, she re-stocked and
generated sales worth C25,000.
Angoori Bai is now a financially
independent entrepreneur confident of a
better future.
Fusion helped create the opportunity.
“My success would not have been possible without Fusion and fellow group members” – Angoori Bai
BIMLA YADAV, 45, Mohangiri Colony, VidishaBimla Yadav, 45, lives in a one-
room tenement in Mohangiri
Colony in Vidisha with her
husband and three children.
One 2010 morning, her husband
announced that he would not be able to
shoulder physical labour for long.
So Bimla Yadav sought an C10,000 loan
from Fusion to purchase a push cart and
equipment to commission a chaat stall.
By the second month, her stall was
generating C300 in daily sales at a margin
of 50%.
In 2011, Bimla sought another Fusion
loan, renovated her cart, bought utensils
and widened her menu. Daily sales now
increased to C500 at prevailing margins.
The result is that Bimla now earns C9,000
a month and owns a bank account.
Fusion helped create the opportunity.
“Fusion helped me at a time when I needed help the most” – Bimla Yadav
FUSION MICROFINANCE PRIVATE LIMITED

YASMEEN, 45, Phase I, Metro Vihar, Holambi KalanYasmeen’s husband stopped
providing for the family
following marriage.
Yasmin realised that she would soon
starve. So she started what appeared to
be a no-brainer: a grocery shop.
When the Delhi Government embarked on
slum relocation in 2002, her family was
compelled to leave for Holambi Kalan -
without electricity, water or sanitation.
In 2005, Yasmeen began to explore an
opening in making and marketing knick-
knacks.
To realise this vision, she sought a C1,000
loan from Fusion, purchased material
wholesale and made decorative items
with it.
Her profit: C1,400.
Yasmeen has progressed considerably
since. Thanks to successive loans of
higher amounts from Fusion, her average
monthly sales have increased to about
C200,000 with a corresponding gross
margin of 15 to 25%.
Over the last few years, she has had
her children married, built a house and
recruited 50 neighbourhood women to
work with her.
Fusion helped create the opportunity.
“Fusion has transformed the lives of many poor people like me” – Yasmeen
DULARI, 38, Kalyanpur Village, Haridwar Dulari’s husband Hridayram
was a construction labourer
who ran a tea shop in
Kalyanpur, 5 kilometres from
Roorkee.
In January 2010, Dulari approached
Fusion for a C10,000 loan. The amount
was used to buy a stove and other items.
The result was that the tea shop now
began to serve French toast, pakodas and
biscuits as well.
With increased sales came higher profits.
Encouraged, Dulari took a second loan,
this time to enter a new business to buy
tents and utensils to cater to the needs of
the marriage season.
Dulari’s family‘s income increased by
140% in just two years.
Fusion helped create the opportunity.
“Thanks to Fusion, we have done well enough to buy assets like a TV, cupboard and cycle.” – Dulari
ANNUAL REPORT 2013-14 > 1312

10 minutes with the management team
“FUSION IS SET TO CLIMB INTO A HIGHER ORBIT”
Devesh Sachdev, CEO Ashish Tewari, COO
Dear shareholders,
WE ARE PLEASED TO REPORT THAT IN FISCAL 2013-14, FUSION BECAME LARGER AND INCREASINGLY PROFITABLE. WE WERE ABLE TO TOUCH 80,887 FAMILIES, A SUBSTANTIAL INCREASE OVER THE PREVIOUS YEAR.AND EVEN AS THE SECTOR BECAME INCREASINGLY COMPETITIVE, FUSION MICROFINANCE CONTINUED TO GROW ITS BUSINESS PROFITABLY: A SHARP INCREASE IN REVENUES WITH A CORRESPONDING GROWTH IN OUR PROFIT AFTER TAX.
Sky is the limitThe C27,000-crore Indian microfinance sector is still in its nascence but is addressing
a massive opportunity. Credible estimates suggest that there are over 134.7 million
households in India with annual incomes less than C112,000. These households do
not enjoy access to essential financial services (credit, insurance and savings facilities).
Assuming an annual average loan size of C15,000 per household, the total micro-credit
potential in India is estimated at above C202,050 crore, representing years of sustainable
revenue growth even if we consider the addressable opportunity at a conservative 50%.
FUSION MICROFINANCE PRIVATE LIMITED

The country’s microfinance sector has
rebounded from the crisis a few years
ago when it faced extensive loan defaults,
especially in Andhra Pradesh. Over the
last few years, the RBI has drafted a
roadmap for financial inclusion in a truer
sense of the word. This departure from
this retrospective position of financial
inclusion would need to be bank-led.
The result has been the announcement
of sector-specific and customer-centric
policies and guidelines, ensuring that the
hitherto ‘non-legal’ microfinance business
has turned a new leaf. Over time, the
increasing regulation will filter non-serious
players, widening the opportunity pie for
the focused and organised.
The future looks bright with lot of
opportunities emanating from the
microfinance sector and the RBI coming
up with draft guidelines for specialised
banks and on-tap banking. The fact
that the regulatory landscape has been
stabilising is evident from Bandhan
Microfinance getting an in-principle
approval to function as a full-fledged
scheduled bank.
2013-14 an inflection pointAt Fusion, 2013-14 proved to be
a watershed year on the back of a
strong business model, internationally-
benchmarked risk management system,
and technology investments to strengthen
business systems and enhanced liquidity.
Institutionalised a risk management
framework in consultation with the IFC,
insulating growth from external vagaries.
Upgraded our IT system – from a SQL-
based platform to web-based operations
– so as to permit real time informational
updation.
Ensured seamless transfer of data
without incurring any operational loss
despite the fact that IT migration can be
quite challenging.
Added more banks to our fund
providers’ list and increased our
borrowing limits with existing bankers.
While this diversified our fund sourcing
on the one hand (banks and NBFCs), it
helped optimise borrowing costs on the
other.
From an entrepreneurial standpoint,
job creation is an important facet of our
business. Consequently, our employee
strength grew from 168 to 341. We
introduced people-oriented HR policies
that helped retain intellectual capital on
the one hand and draw fresh talent on the
other.
Besides, the C25 crore capital infusion in
February 2013, provided the Company
with adequate room to leverage its
Balance Sheet to grow the business from
a modest debt-equity ratio to 2.33x as on
March 31, 2014.
The path aheadFusion reinforced business scalability
through its globally-benchmarked risk
management system. The Company
intends to increase its branch network to
70 (March 2015) from 42 (March 31,
2014). We are working to moderate
our turnaround time (receipt of loan
application to funds disbursement) without
compromising processes or asset quality.
Outlook It’s on the back of a seamless
strengthening of functions; Fusion is
poised to move into a higher orbit,
strengthening growth and profitability in a
sustainable way across the future.
Regards,
The management team
ASSUMING AN ANNUAL AVERAGE LOAN SIZE OF C15,000 PER HOUSEHOLD, THE TOTAL MICRO-CREDIT POTENTIAL IN INDIA IS ESTIMATED AT ABOVE C202,050 CRORE, REPRESENTING YEARS OF SUSTAINABLE REVENUE GROWTH
ANNUAL REPORT 2013-14 > 1514

STRENGTHS AT FUSION
FUSION’S IMPROVING FINANCIALS.
Focus: The Company
provides underprivileged and
unbanked women with viable
prospects to transform their
lives.
Presence: The Company
has selected to grow in
underpenetrated areas across
the states of its presence.
Transparency: The
Company’s transparent pricing
and well-articulated processes
have strengthened brand
recall.
Dynamism: The Company
has adapted processes in line
with the evolving business
environment.
Technology: The Company
has invested in robust IT and
MIS systems, facilitating a
continuous monitoring of
clients, disbursements, cash
management, field officers
and operating expenses.
Governance: The Company
has ensured regulatory
compliances and governance
commitment.
Business growth
Profitability improvement
Stronger financial statements
86% Increase in active loan clients
(3-year CAGR)
446% Increase in net profit margin
(Between 2011-12 and 2013-14)
228% Increase in return on equity
(Between 2011-12 and 2013-14)
91% Revenue growth (3-year CAGR)
346% Growth in profit for the year
(3-year CAGR)
40% Growth in shareholders’ funds
(3-year CAGR)
FUSION MICROFINANCE PRIVATE LIMITED
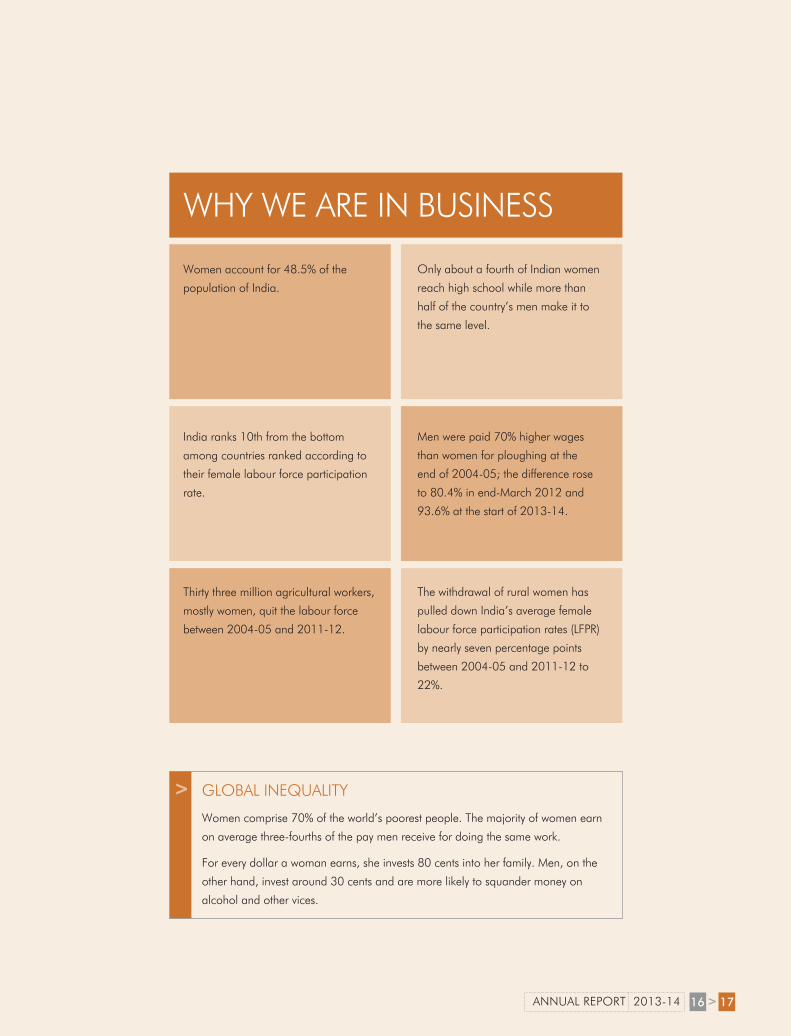
GLOBAL INEQUALITY
Women comprise 70% of the world’s poorest people. The majority of women earn
on average three-fourths of the pay men receive for doing the same work.
For every dollar a woman earns, she invests 80 cents into her family. Men, on the
other hand, invest around 30 cents and are more likely to squander money on
alcohol and other vices.
WHY WE ARE IN BUSINESS
Women account for 48.5% of the
population of India.
India ranks 10th from the bottom
among countries ranked according to
their female labour force participation
rate.
Thirty three million agricultural workers,
mostly women, quit the labour force
between 2004-05 and 2011-12.
Only about a fourth of Indian women
reach high school while more than
half of the country’s men make it to
the same level.
Men were paid 70% higher wages
than women for ploughing at the
end of 2004-05; the difference rose
to 80.4% in end-March 2012 and
93.6% at the start of 2013-14.
The withdrawal of rural women has
pulled down India’s average female
labour force participation rates (LFPR)
by nearly seven percentage points
between 2004-05 and 2011-12 to
22%.
ANNUAL REPORT 2013-14 > 1716

THE MICROFINANCE SECTOR – REVIEW AND OPTIMISM
OverviewIn India, microfinance is defined as
the loans up to C50,000 to unbanked
customers.
The country’s microfinance sector is
socially conscious, commercially viable
and financially sustainable. Over the
years, MFIs have developed a sustainable
business model to circumvent challenges
faced by the financial services sector
in servicing low-income and unbanked
customers, strengthening the country’s
efforts to guarantee financial inclusion.
The country’s microfinance sector has
matured following the 2010 Andhra
Pradesh crisis, one of the manifestations
being a performance reporting discipline
comprising coverage of performance
within and outside Andhra Pradesh.
Case in point: India’s microfinance
institutions registered strong growth in
the Outstanding Loan Portfolio (OLP)
category. The OLP of the NBFC-MFIs
increased at a CAGR of 26.76% from
C17,383 crore in FY12 to C27,931 crore
in FY14 following an increase in active
borrowers from 2.27 crore to 2.8 crore.
The medium-sized institutions (with OLPs
between C100 – C500 crore) reported the
highest growth of 32% and 57% in FY
2013 and 2014 respectively.
The outperformance of the MFI segment
was catalysed by a significant increase in
debt funding. The sector also attracted
significant equity investments from private
investors, reflecting a growing confidence
in the sector’s capability to fulfil the needs
of its enormous target audience, who
have otherwise remained unaddressed in
the traditional scheme of things.
FY12
OLP, Disbursements
FY13 FY14
(C crore)
OLP & Annual Disbursements
17,1
68
20,9
51
20,7
26
2368
6
27,9
31
34,9
68
FY12
OLP/client Loan disbursed/client
FY13 FY14
(C crore)
Loan disbursed per client
7,64
5
11,8
72
8,89
5
12,7
57
9,96
1
14,3
43
Small MFIs Medium MFIs Large MFIs
FY13 FY14
(C crore)
Growth rates of MFIs
23%
32%
17%
23%
57%
32%
FUSION MICROFINANCE PRIVATE LIMITED

OptimismThe primary target of MFIs comprise 134.7 million ‘deprived’ households with an annual household income of less than C112,000 but lacking access to essential financial services like credit, insurance and savings facilities. These households comprise 56.13% of the total households in India.
Based on average loan size of C15,000, the total micro-credit demand is estimated at between C202,050 crore and C673,500 crore (Source: National Survey of Household Income & Expenditure (2011), NCAER-CMCR). Over the next five years, the potential market at a 50% penetration level and average loan size of C30,000 is estimated at C202,050 crore; ICRA’s estimate is between C140,000 to C250,000 crore.
Rich (3.2 m HH)
Middle Class (31.4 m HH)
Deprived (134.7 m HH)
Aspirers (70.7 m HH) MFIs target
‘Bottom of Pyramid’
(Source: National Survey of Household Income & Expenditure (2011), NCAER-CMCR)
MFI AND SHG PENETRATION AMONG FEMALE POPULATION
> = 5% & <10%
> = 2% & <5%
> = 15% & <20%
> = 10%
> = 10% & <15%
> = 0% & <2%
ANNUAL REPORT 2013-14 > 1918

BOARD MEMBERS
Mr. Vishwanath Seshadri Independent Director
A chartered accountant cost and works accountant and commerce graduate, he has over 25 years of work experience of working at ICICI Bank, GE Capital and a few other companies.
He was instrumental in setting up the retail risk management function within ICICI Bank during its foray into retail banking in 1998.
Mr. Njord Andrewes Nominee Director
Njord Andrewes is the Investment Director of the NMI Global Fund. Prior to joining NMI, Mr. Andrewes has worked as an equity research analyst at Lazard Capital Markets and Janney Montgomery Scott, LLC. He began his career at
Robertson Stephens in sales and trading. Mr. Andrewes is an MBA in finance from the Kelley School of Business, Indiana University, and a B.A. in economics from Hope College, Michigan.
Mr. Aditya Bhandari Nominee Director
Aditya joined the Board of Directors of Fusion Microfinance in May 2010. He holds Board-level positions in other leading MFIs in India. He has over eleven years of experience in investment management, investment banking and corporate finance. His professional repertoire includes working with Aavishkaar Venture Capital, Goldman Sachs and Standard Chartered Bank.
He holds an Associate degree from the Institute of Chartered Accountants of India and Bachelors in Commerce from the University of Madras. He has attended the executive program on private equity education organized by the Indian School of Business and a program on Strategic Leadership for Microfinance course to be held at Harvard Business School.
Mr. Ashish Tewari COO & Director
An economics, law and management Graduate with over a decade of experience in financial services, Ashish has earlier worked with Development Credit Bank, GE and ICICI in various positions.
His expertise lies in the area of people management, recruitment, training, distribution and mapping productivity, spotting potential new business opportunities and chalking out business plans
Mr. Devesh Sachdev CEO & Director
An XLRI post graduate with 16 years of experience in the service industry, Devesh leads from the front. He started his career with Citigroup after which his entrepreneurial hunger forced him to join a mid-sized logistics company, BSA. When he left, BSA was operating from 26 cities, had more than
500 employees, 300 business associates and was handling around 4 million transactions in a month.
His expertise includes managing large teams cost-efficiently, managing relationships effectively and handling all operational aspects of a business.
FUSION MICROFINANCE PRIVATE LIMITED

STATUTORY SECTIONDirectors’ Report ................. 22
Corporate Governance ....... 24
Financial Section ................. 25
ANNUAL REPORT 2013-14 > 2120

DIRECTORS’ REPORT
Financial Results (C in lacs)
Particulars Financial Year ended
March 31, 2014
Financial Year ended
March 31, 2013
Total Income 2496.16 1085.58
Total Expenditure 2053.17 1059.22
Profit/(Loss) before Tax 442.98 26.35
Less: Current Tax 175.61 4.31
Add: Deferred Tax 33.49 5.59
Profit/(Loss) after Tax 300.86 27.64
To
The Members,
Fusion Microfinance Private Limited
Your Directors have immense pleasure in presenting the Annual Report together with the Audited Accounts for the year ended
March 31, 2014.
PerformanceThe total income of the Company for the year has increased by
129.94% in comparison to last financial year and the profit after
Tax for the year has increased by 988.49% in comparison to last
financial year.
RBI GuidelinesThe Company is registered with the Reserve Bank of India as
a NBFC within the provisions of the NBFC (Reserve Bank of
India) Directions, 1998. The Company continues to comply with
all the requirements prescribed by the Reserve Bank of India as
applicable to it.
DividendNo dividend has been declared in the current financial year.
Fixed DepositsCompany has neither invited nor accepted any deposits from
public within the meaning of Section 58A of the Companies Act,
1956 read with Companies (Acceptance of Deposit) Rules 1975
during the period under review.
Internal Control SystemCompany is following an effective internal control system
commensurate with its size and operations. In addition to this the
work process is designed in such a way that process of internal
check is ensured at all levels.
Director’s Responsibility StatementPursuant to Section 217(2AA) of the Companies Act, 1956, with
respect to the Directors’ Responsibility Statement, your Directors
FUSION MICROFINANCE PRIVATE LIMITED

hereby confirmed that:
(i) In the preparation of the annual accounts for the year ended
March 31,2014 the applicable accounting standards have
been followed along with proper explanations relating to
material departures, wherever applicable;
(ii) the Directors have selected such accounting policies and
applied them consistently and made judgments and estimates
that are reasonable and prudent so as to give a true and fair
view of the state of affairs of the Company as at March 31,
2014, and of the loss of the Company for the year;
(iii) the Directors have taken proper and sufficient care for the
maintenance of adequate accounting records in accordance
with the provisions of the Companies Act, 1956 for
safeguarding the assets of the Company and for preventing
and detecting fraud and other irregularities; and
(iv) the Directors have prepared the annual accounts on a ‘going
concern’ basis.
AuditorsM/s B.S.R & Associates LLP, Chartered Accountants, will retire
at the conclusion of the forthcoming Annual General Meeting
and are eligible for re-appointment. Members are requested to
consider their re-appointment on remuneration to be decided by
the Board.
B.S.R & Co. converted itself into a Limited Liability Partnership
(LLP) under the provisions of the Limited Liability Partnership Act,
2008 and is now known as M/s B.S.R & Associates LLP, Chartered
Accountants and have confirmed their eligibility and willingness
to accept the office of the Statutory Auditors, if re-appointed.
Conservation of Energy, Technology Absorption and Foreign Exchanges and OutgoStatement containing the necessary information as required under
section 217 (1) (e) read with Companies (Disclosure of Particulars
in the Report of Board of Director) Rules, 1988 is given is as under:
A. Energy Conservation
The operations of the Company are not energy intensive.
Further, every endeavor has been made to ensure the optimal
use of energy, avoid wastage and conserve energy as far as
possible.
B. Technology Absorption
No imported technology is involved in the operation of the
company. Therefore there is no technology absorption.
AcknowledgementsThe Board wishes to place on record its sincere appreciation for
the continued assistance, support and co-operation extended to
the Company by the Customers, Banks, Financial Institutions,
Investors, Government Authorities and Employees during the year
under review and look forward to their continued support in the
future.
By order of the Board of Directors
For Fusion Microfinance Private Limited
Place: New Delhi Devesh Sachdev Ashish Tewari
Dated: June 24, 2014 (Director& CEO) (Director & COO)
ANNUAL REPORT 2013-14 > 2322

CORPORATE GOVERNANCE REPORT
To
The Members,
Fusion Microfinance Private Limited
Board Strength & RepresentationComposition and CategoryThe current policy is to have an appropriate mix of executive and Non Executive directors to maintain independence of the Board.
The composition of Board of Directors is as under:
Name of the Director Category
Devesh Sachdev Director
Ashish Tewari Director
Aditya Bhandari Nominee Director
Vishwanath Seshadri Independent Director
Njord Andrewes Nominee Director
Change in boardDuring the year there is no change in the Board.
Conduct of Board ProcedureThe day-to-day business is conducted by the executives and the business heads of the Company under the direction of the designated CEO and the supervision of the Board led by the Chairman. The Board holds a minimum of four meetings every year to review and discuss the performance of the Company, its future plans, strategies and other pertinent issues relating to the Company.
Committees of the Board
Audit Committee:The Audit Committee consists of the following members of the Board:
Mr. Vishwanath Seshadri – ChairmanMr. Ankur Singhal – MemberMr. Aditya Bhandari – Member
The committee holds a meeting each quarter to review, the audited/un-audited Financial Statements, Oversight of the Company’s Financial Reporting Process, Reviewing of Quarterly Financial Statements, Reviewing the adequacy of Internal Audit Function, Reviewing the performance of Statutory and Internal Auditors and adequacy of Internal Control Systems.
ALM Committee:The ALM Committee consists of the following members of the Board:
Mr. Devesh Sachdev – ChairmanMr. Ashish Tewari – DirectorMr. Aditya Bhandari – Director
The committee holds a meeting each quarter to review the Asset-Liability management system and procedures.
Compliance: To prepare a calendar detailing the list of compliance/covenants
that need to be monitored, and the frequency of its reporting to the Board of the company as well as to regulatory agencies and other stakeholders.
To review statement of significant related party transactions and examination of reasons for substantial defaults, if any, in payment to stakeholders.
To review compliance with stipulated statutory and regulatory requirements particularly in relation to financial management and reporting.
To review compliance of the various inspection and audit reports of internal and statutory auditors and commenting on the action taken report prepared by the management and ensuring submission to the Board of the company from time to time.
To review the consolidated compliance report and the final accounting system for the financial year before it is submitted to the Board of the company for adoption.
To internalise guidelines issued by the regulator specifically for the microfinance industry or any other such guidelines as may be relevant to the company and monitor adherence to the same.
Management Discussion and AnalysisThe Company is registered with the Reserve Bank of India as a NBFC within the provisions of the NBFC (Reserve Bank of India) Directions, 1998. The Company continues to comply with all the requirements prescribed by the Reserve Bank of India as applicable to it.
Internal Control Systems and Their AdequacyThe Company has proper and adequate system of internal controls to ensure that all assets are safeguarded and protected against loss from misuse or disposition and that transaction are authorized, recorded and reported correctly.
The internal control is supplemented by an extensive program of internal audits, review by management and guidelines and procedures. The internal control is designed to ensure that the financial and other records are reliable for preparing financial statements and other data, and for maintaining accountability of assets.
FUSION MICROFINANCE PRIVATE LIMITED

AnnuAl RepoRt 2013-14 > 31PB
InDepenDent AuDItoR’S RepoRt
Report on the Financial StatementsWe have audited the accompanying financial statements of Fusion Micro Finance Private Limited, (‘the Company’), which comprise the Balance Sheet as at 31 March 2014, the Statement of Profit and Loss and the Cash Flow Statement for the year then ended, and a summary of significant accounting policies and other explanatory information (‘collectively referred to as the ‘financial statements’).
Management’s Responsibility for the Financial StatementsManagement is responsible for the preparation of these financial statements that give a true and fair view of the financial position, the financial performance and the cash flows of the Company in accordance with the Accounting Standards referred to in sub-section (3C) of Section 211 of the Companies Act, 1956 (“the Act”). This responsibility includes the design, implementation and maintenance of internal control relevant to the preparation and presentation of the financial statements that give a true and fair view and are free from material misstatement, whether due to fraud or error.
Auditor’s ResponsibilityOur responsibility is to express an opinion on these financial statements based on our audit. We conducted our audit in accordance with the Standards on Auditing issued by the Institute of Chartered Accountants of India (ICAI). Those Standards require that we comply with ethical requirements and plan and perform the audit to obtain reasonable assurance about whether the financial statements are free from material misstatement.
An audit involves performing procedures to obtain audit evidence about the amounts and disclosures in the financial statements. The procedures selected depend on the auditor’s judgement, including the assessment of the risks of material misstatement of the financial statements, whether due to fraud or error. In making those risk assessments, the auditor considers internal control relevant to the Company’s preparation and fair presentation of the financial statements in order to design audit procedures that are appropriate in the circumstances, but not for the purpose of expressing an opinion on the effectiveness of the Company’s internal control. An audit also includes evaluating the appropriateness of accounting policies used and the reasonableness of the accounting estimates made by management, as well as evaluating the overall presentation of the financial statements.
We believe that the audit evidence we have obtained is sufficient and appropriate to provide a basis for our audit opinion.
OpinionIn our opinion and to the best of our information and according
to the explanations given to us, the financial statements give the information required by the Act in the manner so required and give a true and fair view in conformity with the accounting principles generally accepted in India:
i. in the case of the Balance Sheet, of the state of affairs of the Company as at 31 March 2014;
ii. in the case of the Statement of Profit and Loss, of the profit for the year ended on that date; and
iii. in the case of the Cash Flow Statement, of the cash flows for the year ended on that date.
Report on Other Legal and Regulatory Requirements1. As required by the Companies (Auditor’s Report) Order,
2003, as amended (“the Order”) issued by the Central Government of India in terms of sub-section (4A) of Section 227 of the Act, we enclose in the Annexure a statement on the matters specified in paragraphs 4 and 5 of the said Order.
2. As required by Section 227(3) of the Act, we report that: a) we have obtained all the information and explanations
which to the best of our knowledge and belief were necessary for the purpose of our audit;
b) in our opinion proper books of account as required by law have been kept by the Company so far as appears from our examination of those books;
c) the Balance Sheet, the Statement of Profit and Loss, and the Cash Flow Statement dealt with by this Report are in agreement with the books of account;
d) in our opinion, the Balance Sheet, the Statement of Profit and Loss, and the Cash Flow Statement comply with the Accounting Standards referred to in sub-section (3C) of Section 211 of the Act; and
e) on the basis of written representations received from the directors as on 31 March 2014, and taken on record by the Board of Directors, we report that none of the directors is disqualified as on 31 March 2014, from being appointed as a director in terms of clause (g) of sub-section (1) of Section 274 of the Act.
for B S R & Associates LLP Chartered Accountants Firm Membership No: 116231W
Sriram MahalingamPlace: Hyderabad PartnerDate : 24 June 2014 Membership No: 049642
TO THE MEMBERS OF FUSION MICRO FINANCE PRIVATE LIMITED

FuSION MICROFINANCe PRIvATe LIMITeD
ANNeXuRe TO THe INDePeNDeNT AuDITOR’S RepoRt
The Annexure referred to in our report of even date to the Members
of Fusion Micro Finance Private Limited (‘the Company’) on the
financial statements for the year ended 31 March 2014. We
report that:
(i) (a) The Company has maintained proper records showing
full particulars, including quantitative details and
situation of fixed assets.
(b) The Company has a regular programme of physical
verification of its fixed assets by which all fixed assets
are verified every year. In our opinion, the periodicity
of physical verification is reasonable having regard
to the size of the Company and nature of its assets.
No material discrepancies were noticed on such
verification.
(c) The Company has not disposed any fixed assets during
the year, and therefore, do not affect the going concern
assumption.
(ii) The Company is a Non-Banking Finance Company-Micro
Finance Institution (NBFC-MFI), engaged in the business
of providing micro credit. Accordingly it does not hold any
physical inventories. Hence, paragraph 4(ii) of the Order is
not applicable
(iii) (a) The Company has granted unsecured loans to two
Directors covered in the register maintained under
Section 301 of the Companies Act, 1956 (‘Act’). The
maximum amount outstanding during the year was
Rs. 971,088 and the year-end balance of such loans
was Nil.
(b) In our opinion, the rate of interest and other terms
and conditions on which the above mentioned loans
have been granted to the Directors listed in the register
maintained under Section 301 of the Act are not, prima
facie, prejudicial to the interest of the Company.
(c) In the case of above mentioned loans granted to the
Directors listed in the register maintained under Section
301 of the Act, the borrowers have been regular in
repaying the principal amounts as stipulated and in the
payment of interest.
(d) There is no overdue amount of more than Rupees one
lakh in respect of loans granted to Directors listed in the
register maintained under Section 301 of the Act.
(e) The Company has taken loan from one Director
covered in the register maintained under Section 301
of the Act. The maximum amount outstanding during
the year was Rs. 3,400,000 and the year-end balance
of such loan was Rs. Nil.
(f) In our opinion, the rate of interest and other terms
and conditions on which the above mentioned loan
has been taken from Director listed in the register
maintained under Section 301 of the Act is not, prima
facie, prejudicial to the interest of the company.
(g) In the case of loan taken from Director listed in the
register maintained under Section 301 of the Act, the
Company has been regular in repaying the principal
amounts as stipulated and in the payment of interest.
(iv) In our opinion and according to the information and
explanations given to us, and having regard to the
explanation that purchases of certain items of fixed assets
are for the company’s specialized requirement and suitable
alternative sources are not available to obtain comparable
quotations, there is an adequate internal control system
commensurate with the size of the Company and the
nature of its business with regard to purchase of fixed assets
and with regard to the services rendered by the Company.
The activities of the Company do not involve purchase of
inventory and sale of goods. We have not observed any
major weakness in the internal control system during the
course of the audit.
(v) (a) In our opinion and according to the information and
explanations given to us, the particulars of contracts or
arrangements referred to in Section 301 of the Act have
been entered in the register required to be maintained
under that section.
(b) In our opinion, and according to the information
and explanations given to us, the transactions made
in pursuance of such contracts and arrangements
referred to in (a) above and exceeding the value of
Rs. 5 lakh with any party during the year have been
made at prices which are reasonable having regard to
the prevailing market prices at the relevant time.
(vi) The Company has not accepted any deposits from the
public.

AnnuAl RepoRt 2013-14 > 3332
(vii) In our opinion, the Company has an internal audit system
commensurate with the size and the nature of its business.
(viii) The Central Government of India has not prescribed the
maintenance of cost records under Section 209(1)(d) of the
Act for any of the services rendered by the Company.
(ix) (a) According to the information and explanations given to
us and on the basis of our examination of the records
of the Company, amounts deducted/accrued in the
books of account in respect of undisputed statutory
dues including Provident Fund, employees’ State
Insurance, Income-tax, Service tax, and other material
statutory dues have generally been regularly deposited
during the year by the Company with the appropriate
authorities. As explained to us, the Company did not
have any dues on account of Investor education and
protection fund, Wealth tax, Customs duty, Sales tax,
Cess and excise duty.
According to the information and explanations given
to us, no undisputed amounts payable in respect of
Provident Fund, employees’ State Insurance, Income-
tax, Service tax and other material statutory dues were
in arrears as at 31 March 2014 for a period more than
six months from the date they became payable.
(b) According to the information and explanations given
to us, there are no dues of Income tax, Service tax
and Wealth tax which have not been deposited with
appropriate authorities on account of any dispute. As
explained to us, the provisions of Sales tax, Customs
duty, Cess and excise duty are not applicable.
(x) The Company does not have any accumulated losses at the
end of the financial year and has not incurred cash losses
in the financial year and in the immediately preceding
financial year.
(xi) In our opinion and according to the information and
explanations given to us, the Company has not defaulted
in repayment of dues to its bankers, financial institutions or
any debenture holders during the year.
(xii) The Company has not granted any loans and advances on
the basis of security by way of pledge of shares, debentures
and other securities.
(xiii) In our opinion and according to the information and
explanations given to us, the Company is not a chit fund or
a nidhi/ mutual benefit fund/ society.
(xiv) According to the information and explanations given to us,
the Company is not dealing or trading in shares, securities,
debentures and other investments.
(xv) According to the information and explanations given to us,
the Company has not given any guarantee for loans taken
by others from banks or financial institutions.
(xvi) In our opinion and according to the information and
explanations given to us, the term loans taken by the
company have been applied for the purpose for which they
were raised.
(xvii) According to the information and explanations given to us
and on an overall examination of the Balance Sheet of the
Company, we are of opinion that the funds raised on short-
term basis have not been used for long-term investment.
(xviii) The Company has not made any preferential allotment
of shares to companies, firms and parties covered in the
register maintained under Section 301 of the Companies
Act, 1956.
(xix) According to the information and explanations given to us,
the Company has not created security or charge in respect
of debentures outstanding during the year.
(xx) The Company has not raised any money by way of public
issues
(xxi) According to the information and explanations given to us,
we report that no material fraud on or by the Company has
been noticed / reported during the year except instances
of cash embezzlements by an employee of the Company
aggregating an amount of Rs. 82,000. The services of
the employee was terminated and the entire amount was
recovered from the employee.
for B S R & Associates LLP
Chartered Accountants
Firm Membership No: 116231W
Sriram Mahalingam
Place: Hyderabad Partner
Date : 24 June 2014 Membership No: 049642

FuSION MICROFINANCe PRIvATe LIMITeD
The notes referred to above form an integral part of the financial statements.
As per our report of even date attached for and on behalf of the Board of Directors of For B S R & Associates LLP Fusion Micro Finance Private LimitedChartered AccountantsFirm Registration No.:116231W
Sriram Mahalingam Devesh Sachdev Ashish Tewari Partner Director & CEO Director & COOMembership No.:049642
Place: Hyderabad Deepak MadaanDate: 24 June 2014 Company Secretary
BALANCe SHeeT as at 31 March 2014(All amounts in Indian rupees, except share data and where otherwise stated)
NotesAs at
31 March 2014As at
31 March 2013EQUITY AND LIABILITIESShareholders’ FundsShare capital 2.1 10,70,29,900 10,70,29,900 Reserves and surplus 2.2 13,39,59,679 10,38,73,345
24,09,89,579 21,09,03,245 Non-Current LiabilitiesLong-term borrowings 2.3 33,41,05,157 25,85,40,309 Long-term provisions 2.4 50,27,884 23,59,286 Other long term liabilities 2.5 92,73,064 9,80,004
34,84,06,105 26,18,79,599 Current LiabilitiesOther current liabilities 2.6 85,05,19,543 32,64,87,573 Short-term provisions 2.7 83,59,508 45,92,243
85,88,79,051 33,10,79,816 Total 1,44,82,74,735 80,38,62,660
ASSETSNon-Current AssetsFixed Assets 2.8(i) Tangible fixed assets 1,22,71,020 25,02,872(ii) Intangible fixed assets 6,71,077 5,29,205Deferred tax asset, net 2.33 45,03,576 11,53,928 Loan portfolio 2.9 24,87,20,909 7,19,61,295 Long-term loans and advances 2.10 16,09,653 27,95,689 Other non current assets 2.11 6,90,31,233 4,13,65,842
33,68,07,469 12,03,08,831 Current assetsCurrent investments 2.12 2,29,28,776 20,79,08,449 Cash and bank balance 2.13 25,33,60,857 8,84,17,151 Loan portfolio 2.9 77,88,42,073 34,23,92,856 Short-term loans and advances 2.14 1,11,48,165 58,33,564 Other current assets 2.15 4,51,87,395 3,90,01,809
1,11,14,67,266 68,35,53,829 Total 1,44,82,74,735 80,38,62,660
Significant accounting policies 1
Notes to the financial statements 2

AnnuAl RepoRt 2013-14 > 3534
The notes referred to above form an integral part of the financial statements.
As per our report of even date attached for and on behalf of the Board of Directors of For B S R & Associates LLP Fusion Micro Finance Private LimitedChartered AccountantsFirm Registration No.:116231W
Sriram Mahalingam Devesh Sachdev Ashish Tewari Partner Director & CEO Director & COOMembership No.:049642
Place: Hyderabad Deepak MadaanDate: 24 June 2014 Company Secretary
STATeMeNT OF PROFIT AND LOSS for the year ended 31 March 2014(All amounts in Indian rupees, except share data and where otherwise stated)
NotesFor the year ended
31 March 2014For the year ended
31 March 2013INCOME Revenue from operations 2.16 24,88,63,880 10,79,86,409 Other income 2.17 7,52,499 5,71,198 Total revenue 24,96,16,379 10,85,57,607 EXPENSES Operating expenses 2.18 1,18,40,057 30,26,781 employee benefits 2.19 6,71,08,343 3,44,09,691 Finance costs 2.20 9,81,17,209 5,45,87,778 Depreciation and amortisation 2.8 37,96,938 20,58,216 Other expenses 2.21 2,44,55,437 1,18,39,793
Total expenses 20,53,17,984 10,59,22,259 Profit before tax 4,42,98,395 26,35,348 Tax expenses:- Current tax 1,75,61,709 4,31,200 - Deferred tax (33,49,648) (5,59,680)Profit after tax 3,00,86,334 27,63,828
Earning per equity share 2.28
[Nominal value per share Rs. 10 (previous year Rs. 10)]
Basic 2.81 (0.04)
Diluted 1.97 (0.04)
Significant accounting policies 1
Notes to the financial statements 2
FuSION MICROFINANCe PRIvATe LIMITeD
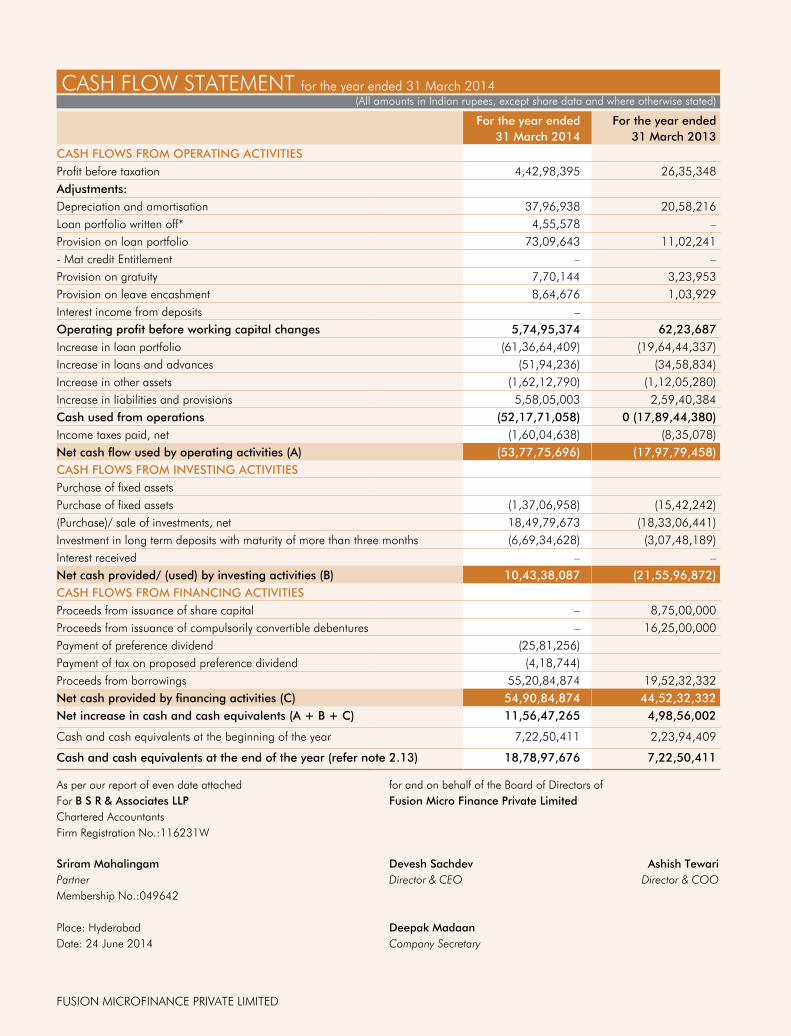
CASH FLOW STATeMeNT for the year ended 31 March 2014(All amounts in Indian rupees, except share data and where otherwise stated)
For the year ended 31 March 2014
For the year ended 31 March 2013
CASH FLOWS FROM OPERATING ACTIVITIES Profit before taxation 4,42,98,395 26,35,348 Adjustments:Depreciation and amortisation 37,96,938 20,58,216 Loan portfolio written off* 4,55,578 –Provision on loan portfolio 73,09,643 11,02,241 - Mat credit entitlement – –Provision on gratuity 7,70,144 3,23,953 Provision on leave encashment 8,64,676 1,03,929 Interest income from deposits –Operating profit before working capital changes 5,74,95,374 62,23,687 Increase in loan portfolio (61,36,64,409) (19,64,44,337)Increase in loans and advances (51,94,236) (34,58,834)Increase in other assets (1,62,12,790) (1,12,05,280)Increase in liabilities and provisions 5,58,05,003 2,59,40,384 Cash used from operations (52,17,71,058) 0 (17,89,44,380)Income taxes paid, net (1,60,04,638) (8,35,078)Net cash flow used by operating activities (A) (53,77,75,696) (17,97,79,458)CASH FLOWS FROM INVESTING ACTIVITIESPurchase of fixed assetsPurchase of fixed assets (1,37,06,958) (15,42,242)(Purchase)/ sale of investments, net 18,49,79,673 (18,33,06,441)Investment in long term deposits with maturity of more than three months (6,69,34,628) (3,07,48,189)Interest received – –Net cash provided/ (used) by investing activities (B) 10,43,38,087 (21,55,96,872)CASH FLOWS FROM FINANCING ACTIVITIESProceeds from issuance of share capital – 8,75,00,000 Proceeds from issuance of compulsorily convertible debentures – 16,25,00,000 Payment of preference dividend (25,81,256)Payment of tax on proposed preference dividend (4,18,744)Proceeds from borrowings 55,20,84,874 19,52,32,332 Net cash provided by financing activities (C) 54,90,84,874 44,52,32,332 Net increase in cash and cash equivalents (A + B + C) 11,56,47,265 4,98,56,002
Cash and cash equivalents at the beginning of the year 7,22,50,411 2,23,94,409
Cash and cash equivalents at the end of the year (refer note 2.13) 18,78,97,676 7,22,50,411
As per our report of even date attached for and on behalf of the Board of Directors of For B S R & Associates LLP Fusion Micro Finance Private LimitedChartered AccountantsFirm Registration No.:116231W
Sriram Mahalingam Devesh Sachdev Ashish Tewari Partner Director & CEO Director & COOMembership No.:049642
Place: Hyderabad Deepak MadaanDate: 24 June 2014 Company Secretary

AnnuAl RepoRt 2013-14 > 3736
NOTeS TO THe FINANCIAL STATeMeNT for the year ended 31 March 2014(All amounts in Indian rupees, except share data and where otherwise stated)
COMPANY OVERVIEWFusion Micro Finance Private Limited (‘the Company’) was incorporated on 5 September 1994 under the Companies Act, 1956. The Company is registered effective 19 May 2010 as a Non Banking Financial (Non – Deposit Accepting or Holding) Company under section 45-IA of the Reserve Bank of India Act, 1934. The Company got converted to Non Banking Financial Company-Micro Finance Institution (NBFC-MFI) with effect from 28 January 2014.
It is engaged in micro finance lending activities, providing financial services to poor women in India who are organized as Joint Liability Groups (‘JLGs’). The Company provides small value collateral free loans up to Rs. 50,000. All financial transactions are conducted in the group meetings organized near the habitats of the borrowers. Further the company also provides small ticket vehicle loan size upto Rs. 600,000.
1. SIGNIFICANT ACCOUNTING POLICIESa. Basis of preparation of financial statements The financial statements have been prepared and presented under the historical cost convention on the accrual basis of accounting
in accordance with the Generally Accepted Accounting Principles (GAAP) in India and comply with the Accounting Standards (“AS”) prescribed by the Companies (Accounting Standards) Rules, 2006 issued by the Central Government, the relevant provisions of the Companies Act, 1956 (‘the Act’) and / or the Companies Act, 2013, as appropriate and the relevant guidelines of Reserve Bank of India (‘RBI’) to the extant applicable to a Non Banking Financial (Non – Deposit Accepting or Holding) Company / Non Banking Financial Company-Micro Finance Institution (NBFC-MFI). The financial statements are presented in Indian Rupees rounded off to the nearest rupee.
b. Use of estimates The preparation of financial statements in conformity with GAAP requires management to make judgments, estimates and
assumptions that affect the application of accounting policies and reported amounts of assets, liabilities, income and expenses and the disclosure of contingent liabilities on the date of the financial statements. Actual results could differ from those estimates. estimates and underlying assumptions are reviewed on an ongoing basis. Any revision to accounting estimates is recognized prospectively in current and future periods.
c. Current – non-current classification All assets and liabilities are classified into current and non-current.
Assets An asset is classified as current when it satisfies any of the following criteria: i. it is expected to be realised in, or is intended for sale or consumption in, the company’s normal operating cycle;
ii. it is held primarily for the purpose of being traded;
iii. it is expected to be realised within 12 months after the reporting date; or
iv. it is cash or cash equivalent unless it is restricted from being exchanged or used to settle a liability for atleast 12 months after the reporting date.
Current assets include the current portion of non-current financial assets. All other assets are classified as non-current.
Liabilities A liability is classified as current when it satisfies any of the following criteria: i. it is expected to be settled in the company’s normal operating cycle;
ii. it is held primarily for the purpose of being traded;
iii. it is due to be settled within 12 months after the reporting date; or
iv. the company does not have an unconditional right to defer settlement of the liability for atleast 12 months after the reporting date.
Current liabilities include the current portion of non-current financial liabilities. All other liabilities are classified as non-current.
Operating cycle Company has ascertained its operating cycle as 12 months that is the time between the acquisition of assets for processing and
their realization in cash or cash equivalents.

FuSION MICROFINANCe PRIvATe LIMITeD
NOTeS TO THe FINANCIAL STATeMeNT for the year ended 31 March 2014(All amounts in Indian rupees, except share data and where otherwise stated)
d. Revenue recognition i. Interest income on loan portfolio is recognised in the Statement of Profit and Loss on accrual basis using effective interest
method except in the case of non-performing assets (“NPA’s”) where it is recognised, upon realisation, as per the prudential norms of Reserve Bank of India (RBI).
ii. Premium on securitisation of assets is the difference between the book value of the securitised assets and consideration received on the assets derecognised from books. Premium on securitisation is amortised over the life of the securitised loan portfolio and losses, if any, are recognised immediately in accordance with the guidelines laid down by RBI.
iii. Loan processing fee is accounted for upfront as and when it become due as per the terms of contract entered into with the customer.
iv. Interest on term deposits has been accrued on the time proportion basis, using the underlying interest rate.
v. Dividend income is accounted when the right to receive the dividend is established.
e. Classification of loan portfolio and provisioning policy 1. During the year the Company revised its classification and provisioning norms for its loan portfolio to align it with the RBI norms
for Non-Banking Financial Company – Micro Finance Institutions (NBFC-MFIs).
Asset classification norms: i. Standard asset means the asset in respect of which, no default in repayment of principal or payment of interest is perceived
and which does not disclose any problem nor carry more than normal risk attached to the business.
ii. Non-performing asset means an asset for which, interest/principal payment has remained overdue for a period of 90 days or more.
Provisioning norms: The aggregate loan provision shall not be less than the higher of:
a) 1% of the outstanding loan portfolio, or
b) 50% of the aggregate loan installments which are overdue for more than 90 days and less than 180 days and 100% of the aggregate loan installments which are overdue for 180 days or more.
During the year the Company discontinued provisioning on securitised portfolio.
2. The provisioning and asset classification norms, which was followed upto the previous financial year are as given below:
All loan exposures were classified into standard and NPAs. NPAs were classified into sub standard, doubtful and loss assets in accordance with Non-Banking Financial (Non-Deposit Accepting and Holding) Companies prudential Norms (Reserve Bank) Direction, 2007.
i. The Company maintains a general provision of 0.50% on outstanding loan balance of standard assets for both own and securitised loan portfolio.
ii. Provisioning norms for both own and securitised loan portfolio other than small ticket vehicle loan were as given below.
Asset classification Overdue days Provisioning %
Sub standard – I 1 – 30 days 1%
Sub standard – II 31 – 60 days 5%
Sub standard – III 61 – 90 days 15%
Sub standard – Iv 91 – 180 days 30%
Sub standard – v 181 – 365 days 60%
Doubtful and loss > 365 days 100%
iii. Provisioning norms for both own and securitised small ticket vehicle loan were as given below
Asset classification Overdue days Provisioning %
Sub standard – I 1 – 365 days 10%
Sub standard – II 365 – 540 days 20%
Sub standard – III 540 – 720 days 50%
Doubtful and loss > 720 days 100%
AnnuAl RepoRt 2013-14 > 3938
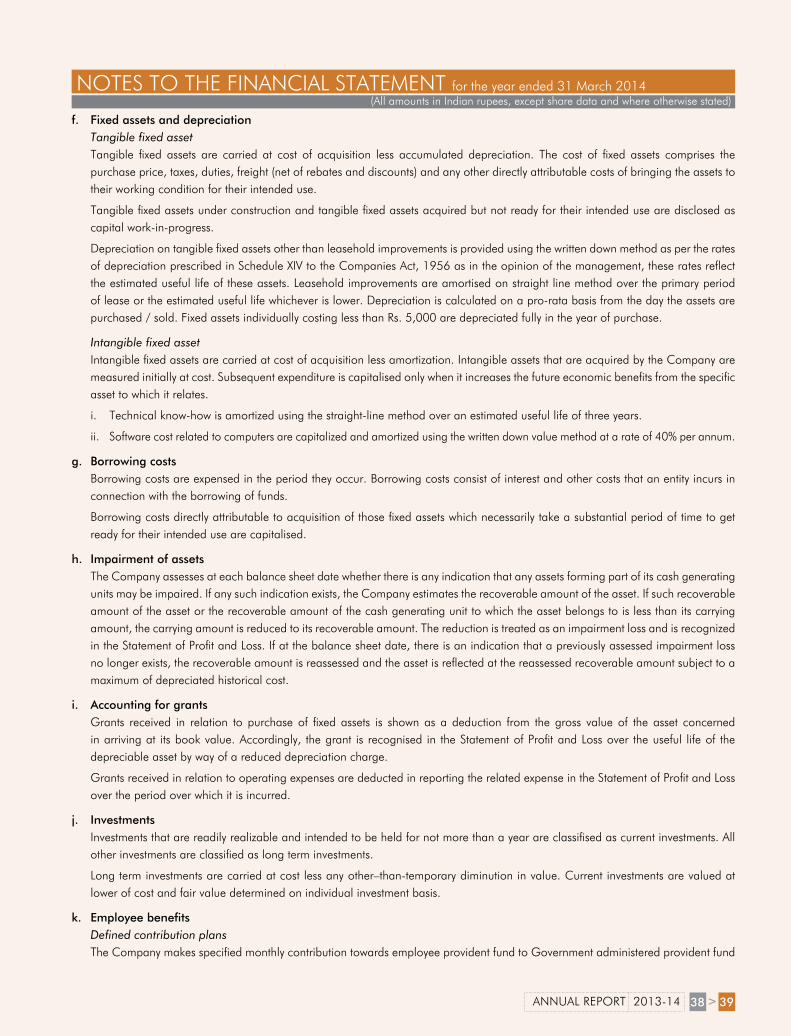
NOTeS TO THe FINANCIAL STATeMeNT for the year ended 31 March 2014(All amounts in Indian rupees, except share data and where otherwise stated)
f. Fixed assets and depreciation Tangible fixed asset Tangible fixed assets are carried at cost of acquisition less accumulated depreciation. The cost of fixed assets comprises the
purchase price, taxes, duties, freight (net of rebates and discounts) and any other directly attributable costs of bringing the assets to their working condition for their intended use.
Tangible fixed assets under construction and tangible fixed assets acquired but not ready for their intended use are disclosed as capital work-in-progress.
Depreciation on tangible fixed assets other than leasehold improvements is provided using the written down method as per the rates of depreciation prescribed in Schedule XIv to the Companies Act, 1956 as in the opinion of the management, these rates reflect the estimated useful life of these assets. Leasehold improvements are amortised on straight line method over the primary period of lease or the estimated useful life whichever is lower. Depreciation is calculated on a pro-rata basis from the day the assets are purchased / sold. Fixed assets individually costing less than Rs. 5,000 are depreciated fully in the year of purchase.
Intangible fixed asset Intangible fixed assets are carried at cost of acquisition less amortization. Intangible assets that are acquired by the Company are
measured initially at cost. Subsequent expenditure is capitalised only when it increases the future economic benefits from the specific asset to which it relates.
i. Technical know-how is amortized using the straight-line method over an estimated useful life of three years.
ii. Software cost related to computers are capitalized and amortized using the written down value method at a rate of 40% per annum.
g. Borrowing costs Borrowing costs are expensed in the period they occur. Borrowing costs consist of interest and other costs that an entity incurs in
connection with the borrowing of funds.
Borrowing costs directly attributable to acquisition of those fixed assets which necessarily take a substantial period of time to get ready for their intended use are capitalised.
h. Impairment of assets The Company assesses at each balance sheet date whether there is any indication that any assets forming part of its cash generating
units may be impaired. If any such indication exists, the Company estimates the recoverable amount of the asset. If such recoverable amount of the asset or the recoverable amount of the cash generating unit to which the asset belongs to is less than its carrying amount, the carrying amount is reduced to its recoverable amount. The reduction is treated as an impairment loss and is recognized in the Statement of Profit and Loss. If at the balance sheet date, there is an indication that a previously assessed impairment loss no longer exists, the recoverable amount is reassessed and the asset is reflected at the reassessed recoverable amount subject to a maximum of depreciated historical cost.
i. Accounting for grants Grants received in relation to purchase of fixed assets is shown as a deduction from the gross value of the asset concerned
in arriving at its book value. Accordingly, the grant is recognised in the Statement of Profit and Loss over the useful life of the depreciable asset by way of a reduced depreciation charge.
Grants received in relation to operating expenses are deducted in reporting the related expense in the Statement of Profit and Loss over the period over which it is incurred.
j. Investments Investments that are readily realizable and intended to be held for not more than a year are classifised as current investments. All
other investments are classified as long term investments.
Long term investments are carried at cost less any other–than-temporary diminution in value. Current investments are valued at lower of cost and fair value determined on individual investment basis.
k. Employee benefits Defined contribution plans The Company makes specified monthly contribution towards employee provident fund to Government administered provident fund

FuSION MICROFINANCe PRIvATe LIMITeD
NOTeS TO THe FINANCIAL STATeMeNT for the year ended 31 March 2014(All amounts in Indian rupees, except share data and where otherwise stated)
scheme, which is a defined contribution scheme. The Company’s contribution is recognised as an expense in the Statement of Profit and Loss during the period in which the employee renders the related service.
Defined benefit plan The Company provides for gratuity, a defined benefit plan covering eligible employees. Gratuity is accrued based on an actuarial
valuation as at the balance sheet date, carried out by an independent actuary using the projected unit credit method. Actuarial gains and losses arising during the year are immediately recognised in the Statement of Profit and Loss in the year in which they arise.
Compensated absences Compensated absences, is a long-term employee benefit, and accrued based on an actuarial valuation done as per projected unit
credit method as at the Balance Sheet date, carried out by an independent actuary.
Actuarial gains and losses arising during the year are immediately recognised in the Statement of Profit and Loss.
l. Income Tax Income tax expense comprises current tax and deferred tax.
Current tax The current charge for income taxes is calculated in accordance with the relevant tax regulations applicable to the Company.
Deferred tax Deferred tax charge or benefit reflects the tax effects of timing differences between accounting income and taxable income for the
period. The deferred tax charge or benefit and the corresponding deferred tax liabilities or assets are recognized using the tax rates that have been enacted or substantially enacted by the balance sheet date. Deferred tax assets are recognised only to the extent there is reasonable certainity that the assets can be realised in future; However, where there is unabsorbed depreciation or carry forward of losses, deferred tax assets are recognized only if there is a virtual certainty of realization of such assets. Deferred tax assets are reviewed at each balance sheet date and written-down or written-up to reflect the amount that is reasonably/virtually certain to be realised.
m. Earnings per share (“EPS”) Basic earnings per share is computed by dividing the net profit after tax for the year attributable to equity shareholders by the
weighted average number of equity shares outstanding during the year. For the purpose of calculating diluted earnings per share, net profit after tax for the year and the weighted average number of shares outstanding during the year are adjusted for the effects of all dilutive potential equity shares. Dilutive potential equity shares are deemed to have been converted as of the beginning of the year, unless they have been issued at a later date.
n. Leases Lease payments for assets taken on operating lease are charged in the Statement of profit and loss on a straight-line basis over the
lease term.
o. Cash flow statement Cash flows are reported using the indirect method, whereby net profit/ (loss) before tax is adjusted for the effects of transactions of
a non-cash nature and any deferrals or accruals of past or future cash receipts or payments. The cash flow from regular revenue generating, investing and financing activities of the Company are segregated.
p. Provisions and contingent liabilities The Company creates a provision when there is a present obligation as a result of an obligating event that probably requires an
outflow of resources and a reliable estimate can be made of the amount for the obligation. A disclosure for a contingent liability is made when there is a possible obligation or a present obligation that may, but probably will not, require an outflow of resources. Where there is a possible obligation or a present obligation that the likelihood of outflow of resource is remote, no provision or disclosure is made.
Provisions for onerous contracts, i.e. contracts where the expected unavoidable costs of meeting the obligations under the contract exceed the economic benefits expected to be received under it, are recognised when it is probable that an outflow of resources embodying economic benefits will be required to settle a present obligation as a result of an obligating event based on a reliable estimate of such obligation.

AnnuAl RepoRt 2013-14 > 4140
NOTeS TO THe FINANCIAL STATeMeNT for the year ended 31 March 2014(All amounts in Indian rupees, except share data and where otherwise stated)
As at 31 March 2014
As at 31 March 2013
2.1 SHARE CAPITALAuthorised:Equity shares12,000,000 (previous year: 12,000,000) equity shares of Rs. 10 each 12,00,00,000 12,00,00,000
12,00,00,000 12,00,00,000Issued, subscribed and paid-up:Equity shares10,702,990 (previous year: 10,702,990) equity shares of Rs. 10 each fully paid up 10,70,29,900 10,70,29,900
10,70,29,900 10,70,29,900
The reconciliation of the number of equity shares outstanding at the beginning and the end of the reporting period
As at 31 March 2014 As at 31 March 2013 Particulars Number of shares Amount Number of shares AmountEquity sharesAt the commencement of the year 1,07,02,990 10,70,29,900 56,76,814 5,67,68,140 Issued during the year – – 50,26,176 5,02,61,760At the end of the year 1,07,02,990 10,70,29,900 1,07,02,990 10,70,29,900
The reconciliation of the number of 12% compulsorily convertible cumulative participating preference shares (‘CCCPPS’) outstanding is set out below:
As at 31 March 2014 As at 31 March 2013 Particulars Number of shares Amount Number of shares AmountPreference sharesAt the commencement of the year – – 50,00,000 5,00,00,000 Conversion during the year – – (50,00,000) (5,00,00,000)At the end of the year – – – –
Shares reserved for Issue under OptionsCompany has reserved 288,253 (previous year : 288,253) equity shares at preferential price for employee Stock Options (eSOP) and 303,425 (previous year : 303,425) equity shares for Milestone based Stock Options (MSOP) at nil price for Promoter Directors vide Share Subscription Agreement dated 24 May 2010.
Pursuant to the Shareholder’s Agreement dated 22 February 2013, the Promoter Directors has right to subscribe upto 1,730,122 (previous year : 1,730,122) equity shares under the MSOP pool, for no consideration upon the conversion of Compulsorily Convertible Debentures and upon fulfillment of certain milestones as mentioned in the above said agreement over a period of 3 years commencing from 1 April 2013.
The Company had issued 5,000,000 12% compulsory convertible cumulative participating preference shares of Rs. 10 each to RIF-
North 2 during the year 2010-11. These shares are converted into equity shares in the financial year 2012-13 as per the terms and
conditions of the agreement entered into with them.
The rights, preferences and restrictions attaching to each class of shares including restrictions on the distribution of dividends
and the repayment of capital:
The Company has single class equity shares having a par value of Rs. 10 per equity share. Accordingly, all equity shares rank equally
with regard to dividends and share in the company’s residual assets. The equity shares are entitled to receive dividend as declared
from time to time subject to payment of dividend to preference shareholders. In the event of liquidation of the Company, the holders
of equity shares will be entitled to receive the residual assets of the Company, remaining after distribution of all preferential amounts in
proportion to the number of equity shares held.

FuSION MICROFINANCe PRIvATe LIMITeD
NOTeS TO THe FINANCIAL STATeMeNT for the year ended 31 March 2014(All amounts in Indian rupees, except share data and where otherwise stated)
Particulars of equity shareholder holding more than 5% equity shares is set below:As at 31 March 2014 As at 31 March 2013
Name of the shareholder Number of shares % of Holding Number of shares % of Holding RIF-NORTH 2 - Mauritius 52,37,174 48.93 52,37,174 48.93 NMI FRONTIeR FuND, LLP - Norway 20,26,316 18.93 20,26,316 18.93 Devesh Sachdev - Director & CeO 8,42,500 7.87 8,30,000 7.75
81,05,990 75.73 80,93,490 75.61
2.1 SHARE CAPITAL (continued)
As at 31 March 2014
As at 31 March 2013
2.2 RESERVES AND SURPLUS Securities premium account At the commencement of the year 10,83,79,795 2,11,41,555 Add: Received during the year – 8,72,38,240 Closing balance (A) 10,83,79,795 10,83,79,795 Statutory reserve (created under Section 45-1C of RBI Act, 1934)At the commencement of the year 8,55,388 3,02,622 Add: Amount transferred 60,17,267 5,52,766 Less: Amount utilised – –Closing balance (B) 68,72,655 8,55,388 Surplus (Profit and Loss)At the commencement of the year (53,61,838) (45,72,900)Add: Profit for the year 3,00,86,334 27,63,828 Less : Amount transferred to statutory reserve (60,17,267) (5,52,766)Less : Proposed dividend on 12% compulsorily convertible cumulative participating preference shares
– (25,81,256)
Less: Tax on proposed dividend – (4,18,744)Closing balance (C) 1,87,07,229 (53,61,838)Total reserves and surplus (A+B+C) 13,39,59,679 10,38,73,345

AnnuAl RepoRt 2013-14 > 4342
NOTeS TO THe FINANCIAL STATeMeNT for the year ended 31 March 2014(All amounts in Indian rupees, except share data and where otherwise stated)
As at 31 March 2014
As at 31 March 2013
2.3 LONG-TERM BORROWINGS Term loans* Secured from banks 17,55,95,065 4,82,59,606 from others 14,49,15,800 4,73,69,409 unsecured from financial institution 1,00,00,000 Vehicle loan*Secured from banks 33,68,728 – from others 2,25,564 4,11,294
33,41,05,157 9,60,40,309 Debenturesunsecured(previous year: 6,500,000) Compulsorily convertible debentures of Rs. 25 each fully paid** – 16,25,00,000
33,41,05,157 25,85,40,309
* refer note 2.31 & 2.32
** These debentures shall be converted into fully paid up equity shares by 30 September 2014 at a conversion price ranging from a minimum of Rs. 28.50 per equity share or such higher value of equity share taking into consideration the audited profit after tax for the year ended 31 March 2014. However, as per the terms of the agreement the conversion price shall not be more than Rs. 38 per equity share.
As at 31 March 2014
As at 31 March 2013
2.4 LONG TERM PROVISIONS Contingent provisions against standard own loan portfolio (refer note 2.23) 24,87,209 17,09,425 Provision for employee benefits- Gratuity (refer note 2.26) 14,18,299 6,49,861 - Compensated absences 11,22,376 –
50,27,884 23,59,286
As at 31 March 2014
As at 31 March 2013
2.5 OTHER LONG TERM LIABILITIES unamortised income on securitisation 92,73,064 9,80,004
92,73,064 9,80,004

FuSION MICROFINANCe PRIvATe LIMITeD
NOTeS TO THe FINANCIAL STATeMeNT for the year ended 31 March 2014(All amounts in Indian rupees, except share data and where otherwise stated)
As at 31 March 2014
As at 31 March 2013
2.6 OTHER CURRENT LIABILITIES Current maturities of long term debt: - Banks and others* 60,60,66,355 29,20,46,328 - Compulsorily convertible debentures ** 16,25,00,000 –6,500,000 Compulsorily convertible debentures of Rs. 25 each fully paidPayable towards securitised portfolio 3,84,91,021 1,77,55,910 unutilised grant – 3,97,135 Interest accrued but not due on borrowings 12,96,980 14,32,106 Interest accrued and due on borrowings 4,384 11,99,814 Statutory liabilities 24,62,265 12,86,098 Salaries and bonus payable 63,66,258 24,39,447 expenses payable 73,39,567 9,21,305 unamortised income on securitisation 2,19,24,460 80,83,639 Other payable 40,68,253 9,25,791
85,05,19,543 32,64,87,573
* refer note 2.31 & 2.32
** These debentures shall be converted into fully paid up equity shares by 30 September 2014 at a conversion price ranging from a minimum of Rs. 28.50 per equity share or such higher value of equity share taking into consideration the audited profit after tax for the year ended 31 March 2014. However, as per the terms of the agreement the conversion price shall not be more than Rs. 38 per equity share.
As at 31 March 2014
As at 31 March 2013
2.7 SHORT TERM PROVISIONS Contingent provisions against standard own loan portfolio (refer note 2.23) 77,68,371 3,59,273 Contingent provisions against standard securitised loan portfolio* – 7,66,036 Provision on non performing loan portfolio (refer note 2.23) 20,050 1,31,253 Proposed preference dividend – 25,81,256 Provision for tax on proposed preference dividend – 4,18,744 Provision for tax [Net of advance tax : Rs. 17,766,509 (Previous year : Rs. Nil)] 4,91,400 –Provision for employee benefits
- Gratuity (refer note 2.26) 3,673 1,967 - Compensated absences 76,014 3,33,714
83,59,508 45,92,243
* During the year the company has discontinued provisioning on true sale - securtised portfolio

AnnuAl RepoRt 2013-14 > 4544
NOTeS TO THe FINANCIAL STATeMeNT for the year ended 31 March 2014(All amounts in Indian rupees, except share data and where otherwise stated)
As at 31 March 2014
As at 31 March 2013
2.9 LOAN PORTFOLIO Unsecured Microfinance loan portfolio (net of true sale-securtised loan portfolio Rs. 347,523,242 (previous year Rs. 141,954,500)
1,00,56,88,453 37,85,72,882
Securedvehicle loans (net of securtised loan portfolio Rs. 2,773,420 (previous year Rs. 11,252,649)
2,18,74,529 3,57,81,269
1,02,75,62,982 41,43,54,151Non current portion of loan portfolio 24,87,20,909 7,19,61,295Current portion of loan portfolio 77,88,42,073 34,23,92,856
1,02,75,62,982 41,43,54,151Out of the aboveLoan portfolio (considered good) 1,02,55,57,944 41,37,39,547 Loan portfolio (considered doubtful) 20,05,038 6,14,604
1,02,75,62,982 41,43,54,151
As at 31 March 2014
As at 31 March 2013
2.10 LONG-TERM LOANS AND ADVANCES unsecured, considered good Advances tax recoverable [Net of provision for tax Rs. Nil (Previous year : Rs. 696,200)] – 10,65,671unamortised processing fees 16,09,653 2,30,018 Capital advances – 15,00,000
16,09,653 27,95,689
Description
Gross block Depreciation and amortisation Net block
As at
1 April
2013
Additions Disposals As at
31 Mar
2014
As at
1 April
2013
For the
year
On
Disposals
As at
31 Mar
2014
As at
31 Mar
2014
As at
31 Mar
2013
Tangible fixed assets
Owned
Furniture and fixtures 1,137,910 367,230 – 1,505,140 603,336 451,587 – 1,054,923 450,217 534,574
electrical fittings 539,316 684,932 – 1,224,248 198,323 219,396 – 417,628 806,620 341,084
Office equipment 218,068 590,316 – 808,384 154,713 155,454 – 310,167 498,217 63,355
vehicles 1,043,888 5,743,289 – 6,787,177 470,555 763,580 – 1,234,135 5,553,042 573,333
Computers 2,327,031 1,503,963 – 3,830,994 1,336,505 807,769 – 2,144,274 1,686,720 990,526
Leasehold improvements – 4,395,958 – 4,395,958 – 1,119,754 – 1,119,754 3,276,204 –
Total 5,266,213 13,285,688 – 18,551,901 2,763,341 3,517,540 – 6,280,881 12,271,020 2,502,872
Previous year 4,111,874 1,154,339 5,266,213 1,871,840 891,501 2,763,341 2,502,872
Intangible fixed assets
Owned
Computer software 1,119,806 421,270 – 1,541,076 590,601 279,398 – 869,999 671,077 529,205
Technical knowhow 2,900,000 – – 2,900,000 2,900,000 – – 2,900,000 – –
Total 4,019,806 421,270 – 4,441,076 3,490,601 279,398 – 3,769,999 671,077 529,205
Previous year 3,631,903 387,903 4,019,806 2,323,886 1,166,715 3,490,601 529,205
2.8 FIXED ASSETS

FuSION MICROFINANCe PRIvATe LIMITeD
NOTeS TO THe FINANCIAL STATeMeNT for the year ended 31 March 2014(All amounts in Indian rupees, except share data and where otherwise stated)
As at 31 March 2014
As at 31 March 2013
2.11 OTHER NON CURRENT ASSETS (unsecured, considered good) Long term deposits with maturity of more than 12 months - with banks* 3,82,19,636 2,05,81,449 - with financial institution as security deposit towards borrowings** 2,94,74,817 1,66,75,034 - with financial institution as security deposit towards securitised portfolio** – 29,87,375 Interest accrued but not due
- fixed deposit with banks 9,92,829 4,72,580 - security deposits 3,43,951 6,49,404
6,90,31,233 4,13,65,842
*Includes deposits of Rs. 31,387,144 (previous year : Rs. 9,000,000) maintained as cash collateral against term loans availed and Rs. 6,832,492 (previous year : Rs. 11,581,449) maintained as cash collateral against managed portfolio.
**Represents deposits maintained as cash collateral against term loan availed and towards securitised portfolio.
As at 31 March 2014
As at 31 March 2013
2.13 CASH AND BANK BALANCES Cash and cash equivalents Cash in hand 11,07,194 5,61,984 Cheques in hand 4,42,000 – (A) 15,49,194 5,61,984 Balances with banks- in current accounts 16,51,23,482 1,71,38,427 - in deposit accounts (with less than 3 months maturity)* – –- in deposit accounts with less than 3 months maturity 2,12,25,000 5,45,50,000 (B) 18,63,48,482 7,16,88,427 Other bank balances- Bank deposits with maturity more than 3 months but less than 12 months* – –- Deposits with banks with maturity more than 3 months but less than 12 months* 6,54,63,181 1,61,66,740 (C) 6,54,63,181 1,61,66,740 (A)+(B)+(C) 25,33,60,857 8,84,17,151
*Includes deposits of Rs. 1,090,732 (previous year : Rs. 1,000,000) maintained as cash collateral against term loans availed and Rs. 53,820,323 (previous year : Rs. 15,166,740) maintained as cash collateral against managed portfolio.
As at 31 March 2014
As at 31 March 2013
2.12 CURRENT INVESTMENTS Investments in mutual funds - Quoted (valued at lower of cost and fair value) Nil units (previous year: 182,730 units) of Axis Treasury Advantage Fund – 20,79,08,449 7,225 units (previous year: Nil) of Reliance Liquid Fund 2,25,98,488 –225 units (previous year: Nil units) of Baroda Pioneer Liquid Fund 3,30,288
2,29,28,776 20,79,08,449 Market value of quoted investments 2,29,28,776 20,79,08,449 Aggregate amount of quoted investments 2,29,28,776 20,79,08,449

AnnuAl RepoRt 2013-14 > 4746
NOTeS TO THe FINANCIAL STATeMeNT for the year ended 31 March 2014(All amounts in Indian rupees, except share data and where otherwise stated)
As at 31 March 2014
As at 31 March 2013
2.14 SHORT TERM LOANS AND ADVANCES (unsecured, considered good) Advances given to related parties (refer note 2.31) – 9,71,088 Advances recoverable in cash or kind or for value to be received 38,48,524 15,38,158 Rent deposits 8,75,250 9,65,750 Tax deducted at source – –unamortised processing fees 40,36,206 14,76,960 Prepaid expenses 9,96,130 7,89,252 Service tax receivable 4,68,338 92,356 Grant receivable 9,23,717 –
1,11,48,165 58,33,564
For the year ended 31 March 2014
For the year ended 31 March 2013
2.16 REVENUE FROM OPERATIONS Interest income on loan portfolio 19,35,67,622 8,66,75,171 Income from asset securitisation 2,08,49,000 35,36,973 Processing fee on loan portfolio 1,68,72,072 1,00,78,982
23,12,88,694 10,02,91,126 Other operating incomeInterest on term deposits with banks 97,23,626 56,57,041 Profit on sale of mutual funds 75,43,223 4,53,963 Dividend income on mutual funds 3,08,337 15,84,279
1,75,75,186 76,95,283 24,88,63,880 10,79,86,409
For the year ended 31 March 2014
For the year ended 31 March 2013
2.17 OTHER INCOME Interest income on loan portfolio 7,52,499 5,71,198
7,52,499 5,71,198
As at 31 March 2014
As at 31 March 2013
2.15 OTHER CURRENT ASSETS (unsecured, considered good) Security deposits towards borrowings* 2,89,20,945 2,13,64,965 Security deposits towards securitised portfolio* 10,66,040 1,11,83,523 Interest accrued but not due - on loan portfolio 1,00,88,147 26,52,857 - on fixed deposits with banks 31,72,574 6,13,011 - on security deposits 19,39,689 31,87,453
4,51,87,395 3,90,01,809
*Represents deposits maintained as cash collateral against term loans availed and towards securitised portfolio.
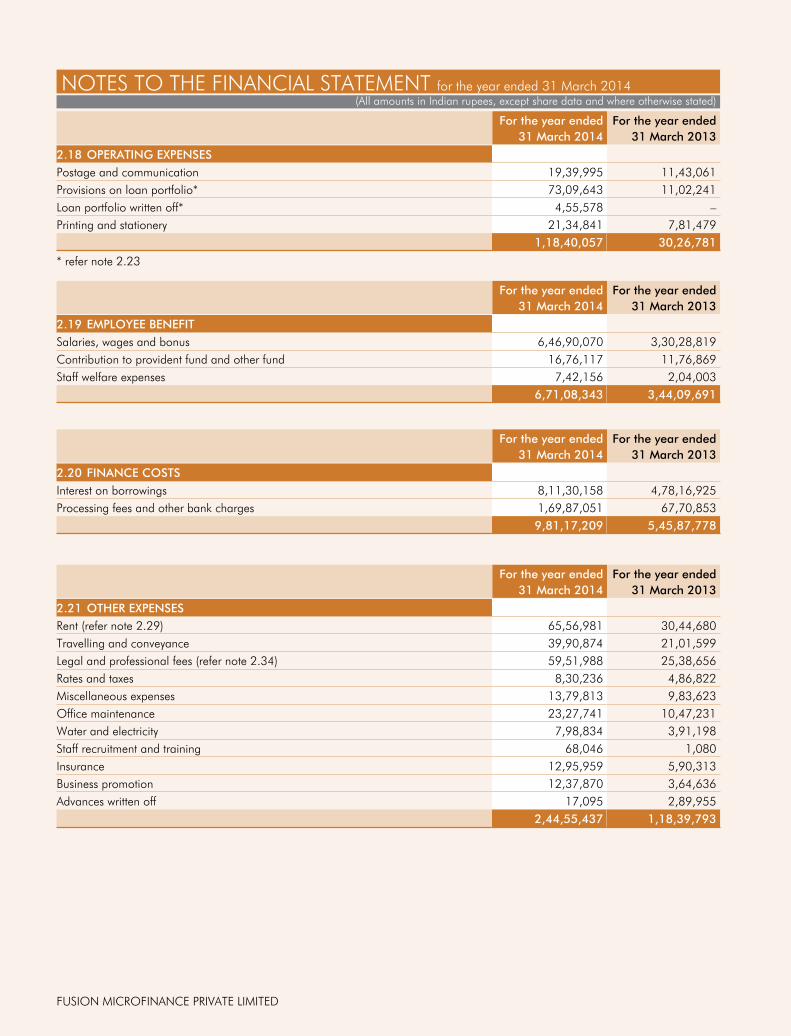
FuSION MICROFINANCe PRIvATe LIMITeD
NOTeS TO THe FINANCIAL STATeMeNT for the year ended 31 March 2014(All amounts in Indian rupees, except share data and where otherwise stated)
For the year ended 31 March 2014
For the year ended 31 March 2013
2.18 OPERATING EXPENSES Postage and communication 19,39,995 11,43,061 Provisions on loan portfolio* 73,09,643 11,02,241 Loan portfolio written off* 4,55,578 –Printing and stationery 21,34,841 7,81,479
1,18,40,057 30,26,781
* refer note 2.23
For the year ended 31 March 2014
For the year ended 31 March 2013
2.19 EMPLOYEE BENEFIT Salaries, wages and bonus 6,46,90,070 3,30,28,819 Contribution to provident fund and other fund 16,76,117 11,76,869 Staff welfare expenses 7,42,156 2,04,003
6,71,08,343 3,44,09,691
For the year ended 31 March 2014
For the year ended 31 March 2013
2.20 FINANCE COSTS Interest on borrowings 8,11,30,158 4,78,16,925 Processing fees and other bank charges 1,69,87,051 67,70,853
9,81,17,209 5,45,87,778
For the year ended 31 March 2014
For the year ended 31 March 2013
2.21 OTHER EXPENSES Rent (refer note 2.29) 65,56,981 30,44,680 Travelling and conveyance 39,90,874 21,01,599 Legal and professional fees (refer note 2.34) 59,51,988 25,38,656 Rates and taxes 8,30,236 4,86,822 Miscellaneous expenses 13,79,813 9,83,623 Office maintenance 23,27,741 10,47,231 Water and electricity 7,98,834 3,91,198 Staff recruitment and training 68,046 1,080 Insurance 12,95,959 5,90,313 Business promotion 12,37,870 3,64,636 Advances written off 17,095 2,89,955
2,44,55,437 1,18,39,793
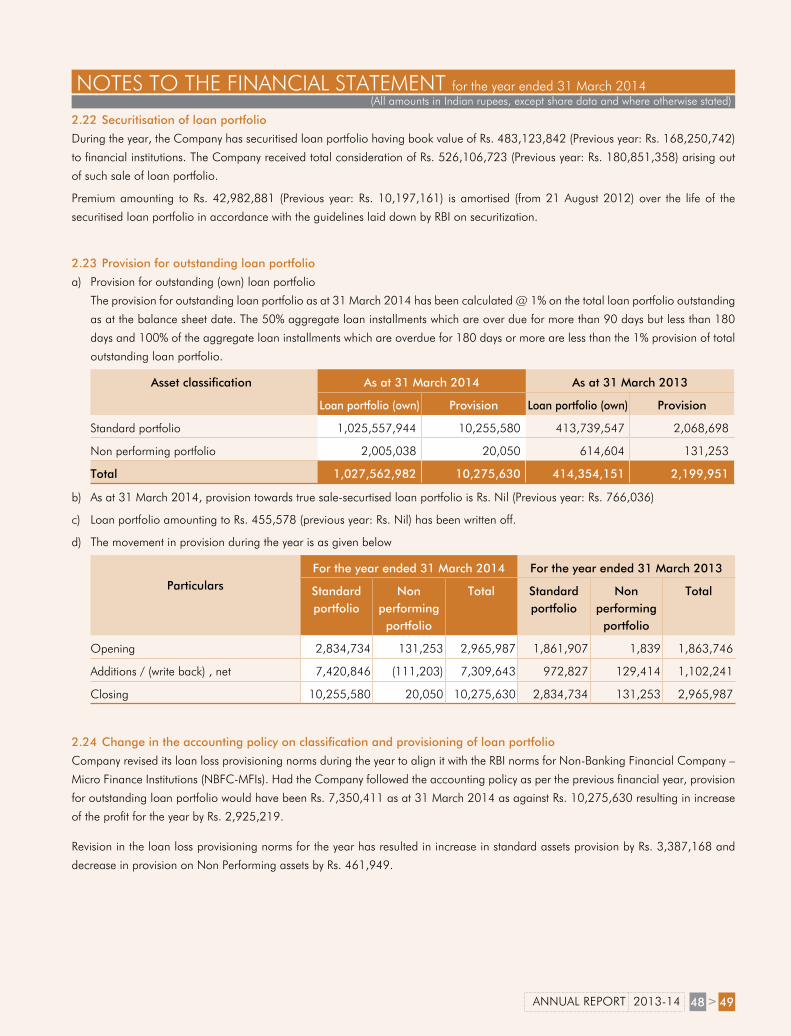
AnnuAl RepoRt 2013-14 > 4948
NOTeS TO THe FINANCIAL STATeMeNT for the year ended 31 March 2014(All amounts in Indian rupees, except share data and where otherwise stated)
2.22 Securitisation of loan portfolio
During the year, the Company has securitised loan portfolio having book value of Rs. 483,123,842 (Previous year: Rs. 168,250,742)
to financial institutions. The Company received total consideration of Rs. 526,106,723 (Previous year: Rs. 180,851,358) arising out
of such sale of loan portfolio.
Premium amounting to Rs. 42,982,881 (Previous year: Rs. 10,197,161) is amortised (from 21 August 2012) over the life of the
securitised loan portfolio in accordance with the guidelines laid down by RBI on securitization.
2.24 Change in the accounting policy on classification and provisioning of loan portfolio
Company revised its loan loss provisioning norms during the year to align it with the RBI norms for Non-Banking Financial Company –
Micro Finance Institutions (NBFC-MFIs). Had the Company followed the accounting policy as per the previous financial year, provision
for outstanding loan portfolio would have been Rs. 7,350,411 as at 31 March 2014 as against Rs. 10,275,630 resulting in increase
of the profit for the year by Rs. 2,925,219.
Revision in the loan loss provisioning norms for the year has resulted in increase in standard assets provision by Rs. 3,387,168 and
decrease in provision on Non Performing assets by Rs. 461,949.
2.23 Provision for outstanding loan portfolio
a) Provision for outstanding (own) loan portfolio
The provision for outstanding loan portfolio as at 31 March 2014 has been calculated @ 1% on the total loan portfolio outstanding
as at the balance sheet date. The 50% aggregate loan installments which are over due for more than 90 days but less than 180
days and 100% of the aggregate loan installments which are overdue for 180 days or more are less than the 1% provision of total
outstanding loan portfolio.
Asset classification As at 31 March 2014 As at 31 March 2013
Loan portfolio (own) Provision Loan portfolio (own) Provision
Standard portfolio 1,025,557,944 10,255,580 413,739,547 2,068,698
Non performing portfolio 2,005,038 20,050 614,604 131,253
Total 1,027,562,982 10,275,630 414,354,151 2,199,951
b) As at 31 March 2014, provision towards true sale-securtised loan portfolio is Rs. Nil (Previous year: Rs. 766,036)
c) Loan portfolio amounting to Rs. 455,578 (previous year: Rs. Nil) has been written off.
d) The movement in provision during the year is as given below
Particulars
For the year ended 31 March 2014 For the year ended 31 March 2013
Standard portfolio
Non performing
portfolio
Total Standard portfolio
Non performing
portfolio
Total
opening 2,834,734 131,253 2,965,987 1,861,907 1,839 1,863,746
Additions / (write back) , net 7,420,846 (111,203) 7,309,643 972,827 129,414 1,102,241
Closing 10,255,580 20,050 10,275,630 2,834,734 131,253 2,965,987

FuSION MICROFINANCe PRIvATe LIMITeD
2.25 Contingent Liability1. Guarantees given on securitised portfolio fully secured by security deposits given as collateral:
# Guarantees given as a % total cash flow.* Guarantees given as a % assigned portfolio.
S. No
Bank/Financial Institution 31 March 2014 31 March 2013Purchase
ConsiderationGuarantee FLDG % Purchase
ConsiderationGuarantee FLDG %
1 IFMR Capital Finance Private Limited – II – – – 25,534,130 3,422,000* 14.252 IFMR Capital Finance Private Limited – III – – – 48,639,679 6,126,451* 13.753 MAS Financial Services Limited –I – – – 39,347,007 5,576,675# 12.504 MAS Financial Services Limited – II – – – 22,312,434 3,124,204# 12.505 MAS Financial Services Limited – III – – – 17,411,138 2,482,644# 12.506 MAS Financial Services Limited – Iv 5,180,902 178,716# 15.00 5,180,902 547,080# 15.007 MAS Financial Services Limited – vI 5,539,578 254,178# 15.00 5,539,578 759,677# 15.008 MAS Financial Services Limited – vII 10,747,587 633,146# 15.00 10,747,587 1,680,618# 15.009 IFMR Capital Finance Private Limited – Iv – – – 20,286,607 2,200,000# 10.0010 IFMR Capital Finance Private Limited – v – – – 15,795,766 1,926,449* 13.2511 IFMR Capital Finance Private Limited – vI 36,553,449 3,418,289# 8.70 36,553,449 3,418,289# 8.7012 IFMR Capital Finance Private Limited – vII 39,425,113 4,159,448* 11.25 39,425,113 4,159,448* 11.2514 IFMR Capital Finance Private Limited – IX 39,472,066 4,100,000# 9.60 39,472,066 4,100,000# 9.6015 IFMR Capital Finance Private Limited – X 67,070,714 6,851,952* 11.00 – – –16 IFMR Capital Finance Private Limited – XI 88,994,077 8,600,000# 8.91 – – –17 IFMR Capital Finance Private Limited – XII 36,184,718 3,500,000# 8.93 – – –18 IFMR Capital Finance Private Limited – XIII 87,462,763 8,955,638* 11.25 – – –19 IFMR Capital Finance Private Limited – XIv 50,185,610 5,299,986* 11.50 – – –20 IFMR Capital Finance Private Limited – Xv 29,457,894 3,070,239* 11.50 – – –21 IFMR Capital Finance Private Limited – XvI 81,171,549 4,469,219* 6.00 – – –22 IFMR Capital Finance Private Limited – XvII 35,595,121 2,542,666* 7.70 – – –23 IFMR Capital Finance Private Limited – XvIII 49,984,277 4,289,826* 9.25 – – –
Total 676,056,610 61,718,855 339,276,648 40,919,087
NOTeS TO THe FINANCIAL STATeMeNT for the year ended 31 March 2014(All amounts in Indian rupees, except share data and where otherwise stated)
2.26 Employee Benefitsa) Defined benefit plan – Gratuity (Unfunded) The following tables set out the status of the gratuity plan as required under AS 15 (Revised)
Movement in present values of defined benefit obligations
Particulars As at 31 March 2014
As at 31 March 2013
Present value of obligation as at the beginning of the year 6,51,828 327,875Current service cost 7,06,169 289,963Interest cost 58,664 26,975Acturial (gain)/loss recognized during the year 5,311 7,015Net (liability) 14,21,972 651,828
Expense recognised in Statement of Profit and LossParticulars For the year ended
31 March 2014For the year ended
31 March 2013
Current service cost 7,06,169 289,963Interest cost 58,664 26,975Net actuarial (gain)/ loss recognized in the year 5,311 7,015Amount, included in employee benefit expenses 7,70,144 323,953

AnnuAl RepoRt 2013-14 > 5150
NOTeS TO THe FINANCIAL STATeMeNT for the year ended 31 March 2014(All amounts in Indian rupees, except share data and where otherwise stated)
2.27 Segment reportinga) Business segment The company operates in a single reportable segment i.e. lending to member’s of JLGs who have similar risks and returns.
Accordingly, there is no reportable segment to be disclosed as required by Accounting Standard 17 ‘Segment Reporting’.
b) Geographical segment During the year, the Company has engaged in its business primarily within India. The conditions prevailing in India being uniform,
no separate geographical disclosure is considered necessary.
Amount recognised in the balance sheet
Particulars As at 31
March 2014
As at 31
March 2013
As at 31
March 2012
As at 31
March 2011
As at 31
March 2010
Projected benefit obligation at the end of
the year
14,21,972 651,828 327,875 129,940 22,102
Fair value of plan assets at end of the year – – – – –
Net liability/(asset) 14,21,972 651,828 327,875 129,940 22,102
2.26 Employee Benefits (continued)
b) Defined contribution plan
Amount recognised in Statement of Profit and Loss towards For the year ended 31 March 2014
For the year ended 31 March 2013
i) Provident fund 873,243 782,811ii) employee state insurance 802,874 394,058Total 1,676,117 1,176,869
Principal actuarial assumptions For the year ended 31 March 2014
For the year ended 31 March 2013
i) Discount rate (p.a) 9.00% 8.25%ii) Salary escalation rate (p.a) 8.00% 6.00%
Discount rate: - The discount rate is based on the prevailing market yield of Indian Government securities as at the balance sheet date for the estimated term of obligations.
Salary escalation rate: - The estimate for the future salary increments considered taking into account the inflation, seniority, promotional and other relevant factors.
2.28 Earnings Per Share (EPS)
Particulars For the year ended 31 March 2014
For the year ended 31 March 2013
Net profit/ (loss) for the year 30,086,334 2,763,828Less: Dividend payable on compulsorily convertible cumulative participating preference shares (including tax)
– 3,000,000
Net profit/ (loss) for the year after preference dividend 30,086,334 (236,172)Number of shares at the beginning of the year 10,702,990 5,676,814Add: weighted average number of equity shares issued during the year – 344,259Weighted average number of equity shares outstanding during the year 10,702,990 6,021,073Add : Weighted number of shares (including potential equity shares) considered for calculation of diluted ePS
4,579,741 282,898
Weighted average number of equity shares on conversion of Compulsorily Convertible Debentures and Milestone based stock options #
15,282,731 6,313,971
Par value of each share 10 10Basic earnings per share 2.81 (0.04)Diluted earnings per share 1.97 (0.04)#Diluted earnings per share was not completed as at 31 March 2013 as the same was anti dilutive.

FuSION MICROFINANCe PRIvATe LIMITeD
NOTeS TO THe FINANCIAL STATeMeNT for the year ended 31 March 2014(All amounts in Indian rupees, except share data and where otherwise stated)
2.29 Operating LeasesLease payments made under cancellable operating lease amounting to Rs. 6,556,981 (previous year Rs. 3,044,680) disclosed as rent and the same have been recognized as an expense in the Statement of Profit and Loss.
2.31 Related Party Transactions
Relationship Name of the party
entities exercising significant influence over the Company
RIF-NORTH 2, Mauritius
NMI FRONTIeR FuND, LLP, Norway
Key Managerial Personnel (KMP) Devesh Sachdev - Director and Chief executive Officer
Ashish Tewari - Director and Chief Operating Officer
Relatives of KMP Aruna Tewari, Mother of KMP
enterprises under the Control of KMP Fusion Saksham Development Foundation – Trust
Samarth Financial Consultancy Private Limited
Particulars 31 March 2014 31 March 2013
1. Number of SPvs sponsored by the Company for securitisation / bilateral transactions
9 5
2. Total amount of securitised assets as per books of the SPvs/assignees sponsored by the Company
483,123,842 168,250,742
3. Total amount of exposures retained by the Company to comply with MRR as on the date of balance sheet
– –
a) Off-balance sheet exposures
* First loss 47,579,526 19,640,023
* Others – –
b) On-balance sheet exposures
* First loss – –
* Others – –
4. Amount of exposures to securitisation transactions other than MRR
a) Off-balance sheet exposures
i) exposure to own securitizations
* First loss – –
* loss – –
ii) exposure to third party securitizations
* First loss – –
* Others – –
b) On-balance sheet exposures
i) exposure to own securitizations
* First loss – –
* Others – –
ii) exposure to third party securitizations
* First loss – –
* Others – –
2.30As required in terms of circular RBI//2012-13/170 DNBS. PD. No. 301/3.10.01/2012-13 dated 21 August 2012 for the securitisation transactions entered on or after 21 August 2012:

AnnuAl RepoRt 2013-14 > 5352
NOTeS TO THe FINANCIAL STATeMeNT for the year ended 31 March 2014(All amounts in Indian rupees, except share data and where otherwise stated)
The following is a summary of related party transactions:2.31 Related Party Transactions (continued)
Name of the related party Nature of transactionFor the year ended
31 March 2014For the year ended
31 March 2013Ms. Aruna Tewari unsecured loan repaid – 1,100,000Mr Devesh Sachdev loan given – 400,000
Loan repaid 181,727 –Interest earned 47,255 34,472Loan taken and repaid 3,300,000 –Interest paid 80,323 –Managerial remuneration 4,811,944 3,260,604
Mr. Ashish Tewari loan given – 500,000Loan repaid 284,757 –Interest earned 48,141 36,616Managerial remuneration 4,811,944 3,260,604
RIF-NORTH 2 – Mauritius Dividend proposed – 3,000,000Issue of debentures – 107,250,000Allotment of equity shares (includes share premium) – 29,750,000
NMI FRONTIeR FuND, LLP -Norway
Issue of debentures – 55,250,000Allotment of equity shares (includes share premium) – 57,750,000
The company has the following amounts receivable/(payable) from/(to) related parties:
Name of the related party Nature of transactionReceivable /
(Payable) as at 31 March 2014
Receivable/ (Payable) as at 31
March 2013Mr. Devesh Sachdev Loan recoverable – 434,471
Bonus payable (1,000,000) (345,000)Mr. Ashish Tewari Loan recoverable – 536,616
Bonus payable (1,000,000) (345,000)RIF-NORTH 2 – Mauritius Dividend payable – (3,000,000)
Debentures outstanding (107,250,000) (107,250,000)NMI FRONTIeR FuND, LLP -Norway Debentures outstanding (55,250,000) (55,250,000)
2.32 Terms Of The Borrowings
Nature of Facility
Amount outstanding as at 31 March 2014
Amount outstanding as at 31 March 2013
Interest rate
First date of repayment
Terms of repayment
Current Non Current Current Non CurrentA. Secured term loan (‘TL’) from banks *
tl 1 – – 1,111,115 – BR+4.25% 31-Jul-11 Monthly/27
tl 2 20,370,370 29,629,630 – – BR+ 2.40% 31-May-14 Monthly/30
tl 3 3,333,287 – 8,000,004 3,333,341 BR+ 4.00% 31-Jul-12 Monthly/30
tl 4 5,997,670 – 8,000,004 5,997,425 BR+ 4.00% 31-Jul-12 Monthly/30
TL 5 9,946,128 7,483,000 7,500,000 17,500,000 BR+ 3.00% 31-Jul-13 Monthly/30
TL 6 7,142,428 14,286,143 28,571,160 21,428,840 BR+ 3.00% 22-Jun-13 Quarterly/8
tl 7 28,571,428 8,928,572 – – BR+ 3.60% 31-Dec-13 Quarterly/8
TL 8 42,857,142 57,142,858 – – BR+ 2.45% 30-Sep-14 Quarterly/7
TL 9 37,500,000 28,125,000 – – 12.25% 24-Jan-14 Quarterly/8
tl 10 28,571,568 14,285,576 – – BR+ 3.00% 27-Dec-13 Monthly/21
tl 11 14,285,714 15,714,286 BR+3.50% 30-Jun-14 Monthly/21
Total (A) 198,575,735 175,595,065 53,182,283 48,259,606

FuSION MICROFINANCe PRIvATe LIMITeD
2.32 Terms Of The Borrowings (continued)
Nature of Facility
Amount outstanding as at 31 March 2014
Amount outstanding as at 31 March 2013
Interest rate
First date of repayment
Terms of repayment
Current Non Current Current Non CurrentB. Secured term loan from others*tl 12 – – 12,000,000 – 15.50% 12-nov-11 Half yearly/5tl 13 16,666,668 4,166,662 16,666,668 20,833,331 15.00% 10-Jun-12 Quarterly/12tl 14 18,750,000 37,500,000 – – 15.00% 13-Dec-13 Quarterly/12TL 15 1,878,611 – 20,494,686 1,854,655 15.50% 1-nov-12 Monthly/18TL 16 26,442,218 3,131,019 15.50% 1-Aug-13 Monthly/18tl 17 33,292,207 9,703,809 15.50% 1-Jan-14 Monthly/18TL 18 – – 2,288,884 – 15.50% 26-Jan-12 Monthly/18TL 19 – – 606,493 – 15.50% 21-Dec-11 Monthly/18tl 20 – – 8,333,329 – 16.00% 13-Feb-12 Monthly/18tl 21 – – 6,666,667 – 16.00% 19-Mar-12 Monthly/18tl 22 – – 3,333,333 – 29-Mar-12 Monthly/18tl 23 1,333,329 – 2,000,000 1,333,314 BR+0.50% 30-May-12 Monthly/30tl 24 – – 15,000,000 – BR+1.00% 27-Jun-12 Monthly/18TL 25 – – 15,277,778 – BR+1.00% 25-Aug-12 Monthly/18TL 26 1,833,329 – 2,000,000 1,833,333 BR+0.50% 25-Aug-12 Monthly/30tl 27 – – 10,000,000 – BR+1.00% 21-Sep-12 Monthly/18TL 28 2,000,000 – 2,000,000 2,000,000 BR+0.50% 21-Sep-12 Monthly/30TL 29 1,388,887 – 16,666,667 1,388,889 BR+1.00% 25-Oct-12 Monthly/18tl 30 2,777,776 – 16,666,667 2,777,778 BR+1.00% 26-Nov-12 Monthly/18tl 31 2,500,000 – 10,000,000 2,500,000 BR+1.00% 15-Dec-12 Monthly/18tl 32 2,811,745 – 6,666,667 2,777,778 BR+1.00% 31-Jan-13 Monthly/18tl 33 2,777,772 – 6,666,667 2,777,778 BR+1.00% 20-Feb-13 Monthly/18tl 34 30,555,554 – – – BR+1.00% 26-Aug-13 Monthly/18TL 35 33,333,332 – – – BR+1.25% 17-Sep-13 Monthly/18TL 36 20,000,335 3,332,996 – – BR+1.25% 29-Nov-13 Monthly/18tl 37 13,332,999 3,333,668 – – BR+1.25% 26-Dec-13 Monthly/18TL 38 30,555,558 19,444,442 – – BR+1.25% 22-Jan-14 Monthly/18TL 39 16,666,670 13,333,330 – – BR+1.25% 19-Feb-14 Monthly/18tl 40 9,999,999 10,000,000 – – BR+1.25% 26-Mar-14 Monthly/18tl 41 – – 3,056,935 – 16.00% 30-Sep-12 Monthly/18tl 42 – – 5,749,791 – 15.00% 30-Sep-12 Monthly/18tl 43 – – 7,172,491 – 15.32% 20-Apr-12 Monthly/18tl 44 – – 5,284,932 – 15.25% 2-Jul-12 Monthly/18TL 45 – – 10,568,751 – 15.25% 13-Jul-12 Monthly/18TL 46 – – 6,911,749 – 15.25% 25-Oct-12 Monthly/18tl 47 1,225,445 – 6,739,337 1,225,445 15.25% 26-Dec-12 Monthly/18TL 48 1,227,515 – 6,737,277 1,227,515 15.25% 31-Dec-12 Monthly/18TL 49 4,839,593 – 13,141,828 4,839,593 15.25% 28-Feb-13 Monthly/18TL 50 34,568,733 – – – 15.35% 21-Sep-13 Monthly/18TL 51 20,471,276 1,867,064 – – 15.35% 25-Nov-13 Monthly/18TL 52 11,651,991 3,189,194 – – 15.10% 31-Mar-14 Monthly/18TL 53 64,086,384 35,913,616 – – 15.00% 22-Apr-14 Monthly/18Total (B) 406,967,926 144,915,800 238,697,597 47,369,409
NOTeS TO THe FINANCIAL STATeMeNT for the year ended 31 March 2014(All amounts in Indian rupees, except share data and where otherwise stated)

AnnuAl RepoRt 2013-14 > 5554
2.32 Terms Of The Borrowings (continued)
Nature of Facility
Amount outstanding as at 31 March 2014
Amount outstanding as at 31 March 2013
Interest rate
First date of repayment
Terms of repayment
Current Non Current Current Non Current
C. Secured vehicle loan from bank#
vL 2 336,964 3,368,728 – – 10.25% 31-oct-13 Monthly/60
Total (C) 336,964 3,368,728 – –
D. Secured vehicle loan from others#
vL 1 185,730 225,564 166,448 411,294 11.00% 15-May-11 Monthly/60
Total (D) 185,730 225,564 166,448 411,294
E. Unsecured term loan (‘USL’) from financial institutions
uSl 1 10,000,000 – – 4.00% 10-Oct-15 Monthly/6
Total (E) 10,000,000 – –
Total (A+B+C+D+E)
606,066,355 334,105,157 292,046,328 96,040,309
NOTeS TO THe FINANCIAL STATeMeNT for the year ended 31 March 2014(All amounts in Indian rupees, except share data and where otherwise stated)
*All term loans are secured against exclusive charge on the standard assets portfolio receivables pertaining to micro credit loans and cash collateral as per the respective agreements.
#vehicle loan is secured by the vehicles owned by the Company.
2.33 Deferred Tax
Particulars As at 31 March 2014
As at 31 March 2013
Deferred tax asset- Provisions on loan portfolio 3,333,928 962,314- Provision for employee benefits 850,177 211,486- Depreciation on fixed assets 319,471Total (A) 4,503,576 1,173,800
Deferred tax liability- Depreciation on fixed assets – 19,872Total (B) – 19,872
Deferred tax asset/(liability), net (A-B) 4,503,576 1,153,928
2.34 Legal professional and consultancy charges in note 2.21 includes auditors remuneration as follows:
Particulars For the year ended 31 March 2014
For the year ended 31 March 2013
Audit fees 7,50,000 5,00,000Certification fees 300,000 50,000Out of pocket expenses 30,875 20,000Total 1,080,875 5,70,000
2.35 Amounts payable to Micro, Small and Medium EnterprisesThe Ministry of Micro, Small and Medium enterprises has issued an Office Memorandum dated 26 August 2008 which recommends that the Micro and Small enterprises should mention in their correspondence with its customers the entrepreneurs Memorandum Number as allotted after filing of the Memorandum. Accordingly, the disclosure in respect of the amounts payable to such enterprises as at 31 March 2014 has been made in the financial statements based on information received and available with the Company. Further

FuSION MICROFINANCe PRIvATe LIMITeD
NOTeS TO THe FINANCIAL STATeMeNT for the year ended 31 March 2014(All amounts in Indian rupees, except share data and where otherwise stated)
2.35 Amounts payable to Micro, Small and Medium Enterprises (continued)in the view of the management, the impact of interest, if any, that may be payable in accordance with the provisions of the Micro, Small and Medium enterprises Development Act, 2006 is not expected to be material. The Company has not received any claim for interest from any supplier under the said Act.
b) The Company does not have any direct or indirect exposure to real estate sector.
c) Maturity pattern of certain items of assets and liabilities: (Figures in Rupees Lakhs)Particulars 1 day to
30/ 31days 1 month
Over 1 month upto 2 months
Over 2 months upto
3 months
Over 3 months upto
6 months
Over 6 months
upto 1 year
Over 1 year upto 3 years
Over 3 years upto
5 years
Over 5 years
Borrowings from banks 281.74 135.70 149.99 537.06 884.64 1,789.64 – –Market Borrowings 324.71 373.19 323.10 1,060.78 3,614.76 1,551.41 – –Advances 663.88 662.03 645.99 2,059.03 3,757.49 2,487.21 – –Investments 229.29 – – – – – – –
2.36 Amounts payable to Micro, Small and Medium Enterprises (continued)
Particulars For the year ended 31 March 2014
For the year ended 31 March 2013
The principal amount and the interest due thereon remaining unpaid to any supplier as at the end of each accounting year.
Nil Nil
The amount of interest paid by the company along with the amounts of the payment made to the supplier beyond the appointed day during the year.
Nil Nil
The amount of interest due and payable for the period of delay in making payment (which have been paid but beyond the appointed day during the year) but without adding the interest specified under this act.
Nil Nil
The amount of interest accrued and remaining unpaid at the end of the year; and Nil NilThe amount of further interest remaining due and payable even in the succeeding years, until such date when the interest due as above are actually paid to the small enterprise.
Nil Nil
2.37 As required in terms of Paragraph 10 of Non-Banking Financial (Non Deposit Accepting or Holding) Companies Prudential Norms (Reserve Bank) Directions, 2007.
a) Capital to Risk Asset ratio (CRAR):
Particulars 2013-14
CRAR% 29.71
CRAR -Tier I Capital % 17.32
CRAR-Tier II Capital % 12.39
2.38 Previous year’s figures have been regrouped / reclassified, where necessary, to conform to current year’s classification.
As per our report of even date attached for and on behalf of the Board of Directors of For B S R & Associates LLP Fusion Micro Finance Private LimitedChartered AccountantsFirm Registration No.:116231W
Sriram Mahalingam Devesh Sachdev Ashish Tewari Partner Director & CEO Director & COOMembership No.:049642
Place: Hyderabad Deepak MadaanDate: 24 June 2014 Company Secretary


www.fusionmicrofinance.com