creating competition? globalisation and the...
TRANSCRIPT

A
ccwra©
J
K
1
nistap
f
C
0
Research Policy 36 (2007) 209–226
Creating competition?Globalisation and the emergence of
new technology producers
Suma Athreye a,∗, John Cantwell b,1
a Brunel Business School, Brunel University, Uxbridge UB83PH, UKb Rutgers Business School at Newark and New Brunswick, 111 Washington Street, Newark, NJ 07102-3027, USA
Received 10 October 2005; received in revised form 11 October 2006; accepted 7 November 2006Available online 2 January 2007
bstract
This paper studies the role of globalisation (through trade, inward FDI and international migration) in the emergence of newountries as contributors to technology generation in the world economy. Increasing FDI is a factor causing the emergence of newerountries with the more sophisticated technology generation associated with patenting, but not in the recent surge of newer countriesith the basic capabilities needed to become licensors in the world economy. Yet increases in the international spread of subsidiary
esearch efforts in MNCs have tended on average to reinforce the position of established centres of higher grade technologicalctivity.
2006 Elsevier B.V. All rights reserved.
EL classification: O33; F23; O19; F43; O57
on
eywords: Technology; Innovation; Patenting; Licensing; Globalisati. Introduction
There is considerable debate on the issue of whetherew countries in the developing world are catching-upn technological capabilities and if they can emerge asignificant producers of technology. Case studies suggest
hat countries like Ireland, Israel and India have emergeds significant exporters of technologically sophisticatedroducts and services. A significant proportion of multi-∗ Corresponding author. Tel.: +44 1895 265410;ax: +44 1895 269775.
E-mail addresses: [email protected] (S. Athreye),[email protected] (J. Cantwell).1 Tel.: +1 973 353 5050; fax: +1 973 353 1664.
048-7333/$ – see front matter © 2006 Elsevier B.V. All rights reserved.doi:10.1016/j.respol.2006.11.002
national company R&D has moved to countries ofdeveloping Asia—estimates suggest that the share of USaffiliate R&D in Canada, Japan and Europe relative tothe world as a whole decreased from 94% in 1989 to 85%in 1999, while the share of developing Asia grew fromless than 1% to over 7.7%.1 Yet our knowledge remainslimited of whether this transfer of R&D has been asso-ciated with technological generation from new countriesto a significant extent.
However, we also live in times when the unprece-
dented globalisation of the last two decades is underthreat. On the one hand, researchers concerned with thedevelopment of poor countries in Africa are campaign-1 US Department of Commerce as cited in Beausang (2004), Table 1.

search
210 S. Athreye, J. Cantwell / Reing for Developed Market Economies to open a largerpart of their market. Larger developing countries such asIndia and Brazil have also intervened aggressively for afair deal in trading during the Doha and Cancun rounds ofthe WTO negotiations. On the other hand, recent trendsin the outsourcing of intellectual labour have given riseto the fear in Developed Market Economies that theystand to lose their comparative advantage in knowledge-intensive products as new countries emerge with thebasic capabilities needed to provide some technology-based services. At least two recent works on internationaltrade by eminent economists argue that these fears maybe well founded. Gomroy and Baumol (2000) show thatin a multi-country, multi-product setting where inter-national trade is based mostly on created comparativeadvantages and economies of scale, the terms of tradeconsequences of productivity improvements among trad-ing partners may be such that the classical argument thatfree trade benefits all countries is overturned. In a simi-lar vein, Samuelson (2004) has argued that productivitygrowth in trading partners may sometimes ‘permanentlyharm’ the trading country.
These concerns about the possibilities and conse-quences of productivity growth in trading partners arealso closely related to the discussion of technologicalcatch-up of developing economies, especially in the con-text of North-South trade. Increases in productivity indeveloping economies often start with simple technol-ogy transfer type activities, facilitated by openness andthen proceed through investments by firms in capabilitybuilding (within economies of the South) to become dis-tinctive niches that underlie the competitive advantagesof these nations.
There are two reasons to expect that the relation-ship between technological catch-up and globalisationvary with whether countries are at earlier stagesof development that require simpler capabilities, orhave entered a more mature phase of developmentthat relies on sophisticated capabilities. First, whenbuilding simpler capabilities smaller firms may playa more prominent independent entrepreneurial role,and there is less need for organisational complexityand interconnected network structures. Therefore, ear-lier technological catch-up relies less upon a systemfor sustained and continuous international knowledgeexchanges and interdependencies (of the kind that arefacilitated by trade and FDI), but depends more in thefirst instance upon indigenous learning efforts. Second,
the recent rise in technology trade and the outsourcing ofknowledge-related functions that has accompanied thefragmentation of value chains has created new oppor-tunities for those with at least basic capabilities inPolicy 36 (2007) 209–226
what were formerly less well internationally intercon-nected locations, especially in developing countries.Some countries with basic capabilities may thus nowbe able to establish new niches for themselves in inter-national knowledge creation that does not depend on analready prevailing system of trade and FDI.
Our paper aims to contribute to these debates andtheir concerns. Its novelty lies in providing a quantitativeassessment of the periods when new countries emergedas technology producers (thus demonstrating technolog-ical catch-up), and assessing how different phases anddimensions of technological catch-up are related to glob-alisation. We are able to distinguish between the earlierphases of technological catch-up that rely on the build-ing of simpler capabilities, by utilising a new sourceof data, viz. cross-border licensing revenue data. Theattainment of higher level technology based competi-tiveness is captured (as in other work on the subject)by the inventive sources of patenting. The paper paysattention to different dimensions of globalisation in theworld economy—openness to trade, share of foreigndirect investment (FDI), the use of international locationsas sources for patenting by multinational corporations(MNCs), and the proportion of the world’s populationthat migrated between countries.
Indeed, our empirical findings suggest a strong rolefor increasing inward direct investment in the worldeconomy as a factor inducing the emergence of newcountries as patentees (which usually does require inter-national knowledge interdependencies), but only someambiguous evidence that greater openness to interna-tional trade explains the recent surge of new countriesas licensors in the world economy. We interpret the lat-ter finding as suggestive of the important role playedby exogenous factors such as the emergence of generictechnologies that have facilitated the growth of tech-nology trade often in intangibles as argued by Athreye(1998) and Arora et al. (2001). However, patenting byMNCs from international sources (that is, from the inno-vative efforts of their subsidiaries abroad) is enhancedby a weakening of the possibilities for trade. This iswhat we would expect from internalisation theory of theMNC (Buckley and Casson, 1976), but it may also be thecase even without the internalisation of a former market(trade) connection that when openness to trade declines,host countries rely to a greater extent on a local presenceby the subsidiaries of foreign-owned MNCs to fostertechnology creation, as opposed to international busi-
ness knowledge linkages that come through trade andsubcontracting.However, when international knowledge linkages arecreated through FDI, it facilitates the consolidation of

search
huiTvc2ktCPtohttnslaetf
at1emet
2t
oaoa
aactaAtbOwo
S. Athreye, J. Cantwell / Re
igher level capabilities locally, even though FDI is notsually the means by which lower level capabilities arenitially built up in the earlier stages of development.aken together, these findings are consistent with theiew that multinationals require the presence of localapabilities and infrastructure before they invest (Lall,001), and that they tend in recent times to have followednowledge-based asset-seeking strategies to reinforceheir competitive strengths as argued by authors such asantwell (1995), Dunning (1996), Makino et al. (2002),earce (1999) and Wesson (2005). Indeed, we argue
hat the shift within the existing international networksf MNCs towards competence-creating activities (andence to more patents that are attributable to the interna-ional facilities of MNCs) is – initially, at least – likelyo reinforce the innovative strengths of established tech-ology producers. This is because competence-creatingubsidiaries need to be more closely embedded withinocal networks (Birkinshaw et al., 1998; Andersson etl., 2002), and an increased intensity of knowledgexchanges between local actors in these networks tendso create a virtuous cycle of growth in innovation in thoseavoured locations that have attracted high quality FDI.
The remainder of the paper is organised as follows:brief review of the literature on the emergence of new
echnology producing countries and regions in Section, is followed in Section 2 by an outline of the methodmployed in our study, including a description of theethod used to track technological catch-up in the world
conomy. Section 3 describes our main results and Sec-ion 4 concludes.
. Factors influencing the emergence of newechnology producing regions
The influence of globalisation2 and human capital
n the technological capacities of a country is widelycknowledged in the literature on technology and devel-pment (Lall, 2001; Romer, 1990). Yet globalisation hasdual dimension in the way that it influences the emer-2 There is a large and important literature on the influence of glob-lisation on the form and extent of internationalisation of innovativectivity from actors based in the OECD economies which we do not dis-uss in any detail here since we are interested in the emergence of newechnology producers (including through their own indigenous efforts)s a result of globalisation. Key references for this literature includerchibugi and Iammarino (2002) and Archibugi and Coco (2001). In
his study we refer to the internationalisation of innovative activityy the world’s largest firms (which originate predominantly from theECD countries) as itself one of our indicators of globalisation, and soe consider its relationship with the overall geographical distributionf innovative activity in total across a broad range of countries.
Policy 36 (2007) 209–226 211
gence of new technology producers that is not oftenaddressed in this literature. The rates of growth of exportsand imports in the global economy provide or close ademand opportunity for all countries—this may be espe-cially important in poorer countries where low incomesmay cause domestic markets to be small to start with.Periods of relatively greater openness are therefore alsooften periods where the world economy enjoys a boomin demand as a result of growth in incomes of trad-ing countries. This growth of demand may contain newtechnological opportunities inasmuch as technologicalopportunity is dependent both upon the novelty of prod-uct demand and a large scale of operations. In addition,in developing countries export demand provides accessto a wider range of high income consumers that requirehigher quality products than may be broadly in demandat home (Pasinetti, 1981). Globalisation in this first senseprovides the preconditions for the generation of technol-ogy within developing countries and is one dimensionthat underlies what we study in this paper—namely,through the measure of the openness of the world econ-omy to trade. The demand-pull approach to innovation(Schmookler, 1966; Vernon, 1966) stresses this con-nection between the growth of demand and the rise ofinnovation, even if it was originally applied in a morelocalised domestic setting in considering this impact ofdemand.
The second dimension of globalisation (and the morewidely studied one) is the ability of countries to exploitsuch demand booms. Here supply side factors such aslevels of infrastructure, stocks of human capital andexisting technological capacity condition the influenceof openness. Whilst openness allows opportunities toimport capital goods and technology-embodied prod-ucts, the presence of local human capital, and linkagesto demanding users such as foreign-owned firms maywell play an important role in the exploitation of theopportunities offered by openness, while the capacity toexploit these advantages may also vary with dynamiclocal firm capabilities and the institutional infrastruc-ture of the country (Fagerberg, 1994; Verspagen, 1991).3
This second dimension is thus quite distinct from thefirst dimension, but it is reflected in the geographicaldispersion by MNCs of their subsidiary sources of tech-
3 See, for example, the discussions of ‘social capability’(Abramovitz, 1991) and the importance of ‘absorptive capacity’ inrealising the benefits of FDI (Narula and Dunning, 2000). The role ofa complex local network of interconnected actors and institutions isalso emphasised in the literatures on national and regional systems ofinnovation (Freeman, 1987; Nelson, 1993; Breschi and Lissoni, 2001;Cooke, 2001).
search
212 S. Athreye, J. Cantwell / Renological knowledge creation (Cantwell and Mudambi,2005).
An important factor emphasised in the literature onthe emergence of technology producing regions is thatsuch regions embody ‘untraded’ competencies (Storper,1997), which includes technology generating economicand social institutions. Other studies have also high-lighted the role of human capital and training and theinertia associated with such labour in some regions.Thus, studies on the emergence of new science basedregions such as those by Bresnahan and Gambardella(2004), Arora and Gambardella (2005), Florida (2002)suggest that human capital variations have opened upthe possibility for new regions and nations to occupydistinctive technological niches in a global market basedupon their comparative advantage in access to skilledlabour. Recent examples of technological catch-up suchas those of Israel and Taiwan point to the importantrole of openness and human capital investment in cre-ating distinctive comparative advantage positions forthe countries often in global production chains (Ernst,2002; Ernst and Kim, 2002).4 Human capital improve-ments are also often intertwined with the ability toexploit inward foreign direct investment. Thus, open-ness on one hand provides opportunities for the exportof goods and services from new regions but a certainlack of mobility of some key local supporting fac-tors (such as skilled labour, or universities) in the faceof a generally open environment may also attract for-eign direct investment of a local technology promotingkind.
It is also argued that the emergence of general pur-pose technologies, such as IT and biotechnology havecreated conditions in which new technology marketshave emerged (Athreye, 1998; Arora et al., 2001). Keyparts of this argument relate to the role of technologi-cal convergence (facilitated by the emergence of generictechnologies) in creating a large scale of market, the low-ered costs of experimentation due to easier trial and error(for example through the widespread use of computeraided simulation) and the emergence of new scientific
languages that allow some hitherto tacit knowledge to becodified. The emergence of these new markets howeverrepresents a changing division of labour where newer4 These case studies also emphasise the large and coordinated invest-ments by numerous agents in the economy required to achieve successin technological catch-up and the role of indigenous institutions inimparting unique advantages to nations. It is beyond the scope of theaggregated level of analysis of this paper to examine these aspects oftechnological catch-up, although we think such factors do affect theinter-country differences in catch-up.
Policy 36 (2007) 209–226
nations have a chance to specialise narrowly and emergeas technology producers. Some work from the studyof patent data seems to support this conclusion. Forexample, Cantwell and Vertova (2004) find that the tech-nological diversification of nations has declined in recentyears and from this they conclude that newer countrieshave different opportunities for catch-up when comparedto earlier periods because they can afford to catch-upthrough a much narrower specialisation.
Thus, in assessing the factors due to which newcountries emerge as technology producers in the worldeconomy, we need to take account of the openness of theworld economy, the movement of inward direct invest-ment and migration as well as the growth and variation ofthe stock of human capital. In addition, the technologicaldevelopments in the fields of IT and biotechnology mayexercise an independent influence because the develop-ment of these fields has opened up huge opportunities forniche technologies based on recombination, which manynew countries with sufficient human capital can exploit.While these technological developments are not directlymeasurable, their influence has been noted in severalstudies since the late 1980s on the growing importanceof the knowledge-based economy.5
3. Data and methodology employed
The interrelationship between trade, FDI, human cap-ital and economic growth, implies that the challenge instatistically testing some of the relationships at the coun-try level lies in overcoming the biases introduced byendogeneity in the statistical models. Consequently, dis-entangling their influence on growth and separately ontechnological catch-up is problematic. In this paper weconstruct an aggregated measure of technological catch-up that does not depend upon growth measures in a directway. This allows us to bypass some of the endogene-ity issues to do with technology and growth. However,the interrelatedness between processes of globalisationand technology generation remains an important issue.Thus technology generation may respond to the demandopportunities created by openness while internationalproducers may flock to regions of technological advan-tage. We use time series techniques to address theseissues of interrelatedness and to assess the direction of
statistical causality. This comes at a cost however, sincewe also lose much of the variation across countries inthe data, which we could exploit. Thus, one implicationof the methodology we employ is that we cannot say5 See for example, Foray and Lundvall (1996) and Antonelli (1998).
search
vo
3
3
cwiiilralc
fbrtltlocvtibp
thdhtlotdffrmss
1
S. Athreye, J. Cantwell / Re
ery much about individual cases of success or failuref economies to emerge as technology producers.
.1. Data used in the analysis
.1.1. Measuring technological catch-upWe use two measures to evaluate a country’s
ontribution to the production of technology in theorld economy. The first is a country’s share of patents
ssued by the USPTO that are attributable to all non-USnventors, and the second is a country’s share of licens-ng revenues in the world economy. Note that in theatter case of licensing revenues, we use just licensingeceipts by country and not payments. This is thereforemeasure of the sums received from abroad for intel-
ectual property generated locally by residents of eachountry.
Royalty and licence fees are receipts by residentsrom non-residents for the authorised use of intangi-le, non-produced, non-financial assets and proprietaryights (such as patents, copyrights, trademarks, indus-rial processes, and franchises) and for the use, throughicensing agreements, of reproduced originals of pro-otypes (such as manuscripts and films). Data on suchicensing receipts are normally recorded on the balancef services section of the balance of payments in everyountry. They therefore provide an indicator of the totalalue of intellectual property rights created and held byhe residents of each country that is recognised by usersn the rest of the world, and which measure covers aroader range of technology creation activity than doatents.
The USPTO database has advantages and disadvan-ages in the analysis of technological behaviour and theseave been widely discussed in the literature using patentata.6 For our purposes a major advantage is that itelps us track the presence across countries of advancedechnology generating capabilities, by examining theocation of (the first named) inventors. We exclude fromur analysis the share of US patents attributable to inven-ors resident in the US itself, since the determinants ofomestic patenting are somewhat different from those oforeign patenting, and cross-border patenting includesewer questionable or lower quality patents. The US
epresents the best choice of a ‘third country’ as a bench-ark for comparing any other pair of countries, given thetrength and consistency of its patent system over a con-iderable historical period, and the role of the US as the
6 See e.g. Schmookler, 1950, 1966; Pavitt, 1985, 1988; Griliches,990; Archibugi, 1992.
Policy 36 (2007) 209–226 213
world’s largest market (Soete and Wyatt, 1983). Further-more, by excluding US resident inventor patents fromour study we exclude from our consideration the issue ofthe increase in foreign patenting everywhere relative todomestic patenting, which would otherwise falsely exag-gerate any measure of technological catch-up amongstcountries.
However, the US patent share of countries is anunderestimate of the overall technological capacity ofcountries, which includes more basic capabilities that areless likely to be associated with the kinds of knowledgecreation that gives rise to patenting. US patents may alsobe biased towards areas of industry which are dominantin US imports. For these reasons, US patents providean over-representation of innovation in advanced manu-facturing and in areas for which the US market is mostimportant, but they are a poor representation of innova-tion of a simpler kind, in services and of technologytrade that less involves the US (e.g. trade in knowl-edge based services between two developing countries).Since the mid-1980s, knowledge intensive services havebeen increasing in importance for economic activity withseveral new countries becoming involved in technologytrade in these fields (e.g. software exports from India).For this reason we also use the share of a country ininternational royalty and licensing receipts as a measureof technological generation capacity of a simpler kind.This better reflects earlier stages of the development pro-cess and other aspects of innovations that have arisen inmore recent industrial history (most notably, innovationin services).
While patents can be used to generate licensing rev-enues, licensing revenues can also be earned without theissuance of patents. Licensing is the more prevalent wayof trading technology-based business services betweenfirms. However, it should be noted that unlike US patents,licensing revenues are probably far more influenced bylocal institutional conditions, transfer pricing practicesof multinationals, and bilateral trade ties—factors thatwe lose sight of in the high level of aggregation of ourdata.
The emergence of new countries as technology pro-ducers should result in a greater dispersion of technologyshares as measured by indices of concentration like theHerfindahl. We compute the Herfindahl index of concen-tration using the following definition:
H =∑
S2, (1)
t itwhere Sit is the technology share of the ith country attime t. We then exploit a particular decomposition ofthe Herfindahl index, which splits the change in overall

search
(
214 S. Athreye, J. Cantwell / Re
concentration into a turbulence effect and a regressioneffect.7
�Ht =∑
i(�Sit)
2 + 2∑
i(Sit−1 �Sit) (2)
In Eq. (2), the first term of the right hand side mea-sures technology share turbulence (the concentration ofthe change in shares). Both positive and negative changeshave the same weight in this index and the larger thevalue of the turbulence the more changes there will havebeen in technology shares. By construction the turbu-lence measure is always positive.
The second term is, however, the more interestingone for tracking technological catch-up by new coun-tries. It measures the linear association between initialtechnology share and the change in that share, weight-ing large initial shares more than small ones. We call thisthe inverse regression index (IRI), since negative valuesimply a regression of country shares towards the mean.8
Negative values of the inverse regression effect comeabout when countries that had initially larger technol-ogy shares are also those with negative values of �Sit,(i.e. when these countries lose technology shares). Whentechnology producers with small initial shares havegained or lost patent shares these are given a smallerweight and the cross term will have a smaller positivevalue than if the same were to happen to large patentees.
As new countries begin to make small gains in tech-nology shares and erode the shares of existing nationsthey cause lower positive values for the turbulence termand a negative value for the inverse regression index.When some already dominant existing countries areincreasing their technology shares both terms will bepositive and higher. In general, turbulence tends to begreatest when it is the largest countries that make signif-icant gains and losses against one another, since at thatend changes in shares tend to be higher in absolute terms.
We use the IRI term as the dependent variable in atime series analysis to capture the existence of technolog-ical catch-up. Thus, we compute two IRI measures—onebased on patent shares of countries (IRIP) and the second
based on licensing (receipt) shares of countries (IRIL),and use these as the principal dependent variables in ouranalysis.7 For an application of this decomposition to study the evolutionof market shares and concentration see Khambampati and Kattuman(2003).
8 This very similar to the Galtonian regressions used in Cantwell(1991a), in which the variance of shares is analogously decomposedinto a mobility effect (measured by one minus the correlation coef-ficient), and a regression effect (measured by one minus the slopecoefficient on lagged shares).
Policy 36 (2007) 209–226
3.1.2. The globalisation variablesThe data for the globalisation variables are drawn by
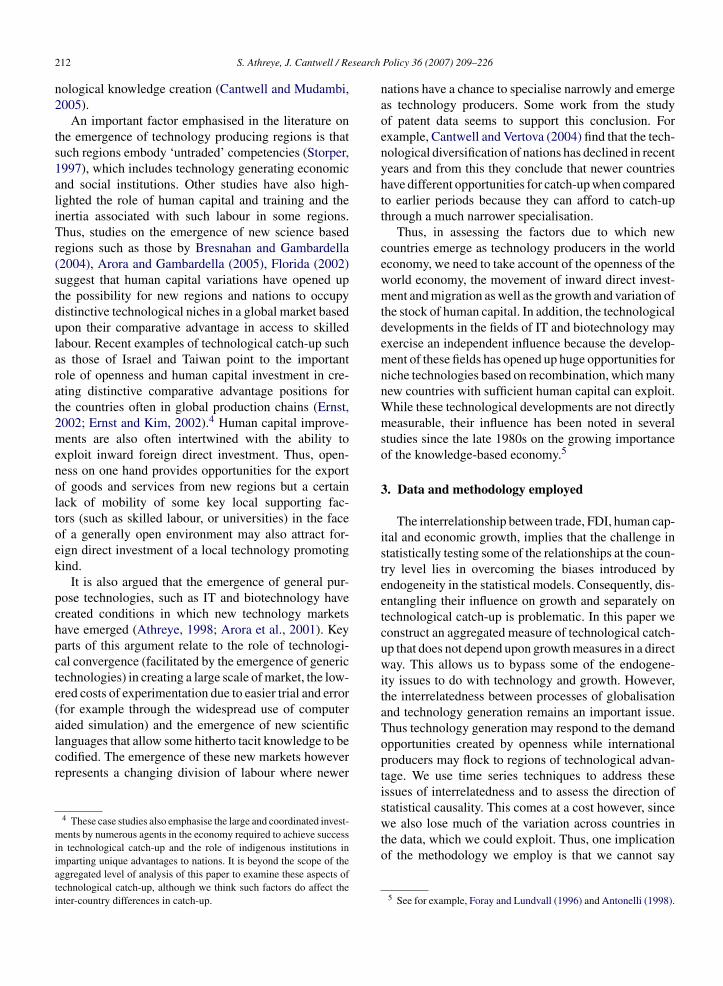
aggregating the relevant data over countries from well-known data sources, and these are set out in detail inthe Appendix A to this paper. In particular, we use fourmeasures of globalisation across the world economy asa whole:
(i) Openness to trade as measured by the ratio of worldexports and imports to total world income (OPEN);
(ii) The ratio of world inward FDI stock to gross worldincome (IFDI);
iii) The share of total US patents that are assigned tothe largest foreign-owned MNCs active in each hostcountry (location of invention) across the worldeconomy—a measure of the globalisation of R&Dor patenting by MNCs from international R&Dsources (INTPAT);
(iv) The proportion of population that migrated acrosscountries as a percentage of the world population(PROPMIG).
We also looked at the possibility of including mea-sures of human capital such as the share of the populationeducated to tertiary level in the world economy, and thevariance in the share of the population educated to ter-tiary level in the world economy. However, the earliestperiod for which such data became available in a consis-tent fashion was from 1970 and the data were availableonly for 5 yearly intervals. Given the relatively short span(for a time series analysis) we decided not to includethese variables but to use an econometric methodologycapable of controlling for the influence of such omittedfactors.
Table 1 below describes the four globalisation vari-ables used in the study and their expected influence onIRIP and IRIL, based on the review of the previous sec-tion. We further note that since IRIP and IRIL may alsobe capable of influencing one another directly, the direc-tion of their relationship is potentially complex. Thedirect relationship may be expected to be positive fortwo reasons. First, patents are sometimes issued witha view to earning licensing revenues, so new patenteesshould also imply new licensees. Second, new licensorsmay over time acquire the higher grade capabilities andnetworks that permit them to become patentees, althoughthe lag here from one to the other may be consider-able. However, new technology producers may first test
the market for their technologies through licensing, andespecially when tacit elements of knowledge are impor-tant they may bundle licensing revenues with services.Once the scope for their market becomes clear, they
S. Athreye, J. Cantwell / Research Policy 36 (2007) 209–226 215
Table 1Explanatory variables used in the econometric analysis
Variable Description Influence on IRIP/IRIL
OPEN (Import + export)/real GDP (1996 constant) −IFDI Share of inward FDI stock as a proportion of world GDP −I n-owneP world p
S bles. Al
mceb
csesIHstl
am
TR
V
IIOIIP
N
TCd
L
D
NTPAT Share of patents assigned to large foreigROPMIG Absolute value of migrant population to
ee Appendix A for data sources used in the construction of the varia
ay seek to patent their proprietary technologies. In thisase new patentees will further concentrate licensing rev-nues and the relationship between IRIL and IRIP mayecome negative.
Augmented Dicky Fuller tests (with a trend and inter-ept) were used to determine whether each variable wastationary or trended. The order of integration of all thexplanatory variables, reported in Table 2, indicate non-tationarity in all the globalisation variables. Since theRI is constructed by decomposing the difference of theerfindahl index for patents and licensing shares, it is
tationary to start with. We thus used first differences ofhe globalisation variables along with IRIL and IRIP (in
evels) for our estimation.Fig. 1 plots the main trends in the explanatory vari-bles we considered, while Table 3 reports the correlationatrix of explanatory variables. Fig. 1 shows a rising
able 2esults of ADF unit root tests
ariable Order of integration Data span
RIP I(0) 1950–2001RI (licensing) I(0) 1955–2001PEN I(1) 1950–2000
FDI I(2) 1950–2000NTPAT I(1) 1950–2001ROPMIG I(1) 1955–2000
ote: All tests are significant at the 5% level of significance.
able 3ross correlation matrix of explanatory variables (in levels andifferences)
OPEN IFDI INTPAT PROPMIG
evelsOPEN 1.00IFDI 0.93 1.00INTPAT 0.81 0.93 1.00PROPMIG 0.89 0.89 0.72 1.00
ifferencesOPEN 1.00IFDI 0.17 1.00INTPAT −0.63 −0.17 1.00PROPMIG 0.30 0.08 −0.45 1.00
d firms in foreign locations +opulation ?
l ratios expressed in percentages.
trend in all the explanatory variables though the levels ofOPEN, IFDI and INTPAT seem considerably higher thanthe values for PROPMIG. The correlation matrix alsoshows that the globalisation variables are very highlycorrelated in levels. De-trending the data by differenc-ing we find the correlations are still evident but muchmore manageable for estimation purposes.
3.2. Econometric methodology
We use a vector autoregressive system of equa-tions (henceforth VAR) to model the inter-relationshipbetween the emergence of new technology producers andglobalisation in the world economy. The estimated VARtakes the form:
yt = α + A1yt−1 + · · ·Apyt−p + εt
where yt is a k vector of endogenous variables, � is ak-vector of constants, A1–Ap are matrices of coefficientsto be estimated and εt is an error term which we assumedoes not display any correlation with its own values orthe right hand side variables. Thus each variable in thesystem is explained by its own past values and the pastvalues of the other variables. For the k variables in theVAR system this gives us k separate equations to estimatesimultaneously. In our case, k = 6, viz. the four globali-sation variables detailed in Table 1 and the two catch-upvariables IRIP and IRIL.
VAR systems avoid many common problems such assimultaneity (only lagged values appear) and the absenceof a full variable set (since we use lagged values ofthe dependent variable itself as an explanatory variable).However, they are intensive in their need for a long spanof data at regular intervals. The lag length we use isalso a matter of choice. We used statistical tests on thegoodness of fit of the equations in order to choose theappropriate lag length.
To assess causality between the dependent and
explanatory variables we used Granger causality tests. Inthis exercise we ask the data to predict observed values ofthe one variable (e.g. IRI) using past lagged values of theothers (e.g. OPEN). If the fitted model successfully pre-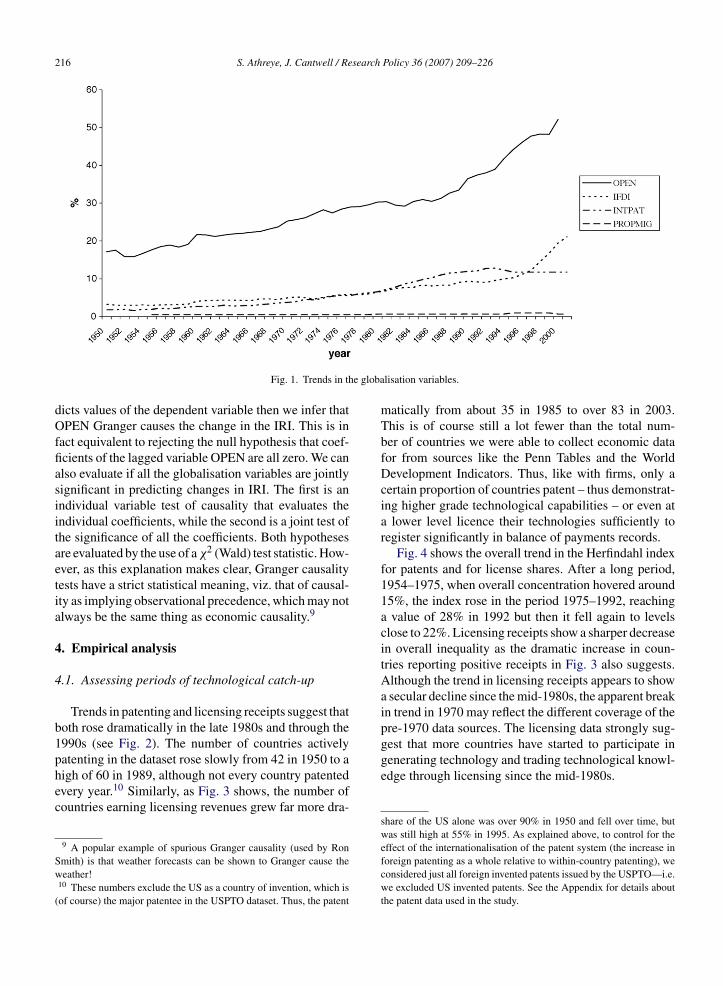
216 S. Athreye, J. Cantwell / Research Policy 36 (2007) 209–226
e globa
gest that more countries have started to participate ingenerating technology and trading technological knowl-
Fig. 1. Trends in th
dicts values of the dependent variable then we infer thatOPEN Granger causes the change in the IRI. This is infact equivalent to rejecting the null hypothesis that coef-ficients of the lagged variable OPEN are all zero. We canalso evaluate if all the globalisation variables are jointlysignificant in predicting changes in IRI. The first is anindividual variable test of causality that evaluates theindividual coefficients, while the second is a joint test ofthe significance of all the coefficients. Both hypothesesare evaluated by the use of a χ2 (Wald) test statistic. How-ever, as this explanation makes clear, Granger causalitytests have a strict statistical meaning, viz. that of causal-ity as implying observational precedence, which may notalways be the same thing as economic causality.9
4. Empirical analysis
4.1. Assessing periods of technological catch-up
Trends in patenting and licensing receipts suggest thatboth rose dramatically in the late 1980s and through the1990s (see Fig. 2). The number of countries activelypatenting in the dataset rose slowly from 42 in 1950 to a
high of 60 in 1989, although not every country patentedevery year.10 Similarly, as Fig. 3 shows, the number ofcountries earning licensing revenues grew far more dra-9 A popular example of spurious Granger causality (used by RonSmith) is that weather forecasts can be shown to Granger cause theweather!10 These numbers exclude the US as a country of invention, which is
(of course) the major patentee in the USPTO dataset. Thus, the patent
lisation variables.
matically from about 35 in 1985 to over 83 in 2003.This is of course still a lot fewer than the total num-ber of countries we were able to collect economic datafor from sources like the Penn Tables and the WorldDevelopment Indicators. Thus, like with firms, only acertain proportion of countries patent – thus demonstrat-ing higher grade technological capabilities – or even ata lower level licence their technologies sufficiently toregister significantly in balance of payments records.
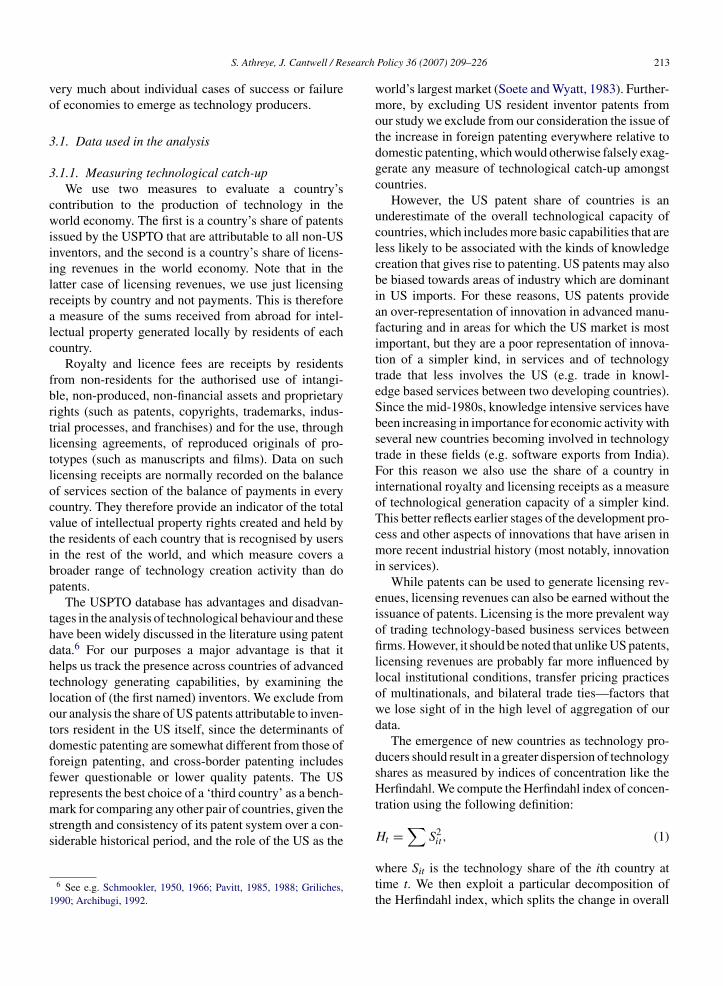
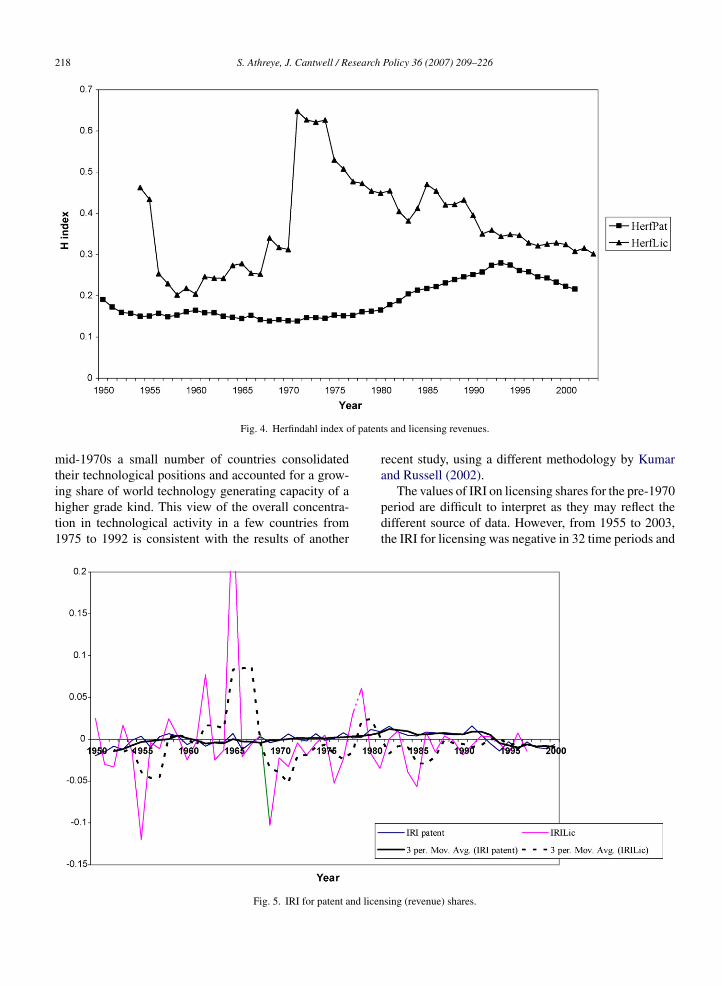
Fig. 4 shows the overall trend in the Herfindahl indexfor patents and for license shares. After a long period,1954–1975, when overall concentration hovered around15%, the index rose in the period 1975–1992, reachinga value of 28% in 1992 but then it fell again to levelsclose to 22%. Licensing receipts show a sharper decreasein overall inequality as the dramatic increase in coun-tries reporting positive receipts in Fig. 3 also suggests.Although the trend in licensing receipts appears to showa secular decline since the mid-1980s, the apparent breakin trend in 1970 may reflect the different coverage of thepre-1970 data sources. The licensing data strongly sug-
edge through licensing since the mid-1980s.
share of the US alone was over 90% in 1950 and fell over time, butwas still high at 55% in 1995. As explained above, to control for theeffect of the internationalisation of the patent system (the increase inforeign patenting as a whole relative to within-country patenting), weconsidered just all foreign invented patents issued by the USPTO—i.e.we excluded US invented patents. See the Appendix for details aboutthe patent data used in the study.

S. Athreye, J. Cantwell / Research Policy 36 (2007) 209–226 217
and wo
wtt(pittm
Fig. 2. Growth in non-US held patents
However, it is the shares of technology generation thatent to these newer countries that are important—were
hey large enough to make a dent on the shares of theechnological leaders? Fig. 5 plots the IRI term of Eq.2) for both licensing shares and patent shares. Sinceatent numbers vary widely year-on-year they can cause
ndividual patent shares to fluctuate widely. The varia-ions in licensing revenues are even wider. To smoothhe data for these variations we also plot a three periodoving average for the two IRI terms.
Fig. 3. Patents and receipts of royalty and licensing fees (1
rldwide royalty and license revenues.
Fig. 5 shows that through much of the 1950s and1960s the inverse regression index values for patentswere negative, reflecting a loss of patent shares to newpatentees. The negative values were somewhat larger inthe 1950s than in the 1960s, when they hovered between0.0 and 0.5. The period 1992–2001 has also been one of
catch-up, with smaller patentees gaining patent share. Inthe intervening period (1972–1992) the index for patentsturned positive and continued to rise in value up untilthe mid-1980s. Thus, for much of the period since the950–2003) number of reporting countries by year.
218 S. Athreye, J. Cantwell / Research Policy 36 (2007) 209–226
f paten
Fig. 4. Herfindahl index omid-1970s a small number of countries consolidatedtheir technological positions and accounted for a grow-
ing share of world technology generating capacity of ahigher grade kind. This view of the overall concentra-tion in technological activity in a few countries from1975 to 1992 is consistent with the results of anotherFig. 5. IRI for patent and licen
ts and licensing revenues.
recent study, using a different methodology by Kumarand Russell (2002).
The values of IRI on licensing shares for the pre-1970period are difficult to interpret as they may reflect thedifferent source of data. However, from 1955 to 2003,the IRI for licensing was negative in 32 time periods and
sing (revenue) shares.
search
pvItbeuln
iti
tdoicaop
rtcIeCtrlntitT
TT
C
C
SITSSCIFRN
S. Athreye, J. Cantwell / Re
ositive in only 17. This is comparable to the equivalentalues for the IRI in patenting: from 1950 to 2001 theRI was positive in 12 time periods and negative in 38. Inhe case of licensing revenues too, there seems to haveeen some consolidation in the late seventies and earlyighties but mostly, negative values thereafter. Indeed,nlike the case of patenting, the decline in the IRI foricensing set in much earlier in the mid-1980s and stayedegative for much of the remaining period.
In both cases, there was relatively little turbulencen the cross-country distribution, and so the changes inhe Herfindahl index were mostly due to changes in thenverse regression index.
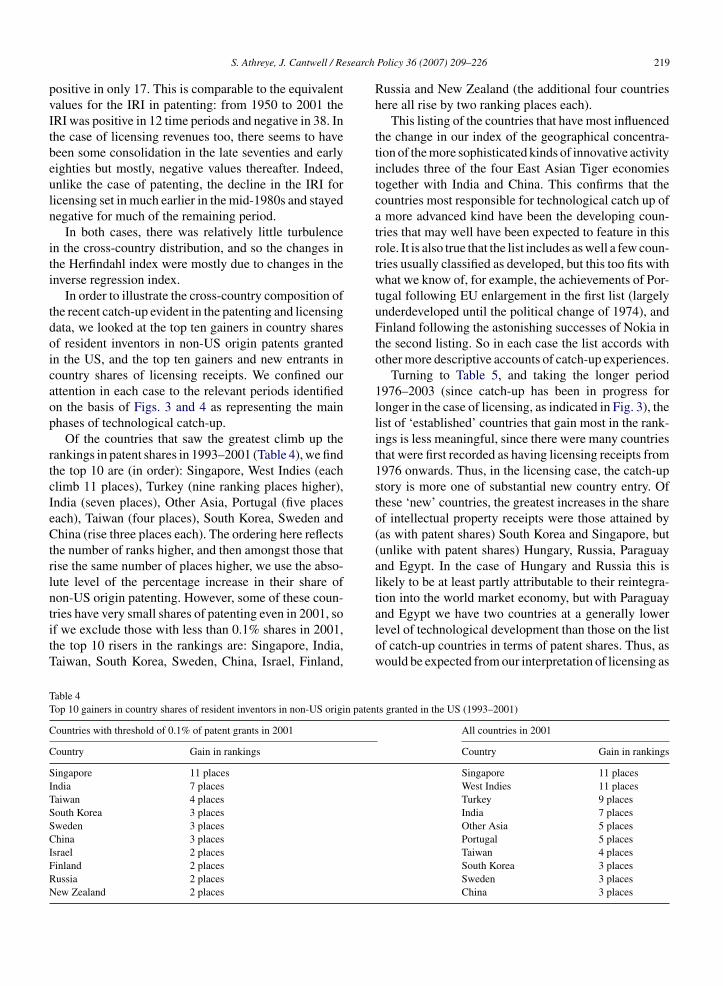
In order to illustrate the cross-country composition ofhe recent catch-up evident in the patenting and licensingata, we looked at the top ten gainers in country sharesf resident inventors in non-US origin patents grantedn the US, and the top ten gainers and new entrants inountry shares of licensing receipts. We confined ourttention in each case to the relevant periods identifiedn the basis of Figs. 3 and 4 as representing the mainhases of technological catch-up.
Of the countries that saw the greatest climb up theankings in patent shares in 1993–2001 (Table 4), we findhe top 10 are (in order): Singapore, West Indies (eachlimb 11 places), Turkey (nine ranking places higher),ndia (seven places), Other Asia, Portugal (five placesach), Taiwan (four places), South Korea, Sweden andhina (rise three places each). The ordering here reflects
he number of ranks higher, and then amongst those thatise the same number of places higher, we use the abso-ute level of the percentage increase in their share ofon-US origin patenting. However, some of these coun-
ries have very small shares of patenting even in 2001, sof we exclude those with less than 0.1% shares in 2001,he top 10 risers in the rankings are: Singapore, India,aiwan, South Korea, Sweden, China, Israel, Finland,able 4op 10 gainers in country shares of resident inventors in non-US origin paten
ountries with threshold of 0.1% of patent grants in 2001
ountry Gain in rankings
ingapore 11 placesndia 7 placesaiwan 4 placesouth Korea 3 placesweden 3 placeshina 3 places
srael 2 placesinland 2 placesussia 2 placesew Zealand 2 places
Policy 36 (2007) 209–226 219
Russia and New Zealand (the additional four countrieshere all rise by two ranking places each).
This listing of the countries that have most influencedthe change in our index of the geographical concentra-tion of the more sophisticated kinds of innovative activityincludes three of the four East Asian Tiger economiestogether with India and China. This confirms that thecountries most responsible for technological catch up ofa more advanced kind have been the developing coun-tries that may well have been expected to feature in thisrole. It is also true that the list includes as well a few coun-tries usually classified as developed, but this too fits withwhat we know of, for example, the achievements of Por-tugal following EU enlargement in the first list (largelyunderdeveloped until the political change of 1974), andFinland following the astonishing successes of Nokia inthe second listing. So in each case the list accords withother more descriptive accounts of catch-up experiences.
Turning to Table 5, and taking the longer period1976–2003 (since catch-up has been in progress forlonger in the case of licensing, as indicated in Fig. 3), thelist of ‘established’ countries that gain most in the rank-ings is less meaningful, since there were many countriesthat were first recorded as having licensing receipts from1976 onwards. Thus, in the licensing case, the catch-upstory is more one of substantial new country entry. Ofthese ‘new’ countries, the greatest increases in the shareof intellectual property receipts were those attained by(as with patent shares) South Korea and Singapore, but(unlike with patent shares) Hungary, Russia, Paraguayand Egypt. In the case of Hungary and Russia this islikely to be at least partly attributable to their reintegra-tion into the world market economy, but with Paraguay
and Egypt we have two countries at a generally lowerlevel of technological development than those on the listof catch-up countries in terms of patent shares. Thus, aswould be expected from our interpretation of licensing asts granted in the US (1993–2001)
All countries in 2001
Country Gain in rankings
Singapore 11 placesWest Indies 11 placesTurkey 9 placesIndia 7 placesOther Asia 5 placesPortugal 5 placesTaiwan 4 placesSouth Korea 3 placesSweden 3 placesChina 3 places

220 S. Athreye, J. Cantwell / Research Policy 36 (2007) 209–226
Table 5Top 10 gainers and new entrants in country shares of licensing receipts (1976–2003)
Countries with threshold of 0.1% of revenues in 2003 All countries in 2003
Country Gain in rankings Country Gain in rankings
Finland 7 places Finland 7 placesIsrael 6 places Israel 6 placesIreland 5 places (from 1970) Ireland 5 places (from 1970)Japan 4 places (from 1977) Japan 4 places (from 1977)Spain 4 places Spain 4 placesSweden, Italy, Australia 1 place Sweden, Italy, Australia 1 place
‘New’ countries Year of entry ‘New’ countries Year of entry
South Korea 1980 Argentina, Barbados, South Korea, Greece,India, Jamaica, Myanmar, Zimbabwe
1976–1980
Hungary 1990 Kenya, Thailand, Netherlands Antilles 1981–1985Singapore 1995 Paraguay, Tunisia, Kenya, Maldives, Cape
Verde, Phillipines, Hungary, Madagascar,Chile
1986–1990
Paraguay 1988 Russia, Singapore, Egypt, Czech Republic,Slovak Republic, Croatia, Poland, Slovenia,Pakistan, Estonia, Latvia, Romania, Peru,Lithuania
1991–1995
Russia 1994 Guyana, Malaysia, Ukraine, Georgia,Bulgaria, Uganda, Macedonia, Belarus,Moldova, Tajikistan, Bangaldesh, Guinea
1996–2003
Egypt 1994Combined licensing share
of new countries2.52% Combined licensing share of new countries 2.96
ears, sontries ad Japan
Notes: (i) Since the coverage of licensing data is not uniform across ythe case we use the nearest data point available to 1976. (ii) ‘New’ couomissions in the WDI licensing dataset is that Taiwan, South Korea an
incorporating a far broader range of innovative activities(including many that can begin at a much lower initiallevel of technological development), we find that it isa wider and more heterogeneous collection of countries(in terms of their levels of development) that are mostresponsible for catch-up in this dimension.
By examining country shares of patenting by disag-gregated fields (derived from the US patent class system),we can also ask which kinds of technologies were mostinvolved in the catch-up of recent years. Looking atthe period since 1980, we find signs of catch-up insome quite traditional technologies that also featuredprominently in the earlier more moderate catch-up ofthe 1950s, also shown in Fig. 3—for example, textiles,chemicals (bleaching and dyeing, and disinfecting), andindustrial machinery.11 To take an example of which sec-
tors and countries are involved, we find that in textiles,clothing and leather, Japan had the single largest shareat 21% of all patents in 1995. However, the combined11 Disturbingly, catch-up is also evident in the areas of nuclear reac-tors and systems and explosives charges and compositions.
me countries do not show revenues in 1976 and 2003. Where this isre those with no receipts (in the WDI data) prior to 1976. (iii) Notable
(until 1976) do not appear as licensor countries.
share of South Korea, Taiwan and Hong Kong was 13%,with countries like India and Israel contributing lessthan 2%.
Cantwell and Vertova (2004) analysed a very longrun of the same USPTO data (1890–1990) to assess therelationship between a country’s size and technologi-cal diversification. They found that although historicallylarge countries tend to be technologically diversified(less specialised) than small countries, in the period1965–1990 all countries (large and small) became moretechnologically specialised in their patent profiles. Aninteresting implication of this tendency toward greatertechnological specialisation is that the spread of sectorswill be smaller for the newest countries capturing patentshares today, in comparison with those then at a similarstage of development that caught up in an earlier phase,although it is beyond the scope of our paper to investigatethis conjecture any further.
4.2. Results of the VAR estimation
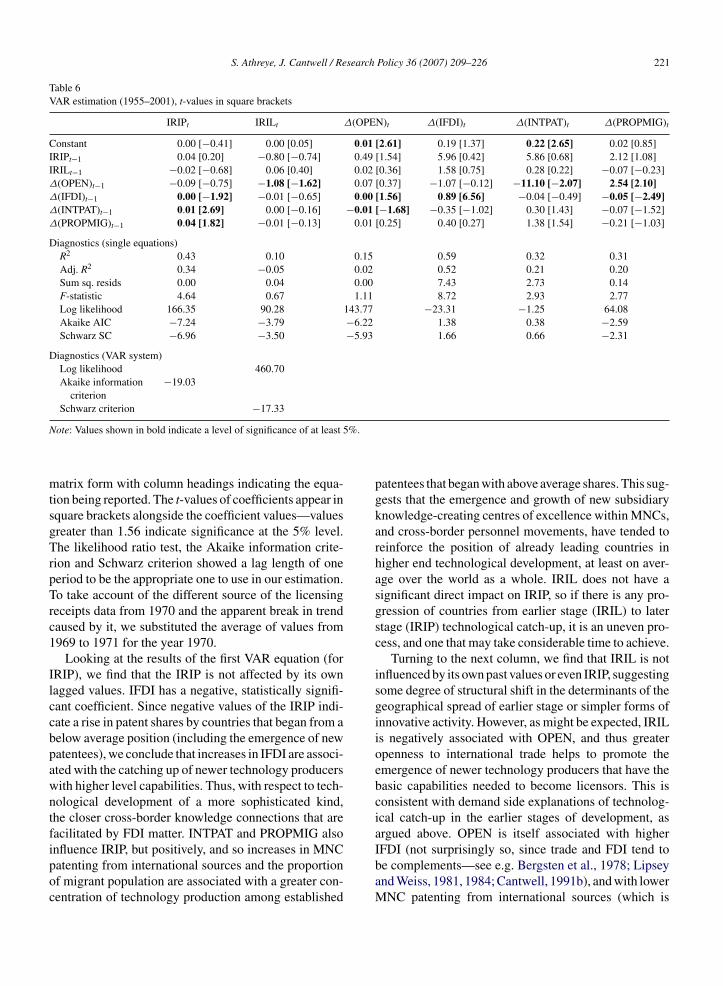
Table 6 reports the results of the VAR estimationsdescribed in Section 3.3. The results are reported in
S. Athreye, J. Cantwell / Research Policy 36 (2007) 209–226 221
Table 6VAR estimation (1955–2001), t-values in square brackets
IRIPt IRILt Δ(OPEN)t Δ(IFDI)t Δ(INTPAT)t Δ(PROPMIG)t
Constant 0.00 [−0.41] 0.00 [0.05] 0.01 [2.61] 0.19 [1.37] 0.22 [2.65] 0.02 [0.85]IRIPt−1 0.04 [0.20] −0.80 [−0.74] 0.49 [1.54] 5.96 [0.42] 5.86 [0.68] 2.12 [1.08]IRILt−1 −0.02 [−0.68] 0.06 [0.40] 0.02 [0.36] 1.58 [0.75] 0.28 [0.22] −0.07 [−0.23]Δ(OPEN)t−1 −0.09 [−0.75] −1.08 [−1.62] 0.07 [0.37] −1.07 [−0.12] −11.10 [−2.07] 2.54 [2.10]Δ(IFDI)t−1 0.00 [−1.92] −0.01 [−0.65] 0.00 [1.56] 0.89 [6.56] −0.04 [−0.49] −0.05 [−2.49]Δ(INTPAT)t−1 0.01 [2.69] 0.00 [−0.16] −0.01 [−1.68] −0.35 [−1.02] 0.30 [1.43] −0.07 [−1.52]Δ(PROPMIG)t−1 0.04 [1.82] −0.01 [−0.13] 0.01 [0.25] 0.40 [0.27] 1.38 [1.54] −0.21 [−1.03]
Diagnostics (single equations)R2 0.43 0.10 0.15 0.59 0.32 0.31Adj. R2 0.34 −0.05 0.02 0.52 0.21 0.20Sum sq. resids 0.00 0.04 0.00 7.43 2.73 0.14F-statistic 4.64 0.67 1.11 8.72 2.93 2.77Log likelihood 166.35 90.28 143.77 −23.31 −1.25 64.08Akaike AIC −7.24 −3.79 −6.22 1.38 0.38 −2.59Schwarz SC −6.96 −3.50 −5.93 1.66 0.66 −2.31
Diagnostics (VAR system)Log likelihood 460.70Akaike information
criterion−19.03
Schwarz criterion −17.33
N 5%.
mtsgTrpTrc1
Ilccbpawntfipoc
ote: Values shown in bold indicate a level of significance of at least
atrix form with column headings indicating the equa-ion being reported. The t-values of coefficients appear inquare brackets alongside the coefficient values—valuesreater than 1.56 indicate significance at the 5% level.he likelihood ratio test, the Akaike information crite-
ion and Schwarz criterion showed a lag length of oneeriod to be the appropriate one to use in our estimation.o take account of the different source of the licensingeceipts data from 1970 and the apparent break in trendaused by it, we substituted the average of values from969 to 1971 for the year 1970.
Looking at the results of the first VAR equation (forRIP), we find that the IRIP is not affected by its ownagged values. IFDI has a negative, statistically signifi-ant coefficient. Since negative values of the IRIP indi-ate a rise in patent shares by countries that began from aelow average position (including the emergence of newatentees), we conclude that increases in IFDI are associ-ted with the catching up of newer technology producersith higher level capabilities. Thus, with respect to tech-ological development of a more sophisticated kind,he closer cross-border knowledge connections that areacilitated by FDI matter. INTPAT and PROPMIG also
nfluence IRIP, but positively, and so increases in MNCatenting from international sources and the proportionf migrant population are associated with a greater con-entration of technology production among establishedpatentees that began with above average shares. This sug-gests that the emergence and growth of new subsidiaryknowledge-creating centres of excellence within MNCs,and cross-border personnel movements, have tended toreinforce the position of already leading countries inhigher end technological development, at least on aver-age over the world as a whole. IRIL does not have asignificant direct impact on IRIP, so if there is any pro-gression of countries from earlier stage (IRIL) to laterstage (IRIP) technological catch-up, it is an uneven pro-cess, and one that may take considerable time to achieve.
Turning to the next column, we find that IRIL is notinfluenced by its own past values or even IRIP, suggestingsome degree of structural shift in the determinants of thegeographical spread of earlier stage or simpler forms ofinnovative activity. However, as might be expected, IRILis negatively associated with OPEN, and thus greateropenness to international trade helps to promote theemergence of newer technology producers that have thebasic capabilities needed to become licensors. This isconsistent with demand side explanations of technolog-ical catch-up in the earlier stages of development, asargued above. OPEN is itself associated with higher
IFDI (not surprisingly so, since trade and FDI tend tobe complements—see e.g. Bergsten et al., 1978; Lipseyand Weiss, 1981, 1984; Cantwell, 1991b), and with lowerMNC patenting from international sources (which is
search
222 S. Athreye, J. Cantwell / Reconsistent with the internalisation argument that highertransaction costs in markets lead to a replacement of sub-contracting linkages by internal knowledge-generatingcapacity within MNCs—see e.g. Buckley and Casson,1976). IFDI is influenced by its own past values aswould surely be expected of an accumulated stock, whilstPROPMIG is naturally influenced by both OPEN andIFDI. INTPAT is negatively associated with OPEN, onwhich we have just commented the other way round,and so we will return to in our assessment of Grangercausality below.
Some of these results accord with what has beenobserved in other cross-country studies. Studies of theFour Dragons and Japan for example, showed the role ofopenness and foreign-owned firms in technology acqui-sition and the technological capability building process(Hobday, 1995). The results on licensing suggest thatwith basic capabilities openness to trade is more impor-tant than the attraction of FDI. In the earlier stages ofdevelopment international business linkages can takea variety of forms (such as the export of componentsto MNC networks under subcontracting agreements).This is also consistent with the view that the opportu-nities offered by the growth of technology trade haveopened up a new potential amongst certain countries totake advantage of some established capabilities throughknowledge service provision that need not be tied to FDInetworks. Put differently, the growing division of inno-
vative labour between countries may be based as muchupon a widening of the kinds of comparative advantageof nations that are relevant to knowledge provision, asit is upon the availability of new technological oppor-Table 7VAR Granger causality (Wald) tests
Dependent variable: IRIP IRIL
Excluded χ2 d.f. Probability Excluded χ2
IRIL 0.46 1 0.50 IRIP 0.55Δ(OPEN) 0.56 1 0.45 Δ(OPEN) 2.62Δ(IFDI) 3.70 1 0.05 Δ(IFDI) 0.43Δ(INTPAT) 7.23 1 0.01 Δ(INTPAT) 0.03Δ(PROPMIG) 3.32 1 0.07 Δ(PROPMIG) 0.02
All 15.12 5 0.01 All 4.02Δ(IFDI) Δ(INTPAT)IRIP 0.17 1 0.68 IRIP 0.46IRIL 0.56 1 0.45 IRIL 0.05Δ(OPEN) 0.02 1 0.90 Δ(OPEN) 4.29Δ(INTPAT) 1.04 1 0.31 Δ(IFDI) 0.24Δ(PROPMIG) 0.07 1 0.79 Δ(PROPMIG) 2.39
All 2.19 5 0.82 All 6.37
Policy 36 (2007) 209–226
tunities as such. Secondly, as we noted earlier licensingis more sensitive to local institutional and governancefactors. These factors exercise less influence on patent-ing through the USPTO. The aggregated measures forthe world economy effects that we use in this analysisare not able pick up separate individual country levelprocesses.
4.3. Assessing Granger causality
We turn now to the Granger causality tests that arereported in Table 7. Wald statistics are shown againsteach variable along the columns and the level of signifi-cance is indicated by the probability. The results for IRIPshow that IFDI, INTPAT and PROPMIG Granger causeschanges in the IRIP. This reinforces the argument abovethat the international knowledge connections providedby FDI tend to precede and thus to facilitate catching upat higher levels of technological sophistication. Further-more, we cannot reject the hypothesis that the influenceof the globalisation variables jointly is equal to zero,i.e. they are jointly relevant to predicting the emergenceof new patentees. In other words, we might infer thatFDI tends to promote technological catch-up of a moreadvanced kind especially when it connects more withexternal networks of independent actors that are mainlyindigenous to the host economies that receive FDI, asopposed to relying more just upon its own international
network (the cross-border movement of technologicalresources and people mainly within or into MNCs). Incontrast, IRIL is not influenced individually or jointlyby any of the globalisation variables. Thus, earlier stageΔ(OPEN)
d.f. Probability Excluded χ2 d.f. Probability
1 0.46 IRIP 2.37 1 0.121 0.11 IRIL 0.13 1 0.721 0.51 Δ(IFDI) 2.43 1 0.121 0.87 Δ(INTPAT) 2.84 1 0.091 0.90 Δ(PROPMIG) 0.06 1 0.80
5 0.55 All 5.06 5 0.41Δ(PROPMIG)
1 0.50 IRIP 1.17 1 0.281 0.82 IRIL 0.06 1 0.811 0.04 Δ(OPEN) 4.40 1 0.041 0.63 Δ(IFDI) 6.22 1 0.011 0.12 Δ(INTPAT) 2.30 1 0.13
5 0.27 All 16.59 5 0.01
search
todme
wGctrtgweteoaPvaI
cdaocaalteonocccttOatcttstrr
S. Athreye, J. Cantwell / Re
echnological catch-up, while positively associated withpenness (from Table 6 above), need not be strictlyependent upon it (see Table 7), but may be set inotion mainly by a virtuous local cycle of indigenous
fforts.Turning now to the effects on globalisation variables
e find that INTPAT Granger causes OPEN, and OPENranger causes INTPAT. Thus, there is bi-directional
ausality between these two variables, which implieshat just as constraints on trade may induce MNCs toely more on internal knowledge creation as opposed tohat of their partners, suppliers or subcontractors, so tooreater local subsidiary creativity tends to be associatedith increased embeddedness in networks in the local
nvironment (Andersson et al., 2002), which may leado some replacement of trade by local transactions. How-ver, FDI is not influenced by the values of any of thether variables, but it promotes on average trade (Lipseynd Weiss, 1981) and movements of people. Indeed,ROPMIG is influenced by all the other globalisationariables. There is no suggestion, however, that the glob-lisation variables are themselves caused by changes inRIL and IRIP.
As we noted earlier, Granger causality interpretsausality in a narrow way as a matter of statistical prece-ence. Yet we feel our results may be consistent withn interpretation of economic causality since both ofur main findings with respect to IRIP and INTPAT areonsistent with the observation made by many schol-rs that inward FDI seeks global sources of competitivedvantage and will be drawn to regions of establishedocational advantage (Dunning, 1993; Lall, 2001). Fur-hermore, although periods of globalisation in the worldconomy have also always thrown up new technol-gy producers—these have often been relatively fewew countries. These observations are consistent withur findings that on average across a broad range ofountries, FDI promotes technological catch-up amongstountries that have already acquired sufficient absorptiveapacity for higher order types of innovative activity toake off locally; but that it tends to have on average lit-le impact on catch-up in earlier stages of development.ur results also suggest that on average the internation-
lisation of research within the largest MNCs has tendedo reinforce the positions of (and the knowledge inter-onnectedness between) the more established centres ofechnology creation. However, other more informal insti-utional channels for international business connections,
uch as trade, subcontracting, licensing, and especiallyhe growth of so-called technology markets, have inecent years facilitated the catch-up of a somewhat widerange of newer technology producers.Policy 36 (2007) 209–226 223
5. Summary and conclusions
In this paper we use measures of technological catch-up in the world economy to try and assess what periodsof catch-up there have been, as well as to assess to whatextent globalisation causes changes in catch-up. Thesetrends differ depending upon whether we look at the geo-graphical dispersal of the more sophisticated capabilitiesassociated with patent shares or the wider range of capa-bilities reflected by licensing (receipt) shares. Patentingshows evidence of technological catch-up of a moresophisticated kind in the 1950s and 1960s and againin the period 1992–2001. However, licensing receiptsshow a secular trend towards the emergence of new coun-tries starting from the mid-1980s onwards and gatheringspeed in the 1990s. We speculate that this trend maybe related to the new opportunities for niche strategiesconnected with the increasing importance of knowledge-intensive services since the 1980s, which have beennoted by several scholars (such as Arora et al., 2001).
Studying the impact of globalisation in explaining theemergence of newer producers of technology we againfind distinct results for the different types of techno-logical efforts associated with patenting and licensing(receipt) shares. In the case of patenting we find evi-dence that inward FDI matters for the catch-up of newertechnology producers with the higher level capabilitiesneeded. MNC patenting from international sources andinternational migration also matter—but they promotegreater concentration of patent shares by tending to rein-force the status of established centres of excellence, andso on average they constrain the incidence of higher lev-els of technological catch-up across countries. The resulton the effects of international migration in concentratingtechnology production is interesting as the examples ofTaiwan, Ireland, Israel and India have often been used tosuggest the advantages of diasporic migration throughethnic knowledge networks in research-based sectors.The aggregate results of this paper – perhaps more microdisaggregated evidence that separates out different coun-try effects would be necessary – do not suggest any roleon average for diasporas, although of course, our mea-sure of international migration is crude in that our datado not distinguish between the migration of technicallyskilled versus unskilled people.
Looking at licensing shares, however, the influencethat we have observed running from greater opennessin the world economy to the emergence and catch-up of
newer countries as licensees does not appear to be robust,as it holds only in our VAR analysis and not in the tests ofGranger causality. This disparity suggests that increasesin openness have themselves been associated with the
search
are attributable to all non-US inventors. These data areavailable at the USPTO web-site and updated yearly.
The share of licensing revenues was calculated by
224 S. Athreye, J. Cantwell / Re
emergence and growth of at least basic technologicalgenerating capacity in some developing countries, whichmay well have helped lead them to be better disposedtowards greater openness in trade.
The implication of our findings on FDI is that FDI isnot on average across countries a key development toolin the initial stages of technological capability devel-opment, but it begins to play a role only in later, moreadvanced stages. Purposeful technological efforts, suchas private sector R&D, and conducive government poli-cies may play a central role in basic development and thesubsequent upgrading of technological activity in partic-ular countries, as revealed by notable Asian experiences(e.g. South Korea, Singapore, and modern China) butthey are not captured by the globalisation variables wemeasure.
Lastly, despite the lack of any clear causal directionin the effect of changes in the openness of the worldeconomy on the emergence and growth of lower levelnewer technology producers, we do find that opennessinfluences two other variables of globalisation, namelyinternational migration (positively) and the internation-alisation of research in MNCs (inversely). More openperiods are also periods of higher international migra-tion. However, a reduction in openness in the worldeconomy predicts an increase in the extent of MNCpatenting from international sources, and perhaps fromnew locations (and vice versa), since more the intenselocal network linkages associated with greater subsidiaryembeddedness to some extent substitutes for interna-tional trade connections. Yet both greater internationalmigration and the international dispersal of technolog-ical creativity within MNCs tend in turn to imply thenet consolidation of technological knowledge creationof the more sophisticated kind in fewer countries, albeitby means of drawing upon resources from outside theestablished home bases of the largest MNCs, althoughprobably still on average in other established centres ofexcellence.
Our results are also suggestive of a general patternin the linkages between globalisation and technologicalcatch-up that may not be true of all countries at all times,but which has been observed on average in the post-war period. That is, in the earlier stages of capabilitydevelopment, catch-up relies mainly on a localised andindigenous learning that is not closely interconnectedwith current knowledge creation elsewhere in the world,and so does not rely on prior FDI. In this earlier phase
of development general openness on the demand side inthe form of connections through trade and the availabil-ity of intellectual property markets is a more importantinfluence upon the potential for catch-up.Policy 36 (2007) 209–226
However, once basic capabilities are formed, loca-tions can begin to act as creative nodes within globalproduction networks, initially more commonly throughtrade and subcontracting linkages, rather than throughFDI. Yet when the scope of international trade andsubcontracting networks are reduced, the role of localsubsidiaries in knowledge-creating nodes is likely to beincreased. That is, the wider dispersion of knowledge-generating capabilities by multinational firms comes totake advantage of new potential sources of ideas andbegins to integrate them more fully into their interna-tional corporate networks. The tendency for increases inthe international spread of subsidiary research efforts inMNCs to reinforce on average the position of establishedcentres of higher grade technological activity, may bedue to the increased intensity of knowledge exchangesbetween the key actors within local networks as sub-sidiaries become more technologically creative. Indeed,when moving on to the higher levels of technologicaldevelopment needed for the later stages of catch-up, theadequacy of local supply side infrastructure becomescritical, and participation in the international intercon-nectedness of knowledge networks provided by MNCsthrough FDI is more likely to be a precondition for catch-up.
Acknowledgements
We are grateful to the Open University for a smallgrant, which helped to collate the data required for thepaper. We thank Elena Stassiouk and Nevena Yakova fortimely research assistance and Ron Smith for guidance.Suma Athreye would also like to thank the Centre forNew and Emerging Markets at London Business Schoolfor providing a stimulating intellectual environment dur-ing her work on this paper.
Appendix A. Data definitions and sources12
We use two measures of the IRI index as the depen-dent variable: the first computed over patent shares andthe second computed over shares of licensing revenues.
The patent shares we use are the share of each coun-try in the patents issued every year by the USPTO that
collating information from two sources. For the period
12 Except where otherwise indicated all web-based sources were lastdownloaded in March 2005.
search
1yltdcwherCct
sde
aaW(=ctssyDtWsybc
adaaIvcC
bfiia(e1
S. Athreye, J. Cantwell / Re
950–1969, we consulted The IMF balance of paymentsearbook (various years), which reports royalty andicensing fees in current USD by country. From 1970o 2001, we used the World Development Indicatorsatabase that collates royalty and licensing revenues inurrent USD separately for each country (http://www.orldbank.org/data/onlinedatabases/onlinedatabases.tml). Data for the total licensing revenues for the worldconomy were calculated by summing up licensingevenues by each country for the period 1950–1969.ountry shares of world licensing revenues were thenomputed by dividing each country’s revenue by theotal for the world economy in any year.
The explanatory variables were collated from diverseources. The openness index has been computed usingata contained in the Penn World Tables (http://pwt.con.upenn.edu/).
Inward FDI stocks in current USD by country andggregated for the world economy were available inconsistent way for the period 1980–2001, from theorld Investment Report (2004) published by UNCTAD
http://www.unctad.org/Templates/Page.asp?intItemID1890&lang=1). For earlier years (1950–1979) weonstructed the Inward FDI stock by extrapolating onhe basis of available Inward FDI flow data for theame period and utilizing Inward FDI stock data foreveral benchmark years that were available. For theears 1950, 1960, 1967 and 1973 we used the data inunning (1993: Chapter 5), and for 1966 and 1971
he estimates reported in UNCTC (1973). MNCs inorld Development. We estimated the end of year
tocks in all the intervening years between benchmarkears by proportioning the overall change in stocksetween years in line with the proportioning of the totalumulative flow.
Inward FDI flow data for 1970–1979 are avail-ble from UNCTAD Handbook of Statistics (onlineatabase). Where Inward FDI flows were not avail-ble (1950–1964), World total Inward FDI flows weressumed equal to the sum of the US and UK outflows.nward FDI flow data for the period 1965–1969 is pro-ided by UNCTC (1973). Inward FDI stock data byountry for the year 1975 was estimated in Dunning andantwell (1987).
The proportion of international patents was computedy identifying the patents held by large foreign-ownedrms that were attributable to subsidiary sources of
nvention outside their respective home countries. We
ggregated these data, available by host country and year1950–1995), to create a measure of the number of for-ign held patents in the world economy. For the period996–2001 we used the 1995 values.Policy 36 (2007) 209–226 225
International migration data were available by coun-try for 5-year intervals from the UN Common databasedownloadable from (http://unstats.un.org/unsd/cdb/cdb help/cdb quick start.asp). The figure for net migra-tion refers to the net average annual number of migrants,that is, the annual number of immigrants less the annualnumber of emigrants, including both citizens and non-citizens. Migration as percentage of total populationwas calculated by utilizing population data from theWorld Population Prospects, published by UN Popu-lation division and available online at (http://esa.un.org/unpp/).
References
Abramovitz, M., 1991. Thinking About Growth and Other Essayson Economic Growth and Welfare. Cambridge University Press,Cambridge and New York.
Andersson, U., Forsgren, M., Holm, U., 2002. The strategic impactof external networks: subsidiary performance and competencedevelopment in multinational corporations. Strategic ManagementJournal 23 (11), 979–996.
Antonelli, C., 1998. Localized technological change, new informa-tion technology and the knowledge-based economy: the Europeanevidence. Journal of Evolutionary Economics 8, 177–198.
Archibugi, D., 1992. Patenting as an indicator of technological inno-vation: a review. Science and Public Policy 19, 357–368.
Archibugi, D., Coco, A., 2001. The technological performance ofEurope in a global setting. Industry and Innovation 8 (3), 245–266.
Archibugi, D., Iammarino, S., 2002. The globalization of technolog-ical innovation: definition and evidence. Review of InternationalPolitical Economy 9 (1), 98–122.
Arora, A., Gambardella, A., 2005. From Underdogs to Tigers: TheRise and Growth of the Software Industry in Brazil, China, India,Ireland, and Israel. Oxford University Press, Oxford.
Arora, A., Fosfuri, A., Gambardella, A., 2001. Markets for Technology.MIT Press, Cambridge, Mass.
Athreye, S., 1998. On markets in knowledge. Journal of Managementand Governance 1 (2), 231–253.
Beausang, F. (2004) Outsourcing and the Internationalization of Inno-vation, Working Paper 18, The American University of Paris, Paris.
Bergsten, C.F., Horst, T., Moran, T.H., 1978. American Multinationalsand American Interests. Brookings Institution, Washington, DC.
Birkinshaw, J., Hood, N., Jonsson, S., 1998. Building firm-specificadvantages in multinational corporations: the role of subsidiaryinitiative. Strategic Management Journal 19 (3), 221–241.
Breschi, S., Lissoni, F., 2001. Knowledge spillovers and local innova-tion systems: a critical survey. Industrial and Corporate Change 10(4), 975–1075.
Bresnahan, T., Gambardella, A., 2004. Building High Tech Clusters:Silicon Valley and Beyond. Cambridge University Press, Cam-bridge.
Buckley, P.J., Casson, M.C., 1976. The Future of the MultinationalEnterprise. Macmillan, London.
Cantwell, J.A., 1991a. The international agglomeration of R&D. In:
Casson, M.C. (Ed.), Global Research Strategy and InternationalCompetitiveness. Basil Blackwell, Oxford.Cantwell, J.A., 1991b. The relationship between international trade andinternational production. In: Greenaway, D., Winters, L.A. (Eds.),Surveys in International Trade. Basil Blackwell, Oxford.

search
Verspagen, B., 1991. A new empirical approach to catching up orfalling behind. Structural Change and Economic Dynamics 2,
226 S. Athreye, J. Cantwell / Re
Cantwell, J.A., 1995. The globalisation of technology: what remainsof the product cycle model? Cambridge Journal of Economics 19(1), 155–174.
Cantwell, J.A., Mudambi, R., 2005. MNE competence-creatingsubsidiary mandates. Strategic Management Journal 26 (12),1109–1128.
Cantwell, J.A., Vertova, G., 2004. Historical evolution of technologicaldiversification. Research Policy 33 (3), 511–529.
Cooke, P., 2001. Regional innovation systems, clusters, and the knowl-edge economy. Industrial and Corporate Change 10 (4), 945–974.
Dunning, J.H., 1993. Multinational Enterprises and the Global Econ-omy. Addison Wesley, Wokingham.
Dunning, J.H., 1996. The geographic sources of the competitivenessof firms: some results of a new survey. Transnational Corporations5, 1–29.
Dunning, J.H., Cantwell, J.A., 1987. The IRM Directory of Statisticsof International Investment and Production. Macmillan, London.
Ernst, D., 2002. Global production networks and the changing geogra-phy of innovation systems: implications for developing countries.Economics of Innovation and New Technology 11 (6), 497–523.
Ernst, D., Kim, L., 2002. Global production networks, knowledge dif-fusion and local capability formation. Research Policy 31 (8–9),1417–1429.
Fagerberg, J., 1994. Technology and international differences in growthrates. Journal of Economic Literature 32, 1147–1175.
Florida, R., 2002. The economic geography of talent. Annals of theAssociation of American Geographers 92 (4), 743–755.
Foray, D., Lundvall, B.A. (Eds.), 1996. Employment and Growth inthe Knowledge-Based Economy. OECD, Paris.
Freeman, C., 1987. Technology Policy and Economic Performance:Lessons from Japan. Frances Pinter, London.
Gomroy, R., Baumol, W., 2000. Global Trade and Conflicting NationalInterests. MIT Press, Cambridge, Mass.
Griliches, Z., 1990. Patent statistics as economic indicators: a survey.Journal of Economic Literature 28 (4), 1661–1707.
Hobday, M., 1995. Innovation in East Asia: The Challenge to Japan.Edward Elgar, Aldershot.
Khambampati, U. Kattuman, P. (2003): Growth Response to Compet-itive Shocks—Market Structure Dynamics under Liberalization:The Case of India’, Working Paper No. 263, ESRC Centre forBusiness Research, University of Cambridge.
Kumar, S., Russell, R.R., 2002. Technological change, technologicalcatch-up and capital deepening: relative contributions to growthand convergence. American Economic Review 92, 527–548.
Lall, S., 2001. Competitiveness, Technology and Skills. Edward Elgar,Cheltenham.
Lipsey, R.E., Weiss, M.Y., 1981. Foreign production and exports inmanufacturing industries. Review of Economics and Statistics 63,488–494.
Policy 36 (2007) 209–226
Lipsey, R.E., Weiss, M.Y., 1984. Foreign production and exports ofindividual firms. Review of Economics and Statistics 66, 304–308.
Makino, S., Lau, C.-M., Yeh, R.-S., 2002. Asset exploitation versusasset seeking: implications for location choice of foreign directinvestment from newly industrialised economies. Journal of Inter-national Business Studies 33, 403–421.
Narula, R., Dunning, J., 2000. Industrial development, globalisationand multinational enterprises: new realities for developing coun-tries. Oxford Development Studies 28, 141–167.
Nelson, R.R. (Ed.), 1993. National Innovation Systems. Oxford Uni-versity Press, Oxford and New York.
Pasinetti, L.L., 1981. Structural Change and Economic Growth: ATheoretical Essay on the Dynamics of the Wealth of Nations.Cambridge University Press, Cambridge and New York.
Pavitt, K.L.R., 1985. Patent statistics as indicators of innovative activ-ities: possibilities and problems. Scientometrics 7, 77–99.
Pavitt, K.L.R., 1988. Uses and abuses of patent statistics. In: van Raan,A.F.J. (Ed.), Handbook of Quantitative Studies of Science andTechnology. Elsevier Science Publishers, Amsterdam.
Pearce, R.D., 1999. The evolution of technology in multinational enter-prises: the role of creative subsidiaries. International BusinessReview 8, 125–148.
Romer, P., 1990. Endogenous technological change. Journal of Politi-cal Economy 98, 1002–1037.
Samuelson, P.A., 2004. Where Ricardo and Smith rebut and confirmthe arguments of mainstream economists supporting globalisation.Journal of Economic Perspectives 18 (3), 135–146.
Schmookler, J., 1950. The interpretation of patent statistics. Journal ofthe Patent Office Society 32, 123–146.
Schmookler, J., 1966. Inventions and Economic Growth. Harvard Uni-versity Press, Cambridge, Mass.
Soete, L.L.G., Wyatt, S.M.E., 1983. The use of foreign patenting as aninternationally comparable science and technology output indica-tor. Scientometrics 5 (1), 31–54.
Storper, M., 1997. The Regional World: Territorial Development in aGlobal Economy. Guildford Press, New York.
UNCTC, 1973. MNCs in World Development. United Nations Con-ference on Trade and Commerce, New York.
Vernon, R., 1966. International investment and international trade inthe product cycle. Quarterly Journal of Economics 80 (2), 190–207.
359–380.Wesson, T., 2005. Foreign Direct Investment and Competitive Advan-
tage. Edward Elgar, Cheltenham.