creating and sustaining process improvement: applying lean
TRANSCRIPT

1
Creating and Sustaining Process Improvement: Applying Lean & Six-Sigma Tools and Change Management to Achieve
Organizational SuccessPreconference Workshop, February 11, 2019
Larry Dux, Mary Ellen Skeens, Deborah D. Flint, Dean Athanassiades, John Hansmann, Brian Compas

2
Thank You to Our Conference Collaborator
2

3
Overview of Healthcare Industry Changes
Introduction of Lean & Six-Sigma and Change Management Approaches
Larry Dux, BSIE, MBA, CPHIMS, LFHIMSS, DSHS, Director, Patient Care Informatics & Process Improvement, Froedtert & The Medical College of Wisconsin Community Hospital Division

4
Conflict of InterestAll of the speakers have no real or apparent conflicts of interest to report.
4

5
Agenda• Welcome and Introductions• Overview of Healthcare Industry Changes • Introduction of Lean & Six-Sigma and Change
Management Approaches• Strategic Alignment and Problem Definition • Part 1: Using Value Stream Maps and Flowcharts• Lunch – Networking and Discussion of Challenges &
Applications
5
6
Agenda - continued• Part 2: Using Value Stream Maps and Flowcharts• Using 5 Why Analysis • Using Data Collection and Display Tools• Generating and Evaluating Solutions • Defining Standard Work and Using Control Charts• Summary Wrap-Up
6

7
Learning Objectives• Describe key healthcare industry changes driving strategic
process improvement initiatives• Define and clarify the scope of the problem to be solved• Use the appropriate measures to assess organizational
performance from a strategic perspective• Apply and use Lean & Six-Sigma tools to achieve desired
organizational performance• Employ change management practices to sustain process
improvements
7

8
• Dean Athanassiades, MBA, PMP, CPHIMS, FHIMSS, DSHS, Senior Director, Service Transformation Program Office, Philips
• Brian Compas, PMP, LFHIMSS, Senior Project Manager, Independent Consultant
• Larry Dux, BSIE, MBA, CPHIMS, LFHIMSS, DSHS, Director, Patient Care Informatics & Process Improvement, Froedtert & The Medical College of Wisconsin Community Hospital Division
Welcome and Introductions
8

9
• Deborah D. Flint, PE, MBA, MSHQS, FHIMSS, DSHS, LSSBB, Sr. Director, Performance Engineering, UAB Medicine: The Kirklin Clinic of UAB Hospital
• John Hansmann, MSIE, LFHIMSS, DSHS, Vice President, Professional Services, Health Catalyst
• Mary Ellen Skeens, PMP, CPHIMS, FHIMSS, CSSBB, DSHS, Director, Solutions and Services Management Office, Philips
Welcome and Introductions
9

10
• New Company being started today • Need 5 Workers and 1 Quality Assurance Specialist • Paying Top Wages with Bonus for High Performance
• Need Observers of the Workers• Need Observers of the Manager
Deming Red Bead Exercise
10

11
• Observers – What observations do you have of the workers? manager?
• Workers – What did you feel? What were you thinking about the work
environment and the manager? • What can we learn from this exercise?• How does this exercise apply to this workshop today?
Deming Red Bead Exercise - Debrief
11

12
Healthcare in the Headlines
12

13
Healthcare in the Headlines
13

14
Definitions – Lean
• “A way to specify value, line up value creating actions in the best sequence, conduct these activities without interruption whenever someone requests them, and perform them more and more effectively.”
from Lean Thinking, by James Womack and Daniel Jones (1996)
• Lean thinking begins with driving out waste so that all work adds value and serves the customer's needs. Identifying value-added and non-value-added steps in every process is the beginning of the journey toward lean operations.
http://www.ihi.org/knowledge/Pages/IHIWhitePapers/GoingLeaninHealthCare
14

15
Definitions Lean Six Sigma
• Lean Six Sigma is a business process philosophy that focuses on the customer and increasing value and improving quality, safety and productivity. Both Lean and Six Sigma have their weaknesses and their strengths.
• For example, Six Sigma will eliminate defects but will not address speed or optimize flow. Lean does not include the advanced statistical tools required to identify the sources of variation necessary to craft an intervention that is as simple and as focused as possible.
15

16
Definitions Lean Six Sigma
• Recognizing the complementary nature of the two methodologies, many companies have used Lean and Six Sigma concurrently, utilizing different pieces of the tool kit to address specific improvement problems along a value stream. This practice of combining different tool sets and playing to strengths is sometimes called the "blended approach." The Center for Transforming Healthcare uses the Lean Six Sigma blended approach.
Source: https://www.centerfortransforminghealthcare.org/about/rpi.aspx 16

17
• Defects: mistakes, rework, errors
• Overproduction: doing more than is required
• Waiting: waiting on people or supplies
• Not Utilizing Staff Talent: not maximizing ability and potential of all staff
Waste – What is it?
17

18
Waste – What is it?
• Travel: moving patients, files, equipment
• Inventory: stockpiling supplies
• Motion: leaving the patient room to search for supplies
• Excess Processing: redundant capture of information, inspection, any unnecessary steps
18

1919

20
• Fundamentally, the process of successful lean transformation rests on applying PDCA cycles of experimentation (the art and craft of science) at every level, everywhere, all the time. Being situational means that every story is going to be specific and different (each situation has a different aim or purpose). Being grounded in a common set of principles yet situational in application provides rich opportunity for the development of truly profound wisdom. Lean thinking and practice also propose a specific point of view around each question. We believe that there are certain approaches to answering each of the 5 questions that will yield greater success in your lean journey.
Questions of the Lean Transformation Framework
20

21
Lean Framework • Purpose, Process, People
Womack and Jones recommend that managers and executives embarked on lean transformations think about three fundamental business issues that should guide the transformation of the entire organization:
• Purpose: What customer problems will the enterprise solve to achieve its own purpose of prospering?
• Process: How will the organization assess each major value stream to make sure each step is valuable, capable, available, adequate, flexible, and that all the steps are linked by flow, pull, and leveling?
• People: How can the organization ensure that every important process has someone responsible for continually evaluating that value stream in terms of business purpose and lean process? How can everyone touching the value stream be actively engaged in operating it correctly and continually improving it?
21

22
Strategic Alignment
• The Right Projects: The success of performance improvement programs is rooted in the projects selected. Unfortunately, many organizations fail to develop criteria for project selection, which results in projects that provide no real benefit to the organization. If employees aren’t working on the right projects, it doesn’t matter how well the projects are run – the results just won’t make a difference. Thus, the “right” projects should be linked to organizational strategies, have identifiable and quantifiable hard results, and be realistic in scope.
22

23
Symptoms of a Broken Process • Customers (internal or external) are unhappy• Some things just take too long• The process wasn’t done right the first time
– It produced errors, rework, mistakes, missing, incomplete or incorrect information
• Management throws people at the problem but it doesn’t improve• Employees report a high frustration factor while working• Process spans several departments and there is finger-pointing
and blaming
23

24
Symptoms of a Broken Process • Processes aren’t measured or controlled• Inventory, buffers and other assets sit idle• Data redundancy is common• Too many reviews and signoffs• Complexity, exceptions and special cases are common• Established procedures are circumvented to expedite work• No one manages the total process• Management throws money at the problem, but it doesn’t improve• Managers spend a great deal of time “firefighting”
24

25
• One of the important advantages of using process improvement tools such as DMAIC (define, measure, analyze, improve, control) is that they provide a systematic approach to solving complex problems. Specifically, they guide improvement teams to examine why processes fail to achieve their desired results. It is this systematic search for causes of quality and safety problems and the assessment of the relative contribution of each cause that gives these improvement tools a great deal of their effectiveness. Experience with the application of the tools of Robust Process Improvement® in health care is consistent with that of other industries including aerospace, automotive, construction, electronics and more.
Why Lean Six Sigma Approaches?
25

26
Why Lean Six Sigma Approaches?
• The collaborating organizations in the Center’s network have a great deal of experience using RPI® methods and tools, such as Lean Six Sigma and change management, in the health care environment. Currently, the lack of convincing data is a key weakness in the effort to improve safety and quality. Because Lean Six Sigma projects are driven by highly reliable measurements, they provide an ideal source of data on the ultimate impact of the solution.
26
27
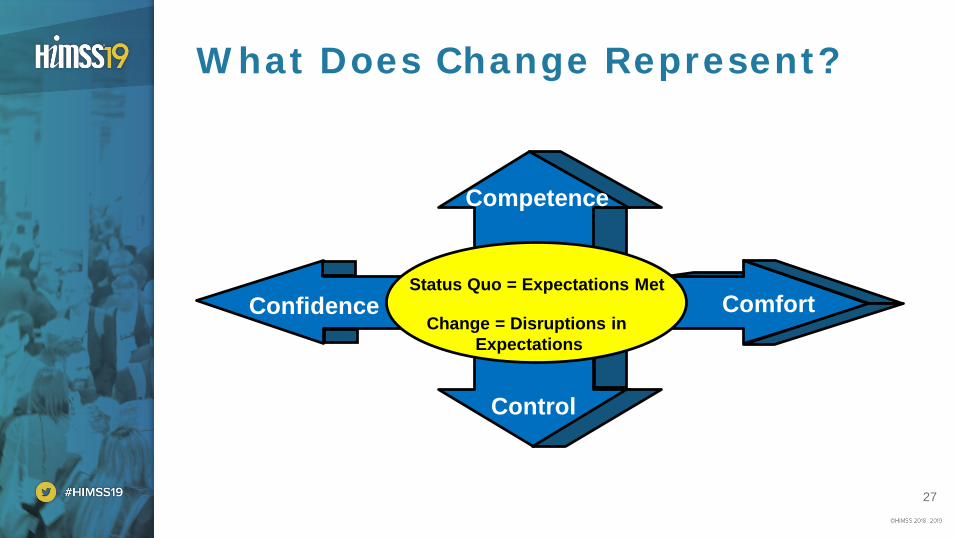
Competence
Comfort
Control
ConfidenceStatus Quo = Expectations Met
Change = Disruptions in Expectations
What Does Change Represent?
27

28
Phases of Personal Change
•Anger
•Denial
•Grieving
•Sense of Loss
•Uncertainty
•Disorientation
•Anxiety
•Self-doubt
•Anticipation
•Excitement
•Energy
•Enthusiasm
EndingsLetting go of
the past
TransitionSearching for a new direction
Beginnings
Setting off in the new direction
28

29
• Change is what happens to us - It is external to us
• Transition is internal – It is how we react to change
• The trick is to harness change and transition in order to learn, grow and reap the positive benefits of the many changes that will happen to us
Change vs. Transition
29

30
Reactions to Change
Negative Positive
• A sense of loss
• Threat to job security, satisfaction, prospects
• Fear of loss of control
• Uncertainty, insecurity
• Mistrust of management motives
• Expectation that “this too will pass”
• Perceived flaws in the approach
• Opportunity to make a difference
• Buy-in to the goal• Challenge• Prospect of personal
benefit (e.g. job satisfaction)
• Dissatisfaction with the status quo
30

31
• Change triggers our emotions• Change is stressful• We hate the loss of control and uncertainty• It takes time to adapt• Although we seek positive change, we object to
being changed
Personal Experience of Change
But, you must transition in order to learn and grow31

32
• Adaptation to change is not automatic• The internal process is not synchronized with
external events• Dealing with resistance versus helping people
through change
Personal Experience of Change
32

33
Models for Change – Lewin©
33
34
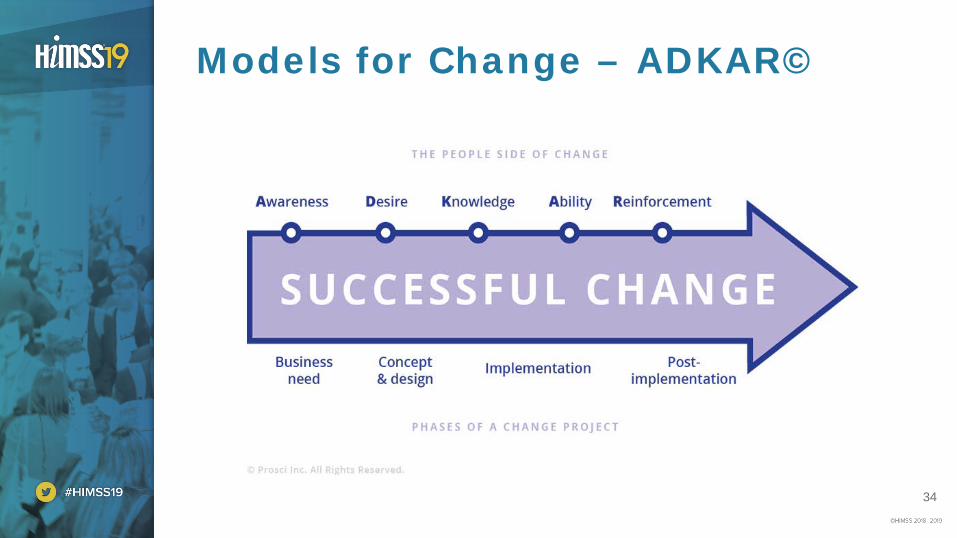
Models for Change – ADKAR©
34

35
Models for Change – Kotter ©
35

36
• Resistance is actually healthy; try not to react against it defensively
• It is good for you: it makes you check your assumptions
• It forces you to clarify what you are doing
Understanding Resistance
36
37
• Support from leadership– Consistent engagement with sustainment
– Taking ownership of the change
– Leading by example
– Providing required resources
Sustaining the Change
37

38
• Measuring Process/Progress– Define metrics at the beginning
– Measure and track progress
– Use measures to course correct and apply training/coaching
Sustaining the Change
38

39
• Communication that encourages feedback – Explain the Why - business reasons for the change
– Connect the process improvement to organizational goals/strategies
– Explain the consequences of not changing
Sustaining the Change
39

40
• Obstacles in sustainment – Project failed to address resistance
– Leadership failed to support and engage with the change
– Sustainment efforts were ignored
– Project had no resources left
Sustaining the Change
40

41
Questions?
• Contact information for Larry Dux:• Email: [email protected]• LinkedIn: linkedin.com/in/larry-dux-a396998
• Please remember to complete the online session evaluation
41

42
• Barnas, Kim, (2014) Beyond Heroes: A Lean Management System for Healthcare ThedaCare Center for Healthcare Value, CRC Press Taylor and Francis Group
• Bridges, William PhD and Bridges, Susan; (2016) Managing Transitions Making the Most of Change 4th
Edition; Da Capo Press
• Graban, Mark (2009) Lean Hospitals: Improving Quality, Patient Safety, and Employee Satisfaction, CRC Press Taylor and Francis Group
• Joint Commission Center for Transforming Healthcare, “Robust Process Improvement®”, https://www.centerfortransforminghealthcare.org/about/rpi.aspx (Accessed January 21, 2018)
• Kotter, John P., (2012) Leading Change; Harvard Business Review Press
• Larson, Jean Ann (2014) Management Engineering: A Guide to Best Practices for Industrial Engineering in Health Care. CRC Press Taylor and Francis Group
• Lean Enterprise Institute, “What is Lean”, https://www.lean.org/WhatsLean/ (Accessed January 21, 2018)• Mullins, L. (2010) Management and Organisational Behaviour, 9th Edition. Harlow: Pearson Higher
Education• Plsek, Paul (2014) Accelerating Health Care Transformation with Lean and Innovation, CRC Press Taylor
and Francis Group• Prosci, What is the ADKAR Model?, https://www.prosci.com/adkar/adkar-model (Accessed January 9,
2019)
Resources
42

43
Strategic Process Improvement:Strategic Alignment & Problem Definition
Dean Athanassiades, MBA, PMP, CPHIMS, FHIMSS, DSHS, Senior Director, Service Transformation Program Office, Philips
John Hansmann, MSIE, LFHIMSS, DSHS, Vice President, Professional Services, Health Catalyst

44
Strategic Process Improvement - Tools Overview
44

45
Strategic Process Improvement
How do you determine
what projects you will work
on?45
46
Strategic Process Improvement
• Organizational Level– How many of your organizations have a strategic planning process?
– How many have a formal process improvement effort?
– Are they aligned?
• Individual and/or Project Level– What is your level of involvement in the organization’s strategic
goals and objectives?
– How do you align your projects with the organization’s strategic goals and objectives? Project charter?
46

47
Project Selection
Strategic Plans /
Organizational Goals
Internal Comparison
“CxOFavorite
External Comparison
Project List
47

48
Goal Alignment
Cascading Goals
Version 1 Version 2
48

49
Strategic Goal 1: Strengthen Health Care
• Objective A: Make coverage more secure for those who have insurance, and extend affordable coverage to the uninsured
• Objective B: Improve health care quality and patient safety
• Objective C: Emphasize primary and preventive care, linked with community prevention services
• Objective D: Reduce the growth of health care costs while promoting high-value, effective care
• Objective E: Ensure access to quality, culturally competent care, including long-term services and supports, for vulnerable populations
• Objective F: Improve health care and population health through meaningful use of health information technology
Strategic Goal 2: Advance Scientific Knowledge and
Innovation
• Objective A: Accelerate the process of scientific discovery to improve health
• Objective B: Foster and apply innovative solutions to health, public health, and human services challenges
• Objective C: Advance the regulatory sciences to enhance food safety, improve medical product development, and support tobacco regulation
• Objective D: Increase our understanding of what works in public health and human services practice
• Objective E: Improve laboratory, surveillance, and epidemiology capacity
Strategic Goal 3: Advance the Health, Safety, and Well-Being of
the American People
• Objective A: Promote the safety, well-being, resilience, and healthy development of children and youth
• Objective B: Promote economic and social well-being for individuals, families, and communities
• Objective C: Improve the accessibility and quality of supportive services for people with disabilities and older adults
• Objective D: Promote prevention and wellness across the life span
• Objective E: Reduce the occurrence of infectious diseases
• Objective F: Protect Americans’ health and safety during emergencies, and foster resilience to withstand and respond to emergencies
Strategic Goal 4: Ensure Efficiency, Transparency,
Accountability, and Effectiveness of HHS Programs
• Objective A: Strengthen program integrity and responsible stewardship by reducing improper payments, fighting fraud, and integrating financial, performance, and risk management
• Objective B: Enhance access to and use of data to improve HHS programs and to support improvements in the health and well-being of the American people
• Objective C: Invest in the HHS workforce to help meet America’s health and human services needs
• Objective D: Improve HHS environmental, energy, and economic performance to promote sustainability
HHS Strategic Plan FY 2014 - 2018
Source: https://www.hhs.gov/about/strategic-plan/index.html49

50
• Aligned– Purpose– Function– Resources
Results in • More organized and
sustainable approach
• Better outcomes
Alignment with Organizational Strategies
Performance
50

51
“Science Projects” “Assorted Results”
51

52
Organizational Strategic Goals
Project 1 Project 2
Project 3
Project 4
52

53
• As a leadership team, what change management issues should you be aware of that will impact your strategic goals?
• How does using the organization’s strategic goals to direct project selection help identify or resolve change management issues?
• Change management issue vs stickiness of adoption - what actions do I need to take to make the improvement stick?
Change Management Impact
53

54
“If you don’t know where you’re going, any road will take you there.”
Lewis Carroll, Alice’s Adventure in Wonderland
“A problem well-stated is a problem half-solved.”
Charles Kettering, GM Research
54

55
• A problem statement is a clear, concise description of the issue. It should include data to help quantify the problem (e.g. cost per case, overtime rate) as well as describe the impact on patients and the system as a whole.
• It’s the “what” that needs to be solved.
Defining the Problem: Problem Statement
Source: Health Catalyst, “7-Step Framework for Outcomes Improvement”55

56
• It states what is wrong (not why it is wrong or causes for it.)• It focuses on the gap between actual and expected – “what is”
versus “what should be.”• It is specific and measurable. • It identifies who is impacted.• TAGS
– Standard – what is expected?– Actuals – how you are performing?– Gap – between expected and performance.– Trend – trend of performance.
Problem Statement Criteria
Who What When Where
NOT Why
56

57
• Will be a good communication tool
• Will assist with getting buy-in and support – from management and potential team members
• Will explain itself, minimizing the amount of time someone needs to spend explaining what the situation is
• Will provide an understanding to people within and exterior to the improvement team of what is trying to be accomplished
• Will use metrics to identify the gap, and state the obvious for expected (e.g. 11% of ED patients LWOBS, should be 1%)
Well Written Problem Statements
57

58
Examples of Problem Statements
1. We need to improve patient throughout.
a. What needs to be improved?b. Actual and expected
performance?c. What’s being measured?
2. 15% of the doctor’s office patients are waiting 20 more minutes to get their lab results.
a. Improve-lab results waiting time
b. Actual-20 min longer (gap); really don’t know expected performance
c. Impacted-15% of pts, but could it be more specific?
Problem Statement Improved Problem Statement
58

59
Examples of Problem Statements
• Example #1: Patient registration is an essential step in the ED workflow, required to initiate documentation and impacts patient care. The hospital discovered that patients were waiting in line for as long as 15 minutes, and want it to be less than 5 minutes to be checked into the ED to receive treatment.
• Example #2: Readmission within 90 days after colorectal surgery occurs nationally in approximately 25% of the patients, resulting in additional cost of about $9,000 per readmission. The hospital identified that it was experiencing a 28% readmit rate in its elective colorectal surgery patients over the past year.
59

60
Patient Flow from the ED into the inpatient environment
Scenario throughout Workshop:
Purpose for today is to learn how to use the various tools, NOT to solve the problem!
60

61
Anywhere Health System (AHS), located in Anywhere, USA is an integrated health system that includes 9 hospitals and over 200 additional locations.
AHS’ service area includes urban city, suburbs, and rural areas.
Key metrics for Anywhere Health System:• 2.1M patients
• 51,000 surgeries
• 6,000 deliveries
Scenario – Anywhere Health System (AHS)
• 500,000 outpatient encounters
• 302,000 ED visits.
• 20,000 employees
61

62
Scenario – AHS Vision
Anywhere Health System's organizational vision is to be the healthcare provider of choice in every community that we serve. Our mission is to improve healthcare delivery everyday in everything we do. Our organizational goals include:
1. To become the safest place to receive care2. To be the healthiest work environment3. To provide the best in clinical care 4. To provide exceptional service to our patients
62

63
Scenario – AHS Focus
Through the annual business planning process, Anywhere Health System has decided to focus on the delivery of care in its 9 emergency departments.
Customer experience interviews and other collected metricssuggest that opportunities exist to improve wait time in the emergency departments including the patient/family perception of ease of service.
63

64
For all patients• Patients Leaving Without Being
Screened (LWOBS)
• Patient Satisfaction
• Diversion Hours
For discharged patients• Door to Doctor Time
• Doctor to Discharge Time
• ED Arrival to Departure for Discharged Patients
For admitted patients• Door to Doctor Time
• Doctor to Decision to Admit Time
• Decision to Departure from ED Time
• ED Arrival to Departure for Admitted Patients
• Daily Boarding Hours
Scenario – AHS ED Metrics Monitored
64

65
• The median ED LOS for Discharged Patients is currently 215 minutes.
• The rate of patients leaving before Medical Screening Exam was 11% in the most recent month.
• The organization strives for a Door to Doctor time of 15 minutes and a Patients Leaving Before Medical Screening Exam rate of 1%.
• The organization’s leadership is very concerned that Door to Doctor time remains significantly higher then their goal.
Scenario – AHS ED Data
Door to Doctor time for Discharged Patients Past 12 Months
MonthDoor to Doctor Time (Minutes)
Jan 58Feb 51Mar 52Apr 55May 54Jun 47Jul 41Aug 55Sep 52Oct 50Nov 53Dec 57
65
66
• What's the problem that needs solving? • How does it align with the organization’s strategic
goals?• What change management issues should you be aware
of?• How does defining the Problem Statement help identify
or resolve change management issues?
Exercise
1. Divide into Teams2. Write Problem Statement – 20 min3. Report Out – 15 min
66

67
Exercise Debrief - Report Out
• What's the problem that needs solving?
• How does it align with the organization’s strategic goals?
• What change management issues should you be aware of?
• How does defining the Problem Statement help identify or resolve change management issues?
67
68
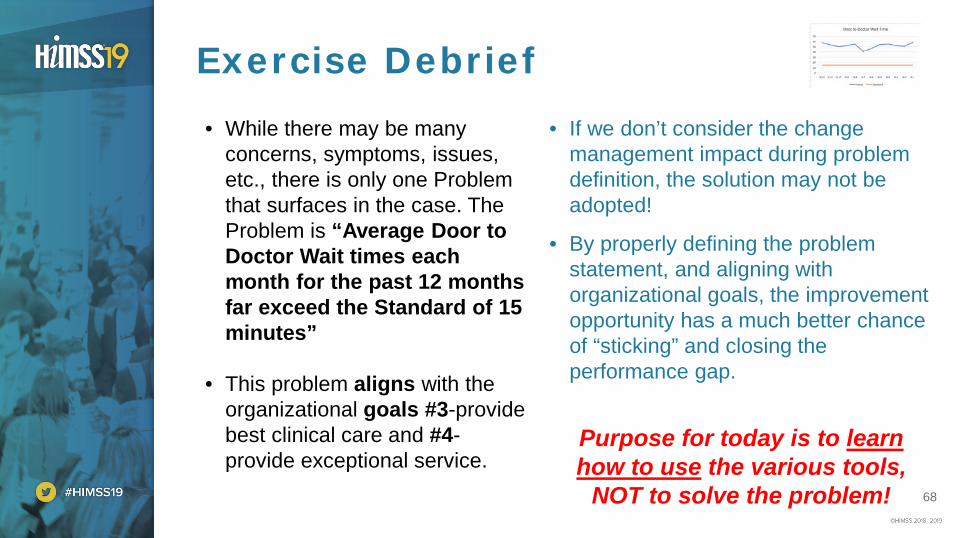
• While there may be many concerns, symptoms, issues, etc., there is only one Problem that surfaces in the case. The Problem is “Average Door to Doctor Wait times each month for the past 12 months far exceed the Standard of 15 minutes”
• This problem aligns with the organizational goals #3-provide best clinical care and #4-provide exceptional service.
• If we don’t consider the change management impact during problem definition, the solution may not be adopted!
• By properly defining the problem statement, and aligning with organizational goals, the improvement opportunity has a much better chance of “sticking” and closing the performance gap.
Exercise Debrief
Purpose for today is to learn how to use the various tools,
NOT to solve the problem! 68

69
Questions?
• Contact information for John Hansmann:• Email: [email protected]• LinkedIn: https://www.linkedin.com/in/jthansmann
• Contact information for Dean Athanassiades:• Email: [email protected]• Twitter: @dathanassiades• LinkedIn: www.linkedin.com/in/dathanassiades
• Please remember to complete the online session evaluation
69

70
Resources• Brassard, Michael, (1989), The Memory Jogger Plus + Featuring the Seven Management and Planning
Tools. GOAL/QPC.
• Bridges, William PhD and Bridges, Susan; (2016) Managing Transitions Making the Most of Change 4th
Edition; Da Capo Press
• Graban, Mark, (2016), Lean Hospitals Improving Quality, Patient Safety, and Employee Engagement, 3rd
Edition. CRC Press Taylor and Francis Group.
• King, Bob, (1989), Hoshin Planning The Developmental Approach, GOAL/QPC.
• Kotter, John P., (2012) Leading Change; Harvard Business Review Press
• Langabeer II, James R, (2009), Performance Improvement in Hospitals and Health Systems. HIMSS
• Mullins, L. (2010) Management and Organisational Behaviour, 9th Edition. Harlow: Pearson Higher Education
• Prosci, What is the ADKAR Model?, https://www.prosci.com/adkar/adkar-model (Accessed January 9, 2019)
• Scholtes, Peter R., (1992), The Team Handbook How to Use Teams to Improve Quality. Joiner.
• https://www.healthcatalyst.com/knowledge-center/70
71
Strategic Process Improvement:VSM & Flowcharting
Mary Ellen Skeens, PMP, CPHIMS, FHIMSS, CSSBB, DSHS, Director, Solutions and Services Management Office, Philips

72
Using Value Stream Maps and Flowcharts
72

73
• Visualization of the process– downstream impact of work– incorporates customer point of view
• Alignment of people– involves people who actually do the work– enables people to see beyond their silo
• Focus on process/system– optimization of system vs. subsystem– helps translate strategy to improvement actions
Why utilize this approach?
73

74
• Identification and sequencing of steps in a process • Specifies start and end points of process
What is Process Flow Charting?
74

75
• A tool for identifying, planning and communicating continuous improvement
• A diagram showing the details of a particular value stream
What is Value Stream Mapping?
75

76
• Value
– What customers are willing to pay for– Changes form, fit or function of material and/or information
• Waste
– Anything that consumes resources but adds no value– Typically “8 types of waste”
Value and Waste
76
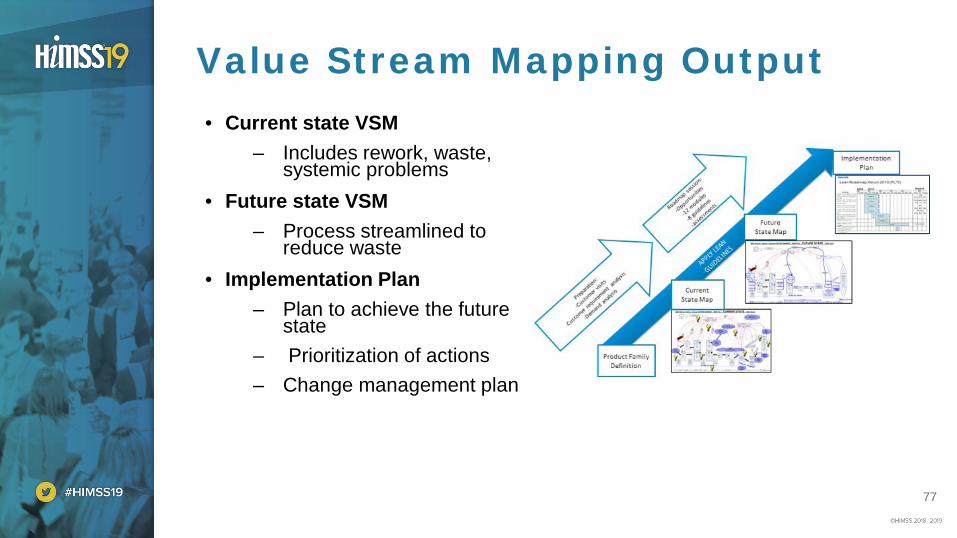
77
• Current state VSM– Includes rework, waste,
systemic problems• Future state VSM
– Process streamlined to reduce waste
• Implementation Plan– Plan to achieve the future
state– Prioritization of actions– Change management plan
Value Stream Mapping Output
77

78
1. Select value stream/process & start and end points2. Assemble team3. Go to the Gemba4. Draw out the process
– Record all steps in the process– Sequence steps
5. Add direction & information flow6. Define activity processing time, throughput, available resources7. Populate timeline8. Identify improvement opportunities (kaizen bursts)
How do you create a VSM?
78

79
Sample VSM Diagram
Source: Joel-Edgar, Sian; Allen, Micaheal; Fordyce, Andrew (2015, October). Time is of the Essence: Value Stream Mapping a National Health Service (NHS) Emergency Department in the South West of England, Paper presented at IEEE Conference - Business Visualisation workshop, Chicago, IL.
79

80
Exercise• Background: The ED project team would like to better understand the current ED
process. They have decided to utilize Value Stream Mapping to visualize the process and understand bottlenecks/opportunities for improvement.
• Exercise: Develop a current state value stream map for the ED process using the information provided in the handout.
1. Identify major steps in the ED process2. Sequence timing of the process steps3. Add direction and information flow4. Add processing time, throughput, available resources5. Draw timeline6. Identify areas for improvement (kaizen bursts)
80

81
Exercise Debrief
• What bottlenecks were identified in the process?
• How did the visualization of the process help in identifying these?
• How did the VSM exercise help the team in aligning on the process?
• How would you use the VSM in the Change Management process?
81

82
Questions?
• Contact information for Mary Ellen Skeens:• Email: [email protected]• Twitter: @maryellenskeens• LinkedIn: https://www.linkedin.com/in/mary-ellen-skeens-
88a5519/
• Please remember to complete the online session evaluation
82
83
Resources
• Larson, Jean Ann (2001) HIMSS Guidebook Series: Management Engineering. HIMSS
• Larson, Jean Ann (2014) Management Engineering: A Guide to Best Practices for Industrial Engineering in Health Care. CRC Press Taylor and Francis Group
• Martin, Karen and Osterling, Mike (2013) Value Stream Mapping. McGraw Hill
83
84
Strategic Process Improvement:Networking Lunch
Brian Compas, PMP, LFHIMSS, Senior Project Manager, Independent Consultant
85
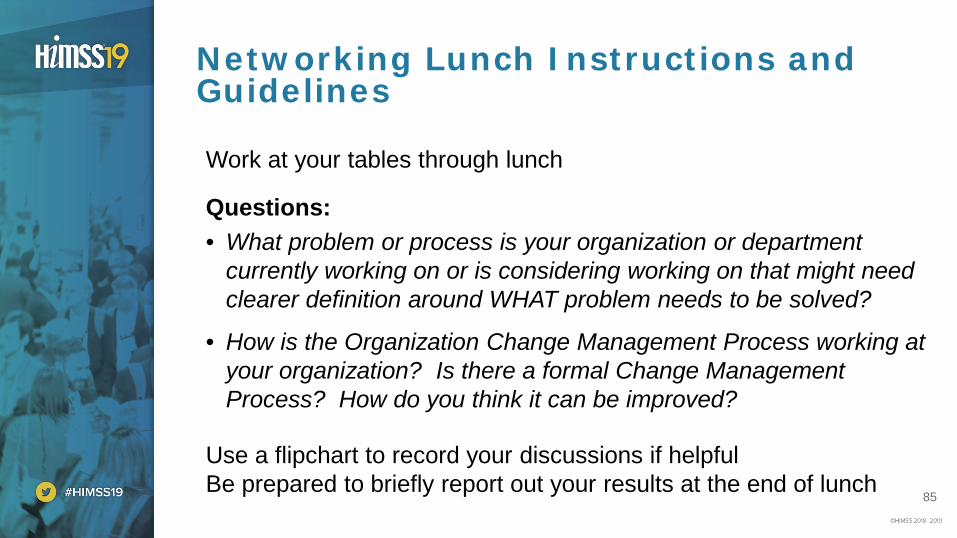
Work at your tables through lunch
Questions:• What problem or process is your organization or department
currently working on or is considering working on that might need clearer definition around WHAT problem needs to be solved?
• How is the Organization Change Management Process working at your organization? Is there a formal Change Management Process? How do you think it can be improved?
Use a flipchart to record your discussions if helpfulBe prepared to briefly report out your results at the end of lunch
Networking Lunch Instructions and Guidelines
85

86
Questions?
• Contact information for Brian Compas:• Email: [email protected]• LinkedIn: www.linkedin.com/in/brian-compas-lfhimss-pmp-
8958097
• Please remember to complete the online session evaluation
86

87
Strategic Process Improvement:Problem Solving Tools – 5 Whys
Mary Ellen Skeens, PMP, CPHIMS, FHIMSS, CSSBB, DSHS, Director, Solutions and Services Management Office, Philips
Dean Athanassiades, MBA, PMP, CPHIMS, FHIMSS, DSHS, Senior Director, Service Transformation Program Office, Philips

88
Problem Solving – Cause & Effect
88

89
• To investigate & identify root causes • Prevent human tendency to jump to solution• To assure we are not only recognizing the symptoms of the
problem (get to point of cause vs. origin or recognition)
Why apply a structured technique?
89

90
What is the approach?• Going to where the work is performed (Gemba)
– Observe/investigate– Gather and verify facts– Collect and confirm data
• 5 Why Analysis
90

91
Breaking down the problem
Many Possible CausesStart by brainstorming possible causes
large problem
Root Cause(s)
5 Whys asked & validated at Gemba5 Why Process
Break down to where problem occursA B C
Point of Recognition
Point of Cause
Point of Occurrence
Most Likely CausesUsing logic, filter out unlikely causes
Actual Causes
Break down causes into no more than 3
x x
91

92
How to use 5 Whys1. Ask “Why” 3-5 times or more to get to an actionable root cause2. Document the evidence and facts that led to the answer at each step3. Check the logic from the root cause to the problem
• if eliminated, would the problem stop, be prevented, cease to reoccur? • if root cause occurs, does the problem occur?
Why 1 / Facts
Why 2 / Facts
Why 3 / Facts
Why 4 / Facts
“can cause” “can cause”
“can cause”
“can cause”
Problem / Actual Cause
Root Cause
Why 5 / Facts
92

93
Effective 5 Why Criteria
Effective 5 Why Criteria
Logical, specific causes flow with evidence/facts observed at each Why
Effective Countermeasures can be identified within your team’s control
Avoid blaming and qualitative words in the 5 Why analysis
Denominator consistent unit of measure
Stop asking “Why” (actionable Root Causes)
Critically assess your 5 Why analysis to ensure consistent logic
93

94
How can we stop the crumbling of the Jefferson Memorial marble?
1. Why is the marble crumbling?
2. Why are the frequent washes needed?
3. Why are there so many bird droppings?
4. Why are there so many spiders?
5. Why are there so many midges?
The midges turned out to be attracted by the lights that were turned on at dusk.
Solution: turning on the lights only 1 hour later, made the midges find their sleeping places somewhere else. They broke the food chain, needed less washes with less strong cleaning acids and stopped the decay.
5 Why Example: The Jefferson Memorial
94
95
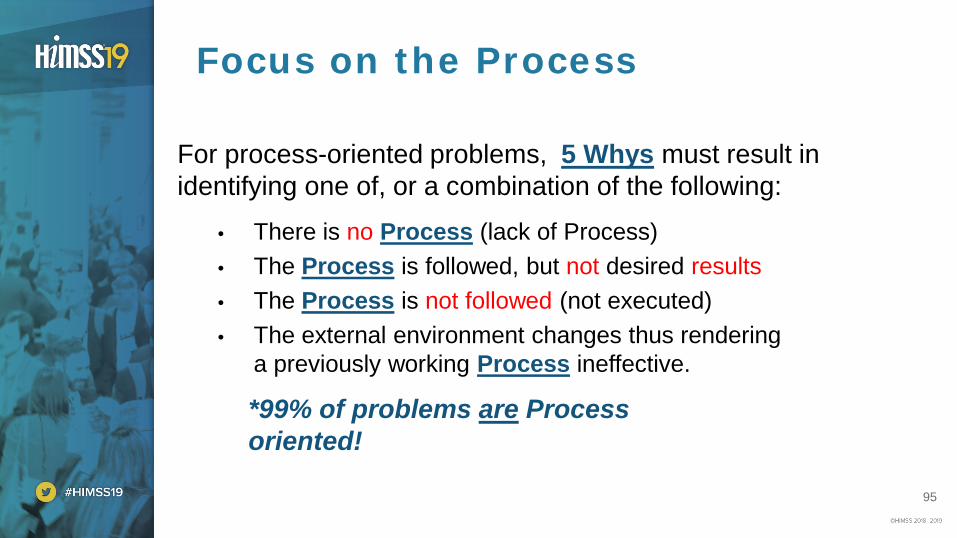
Focus on the Process
For process-oriented problems, 5 Whys must result in identifying one of, or a combination of the following:
• There is no Process (lack of Process)• The Process is followed, but not desired results• The Process is not followed (not executed)• The external environment changes thus rendering
a previously working Process ineffective.
*99% of problems are Process oriented!
95

96
Sociotechnical Systems Theory
Complex Environment
Structure(organization)
People(cognitive and social)
Physical System(hardware, software,
facilities)
Task(work)
Social System Technical System
Sociotechnical System (STS)
“Build a better mousetrap and the world will beat a path to your door.”
STS explains why the “better mousetrap” is not always successful.
Retrieved from: https://www.worldcoal.org/
96

97
Exercise
• Background:The ED project team wanted to understand the root cause behind a dramatic month over month increase in the rate of patients leaving the ED before the medical screening exam. They decided to perform 5 Why Analysis to dig into this.
• Exercise:Perform 5 Why Analysis to discover root cause of why patients are leaving before medical screening exam. 1. Assign roles to team members and use script provided to conduct interviews to
ask why to get to an actionable root cause. 2. Document the evidence and facts that led to the answer at each step. 3. Check the logic from the root cause to the problem.
97

98
Exercise Debrief
• Would the team have identified all the root cause without performing 5 Why analysis?
• How many why’s did it take to reach root cause?
• Did the logic check out?
• How does knowing the root cause help with the identification of countermeasures?
• Were any of the root causes related to social systems?
98

99
Questions?
• Contact information for Dean Athanassiades:• Email: [email protected]• Twitter: @dathanassiades• LinkedIn: www.linkedin.com/in/dathanassiades
• Contact information for Mary Ellen Skeens:• Email: [email protected]• Twitter: @maryellenskeens• LinkedIn: https://www.linkedin.com/in/mary-ellen-skeens-
88a5519/
• Please remember to complete the online session evaluation
99

100
Resources
• Larson, Jean Ann (2001) HIMSS Guidebook Series: Management Engineering. HIMSS
• Larson, Jean Ann (2014) Management Engineering: A Guide to Best Practices for Industrial Engineering in Health Care. CRC Press Taylor and Francis Group
• Graban, M. (Sept 2009) Use 5 Sequential "Whys," not 5 Random Ones. Retrieved from https://www.leanblog.org/
• Trist, E. (1981). The evolution of socio-technical systems. Occasional paper, 2, 1981.
100

101
Strategic Process Improvement:Data Collection & Display Tools
Deborah D. Flint, PE, MBA, MSHQS, FHIMSS, DSHS, LSSBB, Sr. Director, Performance Engineering, UAB Medicine: The Kirklin Clinic of UAB Hospital

102
Using Data Collection and Display Tools
Using Data Collection and Display Tools
WHY?
WHAT?
HOW?
• Identify method to collect data: - Manually capture data - Electronically capture data• Identify method to best display data, e.g.,:
- Table- Charts: line chart/ trend line- Graphs: histogram, pareto- Box plot charts - Control charts
• Identify specific data of interest that best makes the case for change
• Determine how to obtain data• Collect data• Determine how to best display data according to: - Purpose of data - Audience • Make the case for change!
• Identify “what” process has opportunity for improvement
• Identify metrics to “measure success”• Identify baseline metrics that make the case for
change• Obtain post-implementation metrics to determine
if improvements were realized
102

103
• To assess current state:– “How are we doing?”– Do we need to change?
• To identify opportunities for improvement:- How “bad” are we doing?- What process(es) need to be improved?
• To measure results of future state:- Have we improved?- Is the new process working well (or not well)?
Why do we need data? To measure!
103

104
Kinds of Data• Categorical (qualitative)
- Nominal (named categories)- Ordinal (categories with an implied order)
• Numerical (quantitative)- Discrete (Attributes Data)
- yes/no, - present/absent
- Continuous (Variables Data)- Measurements, e.g., time, length, weight
Source: http://sixsigmastudyguide.com/types-of-data/104

105
Quantitative Data: Attributes Data• Binary in nature: yes/no, present/absent • Count the number of “good” or “bad”, “pass” or “fail”• Answers whether or not an event occurred, e.g.:
- Did the resident examine the patient?- Was patient febrile or afebrile upon arrival?- Did patient leave without being seen?- Was triage performed?
Source: https://www.isixsigma.com/dictionary/attribute-data/
Patient # Triaged?1 yes2 yes3 no4 yes5 yes
105
106
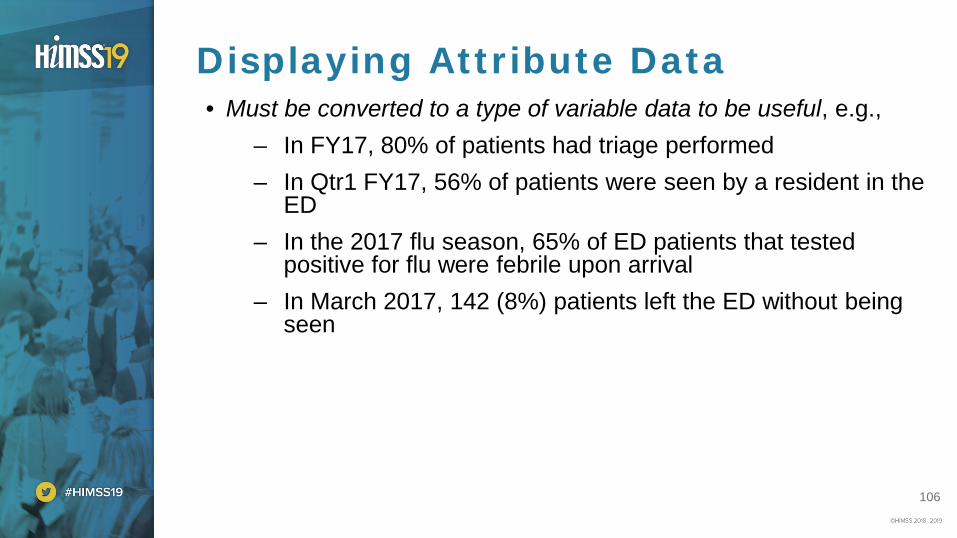
Displaying Attribute Data• Must be converted to a type of variable data to be useful, e.g.,
– In FY17, 80% of patients had triage performed– In Qtr1 FY17, 56% of patients were seen by a resident in the
ED– In the 2017 flu season, 65% of ED patients that tested
positive for flu were febrile upon arrival– In March 2017, 142 (8%) patients left the ED without being
seen
106
107
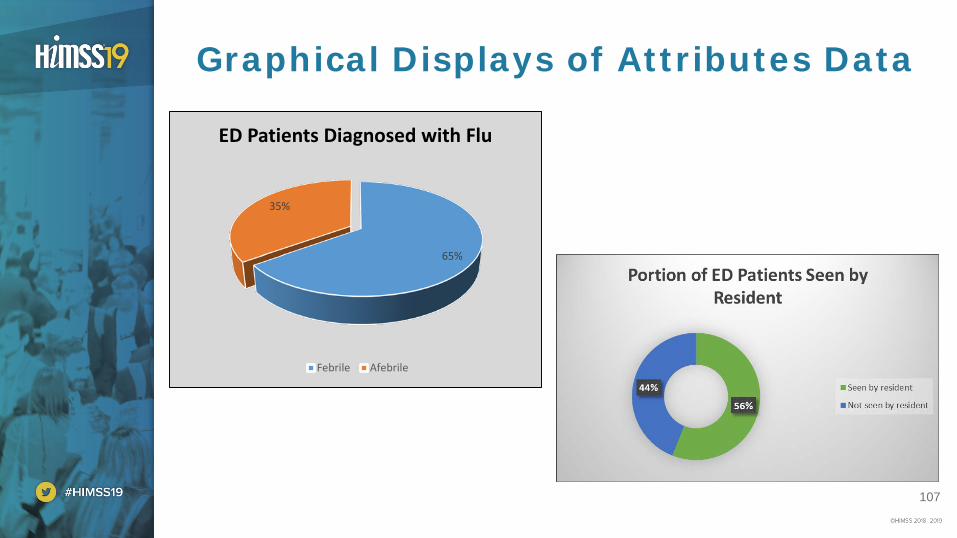
65%
35%
ED Patients Diagnosed with Flu
Febrile Afebrile
Graphical Displays of Attributes Data
107

108
Quantitative Data: Variables Data• Quantitative data
- Discrete (“counts”)- yes/no- present/absent
- Continuous (“measurement”)- time - length- weight
Source: https://www.isixsigma.com/dictionary/variable-data108

109
Displaying Variables Data• In FY17, average door to doctor time was 52.3 minutes with a
standard deviation of 4.62• Median ED LOS for discharged patients is currently 215.4 minutes• Time spent with resident physician ranged from 9.2 to 14.7
minutes.
109

110
• Back to our ED project…..– What data is needed?– How will we capture it?– How will we display it?
Graphical Displays of Data
110

111
• What data do we need?– Patient arrival time (“door”)– Time physician enters room (“seen by resident” or “seen by
attending”)• May need to combine data from multiple sources• Possible sources of data:
– Registration system (capture“door” or “patient arrival” time)– Electronic Health Record (capture “doctor time”) and/or– Direct observations (“Go to the Gemba,” stand in hallway
and observe when doctor enters room)
Project is focusing on reducing “Door to Doctor” Time
111

112
Dept DescLocation
Desc Patient Name MRN Arrival Date Arrival TimeEmergency ED Jones, D. xxxxx-123 2/5/2017 0:24Emergency ED Smith, K. xxxxx-124 2/5/2017 1:22Emergency ED Andrews, D.D. xxxxx-125 2/5/2017 1:35Emergency ED Simpson, L. H. xxxxx-126 2/5/2017 6:45Emergency ED James, S. xxxxx-127 2/5/2017 8:22Emergency ED Brown, L.M. xxxxx-128 2/5/2017 9:10Emergency ED Johnson, F. xxxxx-129 2/6/2017 12:25Emergency ED Thomas, W. xxxxx-130 2/6/2017 1:15Emergency ED Rollins, K. xxxxx-131 2/6/2017 1:17Emergency ED Black, A. xxxxx-132 2/6/2017 2:02Emergency ED Williams, M.P. xxxxx-133 2/6/2017 17:15Emergency ED Johnson, M. xxxxx-134 2/6/2017 20:25
Obtaining the Data: “door” time
Source: ED Registration Data
112
113
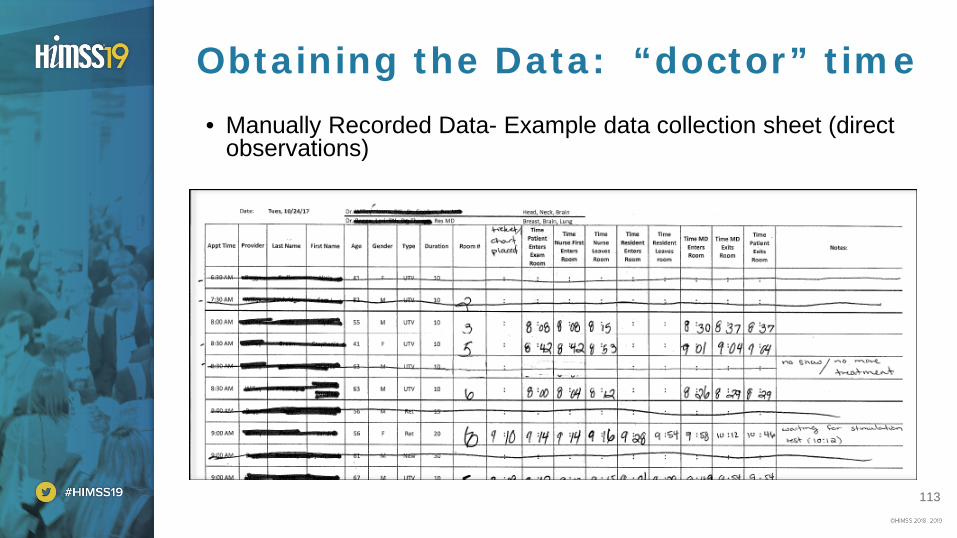
• Manually Recorded Data- Example data collection sheet (direct observations)
Obtaining the Data: “doctor” time
113

114
Other examples• Hybrid of Manual/Automatic Data
– Create form in MS Access– Use tablet to document
timing of events
114

115
• Data Collection Tools/Methods on display at HIMSS Exhibition
Other Examples- Automated Data Collection
115

116
• Now that we have:– Identified what data to collect,– Collected our data, and– Defined our goal of “door to doctor” to be under 30 minutes,
How can we best display the datato make the case for change?
Displaying the Data
116

117
• We obtained the monthly summary of data (below)• How can we best display this data to make the case for change?
Goal: Reduce Door to Doctor Time
MonthDoor to Doctor Time (Minutes)
Jan 58Feb 51Mar 52Apr 55May 54Jun 47Jul 41Aug 55Sep 52Oct 50Nov 53Dec 57 117

118
DecNovOctSepAugJulJunMayAprMarFebJan
60
55
50
45
40
Month
Door
to
Doct
or T
ime
Time Series Plot of ED Door to Doctor Time (minutes)Source: EHR (2017)
6055504540
3.0
2.5
2.0
1.5
1.0
0.5
0.0
Door to Doctor Time
Freq
uenc
y
Mean 52.08StDev 4.621N 12
Histogram of ED Door to Doctor Time (minutes)Source: EHR (FY17)
Displaying Data
118

119
0
10
20
30
40
50
60
70
Jan Feb Mar Apr May Jun Jul Aug Sep Oct Nov Dec
ED “Door to Doctor” Time (minutes)
Door to Doctor Time (Minutes) Goal
Displaying Data
While all graphs display the same data, does any one graph “best” make the case for change?
119

120
Stroke Example
Source: https://www.stroke.org/sites/default/files/homepage-slides/In-hospital-Stroke-Alert-Protocol-Card.pdf120
121
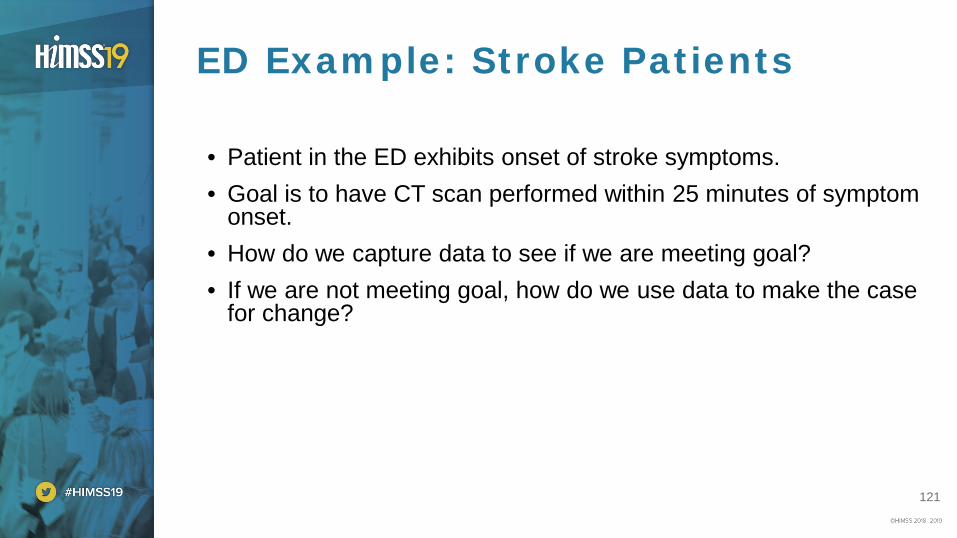
• Patient in the ED exhibits onset of stroke symptoms. • Goal is to have CT scan performed within 25 minutes of symptom
onset. • How do we capture data to see if we are meeting goal?• If we are not meeting goal, how do we use data to make the case
for change?
ED Example: Stroke Patients
121

122
• Identify available timestamps in EMR:- RN records time of symptom onset (creates timestamp in EMR)- Radiology records CT “start” time
• Gather data and display
Stroke Example
21191715131197531
40
30
20
10
0
Observation
Min
utes _
X=16.86
UCL=39.46
LCL=-5.75
1
Control Chart: Time between symptom onset and CT start
122

123
• What is the purpose of the data review?– What story does our data tell?– How can we present the data to clearly display the results?– How can we display our data to best make the case for
change?• Who is our audience?
– Executives generally prefer high level overview– Department managers may need more detail– Engineers want every line item detail!
In summary, How do we decide what graph is best?
123

124
Exercise: Pareto Chart• Pareto Principle (80/20 rule):
– Named after Italian economist, Vilfredo Pareto– Theory stating that 80% of the output from a given situation
is determined by 20% of the input• Used when analyzing data related to the frequency of problems or
causes of problems
Sources:http://whatis.techtarget.com/definition/Pareto-principlehttp://asq.org/learn-about-quality/cause-analysis-tools/overview/pareto.htmlhttps://en.wikipedia.org/wiki/Pareto_chart
124

125
Pareto Chart Example
# of observations
Reasons Patients left without being
seen
6 Had to go to work
15 Tired of waiting
4 Went to Urgent Care
2Had other
commitment / family obligation
1 Went to another ED
15
6
4
21
54%
75%
89%96% 100%
0%
20%
40%
60%
80%
100%
0
2
4
6
8
10
12
14
16
Coun
t
Reasons Patient Left ED Without Being Seen
Reasons Patients left without being seen Cum %
125

126
• Background: In our ED example, the project team wanted to determine root causes of delay in “door to doctor”. The project team “went to the Gemba” and observed patients waiting on the doctor to determine causes of the delay.
• Exercise: Using the M & Ms at your table, create a Pareto chart to determine the most frequent causes of delay waiting for the doctor.
– Identify root causes of delay (for each color M&M)– Quantify volume of each type of delay– Sort types highest to lowest– Calculate cumulative percent– Display in Pareto chart format
M & M Exercise
126
127
Exercise Debrief
• What were the root causes of delay for “door to doctor”?
• What was the most common root cause?
• Did you see evidence of the “80-20 rule”?
• Is the Pareto Chart the best way to present the data to help convince others for the need to change?
• Can you think of other ways to present the data to help with the Change Management process?
127

128
Questions?
• Contact information for Debbie Flint:• Email: [email protected]• Twitter: @ddflint11• LinkedIn: https://www.linkedin.com/in/debbie-flint-pe-mba-
6093498/
• Please remember to complete the online session evaluation
128

129
Resources
• http://sixsigmastudyguide.com/types-of-data/
• https://www.isixsigma.com/dictionary/attribute-data
• https://www.isixsigma.com/dictionary/variable-data
• https://www.stroke.org/sites/default/files/homepage-slides/In-hospital-Stroke-Alert-Protocol-Card.pdf
• http://whatis.techtarget.com/definition/Pareto-principle
• http://asq.org/learn-about-quality/cause-analysis-tools/overview/pareto.html
• https://en.wikipedia.org/wiki/Pareto_chart
129
130
Strategic Process Improvement:Generating Solutions & Evaluating
Mary Ellen Skeens, PMP, CPHIMS, FHIMSS, CSSBB, DSHS, Director, Solutions and Services Management Office, Philips
Deborah D. Flint, PE, MBA, MSHQS, FHIMSS, DSHS, LSSBB, Sr. Director, Performance Engineering, UAB Medicine: The Kirklin Clinic of UAB Hospital

131
Generating Solutions & Evaluating
131

132
Why apply a structured approach?• Generate broad range of ideas for solutions• Organize solutions• Prioritize countermeasures• Bridge the gap from current to future state• Support change management
132

133
What is the approach?
• Facilitate Brainstorming • Perform Solution analysis• Develop Prioritization matrix
133

134
Brainstorming
• Important to set ground rules• Everyone has an equal voice• Can be used to identify improvement
ideas, strengths/weaknesses
134
135
Solution AnalysisDevelopment of Countermeasures:• A proper root cause analysis will point to the action needed • Make a plan that includes who, what, when• Pursue multiple countermeasures • Explore as many countermeasures as possible• Build consensus rather than promote/defend solutions
135

136
Develop CountermeasuresTemporary• Short term view• Actions that address
problem symptoms, but do not address root cause
Permanent• Longer term view• Actions that address root
causes to close the gap
136

137
Prioritization Matrix
High
Low
Impa
ct
EasyHard Level of Effort
Plan Immediate
Consider Drop
• need to study• typically worth doing• e.g. Six Sigma project
• typically the best move• do ASAP
• don’t waste your time • may be worth doing• can create rapid learning cycles
137

138
• Identify and prioritize countermeasures by evaluating impact versus effort
• Test and validate hypotheses and reflect
• Implement and verify gap closure
How to create prioritization matrix?
138

139
• Countermeasures should be tested and validated prior to implementation
• Test countermeasures using pilots, focus groups, dry runs, simulations, etc.
• During the test, observe impact of the countermeasure first-hand at Gemba at the time of change
• Evaluate how the lagging or leading indicators have changed• Prepare to make adjustments
Check the Impact of Countermeasures
139

140
Echocardiography Example ProjectBackground: Echo Lab not meeting desired metrics of performing inpatient exams within desired time frame 48 hours.
The Why: The organization is working diligently to identify delays that increase patient length of stay. Delay in patients having echo exam can prevent timely patient discharge and thus increase patient length of stay.
Project Goal: Evaluate Echo Lab workflow to identify inefficiencies and propose recommendations to streamline workflow to improve turnaround time for patient care
Scope: Echo order received to test finalized for 5 departments
Challenge: Where do we begin? 140

141
Brainstorming- Generating Ideas• Engaged staff to identify
departmental strengths, weaknesses, opportunities, and threats
• Focused on improving weaknesses and strengthening opportunities
141

142
Solution AnalysisIdeas (“opportunities for improvement” or “weaknesses that could be improved”) were grouped in categories
• Performing Exams• Space & Equipment• Staffing Levels• Managing Workflow• Communication
142

143
Assessing ImpactLevel of Impact - Impact that work on this effort would have on improving UH Echo In-Lab
Level of Control - Degree that work on this effort is within the span of control of Echo department.
143

144
• Categories were “ranked” according to
– Level of Impact– Span of Control
Assessing Impact- Results
144

145
Please use blank slide if more space is required for charts, graphs, etc.
To remove background graphics, right click on selected slide,
choose “Format Background” and check “Hide background graphics”.
145

146
1. Reviewed prioritization matrix results 2. Identified top areas of focus (highlighted in green)
“managing workflow” “performing exams”
3. Obtained baseline metrics4. Documented current state5. Developed recommendations to improve process(es)6. Implemented improvements 7. Monitor results
Echo Project Next Steps
146

147
Exercise
• Background: The team ED project team identified several possible countermeasures based on the root cause analysis of the dramatic month over month increase in the rate of patients leaving the ED before the medical screening exam. The team decided to utilize a prioritization matrix to help determine which ones to implement.
• Exercise: Brainstorm on countermeasures to address root cause identified. Develop a prioritization matrix.
– Identify and prioritize countermeasures by evaluating impact versus effort
– Consider change management implications for the countermeasures 147

148
Exercise Debrief
• How did the evaluation of impact and effort help to narrow in on the countermeasures that should be implemented?
• How can the countermeasures be validated?
• What do we do if the countermeasure is not effective?
• What are potential blocking points to sustaining the change(s)?
148

149
Questions?• Contact information for Debbie Flint:
• Email: [email protected]• Twitter: @ddflint11• LinkedIn: https://www.linkedin.com/in/debbie-flint-pe-mba-
6093498/
• Contact information for Mary Ellen Skeens:• Email: [email protected]• Twitter: @maryellenskeens• LinkedIn: https://www.linkedin.com/in/mary-ellen-skeens-88a5519/
• Please remember to complete the online session evaluation
149

150
Resources
• Larson, Jean Ann (2001) HIMSS Guidebook Series: Management Engineering. HIMSS
• Larson, Jean Ann (2014) Management Engineering: A Guide to Best Practices for Industrial Engineering in Health Care. CRC Press Taylor and Francis Group
150

151
Strategic Process Improvement:Standard Work & Using Control Charts
Dean Athanassiades, MBA, PMP, CPHIMS, FHIMSS, DSHS, Senior Director, Service Transformation Program Office, Philips

152
• Why Standard Work?• How can I use a Control Chart to monitor, control, and improve
the work?
Defining Standard Work & Using Control Charts
152

153
• Ensures that everyone is working in the best possible way
• Reduces process variability and thereby increase quality
• Provides a structure for cross training and creates flexibility within teams
• Sustains the gains from previous Kaizens and provides a baseline for further improvement
• Where there is no standard there can be no kaizen [good improvement] – Taiichi Ohno, founder of Toyota Production System
Why Standard Work
153

154
• Think about how you got out of bed to get ready for work this morning.
– What part of that was routine?
– Can you give examples of tasks you did routinely?
– What are advantages of having a routine?
– What are disadvantages of having a routine?
– What happens if someone else wants you to change your routine?
– How could they help convince you to change your routine?
Standard Work Exercises
Activity
Standard Pig Exercise
154

155
Levels of Standard Work
1. No process, “tribal knowledge”
2. Process exists, not documented
3. Documented process
4. Documented, standardized and controlled
5. Continuously improved
155
156
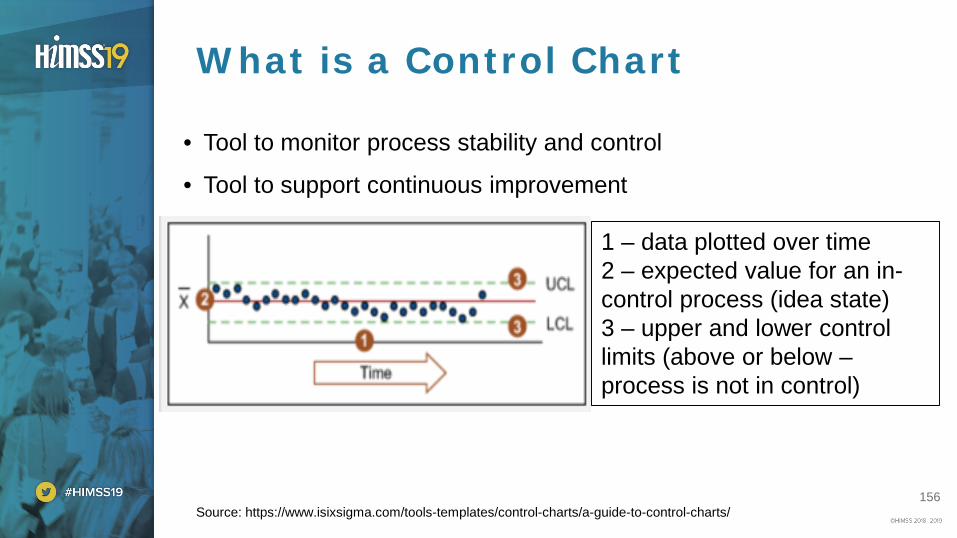
What is a Control Chart
• Tool to monitor process stability and control
• Tool to support continuous improvement
1 – data plotted over time2 – expected value for an in-control process (idea state)3 – upper and lower control limits (above or below –process is not in control)
Source: https://www.isixsigma.com/tools-templates/control-charts/a-guide-to-control-charts/156

157
Interpreting a Control Chart
Which process is in control?Source: https://www.isixsigma.com/tools-templates/control-charts/a-guide-to-control-charts/
157

158
Rule Rule Name Pattern
1Beyond Limits
One or more points beyond the control limits
2 Zone A2 out of 3 consecutive points in Zone A or beyond
3 Zone B4 out of 5 consecutive points in Zone B or beyond
4 Zone C
7 or more consecutive points on one side of the average (in Zone C or beyond)
5 Trend7 consecutive points trending up or trending down
6 Mixture8 consecutive points with no points in Zone C
7Stratification 15 consecutive points in Zone C
8Over-control
14 consecutive points alternating up and down
When is a process out-of-control?
158
159
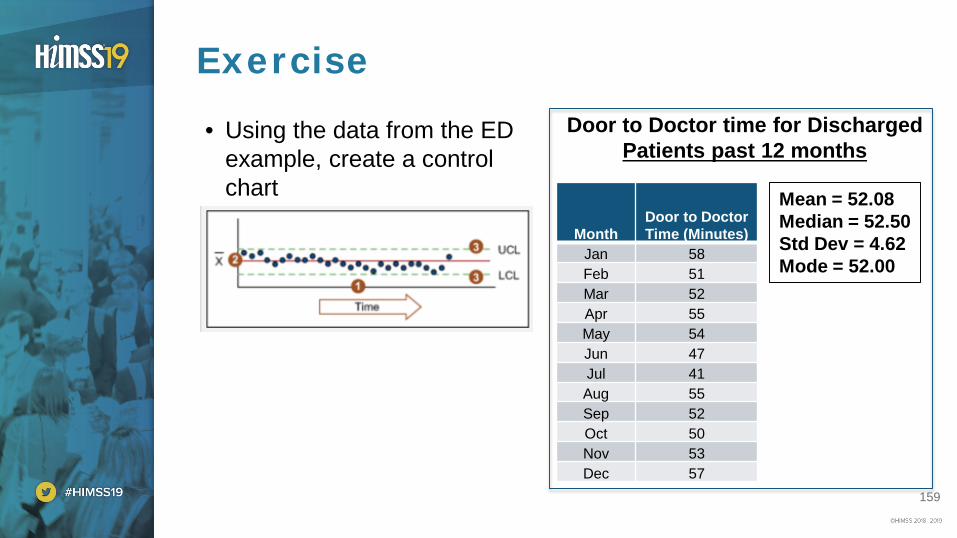
• Using the data from the ED example, create a control chart
Exercise
Mean = 52.08Median = 52.50Std Dev = 4.62Mode = 52.00
Door to Doctor time for Discharged Patients past 12 months
MonthDoor to Doctor Time (Minutes)
Jan 58Feb 51Mar 52Apr 55May 54Jun 47Jul 41Aug 55Sep 52Oct 50Nov 53Dec 57
159

160
• Is the the process in-control? Out-of-control? Why?
• Should we be satisfied? Why or why not?
• How can we convince others that change is needed?
Exercise Debrief
160

161
Questions?
• Contact information for Dean Athanassiades:• Email: [email protected]• Twitter: @dathanassiades• LinkedIn: www.linkedin.com/in/dathanassiades
• Please remember to complete the online session evaluation
161

162
Resources
• Larson, Jean Ann (2001) HIMSS Guidebook Series: Management Engineering. HIMSS
• Larson, Jean Ann (2014) Management Engineering: A Guide to Best Practices for Industrial Engineering in Health Care. CRC Press Taylor and Francis Group
• iSixSigma.com (n.d.). "A Guide to Control Charts." Control Charts. from https://www.isixsigma.com/tools-templates/control-charts/a-guide-to-control-charts/.
162

163
Strategic Process Improvement:Summary

164
Summary• How will you take the learnings from today back to your
work place?• How will you apply what you learned today in your work
place?• Are the tools and concepts learned today applicable to help
improve performance in your organization?• Will the incorporation of change management concepts in
your improvement process help to improve the adoption or “stickiness” of the identified solutions?
164

165
Learning ObjectivesDescribe key healthcare industry changes driving strategic
process improvement initiativesDefine and clarify the scope of the problem to be solvedUse the appropriate measures to assess organizational
performance from a strategic perspectiveApply and use Lean & Six-Sigma tools to achieve desired
organizational performanceEmploy change management practices to sustain process
improvements
165

166
Thank Youfor participating
today** Please remember to complete the online session
evaluation ** 166

167
Dean Athanassiades• Email: [email protected]• Twitter: @dathanassiades• LinkedIn:
www.linkedin.com/in/dathanassiades
Brian Compas• Email: [email protected]• LinkedIn: www.linkedin.com/in/brian-
compas-lfhimss-pmp-8958097
Larry Dux• Email: [email protected]• LinkedIn: linkedin.com/in/larry-dux-
a396998
Debbie Flint• Email: [email protected]• Twitter: @ddflint11• LinkedIn: https://www.linkedin.com/in/debbie-
flint-pe-mba-6093498/
John Hansmann• Email: [email protected]• LinkedIn: https://www.linkedin.com/in/jthansmann
Mary Ellen Skeens• Email: [email protected]• Twitter: @maryellenskeens• LinkedIn: https://www.linkedin.com/in/mary-ellen-
skeens-88a5519/
Contact Information
167
168
Resources
• Barnas, Kim, (2014) Beyond Heroes: A Lean Management System for Healthcare ThedaCare Center for Healthcare Value, CRC Press Taylor and Francis Group
• Brassard, Michael, (1989), The Memory Jogger Plus + Featuring the Seven Management and Planning Tools. GOAL/QPC.
• Bridges, William PhD and Bridges, Susan; (2016) Managing Transitions Making the Most of Change 4th Edition; Da Capo Press
• Graban, Mark, (2016), Lean Hospitals Improving Quality, Patient Safety, and Employee Engagement, 3rd Edition. CRC Press Taylor and Francis Group.
168

169
Resources continued
• Graban, M. (Sept 2009) Use 5 Sequential "Whys," not 5 Random Ones. Retrieved from https://www.leanblog.org/
• iSixSigma.com (n.d.). "A Guide to Control Charts." Control Charts. from https://www.isixsigma.com/tools-templates/control-charts/a-guide-to-control-charts/.
• Joint Commission Center for Transforming Healthcare, “Robust Process Improvement®”, https://www.centerfortransforminghealthcare.org/about/rpi.aspx(Accessed January 21, 2018)
• King, Bob, (1989), Hoshin Planning The Developmental Approach, GOAL/QPC.
169

170
• Kotter, John P., (2012) Leading Change; Harvard Business Review Press
• Langabeer II, James R, (2009), Performance Improvement in Hospitals and Health Systems. HIMSS
• Larson, Jean Ann (2001) HIMSS Guidebook Series: Management Engineering. HIMSS
• Larson, Jean Ann (2014) Management Engineering: A Guide to Best Practices for Industrial Engineering in Health Care. CRC Press Taylor and Francis Group
Resources continued
170

171
• Lean Enterprise Institute, “What is Lean”, https://www.lean.org/WhatsLean/ (Accessed January 21, 2018)
• Martin, Karen and Osterling, Mike (2013) Value Stream Mapping. McGraw Hill
• Mullins, L. (2010) Management and Organisational Behaviour, 9th Edition. Harlow: Pearson Higher Education
• Trist, E. (1981). The evolution of socio-technical systems. Occasional paper, 2, 1981.
• Plsek, Paul (2014) Accelerating Health Care Transformation with Lean and Innovation, CRC Press Taylor and Francis Group
Resources continued
171

172
• Prosci, What is the ADKAR Model?, https://www.prosci.com/adkar/adkar-model (Accessed January 9, 2019)
• Scholtes, Peter R., (1992), The Team Handbook How to Use Teams to Improve Quality. Joiner.
Resources continued
172

173
• http://asq.org/learn-about-quality/cause-analysis-tools/overview/pareto.html
• http://sixsigmastudyguide.com/types-of-data/
• http://whatis.techtarget.com/definition/Pareto-principle
• https://www.healthcatalyst.com/knowledge-center/
• https://www.isixsigma.com/dictionary/attribute-data
• https://www.isixsigma.com/dictionary/variable-data
• https://www.stroke.org/sites/default/files/homepage-slides/In-hospital-Stroke-Alert-Protocol-Card.pdf
• https://en.wikipedia.org/wiki/Pareto_chart
Resources continued
173

174
Conflict of Interest Documents

175
Larry Dux, BSIE, MBA, CPHIMS, LFHIMSS, DSHS
Salary: Froedtert Health Community Memorial Hospital Royalty: N/AReceipt of Intellectual Property Rights/Patent Holder: N/AConsulting Fees (e.g., advisory boards): N/AFees for Non-CME Services Received Directly from a Commercial Interest or their Agents (e.g., speakers’ bureau): N/AContracted Research: N/AOwnership Interest (stocks, stock options or other ownership interest excluding diversified mutual funds): N/AOther: N/A
Conflict of Interest
175
176
John Hansmann, MSIE, LFHIMSS, DSHS
Salary: Health Catalyst Royalty: N/AReceipt of Intellectual Property Rights/Patent Holder: N/AConsulting Fees (e.g., advisory boards): N/AFees for Non-CME Services Received Directly from a Commercial Interest or their Agents (e.g., speakers’ bureau): N/AContracted Research: N/AOwnership Interest (stocks, stock options or other ownership interest excluding diversified mutual funds): Health Catalyst Other: N/A
Conflict of Interest
176

177
Dean Athanassiades, MBA, PMP, CPHIMS, FHIMSS, DSHS
Salary: Philips Royalty: N/AReceipt of Intellectual Property Rights/Patent Holder: N/AConsulting Fees (e.g., advisory boards): N/AFees for Non-CME Services Received Directly from a Commercial Interest or their Agents (e.g., speakers’ bureau): N/AContracted Research: N/AOwnership Interest (stocks, stock options or other ownership interest excluding diversified mutual funds): Philips Other: N/A
Conflict of Interest
177
178
Mary Ellen Skeens, PMP, CPHIMS, FHIMSS, CSSBB, DSHS
Salary: Philips Royalty: N/AReceipt of Intellectual Property Rights/Patent Holder: N/AConsulting Fees (e.g., advisory boards): N/AFees for Non-CME Services Received Directly from a Commercial Interest or their Agents (e.g., speakers’ bureau): N/AContracted Research: N/AOwnership Interest (stocks, stock options or other ownership interest excluding diversified mutual funds): Philips Other: N/A
Conflict of Interest
178

179
Brian Compas, PMP, LFHIMSS
Salary: Independent ContractorRoyalty: N/AReceipt of Intellectual Property Rights/Patent Holder: N/AConsulting Fees (e.g., advisory boards): N/AFees for Non-CME Services Received Directly from a Commercial Interest or their Agents (e.g., speakers’ bureau): N/AContracted Research: N/AOwnership Interest (stocks, stock options or other ownership interest excluding diversified mutual funds): N/AOther: N/A
Conflict of Interest
179

180
Deborah D. Flint, PE, MBA, MSHQS, FHIMSS, DSHS, LSSBB
Salary: UAB Hospital Management, LLCRoyalty: N/AReceipt of Intellectual Property Rights/Patent Holder: N/AConsulting Fees (e.g., advisory boards): N/AFees for Non-CME Services Received Directly from a Commercial Interest or their Agents (e.g., speakers’ bureau): N/AContracted Research: N/AOwnership Interest (stocks, stock options or other ownership interest excluding diversified mutual funds): N/AOther: N/A
Conflict of Interest
180