crash-based evaluation of australian design rule 69 (full frontal
TRANSCRIPT

ATSB RESEARCH AND ANALYSIS REPORT
Road Safety Research Grant – 2006/03
Final Report
Crash-based Evaluation of Australian Design Rule 69
(Full Frontal Impact Occupant Protection)
Michael Fitzharris
Brian Fildes
Stuart Newstead
David Logan
Monash University Accident Research Centre
December 2006


ATSB ROAD SAFETY RESEARCH GRANT REPORT
2006-03
Crash-based Evaluation of Australian Design
Rule 69
(Full Frontal Impact Occupant Protection)
Fitzharris M.P.
Fildes B.N.
Newstead S.V.
Logan D.
Monash University Accident Research Centre
December 2006

– ii –
Published by: Australian Transport Safety Bureau
Postal address: PO Box 967, Civic Square ACT 2608
Office location: 15 Mort Street, Canberra City, Australian Capital Territory
Telephone: 1800 621 372; from overseas + 61 2 6274 6590
Accident and serious incident notification: 1800 011 034 (24 hours)
Facsimile: 02 6274 6474; from overseas + 61 2 6274 6474
E-mail: [email protected]
Internet: www.atsb.gov.au
© Monash University 2006.
To encourage the dissemination of this publication, it may be copied, downloaded, displayed,
printed, reproduced, and distributed in unaltered form (retaining this notice). Subject to the
provisions of the Copyright Act 1968, no other use of the material in this publication may be made
without the authorisation of Monash University
ISBN and formal report title: see ‘Document retrieval information’ on page iii.

– iii –
DOCUMENT RETRIEVAL INFORMATION
Report No.
2006-03
Publication date
December 2006
No. of pages
116
ISBN
0 642 25557 1
Publication title
Crash-based Evaluation of Australian Design Rule 69 (Full Frontal Impact Occupant Protection).
Author(s)
Fitzharris M.P., Fildes B.N., Newstead S.V., & Logan D.
Organisation that prepared this document
Accident Research Centre, Monash University
PO Box 70, Monash University Victoria 3800
Sponsored by
Australian Transport Safety Bureau
PO Box 967, Civic Square ACT 2608 Australia
www.atsb.gov.au
Abstract
In-depth data at MUARC was used to evaluate Australian Design Rule 69 (ADR 69), ‘Full
Frontal Impact Occupant Protection’, with respect to both injury risk and cost of injury for drivers
of passenger cars. The effectiveness of frontal airbag deployment was also examined. ADR 69
was introduced in Australia in mid-1995 and was based largely on the US occupant protection
standard, FMVSS 208. The results of this evaluation indicate reductions of 80% and higher in the
likelihood of sustaining AIS 2+ head and face injuries, with even greater gains associated with
frontal driver airbag deployment. The frontal driver airbag was particularly important in reducing
the probability of chest injuries. The average injury cost savings for drivers of post-ADR 69
manufactured passenger cars was found to be as high as AUD$19,000 depending on the body
region, while the combined injury cost saving associated with head, face, neck and chest injuries
combined was AUD$27,000 on average per driver. The findings do however point the way
forward for improvements in vehicle safety design for the further protection of the spine and the
lower extremity in particular, where the regulation has had little impact among this sample of
belted drivers. Limitations of this research and implications of these findings are discussed.
Recommendations to build on the success of ADR 69 are made.
Keywords
Occupant protection, frontal impact, Australian Design Rule, airbags

– iv –
CONTENTS
ACKNOWLEDGEMENTS..................................................................................... viii
EXECUTIVE SUMMARY..........................................................................................x
ABBREVIATIONS................................................................................................... xvi
1 INTRODUCTION ................................................................................................1
1.1 Background.................................................................................................1
1.2 The development of a frontal protection standard for Australia .............2
1.2.1 Stage 1: MUARC Crashed Vehicle Study.............................2
1.2.2 Stage 2: Standards Development Program ............................5
1.2.3 Stage 3: The Cost-effectiveness & Feasibility of Occupant
Protection Devices.................................................................10
1.3 Introduction of Australia’s frontal protection standard .........................12
1.4 Previous research by MUARC................................................................15
1.5 Project objectives .....................................................................................15
1.6 Use of the report.......................................................................................16
2 METHOD.............................................................................................................17
2.1 Study participants.....................................................................................17
2.2 Ethics approvals .......................................................................................18
2.3 Vehicle inspection procedures ................................................................18
2.4 Injury data and the Abbreviated Injury Scale.........................................19
2.5 Cost of injury: The harm concept ...........................................................20
2.6 Inclusion criteria for the evaluation study ..............................................21
2.7 Statistical analysis ....................................................................................22
2.7.1 Injury Risk Analysis..............................................................22
2.7.2 Injury Cost (HARM) Analysis .............................................24
3 RESULTS.............................................................................................................25
3.1 Vehicle, crash and driver demographics.................................................25
3.1.1 Vehicle and crash characteristics .........................................25
3.1.2 Crash Severity........................................................................26
3.1.3 Driver Characteristics............................................................27
3.2 Global injury severity measures ..............................................................30
3.3 Injury risk analysis ...................................................................................32
3.3.1 Head Injury Risk ...................................................................33
3.3.2 Face Injury Risk ....................................................................38
3.3.3 Neck Injury Risk ...................................................................43
– v –
3.3.4 Chest Injury Risk...................................................................49
3.3.5 Abdomen / Pelvic contents Injury Risk ...............................55
3.3.6 Spine Injury Risk...................................................................60
3.3.7 Upper Extremity Injury Risk ................................................64
3.3.8 Lower Extremity Injury Risk................................................72
3.4 Injury cost (harm) analysis: Harm associated with ADR 69 status ......78
3.4.1 Cost of Head Injuries ............................................................78
3.4.2 Cost of Face Injuries .............................................................78
3.4.3 Cost of Neck Injuries ............................................................80
3.4.4 Cost of Chest Injuries............................................................80
3.4.5 Cost of Abdomen / Pelvic content Injuries ..........................80
3.4.6 Cost of Spine Injuries............................................................80
3.4.7 Cost of Upper Extremity Injuries .........................................80
3.4.8 Cost of Lower Extremity Injuries.........................................81
3.4.9 Cost of Injuries Associated With Multiple Body Regions .81
3.4.10 Summary of Injury Costs By Body Region.........................81
4 DISCUSSION ......................................................................................................83
4.1 Principal study outcomes.........................................................................83
4.1.1 Discussion of Injuries to the Head .......................................85
4.1.2 Discussion of Injuries to the Face ........................................85
4.1.3 Discussion of Injuries to the Neck .......................................86
4.1.4 Discussion of Injuries to the Chest.......................................87
4.1.5 Discussion of Injuries to the Abdomen-Pelvic contents .....88
4.1.6 Discussion of Injuries to the Spine.......................................89
4.1.7 Discussion of Injuries to the Upper Extremity ....................90
4.1.8 Discussion of Injuries of the Lower Extremity ...................91
4.1.9 Cost savings associated with ADR 69 .................................92
4.2 Relationship of ADR 69 to the current FMVSS 208 standard..............93
4.3 Importance of ADR 73, the 56 km/h offset frontal test for Australian
passenger cars...........................................................................................95
4.4 Harmonisation and vehicle safety regulations .......................................97
4.5 Study limitations ......................................................................................98
4.5.1 The issue of separating the airbag effect and determining
compliance with ADR 69 .....................................................98
4.5.2 Selection and injury recall bias.............................................99
4.5.3 Potential sample bias and the need for sample weights ......99
4.6 Conclusion..............................................................................................100
5 RECOMMENDATIONS .................................................................................101

– vi –
6 REFERENCES..................................................................................................103
7 APPENDIXES ...................................................................................................109
7.1 Formula for obtaining injury probability estimates .............................109
7.1.1 Equation Box 1. Formulae for the calculation of Head AIS
2+ injuries ............................................................................109
7.1.2 Equation Box 2. Formulae for the calculation of Face AIS
2+ injuries ............................................................................109
7.1.3 Equation Box 3. Formulae for the calculation of Neck AIS
1+ injuries ............................................................................110
7.1.4 Equation Box 4. Formulae for the calculation of Neck AIS
2+ injuries ............................................................................110
7.1.5 Equation Box 5. Formulae for the calculation of Chest AIS
2+ injuries ............................................................................111
7.1.6 Equation Box 6. Formulae for the calculation of Abdomen-
pelvic contents injuries........................................................111
7.1.7 Equation Box 7. Formulae for the calculation of Abdomen-
pelvic contents AIS 2+ injuries ..........................................112
7.1.8 Equation Box 8 Formulae for the calculation of Spine AIS
1+ injuries ............................................................................112
7.1.9 Equation Box 9 Formulae for the calculation of Spine AIS
2+ injuries ............................................................................112
7.1.10 Equation Box 10. Formulae for the calculation of Upper
Extremity AIS 1+ injuries...................................................113
7.1.11 Equation Box 11. Formulae for the calculation of Upper
Extremity AIS 2+ injuries...................................................113
7.1.12 Equation Box 12. Formulae for the calculation of Lower
Extremity AIS 2+ injuries...................................................114
7.2 Summary table of change in injury risk for all injuries .......................115
7.3 Method for the construction of a crash-based weighting system for in-
depth data ...............................................................................................116

– vii –
– viii –
ACKNOWLEDGEMENTS
The authors are indebted to the Australian Transport Safety Bureau, Department of
Transport and Regional Services, Australia, for their sponsorship, interest and
assistance with this project through the Road Safety Research Grant Scheme.
Particular thanks go to Mr John Collis for all his support in seeing this project to
fruition. Thanks also to Mr John Goldsworthy and Mr Craig Newland, Department
of Transport and Regional Services, for comment and helpful advice.
The Authors gratefully acknowledge the contribution of the ANCIS partners,
Holden Australia, and the Australian Transport Safety Bureau (ATSB) in the
conduct of this research.
The ANCIS partners are: Australian Transport Safety Bureau, Department of
Transport and Regional Services; Autoliv Australia; Department of
Infrastructure, Energy and Resources (Tasmania); Ford Motor Company
Australia Ltd; Holden Ltd; Mitsubishi Motors Australia Ltd; Motor
Accidents Authority of NSW; National Roads and Motorists’ Association Ltd
(trading as NRMA Motoring & Services); Royal Automobile Club of
Victoria Ltd; Roads & Traffic Authority (NSW); Transport Accident
Commission (TAC) (Victoria); Toyota Motor Corporation Ltd; VicRoads,
and Observers: Australian Automobile Association (AAA) and the Federal
Chamber of Automotive Industries.
The authors would also like to thank RTA Crashlab in NSW and the Menzies
Research Institute in Tasmania for their data collection efforts as part of the ANCIS
team.
The authors would like to also thank staff at the Accident Research Centre, past and
present for their considerable efforts in the collection of the in-depth data used in
this report.
Thanks also to Mr Julian Del Beato (RACV) for advice concerning airbag
penetration into the Australian fleet.
Finally and most importantly, the authors would like to acknowledge the significant
contribution of each crash-involved driver and their families who participated in the
research programs, without whom evaluations of vehicle safety standards would not
be possible. Similarly, thanks must also be expressed to participating hospitals and
their medical and nursing staff.
The views expressed are those of the authors and do not necessarily represent those
of the sponsors, Monash University or the Accident Research Centre.

– ix –

– x –
EXECUTIVE SUMMARY
ADR 69 was introduced by the Australian Government following continuing
concern for the high number of serious injuries and the high fatality rate associated
with frontal crashes throughout the 1980s. The Australian Government was
committed to achieving reductions in the road toll, and so embarked on a research
program to examine the feasibility and likely benefits of introducing a frontal
impact protection standard. The three-stage research program involved the Monash
University Accident Research Centre collecting information on a sample of crashes
and analysing mass crash data to identify the extent of injuries associated with
passenger car crashes, followed by a crash test program with tests conducted in
accordance with the US Federal Motor Vehicle Safety Standard (FMVSS) No. 208.
Following the third phase, ADR 69 was promulgated on 16th December 1992.
This report set out to examine the effectiveness of Australian Design Rule No. 69,
‘Full Frontal Impact Occupant Protection’, with respect to injury reduction benefits
for belted drivers in passenger cars (Class MA vehicles) involved in real-world
crashes. ADR 69 is a dynamic full frontal crash test at 48 km/h using belted Hybrid
III 50th percentile male crash test dummies, and specifies the maximum acceptable
injury tolerance values for the head, chest and femur. ADR 69 also specified a 4-
second seat-belt warning light, illuminated on vehicle ignition. The regulation
applied to passenger cars (MA vehicles) introduced as a new model from 1 July
1995, and all passenger cars from 1 January 1996. Notably, frontal airbags were not
a mandatory requirement of ADR 69, however many manufacturers elected to
install frontal airbag systems and optimised seat-belt systems as a means to meeting
the requirements of the Standard.
RESEARCH OBJECTIVES
Using in-depth crash information collected from 285 crash-involved belted drivers
in frontal impacts, the research objectives were as follows:
1. Establish the difference in injury risk for each body region associated with
drivers of pre- and post-ADR 69 passenger cars, defined as pre-1995 and post-1995
(ADR build date) respectively.
2. For each body region, to establish the benefits or otherwise of exposure to frontal
airbag systems.
3. Establish for each body region, the injury reduction benefits or otherwise
associated with post-ADR 69 passenger cars with exposure to a frontal airbag
systems compared to drivers of pre-ADR 69 passenger cars without a frontal airbag
deployment.
4. Determine the probability of injury to each body region for drivers of pre- and
post-ADR 69 passenger cars.
5. For each body region, to determine the injury cost savings, if any, associated with
the implementation of ADR 69.

– xi –
INJURY RISK ANALYSIS
The findings of this study, summarised in Table 1, demonstrate significant
reductions in head and face injury risk for drivers of post-ADR 69 passenger cars
relative to drivers of pre-ADR 69 passenger cars involved in frontal impact tow-
away crashes resulting in injury and / or hospitalisation. The results also suggest
that the presence and deployment of the frontal airbag has been instrumental in the
injury reduction benefits observed for the head, face and chest. The combined effect
of post-ADR 69 passenger cars with an airbag indicated benefits over and above the
benefits associated with airbags or ADR 69 implementation alone.
Table 1 also indicates that drivers of post-ADR 69 passenger cars did not
experience any injury reduction benefit for the neck, chest (in the absence of an
airbag), and extremities, while experiencing an indicative increase in injury risk for
the abdomen-pelvic contents, and a significantly higher risk of injuries of the spine,
compared to drivers of pre-ADR 69 passenger cars.
Table 1: Change in injury risk for AIS 2+ injuries associated with ADR 69 status, airbag deployment and the combined effect.
Body region Post-ADR 69
drivers(a)
Airbag exposed
drivers(b)
Post-ADR 69 +
Airbag exposed (c)
Head 78% reduction† 82% reduction
‡ 96% reduction
‡
Face 88% reduction† 91% reduction
‡ 99% reduction
‡
Neck No statistical
difference
No statistical
difference
Indicative 80%
reduction*
Chest No statistical
difference
79% reduction‡ 74% reduction
‡
Abdomen – Pelvic
contents
No statistical
difference
83% reduction† No statistical
difference
Spine 895% increase‡ 82% reduction
‡ No statistical
difference
Upper Extremity No statistical
difference
No statistical
difference
No statistical
difference
Lower Extremity No statistical
difference
No statistical
difference
No statistical
difference
(a) Relative to pre-ADR 69 drivers; (b) Relative to driver’s without an airbag deployment;
(c) Relative to pre-ADR 69 drivers without an airbag deployment; * p 0.1, †p 0.05,
‡p 0.01
Table 2 shows the probability, or risk, (and confidence intervals) of sustaining
moderate and higher severity injuries (AIS 2+) at an impact speed of 48 km/h, the
ADR 69 crash test speed. These estimates simply state, for example, that the risk
for drivers of post-ADR 69 passenger cars of sustaining a moderate or higher
severity injury to the head is 15% at an impact speed of 48 km/h, compared to 44%
for drivers of pre-ADR 69 passenger cars. These estimates point to the chest and
lower extremities as key priorities for future occupant protection countermeasures.

– xii –
Table 2: AIS 2+ Injury probability estimates for drivers of pre-ADR 69 and post-ADR 69 passenger cars by body region at an EBS of 48 km/h
Body region Post-ADR 69 drivers(a)
95th
% CI 95th
% CI
Body
region Probability
Lower Upper
Probability
Lower Upper
Head 0.44 0.23 0.67 0.15 0.05 0.37
Face 0.12 0.03 0.35 0.02 0.002 0.12
Neck 0.09 0.02 0.29 0.04 0.01 0.22
Chest 0.62 0.41 0.79 0.67 0.43 0.84
Abdomen-
Pelvis 0.03 0.01 0.08 0.08 0.02 0.24
Spine 0.03 0.01 0.08 0.21 0.09 0.42
Upper Ex. 0.29 0.15 0.48 0.26 0.12 0.46
Lower Ex. 0.36 0.19 0.57 0.46 0.24 0.70
(a) Relative to pre-ADR 69 drivers
INJURY COST ANALYSIS
The final objective of this research was to determine the injury cost savings, if any,
associated with the implementation of ADR 69. Using HARM as the cost of injury
metric (year 1996 dollar value) and all injuries as the basis of cost, significant
reductions in the cost of injury were associated with the head (AUD$18,970 saving
on average per case), the face (AUD$6,730 saving on average per case), the neck
(AUD$2,660 saving on average per case), while an increase in the cost of injury of
the spine (AUD$1,290 on average per case) was observed. Of concern was the
strong trend of an average per driver AUD$10,800 increase in injury cost for the
lower extremity for drivers of post-ADR 69 passenger cars, and the finding of no
cost of injury reduction for the chest. With respect to chest injuries, a cost reduction
benefit would be observed if the comparison was based on exposure to the frontal
airbag.
The cost savings for individual body regions are not additive, and so the cost of
head, face, neck and chest injuries for post-ADR 69 drivers (mean: AUD$27,790)
was compared to pre-ADR 69 drivers (mean: AUD$58,280), with the regression
analysis indicating an average per driver cost saving of AUD$27,600. The whole-
of-body injury cost analysis suggests a AUD$13,240 benefit, on average, for drivers
of post-ADR 69 passenger cars, however this is not statistically significant and is
substantially lower than the cost savings associated with the head, face, neck and
chest; this result is, principally due to the high cost disbenefit associated with lower
extremity injuries.
These cost injury estimates demonstrate significant cost savings in the regions most
expected given the injury criteria specified in ADR 69, while pointing to the need
for further improvements in controlling lower extremity injury risk.

– xiii –
CONCLUSIONS
This report set out to examine the effectiveness of ADR 69 in preventing injury
among Australian passenger car drivers. The results presented in this report
demonstrate significant benefits associated with the introduction of ADR 69 as well
as the voluntary parallel introduction of frontal airbags in Australia. The results of
this evaluation are applicable only to Class MA passenger cars however, as no
consideration was given to the real-world crash performance of forward control
passenger vehicles (Class MB), off-road passenger vehicles (Class MC), and light
goods vehicles (Class NA, NA1).
This report demonstrated significant reductions in the risk of head, face, neck and
chest injuries associated with the ADR 69 standard and airbag systems in particular.
It is expected that the safety benefits associated with ADR 69 to these body regions
will flow through the passenger car fleet over time, with the injury reduction
benefits to be realised for generations to come. The findings do however point the
way forward for improvements in design standards, with the aim of enhancing the
protection of the abdomen and pelvic contents, the spine, and the lower extremity in
particular, where the regulation has had little improvement in injury risk among this
sample.
Future studies would be best placed to use a larger sample with a greater range of
injury severities than was used here. Further, the benefit of sample weights based
on complete Australian hospital presentation and admission data linked to Police
reported casualty crashes in the evaluation of ADRs cannot be underestimated. The
use of sample weights would ensure the results of future evaluations would be
applicable to all Australian drivers and passengers.
This Report makes a number of recommendations for further study with the intent
of examining methods to improve occupant protection standards, thereby reducing
the number and severity of injuries for male and female passenger car occupants in
Australia.
RECOMMENDATIONS
Recommendations 1 – 4 are made on the basis of the findings of this report, while
Recommendation 5 stems from methodological considerations in the conduct of this
report. In framing Recommendations 1 - 4, the authors are cognisant of the role of
ADR 73, Australia’s Frontal Offset regulatory test, in the current regulatory regime
for passenger car occupants1. It is recommended therefore that an evaluation of
ADR 73 be undertaken using the same methods used in this report so as to assess
both the need, and if necessary the order of priority, of Recommendations 1 - 4.
1 ADR 73/00, Offset Frontal Occupant Protection was mandated to apply to all new model
passenger car vehicles less than 2.5 tonnes from January 2000 and all passenger car vehicles less
than 2.5 tonnes from January 2004. As of Determination No. 2 of 1998, Class MA passenger cars
complying with the requirements of ADR 73 may be deemed to comply with ADR 69 provided
that the vehicles are fitted with dual airbags and the manufacturer can demonstrate by other
allowable methods that the vehicle complies with the requirements of ADR 69. Notably, ADR 73
does not apply to forward control passenger vehicles (Class MB), off-road passenger vehicles
(Class MC), and light goods vehicles (Class NA, NA1), although these vehicles must meet the
requirements of ADR 69.

– xiv –
This principal recommendation is made on the basis of the ADR 73 representing an
updated frontal crash occupant protection standard, recognition of the significant
regulatory hurdles in adopting any changes to the provisions of ADRs, and the
preference of the Australian Government to harmonise vehicle safety regulations in
accordance with the provisions of the United Nations Economic Commission for
Europe (UNECE) 1958 Agreement concerning the adoption of Uniform Technical
Prescriptions for vehicles.
1. Explore the feasibility and likely benefits of increasing the ADR 69 test speed
from 48 km/h to a higher speed, with the aim of further reducing the probability of
injury at higher impact speeds, as beyond the current 48 km/h test speed the
probability of injury remains high. In doing so, consideration of potential
disbenefits of higher test speeds with respect to vehicle aggressivity must be made.
2. That an assessment be made of the necessity and likely benefits of mandating
dual frontal airbags as standard equipment in all passenger cars.
3. Explore the feasibility and likely benefits of inclusion of the 5th percentile
female into the ADR 69 test regime as a means of addressing the increased risk of
chest injury for short-statured drivers.
4. Examine the risk of lower extremity injuries among occupants of ADR 73
compliant passenger cars involved in frontal crashes. In the event of continuing
high risk of injury, as reported in this study, improved injury criteria and new
dummy instrumentation might be an appropriate method of addressing the high risk
of lower extremity injury as highlighted in this study.
5. Examine the feasibility and value of establishing a national injury crash database,
using linked hospital and police crash data. Alternatively, the feasibility of
establishing an on-going national in-depth crash sampling system could be
examined. These initiatives would add value to future vehicle safety evaluations as
well as permitting the monitoring of current and emerging road safety concerns.

– xv –

– xvi –
ABBREVIATIONS
AAAM Association for the Advancement of Automotive Medicine
AAM Alliance of Automobile Manufacturers (USA)
ADR Australian Design Rule
AIS Abbreviated Injury Scale
ANCIS Australian National Crash In-depth Study
ANOVA Analysis of variance
ANPRM Advanced Notice of Proposed Rulemaking
ATSB Australian Transport Safety Bureau (Australia)
BCR Benefit Cost Ratio
BTE Bureau of Transport Economics (Australia)
CDC Collision Deformation Classification
CI Confidence Interval
Clth of Aust. Commonwealth of Australia
CRABI Child Restraint/Air Bag Interaction (CRABI) dummy
CT imaging Computerized axial tomography
CVF Crashed Vehicle File
DoTARS Department of Transport and Regional Services
(Australia)
EBS Equivalent Barrier Speed
EEVC European Experimental Vehicles Committee
EU European Union
EuroNCAP European New Car Assessment Program
FCAI Federal Chamber of Automotive Industries (Australia)
FMVSS Federal Motor Vehicle Safety Standard (USA)
FORS Federal Office of Road Safety (Australia)
FR Federal Register (USA)
GN Gazette Number (Australia)
GVM Gross Vehicle Mass
HIC Head Injury Criterion
ICD The International Statistical Classification of Diseases
and Related Health Problems
IIHS Insurance Institute for Highway Safety (USA)
ISS Injury Severity Score
km/h Kilometres per hour
kN Kilo Newton
LCI Lower Confidence Interval
MA vehicles Passenger cars
MAIS Maximum Abbreviated Injury Scale

– xvii –
MRI Magnetic Resonance Imaging
ms Milli-seconds
m/s Metres per second
MUARC Monash University Accident Research Centre (Australia)
MY Model Year
NASS National Automotive Sampling System
NCAP New Car Assessment Program
NHTSA National Highway Traffic Safety Administration (USA)
Nij Neck injury assessment measure
OR Odds ratio
Pr Probability
ROC Receiver operating curve
RR Relative Risk
SD Standard deviation
SNPRM Supplemental Notice of Proposed Rulemaking
TAC Transport Accident Commission (Australia)
TBT Technical Barriers to Trade
TCFC Tibia Compression Force Criterion
TI Tibia Index
UCI Upper Confidence Interval
UN ECE United Nations Economic Commission for Europe
US United States
US DOT United States Department of Transportation (USA)
VicRoads Roads Corporation of Victoria (Australia)
WG-11 Working Group 11 (of the EEVC)
WTO World Trade Organisation

– 1 –
1 INTRODUCTION
1.1 Background
Historically, Australia has been at the forefront of many road safety initiatives as
evidenced by the introduction of mandatory fitment and wearing of seatbelts in
19722 and the continual investment in road safety countermeasures such as drink-
driving and speed enforcement campaigns. The system of Australian Design Rules
(ADR), introduced in 1969, mandated a variety of safety requirements with the
intent of improving occupant protection standards, of which the mandatory fitting
of seat belts is one example (Seyer, Makeham & McLennan, 1992). Despite
impressive reductions in the number of fatalities on Australian roads throughout the
1980s compared to the 1960s and 1970s, approximately 1900 drivers and
passengers were killed in motor vehicle crashes per annum, with the total road toll
slightly fewer than 3000 fatalities per year (ATSB, 2004a). In the late 1980s the
Australian Federal Government was committed to achieving further reductions in
road trauma, and backed this sentiment by devoting significant resources to road
safety research and public education (Seyer et al., 1992).
2 ADR 4 & ADR 5 (modified to be 5A prior to formal introduction) specified the fitment of
seatbelts and anchorage characteristics, respectively, with both approved in February 1967; these
ADRs became effective 1 January 1969 for the front outboard seats and to the rear seats of
vehicles manufactured from 1 January 1971. ADR 4 specified lap/sash belts fitted to the front
outboard seats and lap belts fitted to other seats. ADR 4 was superseded by ADR 4A which
specified fixed buckle locations of seat belts be fitted for vehicles manufactured on or after 1st
April 1974 and ADR 4B introduced from 1 January 1975 with specifications designed to make
further improvements to the comfort and ease of use, with further amendments made over the
following years (i.e., ADR 4C, 4D) Likewise, ADR 5A was modified to ADR 5B in order to
specify stricter location of upper anchorage points so as to improve the comfort of the seat belt for
the user; this was effective 1 January 1975. ADR 32 and ADR32A cover seat belt fitment for
heavy vehicles, and was effective from July 1977 (Cameron, 1979; Milne, 1985; DoTARS, 2004).
In December 1970 Victoria legislated mandatory seatbelt wearing and NSW followed suit in
October 1971. By 1972 seatbelt wearing was mandatory throughout Australia (Milne, 1985). The
success of mandatory seat belt wearing is well documented (refer Milne, 1985); for example: seat
belt wearing rates for South Australian drivers rose from 23.1% in 1964 to 90.7% in 1977 where
seat belts were actually fitted. The availability of seatbelts in South Australia also rose from 60%
to 94.7% of vehicles fitted with seatbelts in the driver position following legislation by the SA
government in June 1967 specifying that seatbelts be fitted to front outboard seating positions
although wearing remained voluntary until 1971. According to Milne (1985), the non-availability
of seat belts in vehicles was solved by the introduction of the Australian Design Rule system, as
previously manufacturers considered that after-market fitment would satisfy consumer demand for
seat belts given the low demand indicated by low usage. A recent exposure survey in Victoria
indicated that wearing rates were 97% for the driver position, slightly lower for the front left
passenger and 85% for rear occupants (ARUP, 1995).

– 2 –
1.2 The development of a frontal protection standard for Australia
In 1989, the Australian Government commissioned a comprehensive research
program in collaboration with the Monash University Accident Research Centre
(MUARC) to determine the need and feasibility of introducing further vehicle-
based regulations in order to reduce the number of fatalities and injury outcomes of
frontal vehicle crashes. The research program was broadly comprised (based on
published reports) of three stages and a brief description of each stage follows:
• Stage 1: MUARC crashed vehicle study (Fildes, Lane, Lenard & Vulcan, 1991)
• Stage 2: Standards Development program (Seyer, 1992, 1993; Seyer et al.,
1992) involving crash testing seven Australian passenger cars, computer
simulations and laboratory tests of components and their combinations, and
• Stage 3: Examination of the cost-effectiveness and feasibility of improved
occupant protection devices (MUARC, 1992).
1.2.1 Stage 1: MUARC Crashed Vehicle Study
MUARC was commissioned in 1989 to undertake a comprehensive review of the
current status of occupant protection in Australia with the brief to examine overseas
developments in occupant protection (Fildes et al., 1991). MUARC consulted the
international literature with the aim understanding mechanisms of injury, but also to
detail global developments in occupant protection strategies. This process was
undertaken to guide the development of a future occupant protection standard.
The review of the international literature was supported by the analysis of 7.5 years
of mass crash casualty data from the Transport Accident Commission (TAC)
Claims Database. The analysis examined the characteristics of crashes involving
post-1981 passenger cars that occurred across Victoria from January 1982 to June
1988. Importantly, the TAC Claims Database was merged with the Victoria Police
reported crash data supplied by VicRoads, with a 67% match between the two
datasets achieved. The purpose of the analysis of the merged mass dataset was to
provide a comprehensive picture of injury outcomes across all crash types and
provide future directions for occupant protection strategies. The analysis of the
mass data indicated that frontal crashes accounted for 47% (7876) of TAC
Claimants, followed by occupants involved in side impact crashes (25%, n=4164),
rear end crashes (23%, n=3999), and rollover crashes (5%, n=878). A further
finding was that 64% of claimants were drivers, followed by front left passengers
(24%), rear occupants (12.5%), and front-centre occupants (0.5%). With respect to
injury outcomes, head, chest and lower extremity injuries were the most common
injuries sustained in frontal crashes, while for side impact crashes major chest
injuries were of most concern. On the basis of these mass data results, MUARC
suggested that future occupant protection strategies be focussed on frontal crashes
but noted that side impact crashes should also receive priority attention.
The final phase of the MUARC project was to conduct in-depth investigations of
real-world crashes so as to provide causal information on injury contact sources,
and to determine the overall crashworthiness of the vehicles involved. For
consistency with the analysis of the mass casualty crash data, only post-1981
passenger cars and derivatives were included in the analysis. The study considered
crashes occurring between 1st April 1999 and 31st August 1990 in metropolitan and

– 3 –
rural Victoria. The injury outcomes of 269 hospitalised occupants, resulting from
227 real-world crashes (69% metropolitan), were examined with frontal crashes
accounting for 60% of the study population, followed by side impact crashes (35%),
and a smaller number of patients injured due to rollover crashes (5%). The
proportion of injured occupants by seating position approximated the mass data
analysis, with drivers representing 60% (n=167) of injured occupants in the sample,
followed by front left passengers (25%), and rear occupants (13%). The description
of injuries sustained by front seat occupants involved in frontal crashes was as
follows (Fildes et al., 1991:117):
‘Front seat occupants sustained considerable numbers of body injuries
(including both minor and serious injury) to their heads, chests, abdomens,
and lower extremities from contacts with the steering wheel, seat belts,
instrument panels, and windscreen and header. Occupants not wearing
seatbelts sustained more head, face and upper extremity injuries and more
contacts with the windscreen and header, and exterior objects.’
Fildes et al. (1991) reported agreement with injury contact sources noted in the
international literature and showed that the sample of in-depth crashes reflected the
overall pattern of crash types in the mass data analysis. A smaller number of side
impact and rollover crashes were reported, however the analysis was preliminary in
nature due to the focus being on injuries sustained in frontal crashes. With respect
to the relative importance of crash types in setting priorities for vehicle
countermeasures, the authors commented that…
‘…the overwhelming abundance of frontal collisions in vehicle crashes
demands that they receive primary focus in improving vehicle occupant
protection. Moreover, given the predominance of vehicles containing a driver
and / or front passenger, these occupants also deserve special consideration.’
(Fildes et al., 1991:138).
In the analysis of frontal crashes, Fildes et al. (1991) noted ‘considerable’ intrusion
into the front occupant space and this included intrusion of the toe pan and front
floor, instrument panels, steering assemblies, side panels, and console. It was also
noted that major structural failures by way of intrusion and deformations occurred,
particularly of the roof and pillars. With respect to the performance of the steering
column, Fildes et al. (1991) reported that ‘longitudinal movements generally

– 4 –
performed up to ADR 10/01 requirements3, although there were a sizeable number
of upward and sideways movements of the column, not presently covered by this
ADR [10]’ (Fildes et al., 1991:140). By way of explanation, ADR 10, Steering
Column, was designed to minimise crushing or penetrating injuries to drivers due to
contact with the steering column as a result of frontal impact. ADR 10 was the first
ADR directed specifically to injury mitigation in the event of frontal crashes. The
regulation aimed to minimise crushing or penetrating injuries due to the collapse
and deformation of the steering column. The necessity to comply with the
requirements of ADR 10 was superseded by vehicles meeting the requirements of
ADR 69, where a steering column mounted supplementary restraint system was
fitted (see footnote 3 for greater detail).
In tying together the findings of the international literature review, the mass data
injury analysis and the detailed in-depth study of occupant injury, Fildes et al.
(1991) recommended a number of occupant protection countermeasure options,
many of which were focussed on reducing the observed high frequency of severe
head, chest and lower extremity injuries in frontal crashes. As part of the research
program, MUARC (1992) examined the feasibility and cost-benefit of
implementing a range of occupant protection countermeasures designed to reduce
the risk and severity of injury in the event of crashes, the extent of which was
highlighted by the analysis of mass data and detailed examination of in-depth cases
(Fildes et al., 1991). The countermeasures suggested by MUARC (1992) to combat
the high frequency of injuries seen in the analysis of real world data were
categorised into five broad categories, and covered steering assemblies, improved
restraint systems, modifications to the instrument panel, structural improvements
such as modification of the toe pan and instrument panel, and finally windscreens
and associated surfaces. Two key occupant protection countermeasures were the
proposed introduction of frontal airbag systems, acting as a supplementary restraint
given high seat belt wearing rates, and the introduction of a barrier performance
based frontal crash test standard potentially based on US Federal Motor Vehicle
Safety Standard (FMVSS) 208, Occupant Crash Protection (MUARC, 1992). The
earlier reports (Fildes et al., 1991; MUARC, 1992) also highlighted the need for a
frontal offset test, which on having been demonstrated to be cost-effective (Fildes,
3 The intent of ADR 10 was to minimise crushing or penetrating injuries to drivers from impacts
with the steering wheel in frontal crashes by collapsing (axially) or deforming on contact (to align
with the chest/abdomen to spread the load across the contact area) and hence absorb energy
otherwise absorbed by the driver (Cameron, 1979; DoTARS, 2004). ADR 10 sought to limit
column intrusion and specify a degree of energy attenuation by the assembly. ADR 10 was
effective for passenger cars and derivatives manufactured on and after 1 January 1971 (known as
ADR 10A). ADR 10 was modified such that a test of rearward displacement was added, effective
for passenger cars and derivatives manufactured on and after 1 January 1973 to protect the
restrained occupant from contact with the steering wheel (known as ADR 10B). Compliance with
ADR 10 was determined by testing the performance of the steering column by using a body block
‘…moving at a speed of not less than 6.7 m/s…that at no time shall the load exerted on the body
block by the ‘Steering Column’ assembly which is actuated by the driver exceed 11.1 kN, except
for intervals whose cumulative duration is not more than 3 milliseconds’ (ADR10/01) (DoTARS,
2004). A number of alternative standards and test procedures were permitted. Later
Determinations ensured that vehicles are exempt from the requirements of ADR 10 by meeting the
requirements of ADR 69/… (Determination 4 of 1992) by using a steering column mounted
supplementary restraint system, or where a vehicle ‘meets the requirements of ADR 73/…
(Determination 1 of 1998 issue) where a supplementary restraint system is available for both
frontal outboard positions (DoTARS, 2004).

– 5 –
Lane, Lenard, Gantzer, Vulcan & Wenzel, 1994; Fildes, Digges, Dyte, Gantzer &
Seyer, 1996) was later implemented as ADR 73 (DoTARS, 2004).
1.2.2 Stage 2: Standards Development Program
The research conducted by MUARC (Fildes et al., 1991; MUARC, 1992) provided
further impetus and direction for the Australian Government to explore possibilities
for improved occupant protection by demonstrating that significant reductions in
injury risk and cost could be made by implementing a number of countermeasure
options. The adoption of a performance-based frontal impact protection standard,
similar to the US FMVSS 208 Occupant Protection Standard, was a major
consideration. The Federal Office of Road Safety embarked on a AUD$1 million
standards development program that ultimately culminated in the development and
implementation of ADR 69, Full Frontal Impact Occupant Protection (Seyer, 1993).
Australian Design Rule 69 – Full Frontal Impact Occupant Protection, was
introduced in a 4-year phased-in program from 1 July 1995.
The Standards Development Program (Stage 2) consisted of three distinct phases,
each of which is described briefly below (see Seyer, 1993; Seyer et al., 1992).
Phase 1 - Seven locally produced (Australian) passenger cars were subjected to
crash tests, with one model selected for modification and further testing. The
purpose of the crash tests was to provide baseline data of injury risk, benchmarked
against the US FMVSS 208 standard. Tests were conducted in accordance with the
procedures of FMVSS 208 using Hybrid III dummies and conducted at 48 km/h.
Test results indicated that the main performance differences between the vehicles
were in the recorded Head Injury Criterion (HIC) values. The observed HIC values
were higher for the driver (HIC36 median: 820; HIC36 range: 622-1012; Limit:
1000) in all but one case, where significant head contact with the instrument panel
was observed for the front left passenger (HIC36 median: 611; HIC36 range: 322-
872; Limit: 1000); notably the head of the front left passenger contacted the
instrument panel in four of the seven vehicles tested. The principal head contact
points for the driver were the steering wheel or the instrument panel. With respect
to the chest, deceleration was higher for the driver (Median: 47.7g; Range: 46.7-
59.4g; Limit: 60g) than for the front left passenger (Median: 46.2g; Range: 41.1-
50.8g; Limit: 60g), and driver chest contact with the steering wheel was observed in
all seven cases. Similarly, chest deflection was greater for the driver (Median: 41.9
mm; Range: 36.6-49.0 mm; Limit: 76.2 mm) compared to the front left passenger in
all but one case (Median: 33.1 mm; Range: 29.2-39.1 mm; Limit: 76.2 mm).
Passengers did however record lower femur loadings (Median: 1.51 kN; Range:
0.91-3.10 kN; Limit: 10 kN) in all cases compared to drivers (Median: 2.82 kN;
Range: 1.03-15.40 kN; Limit: 10 kN).
On the basis of the Phase 1 results, it was concluded that ‘…while there were some
injury levels near the threshold of a possible significant injury, none of the vehicles
produced dummy responses which were considered life-threatening’. Following
this, a single high volume selling small vehicle was selected for restraint
optimisation and further testing (Seyer et al., 1992: 14). In the Phase 1 tests, five of
the seven vehicles tested met all injury criteria. There was one case where a driver
dummy left femur load exceeded the threshold 10 kN, while another driver dummy
marginally exceeded the HIC36 1000 limit.

– 6 –
Phase 2 - This phase involved the analysis of the Phase 1 crash tests and the
optimisation of advanced restraint technologies by Autoliv in Germany. The
components used in the optimisation process for the selected vehicle were airbags,
buckle pretensioners, webbing clamps and energy absorbing steering wheels, and
three combinations of these optimised technologies. These countermeasure options
were selected as they were seen to be highly cost effective and likely to have
considerable influence in reducing injury risk (MUARC, 1992; Seyer et al., 1992).
Phase 3 - Following the development and optimisation of the three combinations of
enhanced safety systems, three vehicles of the same vehicle model were crash-
tested to determine improvements in occupant protection performance. As with
Phase 1, tests were conducted in accordance with the procedures of FMVSS 208
using Hybrid III dummies and conducted at 48 km/h. The three combinations of
advanced restraint systems were based on (Seyer, 1993):
1. Energy absorbing steering wheel PLUS buckle pretensioners PLUS
webbing clamps
2. Standard restraint system PLUS driver airbag
3. Driver airbag PLUS buckle pretensioners PLUS webbing clamps
The results of phase 3 demonstrated that significant gains could be achieved by
fitting optimised combinations of safety systems. Importantly though, further
laboratory testing demonstrated that fitting various components in a non-optimised
manner to a vehicle may offer little benefit, and in some cases proved
counterproductive, highlighting the importance of specific optimisation.
Further issues of note stemming from Stage 2, Standards Development
Program
1. The debate of the HIC measurement interval: HIC36 vs. HIC15
Seyer (1993) observed that HIC15 was being argued by manufacturers to be a more
appropriate measure of HIC, particularly with the emerging use of Hybrid III crash
test dummies. Debate stemmed from high non-contact HIC36 values being recorded,
it was believed, due to the ‘whipping’ motion of the improved biofidelity of the
Hybrid III dummy neck compared to the Hybrid II dummy. In the early 1990’s, US
manufacturers petitioned NHTSA to use a 15 ms integration period to calculate HIC
when Hybrid III dummies were used. Seyer (1993) noted that the argument that the
shorter integration period did not alter the HIC value when hard contact is made,
but gave a more representative HIC, or accurate assessment of injury risk, when no
head contact occurred in long duration pulses (Seyer, 1993: 6). Indeed, Prasad and
Mertz (1985) reported that there were increased neck loads and hence increased risk
of neck injury in the long pulse duration where no head contact was evident, and
recommended, though did not specify, a limit on neck loads when the head of the 3-
point belt restrained occupant does not contact the forward interior components in
crash tests.
The Phase 1 test results presented both HIC36 and HIC15 and it was found that for
cases where there was no head contact, HIC15 values were 42%-55% lower than
HIC36 values (Seyer, 1993). This relationship was later shown to approximate
HIC15=0.7*HIC36 using US NCAP test results (Eppinger, Sun, Bandak et al., 1999).
Previously, Transport Canada had suggested an 80g limit on resultant head
deceleration rather than HIC to overcome high HIC36 values in non-head contact

– 7 –
situations; this was later adopted as a requirement in vehicles not equipped with
airbags under Canadian Motor Vehicle Safety Regulations Standard 208. In support
of this proposal, Seyer (1993) reported that head deceleration figures in the Phase 1
tests were similar when taken over pure maxima (g max, no time interval) or using
a 3 ms clip, and stated that … ‘specifying a head deceleration limit could be one
way of addressing the non-head contact HIC’ (p.110). In cases of head strikes,
HIC15 values were the same or up to 30% lower than HIC36 values, while head
decelerations using the 3 ms clip ranged from 10-59% different to those measured
over corresponding maximum decelerations. Seyer (1993) concluded that the
comparison of HIC36 and HIC15 values provided an indication of the severity of the
head strike, while no such correlation was evident when decelerations were
calculated using either a 3 ms clip or maxima.
The comments by Seyer (1993) with respect to HIC15 were extremely pertinent in
the context of future rulemaking. Indeed, ADR 69/00 was modified by
Determination No.2 of 1995 to specify that either HIC15700 or a neck injury
tolerance be met in instances of non-contact head acceleration pulses (DoTARS,
2004). In 2000, NHTSA adopted a HIC15 value not exceeding 700 under FMVSS
208 as part of the ‘Advanced Airbag Regulation’, with the regulation meeting a
mandated phase-in schedule (NHTSA, 2000). Using data presented by Mertz,
Prasad and Irwin (1987), a HIC15 of 700 is estimated to represent a 5% risk of an
AIS 4+ injury, while risk values for skull fracture (AIS 2+) reported by Hertz
(1993) using logistic regression for HIC361000 was 47% and for HIC15700 was 31%
(Eppinger et al., 1999; Kleinberger, Sun, Eppinger et al., 1998). NHTSA was able
to change the HIC measurement interval from 36 ms to 15 ms and the reduction in
the HIC value from 1000 to 700 due to the development and use of Nij to set a neck
injury tolerance. In doing so, NHTSA has made the HIC tolerance level more
stringent for short duration pulses where head injuries, such as skull fracture, have
been observed to occur, thus providing a better fit to the underlying biomechanical
data (Eppinger et al., 1999). Following the work of Hertz (1993) and the
interpretation of Eppinger et al. (1999) and Kleinberger et al. (1998), the change
from HIC361000 to HIC15700 sets the ‘accepted’ risk of skull fracture 34% lower
than previously, however this applies only for short duration pulses with hard head
contact. The longer duration HIC361000 essentially acted as a surrogate for neck
injury risk as well as its primary function as measuring head injury risk, and was
deemed no longer required due to mandating the neck injury risk parameter Nij
which sets the tolerance for neck injury risk. With respect to NHTSA FMVSS 208,
HIC15700 applies to the 50th percentile male dummy, the 5th percentile female
dummy and 6 year old dummies, while scaled values of HIC15570 apply to the 3-
year-old and HIC15390 to the 12-month infant (CRABI) dummy scaled from the
mid-sized male (NHTSA, 2000).
In the context of this debate, this report will seek to examine head injury risk for
drivers of post-ADR 69 passenger cars compared to those manufactured prior to the
introduction of ADR 69, i.e., pre-July 1995.
Risk of lower extremity fractures
Analysis of mass injury data and detailed examination of in-depth crashes indicated
that lower extremity injuries were common in frontal crashes (Fildes et al., 1991).
Indeed, further analysis by MUARC demonstrated the most common severe lower
limb injuries were fractures with floor and toe-pan intrusion, the instrument panel
and steering column being the most common contact sources. Axial loading of the

– 8 –
thigh and lower leg, loading of the knee and crushing or extreme inversion /
eversion / dorsiflexion of the foot and ankle were found to be the most common
injury mechanisms (Fildes, Lane, Lenard, Gantzer, Vulcan & Wenzel, 1994).
It must be noted that assessing the risk of lower extremity injuries has proved a
challenge from the outset in crash test programs due to difficulties associated with
instrumentation of the Hybrid III lower leg (NHTSA, 2005). This section briefly
examines this issue as it is of direct relevance to the evaluation of ADR 69 lower
extremity injury risk.
In the conduct of the Standards Development Program, Seyer (1993) reported that
femur loads in the Phase 1 tests (recorded by a single axis load transducer) were
low due to intrusion into the cabin causing articulation of the dummy knee joint.
The tolerance value tested was a femur axial load not exceeding 10 kN,
representing a 35% risk of an AIS 2+ injury (Mertz et al., 1989 cited in Eppinger et
al., 1999).
At the time, Seyer (1993) argued that improved instrumentation of the dummy
lower leg combined with the development of lower leg injury risk indices could
result in an improved understanding of lower extremity injury risk and drive future
reductions in injury risk. Seyer (1993) noted that while lower leg risk indices were
not mandated by current vehicle regulations, the frontal offset crash test procedure
under consideration (at that time) by the European Experimental Vehicles
Committee (EEVC) Working Group (WG-11) would include a lower limb injury
criteria, and argued that such criteria be adopted for full frontal tests if proved of
value through standards development work.
Australia adopted the provisions of UN ECE Regulation No. 94 as ADR 73, Offset
Frontal Impact Occupant Protection; this regulation was mandated to apply from 1
January 2000 to all new passenger car vehicle models (Class MA) and extended to
all passenger cars by 1 January 2004 with a GVM of less than 2.5 tonnes. The goal
of the offset frontal regulation was to ‘improve the level of protection…where only
part of the front structure of the car is engaged in the crash’ (Clth Aust, 1998: ii).
The offset test involves a 56 km/h offset impact with a deformable barrier with 40%
+/-20 mm overlap.
The offset regulation paid particular attention to the lower extremity, and includes
the Tibia Compression Force criterion (TCFC) (not > 8 kN) and the Tibia Index
(TI). The TI was originally developed by Mertz (1993 cited in Eppinger et al.,
1999) and modified by Hobbs (1997 cited in Eppinger et al., 1999) for use by the
EEVC, and is measured at proximal/distal ends of the tibia with injury assessment
values not exceeding 1.3 at either location. The offset regulation also mandated that
the movement of the sliding knee joint not exceed 15 mm (peak displacement), and
also adopted a stricter axial Femur Force Criterion than ADR 69 (not greater than
9.07 kN @ 0 ms, and not greater than 7.58 kN @ 10 ms) (DoTARS, 2004). Using
the same measures, EuroNCAP also assesses lower extremity injury risk in a
64 km/h offset frontal test for the Hybrid III 50th percentile male. EuroNCAP also
tests the TNO P1 child dummy and a TNO P3 dummy in suitable Child Restraint
Systems, although the child dummies are not assessed on lower extremity criteria
(EuroNCAP, 2004a; 2004b).
With respect to the United States, considerable long-term effort on the part of
NHTSA has been made on assessing the value or of including an offset frontal test
and lower leg injury risk measurement as part of the FMVSS 208 Occupant

– 9 –
Protection Standard. Notably, the Insurance Institute for Highway Safety (IIHS,
cited in NHTSA, 1997: 7-8) has been testing US vehicles under the EU offset test
protocol at 64 km/h since 1994, and argues that the full frontal test allows for ‘…the
safety of the combination of the structure, belt and airbag [to] be evaluated…’ and
is especially demanding on restraint systems, while the offset test is especially
demanding on structure and most useful in assessing intrusion, making it a better
test of lower leg injury risk.
In the context of lower extremity injury risk, it is interesting to note that NHTSA
(1997: 2) state:
The FMVSS No. 208 Standard is most effective in preventing head, femur
and chest injuries and fatalities. However it does not directly address lower
limb and neck injuries.
In 1997, NHTSA stated that the addition of a frontal offset test as a supplement to
the FMVSS 208 was under consideration if ‘…the benefits to lower limb injuries
are demonstrated and proven to be cost-effective. The following year, NHTSA
(1998) proposed the inclusion of an offset frontal test for the belted 5th percentile
female (in the full-forward seat position) only, however NHTSA did not include
lower leg criteria in any test procedure. In the Supplementary Notice of Proposed
Rulemaking (SNPRM) (NHTSA, 1999), considerable discussion was given to the
possibility of an unbelted offset deformable barrier crash test in the order of 48-56
km/h as a means of producing benefits related to injury from intrusion, and two
alternative testing regimes were noted: Alternative One involved including an offset
test for the belted 5th percentile female only; Alternative Two involved an offset
test for the belted 50th percentile male and the belted and unbelted 5th percentile
female. The key points raised in the SNPRM concerning the offset test was the need
for the development and selection of appropriate injury indices as well as the need
for significant development work to appropriately instrument the Hybrid III lower
leg for the 5th percentile female and the 50th percentile male. On this point,
Eppinger et al. (1999: 5-3) noted that ‘…the response of the Hybrid III leg is
different than that of a human under similar impact conditions’, with concern being
expressed of the value of the TI and TCFC. The Final Rule for FMVSS 208
(NHTSA, 2000) included a 40 km/h offset test for the belted 5th percentile female
only, with no specification of lower leg injury criteria.
Ongoing concern regarding lower leg injuries led NHTSA to call for public
comment concerning the appropriate instrumentation of the 50th percentile male
and the 5th percentile female Hybrid III dummies for use in both full and offset
frontal crash tests (NHTSA, 2002). Following a crash test program to assess the
value of including a high speed offset test requirement, NHTSA was concerned
about increases in vehicle aggressivity by manufacturers increasing stiffness so as
to perform better in high-speed offset frontal crash tests, particularly with respect to
SUVs, and called for public comment on the way forward (NHTSA, 2003).
Following receipt of public comments and further crash testing, NHTSA withdrew
the rulemaking to amend FMVSS 208 to include a high speed offset frontal test,
principally due to concern for adverse effects on collision partner occupants and
concern for increasing fleet incompatibility (NHTSA, 2005). NHTSA also
withdrew the related rulemaking concerning instrumentation of the lower leg for
use in test protocols until further refinement of fleet benefit estimates can be
obtained. Importantly though, while no specifications exist for either a high speed
offset frontal test or lower leg injury risk measurement at present in the US,

– 10 –
NHTSA (NHTSA, 2005: 49254) remain committed to these additions to FMVSS
208 stating that:
…we believe that a fixed offset deformable barrier crash test, with
applicability limited to a segment of the vehicle fleet (i.e., passenger cars) and
in the range of 56-60 km/h using advanced dummy instrumented legs, would
provide the best opportunity to reduce lower extremity injuries without
exacerbating vehicle incompatibility.
In the final rulemaking process for the revised FMVSS 208 protocol to commence
‘phase-in’ for MY2007, NHTSA reaffirmed the Femur Force Criterion tolerance
value of 10 kN for the 50th percentile Hybrid III male and stipulated a tolerance
value of 6.8 kN for the 5th percentile Hybrid III. Notably, the Alliance of
Automobile Manufacturers (AAM) suggested slightly lower axial force values in
response to the SNPRM (NHTSA, 1999), however NHTSA (2000: 30718) stated:
…the slightly higher axial force limits we are applying today may provide
design flexibility for manufacturers to optimise head, neck and chest
protection for the 50th percentile male and the 5th percentile female. Of
course, vehicle manufacturers are free to voluntarily meet more stringent
force limits than those included in the Standard No. 208.
Evidently, considerable controversy exists concerning the measurement of lower
extremity loading with differing perspectives on measurement between the US and
the UNECE R94 / ADR 73 regulations, and the trade-off to other body regions in
countermeasure design. Notably, lower leg injury criteria (TI; TCFC) have yet to be
applied to ADR 69 (as at November 2005) however it is critical to note that the
Amendments to ADR 69 by Determination No. 2 of 1998 (DOTARS, 2004: ii)
rules that:
…accept that vehicles complying with the new ADR 73 Offset Frontal Impact
Protection, can be deemed to comply to this rule (ADR 69) provided they are
fitted with dual airbags and the manufacturer can demonstrate by other means
that the vehicles would comply with ADR 69.
It remains important, therefore, to quantify the lower extremity injury risk to drivers
of pre-ADR 69 and post-ADR 69 vehicles, as from 2004 all new vehicles in
Australia are tested using the offset frontal test. In doing so, this analysis may
highlight the need or otherwise of the adoption of either a stricter femur axial load
tolerance threshold or the addition of lower leg injury criteria for the full frontal
test, and will also permit an examination of the effectiveness of the lower extremity
measures some time in the future. Further discussion of the role of ADR 73 is
presented in Section 1.3 and the Discussion of this report.
1.2.3 Stage 3: The Cost-effectiveness & Feasibility of Occupant Protection Devices
Following the initial MUARC report (Fildes et al., 1991) and the Standards
Development Program (Seyer et al., 1992; Seyer, 1993), MUARC was
commissioned to examine the economic benefits of 16 frontal crash protection
countermeasures identified and tested in the earlier stages of the research program,
as well as three combinations, or ‘packages’, of measures to provide direction for a
potential frontal impact regulatory standard (MUARC, 1992). Estimations of the
injury reduction effectiveness of the devices were either based on published
literature, or in the absence of such information the consensus of an expert panel.
– 11 –
In order to determine the total cost of introduction, industry input was sought in
order to elucidate any potential barriers and difficulties associated with the
introduction of the suggested countermeasures, while approximate costs of devices
and necessary structural modifications were obtained from local and international
manufacturers and specialist part suppliers.
The Benefit-Cost analysis indicated positive values for the widespread fitting of
frontal airbags acting as supplementary restraint systems, seat-belt webbing clamps
and seat-belt pretensioners. Individual countermeasures regarded as ‘highly
beneficial’ (BCR>3) were energy absorbing padded steering wheel (3.2-16:1; 1.9%
total cost injury saved), improved belt and seat geometry (7.3:1; 1.7%), and knee
bolsters (2.9-4.3:1; 5.3%). Other countermeasures with positive BCRs were the
fitting of seat-belt webbing clamps (1.1-3.5:1; 1.2%), improved lower panels (1.6-
18:1; 2.6%) and full-size driver airbag (1.2:1, 14%) while seatbelt pretensioners
fitted were marginal (0.8-1.1; 2.7%). BCR estimates for measures to mitigate harm
resulting from floor / toepan intrusion and steering column intrusion were unable to
be calculated despite these intrusions having a per unit societal harm estimate of
AUD$151 (the highest) and AUD$62 respectively; MUARC (1992) noted that both
remain areas of priority as the potential reduction in harm was AUD$200 million
per annum, equating to a 6% cost saving in vehicle occupant trauma. The analysis
indicated fitting front full-size passenger airbags would not be cost-beneficial
despite holding an overall 2.4% reduction in total cost of injury. A number of
individual countermeasures were shown to have negative BCRs, such as improved
interior padding and certain airbag configurations.
The feasibility study also explored the BCR of fitting a highly visible and audible
seatbelt warning device, reporting BCRs ranging from 4.1–7.2 depending on the
complexity and effectiveness (up to a 40% increase in restraint use) of the device.
The cost saving associated with a seatbelt warning device was estimated to be 1.9%
of the total cost of trauma. The report is careful to note that the reported BCR is for
all crash types, and that the benefits of such a device, hence BCR, would require
shifting downward if other devices mitigated seatbelt effectiveness, such as airbags.
Recently, the matter of seat belt warning devices has again become of interest,
largely due to moves by EuroNCAP to award up to three additional points to
vehicle models in the calculation of the NCAP score (although not a requirement
for NCAP assessment), depending upon the number of seats to which the device
applies (EuroNCAP, 2005). The ATSB recently commissioned MUARC to
estimate the value of mandating seatbelt warning devices to all new vehicle models
and the feasibility of retrofitting seatbelt warning devices to inform the ADR
Review Process (Fildes, Fitzharris, Koppel et al., 2002; Fildes, Fitzharris, Vulcan et
al., 2003).
The combinations of countermeasures packages used in the Stage 2 Standards
Program (Phase 3) were seen to return BCRs ranging from 1.2-3.4 depending on the
countermeasure combination package considered. In cost reduction terms, the
societal cost-saving ranged from a 17-25% depending on the countermeasure
package. Fitting a driver airbag, either full-size or facebag, in combination with
other countermeasures, resulted in the best injury savings. The best combination of
countermeasures with respect to total cost of injury saved (25% of total injury cost
saved; BCR 1.4-1.6:1) was the fitting of a fullsize driver airbag in combination with
an energy absorbing steering wheel, a front left passenger seat attached belt
pretensioner, a front passenger inertia wheel attached webbing clamp, improved
belt / seat geometry, and knee bolsters across the full lower dash. BCRs were

– 12 –
calculated using the equilibrium method, where it is assumed that the entire vehicle
fleet is fitted with a particular countermeasure, or group of countermeasures. Seyer
et al. (1992) stated that with the age profile of the Australian vehicle fleet,
penetration of countermeasures to the whole vehicle fleet may take over 10 years.
Finally, the potential benefits of Australia adopting requirements based on US
FMVSS 208 were considered. It was not possible to provide cost estimates for the
entire vehicle fleet due to unknown modifications required by manufacturers to
meet test requirements. It was noted by the Federal Chamber of Automotive
Industries (FCAI) that manufacturers would require a three year minimum lead-
time to meet FMVSS 208 requirements, and suggested a 48 months minimum lead-
time for driver airbags and a 60 month lead time for passenger airbags (MUARC,
1992).
1.3 Introduction of Australia’s frontal protection standard
The research program summarised in Section 1.2 demonstrated the frequency and
severity of injuries occurring in frontal crashes, as well as the potential worth of a
range of countermeasures with the principal goal of mitigating injuries resulting
from frontal collisions.
Seyer et al. (1992) noted the distinction between components versus performance
certification, and stated that while vehicles meet an extensive array of existing
design rules based on individual components, such as seat belts and anchorage
strength, occupants of vehicles continued to be seriously injured in frontal impact
crashes. The Standards Development Program demonstrated the value of optimising
individual components into a single system, tailored for each vehicle model. The
recommendation was to shift from component specification to a system
performance-based requirement, where the ‘vehicle manufacturer is clearly
accountable for the performance of the vehicle safety system as a whole’ (Seyer et
al., 1992: 43).
Seyer et al. (1992: 45) concluded that the research program confirmed that the
implementation of an Australian Design Rule based on US FMVSS 208 would
‘bring about the fitment of a range of cost effective emerging safety technology
including airbags and would lead to significant improvements in occupant
protection’. Australia’s superior seatbelt wearing rates compared to the United
States resulted in adapting US FMVSS 208 to ensure test dummies were tested with
seat belts fastened.
As a consequence of the research program, and the perceived need to improve
Australian vehicle safety standards with the fundamental long term view of
reducing the road toll, Australian Design Rule No. 69/00 (ADR 69/00), Full Frontal
Impact Occupant Protection, was introduced under Section 7 of the Motor Vehicle
Standard Acts 1989 (Clth.).
The function and scope of ADR 69/00 (i) is to:
‘…specify vehicle crashworthiness requirements in terms of forces and
accelerations measured on anthropomorphic dummies in outboard front
seating positions in full fontal crashes so as to minimise the likelihood of
injury to occupants of those seating positions’ (DoTARS, 2004).

– 13 –
The specifications of ADR 69/00, as per that published in the Commonwealth of
Australia Gazette No. GN 50 of 16 December 1992, were to be met according to a
phased-in schedule, defined as follows:
• from 1 July 1995, all new model MA vehicles (Passenger car)
• from 1 January 1996, all MA vehicles
• from 1 January 1998, all new model MB (forward control passenger vehicle)
and MC vehicles (off-road passenger vehicles)
• from 1 July 1998, all new model NA1 vehicles (Light goods vehicle)
• from 1 January 2000, all MB and MC vehicles
• from 1 July 2000, all NA1 vehicles.
Vehicles are classified as a ‘new model’ based on the ‘Date of Manufacture’ that
the model is introduced. For example, for passenger car vehicles, the rule is binding
for all new model passenger cars from 1 July 1995. All passenger cars, introduced
as a ‘new model’ or an existing model, must meet the performance specifications
from 1 January 1996.
The performance specifications to be met are presented in Table 3.
Table 3: ADR 69 Full Frontal Impact Occupant Protection Criteria
Test parameter Criteria
Impact velocity 48 km/h (30 mph)
BARRIER Fixed collision barrier perpendicular to the line of travel, conforming to
SAE document J850, ‘Barrier Collision Test’, February 1963.
Test dummy:
Driver & front
left passenger
Until 1 January 1998, either Hybrid II or Hybrid III, restrained by seatbelt
From 1 January 1998, Hybrid III; Restrained by seatbelt
Injury criteria
Head Head Injury Criterion not to exceed 1000 over 36 ms (HIC361000)
Following Determination No 2 of 1995, where no head contact has been
made aside from with the seatbelt or femur/knee, head injury criteria is
met by meeting either:
For the Hybrid II dummy: resultant acceleration measured at the centre
of gravity is not to exceed 75g, except for intervals whose cumulative
distribution is not more than 3 ms, or
For the Hybrid III dummy: the neck injury measurements shall not
exceed 3300 N of tension force in the inferior-superior direction, or
For the Hybrid III dummy: HIC is not to exceed 700 over 15 ms
(HIC15700).
Thorax Chest deceleration measured by accelerometers in the dummy’s chest
must not exceed the limit of 60g, except for values whose cumulative
duration is not more than 3 ms
Sternum Compression deflection of the sternum relative to the spine must not
exceed 76.2 mm (Hybrid III only)
Femur Axial force through each femur not to exceed 10 kN
Other vehicle requirements
Seat belt A continuous or flashing ‘Visual Indicator’ for a period of not less than 4

– 14 –
warning system seconds when the ignition switch is moved to ‘on’/’start’ position
The warning system is not required to operate when either:
the restraint is fastened, or
the restraint is withdrawn more than 10 cm from the retractor
The words ‘Fasten Seatbelts’ or ‘Fasten Belts’ used or the symbol in
Figure 1
A seat belt warning device complying with US FMVSS 208 meets the
requirement
Figure 1: Seat belt warning system telltale, S.5.5.2 ADR 69/00
At the time of the original research program the EEVC were exploring the
feasibility of implementing a frontal offset impact test. Following the adoption of a
frontal offset test by the EEVC as United Nations Economic Commission for
Europe Regulation 94/01 (UNECE R 94/01), the Australian Government adopted
the test procedures that were to be known as ADR 73/00, Offset Frontal Impact
Occupant Protection, with the specific intent of minimising injuries as a
consequence of offset frontal impacts. ADR 73 was binding for all new model MA
vehicles less than 2.5 tonnes (passenger cars) from 1 January 2000 and all MA
vehicles from 1 January 2004 less than 2.5 tonnes. The determination of ADR 73
was published in the Commonwealth Of Australia Gazette No P 18 of 20 July 1998.
Adoption of UNECE R 94/01 as ADR 73/00 represented a significant step in the
harmonisation of vehicle safety standards in accordance with the UNECE 1958
Agreement concerning the Adoption of Technical Prescriptions for Wheeled
Vehicles.
Of direct relevance to ADR 69 was Determination No. 2 of 1998, which stated that
vehicles complying with the requirements of ADR 73 may be deemed to comply
with ADR 69 provided that the vehicles are fitted with dual airbags and the
manufacturer can demonstrate by other allowable methods that the vehicle complies
with the requirements of ADR 69.
The performance requirements of ADR 73 are different in some respects to that of
ADR 69, quite aside from the difference in the degree of overlap with the barrier
(40% with deformable barrier compared to complete overlap with non-deformable
barrier). ADR 73 uses different head injury criteria (HIC361000 and acceleration not
> 80g for more than 3 ms; HIC not applicable when no head contact), neck injury
risk criteria (neck tension, neck shear, neck bending moment), thorax risk criteria
(Thorax Compression Criterion & Viscous Criterion), a different force by time
femur criterion and lower maximum value (9.07 kN), lower leg indices (Tibia
Compression Force Criterion and the Tibia Index), restriction on the extent of knee

– 15 –
joint movement (15 mm), and finally, limits on upwards vertical and rearward
horizontal direction movement of the steering wheel.
The analysis presented in this report includes vehicles manufactured up to and
including 2000. It will be important then to determine whether any of the vehicles
included in the evaluation are new models since 1 January 2000 and hence
compliant with ADR 73.
1.4 Previous research by MUARC
MUARC was commissioned by the Federal Office of Road Safety (FORS) to
conduct a case-control study during 1995 to evaluate the impact of ADR 69 on
passenger car safety. Research examining the effectiveness of ADR 69 was reported
recently for the ATSB [Morris, Barnes, Fildes et al., 2001]. Briefly, the report
found reductions in head, face, neck and chest injuries among occupants of airbag-
deployed vehicles. In addition, using the HARM method, the mean HARM per
driver was 60% higher in non-airbag vehicles compared to airbag equipped and
deployed vehicles. While the findings of the report were extremely positive, the
level of statistical control exercised to account for differences in crash and occupant
characteristics between the airbag and non-airbag group was limited. Furthermore,
the report by Morris et al. (2001) is more appropriately considered an evaluation of
the performance of frontal airbags, as no distinction was drawn between vehicles
based on year of manufacture.
MUARC was recently commissioned to conduct an examination of the potential
worth of mandating the fitment of a more aggressive seatbelt reminder system than
the one specified by ADR 69. This concern was driven by the observation that a
large proportion of seriously injured and fatally injured crash-involved occupants
were unrestrained, and the apparent plateau in seat belt usage rates with no
observed improvement since the introduction of ADR 69 (Fildes et al., 2002; Fildes
et al., 2003). Fildes et al. (2002) argued that in most current model cars the warning
system is generally easy to ignore or deactivate, and that mandating a seat belt
reminder system similar to that specified by EuroNCAP (2005) with both an
audible and visual warning with intensity linked to vehicle speed would be highly
desirable and cost effective. The system mandated by ADR 69 was a less
demanding system than what MUARC (1992) originally had specified when
calculating the BCR for this device, largely due to concerns of the safety of other
roadusers and that of the non-compliant driver; the system called for a reminder
system that would cause the hazard lights of the vehicle to continually flash thereby
potentially embarrassing front seat occupants who failed to wear their seat belts.
The reader is referred to Fildes et al. (2002; 2003) for a full discussion of the
potential benefits of the mandatory fitting of seat belt reminder systems more
aggressive than that currently specified by ADR 69. At the outset, it is important to
state that this current report does not consider the effectiveness or otherwise in the 4
second seat belt ‘tell-tale’ or text warning, rather its focus is the success or
otherwise of the specified injury performance criteria.
1.5 Project objectives
This study aims to evaluate the effectiveness of both ADR 69 and frontal airbag
deployment on injury risk, severity and cost associated with belted drivers involved

– 16 –
in frontal crashes in Australia using more sophisticated analysis techniques than
used previously.
This report examines drivers involved in frontal crashes and studied in-depth by
researchers of MUARC for the period 1989–2002, with the year of manufacture
ranging from 1986-2000. Vehicles manufactured during 1995 were excluded from
the analysis as the build date was not specified in the dataset, and ADR 69 states
that all MA vehicles (passenger cars) must comply with ADR 69 performance
specifications.
Using advanced regression techniques, this paper will report differences in the
likelihood of injury and injury cost benefits for each body region, adjusted for
influential differences in driver and crash characteristics between the two vehicle
groups, defined by those manufactured pre-1995 and post-1995.
1.6 Use of the report
This report is a scientific evaluation of the benefits or otherwise of the injury
criteria specified by ADR 69. The fundamental building block for this analysis is
in-depth crash data collected by researchers at the Monash University Accident
Research Centre, where an individual was involved in a motor vehicle crash.
The intent of this evaluation is to determine the success or otherwise of ADR 69 in
driving improvements in full frontal occupant crash protection in Australia. In
doing so, it is expected that the analysis conducted herein might point to the way to
future improvements in occupant protection. In formulating recommendations that
may stem from the analysis, the authors recognise the significant regulatory hurdles
in adopting any changes to the provisions of ADRs, and the preference of the
Australian Government to harmonise vehicle safety regulations in accordance with
the provisions of the United Nations Economic Commission for Europe (UNECE)
1958 Agreement concerning the adoption of Uniform Technical Prescriptions for
vehicles. It is imperative to note that many of the issues requiring consideration for
any regulatory change are beyond the scope of this document, and any future
changes to ADR 69 would need to be made in accordance with Australian
Government policy.

– 17 –
2 METHOD
2.1 Study participants
This evaluation pools in-depth crash and injury data from three in-depth vehicle
crash studies conducted by MUARC:
1. The Crashed Vehicle File (CVF) conducted from 1989 – 1993;
2. The In-depth tow-away study funded by FORS (now Australian Transport
Safety Bureau, ATSB) to evaluate ADR 69 and conducted from 1995–2000;
3. The current Australian National Crash In-Depth Study (ANCIS)4 from 2000
onwards.
The recruitment of in-depth cases to the CVF and ANCIS study differed to that of
the FORS-funded study. More specifically, the CVF and ANCIS projects enrolled
patients admitted to hospital as a consequence of a traffic crash, while inclusion in
the FORS study was based on involvement in a tow-away crash.
The value of combining the three datasets is that tow-away and hospitalised crashes
are combined and analysed to fully evaluate ADR 69 and airbag effectiveness in
reducing injuries across a broad spectrum of crash severities. It was possible to
combine the separate databases due to the use of common core data points, as well
as the inclusion of EBS to control for crash severity (and other variables) in
regression models. Sample weights designed to provide a fully representative view
of injuries across the fleet were unavailable at this stage (see Section 4.5.3, p.99). A
brief description of the collection procedures is presented below.
Recruitment procedures for hospital-based studies - CVF and ANCIS
Study participants were recruited to the studies following admission to a
participating public hospital as a consequence of being injured in a road traffic
crash. Participants were required to provide informed consent if medically fit to do
so; Next-of-Kin consent was required for those medically unfit to provide informed
consent themselves. For those under 18 years of age, parental consent or that of a
legal guardian was obtained. Finally, for occupants of vehicles legally owned by
another party, the consent of the vehicle owner was required in order to permit a
vehicle inspection to be undertaken.
For both the CVF and ANCIS study, a short interview was undertaken with the
participating occupant whilst an in-patient of the participating hospital. The
interview included information concerning the vehicle, including vehicle
registration, to facilitate the Vehicle Inspection Process. Injury data was obtained
from medical records, including the patient history and diagnostic imaging reports.
4 The ANCIS partners include the Australian Government Department of Transport and Regional
Services; Autoliv Australia; Ford Motor Company Australia Ltd.; Holden Ltd.; Mitsubishi Motors
Australia Ltd.; Motor Accidents Authority of NSW; National Roads and Motorists’ Association,
Royal Automobile Club of Victoria Ltd.; Roads & Traffic Authority (NSW); Transport Accident
Commission (Vic); Toyota Motor Corporation; and VicRoads. The Federal Chamber of
Automotive Industries and the Australian Automobile Association (AAA) are included as
Observers

– 18 –
Recruitment procedures for the FORS funded tow-away study
The FORS funded tow-away study was conducted from 1995–2000 and was
principally funded to evaluate ADR 69. The entry to the study was a tow-away
criterion, with an effort to ensure matching of pre-ADR 69 and post-ADR 69
vehicles. Researchers received voluntary notifications from registered tow-truck
operators with a nominal spotter’s fee being paid. The researchers were informed of
the crash location, the location of the involved vehicle(s) and the name and contact
phone number of the occupant.
Once contacted by a towing agency, the researchers sought written informed
consent of the crash involved party. This involved a telephone conversation where
the study was explained followed by a written explanation of the study with a
consent form attached. The ‘case’ would only proceed following receipt of
informed consent from the vehicle occupant, and vehicle owner if different.
Following consent, a short telephone interview was conducted with the vehicle
occupant detailing the nature of injuries sustained as well as a description of the
crash event itself. For those hospitalised, injury data was obtained from medical
records, such as the patient history and diagnostic imaging reports.
2.2 Ethics approvals
For each of the three projects, The Monash University Standing Committee on
Ethics involving Research on Humans (SCERH) had approved the studies. For the
CVF and ANCIS studies, Institutional Ethics Committees at each of the study
hospitals was also obtained.
2.3 Vehicle inspection procedures
Vehicle inspections were conducted in accordance with standard international
practice (National Automotive Sampling System-NHTSA). Vehicle damage was
coded as per SAE Recommended Practice J224b (SAE, 1980). Delta-V and
Equivalent Barrier Speed (EBS) were determined using Calspan Reproduction of
Accident Speeds on the Highway Version 3 (CRASH3, 1992).
For this report the EBS was used as a measure of crash severity. Following Morris
et al. (2001: 16), EBS is defined as:
Equivalent Barrier Speed (EBS) is defined as the speed in the case vehicle at
which equal energy would be absorbed in a frontal energy impact into a test
barrier; i.e. an estimation of the velocity change at impact that would be
required of a crash test if it were to re-create the same amount of crush that
occurred in the real crash with a vehicle of equal mass and stiffness.
Calculation of EBS also requires measurement of the crush profile of the
damage, but only of the vehicle being studied.
Delta-V is defined as the change in velocity from the moment of impact until the
study vehicle separates from its impacting source (MUARC, 1992). While delta-V
is often viewed as the preferred index velocity change due to consideration of the
characteristics of collision counterpart as well the type of damage profile of both
vehicles, the calculation was not possible for a significant number of cases due the
inability to conduct a vehicle inspection on the opposing, non-case, vehicle. The
– 19 –
calculation of delta-V requires knowledge of the opposing vehicles mass, stiffness,
and damage profile, and when the vehicle collides with a stationary object such as a
tree, pole or lamp-post. For this reason, EBS was used as a measure of crash
severity in this evaluation.
The reader is referred to Morris et al. (2001) for a comprehensive description of
vehicle inspection procedures used in all three crash databases.
2.4 Injury data and the Abbreviated Injury Scale
Injury data were gathered on each occupant involved in the collision. For
hospitalised occupants, injury details were recorded from medical records of the
treating hospital. Participants were also administered a structured interview by a
research nurse. For persons killed in the crash, injury details were obtained from
coronial records. For occupants not requiring hospital treatment, a research nurse
conducted a structured telephone interview to gather crash and injury details. All
injuries, whether self-reported or medically verified, were coded according to the
Abbreviated Injury Scale (AIS), 1990 revision (AAAM, 1998).
The AIS is best regarded as a threat-to-life scale and stemmed from the need of
road safety researchers and the automotive industry in the late 1960s to have a
single standardised injury classification system (AAAM, 1998). Since its
introduction in 1971, the AIS has undergone substantial revision and expansion in
order to meet the growing needs of injury structure and severity specificity required
by researchers and clinicians alike.
The AIS is based on anatomical injury and scores the severity of each injury. The
AIS system does not assess the impairment or disability resulting from the injury.
The AIS classifies individual injuries by body region on a six point ordinal scale
(see Table 4), from AIS 1 (minor injury) to AIS 6 (maximum, currently
untreatable).
Each injury is represented by a 7 digit code, with the seventh digit preceded by a ‘.’
representing the associated severity for the body region and involved structure and
associated type of damage (AAAM, 1998). For example, the code 420210.5 is the
injury code of a thoracic aorta injury, with the digits in order representing the
thorax (4), vessels (system) (2), the specific structure, in this case the aorta (02), a
major laceration (10), with the overall threat-to-life AIS severity score of 5,
representing a ‘critical’ injury.

– 20 –
Table 4: Abbreviated Injury Scale Severity Scores
AIS Severity Score AIS Severity Descriptor
1 Minor
2 Moderate
3 Serious
4 Severe
5 Critical
6 Maximum, currently untreatable
9 Unknown
The AIS permits the expression of injuries in two other ways, the first being the
maximum AIS (MAIS) which can be taken to be the maximum, or highest, injury
for the entire body, or each body region, and secondly, the Injury Severity Score
(ISS). The ISS is calculated for each case, and acts as a global index of injury
severity and reportedly is a ‘better fit between overall severity and survival’
(AAAM, 1998: viii). The ISS is derived from the AIS and ranges from 0
(uninjured) – 75 (un-survivable).
2.5 Cost of injury: The harm concept
HARM is a metric for quantifying societal injury costs from road trauma and
involves a frequency and a unit cost component. The HARM metric has been used
in a number of studies at MUARC as a means of estimating societal benefits from
the introduction of new countermeasures, and was first used in Australia for
determining the feasibility of introducing ADR 69 (MUARC, 1992) as well as a
means for quantifying the financial benefits to society in evaluation studies (Fildes,
Deery, Lenard, et al., 1996; Fildes, Fitzharris, Koppel et al., 2002). HARM benefits,
or total injury cost differences, associated with drivers of pre- and post-ADR 69
manufactured vehicles are presented in the Results.
In its most general form, HARM is used as a measure of the total cost of road
trauma. Injury costs by body region and injury severity were reported earlier and
were determined using the human capital method (MUARC, 1992). Included within
the HARM estimates are treatment, rehabilitation, loss of productivity and wages,
pain and suffering allowances and administration costs. The HARM values were
originally based on total societal crash costs published by Steadman and Bryan
(1988). For the purpose of this report, the HARM values have been re-factored (by
2.5) to reflect more recent estimates of road crash costs published by the BTE
(2000) that were 2.5 times higher than those estimated by Steadman and Bryan
(1988), and these are equivalent to 1996 dollars. The proportional differences do
however remain the same. Table 5 shows the cost of injury by body region and AIS
severity.
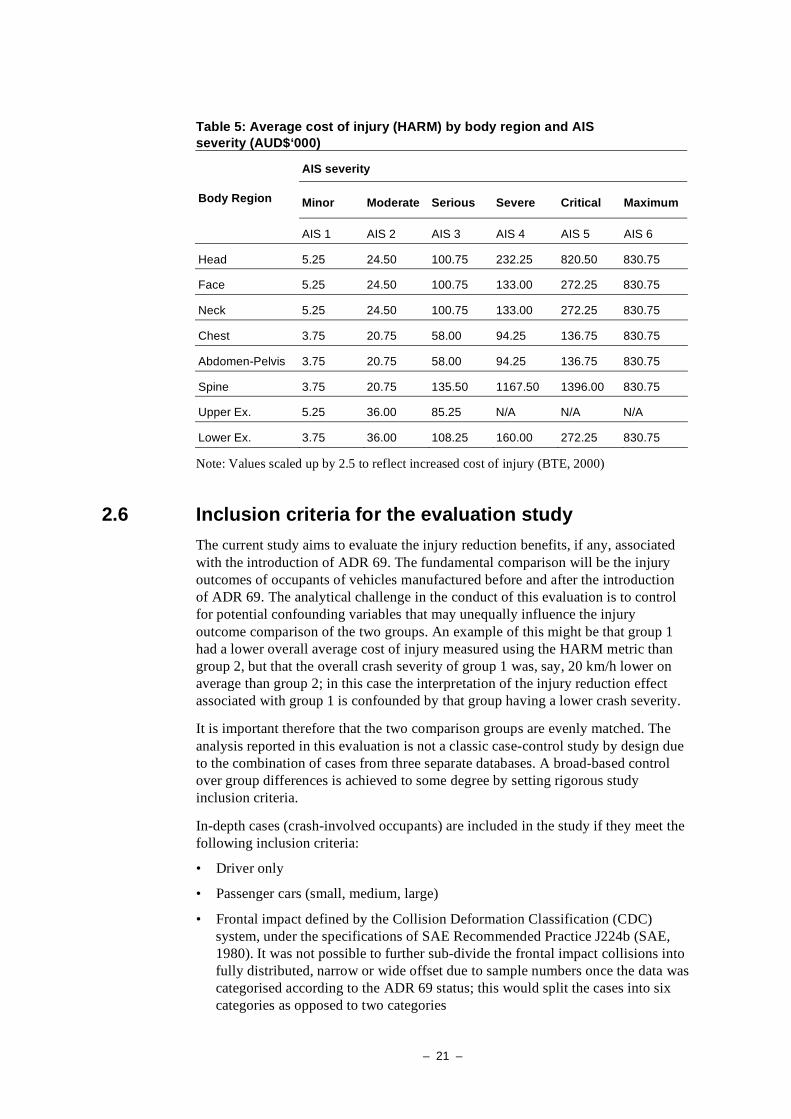
– 21 –
Table 5: Average cost of injury (HARM) by body region and AIS
severity (AUD$‘000)
AIS severity
Minor Moderate Serious Severe Critical Maximum Body Region
AIS 1 AIS 2 AIS 3 AIS 4 AIS 5 AIS 6
Head 5.25 24.50 100.75 232.25 820.50 830.75
Face 5.25 24.50 100.75 133.00 272.25 830.75
Neck 5.25 24.50 100.75 133.00 272.25 830.75
Chest 3.75 20.75 58.00 94.25 136.75 830.75
Abdomen-Pelvis 3.75 20.75 58.00 94.25 136.75 830.75
Spine 3.75 20.75 135.50 1167.50 1396.00 830.75
Upper Ex. 5.25 36.00 85.25 N/A N/A N/A
Lower Ex. 3.75 36.00 108.25 160.00 272.25 830.75
Note: Values scaled up by 2.5 to reflect increased cost of injury (BTE, 2000)
2.6 Inclusion criteria for the evaluation study
The current study aims to evaluate the injury reduction benefits, if any, associated
with the introduction of ADR 69. The fundamental comparison will be the injury
outcomes of occupants of vehicles manufactured before and after the introduction
of ADR 69. The analytical challenge in the conduct of this evaluation is to control
for potential confounding variables that may unequally influence the injury
outcome comparison of the two groups. An example of this might be that group 1
had a lower overall average cost of injury measured using the HARM metric than
group 2, but that the overall crash severity of group 1 was, say, 20 km/h lower on
average than group 2; in this case the interpretation of the injury reduction effect
associated with group 1 is confounded by that group having a lower crash severity.
It is important therefore that the two comparison groups are evenly matched. The
analysis reported in this evaluation is not a classic case-control study by design due
to the combination of cases from three separate databases. A broad-based control
over group differences is achieved to some degree by setting rigorous study
inclusion criteria.
In-depth cases (crash-involved occupants) are included in the study if they meet the
following inclusion criteria:
• Driver only
• Passenger cars (small, medium, large)
• Frontal impact defined by the Collision Deformation Classification (CDC)
system, under the specifications of SAE Recommended Practice J224b (SAE,
1980). It was not possible to further sub-divide the frontal impact collisions into
fully distributed, narrow or wide offset due to sample numbers once the data was
categorised according to the ADR 69 status; this would split the cases into six
categories as opposed to two categories
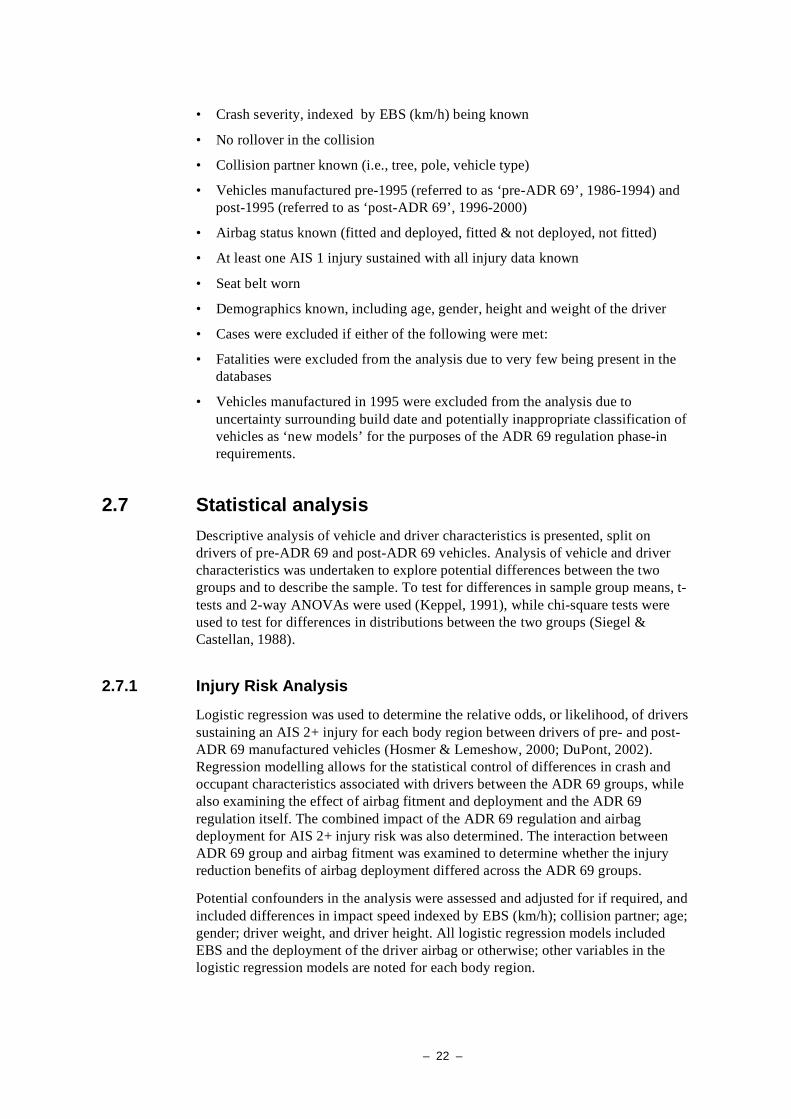
– 22 –
• Crash severity, indexed by EBS (km/h) being known
• No rollover in the collision
• Collision partner known (i.e., tree, pole, vehicle type)
• Vehicles manufactured pre-1995 (referred to as ‘pre-ADR 69’, 1986-1994) and
post-1995 (referred to as ‘post-ADR 69’, 1996-2000)
• Airbag status known (fitted and deployed, fitted & not deployed, not fitted)
• At least one AIS 1 injury sustained with all injury data known
• Seat belt worn
• Demographics known, including age, gender, height and weight of the driver
• Cases were excluded if either of the following were met:
• Fatalities were excluded from the analysis due to very few being present in the
databases
• Vehicles manufactured in 1995 were excluded from the analysis due to
uncertainty surrounding build date and potentially inappropriate classification of
vehicles as ‘new models’ for the purposes of the ADR 69 regulation phase-in
requirements.
2.7 Statistical analysis
Descriptive analysis of vehicle and driver characteristics is presented, split on
drivers of pre-ADR 69 and post-ADR 69 vehicles. Analysis of vehicle and driver
characteristics was undertaken to explore potential differences between the two
groups and to describe the sample. To test for differences in sample group means, t-
tests and 2-way ANOVAs were used (Keppel, 1991), while chi-square tests were
used to test for differences in distributions between the two groups (Siegel &
Castellan, 1988).
2.7.1 Injury Risk Analysis
Logistic regression was used to determine the relative odds, or likelihood, of drivers
sustaining an AIS 2+ injury for each body region between drivers of pre- and post-
ADR 69 manufactured vehicles (Hosmer & Lemeshow, 2000; DuPont, 2002).
Regression modelling allows for the statistical control of differences in crash and
occupant characteristics associated with drivers between the ADR 69 groups, while
also examining the effect of airbag fitment and deployment and the ADR 69
regulation itself. The combined impact of the ADR 69 regulation and airbag
deployment for AIS 2+ injury risk was also determined. The interaction between
ADR 69 group and airbag fitment was examined to determine whether the injury
reduction benefits of airbag deployment differed across the ADR 69 groups.
Potential confounders in the analysis were assessed and adjusted for if required, and
included differences in impact speed indexed by EBS (km/h); collision partner; age;
gender; driver weight, and driver height. All logistic regression models included
EBS and the deployment of the driver airbag or otherwise; other variables in the
logistic regression models are noted for each body region.

– 23 –
In the preliminary model building strategy, variables with a significance value of p
= 0.2 were accepted and formed the basis of the multivariable logistic regression
model. Linearity of continuous variables (EBS, age) was assessed using fractional
polynomials, with transformations undertaken where necessary (Hosmer and
Lemeshow, 2000; Royston and Altman, 1994). Outliers were assessed using
leverage and residuals statistics.
The primary feature of logistic regression is that the outcome is dichotomous in
nature, and in this report is taken to be either injured or not (AIS 1+), or sustaining
an AIS 2+ injury or not. The formulae listed below underpin the logistic regression
analysis of injury risk and are presented in the form of Odds Ratios comparing one
group to another, or probability values based on one or more characteristics. The
probability of a ‘case’ having an injury of interest under a logistic function x, [x]
is:
[x] = exp[ + x] / (1 + [ + x]) [1]
where and are unknown parameters estimated from the data
If we are able to determine the probability of injury, then equally the probability of
being uninjured can be calculated, and is represented in Equation [2]
1 - [x] [2]
Then, to determine the odds of injury of interest we use Equation [3]
[x] / 1 - [x] [3]
And to determine the log odds of injury we use Equation [4]
Error! Objects cannot be created from editing field
codes. = + x [4]
Hence for any number between 0 and 1, the logit function is defined by Equation
[5]
logit [ ] = log[ /1- ] [5]
And Eq.4 can be rewritten as logit [ [xi]] = + xi
The Odds Ratio of two groups can then be calculated as the exponentiated
difference in their individual logits or risk, exp( ), and is interpreted to be the odds
ratio, in this case, of injury associated with a single unit increase in x. The ratio
remains constant for all values of x, assuming that the relationship between the
particular parameter and the outcome variable is linear.
In a practical example Mertz et al. (1989, cited in Eppinger et al., 1999) reported
that the risk of an AIS 2+ femur injury can be given by the probability formula:
Pr (AIS 2+) = 1 / 1 + e(5.795-0.5196*F), where F = femur force in kN

– 24 –
2.7.2 Injury Cost (HARM) Analysis
The difference in average harm between drivers of pre- and post-ADR 69
manufactured vehicles was estimated using a Poisson regression model
compensating for variance over-dispersion (Agresti, 2002). A Poisson regression
model was considered appropriate as the HARM measure is essentially cost-
weighted injury counts. The Poisson error structure of the regression model is
appropriate to reflect the count nature of the data, while the cost weighting leads to
the variance over-dispersion for which the model also accounts. To control for
differences in average crash severity between the two groups, EBS was included as
a covariate in the regression model, as was vehicle market class. It was not possible
to separate the effect of ADR 69 group and airbag deployment in the Poisson cost
model, and therefore the cost effectiveness of post-ADR 69 compared to pre-ADR
69 vehicles is presented. Consequently, the cost of injury for the analysis contains
an unspecified airbag effect.
Analysis was conducted using Stata Intercooled V8.2 (Stata Corp, 2003), and SAS
V.8 (SAS Institute, 1999). A value of p 0.05 was used to assess statistical
significance.

– 25 –
3 RESULTS
3.1 Vehicle, crash and driver demographics
3.1.1 Vehicle and crash characteristics
A total of 285 cases in the dataset satisfied the study entry criteria. Table 6 shows
that of the 285 drivers, 129 (45.3%) were drivers of post-ADR 69 vehicles (1996-
2000), while the remaining 156 (54.7%) were drivers of pre-ADR 69 vehicles
(1986-1994). Of drivers in post-ADR 69 manufactured vehicles, 82.2% (106) had a
frontal airbag system deploy, compared to 30.7% (48) in the pre-ADR 69 group, 2(1)=75.1, p 0.001. The correlation between ADR 69 group and airbag system
status was r=0.51 (p 0.001).
Table 6: Number and percent of drivers by ADR 69 and airbag status
Pre-ADR 69 Post-ADR 69 Airbag status
Freq. % Freq. %
Fitted & deployed 48 30.7 106 82.2
Not fitted, or
Fitted & not deployed 108 69.3 23 17.8
TOTAL 156 100 129 100
The majority of drivers in both ADR 69 groups were occupants of large passenger
vehicles (Table 7). There were significantly more drivers in large vehicles and
fewer in small vehicles among the pre-ADR 69 group compared to the post-ADR
69 group, 2(2)=7.5, p 0.05.
Table 7: Number and percent of drivers by ADR 69 status & vehicle group
Pre-ADR 69 Post-ADR 69 Vehicle
market class Freq. % Freq. %
Small 21 13.50 32 24.8
Medium 9 5.80 11 8.5
Large 126 80.70 86 66.7
TOTAL 156 100 129 100
Cars and passenger car derivatives represented approximately 57% of collision
partners, while poles or trees represented approximately 28% of collision partners
(Table 8). There were a small number of other collision partners, and there was no
difference in the distribution of collision partners between the ADR 69 groups, 2(4)=4.1, p 0.05.
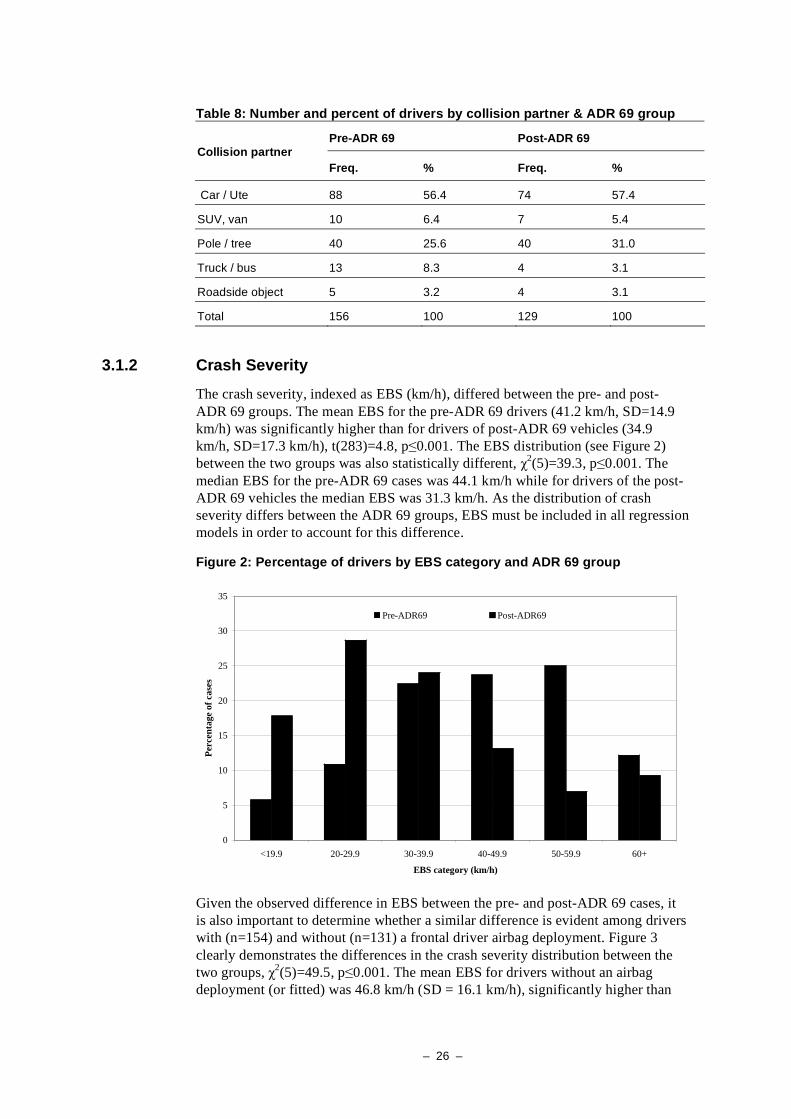
– 26 –
Table 8: Number and percent of drivers by collision partner & ADR 69 group
Pre-ADR 69 Post-ADR 69 Collision partner
Freq. % Freq. %
Car / Ute 88 56.4 74 57.4
SUV, van 10 6.4 7 5.4
Pole / tree 40 25.6 40 31.0
Truck / bus 13 8.3 4 3.1
Roadside object 5 3.2 4 3.1
Total 156 100 129 100
3.1.2 Crash Severity
The crash severity, indexed as EBS (km/h), differed between the pre- and post-
ADR 69 groups. The mean EBS for the pre-ADR 69 drivers (41.2 km/h, SD=14.9
km/h) was significantly higher than for drivers of post-ADR 69 vehicles (34.9
km/h, SD=17.3 km/h), t(283)=4.8, p 0.001. The EBS distribution (see Figure 2)
between the two groups was also statistically different, 2(5)=39.3, p 0.001. The
median EBS for the pre-ADR 69 cases was 44.1 km/h while for drivers of the post-
ADR 69 vehicles the median EBS was 31.3 km/h. As the distribution of crash
severity differs between the ADR 69 groups, EBS must be included in all regression
models in order to account for this difference.
Figure 2: Percentage of drivers by EBS category and ADR 69 group
0
5
10
15
20
25
30
35
<19.9 20-29.9 30-39.9 40-49.9 50-59.9 60+
EBS category (km/h)
Per
cen
tag
e o
f ca
ses
Pre-ADR69 Post-ADR69
Given the observed difference in EBS between the pre- and post-ADR 69 cases, it
is also important to determine whether a similar difference is evident among drivers
with (n=154) and without (n=131) a frontal driver airbag deployment. Figure 3
clearly demonstrates the differences in the crash severity distribution between the
two groups, 2(5)=49.5, p 0.001. The mean EBS for drivers without an airbag
deployment (or fitted) was 46.8 km/h (SD = 16.1 km/h), significantly higher than
– 27 –
the mean EBS for the driver airbag group of 34.2 km/h (SD=14.8 km/h),
t(283)=6.9, p 0.001. Similarly, the median EBS for the non-airbag deployment
group (46 km/h) was higher than for the airbag deployment group (31.8 km/h). As
noted above, EBS must be included in any regression model comparing injury
outcomes between groups defined by the deployment of an airbag or otherwise;
failure to do so would result in confounded, and therefore invalid, results.
Figure 3: Percentage of drivers by EBS category and airbag deployment
status
0
5
10
15
20
25
30
35
<19.9 20-29.9 30-39.9 40-49.9 50-59.9 60+
EBS Category (km/h)
Per
cen
tag
e o
f ca
ses
No airbag Airbag deployed
3.1.3 Driver Characteristics
Driver Gender - Of the 285 drivers, 66% were male (188) and 34% were female
(97). Table 9 indicates that there was no difference in the distribution of male and
female drivers across the two samples, 2(1)=0.2, p 0.05.
Table 9: Number and percent of drivers by gender by ADR 69 status
Pre-ADR 69 Post-ADR 69 Gender
Freq. % Freq. %
Male 101 64.7 87 67.4
Female 55 35.3 42 32.6
Total 156 100 129 100
Driver Age - The overall mean age of pre-ADR 69 drivers (40.2 yrs, SD=14.6 yrs;
Median: 39 yrs) and post-ADR 69 drivers (38.4 yrs, SD=14.4 yrs, Median: 36 yrs)
did not differ (p 0.05). The median values were also similar to the mean, indicating
a relatively normal distribution. Furthermore, there was no difference in the mean
age of males and females either within or between the two ADR 69 groups
(p 0.05). Table 10 and Figure 4 show the age distribution indicating no difference
between the two groups, 2(5)=2.3, p 0.05.

– 28 –
Table 10: Number and percent of drivers by age category and ADR 69 group
Pre-ADR 69 Post-ADR 69 Age category
(years) Freq. % Freq. %
17 – 24 25 16.0 22 17.1
25 – 34 38 24.4 37 28.7
35 – 44 36 23.1 31 24.0
45 – 54 31 19.9 25 19.4
55 – 64 14 8.9 7 5.4
65 - 90 12 7.7 7 5.4
Total 156 100 129 100
Figure 4: Age distribution of drivers by ADR group status
0
5
10
15
20
25
30
35
17 – 24 25 – 34 35 – 44 45 – 54 55 – 64 65 - 90
Age category (years)
Per
cen
tag
e o
f ca
ses
Pre-ADR69 Post-ADR69
Driver height - The overall mean height for males was 178 cm (SD=6.1 cm,
Median: 178 cm; Range: 155-196 cm) and 164.5 cm for females (SD=7.3 cm,
Median: 165 cm; Range: 149-180 cm). A two-way ANOVA indicated that while
the mean height of males and females was statistically different [F(1,281)=236.4,
p 0.001], the difference in height between males and females was equivalent across
the ADR groups (p 0.05). The median height values were also similar to the mean,
indicating relatively normal distribution. Analysis of driver height using 5 cm
intervals indicated that the height distributions of the pre-ADR 69 drivers and post-
ADR 69 drivers was evenly matched, 2(5)=4.7, p 0.05. The overall height
distribution (Table 11, Figure 5) is skewed, reflecting the higher proportion of
males in the sample than female.

– 29 –
Table 11: Number and percent of drivers by height category and ADR 69 group
Pre-ADR 69 Post-ADR 69 Height category
(cm) Freq. % Freq. %
164 40 25.6 32 24.8
165-174 48 30.8 36 27.9
175-179 41 26.3 28 21.7
180-197 27 17.3 33 25.6
Total 156 100 129 100
Figure 5: Height distribution of drivers by ADR 69 group
0
5
10
15
20
25
30
35
40
45
50
<164 165-174 175-179 180-197
Height category (cm)
Per
cen
tage
of
case
s
Pre-ADR69 Post-ADR69
Driver weight - The overall mean weight for males (82.4 kg, SD=13.9 kg, Median:
81 kg; Range: 50-175 kg) was greater than for females (66.2 kg, SD=13.3 kg,
Median: 64 kg; Range: 35-102 kg), [F(1,281)=89.2, p 0.001]. A 2-way ANOVA
indicated that the weight difference between males and females was equivalent
across the ADR groups (p 0.05). The median weight values were also similar to the
mean, indicating a relatively normal weight distribution. Table 12 and Figure 6
presents driver weight using 10 kg intervals, and analysis indicated that the weight
distribution of the pre-ADR 69 drivers and post-ADR 69 drivers was evenly
matched, 2(5)=7.5, p 0.05.

– 30 –
Table 12: Number and percent of drivers by weight category and
ADR 69 group
Pre-ADR 69 Post-ADR 69 Weight category
(kg) Freq. % Freq. %
<60 17 10.9 17 13.2
60-75 59 37.8 38 29.5
76-85 45 28.8 33 25.6
86-99 30 19.2 28 21.7
100+ 5 3.2 13 10.1
Total 156 100 129 100
Figure 6: Weight distribution of drivers by ADR 69 group
0
5
10
15
20
25
30
35
40
<60 60-75 76-85 86-99 100+
Weight category (kg)
Per
cen
tag
e o
f ca
ses
Pre-ADR69 Post-ADR69
3.2 Global injury severity measures
The overall injury severity as indexed by the injury severity score (ISS) of the pre-
ADR 69 drivers and post-ADR 69 drivers did not differ, as can be seen in Figure 7
(t(283)=0.8, p 0.05). The mean ISS for drivers of pre-ADR 69 vehicles was 6.0
(SD=6.7, Range: 1-34, Median: 4) compared to 5.3 (SD=7.5, Range: 1-41, Median:
2) for drivers of post-ADR 69 vehicles. Analysis indicated no difference in the
proportion of drivers’ injuries being classified as minor (ISS<15) or major (ISS>15)
trauma between the ADR 69 groups, 2(1)=0.1, p 0.05. Approximately 9% of
drivers in each group sustained an ISS of greater than 15. While the ISS shows that
drivers of the two ADR 69 groups sustained similar levels of injury, it must also be
remembered that the crash severity of the two groups differed, with the post-ADR
69 group experiencing a lower, on average, crash severity indexed by EBS (km/h).
It is important to explore the individual body regions to examine the specific effect
of the ADR 69 standard on mitigating injury risk.

– 31 –
Figure 7: Cumulative distribution of Injury Severity Score for drivers of pre-ADR 69 and post-ADR 69 vehicles
0
10
20
30
40
50
60
70
80
90
100
1 3 5 7 9 11 13 15 17 19 21 23 25 27 29 31 33 35 37 39 41
Injury Severity Score
Cu
mu
lati
ve
dis
trib
uti
on
% c
ase
sPre-ADR 69 Post ADR 69
An alternative way to examine the overall injury severity is to examine the highest
AIS score, irrespective of body region. In an evaluation of a standard this where
different performance criteria are used for each body region, a global evaluation
such as MAIS provides little information. In any case it remains interesting to note
that the distribution of Maximum Abbreviated Injury Scale scores (MAIS) for
drivers of pre- and post-ADR 69 vehicles differed significantly in Table 13, 2(4)=11.9, p 0.01. A higher proportion of drivers of post-ADR 69 vehicles
sustained AIS 1 (minor) injuries and a correspondingly lower proportion sustained
AIS 2+ injuries compared to drivers of pre-ADR 69 vehicles, although this may
simply reflect differences in EBS (km/h) crash severity. For injuries of AIS 3 and
higher, there was no difference between the groups (see also Figure 8).
Table 13: MAIS distribution for pre- & post-ADR 69 drivers
Pre-ADR 69 Post-ADR 69 MAIS
Freq. % Freq. %
Minor (1) 71 45.5 81 62.8
Moderate (2) 55 35.3 23 17.8
Serious (3) 25 16.0 20 15.5
Severe (4) 4 2.5 4 3.1
Critical (5) 1 0.7 1 0.8
TOTAL 156 100 129 100

– 32 –
Figure 8: Distribution of cases by AIS severity and ADR 69 vehicle group
0
10
20
30
40
50
60
70
Minor (1) Moderate (2) Serious (3) Severe (4) Critical (5)
MAIS severity
Per
cen
tag
e o
f ca
ses
Pre-ADR69 Post-ADR69
3.3 Injury risk analysis
The analysis in this Section, Injury Risk Analysis, will focus on determining the
proportions of drivers sustaining an injury (AIS 1+), as well as those sustaining AIS
2+ injuries, for each body region. The adjusted relative odds ratios of drivers of pre-
& post-ADR 69 vehicles, the impact of airbag deployment and their combined
effect, adjusted for covariates. Adjusted relative odds ratio estimates are presented
for three comparisons:
Comparison 1 - For drivers of post-ADR 69 vehicles relative to drivers of pre-
ADR 69 vehicles, irrespective of airbag deployment status, referred to as ‘Post-
ADR 69’ in all relevant Tables
Comparison 2 - For drivers of airbag deployed vehicles relative to drivers of
vehicles without an airbag deployment, irrespective of ADR 69 status, referred to as
‘Airbag deployment’ in all relevant Tables
Comparison 3 - For drivers of ADR 69 compliant vehicles with an airbag
deployment relative to drivers of pre-ADR 69 manufactured vehicles without an
airbag deployment, referred to as ‘ADR 69+Airbag’ in all relevant Tables; this is
presented to highlight their combined impact on injury risk.
Critically, in interpreting the ‘ADR 69’ result (Comparison 1) the estimate is the
relative odds, or likelihood, of injury irrespective of frontal airbag deployment
status, and as such includes drivers with and without frontal airbag deployment. For
the ADR 69 comparison, inclusion of the airbag variable in the logistic regression
model simply adjusts for differences, if any, in airbag effectiveness between the
pre- and post-ADR 69 groups, but does not remove the impact of the airbag on
injury risk. Consequently, the ADR 69 result contains an unspecified impact of
airbag deployment on injury risk.
Similarly, in interpreting the ‘airbag’ result (Comparison 2), the odds ratio is the
relative odds or likelihood of injury irrespective of ADR 69 status, and
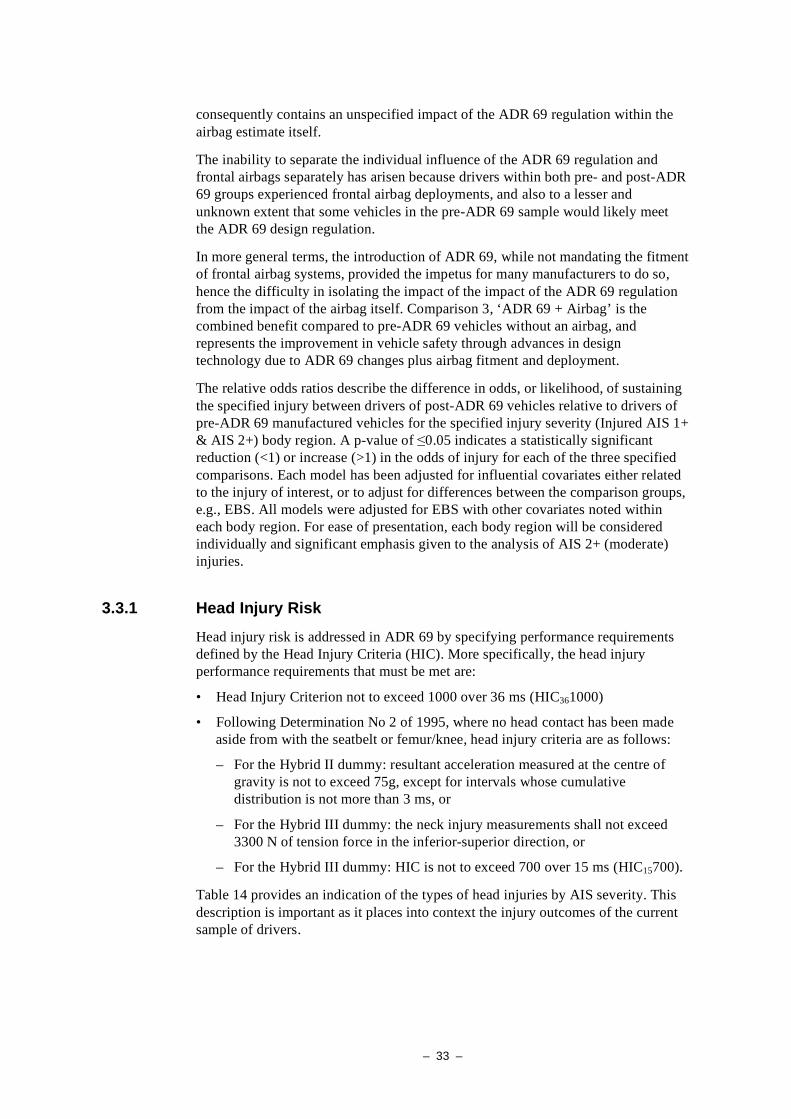
– 33 –
consequently contains an unspecified impact of the ADR 69 regulation within the
airbag estimate itself.
The inability to separate the individual influence of the ADR 69 regulation and
frontal airbags separately has arisen because drivers within both pre- and post-ADR
69 groups experienced frontal airbag deployments, and also to a lesser and
unknown extent that some vehicles in the pre-ADR 69 sample would likely meet
the ADR 69 design regulation.
In more general terms, the introduction of ADR 69, while not mandating the fitment
of frontal airbag systems, provided the impetus for many manufacturers to do so,
hence the difficulty in isolating the impact of the impact of the ADR 69 regulation
from the impact of the airbag itself. Comparison 3, ‘ADR 69 + Airbag’ is the
combined benefit compared to pre-ADR 69 vehicles without an airbag, and
represents the improvement in vehicle safety through advances in design
technology due to ADR 69 changes plus airbag fitment and deployment.
The relative odds ratios describe the difference in odds, or likelihood, of sustaining
the specified injury between drivers of post-ADR 69 vehicles relative to drivers of
pre-ADR 69 manufactured vehicles for the specified injury severity (Injured AIS 1+
& AIS 2+) body region. A p-value of 0.05 indicates a statistically significant
reduction (<1) or increase (>1) in the odds of injury for each of the three specified
comparisons. Each model has been adjusted for influential covariates either related
to the injury of interest, or to adjust for differences between the comparison groups,
e.g., EBS. All models were adjusted for EBS with other covariates noted within
each body region. For ease of presentation, each body region will be considered
individually and significant emphasis given to the analysis of AIS 2+ (moderate)
injuries.
3.3.1 Head Injury Risk
Head injury risk is addressed in ADR 69 by specifying performance requirements
defined by the Head Injury Criteria (HIC). More specifically, the head injury
performance requirements that must be met are:
• Head Injury Criterion not to exceed 1000 over 36 ms (HIC361000)
• Following Determination No 2 of 1995, where no head contact has been made
aside from with the seatbelt or femur/knee, head injury criteria are as follows:
– For the Hybrid II dummy: resultant acceleration measured at the centre of
gravity is not to exceed 75g, except for intervals whose cumulative
distribution is not more than 3 ms, or
– For the Hybrid III dummy: the neck injury measurements shall not exceed
3300 N of tension force in the inferior-superior direction, or
– For the Hybrid III dummy: HIC is not to exceed 700 over 15 ms (HIC15700).
Table 14 provides an indication of the types of head injuries by AIS severity. This
description is important as it places into context the injury outcomes of the current
sample of drivers.

– 34 –
Table 14: Examples of head injuries by AIS severity (AAAM, 1998)
AIS severity Head Injury example
Minor (1) Scalp lacerations & contusions; Headache/dizziness resulting from head
contact
Moderate (2) Laceration or avulsion – major (size), and nerves; Simple fracture vault of
skull; Loss of consciousness (LOC)<1 hour; Concussion
Serious (3)
Artery compromise; Cerebellar & Cerebral contusion; Base of skull
fracture; Cerebrum–subarachnoid haemorrhage;
Vault fracture – comminuted; compound; 1-6 hours LOC
Severe (4)
Laceration intracranial vessels; Cerebellum – large contusion /
haematoma / petechial & subcortical haemorrhage; Complex fracture
base of skull; 6-24 hours LOC, 1-6 hours LOC with on-going neurological
deficit
Critical (5) Major penetrating injury; Laceration intracranial vessels; Injury to brain
stem; large extra/sub-dural haematoma – cerebellar/cerebrum; LOC > 24
hours; LOC 6-24 hours with on-going neurological deficit
Maximum (6) Massive destruction of cranium and skull
The distribution of head injuries by AIS severity for drivers in the pre-ADR 69 and
post-ADR 69 groups is presented in Table 15. The most apparent point of
difference is the higher proportion of drivers of pre-ADR 69 vehicles (21%)
sustaining AIS 2 (moderate) head injuries compared to drivers of post-ADR 69
vehicles (1.5%). The distribution of injuries by the other severities between the
ADR 69 groups is similar. The data presented in Table 15 is simply designed to
provide an indication of the pattern of injury severity and cannot be used to
calculate risk due to previously stated differences in EBS between the ADR 69
groups.
Table 15: Distribution of AIS severity head injuries for pre- & post-ADR 69 drivers
Pre-ADR 69 Post-ADR 69 AIS
Freq. % of drivers Freq. % of drivers
Minor (1) 10 6.4 5 3.9
Moderate (2) 33 21.1 2 1.5
Serious (3) 3 1.9 3 2.3
Severe (4) 3 1.9 2 1.5
Critical (5) 2 1.3 Nil Nil
To determine the difference in head injury risk between drivers in the pre- and post-
ADR 69 group, logistic regression was used to adjust for influential variables, if
any, in order to obtain non-confounded estimates of the difference in injury risk.
Head Injury Risk
Table 16 presents the finding that 28.2% of drivers in pre-ADR 69 vehicles
sustained a head injury compared to 7.7% of drivers in post-ADR 69 vehicles. In
calculating the difference in injury risk, analysis indicated that it was necessary to
adjust for EBS (km/h), vehicle market group (small, medium, large), and collision

– 35 –
partner/struck object; the model displayed ‘excellent’ discrimination with the Area
under the ROC curve being 0.81.
The analysis indicates that the risk of head injury for drivers of post-ADR 69
vehicles was 69% lower than their pre-ADR 69 driver counterparts (OR: 0.31, 0.12-
0.77, p 0.01). The head injury risk reduction associated with airbag deployment
was borderline statistically significant, and the results are suggestive of a 54%
reduction in the risk of sustaining an injury to the head in the event of a frontal
crash relative to those without an airbag deployment (OR: 0.46, 0.20-1.05, p=0.06).
The risk reduction effect for drivers in post-ADR 69 vehicles with an airbag
deployment was 0.14 relative to drivers in pre-ADR 69 vehicles where an airbag
was unavailable, indicating an 84% lower risk of head injury (OR: 0.14, 0.06-0.37,
p 0.001).
Table 16: Percent of drivers sustaining an injury to the head and AIS 2+ head injuries, & the adjusted relative odds ratios for drivers of post-ADR 69 vehicles compared to pre-ADR 69 vehicles, airbag deployments, and the dual effect
Body region
Pre-ADR 69
(n=156)
Post-ADR 69
(n=129)
95% CI
(L-U)
P
Injured / AIS 1+ 28.2% 7.7%
Post-ADR 69 OR: 0.31 0.12-0.77 0.01
Airbag
deployment OR: 0.46 0.20-1.05 0.06
ADR 69+Airbag OR: 0.14 0.06-0.37 0.001
AIS 2+ injury 23.1% 3.9%
Post-ADR 69 OR: 0.22 0.06-0.79 0.05
Airbag
deployment OR: 0.18 0.06-0.58 0.01
ADR 69+Airbag OR: 0.04 0.01-0.18 0.001
AIS 2+ Head Injury Risk
Table 16 also shows that approximately 23% of drivers of pre-ADR 69 vehicles
sustained an AIS 2+ head injury, compared to 4% of drivers of post-ADR 69
vehicles. In calculating the difference in injury risk, analysis indicated that it was
necessary to adjust for EBS (km/h), vehicle market group (small, medium, large),
and occupant weight. The variables of gender, height, and collision partner were not
useful predictors of AIS 2+ head injury risk and were excluded from the regression
model. The logistic regression model displayed ‘excellent’ discrimination with the
Area under the ROC curve being 0.88.
As shown in Table 16 above, the odds ratio associated with drivers of post-ADR 69
vehicles relative to drivers of pre-ADR 69 vehicles was 0.22 (78% reduction), with
95% confidence intervals stating that the reduction in risk might be as great as 94%
to as low as 21% (OR: 0.22, CI: 0.06-0.79, p 0.05). Similarly, the relative odds of
sustaining AIS 2+ head injuries associated with a frontal airbag deployment
compared to drivers of vehicles without an airbag deployment was 0.18 (OR: 0.18,

– 36 –
CI: 0.06-0.58, p 0.01, 82% reduction). The odds ratio for drivers of post-ADR 69
vehicles with an airbag deployment was 0.04 relative to drivers of pre-ADR 69
vehicles without an airbag deployment (OR: 0.04, CI: 0.01-0.18, p 0.001, 96%
reduction). One interpretation of these results is that the frontal airbag is the single
most effective change impacting upon head injury risk.
Of importance were the findings that EBS was significantly related to injury risk
such that a 1 km/h increase translated to a 6% increase in the risk of sustaining an
AIS 2+ head injury (OR: 1.06, CI: 1.04-1.09, p 0.001). The EBS effect was
equivalent for pre-ADR 69 and post-ADR 69 drivers, as well as the two airbag
groups, and was seen to be linear in the logistic regression model.
Vehicle market class was an important factor to adjust for in the statistical model,
and there was some evidence of a trend indicating that the risk of sustaining an AIS
2+ head injury was lower for occupants of medium sized vehicles compared to
those in small vehicles, OR: 0.13, CI: 0.01-1.30, p 0.05. Similarly for drivers of
large vehicles, the point estimate suggests some benefit relative to drivers of small
vehicles, however the odds ratio is not statistically significant (OR: 0.47, CI: 0.16-
1.34, p 0.05).
Figure 9 presents the probability curves associated with pre-ADR 69 drivers and
post-ADR 69 drivers by EBS (km/h), with the vertical line indicating the ADR 69
test speed of 48 km/h. The equations in Equation Box 1, Section 7.1.1, were used to
calculate the probability estimates. The probability curve for drivers of post-ADR
69 vehicles sits to the right of the pre-ADR 69 probability curve, producing a highly
desirable reduction in head injury risk. For instance, the EBS at which a driver of a
pre-ADR 69 vehicle has a 50% chance of sustaining an AIS 2+ head injury is
52 km/h compared to 76.5 km/h for drivers of post-ADR 69 vehicles. Table 17
presents the same probability estimates in 10 km/h increments.
Figure 9: Observed probability distribution for AIS 2+ head injuries for drivers of pre-ADR 69 and post-ADR 69 vehicles; vertical line is ADR 69 test speed
0
0.1
0.2
0.3
0.4
0.5
0.6
0.7
0.8
0.9
1
7 10 13 16 19 22 25 28 31 34 37 40 43 46 49 52 55 58 61 64 67 70 73 76 79 82 85 88 91 94 97
EBS (km/h)
Pro
ba
bil
ity
of
Hea
d A
IS2
+
Post-ADR69 Prob. Post: LCI Post: UCIPre-ADR69 Prob. Pre: LCI Pre: UCI

– 37 –
Table 17: Probability estimates for AIS 2+ head injuries for drivers of post-ADR 69 and pre-ADR 69 vehicles by EBS (km/h) with ADR 69 test speed in bold
Pre-ADR 69 cases Post-ADR 69 cases
95th
% CI 95th
% CI
EBS
(km/h) Probability
Lower Upper
Probability
Lower Upper
20 0.12 0.04 0.32 0.03 0.01 0.13
30 0.20 0.08 0.43 0.05 0.01 0.19
40 0.32 0.15 0.56 0.09 0.03 0.28
48 0.44 0.23 0.67 0.15 0.05 0.37
50 0.47 0.25 0.70 0.16 0.05 0.40
60 0.62 0.37 0.82 0.26 0.09 0.55
70 0.76 0.49 0.91 0.40 0.16 0.70
80 0.85 0.60 0.96 0.55 0.24 0.83
90 0.91 0.70 0.98 0.70 0.34 0.91
Figure 10 presents the probability curve associated with airbag deployment status
by EBS (km/h), with the vertical line indicating the ADR 69 test speed of 48 km/h,
while Table 17 presents the same probability estimates although in 10 km/h
increments, from 20 km/h – 90 km/h. The equations in Equation Box 1,
Section 7.1.1, were used to calculate the probability estimates. The difference in the
probability estimates is readily apparent, with a shift of the curve to the right for
those in airbag deployed vehicles. Table 18 indicates that for drivers of airbag
deployed vehicles, the injury risk at an EBS impact of 60 km/h is 0.23 (CI: 0.06-
0.60), compared to the risk for drivers without an airbag deployment of 0.62 (CI:
0.37-0.82).
Figure 10: Observed probability distribution for AIS 2+ head injuries for drivers of vehicles with and without frontal airbag deployments; vertical line is ADR 69 test speed
0
0.1
0.2
0.3
0.4
0.5
0.6
0.7
0.8
0.9
1
7 10 13 16 19 22 25 28 31 34 37 40 43 46 49 52 55 58 61 64 67 70 73 76 79 82 85 88 91 94 97
EBS (km/h)
Pro
ba
bil
ity
of
Hea
d A
IS2
+
Airbag Prob. Airbag: LCI Airbag: UCINo airbag Prob. No airbag: LCI No airbag: UCI

– 38 –
Table 18: Probability estimates for AIS 2+ head injuries for drivers of vehicles with and without airbag deployment by EBS (km/h) with ADR 69 test speed in bold
Non-airbag deployed cases Airbag deployed cases
95th
% CI 95th
% CI
EBS
(km/h) Probability
Lower Upper
Probability
Lower Upper
20 0.12 0.04 0.32 0.02 0.005 0.12
30 0.20 0.08 0.43 0.04 0.01 0.18
40 0.32 0.15 0.56 0.08 0.02 0.29
48 0.44 0.23 0.67 0.12 0.03 0.40
50 0.47 0.25 0.70 0.14 0.03 0.43
60 0.62 0.37 0.82 0.23 0.06 0.60
70 0.76 0.49 0.91 0.36 0.09 0.75
80 0.85 0.60 0.96 0.51 0.14 0.87
90 0.91 0.70 0.98 0.66 0.20 0.93
3.3.2 Face Injury Risk
ADR 69/00 did not provide for any specification designed directly to reduce injury
risk for the face, however the head injury criteria of ADR 69 would be expected to
provide injury reduction benefits. Table 19 provides an indication of the types of
face injuries by AIS severity and places into context the injury outcomes of the
current sample of drivers.
Table 19: Examples of face injuries by AIS severity (AAAM, 1998)
AIS severity Face Injury example
Minor (1)
Superficial lacerations, contusions & penetrating injuries, ear injury,
eye injuries (corneal abrasions) except globe ruptures/avulsions,
mandibular fracture – minor, nose fracture – closed,
teeth injuries
Moderate (2)
Penetrating injury with tissue loss; major (size/depth) skin, muscle,
subcutaneous laceration / avulsion;
optic nerve contusion / laceration; eye globe ruptures/avulsions; retinal
detachment;
alveolar ridge fracture with or without teeth involvement;
subcondylar or open mandibular fracture;
Maxilla Leforte I & II fractures; Open nose fracture; Zygoma fracture
Serious (3)
large blood loss due to injury to skin, muscle, subcutaneous laceration /
avulsion; external carotid – major;
LeForte III;
Open/displaced/comminuted orbit fracture
Severe (4) LeForte III with >20% blood loss by volume

– 39 –
Table 20 presents the distribution of face injuries by AIS severity for drivers in the
pre-ADR 69 and post-ADR 69 groups. Approximately 39% of pre-ADR 69 drivers
sustained an AIS 1 face injury compared to 24.8% of drivers of post-ADR 69
vehicles. A larger proportion of drivers of pre-ADR 69 vehicles sustained AIS 2
face injuries compared to 1.5% of drivers of post-ADR 69 vehicles.
Table 20: Distribution of AIS severity face injuries for pre-& post-ADR 69
drivers
Pre-ADR 69 Post-ADR 69 AIS
Freq. % of drivers Freq. % of drivers
Minor (1) 61 39.1 32 24.8
Moderate (2) 18 11.5 2 1.5
Serious (3) 1 0.6 1 0.8
Severe (4) Nil Nil Nil Nil
Face Injury Risk
Table 21 presents the finding that 39.7% of drivers in pre-ADR 69 vehicles
sustained a face injury (AIS 1+) compared to 25.6% of drivers in post-ADR 69
vehicles. In calculating the difference in injury risk, analysis indicated that it was
necessary to adjust for EBS (km/h), vehicle market group (small, medium, large),
and collision partner/struck object; the model displayed ‘excellent’ discrimination
with the Area under the ROC curve being 0.88 while the Hosmer-Lemeshow
Goodness of fit test indicated good model fit, p=0.9.
The analysis suggests that the risk of face injury for drivers of post-ADR 69
vehicles was 29% lower than their pre-ADR 69 driver counterparts, though the
difference was not statistically significant (OR: 0.71, 0.36-1.38, p 0.05). Similarly,
there was some evidence of an injury risk reduction benefit associated with airbag
deployments, although this was also not statistically significant (OR: 0.60, 0.31-
1.16, p 0.05). Importantly though, there was a statistically significant 58% injury
reduction benefit for drivers of post-ADR 69 vehicles with an airbag deployment
when compared to drivers of pre-ADR 69 vehicles where an airbag was unavailable
(OR: 0.42, 0.22-0.84, p 0.05).
AIS 2+ Face Injury Risk
Table 21 shows that a higher proportion of drivers of pre-ADR 69 vehicles (11.5%)
sustained an AIS 2+ face injury compared to post-ADR 69 drivers (1.5%). The
statistical model building process indicated that ADR 69 status, airbag status, EBS,
vehicle market class (small, medium, large) and collision partner / object struck
were important variables to control for in the calculation of AIS 2+ face injury risk,
with the overall model being statistically significant, 2(7)=53.7, p 0.001. The
statistical model displayed ‘outstanding’ discrimination with the Area under the
ROC curve being 0.90 while the Hosmer-Lemeshow Goodness of fit test indicated
good model fit, p=0.9.
The odds ratio, or likelihood, of drivers of post-ADR 69 vehicles sustaining an AIS
2+ face injury relative to that of drivers of pre-ADR 69 vehicles was 0.12,
indicating an 88% reduction in ‘moderate’ and more serious injuries to the face
(OR: 0.12, CI: 0.02-0.83, p 0.05). For drivers where an airbag was available and

– 40 –
deployed, the odds of sustaining an AIS 2+ facial injury was 0.09 relative to drivers
without a frontal airbag deployment (OR: 0.09, CI: 0.01-0.91, p 0.05; 91%
reduction). The benefits of ADR 69 status and airbag deployment appear additive in
that the relative odds of sustaining AIS 2+ face injuries for drivers of post-ADR 69
vehicles with an airbag deployment relative to drivers of pre-ADR 69 vehicles
without a frontal airbag system deployment was 0.01 (CI: 0.001-0.18, p 0.001).
Table 21: Percent of drivers sustaining an injury to the face and AIS 2+ face
injuries, & the adjusted relative odds ratios for drivers of post-ADR 69 vehicles compared to pre-ADR 69 vehicles, airbag deployments, and the dual effect
Body region
Pre-ADR 69
(n=156)
Post-ADR 69
(n=129)
95% CI
(L-U)
P
Injured / AIS 1+ 39.7% 25.6%
Post-ADR 69 OR: 0.71 0.36-1.38 0.05
Airbag deployment OR: 0.60 0.31-1.16 0.05
ADR 69+Airbag OR: 0.42 0.22-0.84 0.01
AIS 2+ injury 11.5% 1.5%
Post-ADR 69 OR: 0.12 0.02-0.83 0.05
Airbag deployment OR: 0.09 0.01-0.91 0.01
ADR 69+Airbag OR: 0.01 0.001-0.18 0.001
The model building process revealed that EBS (km/h) was significantly related to
AIS 2+ face injury risk, such that for every 1 km/h increase in EBS there was an 8%
increase in the likelihood of sustaining an AIS 2+ face injury, and this relationship
was seen to be linear (OR: 1.08, CI: 1.04-1.12, p 0.001). While the comparisons
are not statistically significant, vehicle market class was an important variable to
adjust for in the derivation of the effectiveness of both ADR 69 and airbags on face
injury risk. There was, however, some indicative evidence that drivers of medium
and large vehicles being associated with a lower risk of AIS 2+ face injury risk
compared to drivers of small vehicles (Medium: OR: 0.34, CI: 0.03-3.81, p 0.05;
Large: OR: 0.37, CI: 0.10-1.40, p 0.05). The object struck was an important
predictor of AIS 2+ face injuries, such that those impacting poles and trees were
seven times more likely to sustain a moderate or worse face injury (OR: 7.10, 1.92-
26.1, p 0.01) relative to those impacting another sedan or derivative. Although the
confidence intervals are wide, there was a trend toward higher injury risk for drivers
striking vehicles in the 4WD / van / truck / bus grouping compared to sedan or
derivative vehicles (OR: 3.50, 0.78-15.64, p 0.05).
Figure 11 presents the observed probability distribution for AIS 2+ face injuries for
drivers of pre-ADR 69 vehicles and post-ADR 69 vehicles, while Table 22 presents
the probability estimates in 10 km/h EBS increments. The equations in Equation
Box 2, Section 7.1.2, were used to calculate the probability estimates, and these are
adjusted estimates. The difference in injury risk is evident with the post-ADR 69
probability curve sitting to the right of the pre-ADR 69 curve, reflecting the odds
ratio presented in Table 21 (OR: 0.12, CI: 0.02-0.83, p 0.05). The risk beyond 48
km/h (indicated by the vertical line) increases, however the overall probability of

– 41 –
injury for drivers of post-ADR 69 vehicles remains relatively low, reaching a
maximum of 40% compared to pre-ADR 69 drivers reaching a maximum
probability risk of 83% at an EBS of 97 km/h.
Figure 11: Observed probability distribution for AIS 2+ face injuries for
drivers of post-ADR 69 vehicles; vertical line is ADR 69 test speed
0
0.1
0.2
0.3
0.4
0.5
0.6
0.7
0.8
0.9
1
7 10 13 16 19 22 25 28 31 34 37 40 43 46 49 52 55 58 61 64 67 70 73 76 79 82 85 88 91 94 97
EBS (km/h)
Pro
ba
bil
ity
of
Fa
ce A
IS2
+
Post-ADR69 Prob. Post: LCI Post: UCIPre-ADR69 Prob. Pre: LCI Pre: UCI
Table 22: Probability estimates for AIS 2+ face injuries for drivers of post-
ADR 69 and pre-ADR 69 vehicles by EBS (km/h) with ADR 69 test speed in bold
Pre-ADR 69 cases Post-ADR 69 cases
95th
% CI 95th
% CI
EBS
(km/h) Probability
Lower Upper
Probability
Lower Upper
20 0.016 0.003 0.094 0.002 0.000 0.029
30 0.033 0.007 0.149 0.004 0.000 0.046
40 0.068 0.017 0.240 0.009 0.001 0.076
48 0.117 0.031 0.350 0.016 0.002 0.115
50 0.133 0.036 0.384 0.019 0.003 0.128
60 0.245 0.072 0.576 0.039 0.006 0.218
70 0.406 0.126 0.765 0.079 0.013 0.362
80 0.590 0.199 0.893 0.153 0.026 0.554
90 0.752 0.289 0.958 0.276 0.047 0.746
Figure 12 presents the observed probability distribution for AIS 2+ face injuries for
drivers of vehicles with and without airbag deployments, while Table 23 presents
the probability estimates in 10 km/h EBS increments.
The difference in injury risk between the airbag deployed and non-airbag group is
evident, with the curves appearing to separate as EBS increases, however the
confidence intervals are also increasingly wide. The risk among drivers of airbag
deployed vehicles is very low in comparison to the non-airbag group, with the

– 42 –
probability at 60 km/h being 3% compared to 24%, although as noted the
confidence intervals are wide. Importantly though, the odds ratio indicates a highly
beneficial airbag effect (OR: 0.09, CI: 0.01-0.91, p 0.05; 91% reduction).
Figure 12: Observed probability distribution for AIS 2+ face injuries for
drivers of airbag deployed and non-airbag fitted/deployed vehicles; vertical line is ADR 69 test speed
0
0.1
0.2
0.3
0.4
0.5
0.6
0.7
0.8
0.9
1
7 10 13 16 19 22 25 28 31 34 37 40 43 46 49 52 55 58 61 64 67 70 73 76 79 82 85 88 91 94 97
EBS (km/h)
Pro
ba
bil
ity
of
Fa
ce A
IS2
+
Airbag Prob. Airbag: LCI Airbag: UCINo airbag Prob. No airbag: LCI No airbag: UCI
Table 23: Probability estimates for AIS 2+ face injuries for drivers of vehicles
with and without airbag deployment by EBS (km/h) with ADR 69 test speed in bold
Non-airbag deployed cases Airbag deployed cases
95th
% CI 95th
% CI
EBS
(km/h) Probability
Lower Upper
Probability
Lower Upper
20 0.016 0.003 0.094 0.002 0.000 0.032
30 0.033 0.007 0.149 0.003 0.000 0.057
40 0.068 0.017 0.240 0.007 0.000 0.103
48 0.117 0.031 0.350 0.013 0.001 0.166
50 0.133 0.036 0.384 0.015 0.001 0.187
60 0.245 0.072 0.576 0.031 0.002 0.326
70 0.406 0.126 0.765 0.064 0.004 0.518
80 0.590 0.199 0.893 0.126 0.008 0.715
90 0.752 0.289 0.958 0.232 0.015 0.860

– 43 –
3.3.3 Neck Injury Risk
When first mandated, ADR 69/00 used the head injury tolerance of HIC361000. As
noted in Section 1.2, the US regulators specified the 36 ms integration interval to
provide a degree of protection for the neck. Following debate and evidence of
differences in the risk of injury between HIC361000 for short duration hard contact
pulses and long duration no head contact pulses, the US FMVSS 208 regulation was
changed to introduce HIC15700 as well as a Neck Injury Risk tolerance parameter.
In Australia, DoTARS regulators also adopted HIC15700 for instances of no head
contact, and also a neck injury tolerance value such that the neck injury
measurements shall not exceed 3300N of tension force in the inferior-superior
direction; additionally, head acceleration was not permitted to exceed 75g. These
regulatory changes are important to evaluate and are the focus of this sub-section.
To provide context with respect to the type of neck injuries and their associated
severity, Table24 details common neck injuries.
Table 24: Examples of neck injuries by AIS severity (AAAM, 1998)
AIS severity Neck Injury example
Minor (1) Superficial lacerations, contusions & penetrating injuries; laceration
internal/external jugular vein;
Moderate (2)
Penetrating injury with tissue loss; major (size/depth) skin, muscle,
subcutaneous laceration / avulsion; minor vessel (carotid artery -
external, jugular vein, vertebral artery) injury; phrenic nerve injury;
larynx contusion; hyoid fracture
Serious (3)
large blood loss due to injury to skin, muscle, subcutaneous
laceration / avulsion; carotid – internal, artery injury; vertebral injury;
larynx perforation; pharynx contusion
Severe (4) Carotid and vertebral artery disruption with neurological deficit;
larynx perforation with vocal cord involvement
Critical (5) Major carotid artery injury; larynx & pharynx tear
Maximum (6) Decapitation
Table 25 presents the distribution of neck injuries by AIS severity for drivers in the
pre-ADR 69 and post-ADR 69 groups. Table 25 indicates that 25% of pre-ADR 69
drivers sustained an AIS 1 neck injury compared to 18.6% of drivers of post-ADR
69 vehicles. A larger proportion of drivers (4.5%) of pre-ADR 69 vehicles sustained
AIS 2+ neck injuries compared to 1.5% of drivers of post-ADR 69 vehicles.
Table 25: Distribution of AIS severity neck injuries for pre-& post-ADR 69 drivers
Pre-ADR 69 Post-ADR 69 AIS
Freq. % of drivers Freq. % of drivers
Minor (1) 39 25 24 18.6
Moderate (2) 5 3.2 2 1.5
Serious (3) 2 1.3 Nil Nil
Severe (4) Nil Nil Nil Nil
Critical (5) Nil Nil Nil Nil

– 44 –
Neck Injury Risk
This section deviates somewhat from the other body region sections in that it
examines AIS 1+ injuries in detail due to the small number of drivers sustaining
AIS 2+ neck injuries in the sample. It is important to note that ‘whiplash’ injuries
are coded as AIS 1 (minor) injuries in the Spine body region (Section 3.3.6) as per
the AIS coding system. For reasons of consistency, AIS 2+ neck injury risk via the
presentation of odds ratios is discussed, although probability charts are not
presented.
Table 26 presents the finding that 30% of drivers in pre-ADR 69 vehicles sustained
a neck injury compared to 20% of drivers in post-ADR 69 vehicles. In calculating
the difference in injury risk, analysis indicated that it was necessary to adjust for
EBS (km/h) and driver age. Age was transformed using fractional polynomials as
the effect of increasing age did not translate to a linear increase in neck injury risk.
The variables, vehicle market class (small, medium, large), collision partner/struck
object, and driver weight, height, and gender were of no predictive value to the final
statistical model and were therefore excluded. The logistic regression model
displayed ‘borderline acceptable’ discrimination, with the Area under the ROC
curve being 0.65.
The analysis indicates that the risk of neck injury for drivers of post-ADR 69
vehicles was 27% lower than their pre-ADR 69 driver counterparts, although the
difference was not statistically significant (OR: 0.73, 0.38-1.43, p 0.05). This
estimate is adjusted for airbag deployment status, EBS (km/h) and age. The benefit
associated with airbag deployment was higher, such that the results suggest that
frontal airbag deployment is associated with a statistically significant 53%
reduction in the risk of sustaining an injury to the neck (OR: 0.47, 0.24-0.93,
p 0.05). Drivers in post-ADR 69 vehicles with an airbag deployment had a neck
injury risk of 0.35 relative to drivers of pre-ADR 69 vehicles where an airbag was
unavailable, indicating a 65% lower risk of neck injury (OR: 0.35, 0.17-0.70,
p 0.01).
Table 26: Percent of drivers sustaining an injury to the neck and AIS 2+ neck
injuries, & the adjusted relative odds ratios for drivers of post-ADR 69 vehicles compared to pre-ADR 69 vehicles, airbag deployments, and the dual effect
Body region
Pre-ADR 69
(n=156)
Post-ADR 69
(n=129)
95% CI
(L-U)
P
Injured / AIS 1+ 29.5% 20%
Post-ADR 69 OR: 0.73 0.38-1.43 0.05
Airbag deployment OR: 0.47 0.24-0.93 0.05
ADR 69+Airbag OR: 0.35 0.17-0.70 0.01
AIS 2+ injury 4.5% 1.5%
Post-ADR 69 OR: 0.62 0.10-3.67 0.05
Airbag deployment OR: 0.33 0.05-0.2.04 0.05
ADR 69+Airbag OR: 0.20 0.03-1.40 0.05

– 45 –
EBS was also seen to be predictive of neck injury outcome, with the interesting
result of decreasing risk of injury with increasing EBS. More specifically, a 1 km/h
increase in EBS translated to a 2% reduction in neck injury risk, OR: 0.98, CI: 0.96-
0.99, p 0.05). This result is consistent with the large body of scientific literature
that demonstrates that AIS 1+ ‘whiplash’ type injuries are more common at lower
impact speeds, and while ‘whiplash’ injuries are coded to the Spine AIS body
region, AIS 1 neck injuries do include superficial lacerations and contusions,
injuries likely to be associated with ‘whiplash’. In interpreting this result, it is also
important to note the small number of AIS 2+ neck injuries in the sample.
Figure 13 presents the observed probability distribution for AIS 1+ neck injuries for
drivers of pre-ADR 69 and post-ADR 69 vehicles, while Table 27 presents the
probability estimates in 10 km/h EBS increments. The equations in Equation Box 3,
Section 7.1.3, were used to calculate the probability estimates. The two most
important observations concerning the probability estimates presented is the lack of
difference in injury risk between the two ADR 69 groups, and the finding of
reducing injury risk with increasing EBS as noted above.
Figure 13. Observed injury (AIS 1+) probability distribution for neck injuries
for drivers of pre-ADR 69 and post-ADR 69 vehicles; vertical line is ADR 69 test speed
0
0.1
0.2
0.3
0.4
0.5
0.6
0.7
0.8
0.9
1
7 10 13 16 19 22 25 28 31 34 37 40 43 46 49 52 55 58 61 64 67 70 73 76 79 82 85 88 91 94 97
EBS (km/h)
Pro
ba
bil
ity
of
Nec
k A
IS1
+
Post-ADR69 Prob. Post: LCI Post: UCIPre-ADR69 Prob. Pre: LCI Pre: UCI
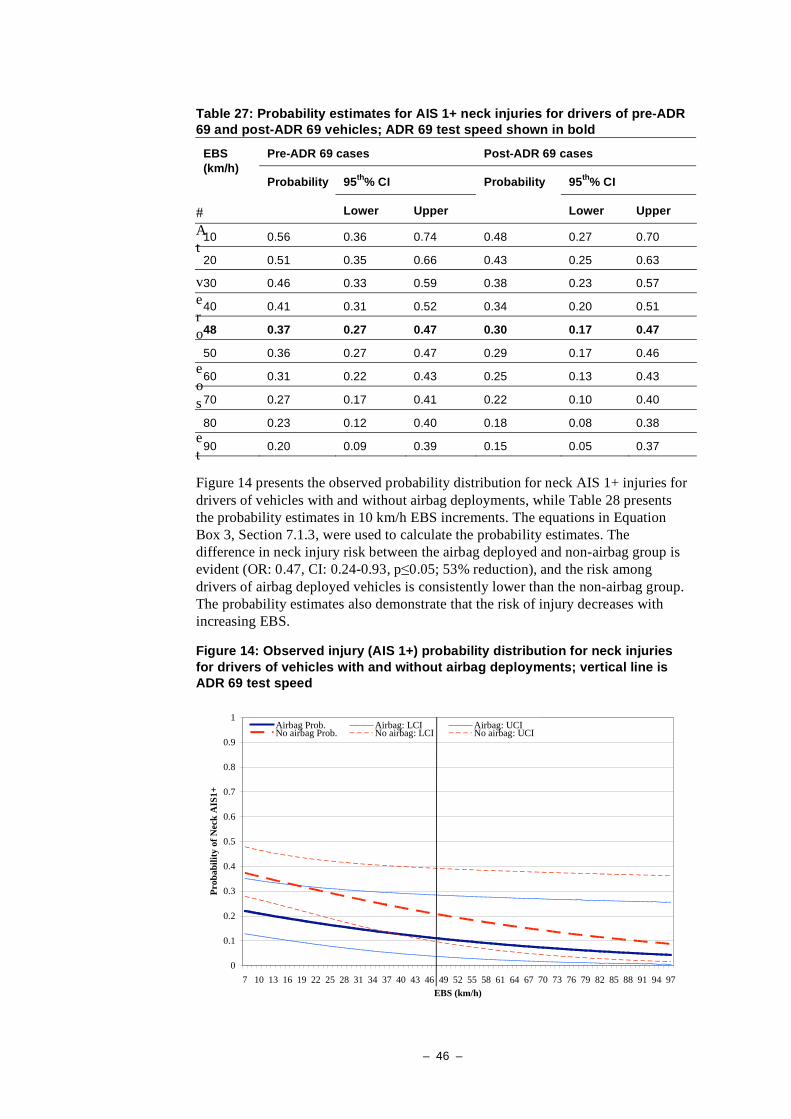
– 46 –
Table 27: Probability estimates for AIS 1+ neck injuries for drivers of pre-ADR 69 and post-ADR 69 vehicles; ADR 69 test speed shown in bold
#
A
t
v
e
r
o
e
o
s
e
t
Figure 14 presents the observed probability distribution for neck AIS 1+ injuries for
drivers of vehicles with and without airbag deployments, while Table 28 presents
the probability estimates in 10 km/h EBS increments. The equations in Equation
Box 3, Section 7.1.3, were used to calculate the probability estimates. The
difference in neck injury risk between the airbag deployed and non-airbag group is
evident (OR: 0.47, CI: 0.24-0.93, p 0.05; 53% reduction), and the risk among
drivers of airbag deployed vehicles is consistently lower than the non-airbag group.
The probability estimates also demonstrate that the risk of injury decreases with
increasing EBS.
Figure 14: Observed injury (AIS 1+) probability distribution for neck injuries
for drivers of vehicles with and without airbag deployments; vertical line is ADR 69 test speed
0
0.1
0.2
0.3
0.4
0.5
0.6
0.7
0.8
0.9
1
7 10 13 16 19 22 25 28 31 34 37 40 43 46 49 52 55 58 61 64 67 70 73 76 79 82 85 88 91 94 97
EBS (km/h)
Pro
ba
bil
ity
of
Nec
k A
IS1
+
Airbag Prob. Airbag: LCI Airbag: UCINo airbag Prob. No airbag: LCI No airbag: UCI
Pre-ADR 69 cases Post-ADR 69 cases
95th
% CI 95th
% CI
EBS
(km/h) Probability
Lower Upper
Probability
Lower Upper
10 0.56 0.36 0.74 0.48 0.27 0.70
20 0.51 0.35 0.66 0.43 0.25 0.63
30 0.46 0.33 0.59 0.38 0.23 0.57
40 0.41 0.31 0.52 0.34 0.20 0.51
48 0.37 0.27 0.47 0.30 0.17 0.47
50 0.36 0.27 0.47 0.29 0.17 0.46
60 0.31 0.22 0.43 0.25 0.13 0.43
70 0.27 0.17 0.41 0.22 0.10 0.40
80 0.23 0.12 0.40 0.18 0.08 0.38
90 0.20 0.09 0.39 0.15 0.05 0.37

– 47 –
Table 28: Probability estimates for AIS 1+ neck injuries for drivers of vehicles with and without airbag deployments; ADR 69 test speed shown in bold
Non-airbag deployed cases Airbag deployed cases
95th
% CI 95th
% CI
EBS
(km/h) Probability
Lower Upper
Probability
Lower Upper
10 0.36 0.27 0.47 0.21 0.12 0.34
20 0.31 0.22 0.43 0.18 0.09 0.32
30 0.27 0.17 0.41 0.15 0.07 0.30
40 0.23 0.12 0.40 0.13 0.05 0.29
48 0.21 0.09 0.39 0.11 0.04 0.28
50 0.20 0.09 0.39 0.11 0.03 0.28
60 0.17 0.06 0.38 0.09 0.02 0.28
70 0.14 0.04 0.38 0.07 0.02 0.27
80 0.12 0.03 0.37 0.06 0.01 0.26
90 0.10 0.02 0.37 0.05 0.01 0.26
In the construction of the logistic regression model to obtain estimates of the impact
of ADR 69 and airbags on neck injury outcome, driver age was an important
predictor variable of neck injury outcome. Figure 15 and Table 29 presents the
probability of neck injury by driver age and the most striking observation is that
neck injury risk is not linear. Using fractional polynomials (Royston and Altman,
1994) age can be transformed to account for the non-linear relationship to neck
injury risk. The probability of neck injury increases rapidly from 17 years to 30
years of age, and then decreases in a largely linear manner. The equations presented
in Equation Box 3, Section 7.1.3, were used to calculate these probability estimates,
with the transformation of age noted. Notably, driver gender was not seen to hold
any predictive value in the calculation of neck injury risk, however bony structures
of the cervical spine are included in the Spine AIS body region (Section 3.3.6).
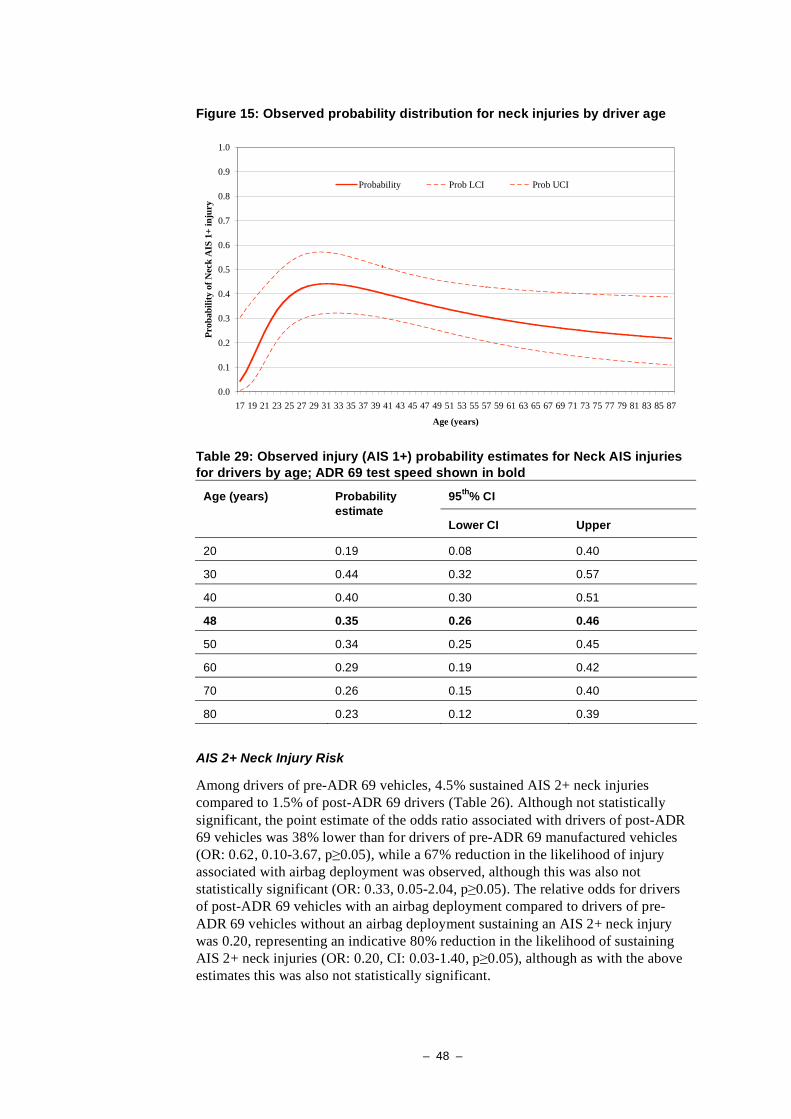
– 48 –
Figure 15: Observed probability distribution for neck injuries by driver age
0.0
0.1
0.2
0.3
0.4
0.5
0.6
0.7
0.8
0.9
1.0
17 19 21 23 25 27 29 31 33 35 37 39 41 43 45 47 49 51 53 55 57 59 61 63 65 67 69 71 73 75 77 79 81 83 85 87
Age (years)
Pro
ba
bil
ity
of
Nec
k A
IS 1
+ i
nju
ry
Probability Prob LCI Prob UCI
Table 29: Observed injury (AIS 1+) probability estimates for Neck AIS injuries
for drivers by age; ADR 69 test speed shown in bold
95th
% CI Age (years) Probability
estimate Lower CI Upper
20 0.19 0.08 0.40
30 0.44 0.32 0.57
40 0.40 0.30 0.51
48 0.35 0.26 0.46
50 0.34 0.25 0.45
60 0.29 0.19 0.42
70 0.26 0.15 0.40
80 0.23 0.12 0.39
AIS 2+ Neck Injury Risk
Among drivers of pre-ADR 69 vehicles, 4.5% sustained AIS 2+ neck injuries
compared to 1.5% of post-ADR 69 drivers (Table 26). Although not statistically
significant, the point estimate of the odds ratio associated with drivers of post-ADR
69 vehicles was 38% lower than for drivers of pre-ADR 69 manufactured vehicles
(OR: 0.62, 0.10-3.67, p 0.05), while a 67% reduction in the likelihood of injury
associated with airbag deployment was observed, although this was also not
statistically significant (OR: 0.33, 0.05-2.04, p 0.05). The relative odds for drivers
of post-ADR 69 vehicles with an airbag deployment compared to drivers of pre-
ADR 69 vehicles without an airbag deployment sustaining an AIS 2+ neck injury
was 0.20, representing an indicative 80% reduction in the likelihood of sustaining
AIS 2+ neck injuries (OR: 0.20, CI: 0.03-1.40, p 0.05), although as with the above
estimates this was also not statistically significant.

– 49 –
In calculating the difference in injury risk for AIS 2+ neck injuries, analysis
indicated that it was necessary to statistically ‘force’ the variables of ADR 69
group, airbag status and EBS (km/h) into the model, as indicated by the above odds
ratios as well as the overall logistic regression model failing to reach statistical
significance, 2(3)=4.4, p 0.05. Other parameters assessed were: vehicle market
group; collision partner/struck object; driver characteristics of height, weight, age
and gender, none of which were of any predictive value. The observed probability
chart for AIS 2+ neck injuries among drivers of post-ADR 69 vehicles and airbag
deployed vehicles are not presented due to the probability curve being essentially
flat and the 95th percentile confidence intervals being extremely wide, reflecting
the extremely low number of cases with AIS 2+ neck injuries. The failure to detect
statistically significant differences is most likely due to low sample numbers,
combined with a small risk of AIS 2+ injuries among this sample.
Finally, the probability of AIS 2+ injury was low at the ADR 69 test speed of 48
km/h, with the estimate being 9% (CI: 0.004-0.31) among the drivers of pre-ADR
69 cars compared to 4% (CI: 0.01-0.22) for drivers of post-ADR 69 passenger cars.
Similarly, the probability of AIS 2+ neck injuries among drivers of without an
airbag deployment was 9% (CI: 0.004-0.31) compared to 4% (CI: 0.02-0.29) among
drivers exposed to an airbag deployment. The equations presented in Equation Box
4, Section 7.1.4, were used to calculate these probability estimates.
3.3.4 Chest Injury Risk
ADR 69/00 mandated two criteria specifically focussed on chest injury risk, these
being:
1. Chest deceleration measured by accelerometers in the dummy’s chest must
not exceed the limit of 60g, except for values whose cumulative duration is
not more than 3 ms
2. Compression deflection of the sternum relative to the spine must not
exceed 76.2 mm (Hybrid III only)
This sub-section aims to evaluate the risk of chest injury among drivers of pre-ADR
69 vehicles and post-ADR 69 vehicles. Common chest (thorax) injuries are
presented in Table 30.
Table 30: Examples of chest injuries by AIS severity (AAAM, 1998)
AIS severity Chest Injury example
Minor (1) Superficial lacerations, contusions & penetrating injuries; rib cage
contusion; fracture of 1 rib; sternum contusion; myocardial contusion
Moderate (2)
Penetrating injury with tissue loss; major (size/depth) skin, muscle,
subcutaneous laceration / avulsion; contusion diaphragm, pericardial
contusion; Fracture of 2 – 3 ribs, fracture of sternum
Serious (3) large blood loss due to injury to skin, muscle, subcutaneous laceration /
avulsion; vessel injuries (minor); lung laceration; haemo-pneumothorax
Severe (4) Aortic artery injury; Venous injuries; Fracture bronchus, major myocardial
contusion; bilateral lung lacerations; > 3 ribs with haemo-pneumothorax
Critical (5) Major vessel tears; heart perforation; lung laceration with tension
pneumothorax; > 3 ribs bilateral with haemo-pneumothorax
Maximum (6) Bilateral destruction of skeletal, vascular, organ and tissue systems
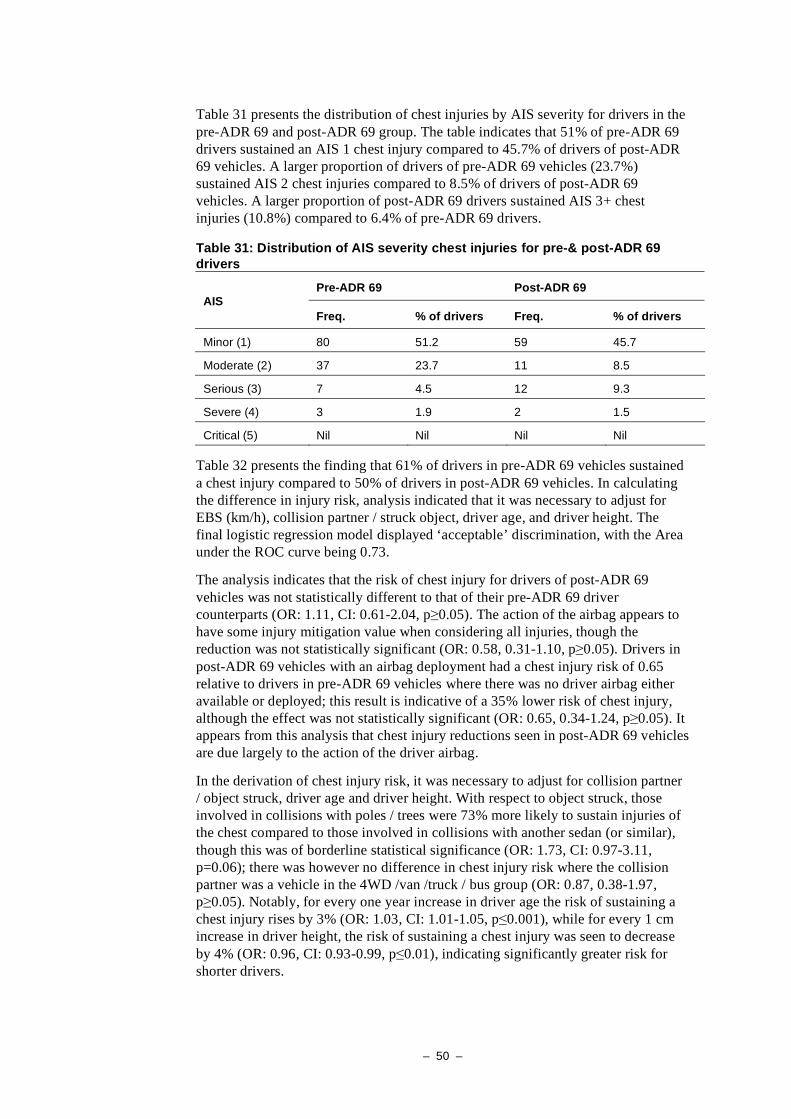
– 50 –
Table 31 presents the distribution of chest injuries by AIS severity for drivers in the
pre-ADR 69 and post-ADR 69 group. The table indicates that 51% of pre-ADR 69
drivers sustained an AIS 1 chest injury compared to 45.7% of drivers of post-ADR
69 vehicles. A larger proportion of drivers of pre-ADR 69 vehicles (23.7%)
sustained AIS 2 chest injuries compared to 8.5% of drivers of post-ADR 69
vehicles. A larger proportion of post-ADR 69 drivers sustained AIS 3+ chest
injuries (10.8%) compared to 6.4% of pre-ADR 69 drivers.
Table 31: Distribution of AIS severity chest injuries for pre-& post-ADR 69 drivers
Pre-ADR 69 Post-ADR 69 AIS
Freq. % of drivers Freq. % of drivers
Minor (1) 80 51.2 59 45.7
Moderate (2) 37 23.7 11 8.5
Serious (3) 7 4.5 12 9.3
Severe (4) 3 1.9 2 1.5
Critical (5) Nil Nil Nil Nil
Table 32 presents the finding that 61% of drivers in pre-ADR 69 vehicles sustained
a chest injury compared to 50% of drivers in post-ADR 69 vehicles. In calculating
the difference in injury risk, analysis indicated that it was necessary to adjust for
EBS (km/h), collision partner / struck object, driver age, and driver height. The
final logistic regression model displayed ‘acceptable’ discrimination, with the Area
under the ROC curve being 0.73.
The analysis indicates that the risk of chest injury for drivers of post-ADR 69
vehicles was not statistically different to that of their pre-ADR 69 driver
counterparts (OR: 1.11, CI: 0.61-2.04, p 0.05). The action of the airbag appears to
have some injury mitigation value when considering all injuries, though the
reduction was not statistically significant (OR: 0.58, 0.31-1.10, p 0.05). Drivers in
post-ADR 69 vehicles with an airbag deployment had a chest injury risk of 0.65
relative to drivers in pre-ADR 69 vehicles where there was no driver airbag either
available or deployed; this result is indicative of a 35% lower risk of chest injury,
although the effect was not statistically significant (OR: 0.65, 0.34-1.24, p 0.05). It
appears from this analysis that chest injury reductions seen in post-ADR 69 vehicles
are due largely to the action of the driver airbag.
In the derivation of chest injury risk, it was necessary to adjust for collision partner
/ object struck, driver age and driver height. With respect to object struck, those
involved in collisions with poles / trees were 73% more likely to sustain injuries of
the chest compared to those involved in collisions with another sedan (or similar),
though this was of borderline statistical significance (OR: 1.73, CI: 0.97-3.11,
p=0.06); there was however no difference in chest injury risk where the collision
partner was a vehicle in the 4WD /van /truck / bus group (OR: 0.87, 0.38-1.97,
p 0.05). Notably, for every one year increase in driver age the risk of sustaining a
chest injury rises by 3% (OR: 1.03, CI: 1.01-1.05, p 0.001), while for every 1 cm
increase in driver height, the risk of sustaining a chest injury was seen to decrease
by 4% (OR: 0.96, CI: 0.93-0.99, p 0.01), indicating significantly greater risk for
shorter drivers.

– 51 –
Table 32: Percent of drivers sustaining an injury to the chest and AIS 2+ chest injuries, & the adjusted relative odds ratios for drivers of post-ADR 69 vehicles compared to pre-ADR 69 vehicles, airbag deployments, and the dual effect
Body region
Pre-ADR 69
(n=156)
Post-ADR 69
(n=129)
95% CI
(L-U)
P
Injured / AIS 1+ 60.9% 50.4%
Post-ADR 69 OR: 1.11 0.61-2.04 p 0.05
Airbag deployment OR: 0.58 0.31-1.10 p 0.05
ADR 69+Airbag OR: 0.65 0.34-1.24 p 0.05
AIS 2+ injury 26.9% 16.3%
Post-ADR 69 OR: 1.24 0.52-2.97 p 0.05
Airbag deployment OR: 0.21 0.09-0.52 p 0.001
ADR 69+Airbag OR: 0.26 0.12-0.60 p 0.001
AIS 2+ Chest Injury Risk
Table 32 shows that 27% of drivers of pre-ADR 69 vehicles sustained an AIS 2+
chest injury compared to 16% of post-ADR 69 drivers. While the ADR 69 estimate
is not significant (1.24, 0.52-2.97, p 0.05), the effect of a frontal airbag deployment
represents a 79% reduction in the likelihood of sustaining an AIS 2+ chest injury
versus non-deployment (OR: 0.21, 0.09-0.52, p 0.001). The airbag effect clearly
drives the benefits associated with post-ADR 69 vehicles with an airbag
deployment relative to drivers of pre-ADR vehicles without an airbag deployment
(OR: 0.26, 0.12-0.60, p 0.001).
In calculating the difference in injury risk, analysis indicated that it was necessary
to statistically adjust for the effect of EBS (km/h), vehicle market group (small,
medium, large), driver age and driver height, as they were all seen to influence the
risk of chest injury. Due to the non-linear relationship for age and height to chest
AIS 2+ injury risk, these two variables were transformed by method of fractional
polynomials (Royston & Altman, 1994). The final logistic regression model
displayed ‘excellent’ discrimination, with the Area under the ROC curve being
0.84, and the Hosmer-Lemeshow goodness of fit test indicating good model fit,
p=0.5.
EBS (km/h) was significantly related to the outcome of AIS 2+ chest injuries, with
the relationship translating to a 2.6% increase in risk for every 1 km/h increase in
EBS (OR: 1.026, CI: 1.00-1.04, p 0.05). The vehicle market class in which the
driver was travelling was also an important predictor of AIS 2+ chest injuries, such
that drivers in large vehicles were significantly less likely to sustain a moderate or
worse chest AIS 2+ injury (OR: 0.41, 0.17-0.98, p 0.05) relative to drivers of small
vehicles, while there was no difference in injury risk for drivers of medium sized
vehicles compared to small vehicles (OR: 0.92, 0.24-3.4, p 0.05). In addition,
driver height was significantly related to injury risk; while the probability chart is
not presented here, it is important to note the injury risk relationship is not linear
and appears as an inverted bath-tub.

– 52 –
Figure 16 and Table 33 presents the observed probability distribution for AIS 2+
chest injuries for drivers of pre-ADR 69 and post-ADR 69 vehicles by EBS (km/h),
and it may be observed that there is no discernible difference between the two
groups. The probability of an AIS 2+ chest injury at the ADR 69 test speed of 48
km/h is seen to be 0.67 (CI: 0.43-0.84) for drivers of post-ADR 69 vehicles and
0.62 (CI: 0.41-0.79) for drivers of pre-ADR 69 vehicles. The high probability of
chest AIS 2+ injuries at relatively low speeds for drivers of post-ADR 69 vehicles
is cause for some concern. The formula in Equation Box 5, Section 7.1.5, was used
to derive the probability estimates.
Figure 16: Observed injury probability distribution for AIS 2+ chest injuries
for drivers of post-ADR 69 vehicles. (Black vertical line indicates 48 km/h; ADR 69 test speed)
0
0.1
0.2
0.3
0.4
0.5
0.6
0.7
0.8
0.9
1
7 9 11 13 15 17 19 21 23 25 27 29 31 33 35 37 39 41 43 45 47 49 51 53 55 57 59 61 63 65 67 69 71 73 75 77 79 81 83 85 87 89 91 93 95 97
EBS (km/h)
Pro
ba
bil
ity
of
Ch
estA
IS2
+ I
nju
ry
PROB: Post ADR69 LOWER: Post ADR69 UPPER: Post ADR69
PROB: Pre ADR69 Pre ADR69 Pre ADR69
Table 33: Probability estimates for AIS 2+ chest injuries for drivers of pre-
ADR 69 and post-ADR 69 vehicles; ADR 69 test speed shown in bold
Pre-ADR 69 cases Post-ADR 69 cases
95th
% CI 95th
% CI
EBS
(km/h) Probability
Lower Upper
Probability
Lower Upper
20 0.44 0.23 0.67 0.50 0.25 0.75
30 0.51 0.30 0.71 0.56 0.32 0.78
40 0.57 0.36 0.75 0.62 0.38 0.81
48 0.62 0.41 0.79 0.67 0.43 0.84
50 0.63 0.42 0.80 0.68 0.45 0.85
60 0.69 0.47 0.85 0.74 0.50 0.89
70 0.74 0.51 0.89 0.78 0.54 0.92
80 0.79 0.54 0.92 0.82 0.58 0.94
90 0.83 0.57 0.95 0.86 0.61 0.96

– 53 –
Figure 17 presents the observed probability distribution for AIS 2+ chest injuries
for drivers of vehicles with and without airbag deployment by EBS (km/h). There is
a clear difference in the injury risk distribution between the two groups; this can
also be seen in the probability of injury estimates in Table 34. For drivers of
vehicles where an airbag deployed, the probability of an AIS 2+ chest injury at the
ADR 69 test speed of 48 km/h is seen to be 0.26 (CI: 0.09-0.54) compared to a
probability of 0.62 (CI: 0.41-0.79). The highest probability of AIS 2+ chest injuries
for drivers in a vehicle where the frontal airbag deployed was 0.55 (CI: 0.17-0.88)
compared to 0.85 (CI: 0.58-0.96) for drivers of non-airbag fitted / deployed
vehicles, indicating that the airbag deployment was the most significant
improvement in frontal impact protection for the chest.
Figure 17: Observed injury probability distribution for AIS 2+ chest injuries
for drivers with and without frontal airbag deployments. (Black vertical line indicates 48 km/h; ADR 69 test speed)
0
0.1
0.2
0.3
0.4
0.5
0.6
0.7
0.8
0.9
1
7 10 13 16 19 22 25 28 31 34 37 40 43 46 49 52 55 58 61 64 67 70 73 76 79 82 85 88 91 94 97
EBS
Pro
ba
bil
ity
of
Ch
est
AIS
2+
In
jury
PROB: Airbag LOWER: Airbag UPPER: Airbag
PROB: No airbag LOWER: No airbag UPPER: No airbag

– 54 –
Table 34: Probability estimates for AIS 2+ chest injuries for drivers of vehicles with and without an airbag deployment; ADR 69 test speed shown in bold
Non-airbag deployed cases Airbag deployed cases
95th
% CI 95th
% CI
EBS
(km/h) Probability
Lower Upper
Probability
Lower Upper
20 0.44 0.23 0.67 0.14 0.05 0.36
30 0.51 0.30 0.71 0.18 0.06 0.42
40 0.57 0.36 0.75 0.22 0.08 0.48
48 0.62 0.41 0.79 0.26 0.09 0.54
50 0.63 0.42 0.80 0.27 0.10 0.56
60 0.69 0.47 0.85 0.32 0.11 0.64
70 0.74 0.51 0.89 0.38 0.13 0.72
80 0.79 0.54 0.92 0.44 0.14 0.79
90 0.83 0.57 0.95 0.51 0.16 0.85
As noted earlier, age was associated with AIS 2+ chest injuries, although
importantly the relationship was not linear. Using fractional polynomials, age was
transformed to allow for the non-linear relationship with AIS 2+ chest injury
probability, the results of which can be seen in Figure 18 and Table 35. The
probability of sustaining an AIS 2+ injury increases dramatically from 17 years of
age until approximately 40 years of age where the increase in risk is seen to slow
and plateau above 70 years of age. That the risk of chest injury increases with
increasing age is unsurprising, and is consistent with previous research (see for
example, Foret-Bruno, Trossielle, Le Coz et al., 1998). These results demonstrate
that further countermeasure work is required to improve the protection afforded to
occupants, particularly older adults.
Figure 18: Observed probability distribution for AIS 2+ chest injuries by driver age
0
0.1
0.2
0.3
0.4
0.5
0.6
0.7
0.8
0.9
1
17 19 21 23 25 27 29 31 33 35 37 39 41 43 45 47 49 51 53 55 57 59 61 63 65 67 69 71 73 75 77 79 81 83 85 87
Age (years)
Pro
ba
bil
ity
of
Ch
estA
IS2
+ I
nju
ry
Probability LCI UCI

– 55 –
Table 35: Probability estimates for Chest AIS 2+ injuries for drivers by age
95th
% CI Age (years) Probability
estimate Lower CI Upper
20 0.09 0.03 0.10
30 0.37 0.19 0.46
40 0.58 0.37 0.74
50 0.70 0.49 0.86
60 0.77 0.56 0.91
70 0.81 0.61 0.93
80 0.83 0.65 0.95
3.3.5 Abdomen / Pelvic contents Injury Risk
ADR 69/00 did not directly specify injury risk performance criteria for the abdomen
and pelvic contents, however some benefit might be expected in reducing
abdominal and pelvic content injuries from the introduction of the thorax injury
criteria noted above, and the 10 kN axial load limit on the femur.
Table 36 provides common injury examples for the abdomen and pelvic region by
increasing AIS severity. Note that the skeletal structures of the pelvis are included
in the lower extremity. The major components of this region are organ systems.
Table 36: Examples of abdominal / pelvic content injuries by AIS severity
(AAAM, 1998)
AIS severity Abdomen / pelvic injury example
Minor (1) Superficial lacerations, contusions & penetrating injuries; contusions to
selected internal abdominal/pelvis contents
Moderate (2)
Penetrating injury with tissue loss; major (size/depth) skin, muscle,
subcutaneous laceration / avulsion; splenic, liver & kidney contusions /
simple lacerations; some duodenal injuries
Serious (3)
Large blood loss due to injury to skin, muscle, subcutaneous laceration /
avulsion; minor (no disruption) tears to vessels (e.g., inferior vena cava);
major disruption of vessels; perforation of colon; kidney, liver, pancreas
lacerations
Severe (4) Injury to vessels (minor tears or lacerations, e.g., abdominal aorta);
massive disruption of internal organs
Critical (5) Avulsion injuries of kidney & spleen, and other internal organs; major vessel
disruption (perforation/puncture)
Maximum (6) Total avulsion of all vascular attachments of liver (hepatic avulsion)
Table 37 provides a breakdown of the distribution of injuries by AIS severity for
drivers of pre-ADR 69 and post-ADR 69 vehicles. Approximately 40% of drivers
of pre-ADR 69 vehicles sustained an AIS 1 (minor) injury compared to 30% of
drivers of post-ADR 69 vehicles. A smaller proportion of drivers sustained injuries
of AIS 2 or above.
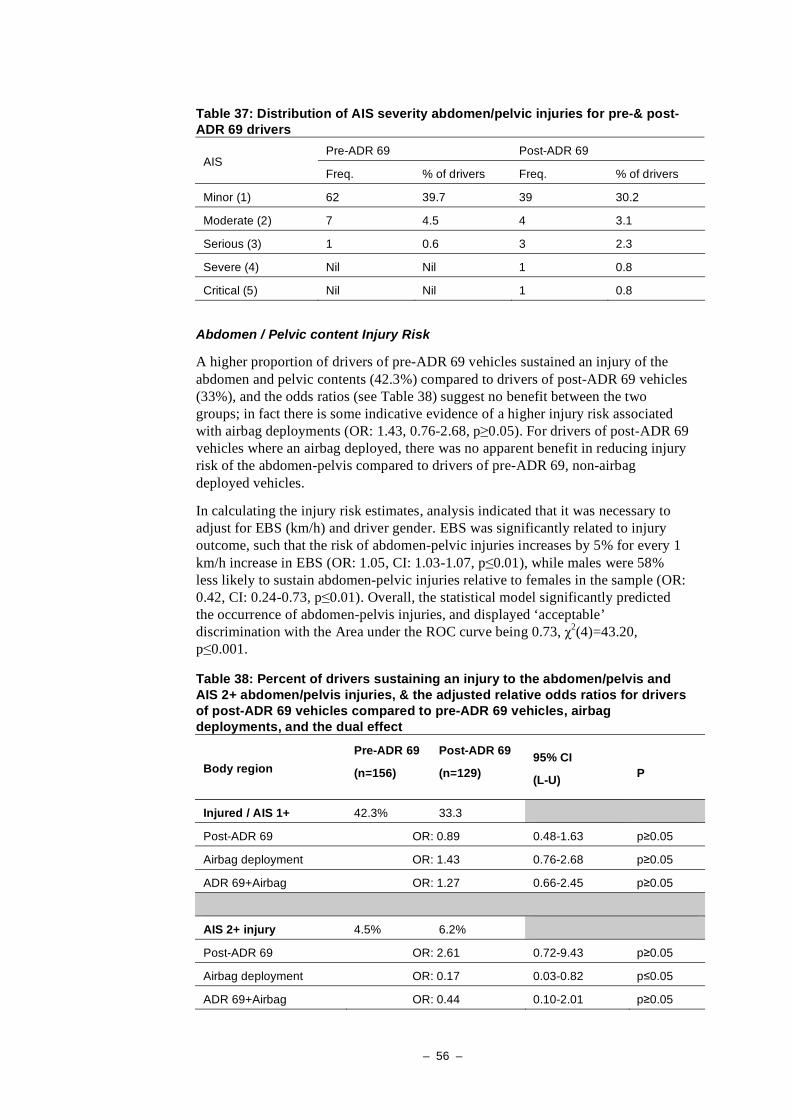
– 56 –
Table 37: Distribution of AIS severity abdomen/pelvic injuries for pre-& post-ADR 69 drivers
Pre-ADR 69 Post-ADR 69 AIS
Freq. % of drivers Freq. % of drivers
Minor (1) 62 39.7 39 30.2
Moderate (2) 7 4.5 4 3.1
Serious (3) 1 0.6 3 2.3
Severe (4) Nil Nil 1 0.8
Critical (5) Nil Nil 1 0.8
Abdomen / Pelvic content Injury Risk
A higher proportion of drivers of pre-ADR 69 vehicles sustained an injury of the
abdomen and pelvic contents (42.3%) compared to drivers of post-ADR 69 vehicles
(33%), and the odds ratios (see Table 38) suggest no benefit between the two
groups; in fact there is some indicative evidence of a higher injury risk associated
with airbag deployments (OR: 1.43, 0.76-2.68, p 0.05). For drivers of post-ADR 69
vehicles where an airbag deployed, there was no apparent benefit in reducing injury
risk of the abdomen-pelvis compared to drivers of pre-ADR 69, non-airbag
deployed vehicles.
In calculating the injury risk estimates, analysis indicated that it was necessary to
adjust for EBS (km/h) and driver gender. EBS was significantly related to injury
outcome, such that the risk of abdomen-pelvic injuries increases by 5% for every 1
km/h increase in EBS (OR: 1.05, CI: 1.03-1.07, p 0.01), while males were 58%
less likely to sustain abdomen-pelvic injuries relative to females in the sample (OR:
0.42, CI: 0.24-0.73, p 0.01). Overall, the statistical model significantly predicted
the occurrence of abdomen-pelvis injuries, and displayed ‘acceptable’
discrimination with the Area under the ROC curve being 0.73, 2(4)=43.20,
p 0.001.
Table 38: Percent of drivers sustaining an injury to the abdomen/pelvis and AIS 2+ abdomen/pelvis injuries, & the adjusted relative odds ratios for drivers of post-ADR 69 vehicles compared to pre-ADR 69 vehicles, airbag deployments, and the dual effect
Body region
Pre-ADR 69
(n=156)
Post-ADR 69
(n=129)
95% CI
(L-U)
P
Injured / AIS 1+ 42.3% 33.3
Post-ADR 69 OR: 0.89 0.48-1.63 p 0.05
Airbag deployment OR: 1.43 0.76-2.68 p 0.05
ADR 69+Airbag OR: 1.27 0.66-2.45 p 0.05
AIS 2+ injury 4.5% 6.2%
Post-ADR 69 OR: 2.61 0.72-9.43 p 0.05
Airbag deployment OR: 0.17 0.03-0.82 p 0.05
ADR 69+Airbag OR: 0.44 0.10-2.01 p 0.05
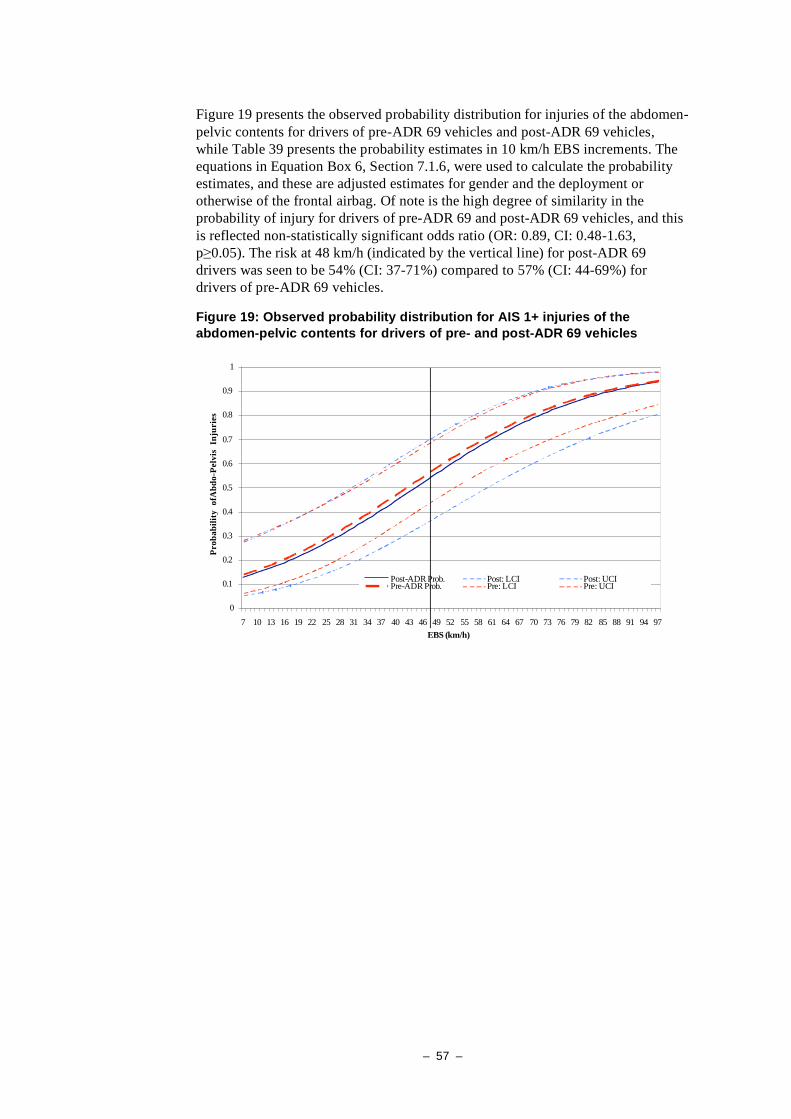
– 57 –
Figure 19 presents the observed probability distribution for injuries of the abdomen-
pelvic contents for drivers of pre-ADR 69 vehicles and post-ADR 69 vehicles,
while Table 39 presents the probability estimates in 10 km/h EBS increments. The
equations in Equation Box 6, Section 7.1.6, were used to calculate the probability
estimates, and these are adjusted estimates for gender and the deployment or
otherwise of the frontal airbag. Of note is the high degree of similarity in the
probability of injury for drivers of pre-ADR 69 and post-ADR 69 vehicles, and this
is reflected non-statistically significant odds ratio (OR: 0.89, CI: 0.48-1.63,
p 0.05). The risk at 48 km/h (indicated by the vertical line) for post-ADR 69
drivers was seen to be 54% (CI: 37-71%) compared to 57% (CI: 44-69%) for
drivers of pre-ADR 69 vehicles.
Figure 19: Observed probability distribution for AIS 1+ injuries of the
abdomen-pelvic contents for drivers of pre- and post-ADR 69 vehicles
0
0.1
0.2
0.3
0.4
0.5
0.6
0.7
0.8
0.9
1
7 10 13 16 19 22 25 28 31 34 37 40 43 46 49 52 55 58 61 64 67 70 73 76 79 82 85 88 91 94 97
EBS (km/h)
Pro
ba
bil
ity
o
fAb
do
-Pelv
is
Inju
rie
s
Post-ADR Prob. Post: LCI Post: UCIPre-ADR Prob. Pre: LCI Pre: UCI
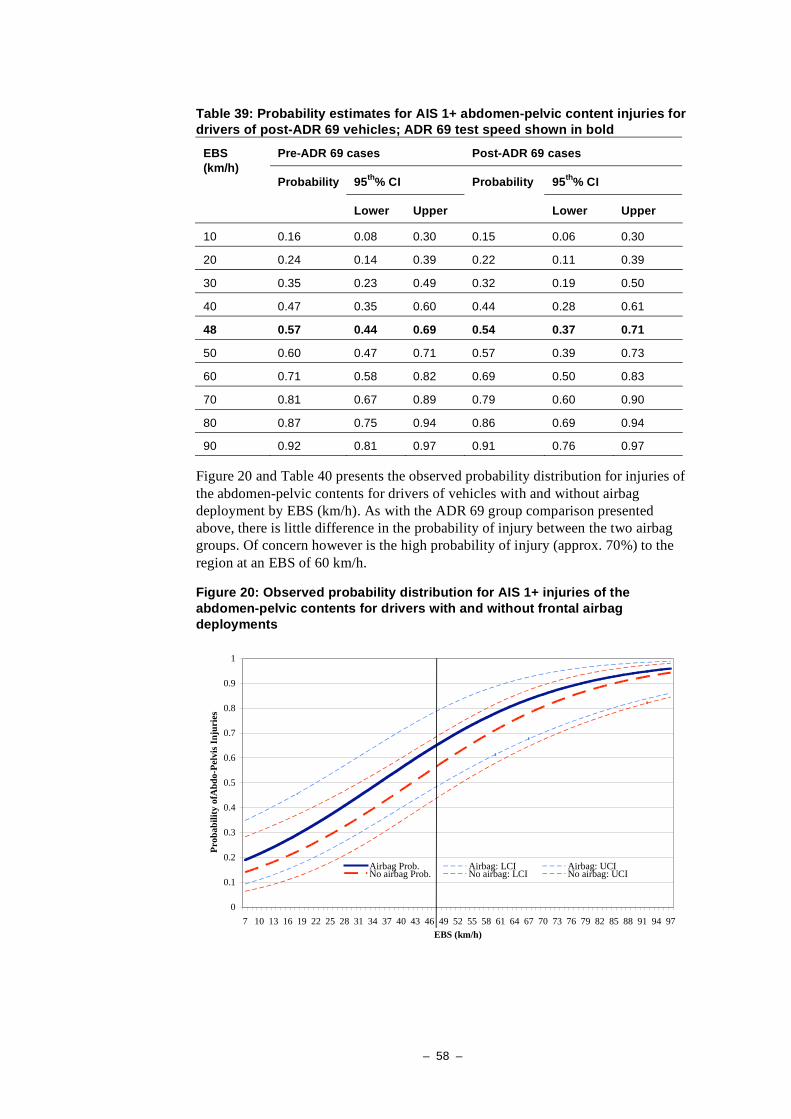
– 58 –
Table 39: Probability estimates for AIS 1+ abdomen-pelvic content injuries for drivers of post-ADR 69 vehicles; ADR 69 test speed shown in bold
Pre-ADR 69 cases Post-ADR 69 cases
95th
% CI 95th
% CI
EBS
(km/h) Probability
Lower Upper
Probability
Lower Upper
10 0.16 0.08 0.30 0.15 0.06 0.30
20 0.24 0.14 0.39 0.22 0.11 0.39
30 0.35 0.23 0.49 0.32 0.19 0.50
40 0.47 0.35 0.60 0.44 0.28 0.61
48 0.57 0.44 0.69 0.54 0.37 0.71
50 0.60 0.47 0.71 0.57 0.39 0.73
60 0.71 0.58 0.82 0.69 0.50 0.83
70 0.81 0.67 0.89 0.79 0.60 0.90
80 0.87 0.75 0.94 0.86 0.69 0.94
90 0.92 0.81 0.97 0.91 0.76 0.97
Figure 20 and Table 40 presents the observed probability distribution for injuries of
the abdomen-pelvic contents for drivers of vehicles with and without airbag
deployment by EBS (km/h). As with the ADR 69 group comparison presented
above, there is little difference in the probability of injury between the two airbag
groups. Of concern however is the high probability of injury (approx. 70%) to the
region at an EBS of 60 km/h.
Figure 20: Observed probability distribution for AIS 1+ injuries of the abdomen-pelvic contents for drivers with and without frontal airbag deployments
0
0.1
0.2
0.3
0.4
0.5
0.6
0.7
0.8
0.9
1
7 10 13 16 19 22 25 28 31 34 37 40 43 46 49 52 55 58 61 64 67 70 73 76 79 82 85 88 91 94 97
EBS (km/h)
Pro
ba
bil
ity
ofA
bd
o-P
elv
is I
nju
ries
Airbag Prob. Airbag: LCI Airbag: UCINo airbag Prob. No airbag: LCI No airbag: UCI

– 59 –
Table 40: Probability estimates for AIS 1+ abdomen-pelvic content injuries for drivers of vehicles with and without an airbag deployment
Non-airbag deployed cases Airbag deployed cases
95th
% CI 95th
% CI
EBS
(km/h) Probability
Lower Upper
Probability
Lower Upper
10 0.16 0.08 0.30 0.21 0.11 0.38
20 0.24 0.14 0.39 0.31 0.19 0.48
30 0.35 0.23 0.49 0.43 0.29 0.59
40 0.47 0.35 0.60 0.56 0.40 0.71
48 0.57 0.44 0.69 0.66 0.49 0.79
50 0.60 0.47 0.71 0.68 0.51 0.81
60 0.71 0.58 0.82 0.78 0.61 0.89
70 0.81 0.67 0.89 0.86 0.70 0.94
80 0.87 0.75 0.94 0.91 0.77 0.97
90 0.92 0.81 0.97 0.94 0.83 0.98
AIS 2+ Abdomen / Pelvis Injury Risk
Approximately 4.5% of drivers of pre-ADR 69 vehicles sustained an AIS 2
(moderate) or higher injury of the abdomen and pelvic contents, compared to 6.2%
of drivers of post-ADR 69 drivers. Table 38 (p.56) presents the odds ratios for AIS
2+ abdomen-pelvic content injury risk. Although not statistically significant, there
was a trend toward drivers of post-ADR 69 manufactured vehicles being more
likely to sustain this injury type than drivers of pre-ADR 69 vehicles (OR: 2.6, CI:
0.72-9.43, p 0.05). Conversely, the relative odds of injury associated with a frontal
airbag deployment were 0.17 (0.03-0.82, p 0.05), translating to a statistically
significant 83% reduction in injury risk. The combined benefit of ADR 69 vehicles
plus airbag system deployment is indicated by the relative odds of injury being 56%
lower (OR: 0.44, 0.10-2.01, p 0.05) than for drivers of pre-ADR 69 vehicles
without a frontal airbag system being activated. The latter two findings are
indicative of benefits attributable to airbag system deployment, including seat belt
technology (for instance, pretension systems and load limiters) in reducing the
injury risk to the abdomen and pelvic contents.
In the calculation of odds ratios, EBS was seen to hold a non-linear relationship
with the risk of AIS 2+ injuries, such that injury risk was higher for lower and
higher EBS speeds (p 0.001). The probability of AIS 2+ injury was low at the ADR
69 test speed of 48 km/h, with the estimate being 3% (CI: 0.01-0.08) among the
drivers of pre-ADR 69 cars compared to 8% (CI: 0.02-0.24). for drivers of post-
ADR 69 passenger cars. Similarly, the probability of AIS 2+ neck injuries among
drivers of without an airbag deployment was 3% (CI: 0.01-0.08) compared to 1%
(CI: 0.001-0.03) among drivers exposed to an airbag deployment. The equations in
Equation Box 7, Section 7.1.7 were used to calculate the probability estimates
Finally, driver body weight was also an important predictor (p 0.05) with the risk
being higher for drivers of lighter body weight (p 0.05).

– 60 –
3.3.6 Spine Injury Risk
ADR 69/00 did not directly specify performance criteria for the cervical spine with
the exception of instances where no head contact was apparent. In cases of no head
contact, ADR 69 sought to restrict the forces the Hybrid III dummy would
experience, such that neck injury measurements shall not exceed 3300 N of tension
force in the inferior-superior direction. Benefits might also be expected due to ADR
69’s thorax and femur load specifications, which may act to limit forces applied to
the thoraco-lumbar region of the vertebral column. This section will examine in
detail AIS 1+ injuries due to ‘whiplash’ injuries being coded as AIS 1 (minor).
Table 41 gives examples of spinal injuries by AIS severity and these involve
fractures of the vertebral column and spinal cord injuries at all levels, while Table
42 shows the proportion of drivers in the pre-ADR 69 group and post-ADR 69
group with each injury severity. Of importance is the observation that the
proportion of drivers with spine injuries among the sample is low.
Table 41: Examples of spine injuries by AIS severity (AAAM, 1998)
AIS severity Spine injury example
Minor (1) Strain, acute with no fracture or dislocation (Cervical spine known as
‘whiplash’); interspinous ligament disruption/laceration
Moderate (2)
Incomplete brachial plexus injury – contusion/laceration; Intervertebral
disc injury without nerve root damage; disc subluxation without fracture
or spinal cord contusion; contusion/laceration of nerve root; Vertebral
fracture without cord involvement; fracture of vertebrae spinous
process, transverse process, and minor compression (<25%) of
vertebral body (‘Burst fracture’)
Serious (3) Spinal cord contusion; major compression (>25%) of vertebral body
(‘Burst fracture’); fracture of vertebral lamina, pedicle
Severe (4) Incomplete cord syndrome with some preservation of sensation/motor
function
Critical (5)
Complete spinal cord syndrome - quadriplegia or paraplegia with no
sensation. C4-C7; spinal cord laceration C4 or lower; Thoracic &
Lumbar spine cord laceration & complete cord syndrome
Maximum (6) Complete spinal cord syndrome - quadriplegia or paraplegia with no
sensation. C1-C3; spinal cord laceration C3 or higher
Table 42: Distribution of AIS severity spine injuries for pre-& post-ADR 69 drivers
Pre-ADR 69 Post-ADR 69 AIS
Freq. % of drivers Freq. % of drivers
Minor (1) 4 2.5 4 3.1
Moderate (2) 4 2.5 8 6.2
Serious (3) 1 0.6 2 1.5
Severe (4) Nil Nil Nil Nil
Critical (5) Nil Nil Nil Nil

– 61 –
Spine Injury Risk
Table 43 shows that 4.5% of drivers of pre-ADR 69 vehicles sustained an injury to
the spine compared to 9.3% of drivers of post-ADR 69 vehicles. The direct ADR 69
comparison once controlled, or adjusted, for the effect of airbag deployment and
impact EBS (km/h) shows that there was a significant increased risk for drivers of
post-ADR 69 vehicles (OR: 6.62, 2.06-21.2, p 0.001). This result is cause for some
concern, and points to the need for future vehicle safety improvements, perhaps in
improved seat design and seat belt systems. The analysis does however indicate a
significant injury mitigation effect of the airbag, with the risk of spine injury being
81% lower where an airbag deployed (OR: 0.19, CI: 0.05-0.68, p 0.01). There was,
however, no benefit to drivers of post-ADR 69 vehicles where an airbag deployed,
relative to drivers of pre-ADR 69 non-airbag deployed vehicles (p 0.05). These
results may be reflective of the influence of stiff front end structures in injury risk
being compensated by airbag deployment, especially of the cervical spine.
In the analysis presented, it is important to note that variables such as vehicle
market class, collision partner, and driver characteristics were not related to spine
injury risk. Initial analysis indicated that weight was a significant predictor,
however once a single outlier was removed from the analysis, occupant weight no
longer held predictive value; hence the analysis presented excludes a single 66 year
old with body weight 35 kg. While EBS was included in the model, there was no
direct relationship with spine injury risk (p 0.05). The statistical model itself
displayed ‘acceptable’ discrimination, with Area under the ROC curve being 0.72.
Table 43: Percent of drivers sustaining an injury to the spine and AIS 2+ spine injuries, & the adjusted relative odds ratios for drivers of post-ADR 69 vehicles compared to pre-ADR 69 vehicles, airbag deployments, and the dual effect
Body region
Pre-ADR 69
(n=156)
Post-ADR 69
(n=129)
95% CI
(L-U)
P
Injured / AIS 1+ 4.5% 9.3%
Post-ADR 69 OR: 6.62 2.06-21.2 0.001
Airbag deployment OR: 0.19 0.05-0.68 0.01
ADR 69+Airbag OR: 1.27 0.35-4.56 p 0.05
AIS 2+ injury 2.5% 6.9%
Post-ADR 69 OR: 9.95 2.29-43.1 0.01
Airbag deployment OR: 0.18 0.04-0.81 0.05
ADR 69+Airbag OR: 1.81 0.35-9.41 0.05
Figure 21 and Table 44 presents the probability of sustaining injuries to the spine
for drivers of pre-ADR 69 and post-ADR 69 vehicles; the formulae in Equation
Box 8, Section 7.1.8, were used in the calculation of these probability estimates.
The ADR 69 test speed of 48 km/h is indicated by a vertical line in Figure 21 and
by bold text in Table 44. As indicated by the odds ratio presented above, the
probability estimates show the consistently higher risk of spine injury for drivers of
post-ADR 69 vehicles. For instance, at an EBS of 48 km/h, the injury risk for
drivers of post-ADR 69 vehicles was seen to be 0.27 (CI: 0.13-0.47) while the risk

– 62 –
for drivers of pre-ADR 69 drivers was 0.05 (CI: 0.02-0.11); similar comparisons
may be drawn across the entire EBS range.
Figure 21: Observed probability distribution for AIS 1+ spine injuries for drivers of pre-ADR 69 and post-ADR 69 vehicles; vertical line indicates 48 km/h; ADR 69 test speed
0
0.1
0.2
0.3
0.4
0.5
0.6
0.7
0.8
0.9
1
7 10 13 16 19 22 25 28 31 34 37 40 43 46 49 52 55 58 61 64 67 70 73 76 79 82 85 88 91 94 97
EBS (km/h)
Pro
ba
bil
ity
ofS
pin
e In
juri
es
Post-ADR Prob. Post: LCI Post: UCIPre-ADR Prob. Pre: LCI Pre: UCI
Table 44: Probability estimates for AIS 1+ spine injuries for drivers of pre-ADR 69 and post-ADR 69 vehicles
Pre-ADR 69 cases Post-ADR 69 cases
95th
% CI 95th
% CI
EBS
(km/h) Probability
Lower Upper
Probability
Lower Upper
20 0.03 0.01 0.11 0.19 0.06 0.47
30 0.04 0.02 0.10 0.22 0.08 0.45
40 0.05 0.02 0.10 0.24 0.11 0.46
48 0.05 0.02 0.11 0.27 0.13 0.47
50 0.05 0.02 0.11 0.27 0.13 0.48
60 0.06 0.03 0.14 0.30 0.15 0.52
70 0.07 0.03 0.17 0.34 0.16 0.58
80 0.08 0.03 0.23 0.37 0.15 0.66
90 0.09 0.02 0.30 0.41 0.15 0.73
The injury mitigation effect of airbag fitment and deployment is seen expressed by
the probability estimates presented in Figure 22 and Table 45. The odds ratio
indicates a highly statistically significant 81% reduction in the risk of spine injury
for those exposed to an airbag deployment relative to those without an airbag fitted
/ deployed (OR: 0.19, CI: 0.05-0.68, p 0.01). While the airbag is highly beneficial
in mitigating injuries to the spine, it is also important to note that the overall risk, or
probability, of injury is small.
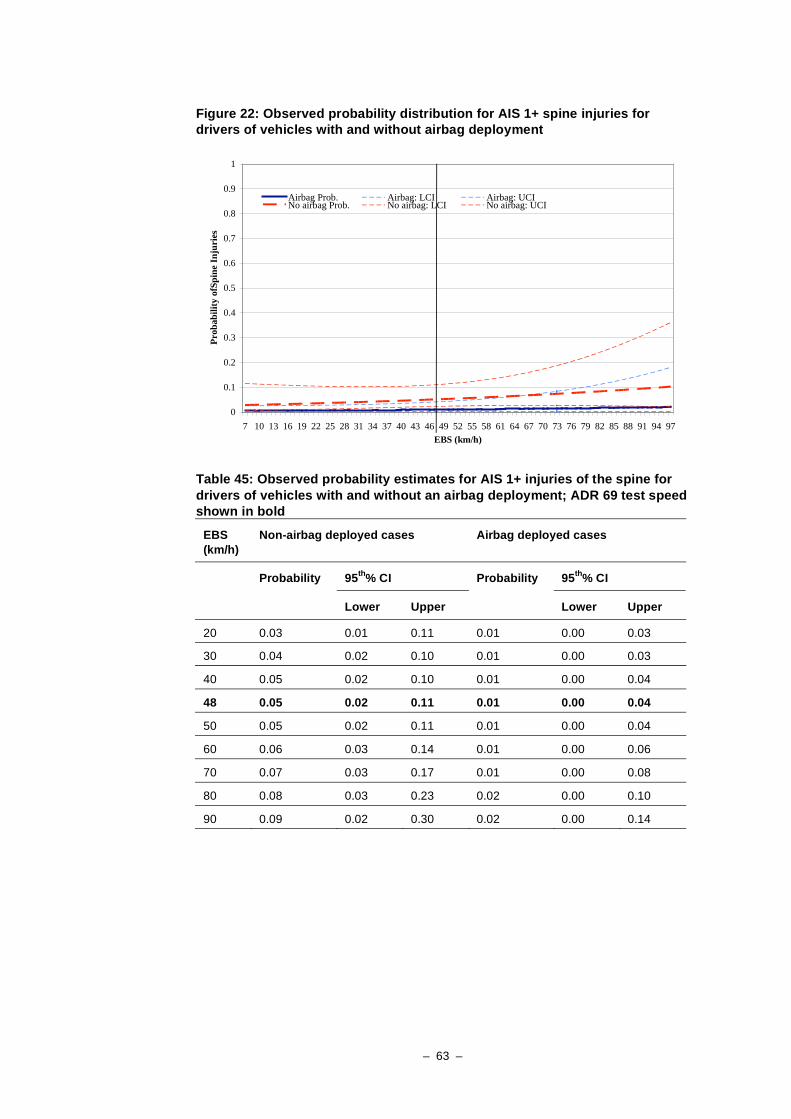
– 63 –
Figure 22: Observed probability distribution for AIS 1+ spine injuries for drivers of vehicles with and without airbag deployment
0
0.1
0.2
0.3
0.4
0.5
0.6
0.7
0.8
0.9
1
7 10 13 16 19 22 25 28 31 34 37 40 43 46 49 52 55 58 61 64 67 70 73 76 79 82 85 88 91 94 97
EBS (km/h)
Pro
ba
bil
ity
ofS
pin
e In
juri
es
Airbag Prob. Airbag: LCI Airbag: UCINo airbag Prob. No airbag: LCI No airbag: UCI
Table 45: Observed probability estimates for AIS 1+ injuries of the spine for
drivers of vehicles with and without an airbag deployment; ADR 69 test speed shown in bold
EBS
(km/h)
Non-airbag deployed cases Airbag deployed cases
95th
% CI 95th
% CI Probability
Lower Upper
Probability
Lower Upper
20 0.03 0.01 0.11 0.01 0.00 0.03
30 0.04 0.02 0.10 0.01 0.00 0.03
40 0.05 0.02 0.10 0.01 0.00 0.04
48 0.05 0.02 0.11 0.01 0.00 0.04
50 0.05 0.02 0.11 0.01 0.00 0.04
60 0.06 0.03 0.14 0.01 0.00 0.06
70 0.07 0.03 0.17 0.01 0.00 0.08
80 0.08 0.03 0.23 0.02 0.00 0.10
90 0.09 0.02 0.30 0.02 0.00 0.14
– 64 –
AIS 2+ Spine Injury Risk
Table 43 also shows that approximately 2.5% of drivers of pre-ADR 69 vehicles
sustained an AIS 2 (moderate) or higher injury of the spine, compared to 6.9% of
drivers of ADR 69 compliant vehicles. That the results mirror those seen for AIS 1+
injuries is unsurprising given the small numbers of drivers with AIS 2+ injuries,
and consequently will not be elaborated upon. For purposes of completeness, it is
noted that the probability of AIS 2+ injury was low at the ADR 69 test speed of 48
km/h, with the estimate being 3% (CI: 0.01-0.08) among the drivers of pre-ADR 69
cars compared to 21% (CI: 0.02-0.24). for drivers of post-ADR 69 passenger cars.
Finally, the probability of AIS 2+ neck injuries among drivers of without an airbag
deployment was 3% (CI: 0.01-0.08) compared to 0.5% (CI: 0.001-0.03) among
drivers exposed to an airbag deployment. These probability estimates reflect the
odds ratios presented in Table 43. The formulae in Equation Box 9, Section 7.1.9,
were used in the calculation of these probability estimates.
3.3.7 Upper Extremity Injury Risk
Upper extremity injuries do not present the same degree of threat-to-life potential as
injuries in other regions assuming appropriate and timely medical treatment is
received, as evidenced by the highest possible AIS severity score being AIS 3
‘Serious’ for the region. Examples of upper extremity injuries are provided in Table
46.
Table 46: Examples of upper extremity injuries by AIS severity (AAAM, 1998)
AIS severity Upper extremity injury example
Minor (1)
Superficial lacerations, contusions & penetrating injuries; minor
lacerations of arterial/venous system; nerve contusions; joint sprains
(elbow, shoulder, wrist) and bones of hand dislocation ; fracture of
finger
Moderate (2)
Penetrating injury with tissue loss; major (size/depth) skin, muscle,
subcutaneous laceration / avulsion; degloving injury of arm/forearm;
minor lacerations of arterial and venous system; Dislocation of shoulder,
sterno-clavicular joint; dislocation of wrist; fracture of clavicle; simple
closed fracture of humerus, radius, scapula and ulna
Serious (3)
Amputation at any point of extremity except finger; penetrating injury
with major (>20%) blood loss; major artery/vein lacerations; crush injury
of wrist; open, displaced or comminuted fracture of humerus, radius or
ulna
Table 47 shows the percentage of drivers in the two ADR 69 groups sustaining
upper extremity injuries. A higher proportion of drivers of post-ADR 69 vehicles
sustained AIS 1 ‘minor’ injuries (64.3%) compared to drivers of pre-ADR 69
vehicles (53.8%). There were slightly fewer drivers of post-ADR 69 vehicles with
‘moderate’ (AIS 2) upper extremity injuries than their pre-ADR 69 counterparts,
while a similar proportion sustained AIS 3 upper extremity injuries.
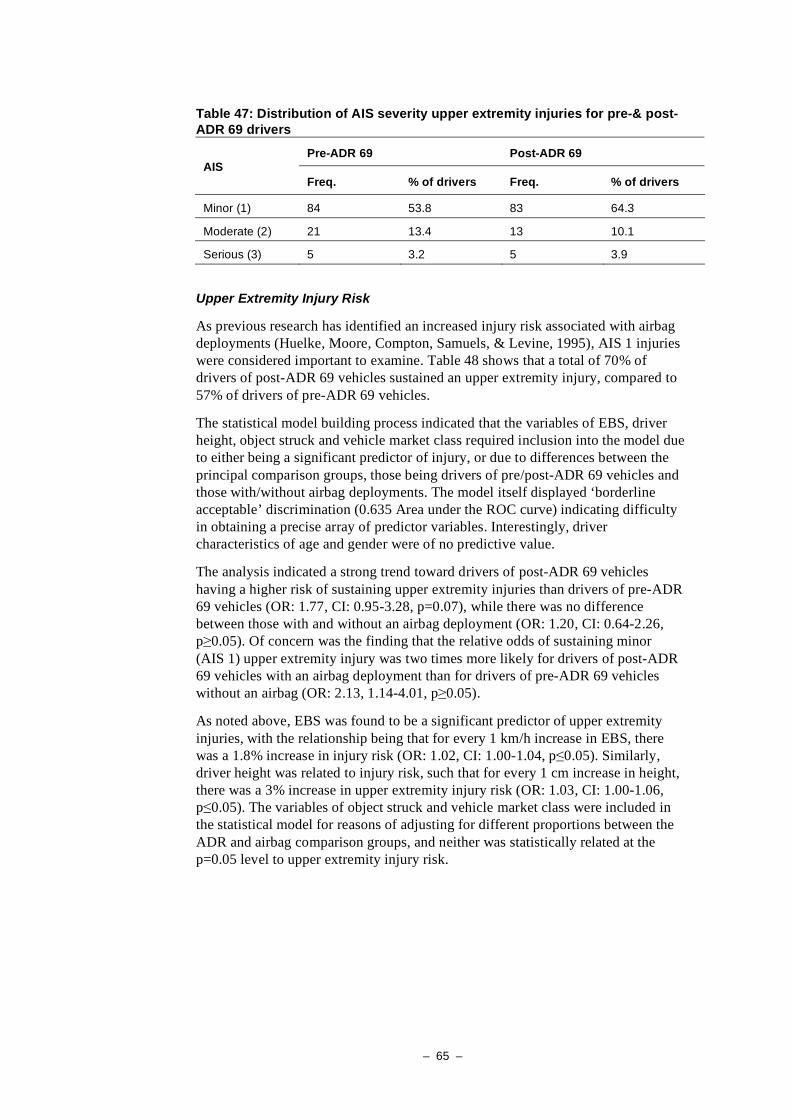
– 65 –
Table 47: Distribution of AIS severity upper extremity injuries for pre-& post-ADR 69 drivers
Pre-ADR 69 Post-ADR 69 AIS
Freq. % of drivers Freq. % of drivers
Minor (1) 84 53.8 83 64.3
Moderate (2) 21 13.4 13 10.1
Serious (3) 5 3.2 5 3.9
Upper Extremity Injury Risk
As previous research has identified an increased injury risk associated with airbag
deployments (Huelke, Moore, Compton, Samuels, & Levine, 1995), AIS 1 injuries
were considered important to examine. Table 48 shows that a total of 70% of
drivers of post-ADR 69 vehicles sustained an upper extremity injury, compared to
57% of drivers of pre-ADR 69 vehicles.
The statistical model building process indicated that the variables of EBS, driver
height, object struck and vehicle market class required inclusion into the model due
to either being a significant predictor of injury, or due to differences between the
principal comparison groups, those being drivers of pre/post-ADR 69 vehicles and
those with/without airbag deployments. The model itself displayed ‘borderline
acceptable’ discrimination (0.635 Area under the ROC curve) indicating difficulty
in obtaining a precise array of predictor variables. Interestingly, driver
characteristics of age and gender were of no predictive value.
The analysis indicated a strong trend toward drivers of post-ADR 69 vehicles
having a higher risk of sustaining upper extremity injuries than drivers of pre-ADR
69 vehicles (OR: 1.77, CI: 0.95-3.28, p=0.07), while there was no difference
between those with and without an airbag deployment (OR: 1.20, CI: 0.64-2.26,
p 0.05). Of concern was the finding that the relative odds of sustaining minor
(AIS 1) upper extremity injury was two times more likely for drivers of post-ADR
69 vehicles with an airbag deployment than for drivers of pre-ADR 69 vehicles
without an airbag (OR: 2.13, 1.14-4.01, p 0.05).
As noted above, EBS was found to be a significant predictor of upper extremity
injuries, with the relationship being that for every 1 km/h increase in EBS, there
was a 1.8% increase in injury risk (OR: 1.02, CI: 1.00-1.04, p 0.05). Similarly,
driver height was related to injury risk, such that for every 1 cm increase in height,
there was a 3% increase in upper extremity injury risk (OR: 1.03, CI: 1.00-1.06,
p 0.05). The variables of object struck and vehicle market class were included in
the statistical model for reasons of adjusting for different proportions between the
ADR and airbag comparison groups, and neither was statistically related at the
p=0.05 level to upper extremity injury risk.

– 66 –
Table 48: Percent of drivers sustaining an injury to the upper extremity and AIS 2+ upper extremity injuries, & the adjusted relative odds ratios for drivers of post-ADR 69 vehicles compared to pre-ADR 69 vehicles, airbag deployments, and the dual effect
Body region
Pre-ADR 69
(n=156)
Post-ADR 69
(n=129)
95% CI
(L-U)
P
Injured / AIS 1+ 57.1% 70.5%
Post-ADR 69 OR: 1.77 0.95-3.28 0.07
Airbag deployment OR: 1.20 0.64-2.26 p 0.05
ADR 69+Airbag OR: 2.13 1.14-4.01 p 0.05
AIS 2+ injury 14.7% 13.9%
Post-ADR 69 OR: 0.84 0.35-1.99 p 0.05
Airbag deployment OR: 0.95 0.40-2.28 p 0.05
ADR 69+Airbag OR: 0.81 0.33-1.95 p 0.05
The probability estimates for upper extremity injuries are presented for drivers of
pre-ADR 69 drivers and post-ADR 69 drivers in Figure 23, and are replicated in
Table 49 in 10 km/h EBS increments. The ADR 69 test speed of 48 km/h is
highlighted in Figure 23 by a vertical line and by bold typeface in Table 49. The
formulae in Equation Box 10, Section 7.1.10, were used to calculate the probability
estimates associated with the ADR 69 and airbag comparisons.
It is evident from Figure 23 and Table 49 that the risk of sustaining any AIS 1+
injury of the upper extremity is high, but higher for drivers of post-ADR 69
vehicles. At the ADR 69 test speed, the risk of injury was found to be 77% for
drivers of post-ADR 69 vehicles and 66% for drivers of pre-ADR 69 vehicles. It
does however remain important to note that AIS 1 injuries include superficial
contusions but also joint sprains, fractured fingers and joint dislocations, and while
these injuries may not present as a significant threat-to-life, they can represent
significant morbidity in performing activities of daily living.

– 67 –
Figure 23: Observed probability distribution for AIS 1+ upper extremity injuries for drivers of pre-ADR 69 and post-ADR 69 vehicles
0
0.1
0.2
0.3
0.4
0.5
0.6
0.7
0.8
0.9
1
7 10 13 16 19 22 25 28 31 34 37 40 43 46 49 52 55 58 61 64 67 70 73 76 79 82 85 88 91 94 97
EBS (km/h)
Pro
ba
bil
ity
of
Up
p.E
x.
Inju
ry
Post-ADR69 Prob. Post: LCI Post: UCIPre-ADR69 Prob. Pre: LCI Pre: UCI
Table 49: Observed probability distribution for AIS 1+ upper extremity injuries
for drivers of pre-ADR 69 and post-ADR 69 vehicles; ADR 69 test speed shown in bold
Pre-ADR 69 cases Post-ADR 69 cases
95th
% CI 95th
% CI
EBS
(km/h) Probability
Lower Upper
Probability
Lower Upper
20 0.54 0.35 0.71 0.67 0.47 0.82
30 0.58 0.41 0.73 0.71 0.53 0.84
40 0.62 0.46 0.76 0.75 0.58 0.86
48 0.66 0.50 0.79 0.77 0.61 0.88
50 0.66 0.50 0.79 0.78 0.61 0.89
60 0.70 0.53 0.83 0.81 0.64 0.91
70 0.74 0.56 0.86 0.83 0.66 0.93
80 0.77 0.57 0.89 0.86 0.68 0.94
90 0.80 0.59 0.92 0.88 0.69 0.96
The probability estimates for sustaining upper extremity injuries by airbag
deployment status is presented in Figure 24 and Table 50 below. Similar to the
probability estimates presented above, the risk of upper extremity injury is high
irrespective of airbag deployment group, however there is little difference in risk
between the airbag deployed and no airbag group.

– 68 –
Figure 24: Observed probability distribution for AIS 1+ upper extremity injuries for drivers of vehicles with and without airbag deployment
0
0.1
0.2
0.3
0.4
0.5
0.6
0.7
0.8
0.9
1
7 10 13 16 19 22 25 28 31 34 37 40 43 46 49 52 55 58 61 64 67 70 73 76 79 82 85 88 91 94 97
EBS (km/h)
Pro
ba
bil
ity
of
Up
p.E
x.
Inju
ry
Airbag Prob. Airbag: LCI Airbag: UCINo airbag Prob. No airbag: LCI No airbag: UCI
Table 50: Observed probability distribution for AIS 1+ upper extremity injuries
for drivers of vehicles with and without an airbag deployment; ADR 69 test speed shown in bold
EBS
(km/h)
Non-airbag deployed cases Airbag deployed cases
95th
% CI 95th
% CI Probability
Lower Upper
Probability
Lower Upper
20 0.54 0.35 0.71 0.58 0.37 0.76
30 0.58 0.41 0.73 0.63 0.42 0.79
40 0.62 0.46 0.76 0.67 0.47 0.82
48 0.66 0.50 0.79 0.70 0.49 0.85
50 0.66 0.50 0.79 0.70 0.50 0.85
60 0.70 0.53 0.83 0.74 0.53 0.88
70 0.74 0.56 0.86 0.77 0.55 0.91
80 0.77 0.57 0.89 0.80 0.56 0.93
90 0.80 0.59 0.92 0.83 0.57 0.95
AIS 2+ Upper Extremity Injury Risk
Table 48 (p.66) shows that approximately 15% of drivers of pre-ADR 69 vehicles
sustained an AIS 2 (moderate) or higher injury of the upper extremity, compared to
14% of drivers of post-ADR 69 vehicles. AIS 2 injuries include dislocations of the
shoulder and wrist, clavicle fractures and simple fractures of bones of the arm,
while AIS 3 injuries include amputation, penetrating injuries with >20% blood loss,
and open, displaced or comminuted fractures of the bones of the arm (refer Table
46).
– 69 –
The findings of the logistic regression model were such that there was no difference
in risk of AIS 2+ injuries between the ADR 69 groups (OR: 0.84, CI: 0.35-1.99,
p 0.05) or the airbag deployed / non-deployed groups (OR: 0.95, CI: 0.40-2.28,
p 0.05). Similarly, there was no difference in injury risk of drivers of post-ADR 69
vehicles with an airbag deployed relative to drivers of pre-ADR 69 vehicles without
an airbag (OR: 0.81, CI: 0.33-1.95, p 0.05).
AIS 2+ upper extremity risk was influenced, and hence adjusted for EBS (km/h),
vehicle market class, collision partner, and occupant height. Driver age and gender
were not useful predictors of upper extremity injuries. Injury risk was seen to
increase by 3.5% for every 1 km/h increase in EBS (OR: 1.03, CI: 1.01-1.06,
p 0.05), while drivers of large vehicles were 76.5% less likely to sustain AIS 2+
upper extremity injuries than occupants of small and medium sized vehicles (OR:
0.23, CI: 0.10-0.54, p 0.05). While there was no difference between drivers
involved in collisions with larger vehicles such as 4WD, trucks, and buses (as a
single grouping) compared to those involved in collisions with sedans (OR: 1.24,
CI: 0.41-3.68, p 0.05), those impacting poles and trees were found to be over two
times more likely to sustain AIS 2+ injuries of the upper extremity relative to those
involved in collisions with sedans and derivatives such as station-wagons (OR:
2.27, CI: 1.05-4.90, p 0.05). Driver height was also included in the logistic
regression model and, whilst not statistically significant, the point estimate suggests
an increase of 3.5% in risk for every 1 cm increase in height (OR: 1.035, CI: 0.99-
1.08, p 0.05); the probability for a driver of 165 cm in height was found to be 19%
(CI: 9-35%) while for a driver of 180 cm in height the probability of an AIS 2+
injury was found to be 28% (CI: 13-49%).
Figure 25 shows the observed probability distribution for AIS 2+ upper extremity
injuries for drivers of pre-ADR 69 and post-ADR 69 vehicles, while Table 51
shows the same estimates though in 10 km/h increments. The formulae in Equation
Box 11, Section 7.1.11, were used to calculate the probability estimates associated
with the ADR 69 and airbag comparisons. As noted above, the risk of sustaining an
AIS 2+ upper extremity injury is seen to increase with increasing crash severity. At
the mandated ADR 69 test speed of 48 km/h, the observed probability of sustaining
an AIS 2+ upper extremity injury is 26% (CI: 12-46%) for drivers of post-ADR 69
vehicles compared to 29% (CI: 15-48%) for drivers of pre-ADR 69 vehicles. As
indicated by the odds ratio, there was little difference in the risk of injury between
drivers in the pre- and post-ADR 69 driver groups.

– 70 –
Figure 25: Observed probability distribution for AIS 2+ upper extremity injuries for drivers of post-ADR 69 vehicles
0
0.1
0.2
0.3
0.4
0.5
0.6
0.7
0.8
0.9
1
7 10 13 16 19 22 25 28 31 34 37 40 43 46 49 52 55 58 61 64 67 70 73 76 79 82 85 88 91 94 97
EBS (km/h)
Pro
ba
bil
ity
of
Up
p.E
x.
AIS
2+
Post-ADR69 Prob. Post: LCI Post: UCIPre-ADR69 Prob. Pre: LCI Pre: UCI
Table 51: Observed probability distribution for AIS 2+ upper extremity injuries
for drivers of pre-ADR 69 and post-ADR 69 vehicles; ADR 69 test speed shown in bold
Pre-ADR 69 cases Post-ADR 69 cases
95th
% CI 95th
% CI
EBS (km/h)
Probability
Lower Upper
Probability
Lower Upper
20 0.13 0.05 0.29 0.12 0.04 0.28
30 0.18 0.08 0.35 0.16 0.06 0.33
40 0.24 0.12 0.42 0.21 0.09 0.40
48 0.29 0.15 0.48 0.26 0.12 0.46
50 0.30 0.16 0.50 0.27 0.13 0.48
60 0.38 0.20 0.60 0.34 0.17 0.57
70 0.47 0.25 0.70 0.42 0.21 0.67
80 0.55 0.29 0.79 0.51 0.25 0.76
90 0.64 0.33 0.86 0.60 0.29 0.84
Figure 26 presents the observed probability distribution for AIS 2+ upper extremity
injuries for drivers of vehicles with and without airbag deployments, while Table 52
presents the probability estimates in 10 km/h EBS increments. The lack of
difference in injury risk between the airbag deployed and non-airbag groups is
evident, with the curves closely tracking one another throughout the EBS range.
While the probability of injury at EBS impact speeds of less than 48 km/h is
relatively low at 25%, the probability of injury increases such that at 80 km/h the
risk of injury in approximately 50% for both driver groups.

– 71 –
Figure 26: Observed probability distribution for AIS 2+ upper extremity injuries for drivers of vehicles with and without airbag deployment
0
0.1
0.2
0.3
0.4
0.5
0.6
0.7
0.8
0.9
1
7 10 13 16 19 22 25 28 31 34 37 40 43 46 49 52 55 58 61 64 67 70 73 76 79 82 85 88 91 94 97
EBS (km/h)
Pro
ba
bil
ity
of
Up
p.E
x.
AIS
2+
Airbag Prob. Airbag: LCI Airbag: UCINo airbag Prob. No airbag: LCI No airbag: UCI
Table 52: Observed probability distribution for AIS 2+ upper extremity injuries
for drivers of vehicles with and without an airbag deployment
Non-airbag deployed cases Airbag deployed cases
95th
% CI 95th
% CI
EBS
(km/h) Probability
Lower Upper
Probability
Lower Upper
20 0.13 0.05 0.29 0.12 0.04 0.29
30 0.18 0.08 0.35 0.16 0.06 0.36
40 0.24 0.12 0.42 0.21 0.08 0.45
48 0.29 0.15 0.48 0.26 0.10 0.52
50 0.30 0.16 0.50 0.27 0.10 0.54
60 0.38 0.20 0.60 0.34 0.13 0.65
70 0.47 0.25 0.70 0.42 0.16 0.75
80 0.55 0.29 0.79 0.51 0.19 0.83
90 0.64 0.33 0.86 0.60 0.22 0.89

– 72 –
3.3.8 Lower Extremity Injury Risk
For the lower extremity, ADR 69 specified a maximum axial force through each
femur not exceeding 10 kN. Examples of lower extremity injuries are presented in
Table 53, while Figure 29 shows an x-ray of a fractured right fibula as a
consequence of a frontal collision. Fractures of the lower extremity are of a
minimum AIS 2 severity, and include simple fractures of the patella, pelvis, tibia,
fibula and bones of the foot as examples, while the AIS severity increases with the
increasingly serious nature of the fracture, and usually involves blood loss.
Table 53: Examples of lower extremity injuries by AIS severity (AAAM, 1998)
AIS severity Lower extremity injury example
Minor (1)
Superficial lacerations, contusions & penetrating injuries; muscle
strain/contusion, ankle, hip, knee, foot bones, fibula & tibia
contusion/sprain; fractured toe
Moderate (2)
Penetrating injury with tissue loss; major (size/depth) skin, muscle,
subcutaneous laceration / avulsion; minor disruption to arterial and
venous structures (except femoral artery); nerve contusions/lacerations;
ligament disruption; Dislocation of knee and ankle; calcaneus fracture;
patella fracture; fracture of pelvis – closed, with or without dislocation;
tibia/fibula fracture; crush injury / amputation of toe
Serious (3)
large blood loss due to injury to skin, muscle, subcutaneous laceration /
avulsion; traumatic amputation below knee; major disruption to arterial
and venous structures (except femoral artery); sciatic nerve laceration;
Fractures of the tibia, fibula, pelvis, open, displaced or comminuted;
fracture of the femur
Severe (4)
Traumatic amputation – above knee; major disruption to femoral artery;
fracture of pelvis with substantial deformation, or ‘open book’, blood
loss<20%
Critical (5) Fracture of pelvis with substantial deformation, or ‘open book’ with
blood loss>20%
Table 54 indicates that approximately half of all drivers in the two ADR 69 groups
sustained a AIS 1 ‘Minor’ lower extremity injury. A sizeable proportion of drivers
also sustained AIS 2 and AIS 3 injuries, while there was one driver in the post-ADR
69 group with an AIS 4 ‘Severe’ injury.
Table 54: Distribution of lower extremity injuries by AIS for pre-& post-ADR 69
drivers
Pre-ADR 69 Post-ADR 69 AIS
Freq. % of drivers Freq. % of drivers
Minor (1) 83 53.2 62 48.1
Moderate (2) 28 17.9 19 14.8
Serious (3) 11 7.1 11 8.5
Severe (4) Nil Nil 1 0.8
Critical (5) Nil Nil Nil Nil

– 73 –
Lower Extremity Injury Risk
Table 55 shows that a slightly higher proportion of drivers of pre-ADR 69 vehicles
sustained an injury of the lower extremity (55%) compared to drivers of post-ADR
69 vehicles (52%). In calculating the difference in injury risk between the ADR 69
and airbag driver groups, lower extremity risk was influenced by, and hence
adjusted for, EBS (km/h) and driver gender; no other variables held any influence
on the risk of injury. The logistic regression model displayed ‘acceptable’
discrimination, with the Area under the ROC curve being 0.72. The odds ratio for
EBS indicated a statistically significant 4.6% increase in risk for every 1 km/h
increase in EBS (OR: 1.05, CI: 1.02-1.06, p 0.001), while males were 61% less
likely to sustain lower extremity injuries than females (OR: 0.39, CI: 0.22-0.67,
p 0.001).
The injury risk estimates indicate a statistically significant greater risk of injury for
drivers of post-ADR 69 vehicles relative to drivers of pre-ADR 69 vehicles (OR:
1.93, CI: 1.03-3.62, p 0.05) once gender and EBS were taken into consideration.
The odds ratio for the airbag group comparison suggests benefits (although
borderline statistically significant) for drivers with an airbag deployment (OR: 0.53,
CI: 0.29-1.00, p 0.05), potentially due to the effect of seat belt pretension systems
which act to minimise movement of the pelvis and / or the airbag preventing contact
with the base of the steering wheel, and hence reducing the number of ‘bruise’ type
injuries. There was, however, no difference in risk between drivers of pre-ADR 69
non-airbag equipped vehicles and drivers of post-ADR 69 vehicles with an airbag
deployment.
Table 55: Percent of drivers sustaining an injury to the lower extremity and
AIS 2+ lower extremity injuries & the adjusted relative odds ratios for drivers of post-ADR 69 vehicles compared to pre-ADR 69 vehicles, airbag deployments, and the dual effect
Body region
Pre-ADR 69
(n=156)
Post-ADR 69
(n=129)
95% CI
(L-U)
P
Injured / AIS 1+ 55.1% 51.9%
Post-ADR 69 OR: 1.93 1.03-3.62 p 0.05
Airbag deployment OR: 0.53 0.29-1.00 p 0.05
ADR 69+Airbag OR: 1.03 0.55-1.94 p 0.05
AIS 2+ injury 19.9% 17.0%
Post-ADR 69 OR: 1.50 0.64-3.51 p 0.05
Airbag deployment OR: 0.60 0.25-1.39 p 0.05
ADR 69+Airbag OR: 0.90 0.39-2.10 p 0.05

– 74 –
AIS 2+ Lower Extremity Injury Risk
Table 55 also presents the proportion of drivers with AIS 2+ lower extremity
injuries and relevant odds ratio comparisons. Approximately 20% of drivers of pre-
ADR 69 vehicles sustained an AIS 2 (moderate) or higher injury of the lower
extremity, compared to 17% of drivers of post-ADR 69 vehicles, indicating little
difference in the likelihood of injury.
Once the influence of EBS, vehicle market class and object struck were considered
within the logistic regression model, there was no statistically significant difference
among the three principal comparisons. The statistical model displayed borderline
‘acceptable’ discrimination with the Area under the ROC curve being 0.79, and
correctly classified 84.2% of cases.
The analysis indicates no difference in injury risk between the drivers of pre- and
post-ADR 69 vehicles (OR: 1.50, CI: 0.64-3.51, p 0.05). Similarly, these was no
difference in injury risk between drivers exposed to an airbag deployment relative
to those not exposed to an airbag deployment (OR: 0.60, CI: 0.39-2.10, p 0.05), or
drivers of post-ADR 69 vehicles with an airbag relative to drivers of pre-ADR 69
vehicle without an airbag deployment (OR: 0.90, CI: 0.39-2.10, p 0.05).
As noted above, AIS 2+ lower extremity risk was influenced by, and hence adjusted
for, EBS (km/h), vehicle market class, and collision partner. Injury risk was seen to
increase by a statistically significant 6.3% for every 1 km/h increase in EBS (OR:
1.06, CI: 1.04-1.09, p 0.001), while drivers of ‘large’ vehicles were 59% less likely
to sustain AIS 2+ lower extremity injuries compared to those in ‘small’ vehicles
(OR: 0.41, CI: 0.17-0.97, p 0.05). There was, however, no difference in injury risk
for those in ‘medium’ sized vehicles compared to drivers of small vehicles, while
the risk across an array of objects struck was similar; however it was important to
include this variable due to differences in object struck between the principal
comparison groups (p=0.5).
The probability of sustaining AIS 2+ injuries was derived using the formulae in
Equation Box 12, Section 7.1.12. Figure 27 and Table 56 presents the observed
probability distribution for AIS 2+ lower extremity injuries for drivers of pre-ADR
69 and post-ADR 69 vehicles, and the slightly higher risk to drivers of post-ADR
69 vehicles is evident. At the mandated ADR 69 test speed of 48 km/h, the
observed probability of an AIS 2+ lower extremity injury is 46% (CI: 24-70%)
compared to 36% for drivers of pre-ADR 69 vehicles (CI: 19-57%). The EBS result
indicates that the risk of injury increases by 6% for every 1 km/h EBS increase and
this is equal across both groups of drivers.
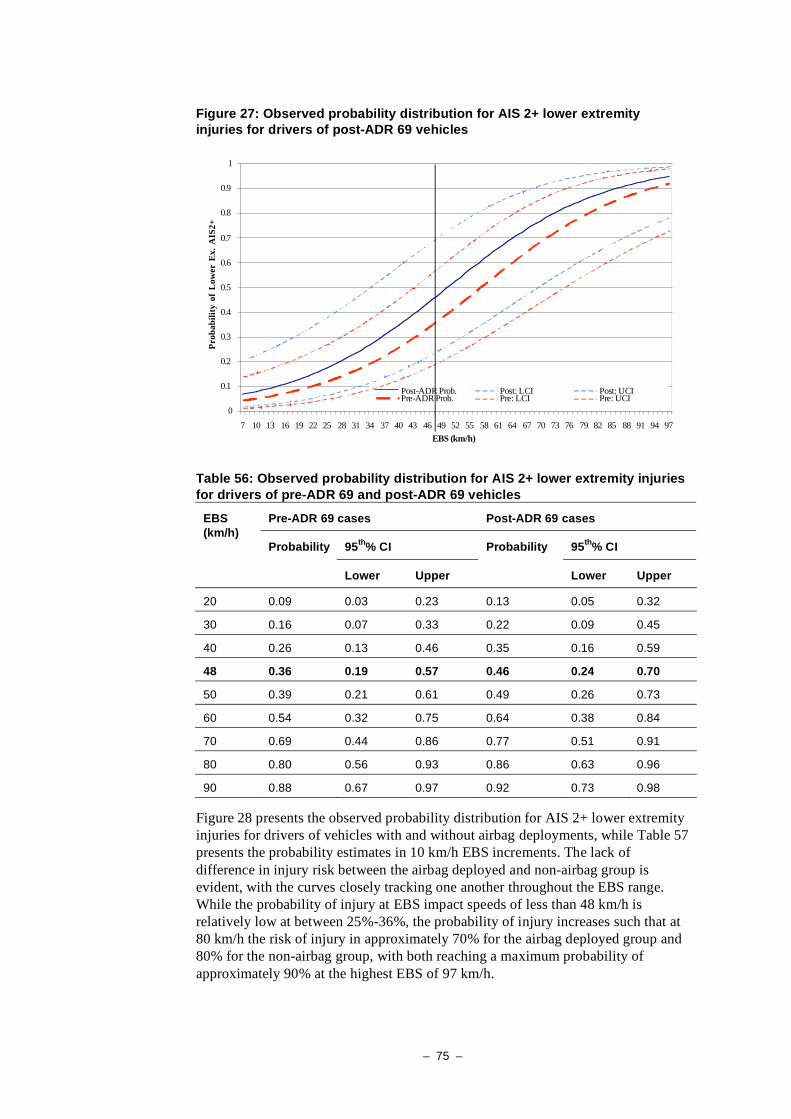
– 75 –
Figure 27: Observed probability distribution for AIS 2+ lower extremity injuries for drivers of post-ADR 69 vehicles
0
0.1
0.2
0.3
0.4
0.5
0.6
0.7
0.8
0.9
1
7 10 13 16 19 22 25 28 31 34 37 40 43 46 49 52 55 58 61 64 67 70 73 76 79 82 85 88 91 94 97
EBS (km/h)
Pro
ba
bil
ity
of
Lo
wer E
x.
AIS
2+
Post-ADR Prob. Post: LCI Post: UCIPre-ADR Prob. Pre: LCI Pre: UCI
Table 56: Observed probability distribution for AIS 2+ lower extremity injuries
for drivers of pre-ADR 69 and post-ADR 69 vehicles
Pre-ADR 69 cases Post-ADR 69 cases
95th
% CI 95th
% CI
EBS (km/h)
Probability
Lower Upper
Probability
Lower Upper
20 0.09 0.03 0.23 0.13 0.05 0.32
30 0.16 0.07 0.33 0.22 0.09 0.45
40 0.26 0.13 0.46 0.35 0.16 0.59
48 0.36 0.19 0.57 0.46 0.24 0.70
50 0.39 0.21 0.61 0.49 0.26 0.73
60 0.54 0.32 0.75 0.64 0.38 0.84
70 0.69 0.44 0.86 0.77 0.51 0.91
80 0.80 0.56 0.93 0.86 0.63 0.96
90 0.88 0.67 0.97 0.92 0.73 0.98
Figure 28 presents the observed probability distribution for AIS 2+ lower extremity
injuries for drivers of vehicles with and without airbag deployments, while Table 57
presents the probability estimates in 10 km/h EBS increments. The lack of
difference in injury risk between the airbag deployed and non-airbag group is
evident, with the curves closely tracking one another throughout the EBS range.
While the probability of injury at EBS impact speeds of less than 48 km/h is
relatively low at between 25%-36%, the probability of injury increases such that at
80 km/h the risk of injury in approximately 70% for the airbag deployed group and
80% for the non-airbag group, with both reaching a maximum probability of
approximately 90% at the highest EBS of 97 km/h.

– 76 –
Figure 28: Observed probability distribution for AIS 2+ lower extremity injuries for drivers of vehicles with and without airbag deployment
0
0.1
0.2
0.3
0.4
0.5
0.6
0.7
0.8
0.9
1
7 10 13 16 19 22 25 28 31 34 37 40 43 46 49 52 55 58 61 64 67 70 73 76 79 82 85 88 91 94 97
EBS (km/h)
Pro
ba
bil
ity
of
Lo
wer
Ex
. A
IS2
+
Airbag Prob. Airbag: LCI Airbag: UCINo airbag Prob. No airbag: LCI No airbag: UCI
Table 57: Observed probability distribution for AIS 2+ lower extremity injuries
for drivers of vehicles with and without an airbag deployment; ADR 69 test speed shown in bold
Non-airbag deployed cases Airbag deployed cases
95th
% CI 95th
% CI
EBS
(km/h) Probability
Lower Upper
Probability
Lower Upper
20 0.09 0.03 0.23 0.06 0.02 0.17
30 0.16 0.07 0.33 0.10 0.03 0.26
40 0.26 0.13 0.46 0.17 0.06 0.40
48 0.36 0.19 0.57 0.26 0.10 0.52
50 0.39 0.21 0.61 0.28 0.11 0.56
60 0.54 0.32 0.75 0.42 0.17 0.71
70 0.69 0.44 0.86 0.57 0.25 0.84
80 0.80 0.56 0.93 0.71 0.35 0.92
90 0.88 0.67 0.97 0.82 0.46 0.96
Figure 29 shows an oblique view of a right ankle indicating a fractured fibula,
resulting from a frontal collision. Such injuries were found to be common, and as
with all lower extremity fractures are extremely debilitating. Indeed, the average
return to work time for those with serious fractures of the lower extremity is over 6-
months (see Kufera, Read, Dischinger et al., 2004).

– 77 –
Figure 29: Oblique view of right lower leg indicating a fractured fibula, resulting from a frontal collision
– 78 –
3.4 Injury cost (harm) analysis: Harm associated with ADR 69 status
As discussed in the method, HARM is a technique for costing injuries of varying
severity for each body region. HARM analysis has the advantage of reflecting total
injury outcome (and associated cost).
Table 58 shows the mean HARM for each body region for drivers of pre-ADR 69
and post-ADR 69 manufactured vehicles, expressed in Australian dollars. Table 58
also provides the relative mean HARM estimate and the estimated cost of injury
difference expressed as reduction (-) or increase (+) for drivers of post-ADR 69
vehicles relative to pre-ADR 69 manufactured vehicles. The regression model
adjusts for EBS and vehicle market class. Due to the structure of the Poisson
regression model it is not appropriate to sum the cost savings of individual body
regions in Table 58 to derive an additive ADR 69 benefit; for instance summing
Head and Face will provide an incorrect monetary estimate. A series of cost of
injury comparisons across a number of body regions combined are presented in
Table 59.
3.4.1 Cost of Head Injuries
The mean cost of injury (HARM) associated with injuries of the head for drivers in
the pre-ADR 69 vehicle group was approximately AUD$31,110 compared to
AUD$10,650 for drivers of post-ADR 69 manufactured vehicles. Adjusting for
EBS and vehicle market class differences between the ADR 69 groups, the head
HARM in the post-ADR 69 group was 0.39 times (RR: 0.39, CI: 0.19-0.78,
p 0.001) that of drivers in the pre-ADR 69 group, equating to a 61% lower HARM.
By using the point estimate and the mean HARM associated with the pre-ADR 69
group, these results translate to an average per case saving of AUD$18,970, with
the confidence intervals suggesting this saving might range from as high as
AUD$25,100 to as low as AUD$6,800 per case.
3.4.2 Cost of Face Injuries
The mean cost of injury (HARM) associated with injuries of the face for drivers in
the pre-ADR 69 vehicle group was approximately AUD$10,320 compared to
AUD$3,200 for drivers of post-ADR 69 manufactured vehicles. Adjusting for EBS
and vehicle market class differences between the ADR 69 groups, the face HARM
in the post-ADR 69 group was 0.35 (RR: 0.35, CI: 0.21-0.58, p 0.001) that of
drivers in the pre-ADR 69 group, equating to a 65% lower cost of facial injury. By
using the point estimate and the mean HARM associated with the pre-ADR 69
group, these results translate to an average per case saving of AUD$6,730, with the
confidence intervals suggesting that the savings might be as low as AUD$4,400 or
as high as AUD$8,100 on average per case.

– 79 –
Table 58: Mean HARM (AUD‘000) & adjusted cost estimates by body regions for drivers of post-ADR 69 vehicles relative to drivers of
pre-ADR 69 vehicles, adjusted for EBS and vehicle market class
Body
Region
Pre-ADR 69
Mean
(‘000)
Post- ADR 69
Mean
(‘000)
Estimate
Post-ADR vs. Pre-ADR
Estimate 95% CI
(L/U)
P Benefit (-) / Cost
(+) $ Estimate
(‘000)
95% CI (L-U)
$ Estimate
(‘000)
Head 31.11 10.65 0.39 0.19-0.78 0.01 -18.97 -25.1, -6.8
Face 10.32 3.20 0.35 0.21-0.58 0.001 -6.73 -8.1, -4.4
Neck 4.00 1.48 0.33 0.20-0.57 0.001 -2.66 -3.2, -1.7
Chest 12.85 12.46 0.98 0.69-1.41 0.05 -0.23 -4.0, -5.2
Abdomen / pelvis 4.64 5.94 1.15 0.75-1.75 0.05 +0.68 -1.1,3.5
Spine 1.65 4.31 1.78 0.99-3.20 =0.05 +1.29 -.02, -3.6
Upper Extremity 14.60 13.80 0.98 0.70-1.39 0.05 -0.26 -4.4, 5.6
Lower Extremity 25.91 33.38 1.42 0.98-2.05 =0.06 +10.84 -.04, 27.1

– 80 –
3.4.3 Cost of Neck Injuries
The mean cost of neck injury (HARM) for drivers of pre-ADR 69 vehicles was
AUD$4,000 compared to AUD$1,480 for drivers of post-ADR 69 manufactured
vehicles, translating to an estimated average per case saving of AUD$2,660 (CI:
AUD$1,700 saving to AUD$3,200 saving). The neck injury HARM associated with
drivers of post-ADR 69 vehicles was one-third that of drivers of pre-ADR 69
vehicles (RR: 0.33, CI: 0.20-0.57, p 0.001)
3.4.4 Cost of Chest Injuries
Table 58 indicates that there was no difference (p 0.05) in the cost of chest injury
between drivers of pre-ADR 69 and post-ADR 69 vehicles, with the average per
case cost being AUD$12,850 and AUD$12,850 respectively.
3.4.5 Cost of Abdomen / Pelvic content Injuries
The cost of injury sustained to the abdomen and pelvic contents was, on average per
case, approximately AUD$4,640 and AUD$5,940 for drivers of pre- and post-ADR
69 vehicles respectively. Poisson analysis indicates that the cost of injuries
sustained by drivers of pre-ADR 69 and post-ADR 69 vehicles was not statistically
different, although the point estimate suggests an added 15% cost of injury for
drivers of post-ADR 69 vehicles (RR: 1.15, 0.75-1.75, p 0.05). The cost difference
was seen to be AUD$680 on average higher for drivers of post-ADR 69 vehicles
compared to drivers of pre-ADR 69 vehicles, however the 95th percentile
confidence intervals indicate that the benefit/disbenefit might range from a saving
of AUD$1,100 to an increased cost of AUD$3,500 per case, on average.
3.4.6 Cost of Spine Injuries
The analysis indicates that following adjustment for crash severity and occupant
vehicle market class, there was a 78% higher cost of spine injuries for drivers of
post-ADR 69 vehicles relative to drivers of pre-ADR 69 vehicles (RR: 1.78, CI:
0.99-3.2, p 0.05). The cost increase for drivers of post-ADR 69 vehicles is
AUD$1,200 per case on average, with the estimate ranging from a benefit of
$AUD200 to a disbenefit of AUD$3,600. The increase in cost was of borderline
statistical significance.
3.4.7 Cost of Upper Extremity Injuries
Table 58 indicates that there was no difference (p 0.05) in the cost of upper
extremity injury between drivers of pre-ADR 69 and post-ADR 69 vehicles with the
average per case cost being AUD$14,600 and AUD$13,800 respectively. These
results are interesting when linked to those of the Injury Risk Analysis that showed
that there was no difference in risk of higher severity (AIS 2+) upper extremity
injuries between drivers of pre-ADR 69 vehicle and post-ADR 69 vehicles; notably
though a statistically borderline increase in sustaining an AIS 1+ injury was
observed.
– 81 –
3.4.8 Cost of Lower Extremity Injuries
The cost of lower extremity injuries for drivers of pre-ADR 69 vehicles was, on
average, AUD$25,910 compared to AUD$33,380, on average, for drivers of post-
ADR 69 drivers. Following adjustment for EBS and vehicle market class, the cost
of injury was 42% higher for drivers of post-ADR 69 vehicles, compared to drivers
of pre-ADR 69 vehicles, although this was seen to be of borderline statistical
significance (p=0.06). This cost increase is seen in the Injury Risk Analysis as
being driven by a higher proportion of drivers in the post-ADR 69 group with the
more severe, and costly, AIS 3 and AIS 4 lower extremity injuries (see Table 54,
p.72).
3.4.9 Cost of Injuries Associated With Multiple Body Regions
Table 59 presents the mean cost for each of the two ADR 69 groups, as well as the
regression estimate of the difference in the mean injury costs for various
combinations of body regions. As noted above, it not statistically valid to simply
add or subtract the cost differences of any number of the individual body regions in
Table 59 to arrive at a injury cost value; rather, separate models have been
calculated where the cost of injuries for multiple body regions are assessed and
compared in the Poisson cost model. As an example, for the first comparison
presented in Table 59 summed the cost of injuries to the head, face, neck, and chest.
The cost of injury for drivers of post-ADR 69 vehicles (Mean: AUD$27,790) was
47% lower (0.53, 0.34-0.83, p 0.01) than for drivers of pre-ADR 69 vehicles
(Mean: AUD$58,280).
Table 59 also presents a number of injury combinations and it can be seen that all
comparisons find a cost saving associated with ADR 69 vehicles with the exception
of the ‘Whole-of-Body’ comparison. Notably, the ‘whole-of-body’ comparison
indicates that adding lower extremity injuries to the cost comparison reduces the
overall benefit of introducing ADR 69, indicating room for design improvements.
3.4.10 Summary of Injury Costs By Body Region
The HARM, or average cost of injury, sustained by drivers of post-ADR 69
manufactured vehicles was lower for the head, face and neck, and higher [although
borderline statistically significant] for the spine and lower extremity than for drivers
of pre-ADR 69 manufactured vehicles. While the results are suggestive of an
increased abdomen / pelvic content injury cost associated with drivers of post-ADR
69 vehicles, the result is ambiguous. The results indicate no difference in the cost of
chest and upper extremity injuries between the groups. The cost of injury analysis
also indicates significant benefits for combined body regions; however the addition
of lower extremity injuries reduces the overall benefit of introducing ADR 69 and
indicates room for design improvement.

– 82 –
Table 59: Mean HARM (AUD‘000) & adjusted cost estimates for combined body regions for drivers of post-ADR 69 vehicles relative
to drivers of pre-ADR 69 vehicles, adjusted for EBS and vehicle market class
Body Regions Pre-ADR 69
Mean
(‘000)
Post- ADR 69
Mean
(‘000)
Estimate
Post-ADR vs.
Pre-ADR
Estimate 95% CI
(L/U)
P Benefit (-) / Cost
(+) $ Estimate
(‘000)
95% CI (L-U)
$ Estimate
(‘000)
Head, Face, Neck, Chest 58.28 27.79 0.53 0.34, 0.83 0.01 -27.60 -38.7, -10.1
Head, Face, Neck, Chest,
Abdomen-Pelvis, Spine 64.57 38.03 0.63 0.42, 0.94 0.05 -24.19 -37.7, -3.9
Head, Face, Neck, Chest,
Abdomen-Pelvis, Spine,
Upper Extremity
79.18 51.84 0.70 0.49, 0.99 0.05 -24.00 -40.4, -0.5
Head, Face, Neck, Chest,
Upper Extremity 72.88 41.59 0.63 0.43, 0.92 0.01 -27.11 -41.6, -5.8
Whole-of-body 105.09 85.22 0.87 0.64-1.20 0.4 -13.24 -38.2, 20.9

– 83 –
4 DISCUSSION
4.1 Principal study outcomes
The findings of this study demonstrate significant reductions in injury risk, injury
severity and reduced cost of injury for particular body regions for drivers of post-
ADR 69 vehicles relative to drivers of pre-ADR 69 vehicles involved in frontal
impact tow-away and hospitalised crashes. In addition, significant improvements in
safety were associated with driver airbag deployment, regardless of ADR 69 build
date. Moreover, the combined effect of post-ADR 69 vehicles with an airbag
indicated benefits over and above the benefits associated with airbags or post-ADR
69 status alone. These results indicate that the presence and deployment of the
frontal airbag has driven much of the injury reduction benefits observed for the
head, face and chest. It remains the case for this sample though, that neither
ADR 69 compliance nor airbag deployment held any clear injury reduction benefits
for the neck, abdomen-pelvic contents, spine, upper extremity or the lower
extremity. The implications of these findings are discussed below and, consistent
with earlier sections of this report, each body region is considered briefly.
Table 60 presents in summary form the change in AIS 2+ injury risk associated
with post-ADR 69 vehicles relative to pre-ADR 69 vehicles, airbag deployment,
and the combined effect (see Section 7.2 for all injuries). In interpreting these
findings, it is important to also consider the probability of injury, as while there
might be large differences in terms of injury reductions, or increased likelihood of
injury in the instance of the spine and to a lesser degree the abdomen-pelvic
contents in the post-ADR 69 versus pre-ADR 69 drivers, the probability of injury
might be low. Table 61 and Table 62 present the probability of sustaining AIS 2+
injuries at an EBS of 48 km/h for post-ADR 69 drivers and pre-ADR 69 drivers,
and airbag deployment groups respectively.
Table 60: Change in injury risk for AIS 2+ injuries associated with ADR 69
status, airbag deployment and the combined effect
Body region Post-ADR 69 drivers
(a)
Airbag exposed drivers
(b)
Post-ADR 69 + Airbag exposed
(c)
Head 78% reduction† 82% reduction
‡ 96% reduction
‡
Face 88% reduction† 91% reduction
‡ 99% reduction
‡
Neck N.S.D N.S.D Indicative 80%
reduction*
Chest N.S.D 79% reduction‡ 74% reduction
‡
Abdomen –
Pelvic contents
N.S.D 83% reduction† N.S.D
Spine 895% increase‡ 82% reduction
‡ N.S.D
Upper Extremity N.S.D N.S.D N.S.D
Lower Extremity N.S.D N.S.D N.S.D
(a) Relative to pre-ADR 69 drivers; (b) Relative to driver’s without an airbag deployment; (c)
Relative to pre-ADR 69 drivers without an airbag deployment; * p 0.1, † 0.05, ‡ 0.01;
N.S.D – No statistical difference

– 84 –
Table 61: AIS 2+ probability estimates for drivers of pre-ADR 69 and post-ADR 69 passenger cars by body region at an EBS of 48 km/h
Pre-ADR 69 cases Post-ADR 69 cases
95th
% CI 95th
% CI
Body
region Probability
Lower Upper
Probability
Lower Upper
Head 0.44 0.23 0.67 0.15 0.05 0.37
Face 0.12 0.03 0.35 0.02 0.002 0.12
Neck 0.09 0.02 0.29 0.04 0.01 0.22
Chest 0.62 0.41 0.79 0.67 0.43 0.84
Abdomen-
Pelvis 0.03 0.01 0.08 0.08 0.02 0.24
Spine 0.03 0.01 0.08 0.21 0.09 0.42
Upper
Extremity 0.29 0.15 0.48 0.26 0.12 0.46
Lower
Extremity 0.36 0.19 0.57 0.46 0.24 0.70
Table 62: Injury probability estimates for drivers without a frontal airbag
deployment and drivers of passenger cars with an airbag deployment by body region at an EBS of 48 km/h
Non-airbag deployed cases Airbag deployed cases
95th
% CI 95th
% CI
Body
region Probability
Lower Upper
Probability
Lower Upper
Head 0.44 0.23 0.67 0.12 0.03
Face 0.12 0.03 0.35 0.01 0.001 0.17
Neck 0.09 0.02 0.29 0.04 0.004 0.31
Chest 0.62 0.41 0.79 0.26 0.09 0.54
Abdomen-
Pelvis 0.03 0.01 0.08 0.01 0.001 0.03
Spine 0.03 0.01 0.08 0.005 0.001 0.03
Upper
Extremity 0.29 0.15 0.48 0.26 0.10 0.52
Lower
Extremity 0.36 0.19 0.57 0.26 0.10 0.52

– 85 –
4.1.1 Discussion of Injuries to the Head
As presented in Table 60, the implementation of ADR 69 was associated with a
78% reduction in the risk of AIS 2+ injuries of the head. These injuries range from
loss of consciousness and concussion through to large haematomas within the brain
at the most critical end of the injury spectrum. Similarly, the injury reduction effect
attributable to the airbag, given the average effect of ADR 69 vehicle status, EBS,
vehicle market class and driver weight, was seen to be an 82% reduction in risk,
while the combined effect was seen to result in a 96% reduction in AIS 2+ head
injury risk. These reductions can also be seen in the shift downwards of the
probability of injury at any given impact speed, such that the EBS at which a driver
of a pre-ADR 69 vehicle was seen to have a 50% chance of sustaining an AIS 2+
head injury is 52 km/h compared to 76.5 km/h for drivers of post-ADR 69 vehicles.
The reduction in injury risk was similar for the airbag comparison pointing to
strong airbag benefits. These reductions in injury risk translate in broad terms to a
reduction in head injury cost to the community, measured using the HARM metric,
of approximately AUD$18,970 on average. These results indicate that ADR 69 was
of significant benefit in reducing head injury risk for Australian passenger car
drivers.
In conducting the analysis, drivers of large and medium vehicles were seen to have
a marginally lower injury risk than drivers of small vehicles; further
countermeasure work focussing on reducing the risk of injury to drivers of small
vehicles, particularly with the polarisation of the Australian market to either small
or large vehicles might be warranted. It also proved to be the case that EBS was
significantly related to injury risk, such that a 1 km/h increase translated to a 6%
increase in the risk of sustaining an AIS 2+ head injury. As noted in Section 3.3.1,
the risk increased substantially for speeds above 48 km/h. Given this finding,
consideration could be given to lifting the test speed with the goal of driving down
the high end speed injury risk; this recommendation is common to other body
regions but particularly the chest and lower extremity where the risk of injury
remains high beyond 48 km/h. In doing so, consideration of potential disbenefits of
higher test speeds with respect to vehicle aggressivity must be made. The reader is
referred to the Introduction (pp. 7-10) for a brief discussion of the potential
implications of increases in crash test impact speeds on front end stiffness in the
context of lower extremity injuries and frontal offset standards.
Recommendation 1: Explore the feasibility and likely benefits of increasing the
ADR 69 test speed with the goal of further reducing the probability of injury at
higher impact speeds. In doing so, consideration of potential disbenefits of higher
test speeds with respect to vehicle aggressivity must be made.
4.1.2 Discussion of Injuries to the Face
The injury reduction benefits associated with the face were equally impressive as
those observed for the head. The implementation of ADR 69 was associated with an
88% reduction in the risk of AIS 2+ injuries of the face, while airbag deployment
resulted in a 91% reduction in risk, and the combined effect was a 99% reduction in
risk. Common injuries of this region are fractures of the mandible and LeForte Type
I, II, III fractures. Importantly, the probability of AIS 2+ face injuries is lower
among drivers of post-ADR 69 vehicles compared to drivers of pre-ADR 69
vehicles, such that at the ADR 69 test speed of 48 km/h the risk of injury was 1.6%
compared to 12%. These reductions in injury risk translate in broad terms to a

– 86 –
reduction in head injury cost to the community, measured using the HARM metric,
of approximately AUD$6,730 on average. As with the head, these results indicate
that ADR 69 was beneficial in reducing face injury risk, and the airbag appears to
have played a major role in this result. Impact severity was again related to injury
risk such that a 1 km/h increase in EBS resulted in an 8% increase in injury risk.
In conducting the analysis, drivers of large and medium vehicles were seen to have
a marginally lower injury risk than drivers of small vehicles, while impacts with
trees/poles resulted in a risk seven times higher of sustaining a face injury than if
the collision partner was a similar passenger car. The result pertaining to the
increased risk associated with pole/tree impacts is of concern given the high
exposure to poles and trees on the roadside.
4.1.3 Discussion of Injuries to the Neck
Injuries to the neck region include penetrating injuries, lacerations and contusions,
injuries of the pharynx and larynx and blood vessel disruption; ‘whiplash’ type
injures are coded to the AIS spine region. As presented in Table 60 there was no
statistical difference in AIS 2+ injury risk associated with either ADR 69 vehicle
status, or airbag status alone, however the combined effect was seen to produce a
trend toward an 80% reduction in AIS 2+ neck injury risk, although the confidence
intervals are very wide (CI: 0.03-1.40, p 0.05). Notably, the estimated probability
of AIS 2+ injuries was 3% for drivers of post-ADR 69 vehicles compared to 9% for
drivers of pre-ADR 69 vehicles at an EBS of 48 km/h, indicating potentially some
benefit.
Given the small numbers of drivers sustaining AIS 2+ neck injuries in the sample
(9 in total), emphasis was placed on AIS 1+ injuries, where the airbag and post-
ADR 69 plus airbag combination demonstrated statistically significant 53% and
65% reductions in injury risk respectively; the ADR 69 comparison indicated no
difference in injury risk. These reductions in injury risk translate in broad terms to a
reduction in head injury cost to the community, measured using the HARM metric,
of approximately AUD$2,660 on average. These results indicate that ADR 69 was
beneficial in reducing neck injury risk, particularly lower severity injuries.
In contrast to every other AIS body region presented, the risk of AIS 1+ neck
injuries decreased with increasing EBS, such that injury risk fell by 3% for every 1
km/h increase in EBS. A possible reason for this result is related to injury
biomechanics associated with the neck region. Evidence has consistently shown
that ‘whiplash’ type injuries occur at lower impact speeds, as forces are applied to
the neck tissues in the forward motion and rebound (flexion-extension) common to
frontal impact crashes (McElhaney, Nightingale, Winkelstein et al., 2002). While
ligamentous disruption (whiplash) is coded to the AIS Spine region, it might also be
the case that contusions and lacerations are associated with lower speeds for similar
biomechanical reasons; the interaction with the seatbelt and seat, particularly the
head rest, at lower speeds might also be a factor.
Finally, injury risk was modified by age but not gender. Interestingly, injury risk
increased rapidly from 17 years-mid-30’s, and then decreased somewhat in a linear
manner. This might be the result of different musculature of those in the mid-30’s,
or may reflect the parameters not included in the statistical model such as driver
height, vehicle market class (hence size) and object struck, though none of which
were seen to hold any predictive value in the calculation of injury risk.
– 87 –
4.1.4 Discussion of Injuries to the Chest
AIS 2+ chest injuries include disruption to the vessels of the chest (aorta,
pulmonary vein etc…), fractures of two or more ribs, hemothorax, and
pneumothorax, with the most common injury source generally being seat-belt
loading. The results indicate that the ADR 69 regulation produced no observable
injury reduction benefit for the chest (controlling for the average airbag / non-airbag
injury effect), and this was reflected in the difference in the cost of injury between
the two ADR 69 groups. The probability of AIS 2+ injuries for drivers of post-ADR
69 vehicles at an impact speed of 48 km/h (EBS) remains high at 67%, while
increasing to a reported maximum of 86% at 90 km/h. Important factors in the
calculation of injury risk based on ADR 69 status were the presence or otherwise of
a frontal airbag, impact speed (EBS, km/h), driver age and height and vehicle
market class; gender was not related to chest injury outcome in this sample.
In contrast to the ADR 69 group comparison, the injury reduction benefit associated
with the frontal airbag was 79% (see Table 60). The observed probability of injury
for airbag exposed drivers was 26% at 48 km/h, while for those without an airbag
the probability was 62%. The role of the airbag was such that drivers of post-ADR
69 vehicles with an airbag deployment were 74% less likely to sustain an AIS 2+
chest injury than drivers in a pre-ADR 69 car without an airbag deployment.
As ADR 69 provided the impetus for manufacturers to install frontal airbag systems
(including optimised seat-belt systems), ADR 69 as a performance-based regulation
can be considered to be beneficial in driving reductions in chest injury risk. It must
be noted though that airbags are not mandatory in Australia and some vehicles in
the Australian market, particularly those in the small vehicle market group,
continue to only offer frontal airbags as optional equipment for the passenger side.
While this report does not examine the injury reduction effect of airbags on the
front left passenger, similar protection experienced by the driver could be expected.
Given the strong evidence for airbag effectiveness and the high risk of injury in
their absence, particularly with respect to the chest, this report recommends that an
assessment be made of the necessity and likely benefits of mandating dual frontal
airbags as standard equipment in all passenger cars. The role of ADR 73 in making
this recommendation is discussed below.
Recommendation 2: That an assessment be made of the necessity and likely
benefits of mandating dual frontal airbags as standard equipment in all passenger
vehicles.
Driver height also proved to be a significant predictor of chest injuries, such that
short-statured drivers were found to be at greater risk of sustaining such injuries.
Inclusion of the 5th percentile female Hybrid III dummy to the ADR 69 test regime
may be beneficial in reducing chest injury risk to short vehicle occupants. Given
these findings, this report recommends that consideration be given to modifications
in the ADR 69 test protocol that would capture the differential injury risk for short
statured drivers.
Recommendation 3: Explore the feasibility and likely benefits of inclusion of the
5th percentile female into the ADR 69 test regime as a means of addressing the
increased risk of chest injury for short-statured drivers.
The analysis of chest injuries also demonstrated that the risk of AIS 2+ chest
injuries was higher for older drivers than for younger drivers, and the risk curve
was not linear; the risk to a driver aged 60 years was seen to be 77% (CI: 56-91%)
– 88 –
compared to 9% (3-10%) for a driver aged 20 years, adjusting for all other factors
noted above including the airbag effect. This finding of increased risk of chest
injuries with aging is consistent with previous research (Foret-Bruno, Trossielle, Le
Coz et al., 1998; Zhou, Rouhana, & Melvin, 1996). Chest injuries carry a high
degree of morbidity and mortality for older adults in particular, such that older
patients with rib fractures have twice the mortality and morbidity of younger
patients with similar injuries, and for every additional rib fracture mortality
increases by 19% and the risk of pneumonia increases by 27% (Bulger, Arneson,
Mock, Jurkovich, 2000).
A variety of indices of chest injury risk have been developed, and it may prove that
revising the ADR 69 (sternal) deflection threshold to less than the present 76.2 mm
might have value in reducing the risk of chest injury; indeed Mertz, Horsch, & Horn
(1991) demonstrated that a Hybrid III sternal deflection of 76 mm correlated to an
approximately 95% risk of AIS 3+ chest injury while the lower value of 50 mm
correlated to a 50% risk; similarly Stalnaker and Mohan (1974, cited in Cavanaugh,
2002) presented evidence of no rib fractures using a chest deflection measure of 58
mm. Importantly though, similar or higher reductions might also be obtained by
using alternative injury tolerance measures, such as the sternal rate of compression
measure (Mertz, 2002), the viscous criterion (Vianno and Lau, 1985, cited in cited
in Cavanaugh, 2002), and the Combined Thoracic Index proposed by NHTSA for
use in FMVSS 208 (Kleinberger et al., 1998), which in its proposed form translates
to an injury risk of 50% of AIS 3+ injuries (in cadavers). Alternatively, age
modifiers could also be used in the assessment of chest injury risk as a means of
assessing crashworthiness across a range of age categories.
4.1.5 Discussion of Injuries to the Abdomen-Pelvic contents
ADR 69/00 did not specify injury risk performance criteria for the abdomen and
pelvis, however some benefit could be expected in reducing abdominal and pelvic
injuries from the introduction of the thorax injury criteria noted above, and the 10
kN axial load limit on the femur. Injuries to this region include contusions,
penetrating injuries, and injuries to the internal organs such as kidney, pancreas,
liver and spleen.
Emphasis in the analysis was placed on AIS 1+ injuries due to the small number of
AIS 2+ injuries in the sample (approx. 5%). The injury risk comparison of pre-ADR
69 drivers vs. post-ADR 69 drivers indicated no difference in risk for AIS 1+ or
AIS 2+ injuries. This finding was also reflected in the statistically non-significant
AUD$680, on average, increase in HARM.
The analysis of all injuries to the region revealed that males were 58% less likely
than females to sustain injuries to this region. These results suggest that the seat-
belt system may be optimised for males at the expense of females given that only
the 50th percentile Hybrid III male is used in the test protocol. Similarly, being of
light weight was associated with significantly increased risk of AIS 2+ injuries.
This data also supports Recommendation 3 noted above in the context of chest
injuries.
It is noteworthy that the observed probability of AIS 1+ injuries at 48 km/h was
high, being 57% and 54% for drivers of pre-ADR 69 and post-ADR 69 vehicles, but
that the observed probability for AIS 2+ injuries was low at 3% and 8%
respectively, and even lower for drivers exposed to an airbag (1%). Analysis of this

– 89 –
body region highlighted the limitations of the sample and the need for nationally
representative data, a point discussed below.
As with the chest, it could be considered that ADR 69 as a regulation has been
beneficial in reducing injuries to the abdomen-pelvis as ADR 69 provided the
impetus for manufacturers to install optimised frontal airbag systems including
optimised seat-belt systems. It is likely that the airbag has its injury reduction effect
in preventing impact by preventing loading of the abdomen from the steering
wheel, while the reduction in rib fractures might also affect secondary organ
damage (see Rouhana, 2002 for an excellent discussion of biomechanics of
abdominal trauma).
4.1.6 Discussion of Injuries to the Spine
ADR 69 did not specify performance criteria for the spine except for instances
where no head contact was made. In cases of no head contact, ADR 69 sought to
restrict the forces the Hybrid III dummy would experience, such that neck injury
measurements not exceed 3300 N of tension force in the inferior-superior direction.
Benefits might also be anticipated to this body due to ADR 69’s thorax and femur
load specifications which may act to limit forces applied to the thoraco-lumbar
region of the vertebral column.
Injuries included with the AIS Spine body region are strains (‘whiplash’) and
interspinous ligament disruptions thru to major burst fractures of vertebral bodies
thru to complete spinal cord syndrome (quadriplegia, paraplegia). Anterior wedge
fractures are an example of a vertebral column fracture resulting from dynamic
flexion and compression as the driver moves forward where the anterior (or front)
portion of the vertebral body fractures, and are most common at C5-C7 where the
neck joins with the largely immobile thoracic cage (King, 2002).
Of note was the finding of the large statistically significant increase in the risk of
AIS 2+ ‘spine’ injuries for drivers of post-ADR 69 vehicles relative to drivers of
pre-ADR 69 vehicles. Table 60 indicates this increase to be of the magnitude of
895% (OR: 9.95, 2.3 43.1). This result is also replicated when considering all
injuries of the spine (AIS 1+), with odds ratio being 6.62 (CI: 2.06-21.2, p 0.001).
This increase is also seen in the statistically significant increase in HARM, that
being AUD$1290 on average per driver. EBS was however not statistically related
to the risk of spine injuries (p 0.05), however EBS was important in adjusting for
differences in crash severity between the two groups. The probability of AIS 2+
spine injuries at 48 km/h for drivers of post-ADR 69 vehicles was 21% (CI: 9-42%)
in contrast to 3% (1-8%) for drivers of pre-ADR 69 vehicles.
In contrast, exposure to the frontal airbag resulted in statistically significant 82%
reduction in AIS 2+ neck injury risk, rendering the actual probability of spine AIS
2+ injury at an EBS of 48 km/h to be less than 1%. It appears though that the airbag
was not sufficiently able to compensate for the increased risk associated with post-
ADR 69 status as the combined ADR 69 plus airbag effect did not result in lower
risk of injury for either AIS 1+ or AIS 2+ injuries; this latter finding possibly due to
increased frontal stiffness or difficulties in optimising restraint systems and seat
design for the full height-weight range of drivers.
The results of the AIS Spine body region raise a number of substantive issues. As
with the AIS Chest and AIS Abdomen-Pelvic contents body regions, the airbag is
associated with statistically significant reductions in injury risk. The reduction in

– 90 –
abdomen-pelvis injuries associated with airbag deployments must be noted, as
clinically fractures of the lumbar spine are often associated with abdominal organ
damage, and is associated with ‘submarining’ or misplacement of the seat belt
(Rouhana, 2002). It appears that the airbag and restraint system is of benefit to both
the AIS regions of the Spine and Abdomen-pelvic contents, although the clinically
important seat belt sign (i.e., significant bruising across the shoulder, diagonally
across the thorax and across the abdomen) appears, anecdotally at least, to be
common among those seriously injured.
Of concern though is the large increase in risk associated with post-ADR 69
vehicles in the absence of an airbag. It may prove that the use of an alternative neck
injury criterion, such as Nij as proposed by Kleinberger et al. (1998), might provide
a means to reduce injuries to the cervical spine, and possibly drive reductions in
injury risk to this region.
On two final points, future analysis would be better served to combine vertebral
column and spine injuries to their matched AIS body region rather than the AIS
body region categories per se. Ideally, injuries of the cervical spine would be
analysed with all neck injuries, injuries to the thoracic spine fall within the AIS
chest region, and the lumbar spine within the AIS region of the Abdomen-Pelvis.
This division might result in improved injury risk estimates by capturing the total
risk to each specific region, whilst highlighting benefits of vehicle countermeasures
and areas requiring further improvements. The analysis conducted in this Report
followed the convention of the AIS coding manual (AAAM, 1998).
Finally, improvements in the quality of diagnostic imaging in the hospital setting
have led to the development of detailed cervical spine clearance protocols designed
to determine the presence of cervical spine injuries in the conscious and
unconscious patient (Ackland, 2005). The improved resolution of magnetic
resonance imaging (MRI) and multi-slice fine-cut CT imaging means that soft
tissue injuries of the neck ligaments and subtle fractures that may have been
difficult to visualise in the past, and consequently under-diagnosed, are now plainly
visible. Such advances offer new opportunities to identify mechanisms of injury and
assess relevant countermeasures, but might also mean a reported increase in injuries
to the vertebral column, particularly of the cervical spine, in future epidemiological
studies.
4.1.7 Discussion of Injuries to the Upper Extremity
Injuries of the upper extremity are by definition not particularly life-threatening if
appropriately treated, as the highest possible AIS code is 3 (‘Serious’) (AAAM,
1998). These injures can, however, prove to be extremely debilitating (Nash,
Mickan, Del Mar et al., 2004). AIS 1 injuries include lacerations and contusions,
joint sprains (i.e., wrist, elbow, shoulder), and dislocations of bones of the hand.
AIS 2 injuries include deep penetrating wounds and simple closed fractures of the
clavicle and bones of the arm (humerus, radius, & ulna), while AIS 3 injuries can be
either open or displaced fractures, and may or may not involve significant blood
loss. There is currently no injury criteria associated with upper extremity injuries.
Upper extremity injuries were sustained by 57% of drivers of pre-ADR 69 vehicles
compared to 70.5% of drivers of post-ADR 69 vehicles, and there was no difference
in the cost of injury between the two groups. Once AIS 2+ injuries are considered,
these percentages decrease to 14.7% and 13.9% of drivers of pre-ADR 69 and post-

– 91 –
ADR 69 vehicles. The results indicate no difference in risk of AIS 2+ injuries for
any of the three comparisons, with the probability of AIS 2+ injuries at an EBS of
48 km/h was 29% and 26% respectively. For AIS 2+ injuries drivers of large
vehicles were nearly 60% less likely to sustain such injuries compared to drivers of
small vehicles, while drivers colliding with poles and trees were more than twice as
likely as those colliding with other passenger cars to sustain these injuries. For both
AIS 1+ and AIS 2+ injuries, EBS and driver height were related to the risk of
injury, such that increases in both resulted in increased risk of upper extremity
injuries.
AIS 1+ injuries were considered in detail due to the reported interactions between
the upper extremity and airbags (Huelke et al., 1995). The analysis indicated that,
once the impact of airbag deployment, EBS, driver height, object struck and vehicle
market class were controlled for, there was a strong trend toward (p=0.07) a 77%
increased risk of upper extremity injuries for drivers of post-ADR 69 vehicles,
while the airbag comparison indicated no difference in risk (OR: 1.20, 0.64-2.26,
p 0.05). However, drivers of post-ADR 69 vehicles with an airbag deployment
were twice as likely to sustain an injury of the upper extremity relative to drivers of
pre-ADR 69 vehicles without an airbag. The probability of injury at an EBS of 48
km/h was high at 77% and 66% for drivers of post-ADR 69 and pre-ADR 69
vehicles respectively.
Upper extremity injuries remain a challenge for manufacturers and improved
interior padding and trim and modified glazing may be some of the few available
countermeasures to address these injuries.
4.1.8 Discussion of Injuries of the Lower Extremity
ADR 69 specified a performance requirement of the maximum allowable femur
axial force not exceeding 10 kN. This criteria emphasised protection for the femur,
bony pelvis and the knee. As noted in the Introduction, there was no performance
specification for the lower leg, namely the tibia, fibula, ankle and the foot in
ADR 69. It is also important to bear in mind the difficulties of measuring lower
extremity injury risk using the Hybrid III, and the stated need for a comprehensive
set of lower limb injury criteria given the high frequency of lower leg injuries in
Australian passenger vehicles at the time of the early Standards Development
Program, as discussed in the Introduction (Fildes et al., 1994; Seyer, 1993). This
report paid particular attention to AIS 2+ injuries as they are both common and
often extremely debilitating (ATSB, 2004b; NHTSA, 2004; Read, Kufera,
Dischenger et al., 2004).
The results indicated that approximately 20% of drivers of pre-ADR 69 vehicles
sustained AIS 2+ injuries, compared to 17% of drivers of post-ADR 69 vehicles.
The analysis indicated that there was no difference in injury risk between the
groups after controlling for differences and the effect of impact speed, collision
partner and vehicle market class. Injury risk increased with increasing impact speed
by a factor of 6% for every 1 km/h increase in impact speed, while drivers of larger
vehicles were 59% less likely to sustain an AIS 2+ injury compared to drivers of
small vehicles. The probability estimates also suggest the risk of injury remains
high, with the risk at 60 km/h estimated to be 64% and 54% for drivers of post-
ADR 69 and pre-ADR 69 vehicles respectively. The HARM estimates demonstrate
a borderline statistically significant (p=0.06) AUD$10,840 average increase per
driver in the cost of injury to the lower extremity (AIS 1+) injuries; this reinforces

– 92 –
the statistically significant increase in risk of AIS 1+ injuries for drivers of post-
ADR 69 vehicles relative to drivers of pre-ADR 69 passenger cars.
These results are cause for some concern, particularly the increase in average total
cost of injury associated with drivers of post-ADR 69 vehicles. Arguably shifting
the test speed upward and revising the axial femur load downward from 10 kN to a
lower value could potentially result in significant injury reductions. Similarly,
adoption of alternative lower leg injury criteria, such as the current ADR 73 criteria,
might also be expected to have a beneficial impact on reducing these debilitating
injuries, a point noted by Seyer (1992, 1993) and Fildes et al. (1994) in the
Standards Development Research Program. Prior to consideration of any revisions
of the current ADR 69 lower extremity criteria, it is essential to examine the
influence of ADR 73 on lower extremity injury risk.
Recommendation 4: Examine the risk of lower extremity injuries among occupants
of ADR 73 compliant passenger cars involved in frontal crashes. In the event of
continuing high risk of injury, as reported in this study, improved injury criteria and
new dummy instrumentation might be an appropriate method of addressing the high
risk of lower extremity injury as highlighted in this study.
Finally, the analysis conducted in this report considered the risk to lower extremity
as a whole. While it is arguable that the upper leg and lower leg should have been
considered separately, the intent of the femur axial load criteria is to provide some
protection for the whole lower extremity. Any future analysis of ADR 73 must
examine the risk to the lower extremity as a single unit, but also must assess the
upper and lower leg separately due to the inclusion of the Tibia Index and the Tibia
Compression Force Criteria. Similarly, future HARM analysis must also consider
the upper and lower leg individually as the mean cost of injury for specified AIS
levels are likely to differ.
4.1.9 Cost savings associated with ADR 69
Using HARM as the cost of injury metric, this report evaluates the mean difference
in injury cost between drivers of pre- and post-ADR 69 vehicles, adjusting for
differences in EBS and vehicle market class between the two groups. The analysis
indicated significant injury savings to the head (AUD$18,970), the face
(AUD$6,730), the neck (AUD$2,660), while an increase in the cost of injury of the
spine (AUD$1,290) was observed. Of concern was the strong trend of an average
AUD$10,840 increase in injury cost for the lower extremity for drivers of post-
ADR 69 vehicles. Also of concern was finding of no cost of injury reduction for the
chest, although a cost reduction benefit would be observed if the comparison was
based on exposure to the airbag.
The cost savings for individual body regions are not additive, and so the cost of
head, face, neck and chest injuries for post-ADR 69 drivers (mean: AUD$58,280)
was compared to pre-ADR 69 drivers (Mean: AUD$27,790), with the regression
analysis indicating an average per driver cost saving of AUD$27,600 (p 0.01). The
whole-of-body injury cost analysis suggests an AUD$13,240 benefit for drivers of
post-ADR 69 vehicles, however this is not statistically significant and is
substantially lower than the cost savings associated with the head, face, neck and
chest, principally due to the high cost associated with lower extremity injuries.
These cost injury estimates demonstrate significant cost savings in regions most
expected, while pointing to the need for further improvements in controlling lower

– 93 –
extremity injury risk. Estimates such as these would also be useful in the conduct of
future cost-benefit analysis of ADR 69. Given the age of the HARM values
(1996 dollars), the cost savings reported here are conservative.
4.2 Relationship of ADR 69 to the current FMVSS 208 standard
At the time of introduction, ADR 69 was based on US FMVSS 208 with respect to
the mandated injury performance criteria, with the difference being that the
Australian procedures required that the Hybrid III dummies be restrained; the US
on the other hand had extremely low levels of seatbelt use and a role of the airbag
in the US market was to prevent occupant ejection. Recent amendments to the US
FMVSS 208 Standard have meant that the injury tolerance criteria of ADR 69 are
no longer directly comparable. It is critical to note that while the performance
specifications of ADR 69 have been updated (see below), Australia also introduced
ADR 73 to apply to all new passenger cars (Class MA) from 1 January 2000.
Further discussion of ADR 73 is provided in Section 4.3.
The following discussion of FMVSS 208 is provided to highlight the complexities
of vehicle safety regulation, and the fact that ADR 69 was originally based on the
US Standard.
Since the US FMVSS 208 standard was introduced in January 1968, the standard
has evolved to reflect improved vehicle safety knowledge and on-going problems
with out-of-position occupants due to the continuing high proportion of unbelted
occupants; notably, in 2005 55% of fatalities in the US were unbelted (NHTSA,
2006). Airbags were mandated for vehicles of model year 1997 and the Advanced
Airbag Rule mandates new airbag technologies, made possible by the ‘Buckle-Up
America’ campaign and the shift from non-seat belt wearing from a secondary
offence in many states to be a primary penalty offence. A further instance of this
evolution was the relatively recent change from HIC361000 to HIC15700 as the head
injury performance criterion, a change made possible largely due to the
development of the neck injury standard, Nij.
It is important to note that the Australian ADR system also changed to reflect new
knowledge, and this was seen in the issuing of a number of Determinations.
Arguably the most important Determination was the addition of a revised head
injury criterion for instances of no head contact, where either the forces to the neck
were not to exceed 3.3 kN of tension force in the inferior-superior direction or a
HIC15 value of 700 was not to be exceeded (DoTARS, 2004).
In 2000, NHTSA shifted to a more rigorous FMVSS 208 test battery which
involves the testing of vehicles with 50th percentile male Hybrid III dummies, 5th
percentile female dummies as well as a number of test requirements for the 1-year
old dummy in the child safety seat, the 3 year old and the 6-year old; there has also
been some discussion of the need for inclusion of the 95th percentile male in the
test protocols. The phase-in requirements commenced 1 September 2003 and will
continue until light vehicles manufactured on or after September 1 2010 enter
production. The requirements concerning the adults are shown in Table 63 with
ADR 69 included for comparison.
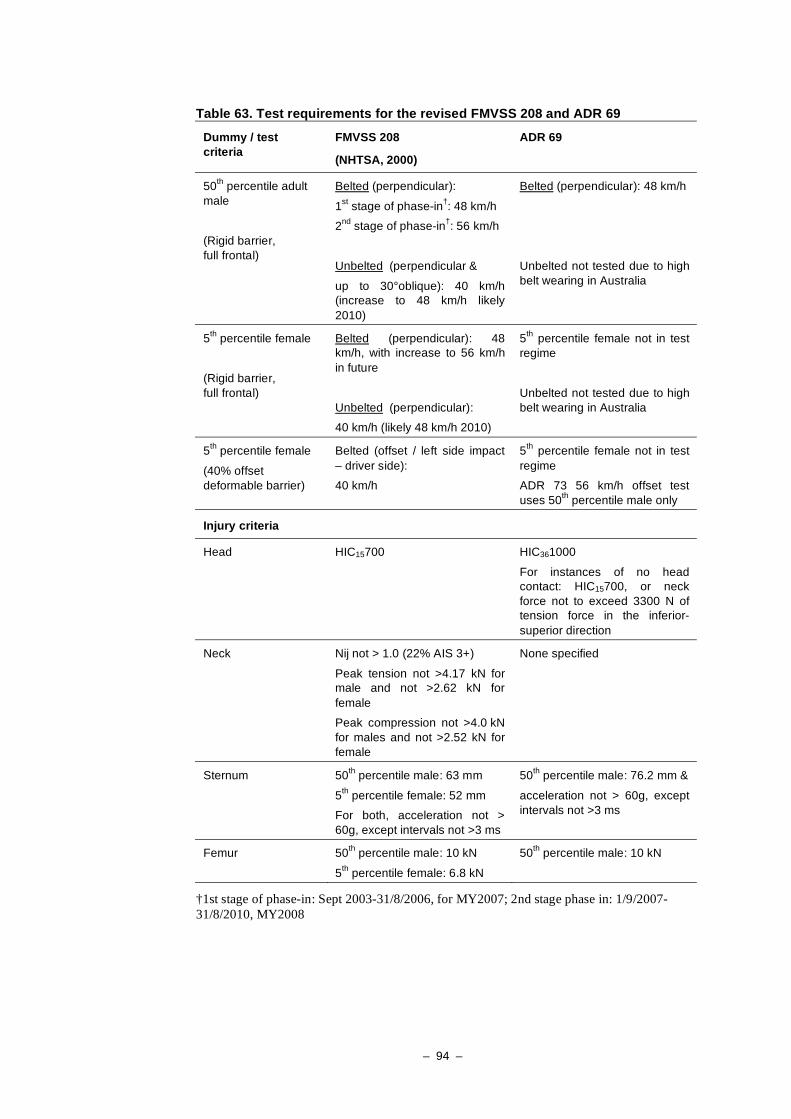
– 94 –
Table 63. Test requirements for the revised FMVSS 208 and ADR 69
Dummy / test
criteria
FMVSS 208
(NHTSA, 2000)
ADR 69
50th
percentile adult
male
(Rigid barrier,
full frontal)
Belted (perpendicular):
1st stage of phase-in
†: 48 km/h
2nd
stage of phase-in†: 56 km/h
Unbelted (perpendicular &
up to 30°oblique): 40 km/h
(increase to 48 km/h likely
2010)
Belted (perpendicular): 48 km/h
Unbelted not tested due to high
belt wearing in Australia
5th
percentile female
(Rigid barrier,
full frontal)
Belted (perpendicular): 48
km/h, with increase to 56 km/h
in future
Unbelted (perpendicular):
40 km/h (likely 48 km/h 2010)
5th
percentile female not in test
regime
Unbelted not tested due to high
belt wearing in Australia
5th
percentile female
(40% offset
deformable barrier)
Belted (offset / left side impact
– driver side):
40 km/h
5th
percentile female not in test
regime
ADR 73 56 km/h offset test
uses 50th
percentile male only
Injury criteria
Head HIC15700 HIC361000
For instances of no head
contact: HIC15700, or neck
force not to exceed 3300 N of
tension force in the inferior-
superior direction
Neck Nij not > 1.0 (22% AIS 3+)
Peak tension not >4.17 kN for
male and not >2.62 kN for
female
Peak compression not >4.0 kN
for males and not >2.52 kN for
female
None specified
Sternum 50th
percentile male: 63 mm
5th
percentile female: 52 mm
For both, acceleration not >
60g, except intervals not >3 ms
50th
percentile male: 76.2 mm &
acceleration not > 60g, except
intervals not >3 ms
Femur 50th
percentile male: 10 kN
5th
percentile female: 6.8 kN
50th
percentile male: 10 kN
†1st stage of phase-in: Sept 2003-31/8/2006, for MY2007; 2nd stage phase in: 1/9/2007-
31/8/2010, MY2008

– 95 –
The revisions to FMVSS 208 aim to capture more fully the range of sizes of vehicle
occupants as well as ensuring optimisation of airbag-restraint system performance
for belted occupants. The inclusion of the 5th percentile female was to improve
protection to belted persons sitting in the full forward seat position, including
female drivers and those of short-stature. In addition, injury criteria were also made
more stringent than the previous incarnation of FMVSS 208. Notably though, the
revised Standard did not adopt any lower leg criteria.
With respect to the addition of the offset test, it was noted that offset tests can result
in designs with either low thresholds for airbag deployment or late deployments in
the field, and consequently NHTSA (2000: 30708-30709) state that the main
purpose of the offset test was to:
…help ensure manufacturers upgrade their crash sensing and software
systems, as necessary, to better address soft crash pulses. Improved sensing
technology will be particularly important if manufacturers design vehicles
with softer front ends to meet the 56 km/h (35 mph) belted rigid barrier test.
It must be noted that the revisions to the US FMVSS 208 Standard have been
undertaken due to continuing concern in the US for risks associated with US-style
airbags, particularly to small women and young children, and also with the intent of
providing ‘improved frontal crash protection for all occupants’ (NHTSA, 2000:
30680). Given the phase-in requirements of the ‘updated’ FMVSS 208 Standard, it
will be some time before any analysis can be made concerning the efficacy of these
changes to the Standard. It must also be noted that FMVSS 208 is a Standard
enforced only by the US Department of Transportation, and does not represent a
global standard.
4.3 Importance of ADR 73, the 56 km/h offset frontal test for Australian passenger cars
As a treaty signatory to the United Nations Economic Commission for Europe
(UNECE) 1958 Agreement, ‘Agreement Concerning The Adoption Of Uniform
Technical Prescriptions For Wheeled Vehicles, Equipment And Parts Which Can
Be Fitted And/Or Be Used On Wheeled Vehicles And The Conditions For
Reciprocal Recognition Of Approvals Granted On The Basis Of These
Prescriptions’, Australian Government policy is to harmonise, wherever possible,
with UN ECE Vehicle regulations.
ADR 73, the Offset Frontal Impact Occupant Protection Standard, represents a
completely harmonised standard under the Uniform Provisions Concerning the
Approval of Vehicles with Regard to the Protection of the Occupants in the Event
of a Frontal Collision. Under the Provisions of the Agreement, the standard is
known as UN ECE Regulation No. 94/01.
ADR 73 applies only to Class MA vehicles (passenger cars), with the phase-in
requirements being:
• From 1 January 2000 on all new model MA category vehicles; and with a Gross
Vehicle Mass of less than 2.5 tonnes
• From 1 January 2004 on all MA category vehicles with a Gross Vehicle Mass of
less than 2.5 tonnes

– 96 –
As noted in the Introduction, Amendments to ADR 69 by Determination No. 2 of
1998 (DoTARS, 2004: ii) rules that ‘vehicles complying with the new ADR 73
Offset Frontal Impact Protection, can be deemed to comply to this rule (i.e., ADR
69) provided they are fitted with dual airbags and the manufacturer can demonstrate
by other means that the vehicles would comply with ADR 69’. As per Clause 12 of
ADR 69, compliance with ADR 73/00 is to be demonstrated at the Conformity of
Production Assessment.
ADR 73 assesses vehicle performance in a 56 km/h offset test against a deformable
barrier, and has a number of differences in injury criteria in comparison to ADR 69.
In particular, ADR 73 includes lower leg criteria (TI, TCFC), different neck and
femur criteria, and a chest compression criterion of 50 mm plus inclusion of the
viscous criterion as an index of chest injury risk.
Seyer (1993) noted the importance of global harmonisation but also noted that
Standards should be consistent with themselves; for instance Seyer (1993)
promoted the notion that lower leg injury criteria then under consideration by the
EEVC for the frontal offset standard be incorporated into the Full Frontal Standard,
ADR 69 if proved beneficial; whether the Hybrid III dummy and the Tibia Index
and Tibia Compression Force Criteria are useful in predicting lower leg injury is
still keenly debate as noted in the Introduction of this report. While the EEVC
frontal offset standard was adopted for Australia to apply from 2000 as ADR 73,
the injury performance criteria of ADR 69 were not revised to reflect the more
stringent injury risk tolerance values across the body regions. For this reason, it
remains important to evaluate ADR 73 prior to the assessment of Recommendations
made in this report concerning ADR 69.
Principal Recommendation: That an evaluation of ADR 73 be undertaken using the
same methods used in this report so as to assess both the need, and if necessary the
order of priority, of Recommendations 1 - 4. This principal recommendation is
made on the basis of ADR 73 representing an updated frontal crash occupant
protection standard, recognition of the significant regulatory hurdles in adopting
any changes to the provisions of ADRs, and the preference of the Australian
Government to harmonise vehicle safety regulations in accordance with the
provisions of the United Nations Economic Commission for Europe (UNECE) 1958
Agreement concerning the adoption of Uniform Technical Prescriptions for
vehicles.
Following this Principal Recommendation, three points are noteworthy, and serve
to highlight the complexity of vehicle safety standards:
1. Both NCAP and the US National Standard include a frontal offset test. NCAP
(2004) uses a test speed of 64 km/h. Interestingly NHTSA (2004, 2005) use the
offset test for the 5th percentile belted female at 40 km/h, and view the addition
of an offset test as a supplement to the FMVSS 208 full frontal test. This was
introduced as a protection against incompatibility problems stemming from
design changes to accommodate the 56 km/h rigid barrier test. NHTSA (2005)
have also flagged the addition of a high speed offset test due to its demanding
nature on vehicle structure as seen by increased intrusion and a method to
control lower leg injury risk.
2. The US Insurance Institute for Highway Safety state that full frontal tests
remain an essential element of vehicle safety regimes, suggesting that the full
frontal test and the offset test complement each other (IIHS, 1995, cited in
NHTSA, 1997). The full frontal test is regarded to be a more demanding test of

– 97 –
restraint systems while the offset test represents a better test of intrusion (IIHS,
1995, cited in NHTSA, 1997). Consequently, future analysis of in-depth data
would be best served by comparing the injury risk for three groups: occupants
of pre-ADR 69 passenger cars, occupants of ADR 69 passenger cars, and
occupants of ADR 73 compliant passenger cars.
3. The potential safety benefit of ADR 73 will not be seen in the Australian fleet
for a considerable period as it applied to all new vehicle models from 2000 and
all new vehicles from 2004. Furthermore, it will prove interesting if lower
extremity injury risk reductions are seen in ADR 69 / ADR 73 compliant
vehicles in the future given the instrumentation of lower leg and associated
injury criteria in ADR 73.
4.4 Harmonisation and vehicle safety regulations
An important issue in vehicle safety is the harmonisation of safety vehicle
standards. This is particularly pertinent in the era of Free Trade Agreements being
signed between many nations, as well as Australia being a signatory to the
provisions of the World Trade Organisation on ‘Technical Barriers to Trade’
(TBT), and a signatory to the United Nations Economic Commission for Europe
(UNECE) 1958 Agreement, ‘Agreement Concerning The Adoption Of Uniform
Technical Prescriptions For Wheeled Vehicles, Equipment And Parts Which Can
Be Fitted And/Or Be Used On Wheeled Vehicles And The Conditions For
Reciprocal Recognition Of Approvals Granted On The Basis Of These
Prescriptions’.
It is recognised that Government regulators would realise an additional cost burden
associated with changes to ADR 69, as would manufacturers. It is therefore
imperative that any regulatory change and Regulatory Impact Statements be
informed by results of evaluation studies using in-depth crash investigation data. In
doing so, these additional regulatory costs must also be balanced against the total
cost of injury resulting from frontal crashes, both to the individual and the
community.
A final consideration is whether any new design rule, or modification of an existing
rule, would breach Australia’s obligations under the World Trade Organisation
Agreement (WTO) on ‘Technical Barriers to Trade’ (TBT). The principal goal of
the TBT Agreement is to ensure a sovereign nation does not engage in protectionist
behaviour through setting technical standards that present as obstacles to
international trade (WTO, 1994). Implicit within this Agreement is the preference
to harmonise standards insofar as possible, however it is noteworthy that Article 2
of the TBT Agreement gives provision for any sovereign nation to mandate
regulations necessary to promote the health of citizens, and at the same time not
breaching the Agreement by stating:
…technical regulations shall not be more trade-restrictive than necessary to
fulfil a legitimate objective, taking account of the risks non-fulfilment would
create. Such legitimate objectives are, inter alia: national security …
protection of human health or safety, …the environment. In assessing such
risks, relevant elements of consideration are, inter alia: available scientific and
technical information, related processing technology or intended end-uses of
products.

– 98 –
While this Report makes a number of recommendations based on the sample of
drivers available at the time for analysis, the Principal Recommendation that an
assessment of ADR 73 be made prior to consideration of Recommendations 1 – 4 is
critical. The results of such an evaluation would influence the need for
Recommendations 1 – 4, and could also be used to inform the UN ECE regulatory
agenda. Certainly any change in vehicle regulations in Australia is likely to be a
complex and lengthy process, though this must be balanced against the need, and
likely effectiveness, of such changes to reduce injury risk in the event of frontal
crashes.
4.5 Study limitations
There were a number of limitations associated with the study. More generally,
while the use of sophisticated regression models represents an advance from
previous research examining the effectiveness of ADR 69 and frontal airbags in
Australia a number of limitations remain. The sample of cases analysed is a product
of focussed entry criteria and hence the results are applicable only to belted drivers
of Australian passenger vehicles (sedans and derivatives; Class MA) in crashes
where no occupant was fatally injured. The following limitations must be also
considered.
4.5.1 The issue of separating the airbag effect and determining compliance with ADR 69
The inability to separate clearly the impact of airbags from the ADR 69 regulation
is a limitation, but one explained by the overlap in their introduction to the vehicle
fleet. It remains the case though that the analysis of ADR 69 and airbag
effectiveness in this report was complicated by the fact that the ADR 69 regulation,
while not mandating the fitment of frontal airbag systems, provided the impetus for
many manufacturers to do so, with the effect of airbags coming to market both
before ADR 69 standard was mandated and in a progressive manner afterwards. It
was not possible in the context of this report, therefore, to specify the precise level
of ADR 69 compliance and airbag effectiveness in mitigating injury risk absolutely;
the results do however statistically adjust for the average effect of the presence and
effect of frontal airbags for the ADR 69 comparison, and ADR 69 status for the
airbag comparison. The results were however unequivocal in delineating the
combined effectiveness of the ADR 69 regulation and airbags in reducing injury
risk, particularly for the head, face and for airbags, the chest.
An important issue is whether vehicles manufactured prior to the introduction of the
ADR 69 standard would have in fact met the ADR 69 standard if tested. Indeed,
some manufacturers elected to fit frontal driver airbag systems some years before
the standard, and this is further complicated by the phased introduction of ADR 69
from mid-1995. Precise information of the compliance status of these vehicles was
not available; however it is noteworthy that some pre-ADR 69 vehicles would
likely have met the standard, indicated by five of the seven vehicles tested in the
Standards Development Program meeting the specified performance criteria [Seyer,
1992, 1993].
– 99 –
4.5.2 Selection and injury recall bias
The results of the study may have some degree of selection bias, as participation in
each of the three in-depth crash research programs was voluntary, and the direction
of this sampling bias is at this stage unclear. Similarly, the tow-away study relied on
driver recall of injuries sustained and some recall bias might be anticipated among
this subset of the sample. An attempt to ensure consistent responses was made by
employing interviewers trained in the use of structured post-crash questionnaire;
however the accuracy of self-reporting of injuries for drivers is unknown. For those
hospitalised, reliance on the medical notes and diagnostic imaging may lead to an
underestimation of soft tissue bruising as such injuries often appear a number of
days post-crash, by which time the patient may have been discharged or the tertiary
survey might have been conducted by hospital medical staff.
4.5.3 Potential sample bias and the need for sample weights
The present evaluation of ADR 69 relied upon 156 belted drivers of pre-ADR 69
(pre-1995) vehicles and 129 belted drivers of post-ADR 69 vehicles with at least
one AIS 1 (minor injury), two-thirds of which were male. In addition, the majority
of vehicles were in the ‘large’ market class with a smaller proportion of ‘small’
vehicles, and a nominal number of medium-sized vehicles. While the degree of
statistical control exercised in this evaluation means that this report represents the
most complete evaluation of ADR 69 yet, the results are best viewed as being
sample-specific rather than representative of the entire Australian vehicle fleet, as at
present the direction of any potential sample bias is unknown. However, it remains
the case that the in-depth driver cases were collected over a period of many years
and were drawn at random, either by notifications from the towing industry or
selected at random as hospital in-patients.
Ideally, any evaluation of an Australian Design Rule would be seen to be
representative of the entire Australian passenger car fleet, and this motivated a
genuine attempt to devise sample weights for application in this report. The goal of
weighting in-depth crash data is to ensure that any analysis is reflective of the total
crash population. The task, then, is to formulate ‘weights’ to ensure that the sample
of crashes are in the same proportion of crashes as the broader population, and also
that when the weights are applied that they sum to the total number of crashes in the
specified jurisdiction. The underlying basis of a weighting system formulated is the
need for complete injury outcome information for all ‘injury’ crashes in Australia.
This information would provide the basis for calculating the ‘expected’ number of
occupants with particular crash characteristics and injury outcomes, and would
permit the ‘weighting’ of in-depth cases. Section 7.3 outlines a proposed system of
calculating weights.
The fundamental basis of the weighting system is detailed casualty crash
information. While detailed information is available for all fatality crashes in
Australia via the ATSB fatality file, no such information is available for serious
injury crashes. The information in the report, Serious Injury due to Road Crashes in
Australia, (ATSB, 2004b) supplied by State and Territory Departments of Health in
6-month summary table blocks does not lend itself to thorough analysis of serious
injury outcomes by the various crash types or vehicles involved.

– 100 –
As a consequence of the unavailability of national crash injury data, it was not
possible to use a weighting system in this report. This report strongly recommends
the establishment of a national crash injury file, inspired by the impressive ATSB
fatality file. This initiative could be made possible by linking hospital and police
crash databases, and potentially the creation of a National Injury Crash Outcome
Information Network. Such information would underpin all future ADR evaluations
and be used to monitor current and emerging road safety concerns. An alternative
would be to establish an in-depth sampling system, similar to the NHTSA NASS
system, where sampling weights are applied to create national estimates based on
appropriately selected representative crashes from pre-defined geographic regions,
or ‘sampling units’.
Recommendation 5: Examine the feasibility and value of establishing a national
injury crash database, using linked hospital and police crash data. Alternatively, the
feasibility of establishing an on-going national in-depth crash sampling system
could be examined. These initiatives would add value to future vehicle safety
evaluations as well as permitting the monitoring of current and emerging road
safety concerns.
4.6 Conclusion
This report set out to examine the effectiveness of ADR 69 in preventing injury
among Australian passenger cars drivers. The results presented in this report
demonstrate significant benefits associated with the introduction of ADR 69 as well
as the voluntary parallel introduction of frontal airbags in Australia. The results of
this evaluation are applicable only to Class MA passenger cars, as no consideration
was given to the real-world crash performance of forward control passenger
vehicles (Class MB), off-road passenger vehicles (Class MC), and light goods
vehicles (Class NA, NA1).
This report demonstrated significant reductions in the risk of head, face, neck and
chest injuries associated with the ADR 69 standard and airbag systems in particular.
It is expected that the safety benefits associated with ADR 69 to these body regions
will flow through the passenger car fleet over time, with the injury reduction
benefits to be realised for generations to come. The findings do however point the
way forward for improvements in design standards, with the aim of enhancing the
protection of the abdomen and pelvic contents, the spine, and the lower extremity in
particular, where the regulation has had little improvement in injury risk among this
sample. This Report makes a number of recommendations for further study with the
intent of examining methods to improve occupant protection standards, thereby
reducing the number and severity of injuries for male and female passenger car
occupants in Australia.
Future studies would be best placed to use a larger sample with a range of greater
range of injury severities than was used here. Further, the benefit of sample weights
based on complete Australian hospital presentation and admission data linked to
Police reported casualty crashes in the evaluation of ADRs cannot be
underestimated. The use of sample weights would ensure the results of future
evaluations would be applicable to all Australian drivers and passengers. A series of
Recommendations stemming from this work are noted throughout the report and
summarised in Chapter 5.
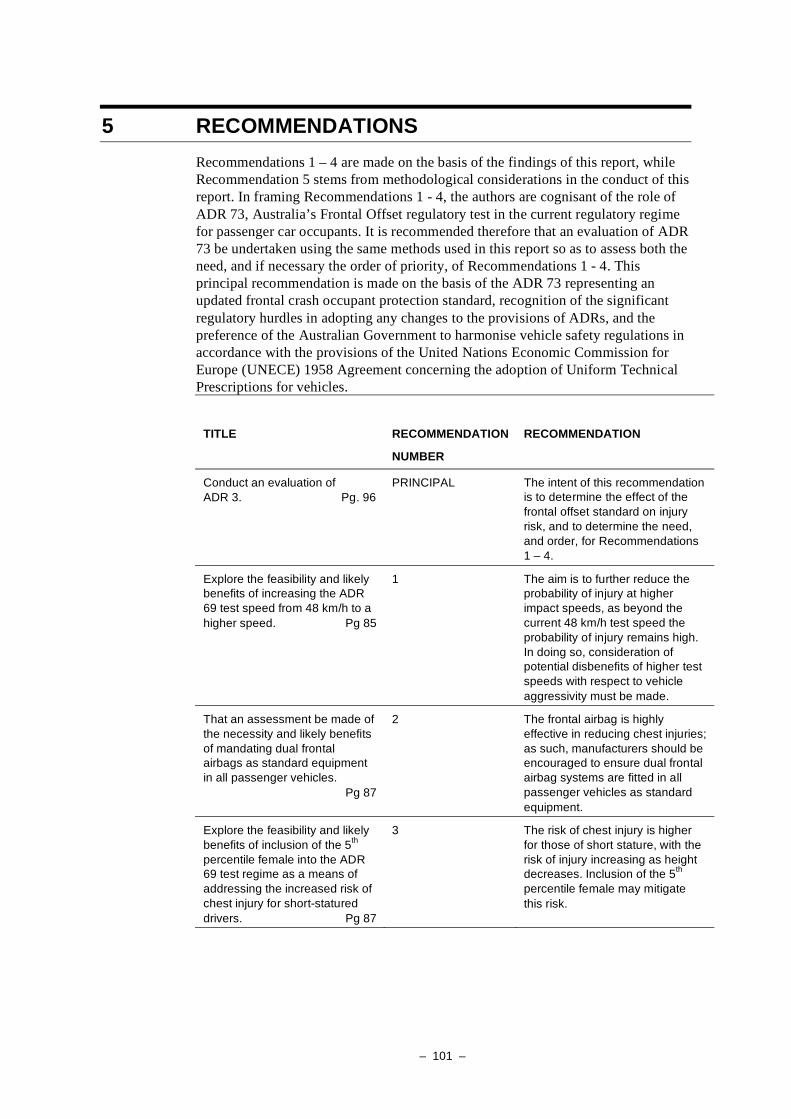
– 101 –
5 RECOMMENDATIONS
Recommendations 1 – 4 are made on the basis of the findings of this report, while
Recommendation 5 stems from methodological considerations in the conduct of this
report. In framing Recommendations 1 - 4, the authors are cognisant of the role of
ADR 73, Australia’s Frontal Offset regulatory test in the current regulatory regime
for passenger car occupants. It is recommended therefore that an evaluation of ADR
73 be undertaken using the same methods used in this report so as to assess both the
need, and if necessary the order of priority, of Recommendations 1 - 4. This
principal recommendation is made on the basis of the ADR 73 representing an
updated frontal crash occupant protection standard, recognition of the significant
regulatory hurdles in adopting any changes to the provisions of ADRs, and the
preference of the Australian Government to harmonise vehicle safety regulations in
accordance with the provisions of the United Nations Economic Commission for
Europe (UNECE) 1958 Agreement concerning the adoption of Uniform Technical
Prescriptions for vehicles.
TITLE
RECOMMENDATION
NUMBER
RECOMMENDATION
Conduct an evaluation of
ADR 3. Pg. 96
PRINCIPAL The intent of this recommendation
is to determine the effect of the
frontal offset standard on injury
risk, and to determine the need,
and order, for Recommendations
1 – 4.
Explore the feasibility and likely
benefits of increasing the ADR
69 test speed from 48 km/h to a
higher speed. Pg 85
1 The aim is to further reduce the
probability of injury at higher
impact speeds, as beyond the
current 48 km/h test speed the
probability of injury remains high.
In doing so, consideration of
potential disbenefits of higher test
speeds with respect to vehicle
aggressivity must be made.
That an assessment be made of
the necessity and likely benefits
of mandating dual frontal
airbags as standard equipment
in all passenger vehicles.
Pg 87
2 The frontal airbag is highly
effective in reducing chest injuries;
as such, manufacturers should be
encouraged to ensure dual frontal
airbag systems are fitted in all
passenger vehicles as standard
equipment.
Explore the feasibility and likely
benefits of inclusion of the 5th
percentile female into the ADR
69 test regime as a means of
addressing the increased risk of
chest injury for short-statured
drivers. Pg 87
3 The risk of chest injury is higher
for those of short stature, with the
risk of injury increasing as height
decreases. Inclusion of the 5th
percentile female may mitigate
this risk.

– 102 –
Examine the risk of lower
extremity injuries among
occupants of ADR 73 compliant
passenger cars involved in
frontal crashes. pg 92
4 The risk of lower extremity injuries
remains high, despite inclusion of
a femur force criterion in ADR 69.
These injuries are seen to be
frequent and debilitating. The
performance criteria of ADR 73
may have acted to resolve this
heightened risk.
Examine the feasibility and
value of establishing an
Australian National Injury Crash
Database, or alternatively
examine the establishment an
on-going national in-depth crash
sampling system. pg 100
5 The value of complete crash injury
information cannot be
understated; these initiatives
would add value to future vehicle
safety evaluations as well as
permitting the monitoring of
current and emerging road safety
concerns.

– 103 –
6 REFERENCES
AAAM (1998), ‘The Abbreviated Injury Scale (AIS) – 1990, 1998 Update’,
Association for the Advancement of Automotive Medicine, Des Plaines, IL.
Ackland H M (2005), ‘The Alfred Spinal Clearance Management Protocol’, The
Alfred, Melbourne, Victoria.
Agresti A (2002), ‘Categorical data analysis, Second Edition’, John Wiley & Sons:
New Jersey.
ARUP (1995), ‘The 1994 Exposure Survey, Final Report’, Prepared for VicRoads
by ARUP Transportation Planning, Melbourne, Victoria.
ATSB (1996), ‘Road crash statistics 1996’, http://www.atsb.gov.au/, Accessed
May, 2002.
ATSB (2004a), ‘Road crash deaths, Australian States and Territories, 1950 to
1988’, Australian Transport Safety Bureau, Canberra.
ATSB (2004b), ‘Serious Injury due to Road Crashes in Australia July 1999 – June
2002’, Australian Transport Safety Bureau, Canberra.
BTE (2000), ‘Road Crash Costs in Australia, Report 102’, Bureau of Transport
Economics, Canberra.
Bulger E M, Arneson M A, Mock C N, Jurkovich G J (2000), ‘Rib fractures in the
elderly’, J Trauma 48, 1040-1046.
Cameron M H (1979), ‘Frontal impacts and the effect of Australian Design Rules
10A and 10B for steering columns, Report CR 7’, Federal Office of Road
Safety, Canberra.
Cavanaugh J (2002), ‘Biomechanical aspects of thoracic trauma’, In Accidental
Injury: Biomechanics and Prevention, Second Edition, Ed: A Nahum & J
Melvin, Springer Verlag, New York.
Crash 3 (1992), ‘Crash 3 User’s Guide and Technical Manual, Revised Edition’,
National Highway Traffic Safety Administration, US Dept of
Transportation, Washington, DC.
DoTARS (2004), ‘Australian Design Rules for Road Vehicles as a Determination 5
of 2003 and Determination 1 of 2004’ [CD], Department of Transport and
Regional Services, Commonwealth of Australia, Canberra.
Dupont W D (2002), ‘Statistical modelling for biomedical researchers: A simple
introduction to the analysis of complex data’, Cambridge University Press,
Cambridge, UK.
Eppinger R, Sun E, Bandak F, Haffner M, Khaewpong N, Maltese M, Kuppa S,
Nguyen T, Takhounts E, Tannous R, Zhang A, & Saul R (1999),
‘Development of Improved Injury Criteria for the Assessment of Advanced
Automotive Restraint Systems – II’, NHTSA Docket No 1999-6407-5,
Washington, DC.
– 104 –
EuroNCAP (2004a), ‘Assessment protocol and biomechanical limits, Version 4.1.,
March 2004’, European New Car Assessment Programme,
www.euroncap.com, Accessed July, 2005.
EuroNCAP (2004b), ‘Frontal Impact testing protocol, Version 4.1., March 2004’,
European New Car Assessment Programme, www.euroncap.com, Accessed
July, 2005.
EuroNCAP (2005), ‘Seatbelt reminder assessment protocol, Version 1.0e’,
European New Car Assessment Programme, www.euroncap.com, Accessed
January, 2005.
Fildes B, Deery H, Lenard J, Kenny D, Edwards-Coghill K, & Jacobson S (1996),
‘Effectiveness of airbags in Australia’, 15th International Technical
Conference on the Enhanced Safety of Vehicles, Paper 96-S5-O-17,
Melbourne, Australia.
Fildes B N, Digges K, Gantzer S, & Seyer K, (1996), ‘Benefits of a frontal offset
regulation’, Report CR 165, Federal Office of Road Safety, Canberra.
Fildes B, Fitzharris M, Koppel S, & Vulcan P (2002), ‘Benefits of seatbelt reminder
systems’, Report CR 211, Australian Transport Safety Bureau, Canberra.
Fildes B, Fitzharris M, Vulcan P, & Koppel S (2003), ‘Benefits of retrofitting
seatbelt reminder systems to Australian passenger vehicles’, Report CR
215, Australian Transport Safety Bureau, Canberra.
Fildes B N, Lane J C, Lenard J, & Vulcan A P (1991), ‘Passenger Cars and
Occupant Injury’, Monash University Accident Research Centre, Clayton,
Victoria.
Fildes B N, Lane J C, Lenard J, Vulcan A P, Wenzel J, (1994), ‘Lower limb injuries
to passenger car occupants’, Report CR 137, Federal Office of Road Safety,
Canberra.
Foret-Bruno J-Y, Trosseille X, Le Coz J-Y, Bendjellal F, Steyer C, Phalempin T,
Villeforceix D, Dandres P, & Got C (1998), ‘Thoracic injury risk in frontal
car crashes with occupant restrained with belt load limiter’, 42nd Annual
STAPP Car Crash Conference, SAE Paper 983166; Society of Automotive
Engineers, Inc., Warrendale, Pennsylvania, USA.
Gadd C W (1966), ‘Use of a Weighted-Impulse Criterion for Estimating Injury
Hazard’, Proceedings of the Tenth STAPP Car Crash Conference, SAE
Paper 660793, Society of Automotive Engineers, Inc., Warrendale,
Pennsylvania, USA.
Hertz E (1993), ‘A Note on the Head Injury Criteria (HIC) as a Predictor of the
Risk of Skull Fracture’, 37th Annual Proceedings of the Association for the
Advancement of Automotive Medicine, Des Plaines, IL.
Huelke, D F, Moore, J L, Compton, T W, Samuels, J, Levine, R S. (1995), ‘Upper
Extremity Injuries Related to Airbag Deployments’, J Trauma 38, 482-488.
Hosmer D W & Lemeshow S (2000), ‘Applied logistic regression’, Second Edition,
John Wiley & Sons, New York.

– 105 –
Keppel G (1991), ‘Design and analysis: A Researchers Handbook, Third Edition’,
Prentice Hall, New Jersey.
Kleinberger M, Sun E, Eppinger R, Kuppa S, Saul R (1998), ‘Development of
Improved Injury Criteria for the Assessment of Advanced Automotive
Restraint Systems’, NHTSA Docket No 1998-4405-9, Washington, DC.
McElhaney J H, Nightingdale R W, Winkelstein B A, Chancey V C, Myers B S
(2002), ‘Biomechanical aspects of cervical trauma’, In Accidental Injury:
Biomechanics and Prevention, Second Edition, Ed: A Nahum & J Melvin,
Springer Verlag, New York.
MacKenzie E J, Sacco W J, and Colleagues (1997), ‘ICDMAP-90: a users guide’,
The Johns Hopkins University School of Public Health and Tri-Analytics,
Inc., Baltimore, MD.
Mertz H J (2002), ‘Injury risk assessments based on dummy responses’, In
Accidental Injury: Biomechanics and Prevention, Second Edition, Ed: A
Nahum & J Melvin, Springer Verlag, New York.
Mertz H J, Prasad P, & Irwin A (1997), ‘Injury Risk Curves for Children and
Adults in Frontal and Rear Collisions’, Forty-First STAPP Car Crash
Conference, SAE Paper No. 973318, Society of Automotive Engineers,
Inc., Warrendale, Pennsylvania, USA.
Mertz H, Horsch J, & Horn G (1991), ‘Thoracic injury assessment of belt restraint
systems based on hybrid III chest compression’, SAE Paper No. 912895,
Society of Automotive Engineers, Inc., Warrendale, Pennsylvania, USA.
Milne P W (1985), ‘Fitting and wearing of seat belts in Australia: The history of a
successful countermeasure’, Report OR 2, Federal Office of Road Safety,
Canberra.
Morris A, Barnes J, Fildes B, Bentivegna F, & Seyer K (2001), ‘Effectiveness of
ADR 69: A case-control study of crashed vehicles equipped with airbags’,
CR1999, Australian Transport Safety Bureau, Canberra.
MUARC (1992), ‘Feasibility of occupant protection measures’, Report CR 100,
Federal Office of Road Safety, Canberra.
Nash C E, Mickan S M, Del Mar C B, Glasziou P (2004), ‘Resting injured limbs
delays recovery: a systematic review’, J Fam Pract 53, 706-712.
NHTSA (1997), ‘Status Report on establishing a Federal Motor Vehicle Safety
Standard for frontal offset crash testing’, National Highway Traffic Safety
Administration.
http://www.nhtsa.dot.gov/cars/rules/CrashWorththy/Frontal
Offset/offrt/offrt.html.
NHTSA (1998), ‘Notice of Proposed Rulemaking - Federal Motor Vehicle Safety
(FMVSS) No. 208 - Occupant Crash Protection; Air Bags’, NHTSA-1998-
4405’, Federal Reg. Citation: 63 FR 49958, Rules and Regulations, Office
of the Federal Register, National Archives and Records Administration,
Washington, DC, Available at http://dms.dot.gov/

– 106 –
NHTSA (1999), ‘Supplemental Notice of Proposed Rulemaking - Notice 1 -
Federal Motor Vehicle Safety Standards (FMVSS) No 208; Occupant
Crash Protection - Air Bags’, NHTSA-1999-6407, Federal Reg. Citation:
64 FR 60556, Proposed Rules, Office of the Federal Register, National
Archives and Records Administration, Washington, DC, Available at
http://dms.dot.gov/.
NHTSA (2000), ‘49 CFR Part 552 et al. Federal Motor Vehicle Safety Standards
(FMVSS) No 208; Occupant Crash Protection; Final Rule’, NHTSA
Docket No-00-7013, Notice 1, Federal Reg. Citation: 65 FR: 30680, Rules
and Regulations, Office of the Federal Register, National Archives and
Records Administration, Washington, DC, Available at http://dms.dot.gov/.
NHTSA (2002), ‘Anthropomorphic Test Devices; Instrumented Lower Legs for
Hybrid III-50M and - 5F Crash Test Dummies, Advanced Notice of
Proposed Rulemaking’, NHTSA-2002-11838, Federal Reg. Citation: 67 FR
22381, Rules and Regulations, Office of the Federal Register, National
Archives and Records Administration, Washington, DC, Available at
http://dms.dot.gov.
NHTSA (2003), ‘Federal Motor Vehicle Safety Standards; Occupant Crash
Protection - 49 CFR Part 571 - Request for Comments’, NHTSA-2003-
15715, Federal Reg. Citation 69 FR 5108, Office of the Federal Register,
National Archives and Records Administration, Washington, DC, Available
at http://dms.dot.gov.
NHTSA (2004), ‘Preliminary Lower Extremity Injury Benefits for Frontal Offset
Crash Tests’, Office of Regulatory Analysis and Evaluation Planning,
Evaluation, and Budget, National Traffic Highway Safety Administration,
Washington, DC.
NHTSA (2005), ‘Federal Motor Vehicle Safety Standards; Occupant Crash
Protection; Anthropomorphic Test Devices; Instrumented Lower Legs for
50th Percentile Male and 5th Percentile Female Hybrid III Dummies,
FMVSS No. 208 and Part 572, Withdrawal of Rulemakings’, NHTSA-
2005-21698, Federal Reg. Citation 70 FR 49248, Office of the Federal
Register, National Archives and Records Administration, Washington, DC,
Available at http://dms.dot.gov.
NHTSA (2006), ‘Motor Vehicle Traffic Crash Fatality Counts and Estimates of
People Injured for 2005, United States. National Traffic Highway Safety
Administration, Washington, DC.
Prasad P & Mertz H (1985), ‘The Position of the United States Delegation to the
ISO Working Group 6 on the Use of HIC in the Automotive Environment’,
SAE Government/Industry Meeting and Exposition, SAE paper No.
851246.
Read K M, Kufera J A, Dischenger P C, et al. (2004), ‘Life-Altering Outcomes
after Lower Extremity Injury Sustained in Motor Vehicle Crashes’, J
Trauma 57, 815-823.

– 107 –
Regan M A, Young K, Triggs T, Tomasevic N, Mitsopoulos E, Tierney P, & Healy
D (2004), ‘Driver adaptation to in-vehicle intelligent transport systems:
Preliminary findings from the TAC SafeCar project’, Proceedings of the
2004 Road Safety Research, Policing and Education Conference, Perth,
Australia.
Rouhana S W (2002), ‘Biomechanics of Abdominal Trauma’, In Accidental Injury:
Biomechanics and Prevention, Second Edition, Ed: A Nahum & J Melvin,
Springer Verlag, New York.
Royston P and Altman D G (1994), ‘Regression using fractional polynomials of
continuous covariates: parsimonious parametric modelling’, Appl Stat 43,
429-467.
SAS Institute (1999), ‘The SAS System for Windows, V.8.02’, SAS Institute Inc.,
Cary, NC.
SAE (1980), ‘Collision Deformation Classification – SAE J224 MAR80’, Society
of Automotive Engineers, Inc., Warrendale, Pennsylvania, USA.
Seyer K (1992), ‘Review of passenger car occupant protection’, Report OR 11,
Federal Office of Road Safety, Canberra.
Seyer K (1993), ‘Development of a New Australian Design Rule for Frontal Impact
Protection’, 37th STAPP Proceedings, SAE, Paper 933117, Society of
Automotive Engineers, Inc., Warrendale, Pennsylvania, USA.
Seyer K, Makeham P, & McLennan D (1992), ‘Review of passenger car occupant
protection – Main Report’, Report OR 12, Federal Office of Road Safety,
Canberra.
Siegel S, & Castellan N J (1988), ‘Nonparametric statistics for the behavioural
sciences, Second Edition’, McGraw-Hill, New York.
StataCorp (2003), ‘Stata Statistical Software: Release 8.0.’, Stata Corporation,
College Station, TX, USA.
Steadman L A & Bryan R J (1988), ‘Costs of Road Accidents in Australia’,
Occasional Paper 91, Bureau of Transport Economics, Canberra, Australia.
World Trade Organisation (1994), ‘Agreement on Technical Barriers to Trade’,
http://www.wto.org/english/docs_e/legal_e/17-tbt.pdf, Accessed May 2005.
Zhou Q, Rouhana S W, Melvin J W, (1996), ‘Age effects on thoracic injury
tolerance’, Proceedings of the 40th STAPP Car Crash Conference, SAE
Paper 962421. Society of Automotive Engineers, Inc., Warrendale,
Pennsylvania, USA.

– 108 –
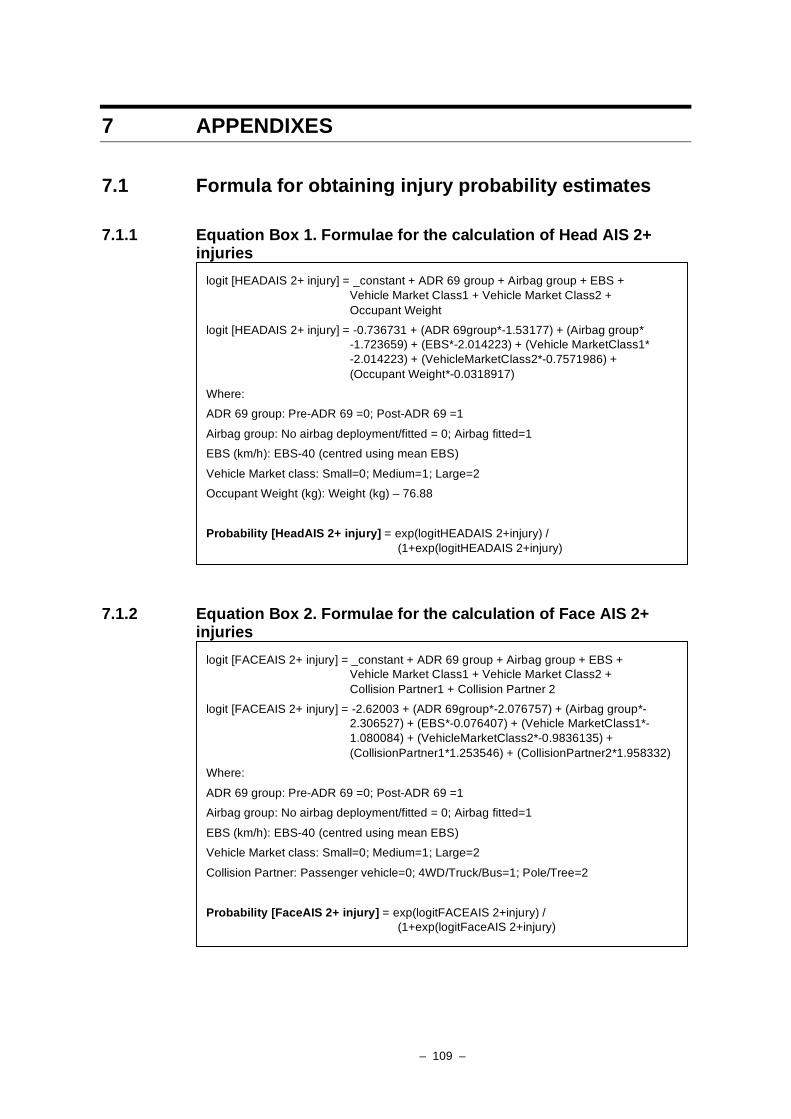
– 109 –
7 APPENDIXES
7.1 Formula for obtaining injury probability estimates
7.1.1 Equation Box 1. Formulae for the calculation of Head AIS 2+ injuries
7.1.2 Equation Box 2. Formulae for the calculation of Face AIS 2+ injuries
logit [FACEAIS 2+ injury] = _constant + ADR 69 group + Airbag group + EBS +
Vehicle Market Class1 + Vehicle Market Class2 +
Collision Partner1 + Collision Partner 2
logit [FACEAIS 2+ injury] = -2.62003 + (ADR 69group*-2.076757) + (Airbag group*-
2.306527) + (EBS*-0.076407) + (Vehicle MarketClass1*-
1.080084) + (VehicleMarketClass2*-0.9836135) +
(CollisionPartner1*1.253546) + (CollisionPartner2*1.958332)
Where:
ADR 69 group: Pre-ADR 69 =0; Post-ADR 69 =1
Airbag group: No airbag deployment/fitted = 0; Airbag fitted=1
EBS (km/h): EBS-40 (centred using mean EBS)
Vehicle Market class: Small=0; Medium=1; Large=2
Collision Partner: Passenger vehicle=0; 4WD/Truck/Bus=1; Pole/Tree=2
Probability [FaceAIS 2+ injury] = exp(logitFACEAIS 2+injury) /
(1+exp(logitFaceAIS 2+injury)
logit [HEADAIS 2+ injury] = _constant + ADR 69 group + Airbag group + EBS +
Vehicle Market Class1 + Vehicle Market Class2 +
Occupant Weight
logit [HEADAIS 2+ injury] = -0.736731 + (ADR 69group*-1.53177) + (Airbag group*
-1.723659) + (EBS*-2.014223) + (Vehicle MarketClass1*
-2.014223) + (VehicleMarketClass2*-0.7571986) +
(Occupant Weight*-0.0318917)
Where:
ADR 69 group: Pre-ADR 69 =0; Post-ADR 69 =1
Airbag group: No airbag deployment/fitted = 0; Airbag fitted=1
EBS (km/h): EBS-40 (centred using mean EBS)
Vehicle Market class: Small=0; Medium=1; Large=2
Occupant Weight (kg): Weight (kg) – 76.88
Probability [HeadAIS 2+ injury] = exp(logitHEADAIS 2+injury) /
(1+exp(logitHEADAIS 2+injury)

– 110 –
7.1.3 Equation Box 3. Formulae for the calculation of Neck AIS 1+ injuries
7.1.4 Equation Box 4. Formulae for the calculation of Neck AIS 2+ injuries
logit [NECKAIS 2+ injury] = _constant + ADR 69 group + Airbag group + EBS
logit [NECKAIS 2+ injury] = -2.873494 + (ADR 69group*-0.4733402) +
(Airbag group*-1.120829) + (EBS*0.0091115)
Where:
ADR 69 group: Pre-ADR 69 =0; Post-ADR 69 =1
Airbag group: No airbag deployment/fitted = 0; Airbag fitted=1
EBS (km/h): EBS-40.0 (centred using mean EBS)
Probability [NeckAIS 2+ injury] = exp(logitNECKAIS 2+injury) /
(1+exp(logitNECKAIS 2+injury)
logit [NECKAIS 1+ injury] = _constant + ADR 69 group + Airbag group + EBS + Age_1
+ Age_2
logit [NECKAIS 1+ injury] = -.3743646 + (ADR 69group*-0.3083719) +
(Airbag group*-0.7465827) + (EBS*-0.0202943)
(Age_1*-20.82653) + (Age_2*-32.92066)
Where:
ADR 69 group: Pre-ADR 69 =0; Post-ADR 69 =1
Airbag group: No airbag deployment/fitted = 0; Airbag fitted=1
EBS (km/h): EBS-40.0 (centred using mean EBS)
Age_1: X^-2-.0645, where X = age/10
Age_2: X^-2*ln(X)-.0884, where X = age/10
Probability [NeckAIS 1+ injury] = exp(logitNECKAIS 1+injury) /
(1+exp(logitNECKAIS 1+injury)

– 111 –
7.1.5 Equation Box 5. Formulae for the calculation of Chest AIS 2+ injuries
7.1.6 Equation Box 6. Formulae for the calculation of Abdomen-pelvic contents injuries
logit [Ab_Pel_AIS1+ injury] = _constant + ADR 69 group + Airbag group + EBS + Gender
logit [Ab_Pel_AIS1+ injury] = -0.1176965 + (ADR 69group*-0.1160454) +
(Airbag group*0.3601362) + (EBS*0.0513099) +
(Gender*-0.8603729)
Where:
ADR 69 group: Pre-ADR 69 =0; Post-ADR 69 =1
Airbag group: No airbag deployment/fitted = 0; Airbag fitted=1
EBS (km/h): EBS-40 (centred using mean EBS)
Gender: Female=0; Male=1
Probability [Ab_Pel_ AIS1+ injury] = exp(logitAb_PelAIS1+injury) /
(1+exp(logitAbpelAIS1+injury)
logit [CHESTAIS 2+ injury] = _constant + ADR 69 group + Airbag group + EBS +
Vehicle Market Class1 + Vehicle Market Class2 + Age +
Height_1 + Height_2
logit [CHESTAIS 2+ injury] = 0.2803183 + (ADR 69group*0.2211183) +
(Airbag group*-1.546525) + (EBS*-0.0260038) +
(Vehicle MarketClass1*-0.0866093) +
(VehicleMarketClass2*-0.8803802) + (Age*-10.35632) +
(Height_1*-83214.18) + (Height_2*35794.21)
Where:
ADR 69 group: Pre-ADR 69 =0; Post-ADR 69 =1
Airbag group: No airbag deployment/fitted = 0; Airbag fitted=1
EBS (km/h): EBS-40 (centred using mean EBS)
Vehicle Market class: Small=0; Medium=1; Large=2
Age: X^-1-.2541, where X = age/10
Height_1: X^-2-.0033, where X = height/10
Height_2: X^-2*ln(X)-.0095, where X =height/10
Probability [ChestAIS 2+ injury] = exp(logitCHESTAIS 2+injury) /
(1+exp(logitCHESTAIS 2+injury)

– 112 –
7.1.7 Equation Box 7. Formulae for the calculation of Abdomen-pelvic contents AIS 2+ injuries
7.1.8 Equation Box 8 Formulae for the calculation of Spine AIS 1+ injuries
7.1.9 Equation Box 9 Formulae for the calculation of Spine AIS 2+ injuries
logit [SPINEAIS 2+ injury] = _constant + ADR 69 group + Airbag group + EBS
logit [SPINEAIS 2+ injury] = -3.768894 + (ADR 69group*2.298312) +
(Airbag group*-1.701426) + (EBS*0.0180666)
Where:
ADR 69 group: Pre-ADR 69 =0; Post-ADR 69 =1
Airbag group: No airbag deployment/fitted = 0; Airbag fitted=1
EBS (km/h): EBS-40.01 (centred using mean EBS)
Probability [SpineAIS 2+ injury] = exp(logitSPINEAIS 2+injury) /
(1+exp(logitSPINEAIS 2+injury)
logit [SPINEAIS1+ injury] = _constant + ADR 69 group + Airbag group + EBS + Gender
logit [SPINEAIS1+ injury] = -3.025938 + (ADR 69group*1.890673) +
(Airbag group*-1.652161) + (EBS*0.015081)
Where:
ADR 69 group: Pre-ADR 69 =0; Post-ADR 69 =1
Airbag group: No airbag deployment/fitted = 0; Airbag fitted=1
EBS (km/h): EBS-40.01 (centred using mean EBS)
Probability [Spine_ AIS1+ injury] = exp(logitSPINEAIS1+injury) /
(1+exp(logitSPINEAIS1+injury)
logit [Ab_Pel_AIS 2+ injury] = _constant + ADR 69 group + Airbag group +
EBS_1 + EBS_2
logit [Ab_Pel_AIS 2+ injury] = -3.599057 + (ADR 69group*0.9583166) +
(Airbag group*-1.768962) + (EBS_1*-11.76417) +
(EBS_2*3.00285) + (Weight*-0.0444557)
Where:
ADR 69 group: Pre-ADR 69 =0; Post-ADR 69 =1
Airbag group: No airbag deployment/fitted = 0; Airbag fitted=1
EBS_1 (km/h): X^.5-2.0, where X = EBS/10
EBS_2 (km/h): X-4.0, where X=EBS/10
Weight (kg): weight-76.88 (centred on mean)
Probability [Ab_Pel_ AIS 2+ injury] = exp(logitAb_PelAIS 2+injury) /
(1+exp(logitAbpelAIS 2+injury)

– 113 –
7.1.10 Equation Box 10. Formulae for the calculation of Upper Extremity AIS 1+ injuries
7.1.11 Equation Box 11. Formulae for the calculation of Upper Extremity AIS 2+ injuries
logit [UPEX_AIS 2+ injury] = _constant + ADR 69 group + Airbag group + EBS +
Vehicle Market Class1 + Vehicle Market Class2 +
Collision Partner 1 + Collision Partner 2 + Height
logit [UPPEXAIS 2+ injury] = -1.176211 + (ADR 69group*-0.1688494) +
(Airbag group*-0.0428528) + (EBS*0.0347353) +
(Vehicle Market Class*-1.445196) +
(CollisionPartner1*0.2152157) +
(CollisionPartner2*0.8218623) + (Height*0.0341864)
Where:
ADR 69 group: Pre-ADR 69 =0; Post-ADR 69 =1
Airbag group: No airbag deployment/fitted = 0; Airbag fitted=1
EBS (km/h): EBS-40 (centred using mean EBS)
Vehicle Market class: Small/Medium=0; Large=1
Collision Partner: Passenger vehicle=0; 4WD/Truck/Bus=1; Pole/Tree=2
Height (cm): height-173.5
Probability [UpExAIS 2+ injury] = exp(logitUPEX_AIS 2+injury) /
(1+exp(logitUPEX_AIS 2+injury)
logit [UPEX_AIS1+ injury] = _constant + ADR 69 group + Airbag group + EBS +
Vehicle Market Class1 + Vehicle Market Class2 +
Collision Partner 1 + Collision Partner 2 + Height
logit [UPPEXAIS1+ injury] = 0.5030415 + (ADR 69group*0.5719651) +
(Airbag group*0.1877379) + (EBS*0.0179289) +
(Vehicle Market Class*-0.3423234) +
+ (CollisionPartner1*-0.4785527) +
(CollisionPartner2*0.0684416) + (Height*0.0314412)
Where:
ADR 69 group: Pre-ADR 69 =0; Post-ADR 69 =1
Airbag group: No airbag deployment/fitted = 0; Airbag fitted=1
EBS (km/h): EBS-40 (centred using mean EBS)
Vehicle Market class: Small/Medium=0; Large=1
Collision Partner: Passenger vehicle=0; 4WD/Truck/Bus=1; Pole/Tree=2
Height (cm): height-173.5
Probability [UpExAIS1+ injury] = exp(logitUPEX_AIS1+injury) /
(1+exp(logitUPEX_AIS1+injury

– 114 –
7.1.12 Equation Box 12. Formulae for the calculation of Lower Extremity AIS 2+ injuries
logit [LOWEX_AIS 2+ injury] = _constant + ADR 69 group + Airbag group + EBS +
Vehicle Market Class1 + Vehicle Market Class2 +
Collision Partner 1 + Collision Partner 2
logit [LOWEX_AIS 2+ injury] = -1.050265 + (ADR 69group*0.4102755) +
(Airbag group*-0.5089616) + (EBS*0.0613511) +
(Vehicle MarketClass1*0.065812) +
(VehicleMarketClass2*-0.8819173) +
(CollisionPartner1*0.2860884) +
(CollisionPartner2*-0.2294495)
Where:
ADR 69 group: Pre-ADR 69 =0; Post-ADR 69 =1
Airbag group: No airbag deployment/fitted = 0; Airbag fitted=1
EBS (km/h): EBS-40 (centred using mean EBS)
Vehicle Market class: Small=0; Medium=1; Large=2
Collision Partner: Passenger vehicle=0; 4WD/Truck/Bus=1; Pole/Tree=2
Probability [LowerEx_AIS 2+ injury] = exp(logit LOWEX_AIS 2+injury) /
(1+ exp(logit LOWEX_AIS 2+injury)

– 115 –
7.2 Summary table of change in injury risk for all injuries
Table 64: Change in injury risk for AIS 1+ injuries
Body region Post-ADR 69 drivers
(a)
Airbag exposed drivers
(b)
Post-ADR 69 + Airbag exposed
(c)
Head 69% reduction‡ Indicative 54%
reduction*
86% reduction‡
Face N.S.D Indicative 40%
reduction*
58% reduction‡
Neck N.S.D 53% reduction† 65% reduction
‡
Chest N.S.D Indicative 42%
reduction*
N.S.D
Abdomen – Pelvic
contents
N.S.D N.S.D N.S.D
Spine 562% increase‡ 81% reduction
‡ N.S.D
Upper Extremity Indicative 77%
increase*
N.S.D 113% increase†
Lower Extremity 93% increase† 47% reduction
† N.S.D
(a) Relative to pre-ADR 69 drivers; (b) Relative to driver’s without an airbag deployment; (c)Relative to pre-ADR 69 drivers without an airbag deployment; *p 0.1, †p 0.05, ‡p 0.01;
N.S.D – No Statistical Difference

– 116 –
7.3 Method for the construction of a crash-based weighting system for in-depth data
The approach in devising a weighting system was motivated broadly by the US
National Automotive Sampling System (NASS) weights with some modification.
We consider that there are 4 levels of crash severity: fatal; admitted to hospital,
‘tow-away crash –injured’, and finally, ‘tow-away crash-uninjured’. In the
calculation of weights these groups are treated independently given the unique
occupant, crash, and injury characteristics associated with each crash type. In this
way, it is ensured that the sample crash data for each severity is correctly weighted
for the population from which it was drawn.
The weighting system developed creates categories, or ‘bins’, into which each crash
would fall based on the variables: year of vehicle manufacture; impact direction
(front, left side of vehicle etc…); seating position of occupant; single vehicle crash
or multiple vehicle crash; speed zone (reduced to categories: 60, 70-90, 100+
km/h); head injury AIS 3; chest or abdominal-pelvic injury AIS 3; and lower
extremity AIS 3. As such, the weighting system results in 4032 possible covariate
patterns for the 4 severity levels. The year of manufacture is important to include as
advances in vehicle safety have progressed rapidly, and pre-/post-1995 serves as a
cut-point for the evaluation of ADR 69 due to its commencement in mid-1995. The
variable speed zone is used as a surrogate for crash severity, while in combination
with single vehicle accident variable it serves as a partial control and identifier for
rural/urban crashes. The AIS injury severity variables are included to ensure that
overall severity of crashes among the four broad crash categories are met, and that
particular high severity in-depth case do not bias the results; ICD injury codes
would be converted to AIS codes using ICD mapping software (MacKenzie, Sacco,
and Colleagues, 1997). This is especially pertinent when occupant HARM is
calculated, and overall societal costs are being estimated.
After obtaining the expected proportion of crashes for each ‘bin’ for each crash
severity, we multiply by the observed reported official numbers over a rolling three
year period by the percent of cases in weight category, leaving the national
expected number of crashes with specified characteristics in Australia per annum.
Finally, the frequency weight is simply expected number of crashes in each ‘bin’ in
Australia divided by the number of matched (based on matching bins) in-depth
cases. Application of the weight to the in-depth data would weight up or down the
cases collected by MUARC and would result in a nationally representative
database.