craig james, chief economist, @commsec … year in review commodity prices lifted over 2016 with...
TRANSCRIPT
Craig James, Chief Economist, @CommSecSavanth Sebastian, Senior Economist, @CommSec
http://hellasfrappe.blogspot.com.au/2013_07_25_archive.html

2
Important InformationThis presentation has been prepared without taking account of the objectives, financial situation or needs of any particular individual. Before acting on the information in this seminar, you should consider its appropriateness to your circumstances and, if necessary, seek appropriate professional advice.
Commonwealth Securities Limited ABN 60 067 254 399 AFSL 238814 (CommSec) is a wholly owned but non-guaranteed subsidiary of Commonwealth Bank of Australia ABN 48 123 123 124 and a Participant of the ASX Group.
Examples used in this presentation are for illustrative purposes only.

3
Year in Review
The year was full of surprises. The UK voted to leave the European Union. Donald Trump was elected US President. The US Federal Reserve only lifted interest rates once in the year. And OPEC oil producers agreed to restrict production in order to support prices.
But probably the biggest surprise was how financial markets reacted to the various political and economic events - unambiguously positive.
The Australian economy probably grew around 2.3 per cent in 2016, down from the decade average of 2.7 per cent. The economy contracted in the September quarter due to political uncertainty at home and abroad.
The annual inflation rate stands at 1.3 per cent. But once volatile factors are removed, underlying inflation is around 1.6 per cent.

4
Year in Review The unemployment rate stands at 5.7 per cent, down from 5.8 per cent at the
end of 2015. In the year to November, 87,300 jobs were created, down from the decade average monthly gain of 183,200.
Wages grew by 1.9 per cent in the year to September, a record (18-year) low. The Federal Government now expects a budget deficit of $36.5 billion in
2016/17 (2.1 per cent of GDP), down from the earlier estimate of $37.1 billion. Australia’s population grew by 1.42 per cent in the year to June, down from the
decade average of 1.66 per cent. Retail trade rose by 3.5 per cent in the year to October, close to the average
rate over the past seven years. Consumer confidence and business confidence and conditions are holding
above long-term averages.

5
Year in Review New car sales are just below record highs on an annual basis. The number of
homes being built at present is at an all-time high. Australian home prices grew by around 10.5 per cent in 2016 after lifting by 7.8
per cent in 2015. The Reserve Bank cut the cash rate by 25 basis points (quarter of a per cent) in
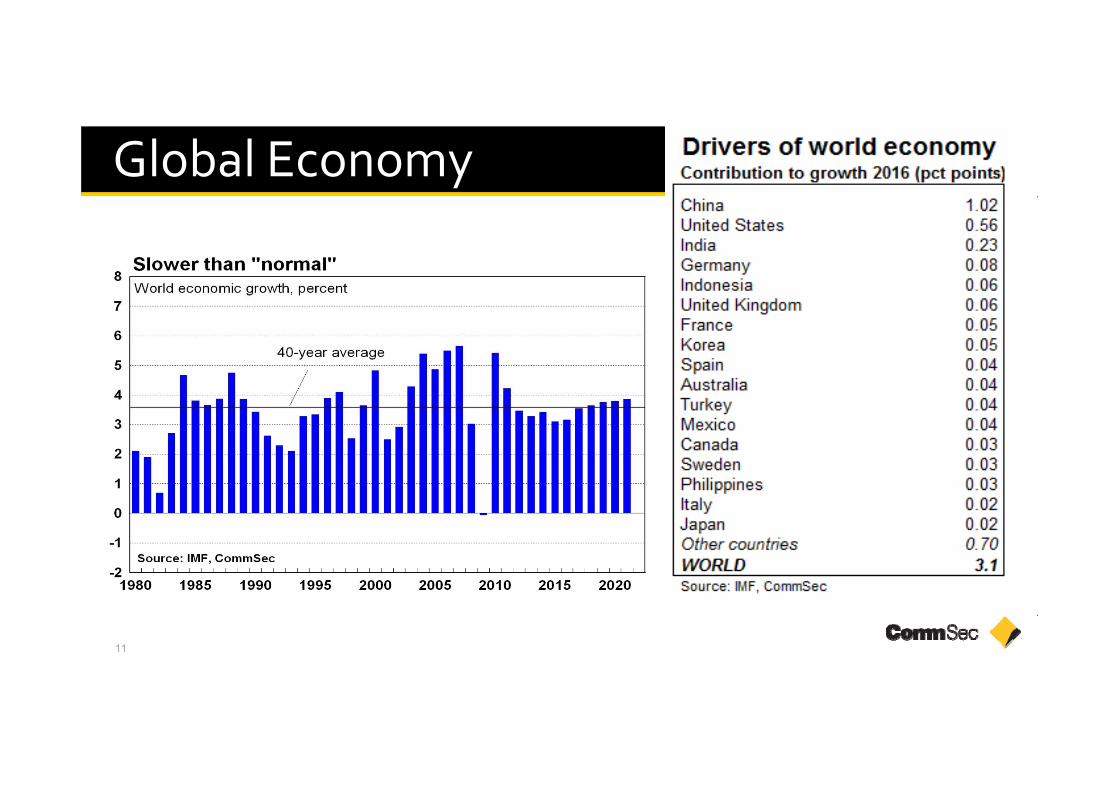
both May and August. The cash rate stands at 1.50 per cent. The global economy probably grew by 3.1 per cent in 2015, below the 40-year
average of 3.5 per cent. Growth of 3.4 per cent is tipped for 2016. The US Federal Reserve lifted interest rates in December for only the second
time in almost a decade. The Aussie dollar started the year near US73 cents and ended 2016 at US72.4
cents. The actual range in 2016 was US68.24c to US78.35c.

6
Year in Review Commodity prices lifted over 2016 with some notably sharp increases in the
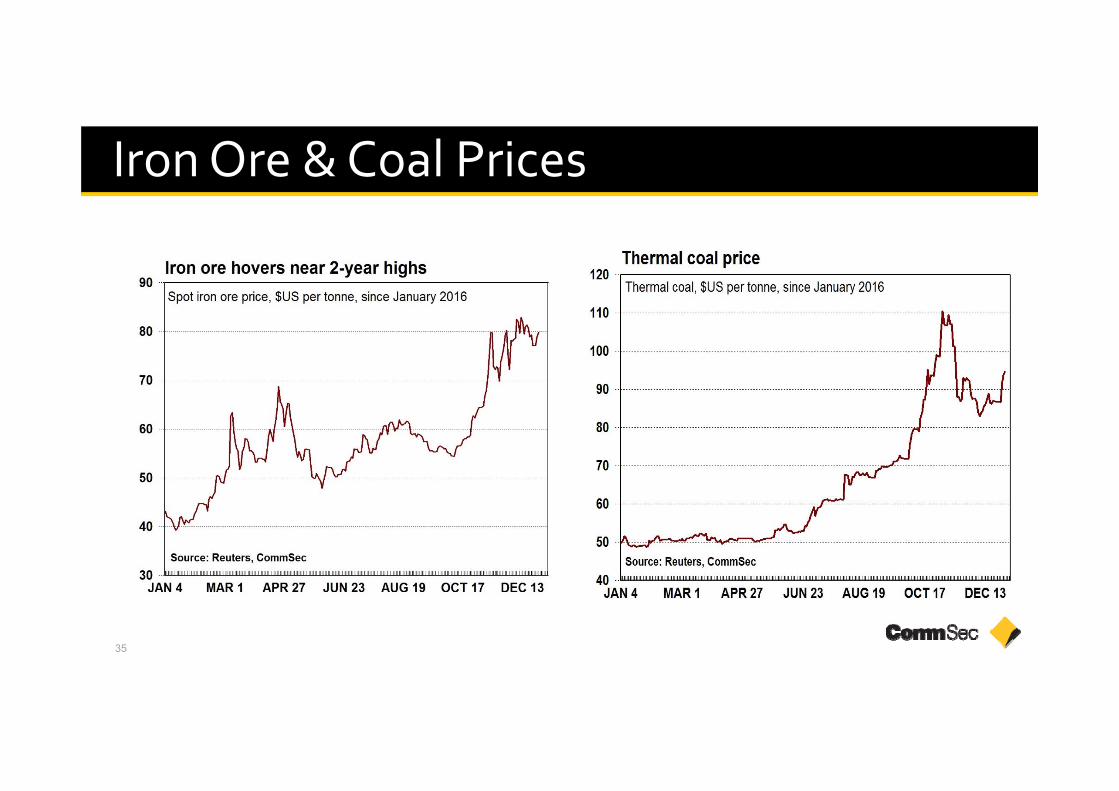
mining sector. Oil prices increased by 45 per cent over the year and doubled from the year’s lows. Iron ore prices rose 86 per cent with thermal coal up 87 per cent and coking coal futures rose by 156 per cent in Chinese yuan terms.
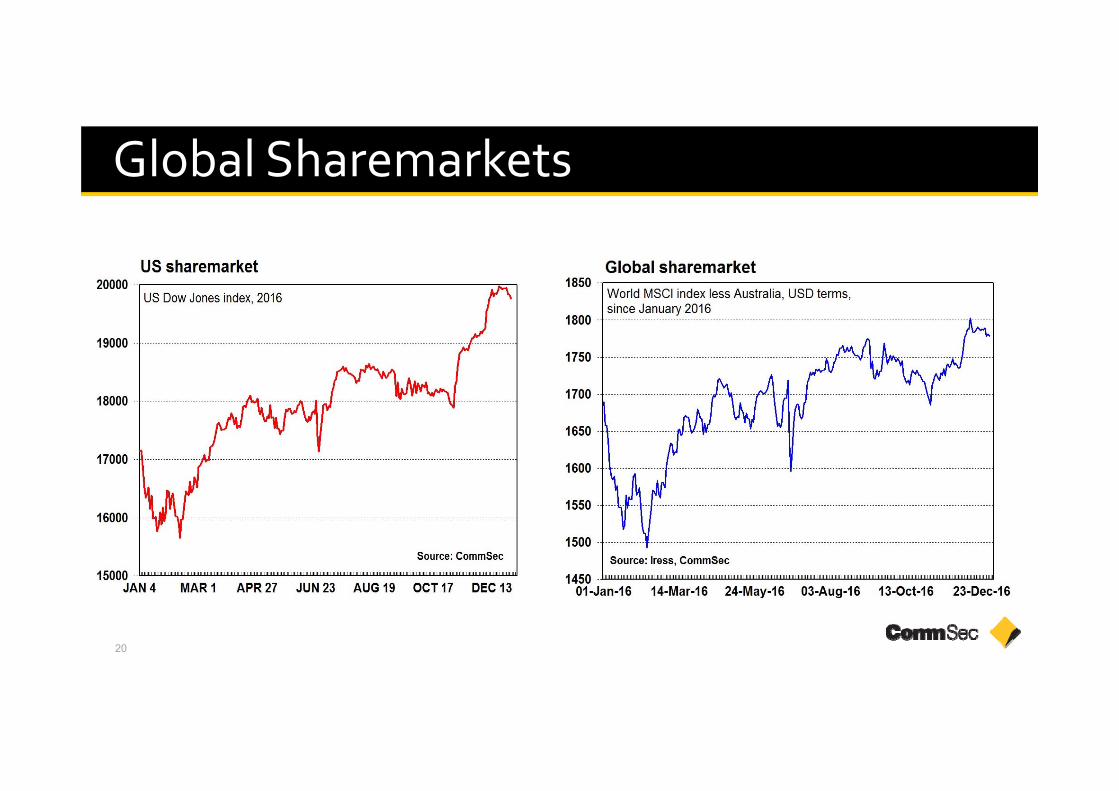
The Australian sharemarket (ASX 200) rose by 7.0 per cent in 2016 (All Ordinaries also rose by 7.0 per cent). The US Dow Jones lifted by 13.4 per cent in 2016 with the US S&P 500 index up by 9.5 per cent. In Europe, the UK FTSE rose by 14.4 per cent with the German Dax up 6.9 per cent. In Asia, the Japanese sharemarket rose by 0.4 per cent while China fell 12.3 per cent.
Total returns on Australian shares (share prices plus dividends) grew by 11.6 per cent in 2016 after rising by 3.8 per cent in 2015. Returns on government bonds rose by 2.5 per cent.

7
Year in Review The average gain on global sharemarkets in 2016 was 10 per cent.
Strongest was Venezuela, up 117 per cent. Australia was in 31st spot of 73 bourses. Only 22 markets fell in 2016. Worst performer was Kenya (down 21 per cent). Spain, Portugal and Denmark were other markets to fall in 2016.
The Capital Goods sector was the best performer on the Australian market (up 39.4 per cent) from Materials (up 39.1 per cent). Worst performer was Telecom (down 12 per cent) from Pharmaceuticals & BioTech (down 7.5 per cent). The MidCap50 was the strongest size category (up 13.5 per cent).
Only 26 of 120 currencies strengthened against the US dollar over 2016. The Brazilian real was strongest, up 17.8 per cent, from the Russian rouble, up 16 per cent. Weakest were the Syrian pound and Egyptian pound, both down around 130 per cent. The Australian dollar was in 54th spot in 2016.

8

9
Year in Review
Key financial indicators 2016: At a Glance
Dec 31 2015 High Low Dec 30 2016 % change
ASX 200 5,295.9 5,649.8 4,706.7 5,665.8 +7.0%
US Dow Jones 17,425.0 19,987.6 15,450.6 19,762.6 +13.4%
AUD/USD, US cents 73.06 78.35 68.24 72.36 -1.0%
90 day bank bills 2.38% 2.34% 1.72% 1.82% -
10 year bond yields 2.89% 2.87% 1.85% 2.77% -
Oil, US$ per barrel 37.04 54.51 26.05 53.72 +45.0%
Gold, US$ per ounce 1,060.20 1,374.9 1,063.20 1,151.70 +8.6%

10
Year in ReviewFINANCIAL MARKETS: 2016 IN DETAIL
% changeDec 30 2016Dec 31 2015% changeDec 30 2016Dec 31 2015
COMMODITIESAUSSIE SHARES85.379.5042.90Iron ore, $US per tonne7.05665.85295.9ASX 20087.294.7050.60Thermal coal, $A per tonne7.05719.15344.6All Ordinaries45.053.7237.04Oil, $US per barrel11.653354.047788.2Returns on Aussie shares8.61151.701060.20Gold, $US per ounce7.11355.001265.00Wool, Eastern market indicatorGLOBAL SHARES1.4396.90391.32Beef, US cents per kg13.419762.617425.0US Dow Jones
-13.2408.00470.00Wheat, $US cents per bushel9.52238.82043.9US S&P 5009.3192.5176.1CRB futures index5.31751.21662.8World index (MSCI)
AUSSIE ASSETSCURRENCIES2.59141.38917.4Return on government bonds-1.072.3673.06$US per $A, cents
12.71042.5924.7Return on residential property*-4.084.4787.98Yen per $Anc17.1615.9Price earnings Aussie shares2.868.7266.82Euro per $A, centsnc4.084.62Dividend yield Aussie shares-2.51.03971.0667$NZ per $A8.21938.31791.5Market size $bn, Aussie shares1.963.962.7Trade weighted index
GLOBAL PERSPECTIVESINTEREST RATES3.7102.498.7US dollar indexnc1.502.00Cash rate, %nc2.452.28US 10-year bond yield, %nc1.812.3890 day bank bills, %
nc2.062.063-year bond yields, %nc2.792.8910-year bond yields, %
Source: Reuters, iress, CommSec, * CoreLogic/RP Data to Novembe
11
Global Economy

12
United States

13
China

14
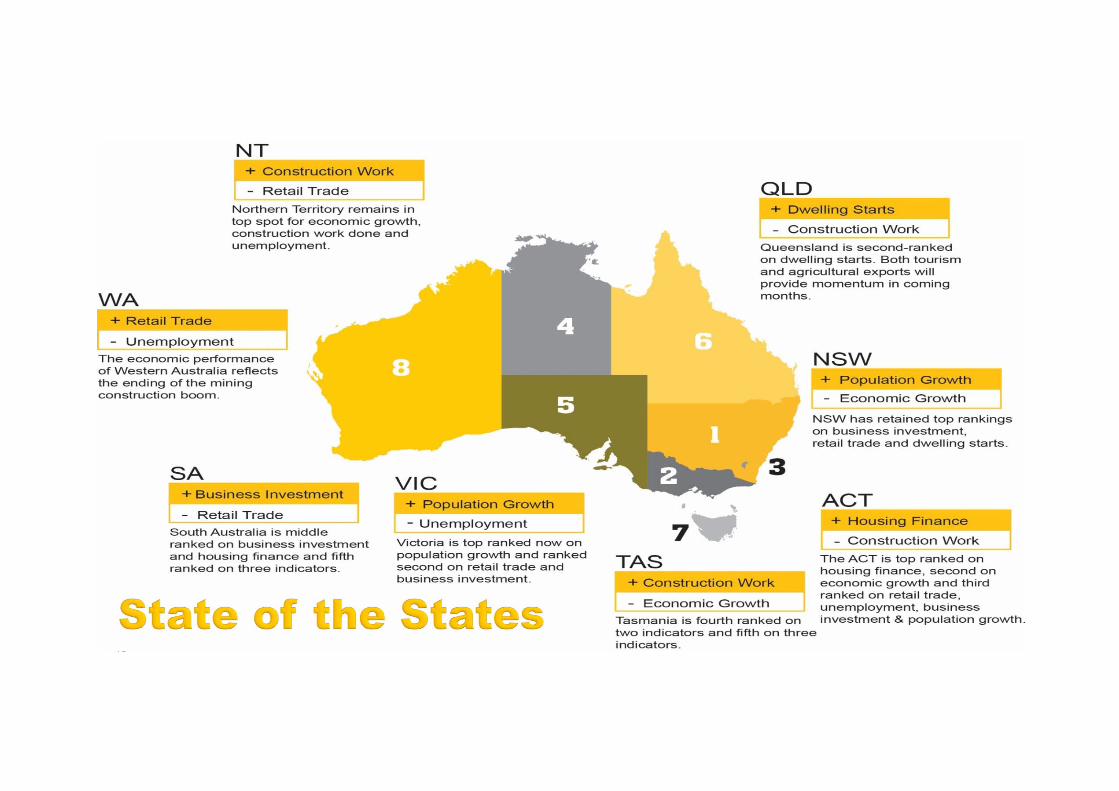
Australia
15

16
Prices and Wages

17
Job Market

18
Home Prices
19
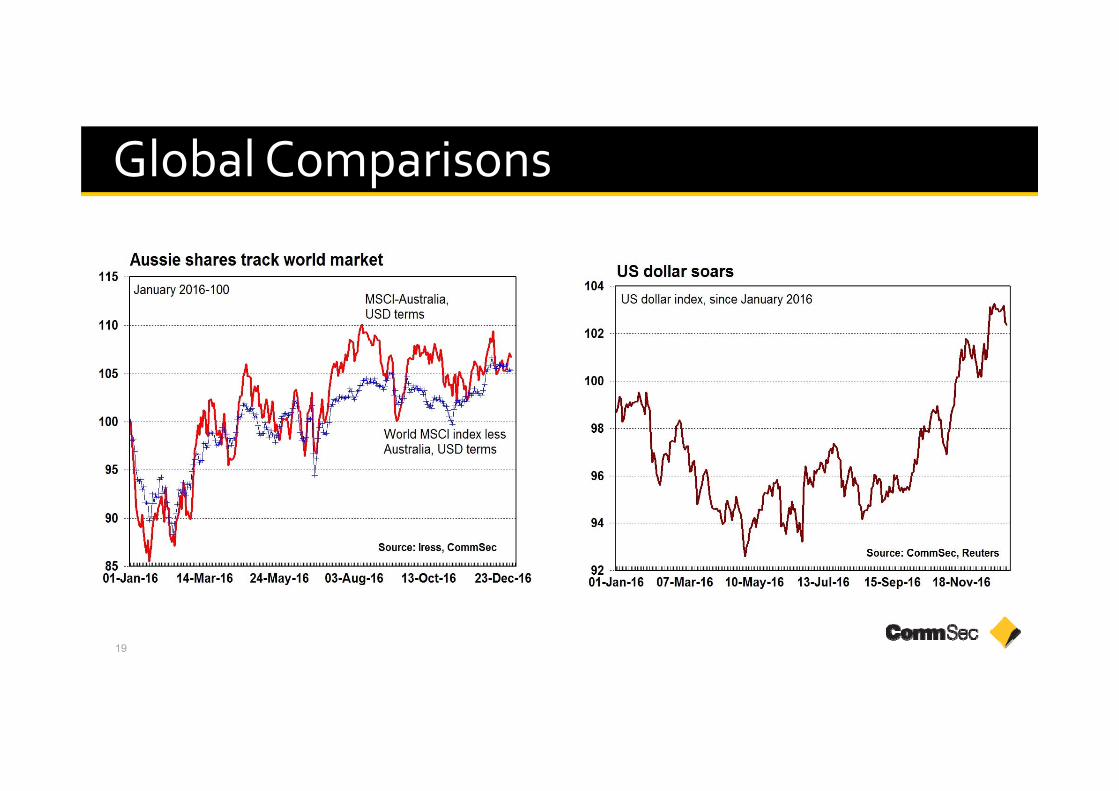
Global Comparisons
20
Global Sharemarkets

21
Australian Sharemarket

22
Australian Shares

23
Australian Industry Sectors
AUSTRALIAN INDUSTRY GROUPSpercent change 2016
7.4Real Estate39.4Capital goods7.0S&P/ASX 20039.1Materials6.3Insurance19.9Retailing1.7Software & services19.7Consumer durables & apparel0.9Food & staples retailing18.1Commercial & professional services0.7Banks13.7Utilities-2.4Transportation12.9Energy-3.0Diversified financials10.0Food beverage & tobacco-7.3Media9.4Auto & components-7.5Pharmaceuticals & biotechnology9.2Health Care Equipment & Services
-12.0Telecommunication services8.1Consumer servicesSource: Iress, CommSec

24
Australian Industry Sectors

25
Australian Industry Sectors
WINNERS AND LOSERSSector performance since 1986
Weakest performanceStrongest performanceWeakest performanceStrongest performancTechnology hardwareUtilities2002Consumer servicesMedia1986
InsuranceSoftware services2003Diversified financialsTransport1987Technology hardwareConsumer services2004InsuranceRetailing1988TelecommunicationsEnergy2005TransportRetailing1989
Health care equipmentPharmaceuticals & biotech2006RetailingUtilities1990Consumer durables & apparelPharmaceuticals & biotech2007InsuranceMedia1991
Diversified financialsPharmaceuticals & biotech2008TransportMedia1992Pharmaceuticals & biotechRetailing2009Commercial servicesTransport1993
Consumer durables & apparelAutomobiles & Components2010MediaRetailing1994Consumer durables & apparelTelecommunications2011TransportBanks1995
Capital goods Pharmaceuticals & biotech2012RetailingCommercial services1996Consumer durables & apparelMedia2013Consumer servicesFood & staples1997
Capital goods Consumer durables & appar2014EnergyTelecommunications1998EnergyAutomobiles & Components2015InsuranceTechnology hardware1999
TelecommunicationsCapital goods 2016Software servicesUtilities2000Technology hardwareCapital goods 2001
Source: CommSec

26
Australian StocksASX 200 losers 2016, % lossASX 200 winners 2016, % gain
-64.6Sirtex MedicalSRX420.0Resolute MiningRSG-62.2Estia HealthEHE356.5Galaxy ResourcesGXY-52.6BlackmoresBKL272.9Whitehaven CoalWHC-50.9Bellamy's AustraliaBAL215.0Fortescue MetalsFMG-47.8Vocus CommunicationsVOC202.2Mineral ResourcesMIN-44.1Nine EntertainmentNEC158.2South32S32-42.7Bega CheeseBGA109.9Worley ParsonsWOR-42.3IPH LtdIPH109.5Bluescope SteelBSL-40.6Isentia GroupISD104.6Infigen EnergyIFN-39.0Mantra GroupMTR97.0OrocobreORE
Source: iress, CommSec

27
Large versus small stocks

28
Australian Returns

29
Australian Interest Rates

30
Australian Interest Rates

31
Australian Dollar

32
Australian Dollar

33
Commodity Prices

34
Oil & Gold Prices
35
Iron Ore & Coal Prices

36
Outlook for 2017 Global Economy: The International Monetary Fund tips global economic
growth to lift from 3.1 per cent in 2016 to 3.4 per cent in 2016. United States: The US economy is expected to post solid growth over 2017.
Interest rates still remain historically-low and the Federal Reserve will be guided by inflation on future rate hikes. Fiscal policy is also expected to be expansionary in the Trump presidency with tax cuts and infrastructure spending both mooted.
China: The transition is still underway from an economy driven by production/exports to one driven by consumer spending. The economy is growing at a 6.7 per cent annual rate, down slightly from 6.8 per cent growth in 2015. Growth will naturally slow over time in line with the maturation of the economy and slower population growth.

37
Outlook for 2017 Europe & Japan: Constrained by flat/negative population growth and
deflationary forces, European and Japanese economies are likely to face ongoing challenges in 2016. A number of European countries face elections, adding to economic risks.
Oil producers: Major OPEC and non-OPEC have agreed to restrict production in order to support prices near US$50-55 a barrel. Investors will closely watch compliance with the production targets.
Australia: We expect economic growth around 2.25-2.75 per cent in 2017, similar growth to 2016. The “full employment” rate of growth is around 2.75-3.00 per cent. Inflation is expected to drift higher towards 2.0 per cent over 2017 but globalisation will continue to cap growth of prices. Unemployment should consolidate between 5.25-5.75 per cent.

38
Outlook for 2017 Australian dollar: Last year we noted: “Using the same methodology as last
year, a possible range for the Aussie dollar would be US63-77 cents.” Over the past 20 years, the Aussie dollar has, on average, tracked in a US13.7 cent range. The actual range in 2016 was US68.24c to US78.35c. We expect a trading range in 2017 of US67-79 cents.
Interest rates: Over 2016, the cash rate has averaged 1.73 per cent – a record low. The cash rate is currently 1.50 per cent and we expect that it will remain unchanged over the year. If rates were to move anywhere in the short-term it would be down. But the longer that rates are left on hold and economic momentum lifts as expected, then thoughts will turn to “normalising” rates –edging rates higher.

39
Outlook for 2017 Sharemarket: Last year we thought that the All Ordinaries would end 2016
between 5,500-5,700 points. So the prediction was largely realised, although with a lot of help from the so-called “Trump bump” from early November. It’s worth noting that the All Ords was sitting at 5,238 points on November 9.
In 2017 the sharemarket is expected to post modest growth. Share prices may lift around 4 per cent while dividends will lift by a similar magnitude. The main focus will be on the US and the economic direction set by the new administration. The transition of the Chinese economy will continue with bottom-line growth near 6.5 per cent. Nominal growth of the domestic economy will be around 4-6 per cent, limiting profit growth and thus sharemarket returns. The All Ordinaries is expected to end 2017 between 5,850-6,100 points.

40
Outlook for 2017 Over the past three years, we, like other forecasters such as the Reserve
Bank and the International Monetary Fund, have been slightly too optimistic. The key influence has been weak growth of prices, making businesses more reticent about investing and hiring, and therefore inducing consumer conservatism.
But in 2017 there is the prospect of reflationary economic policies being employed in the US. China is also keen to maintain firm growth of the economy. The hope is that oil prices stabilise also near US$50-55/barrel.
Housing: As more new homes are completed, the housing market will transition from “under-supply” to more balanced conditions between supply and demand. The concern is that some regions may actually transition to “over-supply”, especially boosted by the the supply of new apartments.

41
Outlook for 2017
FORECASTS20172016
2.25-2.75%2.50%Economic Growth1.50-2.00%1.50%Underlying inflation5.25-5.75%5.70%Unemploymentend 2017mid 2017
1.25-1.50%1.25-1.50%Cash rate5,850-6,1005,700-5,900Sharemarket (All Ords)US70-79cUS67-78cAustralian dollar