cradle to career (p20) framework presentation to leaders roundtable november 24, 2009 pat burk...
Post on 19-Dec-2015
214 views
TRANSCRIPT

Cradle to Career (P20) Framework
Presentation to Leaders RoundtableNovember 24, 2009
Pat BurkMaxine Thompson
1
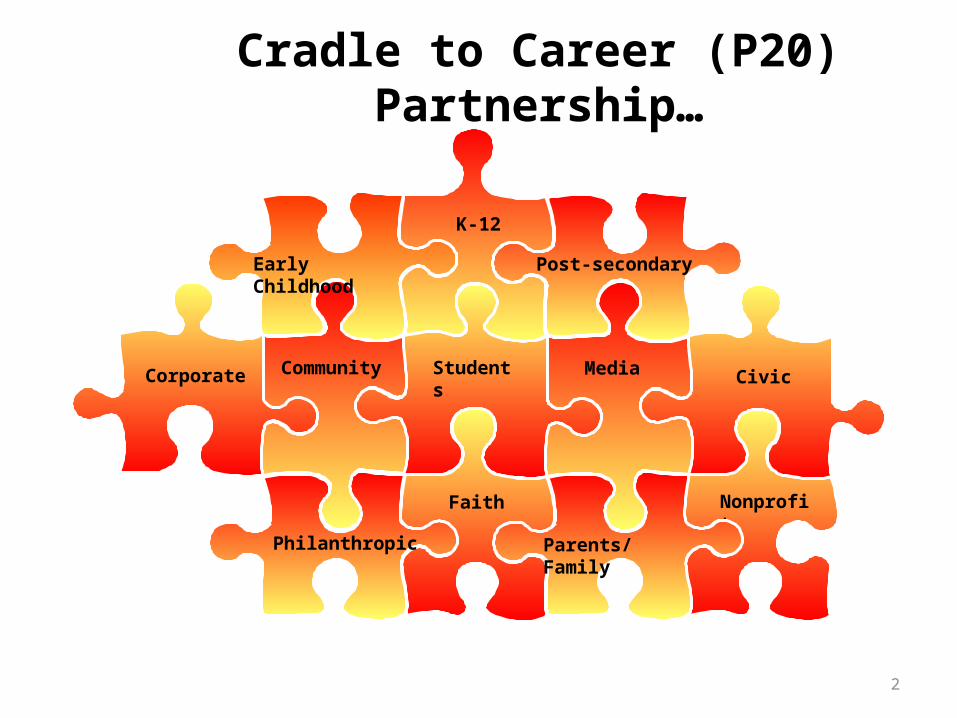
CommunityCorporate
Post-secondary
Media Civic
Faith Nonprofit
K-12
Parents/Family
Early Childhood
Philanthropic
Students
Cradle to Career (P20) Partnership…
2

Cradle to Career (P20)Framework
PurposeCreate a partnership that brings together educators and community leaders at all levels to weave together systems and strategies to maximize student potential from cradle to career.
VisionSuccessful students who become productive citizens contributing to thriving communities.
MissionEvery student has the opportunity to maximize her/his potential from cradle to career.
3

Partnership Goals
A Framework Centered on Five Common Goals
EVERY student will:
1. Be PREPARED for school 2. Be SUPPORTED inside and outside school3. SUCCEED academically4. ENROLL in some form of college5. GRADUATE and enter a career
Agreed upon outcome measures that align with these five goals will be reported to the community on an annual basis in a
Community Report Card 4

Partnership Commitments
• Develop a set of academic and community indicators that are measured and reported publicly
• Coordinate resources around cradle to career vision to improve specific student/community outcomes
• Improve effectiveness by ensuring data is used to build on evidence-based practices and innovate as necessary
• Advocate for funders, policymakers, and the community to support what works
• Engage community partners in developing shared indicators
Catalyst for Change
5

Guiding Principles
-- Not a new initiative or program
-- Collect and use common data
-- Evidence based
-- Unite likeminded organizations
-- Support and strengthen strategies that work
-- Capitalize on the role of post secondary institutions
-- Utilize existing leadership wherever possible & build on what is working now
-- Inform & engage the community around what works for kids
6

Community engagement conversations. . .
Grantmakers of Oregon & SW WashingtonNW Natural
IncightCoalition for Teaching & Learning
Oregon MentorsChildren’s Institute
PSU Council of Academic Deans, Inst. Of Portland-Metro StudiesStep it Up
I Have A Dream FoundationUrban League
Oregon Community FoundationEcoNorthwest
Multnomah County superintendentsOregon Dept. of Human Services
And more . . .
7

Indicating Success
8
Exploring Our Goals
Be PREPARED for school
Be SUPPORTED inside and outside school
SUCCEED academically
ENROLL in some form of college
GRADUATE and enter a career
9

For some of the goal areas we have fairly concrete data, such as . . .
10

Goal: 3
Be PREPARED for school
Be SUPPORTED inside and outside school
SUCCEED academically
ENROLL in some form of college
GRADUATE and enter a career
11
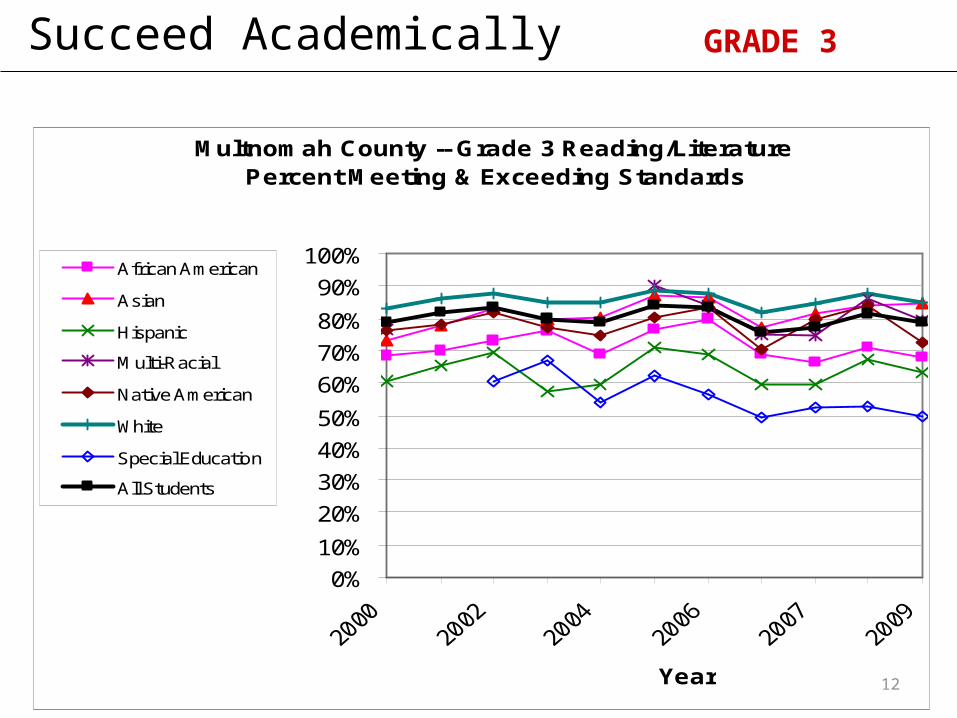
Succeed Academically GRADE 3
Multnomah County -- Grade 3 Reading/LiteraturePercent Meeting & Exceeding Standards
0%
10%
20%
30%
40%
50%
60%
70%
80%
90%
100%
Year
African American
Asian
Hispanic
Multi-Racial
Native American
White
Special Education
All Students
12

Succeed Academically
Multnomah County -- Grade 5 Reading/LiteraturePercent Meeting & Exceeding Standards
0%
10%
20%
30%
40%
50%
60%
70%
80%
90%
100%
Year
African American
Asian
Hispanic
Multi-Racial
Native American
White
Special Education
All Students
GRADE 5
13

Succeed Academically
Multnomah County -- Grade 8 Reading/LiteraturePercent Meeting & Exceeding Standards
0%
10%
20%
30%
40%
50%
60%
70%
80%
90%
100%
Year
African American
Asian
Hispanic
Multi-Racial
Native American
White
Special Education
All Students
GRADE 8
14
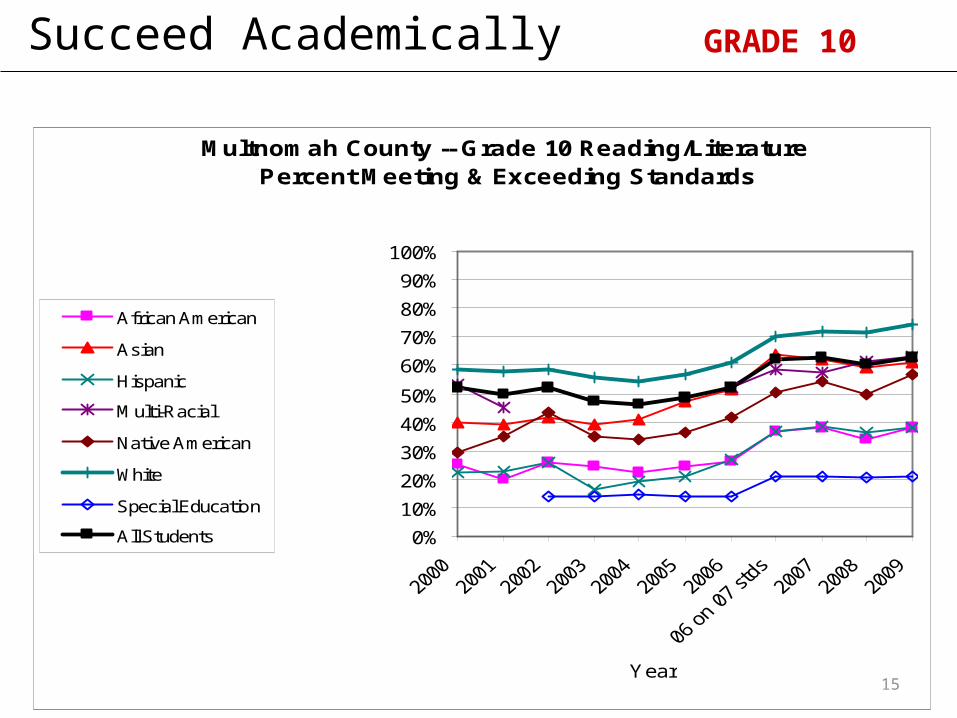
Succeed Academically
Multnomah County -- Grade 10 Reading/LiteraturePercent Meeting & Exceeding Standards
0%
10%
20%
30%
40%
50%
60%
70%
80%
90%
100%
Year
African American
Asian
Hispanic
Multi-Racial
Native American
White
Special Education
All Students
GRADE 10
15

Multnomah County -- Grade 3 MathematicsPercent Meeting & Exceeding Standards
0%
10%
20%
30%
40%
50%
60%
70%
80%
90%
100%
Year
African American
Asian
Hispanic
Multi-Racial
Native American
White
Special Education
All Students
Succeed Academically GRADE 3
16
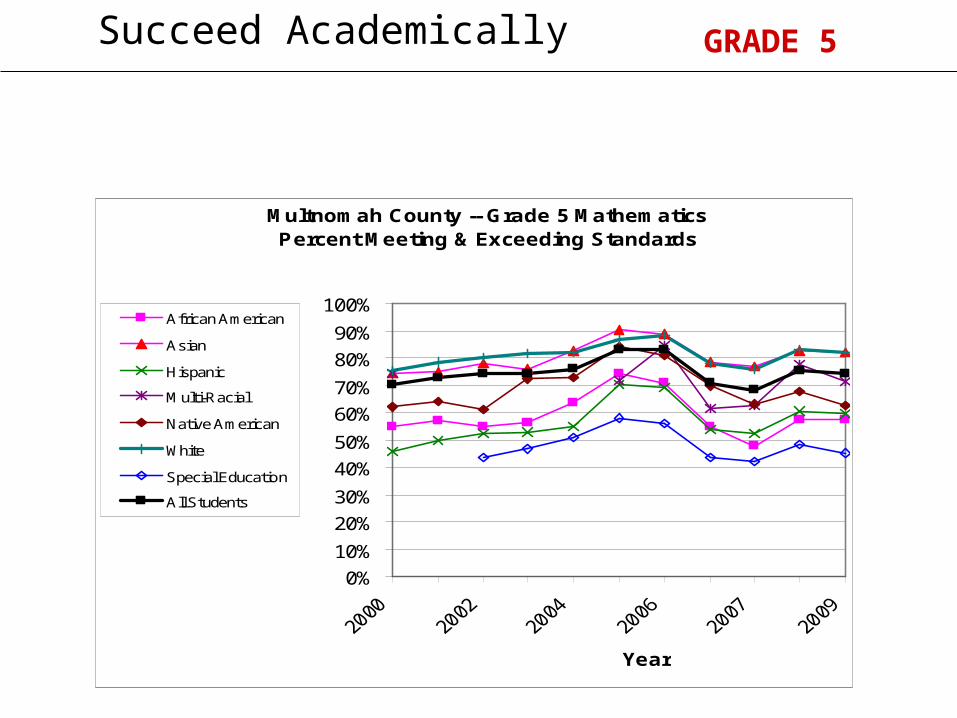
Multnomah County -- Grade 5 MathematicsPercent Meeting & Exceeding Standards
0%
10%
20%
30%
40%
50%
60%
70%
80%
90%
100%
Year
African American
Asian
Hispanic
Multi-Racial
Native American
White
Special Education
All Students
Succeed Academically GRADE 5

Multnomah County -- Grade 8 MathematicsPercent Meeting & Exceeding Standards
0%
10%
20%
30%
40%
50%
60%
70%
80%
90%
100%
Year
African American
Asian
Hispanic
Multi-Racial
Native American
White
Special Education
All Students
Succeed Academically GRADE 8

Multnomah County -- Grade 10 MathematicsPercent Meeting & Exceeding Standards
0%
10%
20%
30%
40%
50%
60%
70%
80%
90%
100%
Year
African American
Asian
Hispanic
Multi-Racial
Native American
White
Special Education
All Students
Succeed Academically GRADE 10
19

Multnomah County Dropout Rates by Race/Ethnicity--Grades 9-12 1997-98 to 2006-07
5.6 ALL STUDENTS7.1 White
African American8.6
Hispanic14.7
Asian/Pac ls4.4
Native American12.7
0.0
5.0
10.0
15.0
20.0
25.0
30.0
35.0
1997-98
1998-99
1999-00
2000-01
2001-02
2002-03
2003-04
2004-05
2005-06
2006-07
Between 1997-98 and 2006-07, dropout rates declined for all race/ethncities. Between 2005-06 and 2006-07, dropout rates for all race/ethnicities increased. Note: Beginning in 1997-98, GED recipients were not counted as dropouts.
Drop
out R
ate

Succeed Academically GOAL 3
21

0 100 200 300 400 500 600
SAT Score
Read08
Read09
Math08
Math09
Writing08
Writing09
Average Score and Year
SAT Results: 2008-2009
SAT Tests: Multnomah County

Hispanic-White Student Performance: Oregon
Succeed academically GOAL 3
25

Succeed academically GOAL 3
26

Succeed academically GOAL 3
27

State of Black OregonThe Urban League of Portland• During 2006-07, Black high school students were
nearly twice as likely as White students to be expelled or suspended.
• The Black-White Difference share of students meeting or exceeding state benchmarks grows dramatically with grade level.
• 68 percent of Black students graduate on time compared with 85 percent of White students
• 32 percent of the Black graduating class of 2006 have enrolled in an Oregon public university or college (through Spring 2008); compared with 47 percent of white students.
Succeed academically GOAL 3
28

State of Black OregonThe Urban League of Portland
•Recommendations:•Attack the achievement gap before it starts•Invest aggressively in pre-kindergarten•Require all school districts to develop equity plans•Assess student progress frequently and intervene at key stages•Provide the best teachers to the students with the greatest learning needs.
•Ensure that staff are culturally competent•Ensure that students stay in school.•Make classes more engaging and relevant.•Support and expand education initiatives that work for African American Students.
Succeed academically GOAL 3
29

Succeed academically GOAL 3
30

GOAL 3
32
Lost opportunity . . .
50 state report on opportunity to learn in America
The Schott Foundation for Public Education
http://www.schottfoundation.org/
33
34


Central question: There is an abundance of data points available.• How do we proceed to identify the critical
indicators related to each goal area? • How should we establish agreement on the
data elements that are most meaningful in the cradle to career framework?
36

Goal: 4
Be PREPARED for school
Be SUPPORTED inside and outside school
SUCCEED academically
ENROLL in some form of college
GRADUATE and enter a career
37

• What do we know about the numbers “enrolling in some form of college”?
• How do we identify the data points that are most likely to generate synergy across multiple organizations and school districts?
• How do we identify the data points most meaningful to strategic planning and communication?
38

Academic indicators are available. In other goal areas the data are much less concrete and/or scattered amongst a number of institutions, e.g. . . .– Students entering private and out-of-state colleges
and universities.– Students entering industry-based training program
not associated with an educational institution.– Community-based Organizations have a wealth of
data on their particular area of focus.
39
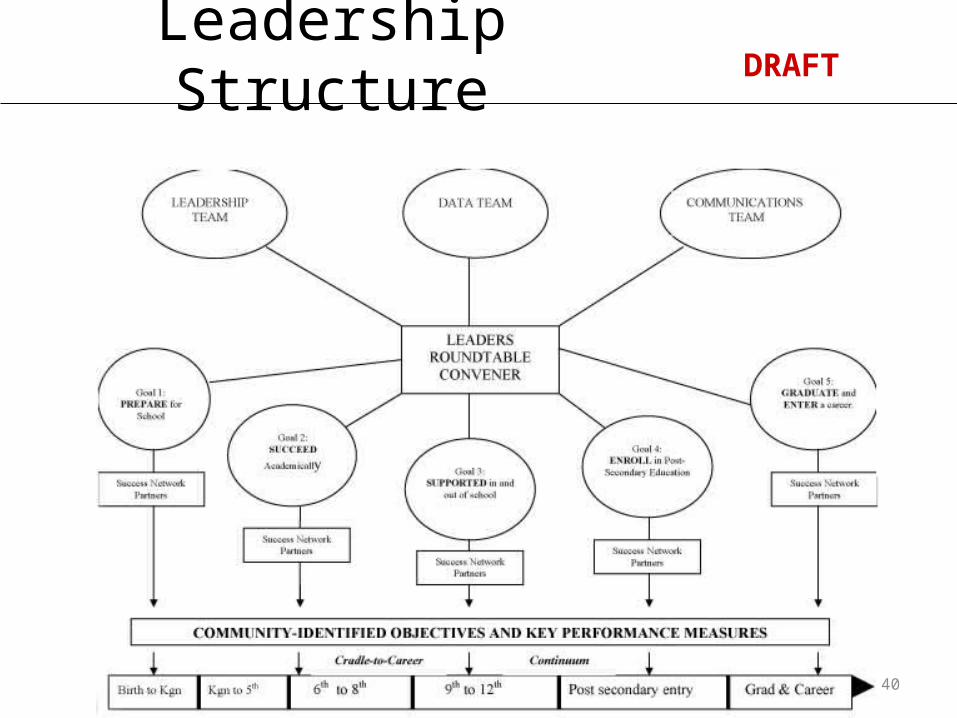
Leadership Structure DRAFT
40

Questions?
41