cracks in base-restrained plain and reinforced concrete...
TRANSCRIPT
Turkish J. Eng. Env. Sci.34 (2010) , 215 – 230.c© TUBITAKdoi:10.3906/muh-1004-127
Cracks in base-restrained plain and reinforced concrete walls
Kheira OUZAA, Mohammed Benali BENMANSOURFaculty of Architecture and Civil Engineering, University of Sciences and Technology Mohamed Boudiaf,
BP 1505 El M’Naouer, 31000 Oran-ALGERIAe-mail: kh [email protected]
Received 28.04.2010
Abstract
This study deals with the problem of shrinkage cracks in reinforced concrete walls restrained at the base.
A finite element model to study cracking of the wall was proposed. Nonlinear behavior of concrete was
considered by means of a smeared crack approach. The equations proposed by ACI Committee 209 were
used to model the mechanical properties of concrete, as well as the average concrete shrinkage within the
thickness of the wall. It was found that the suggested model closely predicts the true behavior of cracking
in base-restrained concrete walls, including the crack pattern and crack propagation.
Key Words: Wall, reinforced concrete, horizontal reinforcement, shrinkage, cracking
Introduction
Volume changes due to shrinkage are significantly important because, in practice, these movements are usuallypartly or wholly restrained; therefore, they induce stresses. Once the tensile strength of the concrete is exceeded,a crack will develop.
Cracks in concrete are undesirable because they are unsightly. They impair structural durability, increasepermeability, and reduce strength.
The control of shrinkage cracks in reinforced concrete walls has been investigated by many researchers.Carlson and Reading (1988) developed a technique for determining shrinkage stresses in concrete building
walls using rubber models. Kheder et al. (1994) studied the problem of cracking due to volume change ofbase-restrained reinforced concrete walls. Their crack prediction formula is based on the theory of change inrestraint during the crack formation. Stoffers (1978) presented the problem of cracking due to shrinkage andtemperature variation in walls. He based his derivations on the fact that the crack spacing in base-restrainedconcrete walls is determined by the effect of the restraining base and not by any reinforcement that may bepresent in the wall. Kheder et al. (1990) presented the strategic reinforcement for controlling volume changecracking in base-restrained concrete walls. Their works are based on the use of finite element analysis to obtainthe diagrams of distribution of restraint factor in walls with different length-to-height ratios. These diagrams areused to determine the amount and the distribution of steel reinforcement in a position effective for controllingcracking. Kianoush et al. (2008) studied the cracking behavior of reinforced concrete walls under restrained
volumetric deformations using the computer program ABAQUS/6.4, which is an FE-based program.
215
OUZAA, BENMANSOUR
The objective of the present work was to study the phenomenon of shrinkage cracks in base-restrainedplain and reinforced concrete walls.
A finite element method was developed and used to find the degree of restraint, sequence, and distributionof cracks and the effect of the horizontal reinforcement (HR) of the wall using a rectangular 4-node element.The suggested model includes material nonlinearity, smeared crack representation, tension stiffening, stressdegradation of concrete in the parallel crack direction, and shear retention of concrete on the cracked surface.
Concrete Representation
Reinforced concrete walls were modeled by 4-node rectangular elements using the following polynomial functionsfor the assumed displacement field:
u = α1 + α2x + α3y + α4xy (1)
v = α5 + α6x + α7y + α8xy (2)
where u and v are the displacement in (x) and (y) directions, and α1 , α2 , α3 , α4 , α5, α6,α7 , and α8 are the
coefficients of the displacement field.
Prior to cracking, the concrete was assumed to be isotropic, homogenous, and linearly elastic; thus, thestress-strain relations for the plane stress were:
⎧⎨⎩
σx
σy
τxy
⎫⎬⎭ =
Ec(t)1 − ν2
⎛⎝ 1 ν 0
ν 1 00 0 1−ν
2
⎞⎠
⎧⎨⎩
εx
εy
γxy
⎫⎬⎭ (3)
in which σx , σy , and τxy are the stresses of concrete in global coordinates; εx , εy , and γxy are the strains of
concrete in global coordinates; Ec (t) is the modulus of elasticity of concrete at time t; and υ is Poisson’s ratioof concrete.
ACI Committee 209 (ACI, 1990) proposed the equations for predicting the compressive strengthf ′c (t) ,
direct tensile strengthf ′t (t) , and modulus of elasticity Ec (t) at time t:
f ′c (t) =
t
4 + 0.85tf ′
c (28) (4)
f ′t (t) = 0.007
√wf ′
c (t) (5)
Ec (t) = 0.043w1.5√
f ′c (t) (6)
where f ′c (28) is the 28-day compressive strength, w is the concrete unit weight in kg/m3 , and f ′
c (t) ,f ′t (t), and
Ec (t) are measured in MPa.
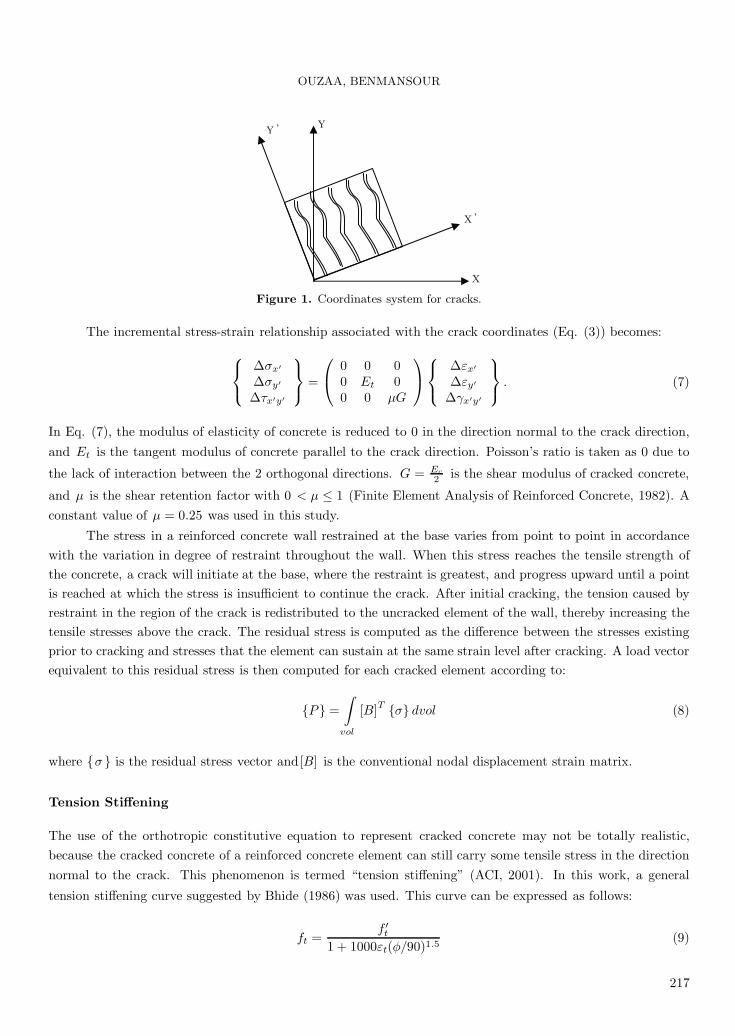
Smeared crack representations treat concrete as an orthotropic material with principal axes normal andparallel to the crack direction (Figure 1).
216
OUZAA, BENMANSOUR
YY ’
X
X ’
Figure 1. Coordinates system for cracks.
The incremental stress-strain relationship associated with the crack coordinates (Eq. (3)) becomes:
⎧⎨⎩
Δσx′
Δσy′
Δτx′y′
⎫⎬⎭ =
⎛⎝ 0 0 0
0 Et 00 0 μG
⎞⎠
⎧⎨⎩
Δεx′
Δεy′
Δγx′y′
⎫⎬⎭ . (7)
In Eq. (7), the modulus of elasticity of concrete is reduced to 0 in the direction normal to the crack direction,and Et is the tangent modulus of concrete parallel to the crack direction. Poisson’s ratio is taken as 0 due to
the lack of interaction between the 2 orthogonal directions. G = Ec
2 is the shear modulus of cracked concrete,
and μ is the shear retention factor with 0 < μ ≤ 1 (Finite Element Analysis of Reinforced Concrete, 1982). Aconstant value of μ = 0.25 was used in this study.
The stress in a reinforced concrete wall restrained at the base varies from point to point in accordancewith the variation in degree of restraint throughout the wall. When this stress reaches the tensile strength ofthe concrete, a crack will initiate at the base, where the restraint is greatest, and progress upward until a pointis reached at which the stress is insufficient to continue the crack. After initial cracking, the tension caused byrestraint in the region of the crack is redistributed to the uncracked element of the wall, thereby increasing thetensile stresses above the crack. The residual stress is computed as the difference between the stresses existingprior to cracking and stresses that the element can sustain at the same strain level after cracking. A load vectorequivalent to this residual stress is then computed for each cracked element according to:
{P } =∫
vol
[B]T {σ} dvol (8)
where {σ } is the residual stress vector and[B] is the conventional nodal displacement strain matrix.
Tension Stiffening
The use of the orthotropic constitutive equation to represent cracked concrete may not be totally realistic,because the cracked concrete of a reinforced concrete element can still carry some tensile stress in the directionnormal to the crack. This phenomenon is termed “tension stiffening” (ACI, 2001). In this work, a general
tension stiffening curve suggested by Bhide (1986) was used. This curve can be expressed as follows:
ft =f ′
t
1 + 1000εt(φ/90)1.5(9)
217
OUZAA, BENMANSOUR
where ft and εt are respectively the average tensile stress and the average tensile strain normal to the crackdirection, f ′
t is the maximum tensile strength of concrete, and Φ is measured in degrees counterclockwise fromthe steel direction to the crack direction.
Stress Degrading Effect for Concrete Parallel to the Crack Direction
After cracking has taken place, the concrete parallel to the crack direction is still capable of resisting eithertensile or compressive forces. When it is subjected to tension, a pure linear elastic behavior is assumed (Figure
2), and Et is taken as Ec (t) in Eq. (7). On the other hand, when concrete is subjected to compression,
experimental results (Vecchio and Collins, 1982; Maekawa and Okamura, 1983) show that the tensile crackscause damage to the concrete with the transverse tensile strain, having a degrading effect not only on thecompressive strength but also on the compressive stiffness.
Several formulas (Vecchio and Collins, 1982; Cervenka, 1985; Vecchio and Collins, 1986) have beenproposed to determine the degraded maximum compressive strength fcm for concrete parallel to the crackdirection. The experimentally determined relationship suggested by Vecchio and Collins (1986) was used in thisstudy:
fcm
f ′c
=1
0.8 + 0.34 εt
ε0
≤ 1 (10)
where ε0 is the strain corresponding to the maximum concrete compressive strength f ′c . After the peak strength
fcm is determined, the stress-strain curve suggested by Saenz (1964) is used to calculate the concrete compressivestress fc :
fc =Ecε
1 + (R + RE−2) εε0
− (2R− 1)(
εε0
)2
+ R(
εε0
)3 (11)
where
R =RE (Rσ − 1)(Rε − 1)2
− 1Rε
, RE =Ec
E0, E0 =
fcm
ε0, Rσ = 4, Rε = 4 (12)
in which R and RE are the ratio relation and the modulus ratio, E0 is the secant modulus of elasticity at fc
for concrete, and Rσ and Rε are respectively the stress and strain ratio.
The tangent modulus Et used in Eq. (7) can be found by differentiating Eq. (11):
Et =dfc
dε=
Ec
[1 + (2R − 1)
(εε0
)2
− 2R(
εε0
)3]
[1 + (R + RE−2)
(εε0
)− (2R − 1)
(εε0
)2
+ R(
εε0
)3]2 . (13)
218

OUZAA, BENMANSOUR
E0
ε 0ε− fε−
1
1
Ec
'tf
cff−
cmf−
cf
Figure 2. Stress-strain curve for concrete parallel to the crack direction.
Reinforced Concrete Representation
The material stiffness of the composite element is obtained by superposition of the material stiffness of theindividual material components, concrete and reinforcement.
A stress-strain relationship for the element can be written in the following form (Chen, 1982):
{σt} = [D] {εt} (14)
where the total stress vector {σt} and the total strain vector {εt} can be defined as follows:
{σt} =
⎧⎨⎩
σx
σy
τxy
⎫⎬⎭ and {εt} =
⎧⎨⎩
εx
εy
γxy
⎫⎬⎭ . (15)
[D] is the composite material stiffness matrix. The strains are similar for the 2 components, steel and concrete,while the total stress vector is the sum of the component stress vectors:
{σt} = {σc} +N∑
i=1
{σ}i (16)
where {σc} is the concrete stress vector and {σ}i is the stress vector for the i th steel layer.
Stresses {σt} , {σc} , and {σ}i act on the unit area of the composite cross section. It can be noted that
the total stresses {σt} do not represent real stresses, but rather internal forces acting on a composite element.These stresses can be found from the strain as follows:
{σc} = [Dc] {εt} (17)
{σ}i = [D]i {εt} (18)
in which [Dc] is the material stiffness matrix for the concrete component and [D]i is the material stiffness
matrix for the i th steel layer. By substituting Eqs. (17) and (18) into Eq. (16), and then comparing Eq. (14)
with Eq. (16), the total material stiffness matrix can be evaluated as follows:
[D] = [Dc] +N∑
i=1
[D]i. (19)
219
OUZAA, BENMANSOUR
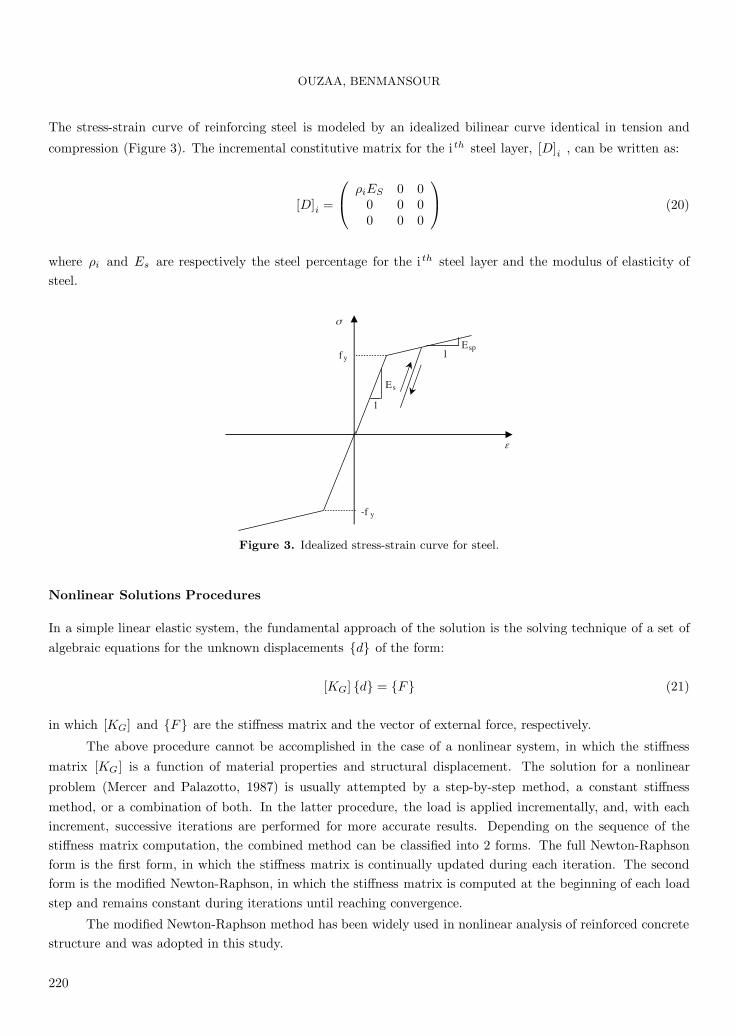
The stress-strain curve of reinforcing steel is modeled by an idealized bilinear curve identical in tension and
compression (Figure 3). The incremental constitutive matrix for the i th steel layer, [D]i , can be written as:
[D]i =
⎛⎝ ρiES 0 0
0 0 00 0 0
⎞⎠ (20)
where ρi and Es are respectively the steel percentage for the i th steel layer and the modulus of elasticity ofsteel.
f y
Es
ε
-f y
1
σ
1 Esp
Figure 3. Idealized stress-strain curve for steel.
Nonlinear Solutions Procedures
In a simple linear elastic system, the fundamental approach of the solution is the solving technique of a set ofalgebraic equations for the unknown displacements {d} of the form:
[KG] {d} = {F } (21)
in which [KG] and {F } are the stiffness matrix and the vector of external force, respectively.
The above procedure cannot be accomplished in the case of a nonlinear system, in which the stiffnessmatrix [KG] is a function of material properties and structural displacement. The solution for a nonlinear
problem (Mercer and Palazotto, 1987) is usually attempted by a step-by-step method, a constant stiffnessmethod, or a combination of both. In the latter procedure, the load is applied incrementally, and, with eachincrement, successive iterations are performed for more accurate results. Depending on the sequence of thestiffness matrix computation, the combined method can be classified into 2 forms. The full Newton-Raphsonform is the first form, in which the stiffness matrix is continually updated during each iteration. The secondform is the modified Newton-Raphson, in which the stiffness matrix is computed at the beginning of each loadstep and remains constant during iterations until reaching convergence.
The modified Newton-Raphson method has been widely used in nonlinear analysis of reinforced concretestructure and was adopted in this study.
220
OUZAA, BENMANSOUR
Convergence criteria
The iterative technique used in the present problem was to decide whether the current iteration was sufficientlyclose to the exact solution. The convergence criteria for nonlinear structural problems can usually be classifiedas displacement convergence and force convergence.
The force convergence criterion was adopted in this work, supposing that the first cracks appear when theconcrete load reaches its ultimate value (nonlinear elastic behavior). The violation of equilibrium is estimatedby the magnitude of the residual unbalanced nodal forces, which are calculated during each iteration as follows(Aldstedt and Bergan, 1978):
{Δf} = {F } − {I} (22)
where {Δf} is the vector of residual unbalanced nodal force, {F } is the applied load vector, and {I} is the
internal force vector, which depends on the nodal deformations {d} .
The convergence formula is:
[NEQ∑j=1
(Δf)2]1/2
[NEQ∑j=1
(F )2]1/2
≤ Force tolerance (23)
in which NEQ represents the number of equations (Mercer and Palazotto, 1987). The force tolerance used inthe present work was taken as equal to 0.05.
Mathematical Formulation of Shrinkage
According to ACI Committee 209 (ACI, 1990), the shrinkage strain occurring between t0 at the start of shrinkageand t can be predicted using the following formula:
εsh (t) =(t − t0)
35 + (t − t0)εshu (24)
where εshu is the ultimate shrinkage and represents the product of the applicable correction factors:
εshu = 780γsh10−6 (25)
γsh = γhγtγsγcγϕγα (26)
where γh, γt, γs, γc, γϕ andγα are empirical coefficients that take into consideration the effects of humidity,
minimum member thickness, slump, cement content, fine aggregate percentage, and air proportion, respectively.γh is expressed by:
γh = 1.4 − 0.01h for 40% ≤ h ≤ 80%γh = 3.0 − 0.03h for 80% ≤ h ≤ 100% (27)
where h is the relative humidity (%).
γtandγs are determined byγt = 1.23− 0.0015Th for the duration of shrinkage ≤ 1 year (28)
221

OUZAA, BENMANSOUR
where Th is the minimum member thickness (mm), and
γs = 0.89 + 0.00161S (29)
whereS is the slump of fresh concrete (mm).
γc is determined byγc = 0.75 + 0.00061C
(30)
where C is the cement content (kg/m3).γϕ and γα are expressed by
γϕ = 0.3 + 0.014ϕ for ϕ ≤ 50%γϕ = 0.9 + 0.002ϕ for ϕ > 50% (31)
where ϕ is the ratio of the fine aggregate to the total aggregate (%), and
γα = 0.95 + 0.008α (32)
where α is the air content (%).
Results and Discussion
In this section, the finite element program is applied to represent shrinkage cracks in base-restrained members.
The following properties were assumed in the analysis: w = 2359kg/m3 , f ′c = 37.2MPa, f ′
t = 2.07 MPa,Ec = 30 GPa, ν =0.15, and Es = 200 GPa.
In all walls, the percentage of the vertical steel reinforcement and diameter of the bar were taken as equalto 0.5% and 8 mm, respectively.
The walls were assumed to be completely fixed to their foundation and 1 m long (Figure 4). The thicknessof the walls and the duration of drying were taken as equal to 0.1 m and 30 days, respectively.
The data required for applying the ACI Committee 209 equations (ACI, 1990) to predict shrinkage valuesare given in Table 1.
Table 1. Shrinkage correction factor γsh .
t0 h Th S C φ α γsh
(days) (%) (mm) (mm) (kg/m3) (%) (%)7 40 100 50 350 38.5 4 0.83
Degree of restraint
The degree of restraint in a wall with a restrained, continuous base varies within the member. At the bottom,the wall is fully restrained, and at the top, it is more or less free to move.
222

OUZAA, BENMANSOUR
C
H
L
Continuous base restraint
Figure 4. Geometry of the reinforced concrete wall.
The first crack usually occurs at the mid-length of the wall, since the restraint is highest at this position.As each new crack forms at approximately the midpoint of the uncracked portions of the base, the previouslyformed cracks will propagate vertically.
The mid-length point of the wall at the base has a maximum degree of restraint. Figure 5 shows thedegree of restraint at this position of the walls for L/H = 1. The degree of restraint KR is calculated during
analysis as the ratio of restrained shrinkage strain εr(t) to free shrinkage strain εsh(t):
KR =εr(t)εsh(t)
. (33)
The restrained shrinkage strain is determined by subtracting the free shrinkage strain from the total strain.
-0.100.10.20.30.40.50.60.70.80.90
0.1
0.2
0.3
0.4
0.5
0.6
0.7
0.8
0.9
1
Degree of restraint
Rel
ativ
e he
ight
abo
ve b
ase
Present studyExperimental values by Carlson and Reading
Figure 5. Degree of restraint at center section of wall for L/H = 1.
Models made of rubber were used by Carlson and Reading (1988) to study drying shrinkage stressconditions in base-restrained walls with different shapes, with and without openings, and with different degreesof restraint. Degree of restraint contour diagrams in walls with different length-to-height ratios of 1, 2, 3, 4, 5,6, 7, 8, 9, 10, and 20 were prepared. These diagrams were used for comparison with the results of the finiteelement analysis. The values of the degree of restraint calculated in the present study were found to be in good
223
OUZAA, BENMANSOUR
agreement with the experimental values obtained by Carlson and Reading (1988). Small negative values of thedegree of restraint were found at the wall top, indicating the occurrence of small compressive stresses.
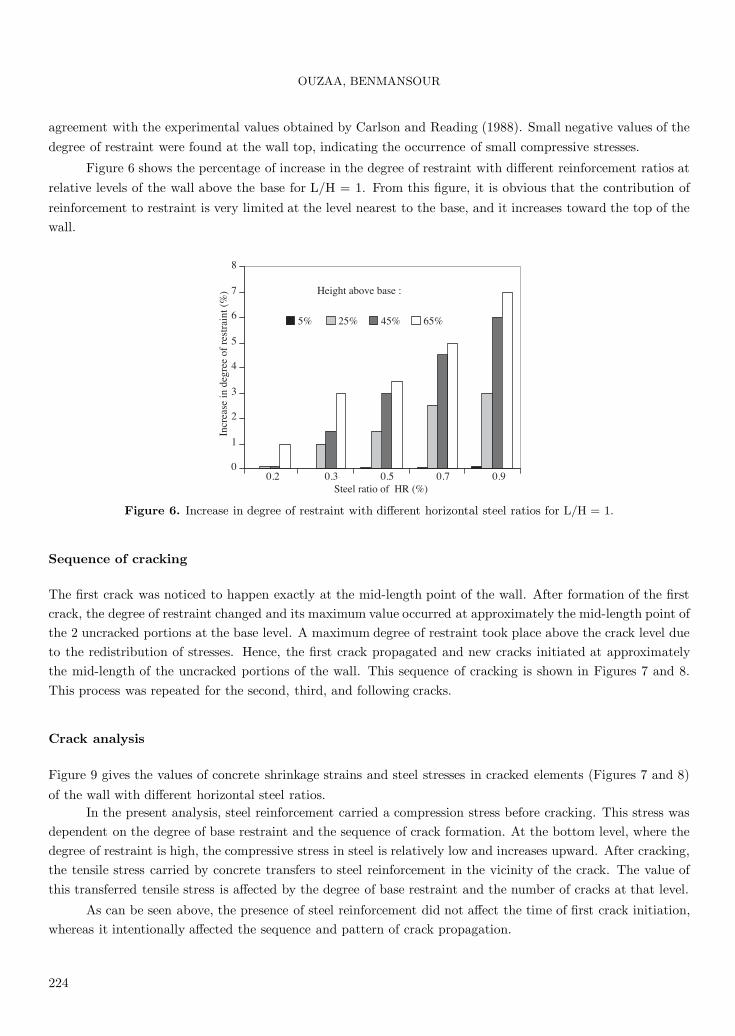
Figure 6 shows the percentage of increase in the degree of restraint with different reinforcement ratios atrelative levels of the wall above the base for L/H = 1. From this figure, it is obvious that the contribution ofreinforcement to restraint is very limited at the level nearest to the base, and it increases toward the top of thewall.
Height above base :
0
1
2
3
4
5
6
7
8
0.2 0.3 0.5 0.7 0.9Steel ratio of HR (%)
Incr
ease
in d
egre
e of
res
trai
nt (
%)
5% 25% 45% 65%
Figure 6. Increase in degree of restraint with different horizontal steel ratios for L/H = 1.
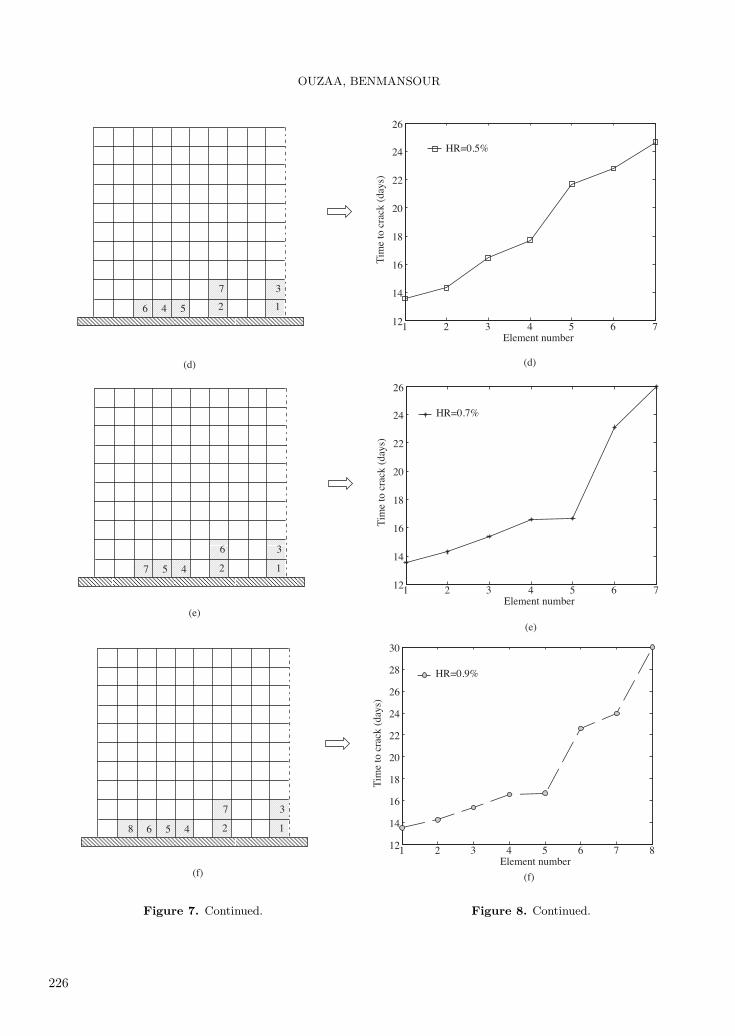
Sequence of cracking
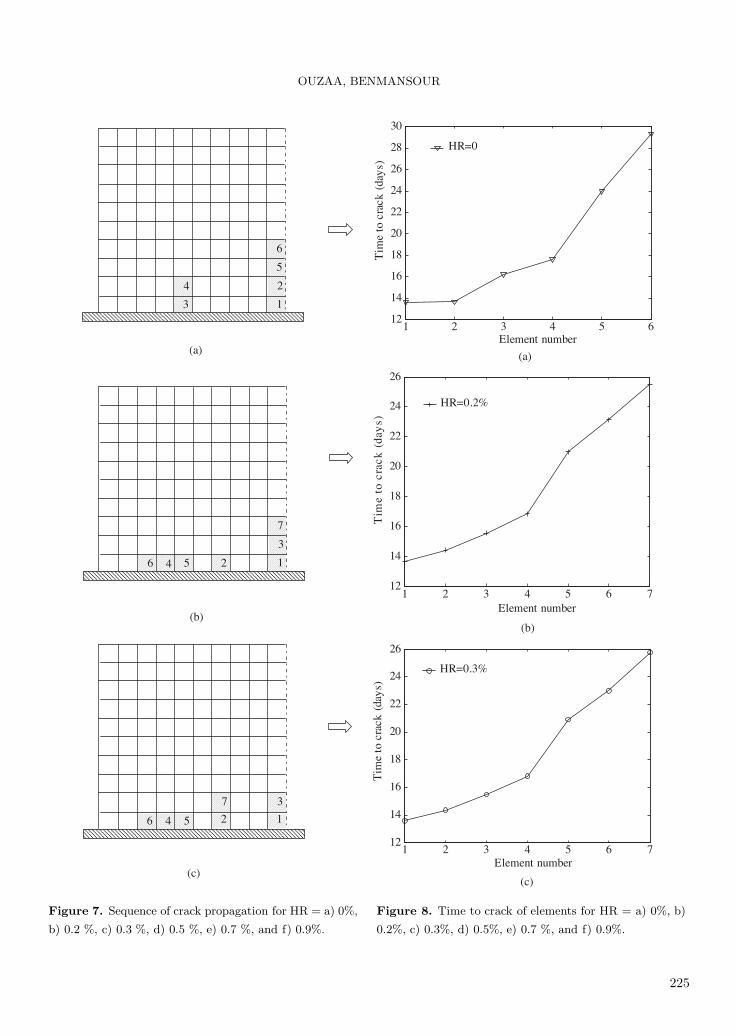
The first crack was noticed to happen exactly at the mid-length point of the wall. After formation of the firstcrack, the degree of restraint changed and its maximum value occurred at approximately the mid-length point ofthe 2 uncracked portions at the base level. A maximum degree of restraint took place above the crack level dueto the redistribution of stresses. Hence, the first crack propagated and new cracks initiated at approximatelythe mid-length of the uncracked portions of the wall. This sequence of cracking is shown in Figures 7 and 8.This process was repeated for the second, third, and following cracks.
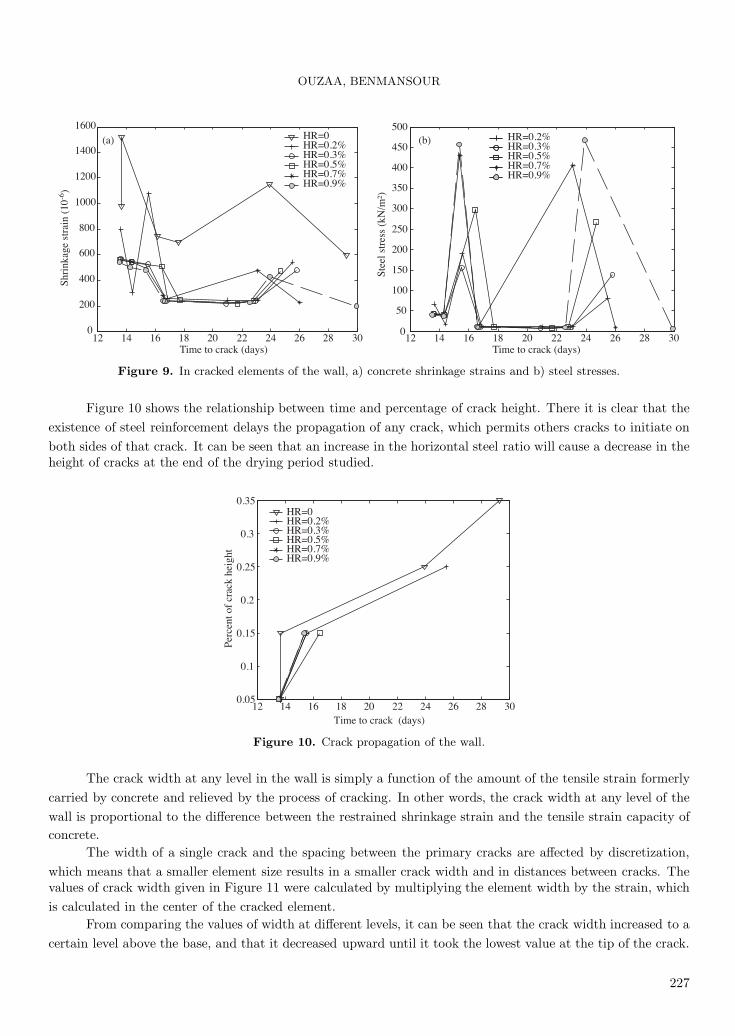
Crack analysis
Figure 9 gives the values of concrete shrinkage strains and steel stresses in cracked elements (Figures 7 and 8)of the wall with different horizontal steel ratios.
In the present analysis, steel reinforcement carried a compression stress before cracking. This stress wasdependent on the degree of base restraint and the sequence of crack formation. At the bottom level, where thedegree of restraint is high, the compressive stress in steel is relatively low and increases upward. After cracking,the tensile stress carried by concrete transfers to steel reinforcement in the vicinity of the crack. The value ofthis transferred tensile stress is affected by the degree of base restraint and the number of cracks at that level.
As can be seen above, the presence of steel reinforcement did not affect the time of first crack initiation,whereas it intentionally affected the sequence and pattern of crack propagation.
224
OUZAA, BENMANSOUR
(a)
4
3
2
5
1
6
1 2 3 4 5 612
14
16
18
20
22
24
26
28
30
Element number
Tim
e to
crac
k(d
ays)
HR=0
(a)
(c)
6 4 5
7
2
3
1
1 2 3 4 5 6 712
14
16
18
20
22
24
26
HR=0.3%
Element number
Tim
eto
crac
k(d
ays)
(c)
(b)
6 4 25
3
7
1
(b)
1 2 3 4 5 6 712
14
16
18
20
22
24
26
HR=0.2%
Tim
eto
crac
k(d
ays)
Element number
Figure 7. Sequence of crack propagation for HR = a) 0%,
b) 0.2 %, c) 0.3 %, d) 0.5 %, e) 0.7 %, and f) 0.9%.
Figure 8. Time to crack of elements for HR = a) 0%, b)
0.2%, c) 0.3%, d) 0.5%, e) 0.7 %, and f) 0.9%.
225
OUZAA, BENMANSOUR
7 5 4
6
2
3
1
(e)
1 2 3 4 5 6 712
14
16
18
20
22
24
26
HR=0.7%
Element number
Tim
e to
cra
ck (
days
)
(e)
(d)
6 4 5
7
2
3
1
(d)
1 2 3 4 5 6 712
14
16
18
20
22
24
26
HR=0.5%
Tim
e to
cra
ck (
days
)
Element number
8 6 5 4
7
2
3
1
(f) (f)
1 2 3 4 5 6 7 812
14
16
18
20
22
24
26
28
30
HR=0.9%
Tim
e to
cra
ck (
days
)
Element number
Figure 7. Continued. Figure 8. Continued.
226
OUZAA, BENMANSOUR
(a)
12 14 16 18 20 22 24 26 28 300
200
400
600
800
1000
1200
1400
1600HR=0HR=0.2%HR=0.3%HR=0.5%HR=0.7%HR=0.9%
Time to crack (days)
Shri
nkag
e st
rain
(10
-6)
(b)
12 14 16 18 20 22 24 26 28 300
50
100
150
200
250
300
350
400
450
500HR=0.2%HR=0.3%HR=0.5%HR=0.7%HR=0.9%
Time to crack (days)
Figure 9. In cracked elements of the wall, a) concrete shrinkage strains and b) steel stresses.
Figure 10 shows the relationship between time and percentage of crack height. There it is clear that theexistence of steel reinforcement delays the propagation of any crack, which permits others cracks to initiate onboth sides of that crack. It can be seen that an increase in the horizontal steel ratio will cause a decrease in theheight of cracks at the end of the drying period studied.
12 14 16 18 20 22 24 26 28 300.05
0.1
0.15
0.2
0.25
0.3
0.35HR=0 HR=0.2%HR=0.3%HR=0.5%HR=0.7%HR=0.9%
Time to crack (days)
Perc
ent o
f cr
ack
heig
ht
Figure 10. Crack propagation of the wall.
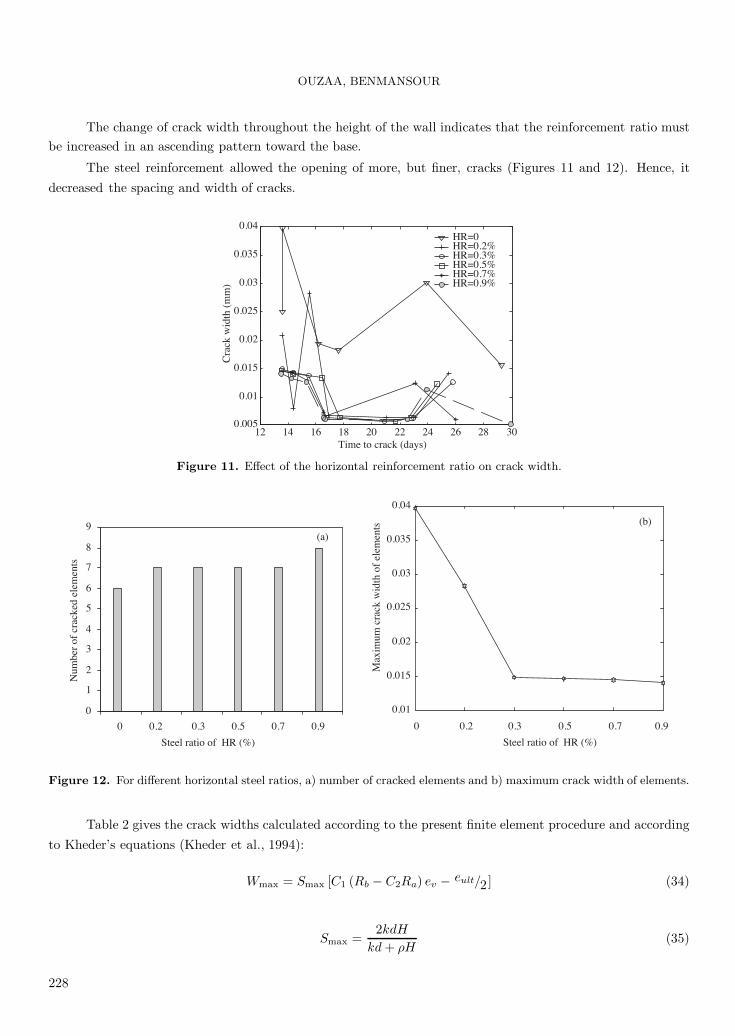
The crack width at any level in the wall is simply a function of the amount of the tensile strain formerlycarried by concrete and relieved by the process of cracking. In other words, the crack width at any level of thewall is proportional to the difference between the restrained shrinkage strain and the tensile strain capacity ofconcrete.
The width of a single crack and the spacing between the primary cracks are affected by discretization,which means that a smaller element size results in a smaller crack width and in distances between cracks. Thevalues of crack width given in Figure 11 were calculated by multiplying the element width by the strain, whichis calculated in the center of the cracked element.
From comparing the values of width at different levels, it can be seen that the crack width increased to acertain level above the base, and that it decreased upward until it took the lowest value at the tip of the crack.
227
OUZAA, BENMANSOUR
The change of crack width throughout the height of the wall indicates that the reinforcement ratio mustbe increased in an ascending pattern toward the base.
The steel reinforcement allowed the opening of more, but finer, cracks (Figures 11 and 12). Hence, itdecreased the spacing and width of cracks.
0.04
12 14 16 18 20 22 24 26 28 300.005
0.01
0.015
0.02
0.025
0.03
0.035
HR=0HR=0.2%HR=0.3%HR=0.5%HR=0.7%HR=0.9%
Time to crack (days)
Cra
ck w
idth
(m
m)
Figure 11. Effect of the horizontal reinforcement ratio on crack width.
(b)
0.01
0.015
0.02
0.025
0.03
0.035
0.04
Max
imum
cra
ck w
idth
of
elem
ents
Steel ratio of HR (%)
0.20 0.3 0.5 0.7 0.9
0
1
2
3
4
5
6
7
8
9
0 0.2 0.3 0.5 0.7 0.9
Steel ratio of HR (%)
Num
ber
of c
rack
ed e
lem
ents
(a)
Figure 12. For different horizontal steel ratios, a) number of cracked elements and b) maximum crack width of elements.
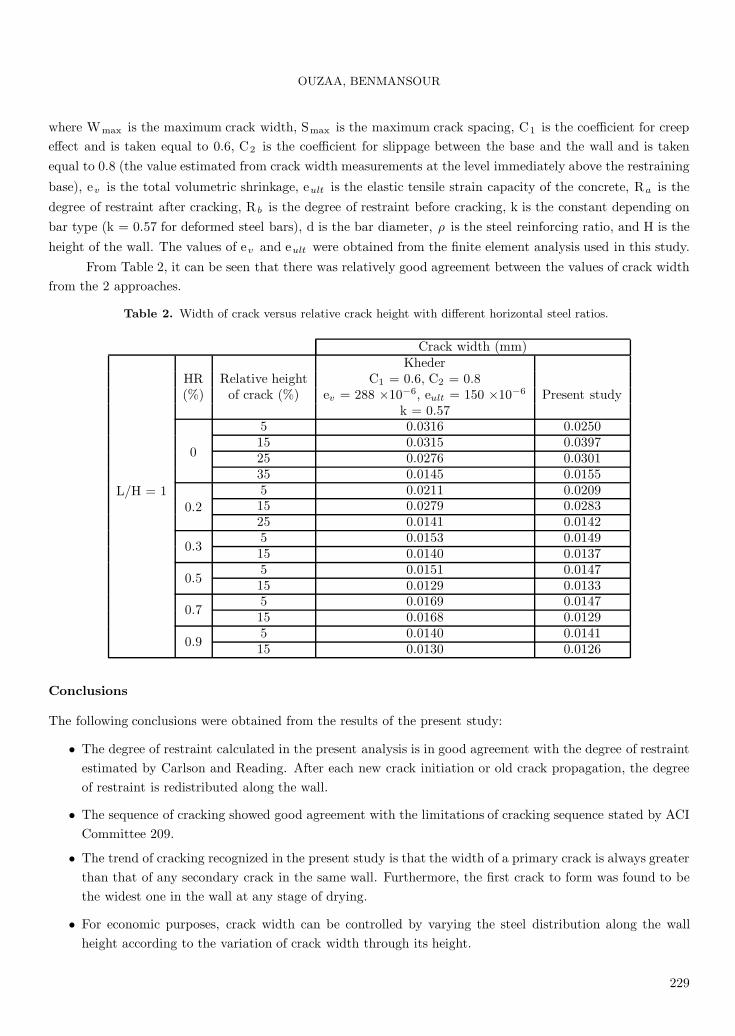
Table 2 gives the crack widths calculated according to the present finite element procedure and accordingto Kheder’s equations (Kheder et al., 1994):
Wmax = Smax [C1 (Rb − C2Ra) ev − eult/2] (34)
Smax =2kdH
kd + ρH(35)
228
OUZAA, BENMANSOUR
where Wmax is the maximum crack width, Smax is the maximum crack spacing, C1 is the coefficient for creepeffect and is taken equal to 0.6, C2 is the coefficient for slippage between the base and the wall and is takenequal to 0.8 (the value estimated from crack width measurements at the level immediately above the restraining
base), ev is the total volumetric shrinkage, eult is the elastic tensile strain capacity of the concrete, Ra is thedegree of restraint after cracking, R b is the degree of restraint before cracking, k is the constant depending onbar type (k = 0.57 for deformed steel bars), d is the bar diameter, ρ is the steel reinforcing ratio, and H is theheight of the wall. The values of ev and eult were obtained from the finite element analysis used in this study.
From Table 2, it can be seen that there was relatively good agreement between the values of crack widthfrom the 2 approaches.
Table 2. Width of crack versus relative crack height with different horizontal steel ratios.
Crack width (mm)
L/H = 1
KhederHR Relative height C1 = 0.6, C2 = 0.8(%) of crack (%) ev = 288 ×10−6, eult = 150 ×10−6 Present study
k = 0.57
0
5 0.0316 0.025015 0.0315 0.039725 0.0276 0.030135 0.0145 0.0155
0.25 0.0211 0.020915 0.0279 0.028325 0.0141 0.0142
0.35 0.0153 0.014915 0.0140 0.0137
0.55 0.0151 0.014715 0.0129 0.0133
0.75 0.0169 0.014715 0.0168 0.0129
0.95 0.0140 0.014115 0.0130 0.0126
Conclusions
The following conclusions were obtained from the results of the present study:
• The degree of restraint calculated in the present analysis is in good agreement with the degree of restraintestimated by Carlson and Reading. After each new crack initiation or old crack propagation, the degreeof restraint is redistributed along the wall.
• The sequence of cracking showed good agreement with the limitations of cracking sequence stated by ACICommittee 209.
• The trend of cracking recognized in the present study is that the width of a primary crack is always greaterthan that of any secondary crack in the same wall. Furthermore, the first crack to form was found to bethe widest one in the wall at any stage of drying.
• For economic purposes, crack width can be controlled by varying the steel distribution along the wallheight according to the variation of crack width through its height.
229
OUZAA, BENMANSOUR
References
ACI Committee 209, “Prediction of Creep, Shrinkage and Temperature Effects in Concrete Structures”, American
Concrete Institute Manual of Concrete Practice Part 1, Farmington Hills, Michigan, 1990.
ACI Committee 224, “Control of Cracking in Concrete Structures”, American Concrete Institute, Farmington Hills,
Michigan, 2001.
Aldstedt, E. and Bergan, P.G., “Nonlinear Time Dependent Concrete Frame Analysis”, Journal of Structural Division,
ASCE, 104, 1077-1092, 1978.
Bhide, S.B., “Reinforced Concrete Element in Shear and Tension”, PhD Thesis, University of Toronto, 1986.
Carlson, R.W. and Reading, T.J., “Model Study of Shrinkage Cracking in Concrete Building Walls”, ACI Structural
Journal, 85, 395-404, 1988.
Cervenka, V., “Constitutive Model for Cracked Reinforced Concrete”, ACI Journal, 82, 877-882, 1985.
Chen, W.F., “Plasticity in Reinforced Concrete”, McGraw-Hill Book Company, New York, 1982.
“Finite Element Analysis of Reinforced Concrete,” American Society of Civil Engineers, New York, 1982.
Kheder, G.F., Rawi, R.S.A. and Dhahi, J.K.A, “A Study of the Behavior of Volume Change Cracking in Base-Restrained
Concrete Walls”, Materials and Structures, 27, 383-392, 1994.
Kheder, G.F. and Fadhil, A.S., “Strategic Reinforcement for Controlling Volume-Change Cracking in Base-Restrained
Concrete Walls”, Materials and Structures, 23, 358-363, 1990.
Kianoush, M.R., Acarcan, M. and Ziari, A., “Behavior of Base Restrained Reinforced Concrete Walls under Volumetric
Change”, Engineering Structures, 30, 1526-1534, 2008.
Maekawa, K. and Okamura, H., “The Deformational Behavior of Constitutive Equation of Concrete Using the Elasto-
Plastic and Fracture Model”, Journal of the Faculty of Engineering - University of Tokyo, 39, 253-328, 1983.
Mercer, J.G. and Palazotto, A.N., “Elastic-Plastic Nonlinearities Considering Fracture Mechanics”, Computers and
Structures, 25, 919-935, 1987.
Saenz, L.P., “Discussion of ‘Equation for the Stress-Strain Curve of Concrete’ by Dessayi and Krishnan”, ACI Journal,
61, 1229-1235, 1964.
Stoffers, H., “Cracking Due to Shrinkage and Temperature Variations in Walls”, Heron, 1978.
Vecchio, F.J. and Collins, M.P., “The Response of Reinforced Concrete to In-Plane Shear and Normal Stresses”,
Department of Civil Engineering, University of Toronto, 1982.
Vecchio, F.J. and Collins, M.P., “The Modified Compression Field Theory for Reinforced Concrete Elements Subjected
to Shear”, ACI Journal, 83, 219-231, 1986.
230