cracking the organizational code for growth aerospace ... · pdf filecracking the...
TRANSCRIPT

© OLIVER WYMAN
Cracking the organizational code for growth
Aerospace & Defense growth analysis
March 2013
1 1 © OLIVER WYMAN
Contents
1) Key organizational challenges in the industry 2
2) Growth performance of key players 4
3) How industry players are exploiting organizational levers 13
4) Why participate in Oliver Wyman’s study? 17
Page
2
Key organizational challenges in the industry
Section 1
3 3 © OLIVER WYMAN
Organizing for growth in the Aerospace and defense industries
• While strategic issues impacting this sector have been analysed at length, designing and implementing the right organization
remains a key lever to both enable and achieve sustainable growth
• Major A&D companies need to overcome the organizational challenges associated with:
- Creating the right organizational set-up to prepare the future while delivering short-term results
- Achieving the right power and resource distribution between:
Regions, business units and the corporate center (to achieve synergies and remain agile)
Programmes and functions (for clear lines of command and matrix ways of working)
- Developing an efficient footprint to balance global and local needs
- Re-inventing their products and conception processes to create and sustain demand
- Design for customization to serve multiple customers using the right enabling platforms / catalogues
- Migrating from ATA to functions and from make to systems integration
- Implementing customer-oriented processes and developing a growth-nurturing culture
- Doing more without more
- Implementing organization and processes aimed at reducing cost and time to market
- Gearing for growth and innovation in a very constrained environment
- Increasing efficiency while maintaining a healthy cost base
- Implementing new ways of working with customers and suppliers
- Working with suppliers and customers in an ever more integrated manner
- Keeping and developing critical skills and making efficient use of contractors
- Building and executing complex deals involving offset agreements and offshoring of activities
• Oliver Wyman is currently launching a study to further understand, qualify and quantify the required organizational levers and
how they impact the long-term sustainable growth prospects within the aerospace and defense industry
• The following pages provide a preliminary view of recent growth results within the sector, based on publicly available
information, in order to showcase the importance of identifying the organizational levers that propelled star performers’ growth
trajectories
4
Growth performance of the key players
Section 2
5 5 © OLIVER WYMAN
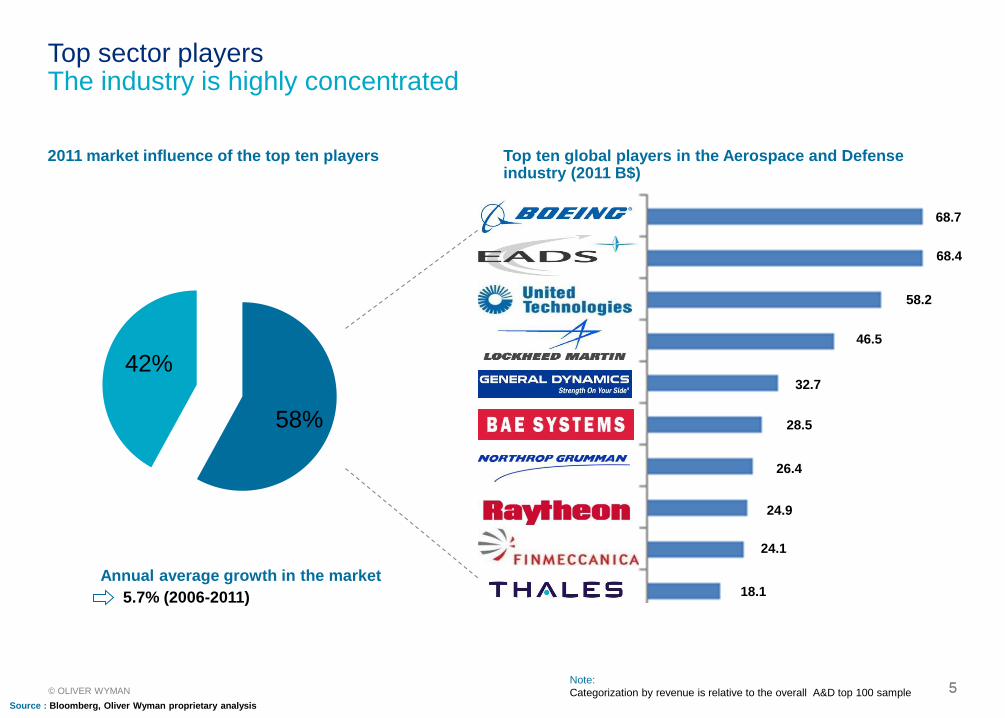
2011 market influence of the top ten players Top ten global players in the Aerospace and Defense industry (2011 B$)
Top sector players The industry is highly concentrated
68.7
68.4
58.2
46.5
32.7
28.5
26.4
24.9
24.1
18.1
58%
42%
Note:
Categorization by revenue is relative to the overall A&D top 100 sample
Source : Bloomberg, Oliver Wyman proprietary analysis
Annual average growth in the market
5.7% (2006-2011)

6 6 © OLIVER WYMAN
What was the impact of the 2008 economic crisis on the industry? While 85% managed double-digit growth pre-crisis, only 34% achieved this following the worst effects of the recession
Catching-up
7% of companies
Anemic
8% of companies
Rev
en
ue G
row
th (
CA
GR
2009
-2011)
Note: Origins of each axis set to 10% to differentiate
double-digit growth
Superstars
27% of companies
Stalling
58% of companies
Revenue Growth (CAGR 2005-2007)
Decelerating Growth Accelerating Growth
AAR CORP.
Alliant Techsystems Inc.
Avio
BAE Systems plc
BBA Aviation
BE Aerospace, Inc.
Cobham plc
Cubic Corporation
Curtiss-Wright Corporation
Dassault Aviation
Delta Tucker Holdings / DynCorp International
Elbit Systems Ltd.
Embraer S.A.
Esterline Technologies Corporation
European Aeronautic Defence and Space Company.
Exelis
Finmeccanica SpA
FLIR Systems
General Dynamics Corporation
GKN Aerospace
Israel Aerospace Industries Ltd.
Korea Aerospace Industries, Ltd.
L-3 Communications Holdings, Inc.
Lockheed Martin Corporation
Loral Space & Communications Inc.
Meggitt PLC
Moog Inc.
MTU Aero Engines Holding AG
Nabtesco Corp
Orbital Sciences Corporation Parker Hannifin Aerospace
Raytheon Company
Rheinmetall AG
Rockwell Collins, Inc.
Rolls-Royce Holdings plc
Saab AB
Safran
Singapore Technologies Engineering
Spirit AeroSystems
Teledyne Technologies Incorporated
Textron Inc.
Thales The Boeing Company
TransDigm Group Incorporated
United Technologies Corporation
Xi'an Aircraft Industry (Group) Company Ltd.
Zodiac Aerospace
Bombardier Aerospace
0 0 0 0 0 0 0 0 0 0 0 0 0 0 0 0 0 0 0 0 0 0 0 0 0 0 0 0 0 0 0 0 0 0 0 0 0 0 0 0 0 0 0 0 0 0 0 0 0 0 0 0 0 0 0 0 0 0 0 0 0 0 0 0 0 0 0 0 0 0 0 0 0 0 0 0 0 0 0 0 0 0 0 0 0 0 0 0 0 0 0 0 0 0 0 0 0 0 0 0 0 0 0 0 0 0 0 0 0 0 0 0 0 0 0 0 0 0 0 0 0 0 0 0 0 0 0 0 0 0 0 0 0 0 0 0 0 0 0 0 0 0 0 0 0 0 0 0 0 0 0 0 0 0 0 0 0 0 0 0 0 0 0 0 0 0 0 0 0 0 0 0 0 0 0 0 0 0 0 0 0 0 0 0 0 0 0 0 0 0 0 0 0 0 0 0 0 0 0 0 0 0 0 0 0 0 0 0 0 0 0 0 0 0 0 0 0 0 0 0 0 0 0 0 0 0 0 0 0 0 0 0 0 0 0 0 0 0 0 0 0 0 0 0 0 0 0 0 0 0 0 0 0 0 0 0 0 0 0 0 0 0 0 0 0 0 0 0 0 0 0 0 0 0 0 0 0 0 0 0 0 0 0 0 0 0 0 0 0 0 0 0 0 0 0 0 0 0 0 0 0 0 0 0 0 0 0 0 0 0 0 0 0 0 0 0 0 0 0 0 0 0 0 0 0 0 0 0 0 0 0 0 0 0 0 0 0 0 0 0 0 0 0 0 0
-10%
-5%
0%
5%
10%
15%
20%
25%
30%
-10% 0% 10% 20% 30% 40% 50%
Source : Bloomberg, Oliver Wyman proprietary analysis
7 7 © OLIVER WYMAN
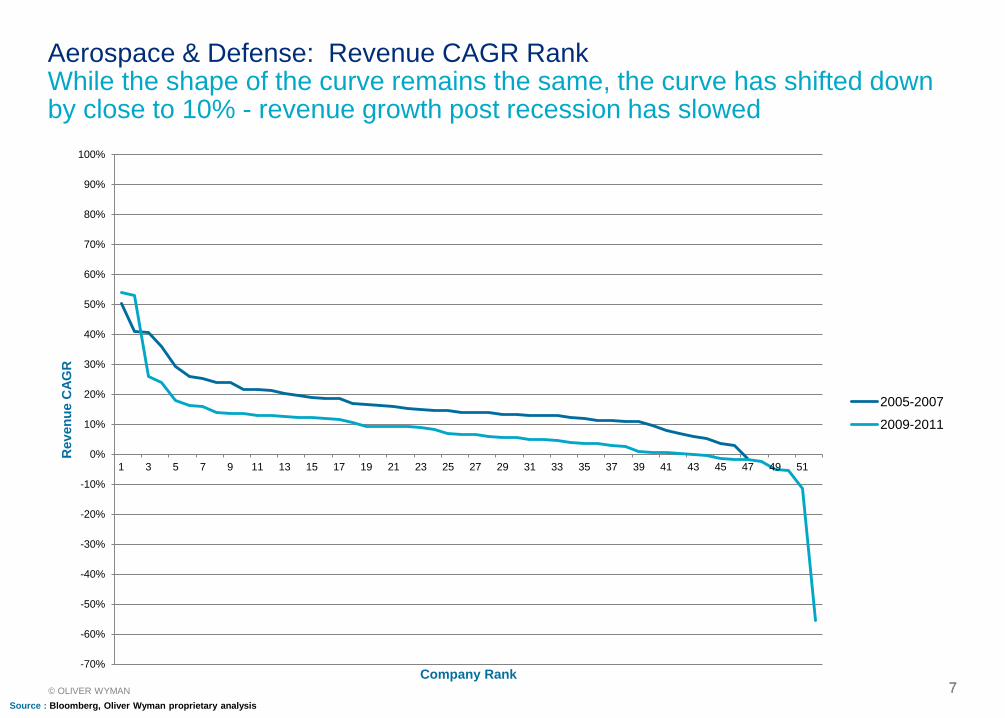
-70%
-60%
-50%
-40%
-30%
-20%
-10%
0%
10%
20%
30%
40%
50%
60%
70%
80%
90%
100%
1 3 5 7 9 11 13 15 17 19 21 23 25 27 29 31 33 35 37 39 41 43 45 47 49 51
Rev
en
ue C
AG
R
Company Rank
2005-2007
2009-2011
Aerospace & Defense: Revenue CAGR Rank While the shape of the curve remains the same, the curve has shifted down by close to 10% - revenue growth post recession has slowed
Source : Bloomberg, Oliver Wyman proprietary analysis

8 8 © OLIVER WYMAN
AAR CORP.
Alliant Techsystems Inc.
Avio
BAE Systems plc
BBA Aviation
BE Aerospace, Inc.
Chemring Group PLC Cobham plc
Cubic Corporation
Curtiss-Wright Corporation
Dassault Aviation
Elbit Systems Ltd.
Embraer S.A. Esterline Technologies Corporation
European Aeronautic Defence and Space Company EADS N.V.
Exelis
FLIR Systems
General Dynamics Corporation
GKN Aerospace
Israel Aerospace Industries Ltd.
Korea Aerospace Industries, Ltd.
L-3 Communications Holdings, Inc.
Lockheed Martin Corporation
Meggitt PLC
Moog Inc.
MTU Aero Engines Holding AG
NABTESCO CORPORATION
Northrop Grumman Corporation
Orbital Sciences Corporation
Parker Hannifin Aerospace
Raytheon Company
Rheinmetall AG
Rockwell Collins, Inc.
Rolls-Royce Holdings plc
Saab AB
Safran Singapore Technologies Engineering
Spirit AeroSystems
Teledyne Technologies Incorporated
Textron Inc.
Thales
The Boeing Company
TransDigm Group Incorporated
United Technologies Corporation
Xi'an Aircraft Industry (Group) Company Ltd.
Zodiac Aerospace
Bombardier Aerospace
-20%
-10%
0%
10%
20%
30%
40%
50%
60%
70%
80%
-20% -15% -10% -5% 0% 5% 10% 15% 20% 25% 30%
EB
ITD
A C
AG
R (
2009
-2011)
Should growth or efficiency be pursued? With an average revenue growth of 7% and EBITDA growth of 9%, strategies were to protect EBITDA, sometimes at the detriment of revenue
Efficiency play
10% of companies Highly profitable growth
33% of companies
Less or unprofitable growth
14% of companies
Falling behind
43% of companies
Revenue Growth (CAGR 2009-2011) Source : Bloomberg, Oliver Wyman proprietary analysis

9 9 © OLIVER WYMAN
Aerospace & Defense: Market Capitalization Companies experiencing highly profitable growth clearly outperformed the market cap growth of their competitors
Source : Bloomberg, Oliver Wyman proprietary analysis
-1.8%
1.3%
30.1%
-5.0%
-20.0%
0.0%
20.0%
40.0%
Falling behind Less or unprofitable growth Highly profitable growth Efficiency play
Mark
et
Cap
CA
GR
(2
0009
-2011)

10 10 © OLIVER WYMAN
AAR CORP.
Aerospace Communications Holdings Co., Ltd.
Alliant Techsystems Inc.
Avio
BAE Systems plc
BBA Aviation
BE Aerospace, Inc.
Chemring Group PLC
Cobham plc
Cubic Corporation
Curtiss-Wright Corporation
Dassault Aviation
Delta Tucker Holdings / DynCorp International
Elbit Systems Ltd.
Embraer S.A.
Esterline Technologies Corporation
European Aeronautic Defence and Space Company EADS N.V.
Exelis
Finmeccanica SpA
FLIR Systems
General Dynamics Corporation
GKN Aerospace
Israel Aerospace Industries Ltd.
ITT Corporation
Korea Aerospace Industries, Ltd.
L-3 Communications Holdings, Inc.
Lockheed Martin Corporation
Loral Space & Communications Inc.
Meggitt PLC
Moog Inc.
MTU Aero Engines Holding AG
Nabtesco Corp Northrop Grumman Corporation
Orbital Sciences Corporation
Parker Hannifin Aerospace Raytheon Company
Rheinmetall AG
Rockwell Collins, Inc.
Rolls-Royce Holdings plc
Saab AB Safran Singapore Technologies Engineering
Spirit AeroSystems
Teledyne Technologies Incorporated
Textron Inc.
Thales
The Boeing Company
TransDigm Group Incorporated
Triumph Group, Inc. United Technologies Corporation
Xi'an Aircraft Industry (Group) Company Ltd.
Zodiac Aerospace
Bombardier Aerospace
0%
5%
10%
15%
20%
25%
30%
35%
40%
45%
50%
500 5000 50000
EB
ITD
A M
arg
in (
2009
-2011)
Average Revenue (2009-2011)
Does company size impact growth? Smaller companies tend to display higher variability in EBITDA
Source : Bloomberg, Oliver Wyman proprietary analysis

11 11 © OLIVER WYMAN
AAR CORP.
Alliant Techsystems Inc.
Avio
BAE Systems plc
BBA Aviation
BE Aerospace, Inc.
Chemring Group PLC
Cobham plc
Cubic Corporation
Curtiss-Wright Corporation
Dassault Aviation
Delta Tucker Holdings / DynCorp International
Elbit Systems Ltd.
Embraer S.A.
Esterline Technologies Corporation
European Aeronautic Defence and Space Company EADS N.V.
Exelis Finmeccanica SpA
FLIR Systems
General Dynamics Corporation
GKN Aerospace
Israel Aerospace Industries Ltd.
Korea Aerospace Industries, Ltd.
L-3 Communications Holdings, Inc.
Lockheed Martin Corporation
Loral Space & Communications Inc.
Meggitt PLC
Moog Inc.
MTU Aero Engines Holding AG
Nabtesco Corp
Northrop Grumman Corporation
Orbital Sciences Corporation Parker Hannifin Aerospace
Raytheon Company
Rheinmetall AG
Rockwell Collins, Inc.
Rolls-Royce Holdings plc Saab AB
Safran
Singapore Technologies Engineering
Spirit AeroSystems Teledyne Technologies Incorporated
Textron Inc.
Thales The Boeing Company
TransDigm Group Incorporated
United Technologies Corporation
Xi'an Aircraft Industry (Group) Company Ltd.
Zodiac Aerospace
Bombardier Aerospace
-15%
-10%
-5%
0%
5%
10%
15%
20%
25%
30%
500 5000 50000Sale
s R
ev
en
ue C
AG
R (
2009
-2011)
Average Revenue (2009-2011)
Aerospace & Defense: Revenue CAGR vs. Average Revenue Smaller companies show agility and ability to grow at a higher rate, yet the main players still display consistent growth rates, even though lower. Mid-size players appear to be in a danger zone.
Source : Bloomberg, Oliver Wyman proprietary analysis

12 12 © OLIVER WYMAN
EBITDA vs. Sales Revenue There is a consistent grouping in the area of 12 to 15% EBITDA margin, however, growth above 12% (twice the industry growth) tends to generate oversized returns
AAR CORP.
Alliant Techsystems Inc.
Avio
BAE Systems plc
BBA Aviation
BE Aerospace, Inc.
Chemring Group PLC
Cobham plc
Cubic Corporation
Curtiss-Wright Corporation
Dassault Aviation
Delta Tucker Holdings / DynCorp International
Elbit Systems Ltd.
Embraer S.A.
Esterline Technologies Corporation
European Aeronautic Defence and Space Company EADS N.V.
Exelis
Finmeccanica SpA
FLIR Systems
General Dynamics Corporation
GKN Aerospace
Israel Aerospace Industries Ltd.
Korea Aerospace Industries, Ltd.
L-3 Communications Holdings, Inc.
Lockheed Martin Corporation
Loral Space & Communications Inc.
Meggitt PLC
Moog Inc.
MTU Aero Engines Holding AG
Nabtesco Corp Northrop Grumman Corporation
Orbital Sciences Corporation
Parker Hannifin Aerospace Raytheon Company
Rheinmetall AG
Rockwell Collins, Inc.
Rolls-Royce Holdings plc
Saab AB
SAFRAN Singapore Technologies Engineering
Spirit AeroSystems
Teledyne Technologies Incorporated
Textron Inc.
Thales
The Boeing Company
TransDigm Group Incorporated
United Technologies Corporation
Xi'an Aircraft Industry (Group) Company Ltd.
Zodiac Aerospace
Bombardier Aerospace
0 0 0 0 0 0 0 0 0 0 0 0 0 0 0 0 0 0 0 0 0 0 0 0 0 0 0 0 0 0 0 0 0 0 0 0 0 0 0 0 0 0 0 0 0 0 0 0 0 0 0 0 0 0 0
0.00% 0.00% 0.00% 0.00% 0.00% 0.00% 0.00% 0.00% 0.00% 0.00% 0.00% 0.00% 0.00% 0.00% 0.00% 0.00% 0.00% 0.00% 0.00% 0.00% 0.00% 0.00% 0.00% 0.00% 0.00% 0.00% 0.00% 0.00% 0.00% 0.00% 0.00% 0.00% 0.00% 0.00% 0.00% 0.00% 0.00% 0.00% 0.00% 0.00% 0.00% 0.00% 0.00% 0.00% 0.00% 0.00% 0.00% 0.00% 0.00% 0.00% 0.00% 0.00% 0.00% 0.00% 0.00% 0.00% 0.00% 0.00% 0.00% 0.00% 0.00% 0.00% 0.00% 0.00% 0.00% 0.00% 0.00% 0.00% 0.00% 0.00% 0.00% 0.00% 0.00% 0.00% 0.00% 0.00% 0.00% 0.00% 0.00% 0.00% 0.00% 0.00% 0.00% 0.00% 0.00% 0.00% 0.00% 0.00% 0.00% 0.00% 0.00% 0.00% 0.00% 0.00% 0.00% 0.00% 0.00% 0.00% 0.00% 0.00% 0.00% 0.00% 0.00% 0.00% 0.00% 0.00% 0.00% 0.00% 0.00% 0.00% 0.00% 0.00% 0.00% 0.00% 0.00% 0.00% 0.00% 0.00% 0.00% 0.00% 0.00% 0.00% 0.00% 0.00% 0.00% 0.00% 0.00% 0.00% 0.00% 0.00% 0.00% 0.00% 0.00% 0.00% 0.00% 0.00% 0.00% 0.00% 0.00% 0.00% 0.00% 0.00% 0.00% 0.00% 0.00% 0.00% 0.00% 0.00% 0.00% 0.00% 0.00% 0.00% 0.00% 0.00% 0.00% 0.00% 0.00% 0.00% 0.00% 0.00% 0.00% 0.00% 0.00% 0.00% 0.00% 0.00% 0.00% 0.00% 0.00% 0.00% 0.00% 0.00% 0.00% 0.00% 0.00% 0.00% 0.00% 0.00% 0.00% 0.00% 0.00% 0.00% 0.00% 0.00% 0.00% 0.00% 0.00% 0.00% 0.00% 0.00% 0.00% 0.00% 0.00% 0.00% 0.00% 0.00% 0.00% 0.00% 0.00% 0.00% 0.00% 0.00% 0.00% 0.00% 0.00% 0.00% 0.00% 0.00% 0.00% 0.00% 0.00% 0.00% 0.00% 0.00% 0.00% 0.00% 0.00% 0.00% 0.00% 0.00% 0.00% 0.00% 0.00% 0.00% 0.00% 0.00% 0.00% 0.00% 0.00% 0.00% 0.00% 0.00% 0.00% 0.00% 0.00% 0.00% 0.00% 0.00% 0.00% 0.00% 0.00% 0.00% 0.00% 0.00% 0.00% 0.00% 0.00% 0.00% 0.00% 0.00% 0.00% 0.00% 0.00% 0.00% 0.00% 0.00% 0.00% 0.00% 0.00% 0.00% 0.00% 0.00% 0.00% 0.00% 0.00% 0.00% 0.00% 0.00% 0.00% 0.00% 0.00% 0.00% 0.00% 0.00% 0.00% 0.00% 0.00% 0.00% 0.00% 0.00% 0.00% 0.00% 0.00% 0.00% 0.00% 0.00% 0.00% 0.00% 0.00% 0.00% 0%
5%
10%
15%
20%
25%
30%
35%
40%
45%
50%
-15% -10% -5% 0% 5% 10% 15% 20% 25% 30%
EB
ITD
A M
arg
in (
2009
-2011)
Sales Revenue CAGR (2009-2011)
Source : Bloomberg, Oliver Wyman proprietary analysis
13
How industry players are exploiting organizational
levers
Section 3

14 14 © OLIVER WYMAN
BAE Systems COMPANY AT A GLANCE
• Sales 2011: $28.5 Billion
• 93,500 employees
• Presence in more than 100 countries
• Second largest global defense supplier
KEY ORGANIZATIONAL ATTRIBUTES (con’t)
ORGANIZATION
The business is reported through five principal reporting segments
• Electronic Systems
• Cyber & Intelligence
• 3 Platforms & Services: US – UK – and International
Executive Committee and other direct reports to the Chief Executive
TALENT
Center for Performance Excellence dedicated to the development and transfer
of best practices
Jobs campaign through radio and social media to detect and support the talent
pipeline in the US
CEO is homegrown – was the former COO
INNOVATION
2011: 1,807 M$ spent on R&D (7% of Revenue)
BAE Systems investment in innovation (I3) is a multi-million dollar program to
develop technologies
Partnership with academia as well as small and medium size businesses
CULTURE AND VALUES
Trusted – Innovative – Bold (challenge and initiative)
Customer Focus, Financial Performance, Program Execution and Responsible
Behavior
Diversity ( 25% of BAE Board are women)
TRANSFORMATION
In October 2011, the Group announced changes to its external reporting
segments to improve performance visibility
KEY ORGANIZATIONAL ATTRIBUTES
PURPOSE / VISION
To be the premier global defense, aerospace and security company
To deliver sustainable growth in shareholder value through
commitment to Total Performance
STRATEGY
Support customers in safeguarding their vital interests
Drive shareholder value by improving financial performance and
competitive positions across the business
Sustain a leadership position in the electronic warfare market
Increase productivity and efficiency
Improve profit and cash generation
Increase international business
ACQUISITONS
Acquisition to sustain the group’s position - especially for its Cyber and
Intelligence division:
• 2011: L-1 Identity Solutions, Inc.’s Intelligence Services Group
• 2011: Norkom Group plc
• 2011: ETI A/S
• 2011: Stratsec.net Pty Limited
Source : Public information , annual report
15 15 © OLIVER WYMAN
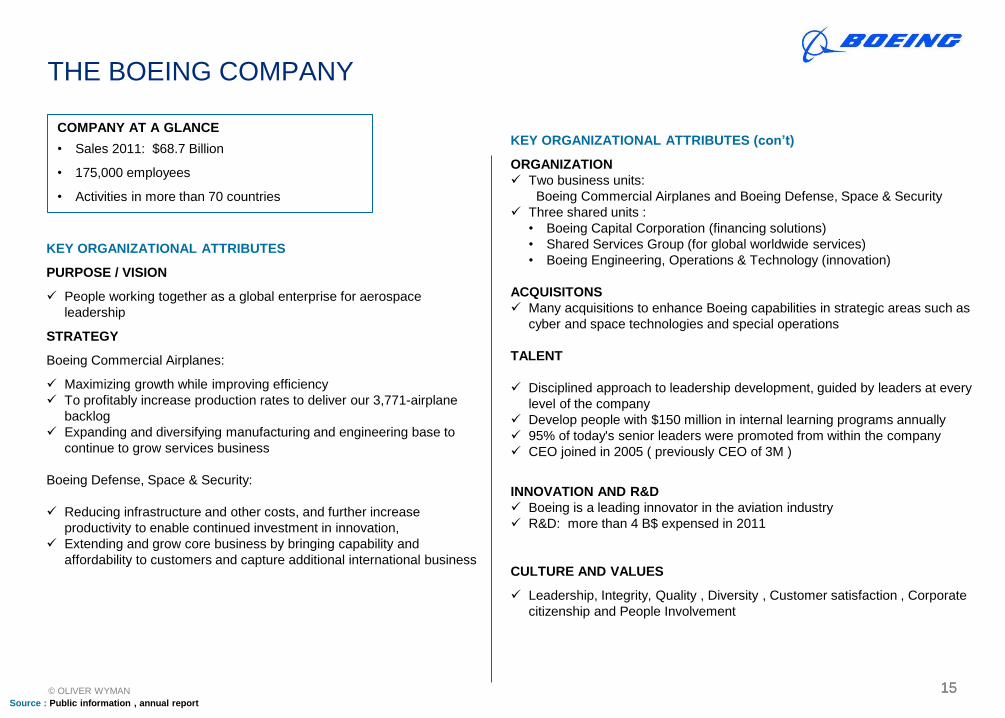
THE BOEING COMPANY
COMPANY AT A GLANCE
• Sales 2011: $68.7 Billion
• 175,000 employees
• Activities in more than 70 countries
KEY ORGANIZATIONAL ATTRIBUTES (con’t)
ORGANIZATION
Two business units:
Boeing Commercial Airplanes and Boeing Defense, Space & Security
Three shared units :
• Boeing Capital Corporation (financing solutions)
• Shared Services Group (for global worldwide services)
• Boeing Engineering, Operations & Technology (innovation)
ACQUISITONS
Many acquisitions to enhance Boeing capabilities in strategic areas such as
cyber and space technologies and special operations
TALENT
Disciplined approach to leadership development, guided by leaders at every
level of the company
Develop people with $150 million in internal learning programs annually
95% of today's senior leaders were promoted from within the company
CEO joined in 2005 ( previously CEO of 3M )
INNOVATION AND R&D
Boeing is a leading innovator in the aviation industry
R&D: more than 4 B$ expensed in 2011
CULTURE AND VALUES
Leadership, Integrity, Quality , Diversity , Customer satisfaction , Corporate
citizenship and People Involvement
KEY ORGANIZATIONAL ATTRIBUTES
PURPOSE / VISION
People working together as a global enterprise for aerospace
leadership
STRATEGY
Boeing Commercial Airplanes:
Maximizing growth while improving efficiency
To profitably increase production rates to deliver our 3,771-airplane
backlog
Expanding and diversifying manufacturing and engineering base to
continue to grow services business
Boeing Defense, Space & Security:
Reducing infrastructure and other costs, and further increase
productivity to enable continued investment in innovation,
Extending and grow core business by bringing capability and
affordability to customers and capture additional international business
Source : Public information , annual report
16 16 © OLIVER WYMAN
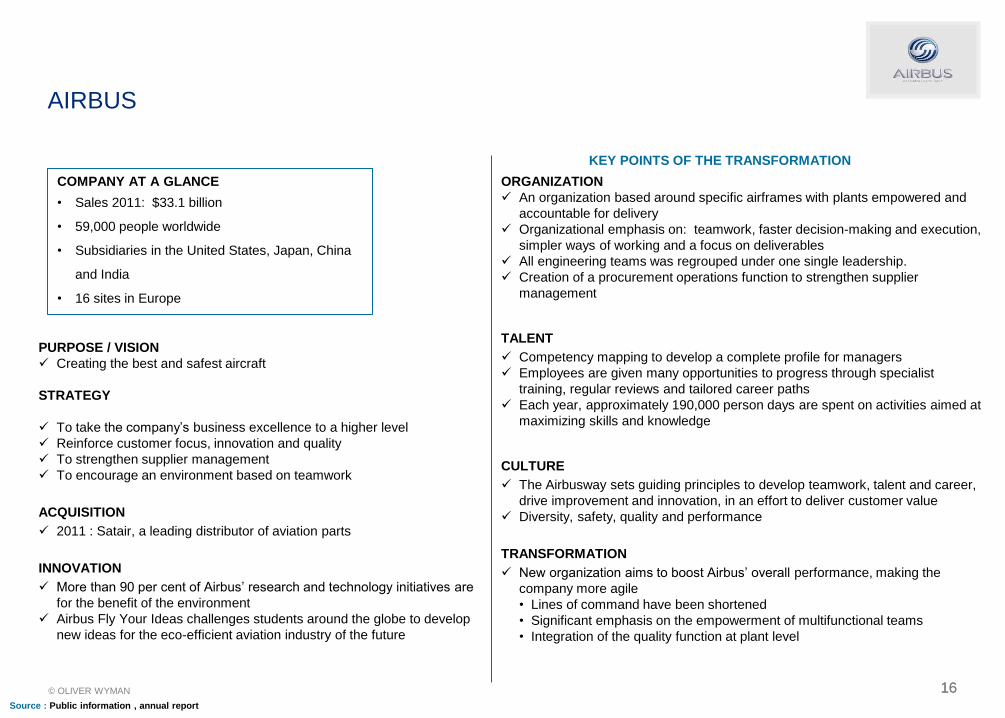
AIRBUS
KEY POINTS OF THE TRANSFORMATION
ORGANIZATION
An organization based around specific airframes with plants empowered and
accountable for delivery
Organizational emphasis on: teamwork, faster decision-making and execution,
simpler ways of working and a focus on deliverables
All engineering teams was regrouped under one single leadership.
Creation of a procurement operations function to strengthen supplier
management
TALENT
Competency mapping to develop a complete profile for managers
Employees are given many opportunities to progress through specialist
training, regular reviews and tailored career paths
Each year, approximately 190,000 person days are spent on activities aimed at
maximizing skills and knowledge
CULTURE
The Airbusway sets guiding principles to develop teamwork, talent and career,
drive improvement and innovation, in an effort to deliver customer value
Diversity, safety, quality and performance
TRANSFORMATION
New organization aims to boost Airbus’ overall performance, making the
company more agile
• Lines of command have been shortened
• Significant emphasis on the empowerment of multifunctional teams
• Integration of the quality function at plant level
PURPOSE / VISION
Creating the best and safest aircraft
STRATEGY
To take the company’s business excellence to a higher level
Reinforce customer focus, innovation and quality
To strengthen supplier management
To encourage an environment based on teamwork
ACQUISITION
2011 : Satair, a leading distributor of aviation parts
INNOVATION
More than 90 per cent of Airbus’ research and technology initiatives are
for the benefit of the environment
Airbus Fly Your Ideas challenges students around the globe to develop
new ideas for the eco-efficient aviation industry of the future
COMPANY AT A GLANCE
• Sales 2011: $33.1 billion
• 59,000 people worldwide
• Subsidiaries in the United States, Japan, China
and India
• 16 sites in Europe
Source : Public information , annual report

17
Why participate in Oliver Wyman’s study?
Section 4
18 18 © OLIVER WYMAN
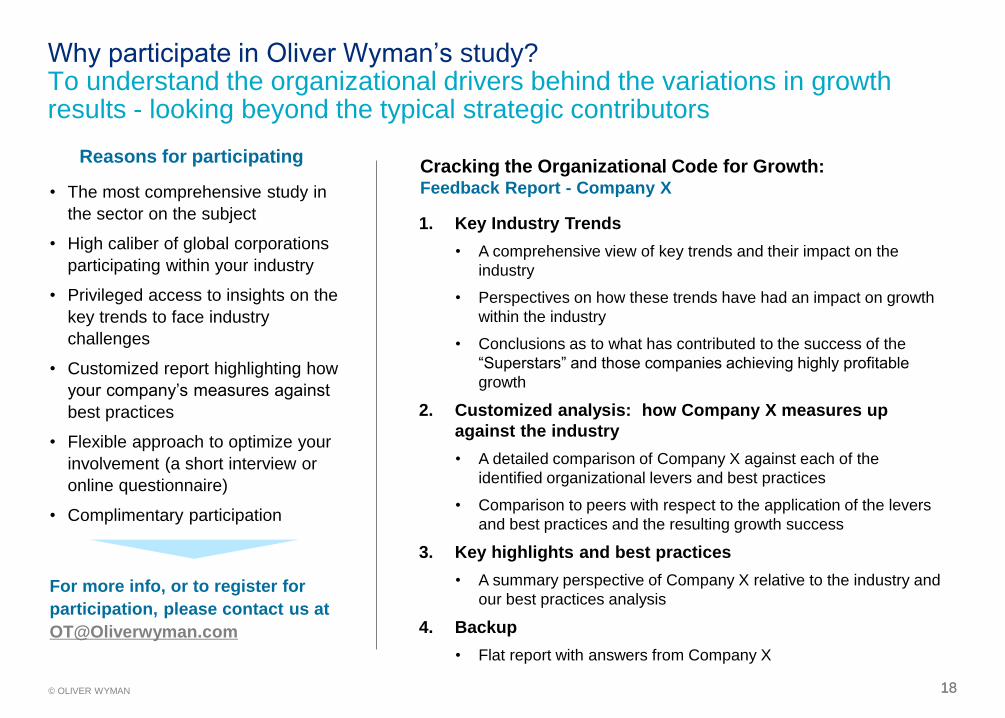
Why participate in Oliver Wyman’s study? To understand the organizational drivers behind the variations in growth results - looking beyond the typical strategic contributors
• The most comprehensive study in
the sector on the subject
• High caliber of global corporations
participating within your industry
• Privileged access to insights on the
key trends to face industry
challenges
• Customized report highlighting how
your company’s measures against
best practices
• Flexible approach to optimize your
involvement (a short interview or
online questionnaire)
• Complimentary participation
Reasons for participating
For more info, or to register for
participation, please contact us at
1. Key Industry Trends
• A comprehensive view of key trends and their impact on the
industry
• Perspectives on how these trends have had an impact on growth
within the industry
• Conclusions as to what has contributed to the success of the
“Superstars” and those companies achieving highly profitable
growth
2. Customized analysis: how Company X measures up
against the industry
• A detailed comparison of Company X against each of the
identified organizational levers and best practices
• Comparison to peers with respect to the application of the levers
and best practices and the resulting growth success
3. Key highlights and best practices
• A summary perspective of Company X relative to the industry and
our best practices analysis
4. Backup
• Flat report with answers from Company X
Cracking the Organizational Code for Growth: Feedback Report - Company X

CONFIDENTIALITY
Our clients’ industries are extremely competitive. The confidentiality of companies' plans and data is obviously critical. will
protect the confidentiality of all such client information.
Similarly, management consulting is a competitive business. We view our approaches and insights as proprietary and therefore
look to our clients to protect 's interests in our presentations, methodologies and analytical techniques. Under no circumstances
should this material be shared with any third party without the written consent of .
Copyright ©