cracking in flocculated dispersions - iit bombay · cracking in flocculated dispersions ... 2.7...
TRANSCRIPT

CRACKING IN FLOCCULATED DISPERSIONS
M. TECH. PROJECT
Submitted in Partial Fulfillment of
the Requirements for the Degree of
MASTER OF TECHNOLOGY
in
CHEMICAL ENGINEERING
by
LAXMAN BHOSALE
(Roll no. 06302019)
Guided by
Prof. M. S. Tirumkudulu
DEPARTMENT OF CHEMICAL ENGINEERING INDIAN INSTITUTE OF TECHNOLOGY
BOMBAY 400 076
JULY 2008

CONTENTS
Name Page No. Approval Certificate iii
Abstract iv
Acknowledgment v
List of Figures ix
Nomenclature x
Abbreviations xi
1 Introduction 1
2 Literature Review 6
2.1 Latex Film Formation 6
2.1.1 Evaporation, Particle Concentration and Ordering 6
2.1.2 Particle Deformation 7
2.1.3 Polymer Chain Diffusion across Particle Boundaries 7
2.2 Cracking in Films formed from Stable and Flocculated
Dispersions
9
2.2.1 Stable Dispersions 9
2.2.2 Flocculated Dispersions 14
3 Experimental Section 18
3.1 Preparation of Dispersions 18
3.2 Final Close-Packed Volume Fraction Measurements 20
3.3 CCT Measurements 24
3.4 Stress Measurements 25
4 Results and Discussion 31
4.1 Final Close-Packed Volume Fraction 31
4.2 Critical Cracking Thickness (CCT) 34

4.2.1 Film Surface Patterns 34
4.2.2 Crack Patterns 35
4.2.3 Thickness Profile 38
4.2.4 Comparison of Experimental CCT with CCT Obtained
from Model
42
4.3 Critical Cracking Stress (CCS) 46
5 Conclusions and Future Work 51
References

iii
Approval Certificate
Department of Chemical Engineering
Indian Institute of Technology Bombay,
The M. Tech. project titled “Cracking in Flocculated Dispersions” submitted by
Laxman R. Bhosale (Roll No. 06302019) may be accepted for evaluation. Date: 03/07/2008
Guide……………………….......................... Co-Guide…………………………………… Internal Examiner………………………....... External Examiner………………………...... Chairman………………………....................

iv
ABSTRACT
Understanding the mechanism of cracking during drying of aqueous colloidal
dispersions has received considerable attention in the recent years. In many important
products such as paints, wet clays, coatings, etc. cracking is highly undesirable.
Hence, there is a need to understand the phenomena of cracking so that failure of
films can be controlled. Most of the work reported in literature have used stable
aqueous dispersions for this type of studies (Singh and Tirumkudulu, 2007;
Tirumkudulu and Russel, 2005; Dufresne et al., 2003). Although flocculated
dispersions are used in variety of applications, film formation in such systems is less
investigated. In this work, we have studied the cracking of colloidal films formed
from flocculated dispersions of -alumina in water. Here, the extent of flocculation
is controlled by varying the pH of the dispersion and characterized in terms of close-
packed volume fraction of the dried film. The effect of flocculation on critical
cracking thickness (CCT) and critical cracking stress (CCS) is measured by changing
the pH of the dispersion. Further, the experimental results are compared with the
model predictions of Singh and Tirumkudulu (2007) and a good agreement is found
between the theory and experiments, suggesting that the model is universal and
applies equally well to stable and flocculated systems. This report begins with an
overview of the latex dispersions followed by literature review, experimental section,
results and discussion and finally conclusions.

v
ACKNOWLEDGEMENT
I seek this opportunity to express my sincere thanks to my guide,
Prof. M. S. Tirumkudulu for his sustained support and encouragement
during the course of this project. I extend my special thanks to Mr.
Karnail B. Singh for helping me in the experimental work. I am also
thankful to all my lab-mates, especially Mr. Arijit Sarkar for their help
and criticism. Finally, I would like to thank Indian Institute of
Technology, Bombay for financial and technical support.
Laxman Bhosale
30th June 2008

vi
LIST OF FIGURES Figure
No.
Title Page
No. 1.1 Schematic of a (i) Stable and (ii) Flocculated Dispersion 3
2.1 Latex film drying process 8
2.2 Three stages of film formation 8
2.3 Critical cracking thickness variation as a function of the shear
modulus
10
2.4 Schematic diagram of an isolated crack propagating across the
film
11
2.5 The measured CCT vs the characteristic scale 2/13 )2( RMG rcp
12
2.6 Effect of NaCl concentration on the CCT of alumina suspensions 14
2.7 Variation of zeta potential as a function of AKP-30 dispersion
without addition of any electrolyte
16
2.8 The semi-empirically corrected -potential, corr , of AKP-30
alumina suspensions as a function of both volume fraction and pH
16
2.9 Variation of zeta potential ( ) of ALCOA-A16 alumina
suspensions as a function of both volume fraction and pH.
Experiments were done with 10mM NaCl as background
electrolyte
17
3.1 Experimental setup for pH measurement 19
3.2 (a) Formation of packed region and movement of particles in
circular capillary; (b) Estimation of Maximum packing fraction
20
3.3 SEM of AKP-30 particles 22
3.4 SEM of ALCOA-A16 particles 23
3.5 Dektak 150 Surface profiler (i) Front view of profilometer and (ii)
Close view of Stylus and stage
24
3.6 Schematic of the experimental setup for stress measurements 25

vii
3.7 Plot of measured stress vs time for AKP-30 dispersion with
pH=3.3, 16.0i and N = 156. The measurements were done at
26.4oC and 42% RH
27
3.8 Plot of measured stress vs time for AKP-30 dispersion with
pH=6.5, 14.0i , and N = 177. The measurements were done at
26.2oC and 42% RH
28
3.9 Plot of measured stress vs time for AKP-30 dispersion with
pH=7.8, 14.0i , and N = 303. The measurements were done at
25.9oC and 38% RH
28
3.10 Plot of measured stress vs time for AKP-30 dispersion with
pH=10.0, 13.0i and N = 262. The measurements were done at
25.8oC and 32%RH
29
3.11 Plot of measured stress vs time for AKP-30 dispersion with
pH=11.1, 17.0i , and N = 234. The measurements were done at
25.8oC and 38% RH
29
3.12 Weight of the drying film as a function of time for AKP-30
dispersion spread on silicon wafer (i) Evaporation rate calculated
using all data points and (ii) Evaporation rate calculated using
initial weight of the film and final four points
30
4.1 Variation of maximum close-packed volume fraction ( m ) as a
function of pH for AKP-30 dispersion without background
electrolyte (Temp= 26.1 oC and relative humidity =43%)
32
4.2 Variation of final close-packed volume fraction ( m ) as a
function of pH for AKP-30 dispersion with background electrolyte
concentration of 50mM NaCl (Temp= 26.6 oC and relative
humidity =53%)
32
4.3 Variation of maximum close-packed volume fraction ( m ) as a
function of pH for ALCOA-A16 dispersion (Temp= 26.1 oC and
relative humidity =43%)
33

viii
4.4 Picture of crack-free dried film obtained from drying stable
dispersions (pH < 7 and pH > 12). Picture (i) is captured by using
wide angle camera and picture (ii) is captured by using
microscope.
34
4.5 Picture of crack-free dried film obtained from drying flocculated
dispersions (7 < pH < 12). Picture (i) is captured by using wide
angle camera and picture (ii) is captured by using microscope. In
picture (ii), arrows indicate regions of bright spots
34
4.6 Pictures of different dried films of stable dispersions (pH < 7)
showing cracks
36
4.7 Pictures of different dried films of dispersions at pH ~ 7.25
showing cracks
36
4.8 Pictures of circular crack formed in different dried films of
flocculated dispersions (7.75 < pH < 11.5). Arrows indicate the
circular crack.
37
4.9 Thickness profile of a film dried (pH = 2.5) at 26.7oC and 35%RH 39
4.10 Thickness profile of a film dried (pH = 5.4) at 26.7oC and 35%RH 39
4.11 Thickness profile of a film dried (pH = 9.5) at 26.7oC and 35%RH 40
4.12 Thickness profile of a film dried (pH = 11) at 26.7oC and 35% RH 41
4.13 Mean coordination numbers (M) as a function of close-packed
volume fraction for several kinds of packings
42
4.14 Extrapolation of close-packed volume fraction below 0.5 43
4.15 Predicted Critical Cracking Thickness (CCT) as a function of pH
of AKP-30 dispersion. Filled symbols represent predictions and
empty symbols represent experimental measurements
45
4.16 The measured CCT as a function of pH for AKP-30 dispersions 45
4.17 The predicted and measured dimensionless critical cracking stress
)2/( Rc as a function of pH of AKP-30 dispersion at different
film heights. Filled symbols represent predictions and empty
symbols represent the values obtained by interpolation of
experimental stress values from line equation shown in figure 4.19
47

ix
4.18 The predicted and measured dimensionless critical cracking stress
)2/( Rc as a function of pH of AKP-30 dispersion at different
film heights. Filled symbols represent predictions by increasing
factor in equation 2.1 by 2 and empty symbols represent the values
obtained by interpolation of experimental stress values from line
equation shown in figure 4.19
47
4.19 Plot of measured dimensionless critical cracking stress )2/( Rc
vs the dimensionless film thickness )2/( Rhrcp
48
4.20 Plot of measured dimensionless critical cracking stress )2/( Rc
vs the dimensionless characteristic scale )/( 2NM m . The data
points are for films of AKP-30 dispersion with varying pH. The
solid line is a power law fit with an exponent of 1/3. C is the
constant
50

x
NOMENCLATURE
Symbol Name First used
on Page No.
elasticE Elastic energy recovery per unit length of the crack 10
Es Young’s modulus of the substrate 25
G shear modulus of the particles 10
hmax Critical cracking thickness 4
oL Initial length of dispersion in capillary 21
mL Final length of packed region in capillary (after
drying)
21
M Coordination number 11
N Dimensionless film thickness ( Rh 2/ ) 11
Pmax Maximum attainable capillary pressure 12
R Particle radius 11
st Substrate thickness 26
ft Film thickness 26
c Critical cracking stress 4
m Maximum close-packed volume fraction 4
rcp Random closed packing fraction 3
Solvent-air interfacial tension 10
Zeta potential 15
Deflection angle 24
Wetting angle 13
f Bulk stress in the film 26

xi
ABBREVIATIONS CCT Critical Cracking Thickness
CCS Critical Cracking Stress
RCP Random Closed Packing
SEM Scanning Electron Microscope
1
CHAPTER 1
INTRODUCTION
Traditionally, organic solvents have been used for the preparation of paint
dispersions. Solvents which are used in these dispersions have a high boiling point, so
that the “open time” defined as the time between the application of the paint and start
of the actual drying process, is sufficiently long for the easy application of these
products. Volatile organic solvents are used to plasticize the polymer and thereby
convert it to a homogeneous film at room temperature (Routh and Russel, 2001). In
case of traditional paints and coatings, large amounts of volatile organic compounds
(VOCs) are emitted during the film formation stage. Since the traditional solvent
based coatings pose serious environmental hazards due to the highly polluting effects
of the solvents (Keddie, 1997), the coating industries are being forced to reduce VOC
emissions via government regulations. Consequently, in several European countries,
indoor use of solvent-based architectural coatings has been banned. One of the reports
published by the Environmental Protection Agency (EPA, USA) shows that the
indoor air pollution is about 10-40 times higher than the outdoor pollution and it is
attributed to the solvent emission by paints and coatings. So it is necessary to find
alternative ways to either reduce or eliminate solvents in coating formulations.
Several alternatives such as water-based coatings, applying coatings in the polymer
melt form, increasing solids volume fraction and using powder coatings exist, but
water based latex coatings have been identified as a worthy alternative because of
ease of application and faster drying (Keddie, 1997).
When solid colloidal particles are dispersed in a liquid then it is called as a sol.
On the other hand, when liquid droplets are dispersed in another liquid, it is called an
emulsion. Latex is a colloidal dispersion of polymer particles in an aqueous solution.

2
Lattices now constitute about eight percent of the world’s total production of
polymers. Latex particles are generally prepared by emulsion polymerization. In this
reaction, monomers are loaded along with an initiator and surfactant into the reactor.
The monomer goes inside the micelle and starts polymerizing. Here, the micelle itself
acts as a small reactor. The size and shape of latex particle depends on the type of
micelle formed by addition of surfactant. Usually these particles are spherical. Typical
particle size obtained by this mechanism varies from 100 nm to 1000 nm.
Latex film formation is essential to products such as paints, adhesives (Mayer
et al., 1995), caulks and sealants, paper coatings, textiles and carpets. Various authors
have mentioned other applications of latex such as in foam mattresses, composites
(Okubo et al., 1983; Crowley et al., 1992), floor polish (Brodnyan and Konen, 1964),
gloves (Dobler et al., 1992) etc.
In most applications, the requirement is that final dried film should be
continuous. The morphology of the final dry film depends on many factors such as
properties of the polymers, method of preparation of latexes and their film formation
mechanism. But many times the properties of latex coatings are inferior to solvent-
based coatings due to incomplete film formation. Water based latex coatings differ
from solvent based latex coatings in terms of their final permeability and mechanical
properties. There are many reasons for incomplete film formation such as incomplete
particle deformation, non-uniform drying, and improper chain diffusion. The quality
of the film deteriorates because of non uniformity and presence of voids in the final
film. To get the required film properties, latex particles should come together and
aggregate to form a continuous film. In this regard, Protzman and Brown (1960)
developed the concept of the Minimum Filming Temperature (MFT) which is defined
as that temperature at which latex cast film becomes continuous and clear. Below this

3
critical temperature, the dry latex is opaque and powdery. MFT primarily indicates the
lower temperature range over which a latex application will be useful. From their first
use in the paint industry, latex coatings have been used in many applications in the
previous years. Although synthetic latex is produced in large quantity, many aspects
of its formation are still not clear.
Most studies reported in literature (Singh and Tirumkudulu 2007; Keddie et
al., 1995; Sperling et al., 1993) have focused on stable dispersions. Here, particles are
well separated from each other during drying and touch each other only when the
particle volume fraction reaches that for random close packing ( rcp ). Stability of the
dispersion is mainly determined by the balance of three forces namely electrostatic
repulsion, van der Waals attraction and steric attraction or repulsion. In case of
flocculated dispersions, the interparticle stabilizing forces are weak and are overcome
by the attractive van der Waals forces causing the particles to contact well before
reaching random close packing. It means that the particles form chain like structures
for concentrations much lower than that for random close packing (figure 1.1). Due to
the formation of flocculated structures, the cracking characteristics are expected to be
different from that for stable dispersions. Thus, it is not clear whether the mechanism
controlling cracking in stable dispersions also applies to flocculated systems.
(i) (ii)
Figure 1.1 Schematic of a (i) Stable and (ii) Flocculated Dispersion

4
Terminology:
Few terms which will be used often in this report are defined as follows:
Consider an aqueous colloidal dispersion, applied on an impermeable substrate.
Final close packed volume fraction ( m ): The volume fraction of solids in the
completely dried film is known as final close packed volume fraction.
CCT: The thickness above which the drying film would crack spontaneously is
known as critical cracking thickness.
CCS: The stress at which first crack nucleates in the film is the critical cracking
stress.
Objectives:
The objectives of this project are
1) To study the effect of flocculation (pH ) on
Final close-packed volume fraction of particles ( m )
Critical cracking thickness (CCT) of the film (hmax)
Critical cracking stress (CCS) of the film ( c )
2) To compare the measured values of critical cracking thickness and critical
cracking stress with the theoretical models available in literature.

5
In this report, different stages of film formation and the relevant studies on
stable and flocculated dispersions reported in literature are discussed in chapter 2.
Chapter 3 focuses on the experimental procedure for preparing dispersions and
measurement of final close packed volume fraction, thickness of the film and tensile
stress in the drying film. Chapter 4 presents the experimental results and their
comparison with the models available in literature. We found that flocculation affects
the particle ordering which changes the final close packed volume fraction of the
dried film. Further, we have also determined the effect of flocculation on critical
cracking thickness (CCT) and critical cracking stress (CCS). Finally, we have
compared the experimental CCT and CCS with the predictions of model developed by
Singh and Tirumkudulu (2007) and found that experiments are in good agreement
with the theory. Finally, the conclusions and scope for future work are discussed in
chapter 5.

6
CHAPTER 2
LITERATURE REVIEW
2.1 Latex Film Formation:
When a thin film of latex containing soft polymer particles is applied on an
impermeable substrate and dried, a continuous, homogeneous film can be achieved
under appropriate conditions. This process is known as film formation. During film
formation, these colloidal particles must overcome their mutual repulsion in order to
form a continuous film. So lot of effort goes into keeping the colloidal particles
separated and deflocculated in order to obtain a stable dispersion.
Though many have studied the latex film formation process (Steward et al.,
2000; Zhao et al., 1990; Lin and Meier, 1995; Brown, 1956; Henson et al., 1953), the
process is not completely understood. The process of drying and film formation in
latex coatings occurs in three stages as shown in figure 2.2. These stages are
explained in the following subsections (Steward et al., 2000).
2.1.1 Evaporation, Particle Concentration and Ordering:
When a thin film of aqueous colloidal dispersion is applied on an impermeable
substrate, water evaporates resulting in an increase in solid concentration. In stable
dispersions, the strong inter-particle repulsive forces disperse the particles against the
tendency of van der Waals force and Brownian motion to bring particles together.
Further evaporation causes particles to concentrate into a close packed array (Sheetz,
1965; Routh and Russel, 1998, 2001; Tirumkudulu and Russel, 2004). The studies
made by Eckersley et al. (1994) confirm that drying rate during the first stage is
constant. If a porous substrate is used instead, then water can leave the latex either by
evaporation into the ambient atmosphere or by absorption into the porous substrate.

7
Most of the studies have concentrated on the evaporative mechanism and considered
impermeable substrates. This is also because most applications involve nonporous
substrates. Because of the liquid meniscus formed between two particles at the
periphery of the film, a low pressure zone is created. This causes the convection of
latex particles towards the packed region. The formation of packed region and
movement of particles is shown in the figure 2.1.
2.1.2 Particle Deformation:
At the beginning of the second stage, particles are observed at the surface of
latex. At this stage, forces which overcome the electrostatic and/or steric repulsions
between particles start acting (Dobler et al., 1991). Further evaporation of water
causes the development of stresses in the wet film (Winnik, 1997). If the particles are
soft, they deform and coalesce so as to close the pores whereas in case of hard
particles, stresses are released by the nucleation and propagation of cracks
(Tirumkudulu and Russel, 2005).
The various theories proposed so far show that particle deformation occurs
due to one or more of the following forces: air/water, water/polymer, or polymer/air
interfacial tension, osmotic force and surface adhesive force (Keddie, 1997).
2.1.3 Polymer Chain Diffusion across Particle Boundaries:
During stage 3, diffusion of particles takes place across particle-particle
interface to fuse the particles. Due to diffusion controlled evaporation, the drying rate
during this stage decreases drastically. The rate of polymer inter-diffusion is mainly
affected by the temperature of the system, molecular weight of polymer, cross-linking
of polymers (Zosel and Ley, 1993), organic solvents (Juhue and Lang, 1994), co-
surfactants (Kim et al., 1994) and coalescing aids. Although the three stages of film

8
formation have been studied for a long time the mechanisms responsible for drying
and particle deformation are not fully understood (Tirumkudulu and Russel, 2004).
Figure 2.1 Latex film drying process (Tirumkudulu and Russel, 2004)
Figure 2.2 Three stages of film formation (Winnik, 1997)

9
2.2 Cracking in Films formed from Stable and Flocculated
Dispersions:
2.2.1 Stable Dispersions:
When a thin film of aqueous colloidal dispersion is applied on a nonporous
substrate, it could crack due to the stresses generated in it. One of the most important
experimental studies on cracking of colloidal films formed from stable dispersion was
reported by Chiu et al. (1993). They studied the cracking during drying of wet
ceramics and found that irrespective of particle size and rigidity there exists a critical
thickness below which films do not crack. Further, this thickness was found to
increase with increase in particle size. Singh and Tirumkudulu (2007) identify two
regimes for obtaining crack free films. For dispersions containing hard particles
(stress-limited regime), the CCT increases with particle size as well as particle rigidity
while for soft particles where particles completely deform to close the pores (strain
limited regime), the critical thickness decreases with increasing particle rigidity but is
independent of particle size (figure 2.3). Further, the way particles pack is also found
to influence their cracking behavior.

10
Figure 2.3 Critical cracking thickness variation as a function of the shear
modulus (Singh and Tirumkudulu, 2007)
Drying of films is accompanied by transverse stresses created due to decrease
in volume of the film during drying. The transverse tensile stress ( ) created in the
film scales with the square of compressive strain ( ), ~ 2G , where ‘G’ is the
shear modulus. When an isolated crack is initiated in the film, stresses over the length
of h around the crack will be released from the film (Singh and Tirumkudulu, 2007).
The elastic energy recovered per unit length of the crack scales as elasticE ~ 2h . At
the same time same, there will be increase in the surface energy per unit length
( sE ~ h ), where is the water/air interfacial tension. According to Griffith’s
energy balance concept, these two energies are equal. So by equating these two
energies, we get c ~ 3/23/1 )( hG (Singh and Tirumkudulu, 2007). In case of hard
particles, even the maximum capillary pressure is not able to completely deform them,
so that the critical cracking stress can be obtained by equating the critical stress to the

11
tensile stress at the maximum capillary pressure, 3/23/1 )( hG ~ )( maxP , which
gives the critical cracking thickness as maxh ~ 2/3max
2/1 )( PG (Singh and
Tirumkudulu, 2007).
Figure 2.4 Schematic diagram of an isolated crack propagating across the film (Tirumkudulu and Russel, 2005)
The exact expression for the critical stress ( c ) was determined by
Tirumkudulu and Russel (2005) as,
3/13/1
2 21877.0
2RG
NMR mc (2.1)
Here, R is the particle radius, m is final close-packed volume fraction, M is
the coordination number and N is dimensionless film thickness ( Rh 2/ ).

12
Singh and Tirumkudulu (2007) obtained following exact expression for the
CCT of hard particles,
2/3
max
2/13
max )(2
264.0
RPRMGh m (2.2)
Here, Pmax is the maximum attainable capillary pressure.
Singh and Tirumkudulu (2007) measured critical cracking thicknesses over a
wide range of particle sizes and particle shear modulii against the characteristic scale
for the stress limited regime. They found that the observed scaling is in remarkable
agreement with the predictions over five orders of characteristic scale (figure 2.5).
They also found that the asphericity of the particles does not significantly affect the
CCT.
Figure 2.5 The measured CCT vs the characteristic scale 2/13 )2( RMG rcp (Singh and Tirumkudulu, 2007)
13
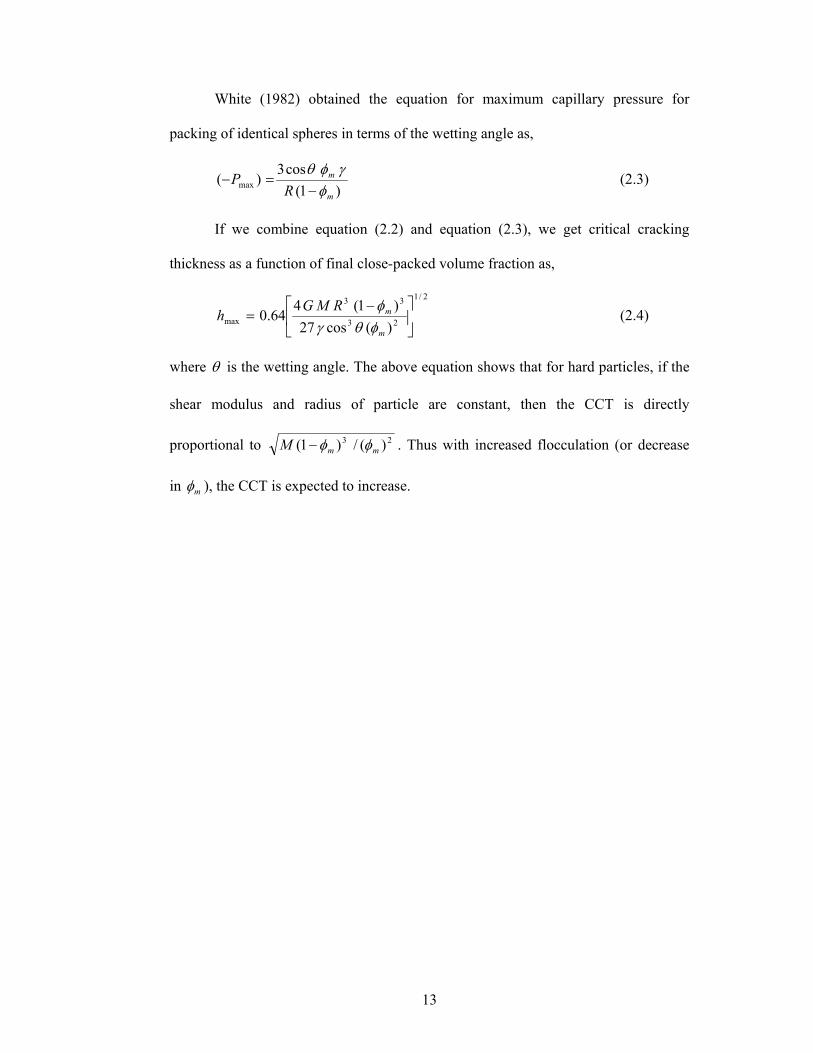
White (1982) obtained the equation for maximum capillary pressure for
packing of identical spheres in terms of the wetting angle as,
)1(cos3
)( maxm
m
RP (2.3)
If we combine equation (2.2) and equation (2.3), we get critical cracking
thickness as a function of final close-packed volume fraction as,
2/1
23
33
max )(cos27)1(4
64.0m
mRMGh (2.4)
where is the wetting angle. The above equation shows that for hard particles, if the
shear modulus and radius of particle are constant, then the CCT is directly
proportional to 23 )(/)1( mmM . Thus with increased flocculation (or decrease
in m ), the CCT is expected to increase.

14
2.2.2 Flocculated Dispersions:
Chiu et al. (1993) have reported the effect of pH and salt concentration and
thereby the degree of flocculation on critical cracking thickness. Here, the degree of
flocculation of the alumina dispersion was changed by adding varying amount of salt
(NaCl). It was found that the CCT initially increases with increase in NaCl
concentration, passes through a maximum and then starts decreasing (Figure 2.6).
Figure 2.6 Effect of NaCl concentration on the CCT of alumina suspensions (Chiu et al., 1993)
More recently, Carreras et al. (2007) studied the effect of flocculation on the
critical cracking thickness of alumina suspensions. In this study, they found that the
critical cracking thickness for dispersed suspensions (pH ~ 1.75) is 3 times greater
than that for flocculated dispersions (pH ~ 9). They attributed this increase in CCT to
the increase in close packed volume fraction for dispersed suspensions. A higher
close-packed volume fraction has more number of particle-particle interactions per
unit area and therefore the film can withstand higher stress. They also found that with
small amounts of cross-linked polymeric binder, critical cracking thickness can be
increased by a factor greater than 10.
15
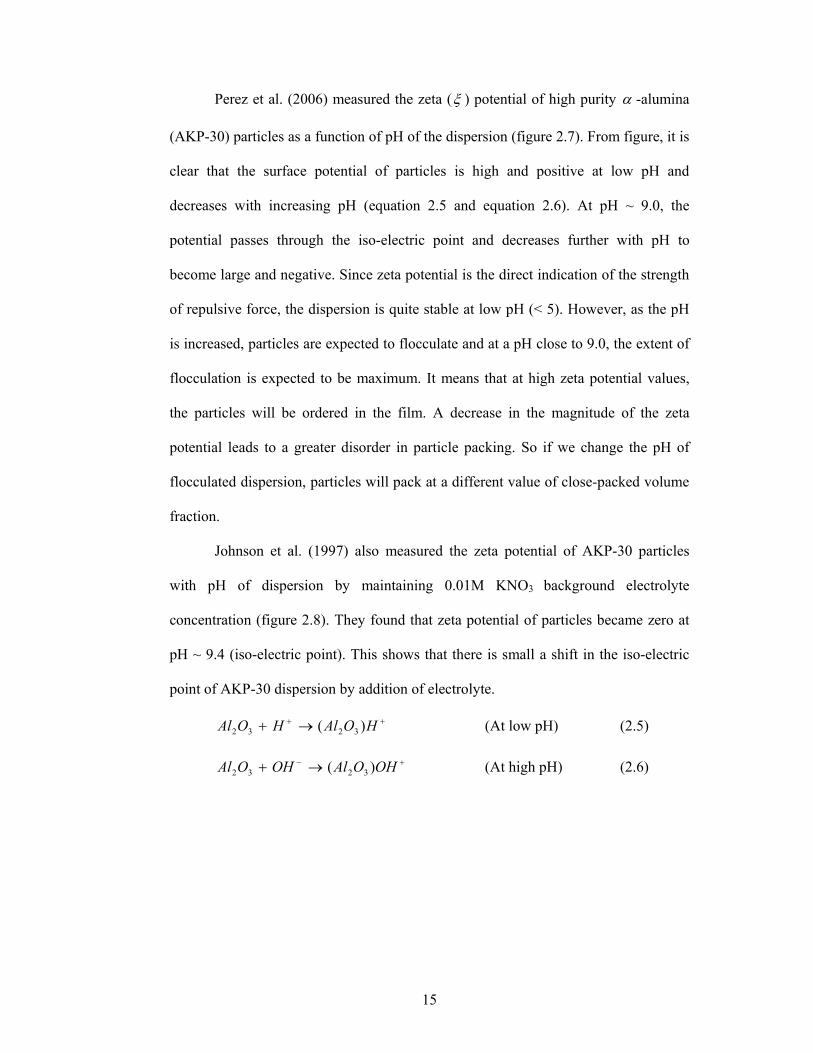
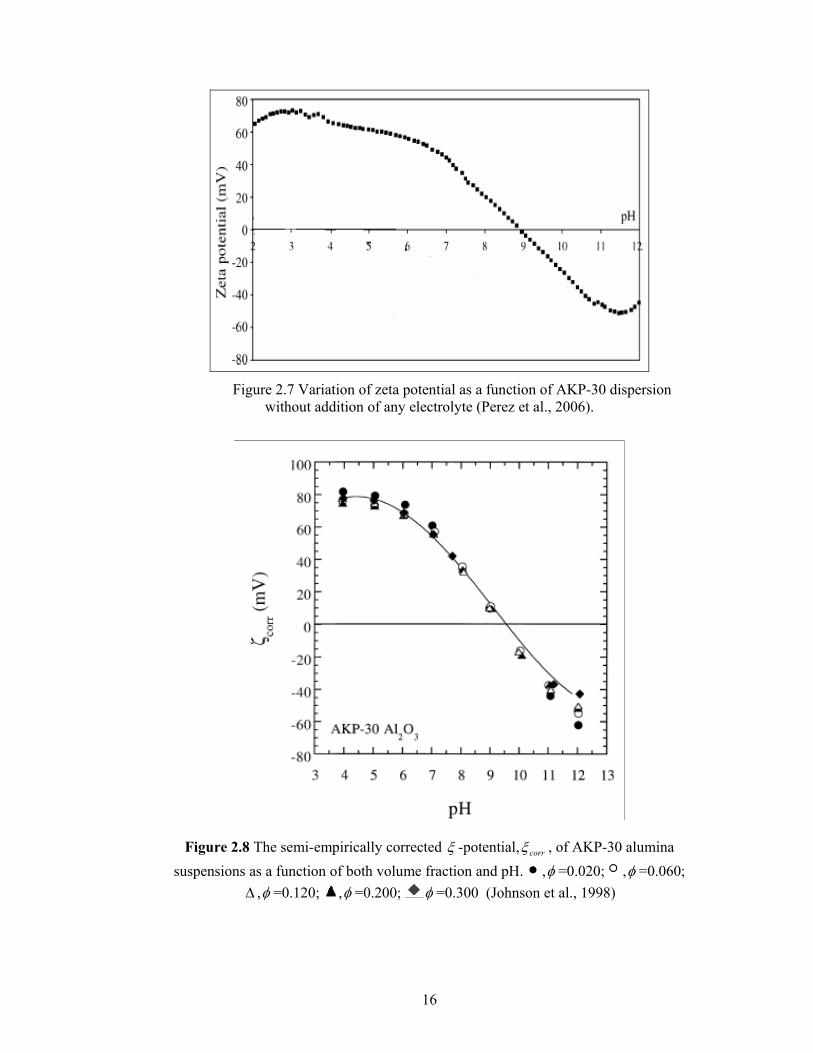
Perez et al. (2006) measured the zeta ( ) potential of high purity -alumina
(AKP-30) particles as a function of pH of the dispersion (figure 2.7). From figure, it is
clear that the surface potential of particles is high and positive at low pH and
decreases with increasing pH (equation 2.5 and equation 2.6). At pH ~ 9.0, the
potential passes through the iso-electric point and decreases further with pH to
become large and negative. Since zeta potential is the direct indication of the strength
of repulsive force, the dispersion is quite stable at low pH (< 5). However, as the pH
is increased, particles are expected to flocculate and at a pH close to 9.0, the extent of
flocculation is expected to be maximum. It means that at high zeta potential values,
the particles will be ordered in the film. A decrease in the magnitude of the zeta
potential leads to a greater disorder in particle packing. So if we change the pH of
flocculated dispersion, particles will pack at a different value of close-packed volume
fraction.
Johnson et al. (1997) also measured the zeta potential of AKP-30 particles
with pH of dispersion by maintaining 0.01M KNO3 background electrolyte
concentration (figure 2.8). They found that zeta potential of particles became zero at
pH ~ 9.4 (iso-electric point). This shows that there is small a shift in the iso-electric
point of AKP-30 dispersion by addition of electrolyte.
HOAlHOAl )( 3232 (At low pH) (2.5)
OHOAlOHOAl )( 3232 (At high pH) (2.6)
16
Figure 2.7 Variation of zeta potential as a function of AKP-30 dispersion
without addition of any electrolyte (Perez et al., 2006).
Figure 2.8 The semi-empirically corrected -potential, corr , of AKP-30 alumina suspensions as a function of both volume fraction and pH. , =0.020; , =0.060;
, =0.120; , =0.200; =0.300 (Johnson et al., 1998)

17
Greenwood (2003) measured the zeta potential of ALCOA-A16 particles as a
function of pH to determine iso-electric point (figure 2.9). They reported that
dispersion with particles having a zeta potential outside the range of -30mV to
+30mV are stable. They also studied the effect of background salt concentration on
the iso-electric point of the dispersion by using SDK160 alumina particles. In this
study, they found that iso-electric point of SDK160 alumina particles shifted from 8.1
with background concentration of 50mM NaCl to 7.4 with no salt present. With
background concentration of 10mM NaCl, they found that zeta potential of ALCOA-
A16 particles becomes zero at a pH value of 8.2 (iso-electric point).
Figure 2.9 Variation of zeta potential ( ) of ALCOA-A16 alumina suspensions as a function of both volume fraction and pH. Experiments were done with 10mM NaCl as background electrolyte. , =0.142; , =0.186; , = 0.237 (Greenwood, 2003)
18
CHAPTER 3
EXPERIMENTAL SECTION
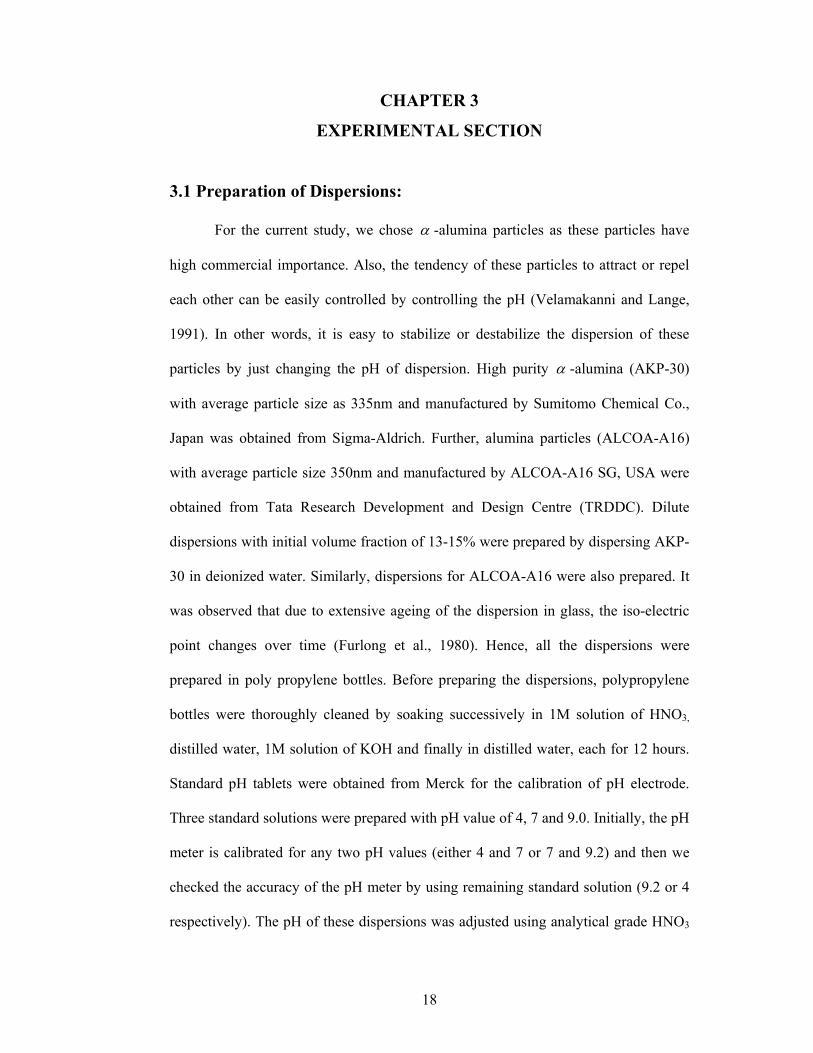
3.1 Preparation of Dispersions:
For the current study, we chose -alumina particles as these particles have
high commercial importance. Also, the tendency of these particles to attract or repel
each other can be easily controlled by controlling the pH (Velamakanni and Lange,
1991). In other words, it is easy to stabilize or destabilize the dispersion of these
particles by just changing the pH of dispersion. High purity -alumina (AKP-30)
with average particle size as 335nm and manufactured by Sumitomo Chemical Co.,
Japan was obtained from Sigma-Aldrich. Further, alumina particles (ALCOA-A16)
with average particle size 350nm and manufactured by ALCOA-A16 SG, USA were
obtained from Tata Research Development and Design Centre (TRDDC). Dilute
dispersions with initial volume fraction of 13-15% were prepared by dispersing AKP-
30 in deionized water. Similarly, dispersions for ALCOA-A16 were also prepared. It
was observed that due to extensive ageing of the dispersion in glass, the iso-electric
point changes over time (Furlong et al., 1980). Hence, all the dispersions were
prepared in poly propylene bottles. Before preparing the dispersions, polypropylene
bottles were thoroughly cleaned by soaking successively in 1M solution of HNO3,
distilled water, 1M solution of KOH and finally in distilled water, each for 12 hours.
Standard pH tablets were obtained from Merck for the calibration of pH electrode.
Three standard solutions were prepared with pH value of 4, 7 and 9.0. Initially, the pH
meter is calibrated for any two pH values (either 4 and 7 or 7 and 9.2) and then we
checked the accuracy of the pH meter by using remaining standard solution (9.2 or 4
respectively). The pH of these dispersions was adjusted using analytical grade HNO3

19
and KOH. Before carrying out the measurements, all the dispersions were re-
dispersed using cyclo-mixer and ultra-sonicator for 4-5 minutes. The pH of the
dispersion was measured by using pH meter as shown in figure 3.1.
Figure 3.1 Experimental setup for pH measurement
pH meter
pH electrode
Flocculated dispersion
Stand

20
3.2 Final Close-Packed Volume Fraction Measurements: The final close-packed volume fraction of these dispersions was measured
using a glass capillary of size 300 m in diameter. Here, the original dispersion was
allowed to dry from one end of the capillary tube under ambient conditions. The final
close-packed volume fraction ( m ) was calculated by measuring the initial and final
length of dispersion plug.
Figure 3.2 (a) Formation of packed region and movement of particles in circular capillary; (b) Estimation of final packing fraction
Figure 3.2 (a) shows a schematic of a capillary where the dispersion fills it
partially so that one of the menisci is at the mouth of the capillary at one end while the
other meniscus is well within the capillary. As drying progresses, water evaporates
from the left and particles form a close-packed array. Due to the high curvature of the
menisci at the first layer of particles, a low pressure zone is created in the fluid. So the
low capillary pressure convects the particles and fluid leading to the formation of a
packed front. Water is drawn from the fluid region to maintain the evaporative loss
and this incoming flux carries particles with it and packed front length goes on
High curvature between the first layer of particles
Movement of particles
Packed Region
High Evaporation Rate
Negligible evaporation
Lo Lm

21
increasing. While on the other end of the capillary, as there is no capillary force
acting, evaporation is negligible.
The initial length of dispersion in capillary (Lo) and the final length of packed
region (Lm) is measured. This procedure is repeated for all the dispersions with pH
values ranging from 2 to 12. Final packing fraction is obtained by taking mass balance
for solids as,
mmoo LL (3.1)
Here, o is the initial solid fraction in capillary, m is the final solid fraction in
capillary (final close-packed volume fraction), oL is the initial length of dispersion in
capillary and mL is the final length of packed region in capillary (after complete
drying).
Figure 3.3 and figure 3.4 shows the SEM image of a dried film of AKP-30 and
ALCOA-A16 dispersions respectively. As can be seen, particles are irregular and
poly-dispersed both in shape as well as in size.

22
Figure 3.3 SEM of AKP-30 particles

23
Figure 3.4 SEM of ALCOA-A16 particles

24
3.3 CCT Measurements:
The critical cracking thickness measurements were done at a temperature of
25-28oC and a relative humidity of 35-40%. Thin films of the dispersions were cast on
glass substrates by disbursing a small amount of liquid using a spin coater (slow
rotation rate ~ 20 rpm). Here, the spin coater was used to spread the liquid uniformly
over a fixed area so as to obtain a nearly circular film. Further, the thicknesses of
these films were varied by disbursing varying amounts of dispersion on the same area.
After the films were cast, they were left to dry under ambient conditions. After a film
was completely dried, it was examined under an optical upright microscope
(Olympus, BX-60) for cracks at varying magnifications. Finally, the thickness profile
of the film was measured using a surface profilometer Dektak-150 (figure 3.5). It
should be noted that in some cases the entire film was crack free which gave the lower
limit for CCT.
(i) (ii)
Figure 3.5 Dektak 150 Surface profiler (i) Front view of profilometer and (ii) Close view of Stylus and stage (www.veeco.com)

25
3.4 Stress Measurements:
The schematic of the experimental setup for the measurement of stress in the
film is shown in the figure 3.6. Here, a thin layer of the dispersion was applied on a
thin silicon wafer (thickness ~ 128 m) clamped on one side. The dimensions of the
silicon wafer used were 13mm (length) and 5mm (width). A laser beam is reflected
from the free end of the substrate and collected by a position sensitive detector (On-
track ). The position of the detector is set in such a way that the reflected beam falls
normally on the surface of the detector. The entire detector assembly is mounted on
an X-Y traverse so that the desired positioning can be done with great precision. The
position data (i.e. the x, y coordinate of the reflected beam) from the detector is
directly fed to a computer. As the film dries, the tensile stresses in the drying film
bend the substrate which further results in the movement of reflected beam on
detector surface. Finally, the displacement of the reflected beam on the detector
surface is correlated to the amount of deflection in the substrate which is finally
related to the average tensile stress in the film.
Figure 3.6 Schematic of the experimental setup for stress measurements
X
Silicon substrate
Laser Source
Latex Film
L2 L1
Deflection angle
Position Sensitive detector
26
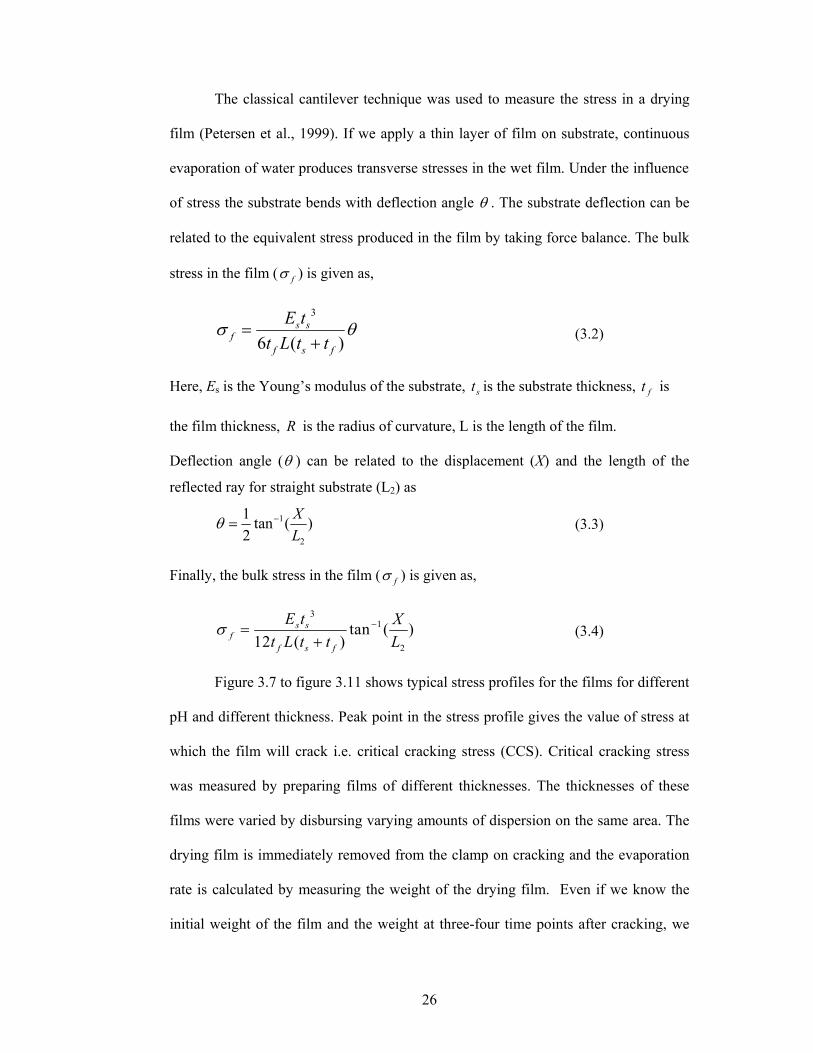
The classical cantilever technique was used to measure the stress in a drying
film (Petersen et al., 1999). If we apply a thin layer of film on substrate, continuous
evaporation of water produces transverse stresses in the wet film. Under the influence
of stress the substrate bends with deflection angle . The substrate deflection can be
related to the equivalent stress produced in the film by taking force balance. The bulk
stress in the film ( f ) is given as,
3
6 ( )s s
ff s f
E tt L t t (3.2)
Here, Es is the Young’s modulus of the substrate, st is the substrate thickness, ft is
the film thickness, R is the radius of curvature, L is the length of the film.
Deflection angle ( ) can be related to the displacement (X) and the length of the
reflected ray for straight substrate (L2) as
1
2
1 tan ( )2
XL
(3.3)
Finally, the bulk stress in the film ( f ) is given as,
31
2
tan ( )12 ( )
s sf
f s f
E t Xt L t t L
(3.4)
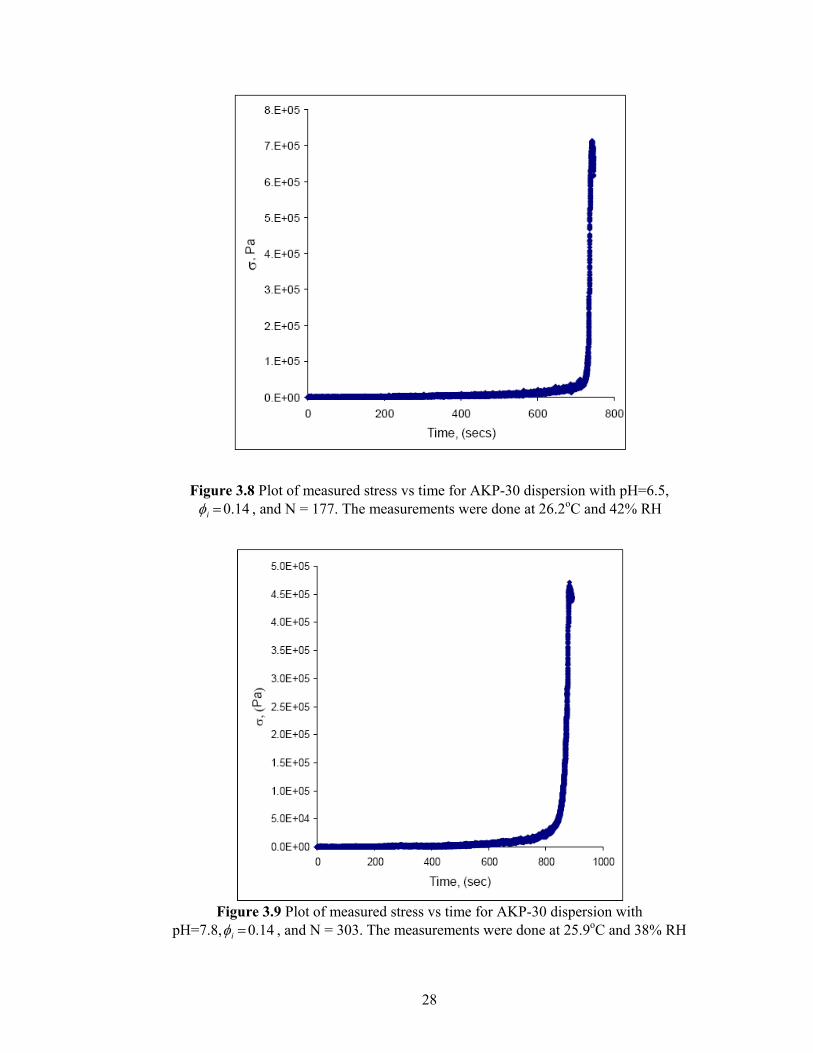
Figure 3.7 to figure 3.11 shows typical stress profiles for the films for different
pH and different thickness. Peak point in the stress profile gives the value of stress at
which the film will crack i.e. critical cracking stress (CCS). Critical cracking stress
was measured by preparing films of different thicknesses. The thicknesses of these
films were varied by disbursing varying amounts of dispersion on the same area. The
drying film is immediately removed from the clamp on cracking and the evaporation
rate is calculated by measuring the weight of the drying film. Even if we know the
initial weight of the film and the weight at three-four time points after cracking, we

27
can get an accurate value of evaporation rate. This is done to get the evaporation rate
at the same conditions at which stress experiments were carried out. Figure 3.12 (i)
and (ii) shows that evaporation calculated from these two plots is the same.
Figure 3.7 Plot of measured stress vs time for AKP-30 dispersion with pH=3.3,
16.0i and N = 156. The measurements were done at 26.4oC and 42% RH
28
Figure 3.8 Plot of measured stress vs time for AKP-30 dispersion with pH=6.5, 14.0i , and N = 177. The measurements were done at 26.2oC and 42% RH
Figure 3.9 Plot of measured stress vs time for AKP-30 dispersion with
pH=7.8, 14.0i , and N = 303. The measurements were done at 25.9oC and 38% RH

29
Figure 3.10 Plot of measured stress vs time for AKP-30 dispersion with pH=10.0, 13.0i and N = 262. The measurements were done at 25.8oC and 32%RH
Figure 3.11 Plot of measured stress vs time for AKP-30 dispersion with pH=11.1, 17.0i , and N = 234. The measurements were done at 25.8oC and 38% RH

30
y = -5.59E-06x + 3.15E-02R2 = 1.00
0.0265
0.0270
0.0275
0.0280
0.0285
0.0290
0.0295
0.0300
0.0305
0.0310
0.0315
0 100 200 300 400 500 600 700 800Time (secs)
Wei
ght (
gms)
(i)
y = -5.59E-06x + 3.15E-02R2 = 1.00
0.0265
0.0270
0.0275
0.0280
0.0285
0.0290
0.0295
0.0300
0.0305
0.0310
0.0315
0 100 200 300 400 500 600 700 800Time (secs)
Wei
ght (
gms)
(ii)
Figure 3.12 Weight of the drying film as a function of time for AKP-30 dispersion spread on silicon wafer (i) Evaporation rate calculated using all data points and
(ii) Evaporation rate calculated using initial weight of the film and final four points

31
CHAPTER 4
RESULTS AND DISCUSSION
4.1 Final Close-Packed Volume Fraction:
The extent of flocculation is quantified in terms of final close-packed volume
fraction ( m ). Figure 4.1 shows the variation of final close-packed volume fraction
with pH for the AKP-30 dispersion without addition of any electrolyte. The measured
volume fraction shows direct correspondence with the reported zeta potential in that,
at low pH, the final close-packed volume fraction is highest essentially due to the
higher surface charge (figure 2.7). As the pH is increased, the stabilizing repulsive
forces between particles decrease and the dispersion becomes more unstable resulting
in particle flocculation. This is evident from lower values of final close-packed
volume fraction as we increase pH. At a pH of 9.1 (iso-electric point), the charges at
the surface are completely neutralized and there are no stabilizing forces. As
expected, the final close-packed volume fraction is the lowest at this pH, 18.0~m .
With further increase in pH the particle surface acquires negative charge which
stabilizes the dispersion. This is again evident from the higher value of final close-
packed volume fraction at high pH.
We repeated the experiment by adding 50mM NaCl salt as background
electrolyte and found the iso-electric point to occur at pH ~ 9.5 (figure 4.2). The shift
in iso-electric point is due to the specific absorption of positively charged ions on the
surface of alumina particles. These results indicate that the iso-electric point should
not change significantly with salt concentration. Further, the final close-packed
volume fraction measurements with pH of AKP-30 dispersion with and without
background electrolyte agree well with the zeta potential vs pH study reported by
Johnson et al. (1997) and Perez et al. (2006) respectively (figure 2.8 and 2.7).

32
0
0.1
0.2
0.3
0.4
0.5
0.6
0.7
0.8
0.0 2.0 4.0 6.0 8.0 10.0 12.0
pH of AKP-30 dispersion
Fina
l clo
se-p
acke
d vo
lum
e fra
ctio
n (
m)
Iso-electric point ~ 9.1
Figure 4.1 Variation of final close-packed volume fraction ( m ) as a function of pH for AKP-30 dispersion without background electrolyte (Temp= 26.1 oC and
relative humidity =43%)
0.0
0.1
0.2
0.3
0.4
0.5
0.6
0.7
0.8
0 2 4 6 8 10 12 14
pH of AKP-30 dispersiom
Fina
l clo
se-p
acke
d vo
lum
e fra
ctio
n (
m)
Iso-electric point ~ 9.5
Figure 4.2 Variation of final close-packed volume fraction ( m ) as a function of pH for AKP-30 dispersion with background electrolyte concentration of 50mM
NaCl (Temp= 26.6 oC and relative humidity =53%)
33
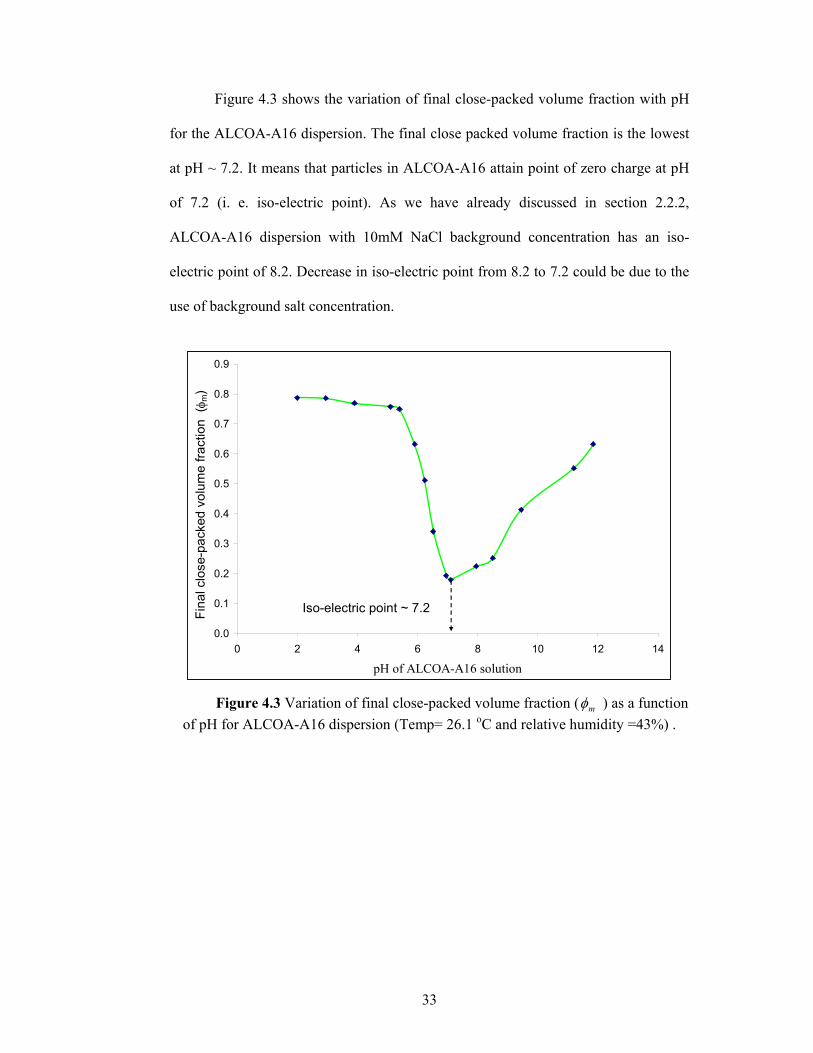
Figure 4.3 shows the variation of final close-packed volume fraction with pH
for the ALCOA-A16 dispersion. The final close packed volume fraction is the lowest
at pH ~ 7.2. It means that particles in ALCOA-A16 attain point of zero charge at pH
of 7.2 (i. e. iso-electric point). As we have already discussed in section 2.2.2,
ALCOA-A16 dispersion with 10mM NaCl background concentration has an iso-
electric point of 8.2. Decrease in iso-electric point from 8.2 to 7.2 could be due to the
use of background salt concentration.
0.0
0.1
0.2
0.3
0.4
0.5
0.6
0.7
0.8
0.9
0 2 4 6 8 10 12 14
pH of ALCOA-A16 solution
Fina
l clo
se-p
acke
d vo
lum
e fra
ctio
n (
m)
Iso-electric point ~ 7.2
Figure 4.3 Variation of final close-packed volume fraction ( m ) as a function
of pH for ALCOA-A16 dispersion (Temp= 26.1 oC and relative humidity =43%) .

34
4.2 Critical Cracking Thickness (CCT):
4.2.1 Film Surface Patterns:
Figure 4.4 and figure 4.5 show the pictures of the surface of crack-free dried films.
Films obtained from drying stable dispersions (i.e. pH < 7 and pH > 12) show smooth,
glossy surface (figure 4.4) whereas the films obtained from drying of flocculated
dispersions show rough surface (figure 4.5). Many bright spots are observed in the
dried films of flocculated dispersions which is clear indication of the high porosity of
the film (i.e. low final close-packed volume fraction).
(i) (ii)
Figure 4.4 Picture of crack-free dried film obtained from drying stable dispersions (pH < 7 and pH > 12). Picture (i) is captured by using wide angle camera and picture
(ii) is captured by using microscope.
(i) (ii)
Figure 4.5 Picture of crack-free dried film obtained from drying flocculated dispersions (7 < pH < 12). Picture (i) is captured by using wide angle camera and
picture (ii) is captured by using microscope. In picture (ii), arrows indicate regions of bright spots.

35
4.2.2 Crack Patterns:
Different types of crack patterns are observed in the dried films of stable and
flocculated dispersions (figure 4.6 - figure 4.8). For dispersions at low pH values (pH
< 7), regular radial cracks are observed in the dried films above critical cracking
thickness (figure 4.6). At pH values ranging from 7 – 7.75, pattern of cracks observed
was somewhat irregular (figure 4.7). For flocculated dispersions (i.e. for 7.75 < pH <
11.5), the film shows ring type of crack (figure 4.8). It appears that two cracks are
initiated at two points in the film and they propagate and meet each other completing
the circle. The reason behind the formation of such ring type of cracks at high
flocculation is not clear and needs further investigation. In these types of films, it is
very difficult to spread the film uniformly on the glass substrate. It was observed that
a drop of flocculated dispersion did not change its shape significantly during drying.
Further, we also observed the water to drain out of the film from the edges. These
results seem to indicate that once the particle concentration reaches that for
flocculation, the shape of the drop is set by the particle network. The capillary forces
are also weak due to the high porosity of the film. So it is expected that flocculated
dispersions will have higher critical cracking thickness than stable dispersions.
Pauchard et al. (1999) studied the crack patterns formed by the drying of an
isolated drop of colloidal silica suspension on a glass slide. They also observed
similar kind of different crack patterns for different salt concentrations. They found
that dried films show regular crack pattern at low salt concentrations (0-0.2 mol/l),
disordered crack pattern at intermediate salt concentration (0.4 mol/l) and an unique
circular crack at high salt concentration (above 0.4 mol/l).

36
Figure 4.6 Pictures of different dried films of stable dispersions (pH < 7) showing cracks
Figure 4.7 Pictures of different dried films of dispersions at pH ~ 7.25 showing cracks

37
Figure 4.8 Pictures of circular crack formed in different dried films of flocculated dispersions (7.75 < pH < 11.5). Arrows indicate the circular crack.

38
4.2.3 Thickness Profile:
Figure 4.9 – 4.12 shows the thickness profiles of dried films of AKP-30
dispersions of varying pH. In case of stable dispersions, the profile shows two peaks
at two ends while the thickness in the central section is lower (figure 4.9 and figure
4.10). As we have already seen that for stable dispersions, final close packed volume
fraction is high and so the capillary pressure generated convects the particles and fluid
leading to the formation of packed front at the periphery of film. Water is drawn from
the fluid region to maintain for evaporative loss and this incoming flux carries
particles with it and packed front length goes on increasing. Transverse flow
generated by capillary forces is responsible for the observed profile.
In case of flocculated dispersion, since the final close-packed volume fraction
is low, the magnitude of capillary pressure is also low. So there is no convection of
particles from central fluid region to the periphery of the film which is clear from the
shape of the thickness profile of the dried film of flocculated dispersion (figure 4.11
and figure 4.12).
Thus, the shape of the dried film gives clear evidence of capillary pressure as
the driving force for the movement of particles in drying colloidal films.

39
Figure 4.9 Thickness profile of a film dried (pH = 2.5) at 26.7oC and 35% RH
Figure 4.10 Thickness profile of a film dried (pH = 5.4) at 26.7oC and 35% RH
Micrometer
Thic
knes
s, A
ngst
rom
Micrometer
Thic
knes
s, A
ngst
rom
Micrometer
Thic
knes
s, A
ngst
rom
Micrometer
Thic
knes
s, A
ngst
rom

40
Figure 4.11 Thickness profile of a film dried (pH = 9.5) at 26.7oC and 35%RH
Micrometer
Thic
knes
s, A
ngst
rom
Micrometer
Thic
knes
s, A
ngst
rom
Micrometer
Thic
knes
s, A
ngst
rom
Micrometer
Thic
knes
s, A
ngst
rom

41
Figure 4.12 Thickness profile of a film dried (pH = 11) at 26.7oC and 35% RH
Micrometer
Thic
knes
s, A
ngst
rom
Micrometer
Thic
knes
s, A
ngst
rom
Micrometer
Thic
knes
s, A
ngst
rom
Micrometer
Thic
knes
s, A
ngst
rom
42
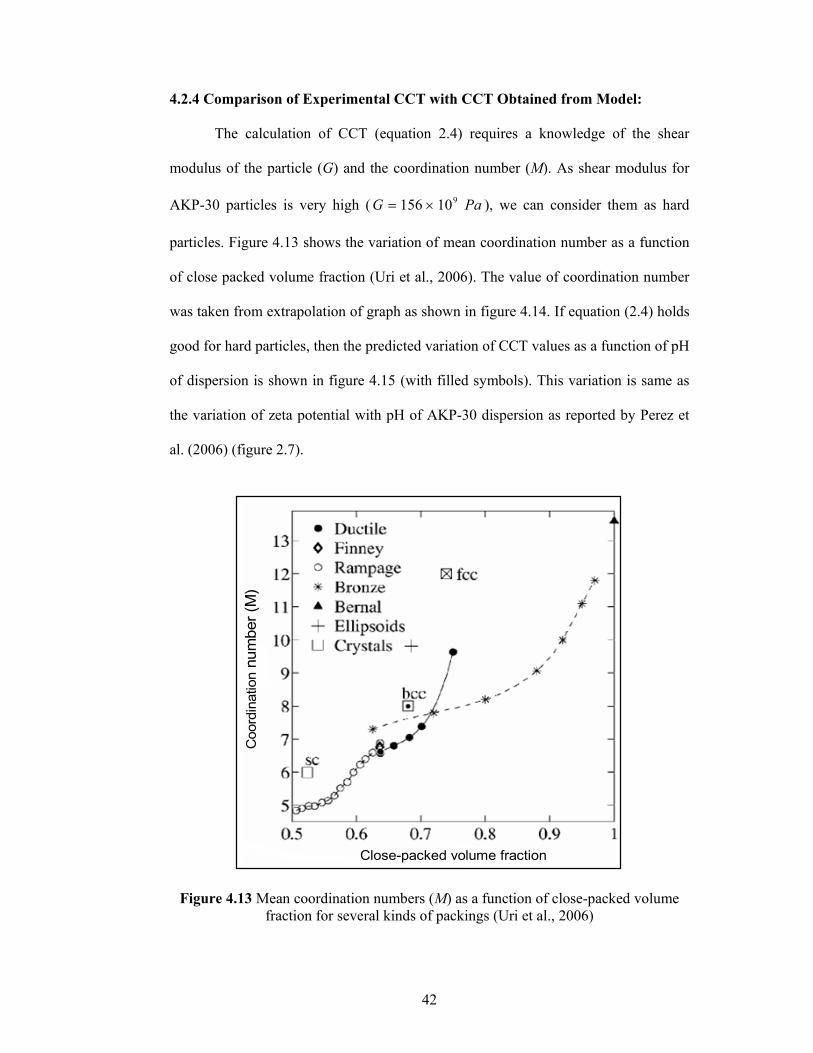
4.2.4 Comparison of Experimental CCT with CCT Obtained from Model:
The calculation of CCT (equation 2.4) requires a knowledge of the shear
modulus of the particle (G) and the coordination number (M). As shear modulus for
AKP-30 particles is very high ( PaG 910156 ), we can consider them as hard
particles. Figure 4.13 shows the variation of mean coordination number as a function
of close packed volume fraction (Uri et al., 2006). The value of coordination number
was taken from extrapolation of graph as shown in figure 4.14. If equation (2.4) holds
good for hard particles, then the predicted variation of CCT values as a function of pH
of dispersion is shown in figure 4.15 (with filled symbols). This variation is same as
the variation of zeta potential with pH of AKP-30 dispersion as reported by Perez et
al. (2006) (figure 2.7).
Figure 4.13 Mean coordination numbers (M) as a function of close-packed volume fraction for several kinds of packings (Uri et al., 2006)
Coo
rdin
atio
nnu
mbe
r (M
)
Close-packed volume fraction
Coo
rdin
atio
nnu
mbe
r (M
)
Close-packed volume fraction

43
y = 11.026x - 0.4023R2 = 0.9778
0
1
2
3
4
5
6
7
8
9
0 0.1 0.2 0.3 0.4 0.5 0.6 0.7 0.8
Maximum close-packed volume fraction ( m)
Coo
rdin
atio
n nu
mbe
r <K
>
Figure 4.14 Extrapolation of close-packed volume fraction below 0.5
Figure 4.16 shows the variation of measured CCT with pH of AKP-30
dispersion. At pH values of above 6 and less than iso-electric point, CCT is found to
increase with the increase in pH. These results are in line with the theory of Singh and
Tirumkudulu (2007) who predicted an increase in CCT with decrease in final close-
packed volume fraction. In case of flocculated dispersions (8.5 < pH < 11.5), we
found it difficult to measure the exact CCT value since the results were not
reproducible. For example, in some cases the ring type of crack appeared at the
periphery of the dried film. However, if the films were cast carefully, crack free films
of a much higher thickness would be obtained. Consequently, we could not ascertain
the exact CCT for 8.5 < pH < 11.5. The thickness of the film at which circular ring
type crack is appeared is greater than 175 m . So it is clear that CCT of the films
obtained from flocculated dispersions is greater than 175 m . As we have already
discussed in section 4.2.3 that in case of stable dispersions capillary pressure effect is
prominent due to high final close-packed volume fraction. So the tensile stresses
generated in the film obtained from drying of stable dispersion are very high, which

44
causes films to crack at lower thicknesses. On the other hand, in case of flocculated
dispersions, final close-packed volume fraction is very low, so the capillary pressure
effect is less and so the CCT of flocculated dispersion is higher than that of stable
dispersions. We get the same results for the measured CCT above pH of 6 (figure
4.16). If we compare figure 4.15 and 4.16, at pH values (> 6), the variation of CCT
with pH in both the figures is identical. However, at pH values (< 6.0), CCT shows an
opposite trend. Also, the measured CCT at pH ~ 11.9 is very (CCT ~ 175) is eight
times greater than the predicted CCT (CCT ~ 22). This is unexpected and needs
further investigation. One of the reason for this trend can be the high solubility of
alumina particles at low pH values. At very low pH values (pH < 4) and very high pH
values (pH > 12), alumina particles are highly soluble in water. So at these pH values,
when we allow the dispersion to dry, alumina precipitate out as drying progresses.

45
0
20
40
60
80
100
120
140
160
180
200
0 2 4 6 8 10 12 14
pH of AKP-30 dispersion
CC
T of
AK
P-3
0, (
m)
Figure 4.15 Predicted Critical Cracking Thickness (CCT) as a function of pH of
AKP-30 dispersion. Filled symbols represent predictions and empty symbols represent experimental measurements.
Figure 4.16 The measured CCT as a function of pH for AKP-30 dispersions
0
20
40
60
80
100
120
140
160
180
200
0 2 4 6 8 10 12 14
pH of AKP-30 dispersion
CC
T of
AK
P-3
0, (
m)
CCT > 175 m
0
20
40
60
80
100
120
140
160
180
200
0 2 4 6 8 10 12 14
pH of AKP-30 dispersion
CC
T of
AK
P-3
0, (
m)
CCT > 175 mCCT > 175 m

46
4.3 Critical Cracking Stress (CCS):
Theoretical critical cracking stresses (equation 2.1) for different pH values
were calculated by taking the values of AW as 72mN/m, Shear Modulus (G) equal to
156 GPa and the m value from capillary experiments (figure 4.1).
As can be seen in figure 4.17, at low pH, the critical cracking stress is highest
essentially due to high close-packed volume fraction and high coordination number.
As the pH is increased, the dispersion becomes more unstable due to decrease in
stabilizing repulsive forces between particles and results in particle flocculation. At
iso-electric point (pH=9.1), extent of flocculation is maximum and close-packed
volume fraction is minimum, so the critical cracking stress is minimum. With increase
in pH above iso-electric point, the critical cracking stress increases. Experimental
CCS values were found to be double the theoretical CCS values. If we increase the
constant in equation 2.1 by a factor of 2, predicted and measured critical cracking
stress values match well (figure 4.18). Experimental critical cracking stress variation
as a function of pH of AKP-30 dispersion is found to be in good agreement with the
critical cracking stress variation predicted by the theory of Tirumkudulu and Russel
(2005) (figure 4.17).

47
0.0
0.2
0.4
0.6
0.8
1.0
1.2
1.4
1.6
0 2 4 6 8 10 12 pH of AKP-30 dispersion
cR
Film Height (N) = 150Film Height (N) = 200Film Height (N) = 250Film Height (N) = 300
Figure 4.17 The predicted and measured dimensionless critical cracking stress )2/( Rc as a function of pH of AKP-30 dispersion at different film heights. Filled
symbols represent predictions and empty symbols represent the values obtained by interpolation of experimental stress values from line equation shown in figure 4.19.
0.0
0.2
0.4
0.6
0.8
1.0
1.2
1.4
1.6
0 2 4 6 8 10 12 pH of AKP-30 dispersion
cR
Film Height (N) = 150Film Height (N) = 200Film Height (N) = 250Film Height (N) = 300
Figure 4.18 The predicted and measured dimensionless critical cracking stress )2/( Rc as a function of pH of AKP-30 dispersion at different film heights. Filled
symbols represent predictions by increasing factor in equation 2.1 by 2 and empty symbols represent the values obtained by interpolation of experimental stress values
from line equation shown in figure 4.19.

48
Figure 4.19 show the variation of dimensionless critical cracking stress vs
dimensionless film thickness. It is clear that the critical cracking stress decreases with
increase in film thickness as predicted by the model of Tirumkudulu and Russel
(2005). When an isolated crack is initiated in the film, stresses over the length of h
around the crack will be released from the film (Singh and Tirumkudulu, 2007). The
elastic energy recovery per unit length of the crack scales as 2~ hEelastic and
increased surface energy due to formation of crack varies as hEs ~ . So if we
increase the film thickness, elastic energy stored in the film will increase with 2h
where as surface energy will increase with h . It means that thick films have sufficient
elastic energy to crack at lower stress. The experimental results also show the same
analysis as predicted (figure 4.19).
0.1
1
10
10 100 1000N = hrcp/2R
c R
pH = 3.3
pH = 6.5
pH = 7.8
pH = 10.0
pH=11.1
Figure 4.19 Plot of measured dimensionless critical cracking stress )2/( Rc vs the dimensionless film thickness )2/( Rhrcp .

49
In figure 4.20, the dimensionless critical cracking stress )2/( Rc is plotted
against the dimensionless characteristic scale )/( 2NM m for dispersions with pH
values of 3.3, 6.5, 7.8, 10.0 and 11.1 respectively. The solid line is a fit from the
model of Tirumkudulu and Russel (2005) (equation 2.1) with an exponent of 1/3. The
plot shows that the measured dimensionless critical cracking stress values matches
well with the predictions of Tirumkudulu and Russel (2005) (after increasing the
coefficient in equation 2.1 by a factor of 2). Also, if we calculate the value of power
of )/( 2NM m from the experimental dimensionless critical cracking stress
)2/( Rc vs the dimensionless characteristic scale )/( 2NM m plot as shown in
figure 4.20, we get the power of )/( 2NM m as ~ (1/3), which gives the validity of
model over wide range of packing fractions. So we can say that the experiments are in
good agreement with the model of Tirumkudulu and Russel (2005). Note that the
coefficient in equation 2.1 was increased by a factor of 2 while comparing this
equation with the experimental results.

50
y = 22.96x0.3333
R2 = 0.8894
0.1
1
10
0.00001 0.0001 0.001
M m/N2
c R
/2
pH=3.3pH=6.5pH=11.1pH=7.8pH=10.0
Figure 4.20 Plot of measured dimensionless critical cracking stress )2/( Rc vs the dimensionless characteristic scale )/( 2NM m . The data points are for films of AKP-30 dispersion with varying pH. The solid line is a power law fit with an exponent of
1/3. C is the constant.
In many of the industrial applications such as paints and coatings, we need
films which are sufficiently thick as well as at the same time having no cracks. Our
study can help to design such formulations where we can get crack free film of
desired thickness. Also, in ceramics industry, it is required to fuse the particles in the
dried film at high temperature. So it is necessary that films should not crack at large
thicknesses as crack will make it difficult to fuse the particles. So this study can be
used to get crack free surface in ceramic industry.
51
CHAPTER 5
CONCLUSIONS
Cracking in drying films of flocculated dispersions has been investigated. It
has been shown that by changing the pH of the dispersion, its flocculation can be
affected which can further be used to control its cracking behavior. As pH is
increased, final packing fraction value decreases, goes through minimum and again
starts increasing. The iso-electric point obtained by using final close packed volume
fraction variation with pH for both AKP-30 as well as ALCOA-A16 is almost equal to
the value that is given in literature. Shape of the films formed after drying AKP-30
dispersions at different pH values gives the direct evidence for the capillary pressure
as driving force for the convection of particles during drying of films. We observed
different types of crack patterns as regular crack pattern (pH < 7), disordered crack
pattern (7.25 < pH < 7.75) and an unique circular crack (7.75 < pH < 11.5).
We also found that experimental critical cracking stress values are two times
of the theoretically predicted values. Experimental studies indicate that there is clear
influence of the way in which particles pack on the cracking behavior of films. We
were able to change the packing fraction over a wide range from 0.2 to 0.7 by
changing the pH of the AKP-30 dispersion. The trend of measured critical cracking
stress with pH is similar to the trend predicted by the model of Tirumkudulu and
Russel (2005). Also, the measured critical cracking thickness variation for pH values
in between 6 and 12 is similar to the trend predicted by model of Singh and
Tirumkudulu (2007). In short, we can say that the cracking behavior of AKP-30 in
water is well described by these two models, suggesting that these models are
universal and apply equally well to both stable as well as flocculated systems.

52
In this study, we have considered that the particle asphericity do not affect the
cracking behavior of flocculated dispersions. So it is required to carry out more
experiments with perfectly spherical alumina particles and compare the results.

53
REFERENCES
1. Brodnyan, J. G. and Konen, T., 1964, “Experimental study of the mechanism
of film formation”, Journal of Applied Polymer Science, 8, 687.
2. Brown, G. L., 1956, “Formation of films from polymer dispersions”, Journal
of Polymer Science, 22, 423-434.
3. Carreras, E. S., Chabert, F., Dunstan, D. E. and Franks G. V., 2007 “Avoiding
“mud” cracks during drying of thin films from aqueous colloidal suspensions”,
Journal of Colloid and Interface Science, 313, 160-168.
4. Channell, G. M. and Zukoski, C. F., 1997, “Shear and compressive rheology
of aggregated alumina suspensions”, AIChE Journal, 43(7), 1700-1708.
5. Chevalier, Y., Graillat, P. C., Joanicot, M., Wont, K., Maquet, J., Linder, P.
and Cabane, B., 1992, “Film formation with latex particles”, Colloid Polymer
Science, 270, 806-821.
6. Chiu, R. C. and Cima, M. J, 1993, “Drying of granular ceramic films: II,
drying stress and saturation uniformity”, Journal of the American Ceramic
Society, 76(11), 2769-2777.
7. Chiu, R. C., Garino, T. J. and Cima, M. J, 1993, “Drying of granular ceramic
films: I, effect of processing variables on cracking behavior”, Journal of the
American Ceramic Society, 76(9), 2257-2264.
8. Crowley, T. L., Sanderson, A. R., Morrison, J. D., Barry, M. D., Morton-
Jones, A. J. and Rennie, A. R., “Formation of bilayers and plateau borders
during the drying of film-forming latices as investigated by small-angle
neutron scattering”, Langmuir, 8, 2110.
9. Dobler, F., Pith, T., Lambla, M. and Holl, Y., 1992, “Coalescence mechanisms
of polymer colloids”, Journal of Colloid and Interface Science, 152, 1-11.

54
10. Dobler, F., Pith, T., Lambla, M. and Holl, Y., 1992, “Coalescense mechanism
of polymer colliods ii Coalescence with evaporation of water”, Journal of
Colloid and Interface Science, 152 (1), 12-21.
11. Dufresne, E. R., Corwin, E. I., Greenblatt, N. A., Ashmore, J., Wang, D. Y.,
Dinsmore, A. D., Cheng, J. X., Xie, X. S., Hutchinson, J. W. and Weitz, D. A.,
2003, “Flow and fracture in drying nanoparticle suspensions”, Physical
Review Letters, 81 (22), 4501-4504.
12. Eckersley, S. T. and Rudin, A., 1990, “Mechanism of film formation from
latexes”, Journal of Coatings Technology, 62 (780), 89-100.
13. Eckersley, S. T. and Rudin, A., 1994, “Drying behaviour of acrylic latexes”,
Progress in Organic Coatings, 23, 387-402.
14. Furlong, D. N., Freeman, P. A. and Lau, A. C. M., 1981, “The adsorption of
soluble silica at solid-aqueous solution interfaces I. Leaching from glass-An
electro-kinetic study”, Journal of Colloid and Interface Science, 80(1), 20-31.
15. Greenwood, R., 2003, “Review of the measurement of zeta potentials in
concentrated aqueous suspensions using electroacoustics”, Advances in
Colloid and Interface Science, 106, 55-81.
16. Henson, W. A., Taber, D. A. and Bradford, E. B., 1953, “Mechanism of film
formation of latex paint”, Industrial and Engineering Chemistry Research, 45
(4), 735-739.
17. Johnson, S. B., Russel, A. S. and Scales, P. J., 1998, “Volume fraction effects
in shear rheology and electro-acoustic studies of concentrated alumina and
kaolin suspensions”, Colloids and Surfaces, 141, 119-130.
18. Juhue, D. and Lang, J., 1994, “Latex film formation in the presence of organic
solvents”, Macromolecules, 27, 695-701.

55
19. Keddie, J. L., Meredith, P., Jones, R. A. L. and Donald, A. M., 1995, “Kinetics
of film formation in acrylic latices studied with multiple-angle-of-incidence
ellipsometry and environmental SEM”, Macromolecules, 28, 2673-2682.
20. Keddie, J.L., 1997, “Film formation of latex”, Material Science and
Engineering, 21, 101-170.
21. Kim, K. D., Sperling, L. H. and Klein, A., 1994, “Reptation time, temperature,
and cosurfactant effects on the molecular interdiffusion rate during
polystyrene latex film formation”, Macromolecules, 27, 6841-6850.
22. Lee, W. P. and Routh, A. F., 2004, “Why do drying films crack?”, Langmuir,
20(23), 9885-9888.
23. Lin, F. and Meier, D. J., 1995, “A study of latex film formation by atomic
force microscopy. I. A comparison of wet and dry conditions”, Langmuir, 11,
2726-2733.
24. Mayer, A., Pith, T. and Hu, G., 1995, “Effect of the structure of latex particles
on adhesion. Part II: Analogy between peel adhesion and rheological
properties of acrylic copolymers”, Journal of Polymer Science, 33, 1793.
25. Mayer, A., Pith, T., Hu, G. and Lambla, M., 1995, “Effect of the structure of
latex particles on adhesion. Part I: Synthesis and characterization of structured
latex particles of acrylic copolymers and their peel adhesion behavior”,
Journal of Polymer Science, 33, 1781.
26. Okubo, M., Seike, M. and Matsumoto, T., 1983, “Studies on suspension and
emulsion. LX. Composite polymer emulsion film with temperature-sensitive
properties”, Journal of Applied Polymer Science, 28, 383.

56
27. Perez, P. G., Pagnoux, C., Rossignol, F. and Baumard, J. F., 2006,
“Heterocoagulation between SiO2 nanoparticles and Al2O3 submicronparticles;
influence of the background electrolyte”, Colloids and Surfaces, 281, 58-66.
28. Petersen, C., Heldmann, C. and Johannsmann, D, 1999, “Internal stresses
during film formation of polymer latices”, Langmuir, 15, 7745-7751.
29. Pokluda, O., Bellehumeur, C.T. and Vlachopoulos, J., 1997, “Modification of
Frenkel’s model for sintering”, AIChE Journal, 43 (12), 3253-3256.
30. Routh, A. F. and Russel, W. B., 2001, “Deformation mechanism during latex
film formation: Experimental evidences”, Industrial and Engineering
Chemistry Research, 40, 4302-4308.
31. Routh, A.F. and Russel, W.B., 1999, “A process for latex film formation:
limiting regimes for individual driving forces”, Langmuir, 15, 7762-7773.
32. Sheetz, D. P., 1965, “Formation of films by drying of latex”, Journal of
Applied Polymer Science, 9, 3759-3773.
33. Singh, K.B. and Tirumkudulu, M.S., 2007, “Cracking in drying colloidal
films”, Physical Review Letters, 98, 218302(1)-218302(4).
34. Steward, P.A., Hearn, J. and Wilkinson, M.C., 2000,”An overview of polymer
latex film formation and properties”, Advances in Colloid and Interface
Science, 86, 195-267.
35. Tirumkudulu, M. S. and Russel, W. B., 2004, “Role of capillary stresses in
film formation”, Langmuir, 20 (7), 2947-2961.
36. Tirumkudulu, M.S. and Russel, W.B., 2005, “Cracking in drying latex films”,
Langmuir, 21, 4938-4948.

57
37. Uri, L., Walmann, T., Alberts, L., Dysthe, D. K. and Feder, J., 2006,
“Structure of plastically compacting granular packings” Physical Review E,
73, 051301.
38. Velamakanni, B. V. and F. F. Lange, 1991, “Effect of interparticle potentials
and sedimentation on particle packing density of bimodal particle distributions
during pressure filtration,” Journal of the American Ceramic Society, 74(1),
166.
39. White, L. R., 1982, “Capillary rise in powders”, Journal of Colloid and
Interface Science, 90, 536-538.
40. Winnik, M. A., 1997, “Latex film formation”, Current Opinion in Colloid and
Interface Science, 2 (2), 192-199.
41. Xia, Z.C. and Hutchinson, J.W., 2000, “Crack patterns in thin films”, Journal
of the Mechanics and Physics of Solids, 48, 1107-1131.
42. Zhao, C. L., Wang, Y., Hruska, Z. and Winnik, M. A., 1990, “Molecular
aspects of latex film formation. An energy transfer study”, Macromolecules,
23, 4082-4087.
43. Zosel, A. and Ley, G., 1993, “Influence of cross-linking on structure,
mechanical properties, and strength of latex films”, Macromolecules, 26,
2222-2227.