cpe 631lecture 01: fundamentals of computer design
TRANSCRIPT

•1
CPE 631 Lecture 01: Fundamentals of Computer Design
Electrical and Computer EngineeringUniversity of Alabama in HuntsvilleAleksandar Milenkovic, [email protected]://www.ece.uah.edu/~milenka
05/01/2004 UAH-CPE631 2
CPE 631AM
Lecture Outline
n Evolution of Computer Technologyn Computing Classesn Task of Computer Designern Technology Trendsn Costs and Trends in Costn Things to Remember

•2
05/01/2004 UAH-CPE631 3
CPE 631AM
Introduction
Eniac, 1946 (first stored-program computer)Occupied 50x30 feet room, weighted 30 tonnes, contained 18000 electronic valves, consumed 25KW of electrical power;capable to perform 100K calc. per second
CHANGE! It is exciting. It has never been more exciting!It impacts every aspect of human life.
PC, 2003
PDA, 2003
Bionic, 2003
05/01/2004 UAH-CPE631 4
CPE 631AM
Introduction (cont’d)
n Continuous growth in performance due to advances in technology and innovations in computer design – 25-30% yearly growth in performance during 1970s
• Mainframes and minicomputers dominated the industry
– Microprocessors enabled 35% yearly growth in performance (late 1970s)
– RISCs (Reduced Instruction Set Computers) enabled 50% yearly growth in performance (early 1980s)
• Performance improvements through pipelining and ILP (Instruction Level Parallelism)

•3
05/01/2004 UAH-CPE631 5
CPE 631AM
Microprocessor Perf. Growth
05/01/2004 UAH-CPE631 6
CPE 631AM
Effect of this Dramatic Growth
n Significant enhancement of the capability available to computer user– Example: your today’s PC of less than $1000 has
more performance, main memory and disk storage than $1 million computer in 1980s
n Microprocessor-based computers dominate– Workstations and PCs have emerged as major
products– Minicomputers - replaced by servers – Mainframes - replaced by multiprocessors– Supercomputers - replaced by large arrays of
microprocessors

•4
05/01/2004 UAH-CPE631 7
CPE 631AM
Computer Engineering Methodology
Evaluate ExistingEvaluate ExistingSystems for Systems for BottlenecksBottlenecks
Simulate NewSimulate NewDesigns andDesigns and
OrganizationsOrganizations
Implement NextImplement NextGeneration SystemGeneration System
TechnologyTrends
Benchmarks
Workloads
ImplementationComplexity
ApplicationsMarket
05/01/2004 UAH-CPE631 8
CPE 631AM
Changing Face of Computing
n In the 1960s mainframes roamed the planet– Very expensive, operators oversaw operations– Applications: business data processing, large
scale scientific computingn In the 1970s, minicomputers emerged
– Less expensive, time sharingn In the 1990s, Internet and WWW, handheld
devices (PDA), high-performance consumer electronics for video games set-top boxes have emerged
n Dramatic changes have led to 3 different computing markets– Desktop computing, Servers, Embedded
Computers

•5
05/01/2004 UAH-CPE631 9
CPE 631AM
Desktop Computing
n Spans low-end (<$1K) to high-end (≈$10K) systems
n Optimize price-performance– Performance measured in the number of
calculations and graphic operations– Price is what matters to customers
n Arena where the newest highest-performance processors appear
n Market force: clock rate appears as the direct measure of performance
05/01/2004 UAH-CPE631 10
CPE 631AM
Servers
n Provide more reliable file and computing services (Web servers)
n Key requirements– Availability – effectively provide service
24/7/365 (Yahoo!, Google, eBay)– Reliability – never fails– Scalability – server systems grow over time,
so the ability to scale up the computing capacity is crucial
– Performance – transactions per minute

•6
05/01/2004 UAH-CPE631 11
CPE 631AM
Embedded Computers
n Computers as parts of other devices where their presence is not obviously visible– E.g., home appliances, printers, smart cards, cell
phones, palmtops
n Wide range of processing power and cost– ≈$1 (8-bit, 16-bit processors), $10 (32-bit capable
to execute 50M instructions per second), ≈$100-200 (high-end video games and network switches)
n Requirements– Real-time performance requirement (e.g., time to
process a video frame is limited)– Minimize memory requirements, power
05/01/2004 UAH-CPE631 12
CPE 631AM
Computing Classes: A Summary
Price, power consumption, application-specific performance
Throughput, availability, scalability
Price-performance, graphics performance
Critical system design issues
$0.2-$200$200-$2K$100-$1KPrice of the processor
300M(only 32-bit and 64-bit)
4M150MSold per year(from 2000)
$10-$100K$10K-$10M$1K-$10KPrice of the system
EmbeddedServerDesktopFeature

•7
05/01/2004 UAH-CPE631 13
CPE 631AM
Task of Computer Designer
n “Determine what attributes are important for a new machine; then design a machine to maximize performance while staying within cost constraints.”
n Aspects of this task– instruction set design
– functional organization
– logic design and implementation (IC design, packaging, power, cooling...)
05/01/2004 UAH-CPE631 14
CPE 631AM
What is Computer Architecture?
– Instruction Set Architecture• the computer visible to the assembler language programmer or
compiler writer (registers, data types, instruction set, instruction formats, addressing modes)
– Organization• high level aspects of computer’s design such as
the memory system, the bus structure, and the internal CPU (datapath + control) design
– Hardware• detailed logic design, interconnection and packing technology,
external connections
Computer Architecture covers all three aspects of computer design

•8
05/01/2004 UAH-CPE631 15
CPE 631AM
Technology Trends
n Integrated circuit technology – 55% /year– Transistor density – 35% per year– Die size – 10-20% per year
n Semiconductor DRAM– Density – 40-60% per year (4x in 3-4 years)– Cycle time – 33% in 10 years– Bandwidth – 66% in 10 years
n Magnetic disk technology– Density – 100% per year– Access time – 33% in 10 years
n Network technology (depends on switches and transmission technology)– 10Mb-100Mb (10years), 100Mb-1Gb (5 years)– Bandwidth – doubles every year (for USA)
05/01/2004 UAH-CPE631 16
CPE 631AM
Processor and Memory Capacity
MOORE’sLaw ⇒2X transistors per chip,every 1.5 years
Year Size Cycle time------------------------------------1980 64 Kb 250 ns1983 256 Kb 220 ns1986 1 Mb 190 ns1989 4 Mb 165 ns1992 16 Mb 145 ns1996 64 Mb 120 ns2000 256 Mb 100 ns2002 1 Gb ?? ns
DRAM Chip Capacity/Cycle time
Reuters, Monday 11 June 2001:Intel engineers have designed and manufactured the world’s smallest and fastest transistor in size of 0.02 microns in size. This will open the way for microprocessors of 1 billion transistors, running at 20 GHz by 2007.
Intel 4004,2300tr Intel P4 – 55M tr
Intel McKinley –221M tr.
•9
05/01/2004 UAH-CPE631 17
CPE 631AM
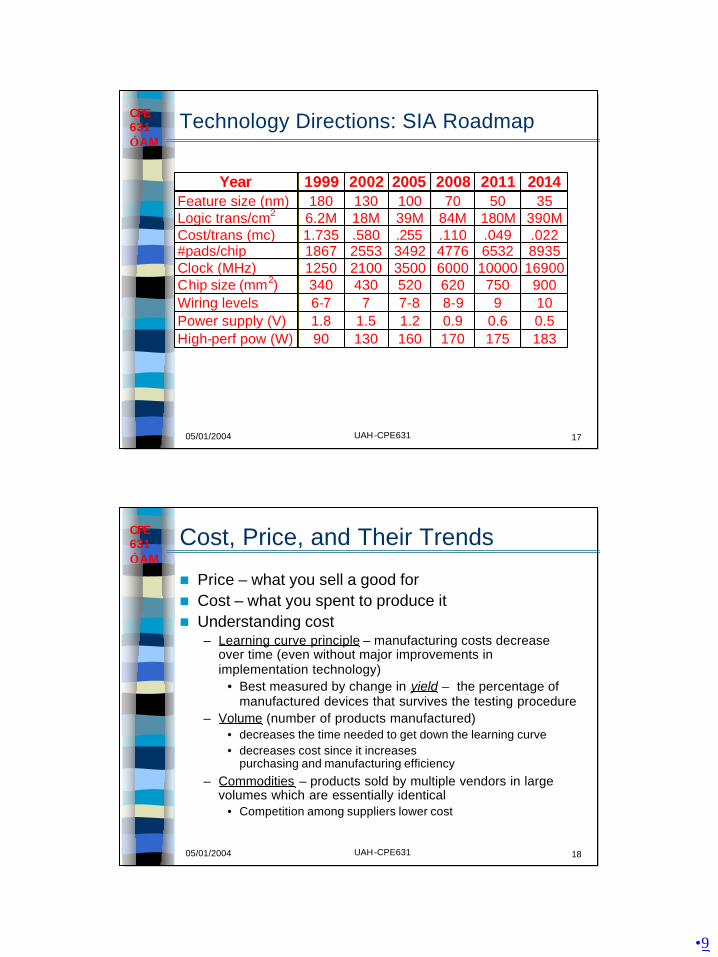
Technology Directions: SIA Roadmap
Year 1999 2002 2005 2008 2011 2014 Feature size (nm) 180 130 100 70 50 35 Logic trans/cm2 6.2M 18M 39M 84M 180M 390M Cost/trans (mc) 1.735 .580 .255 .110 .049 .022 #pads/chip 1867 2553 3492 4776 6532 8935 Clock (MHz) 1250 2100 3500 6000 10000 16900 Chip size (mm2) 340 430 520 620 750 900 Wiring levels 6-7 7 7-8 8-9 9 10 Power supply (V) 1.8 1.5 1.2 0.9 0.6 0.5 High-perf pow (W) 90 130 160 170 175 183
05/01/2004 UAH-CPE631 18
CPE 631AM
Cost, Price, and Their Trends
n Price – what you sell a good forn Cost – what you spent to produce it n Understanding cost
– Learning curve principle – manufacturing costs decrease over time (even without major improvements in implementation technology)
• Best measured by change in yield – the percentage of manufactured devices that survives the testing procedure
– Volume (number of products manufactured)• decreases the time needed to get down the learning curve• decreases cost since it increases
purchasing and manufacturing efficiency– Commodities – products sold by multiple vendors in large
volumes which are essentially identical• Competition among suppliers lower cost

•10
05/01/2004 UAH-CPE631 19
CPE 631AM
Prices of DRAM and Intel Pentium III
05/01/2004 UAH-CPE631 20
CPE 631AM
Integrated Circuits Variable Costs
yieldtestFinalcostPackagingcostTestingcostDiecostIC ++=
yieldDiewaferperDieswaferofCost
dieofCost×
=
areaDiediameterWafer
areaDiediameterWafer
waferperDies×
×−
×=
22 2 ππ )/(
Example: Find the number of dies per 20-cm wafer for a die that is 1.5 cm on a side.Solution: Die area = 1.5x1.5 = 2.25cm2. Dies per wafer = 3.14x(20/2)2/2.25 – 3.14x20/(2x2.5)0.5=110.

•11
05/01/2004 UAH-CPE631 21
CPE 631AM
Integrated Circuits Cost (cont’d)
α
α
−
×+×= areaDieareaunitperDefectsyieldWaferyieldDie 1
• What is the fraction of good dies on a wafer – die yield• Empirical model
• defects are randomly distributed over the wafer• yield is inversely proportional to the complexity of the
fabrication process
• Wafer yield accounts for wafers that are completly bad (no need to test them); We assume the wafer yield is 100%
• Defects per unit area: typically 0.4 – 0.8 per cm2
• α corresponds to the number of masking levels; for today’s CMOS, a good estimate is α=4.0
05/01/2004 UAH-CPE631 22
CPE 631AM
Integrated Circuits Cost (cont’d)
α
α
−
×+×= areaDieareaunitperDefects
yieldWaferyieldDie 1
• Example: Find die yield for dies with 1 cm and 0.7 cm on a side; defect density is 0.6 per square centimeter
• For larger die: (1+0.6x1/4)-4=0.57• For smaller die: (1+0.6x0.49/4)-4=0.75
• Die costs are proportional to the fourth power of the die area
• In practice
( )4areaDiefcostDie =
( )2areaDiefcostDie =

•12
05/01/2004 UAH-CPE631 23
CPE 631AM
Real World Examples
$4179%402961.5$15000.703Pentium
$27213%482561.6$17000.703SuperSPARC
$14919%532341.2$15000.703Dec Alpha
$7327%661961.0$13000.803HP PA 7100
$5328%1151211.3$17000.804PowerPC 601
$1254%181811.0$12000.803486DX2
$471%360431.0$9000.902386DX
Die cost
YieldDies/wafer
Area [mm2]
Defect [cm 2]
Wafer cost
Linewidth
MLChip
From "Estimating IC Manufacturing Costs,” by Linley Gwennap, Microprocessor Report, August 2, 1993, p. 15
Typical in 2002: 30cm diameter wafer, 4-6 metal layers, wafer cost $5K-6K
05/01/2004 CPE 631 24
CPE 631AM
Things to Remember
n Computing classes: desktop, server, embedd.n Technology trends
n Cost– Learning curve:
manufacturing costs decrease over time– Volume: the number of chips manufactured– Commodity
33% in 10 years4x in 3-4 yearsDisk
33% in 10 years4x in 3-4 yearsDRAM
2x in 3 years4x in 3+ yearsLogic
SpeedCapacity

•13
05/01/2004 CPE 631 25
CPE 631AM
Things to Remember (cont’d)
n Cost of an integrated circuit
yieldtestFinalcostPackagingcostTestingcostDie
costIC++
=
yieldDiewaferperDieswaferofCost
dieofCost×
=
areaDiediameterWafer
areaDiediameterWafer
waferperDies×
×−
×=
22 2 ππ )/(
α
α
−
×+×= areaDieareaunitperDefects
yieldWaferyieldDie 1