cox & kings ltd. results presentation for 4q fy15 & fy15 may 16
TRANSCRIPT
Cox & Kings Ltd. Results presentation for 4Q FY15 & FY15 May 16, 2015
1
This presentation has been prepared by Cox and Kings Limited (the “Company”) solely for your information and for your use and may not be taken away, reproduced, redistributed or passed on, directly or indirectly, to any other person (whether within or outside your organization or firm) or published in whole or in part, for any purpose. By attending this presentation, you are agreeing to be bound by the foregoing restrictions and to
maintain absolute confidentiality regarding the information disclosed in these materials.
The information contained in this presentation does not constitute or form any part of any offer, invitation or recommendation to purchase or subscribe for any securities in any jurisdiction, and neither the issue of the information nor anything contained herein shall form the basis of, or be
relied upon in connection with, any contract or commitment on the part of any person to proceed with any transaction. The information contained in these materials has not been independently verified. No representation or warranty, express or implied, is made and no reliance should be placed on
the accuracy, fairness or completeness of the information presented or contained in these materials. Any forward-looking statements in this presentation are subject to risks and uncertainties that could cause actual results to differ materially from those that may be inferred to being
expressed in, or implied by, such statements. Such forward-looking statements are not indicative or guarantees of future performance. Any forward-looking statements, projections and industry data made by third parties included in this presentation are not adopted by the Company and the Company is not responsible for such third party statements and projections. This presentation may not be all inclusive and may not contain all of the information that you may consider material. The information presented or contained in these materials is subject to change without notice and
its accuracy is not guaranteed. Neither the Company nor any of its affiliates, advisers or representatives accepts liability whatsoever for any loss howsoever arising from any information presented or contained in these materials.
THIS PRESENTATION IS NOT AN OFFER OF SECURITIES FOR SALE IN THE UNITED STATES OR ELSEWHERE.
Disclaimer Disclaimer
2

Individual business performance highlights and outlook
Quarterly performance
Annual highlights
Recap
3

4
Annual highlights
4
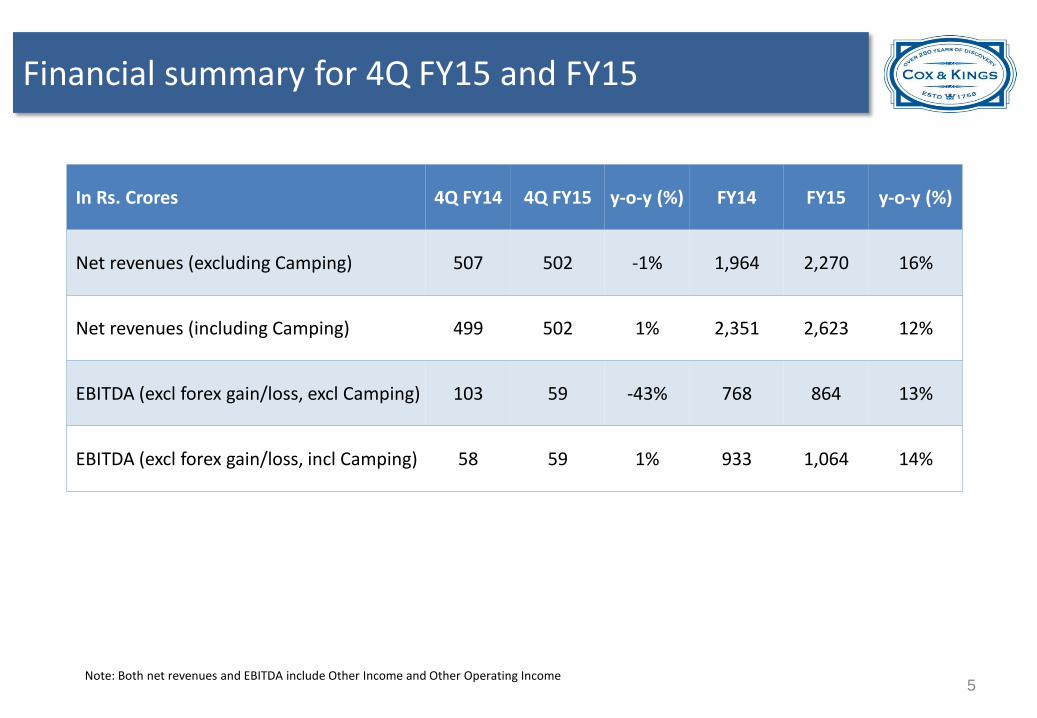
Financial summary for 4Q FY15 and FY15
In Rs. Crores 4Q FY14 4Q FY15 y-o-y (%) FY14 FY15 y-o-y (%)
Net revenues (excluding Camping) 507 502 -1% 1,964 2,270 16%
Net revenues (including Camping) 499 502 1% 2,351 2,623 12%
EBITDA (excl forex gain/loss, excl Camping) 103 59 -43% 768 864 13%
EBITDA (excl forex gain/loss, incl Camping) 58 59 1% 933 1,064 14%
Note: Both net revenues and EBITDA include Other Income and Other Operating Income 5
491 539
640
198 225 262
0%
10%
20%
30%
40%
50%
60%
70%
0
100
200
300
400
500
600
700
FY13 FY14 FY15
Net revenues EBITDA EBITDA margin (%) RHS
270
329 356
88 99 124
0%
10%
20%
30%
40%
50%
60%
70%
0
50
100
150
200
250
300
350
400
FY13 FY14 FY15
Net revenues EBITDA EBITDA margin (%) RHS
608 611 650
208 216 236
0%
10%
20%
30%
40%
50%
60%
70%
0
100
200
300
400
500
600
700
FY13 FY14 FY15
Net revenues EBITDA EBITDA margin (%) RHS
372 419
481
186 207 236
0%
10%
20%
30%
40%
50%
60%
70%
0
100
200
300
400
500
600
FY13 FY14 FY15
Net revenues EBITDA EBITDA margin (%) RHS
Our businesses have been growing robustly
All figures in Rs. Crores and excluding forex gain/(loss)
Leisure - India
Education Meininger
Leisure - International
6
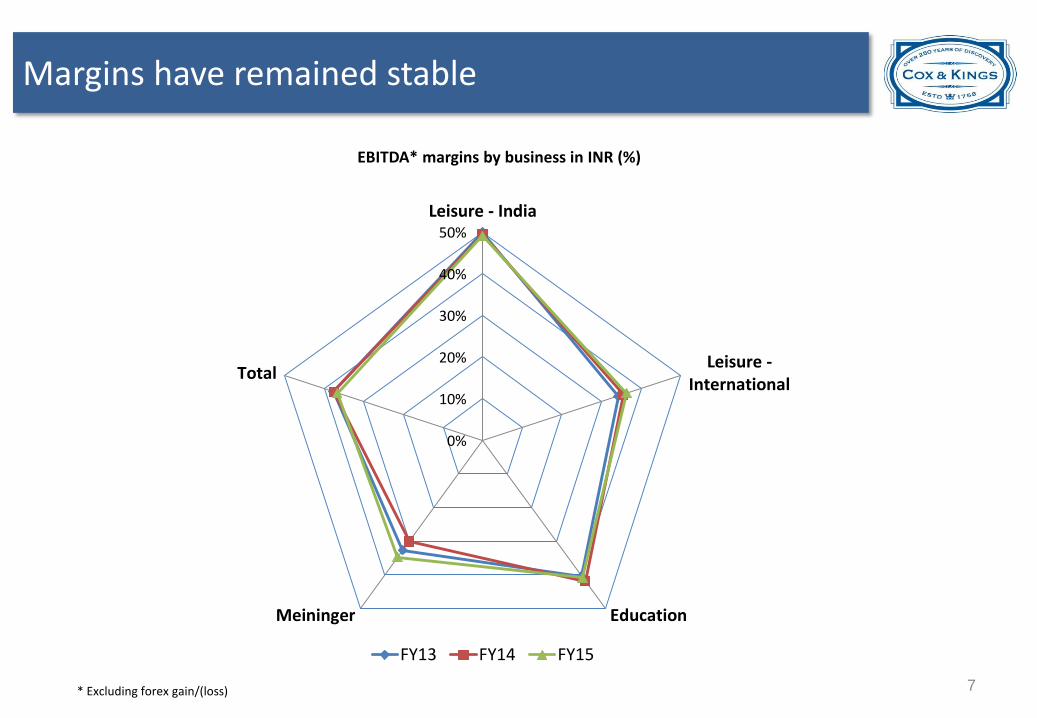
Margins have remained stable
EBITDA* margins by business in INR (%)
0%
10%
20%
30%
40%
50%
Leisure - India
Leisure -International
EducationMeininger
Total
FY13 FY14 FY15
* Excluding forex gain/(loss) 7
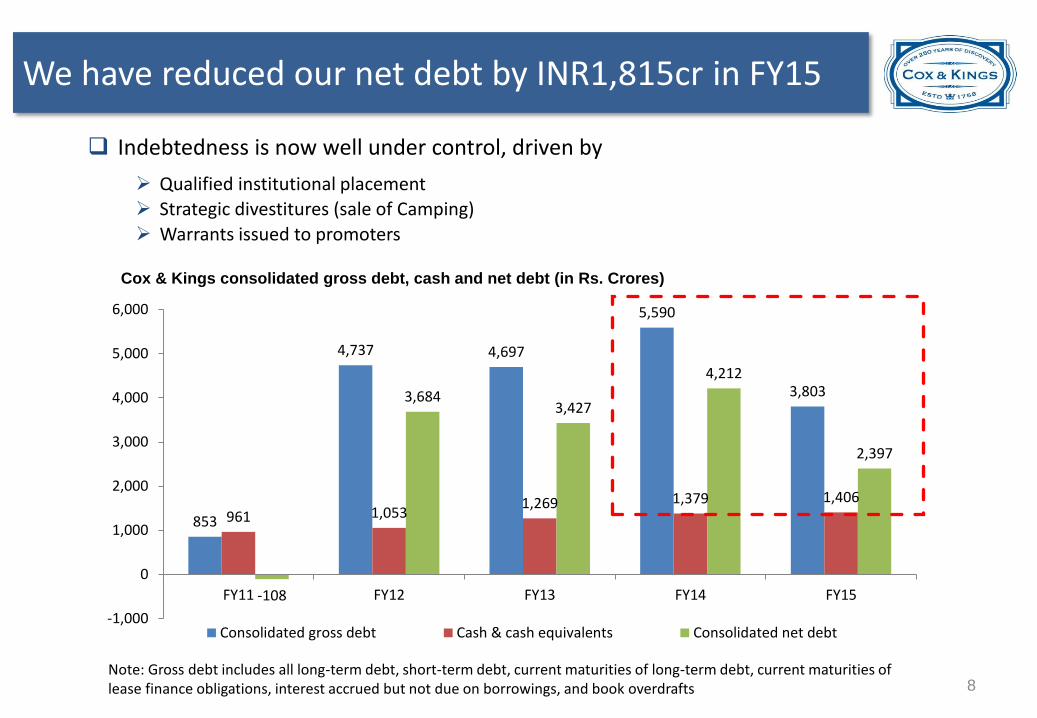
853
4,737 4,697
5,590
3,803
961 1,053 1,269 1,379 1,406
-108
3,684 3,427
4,212
2,397
-1,000
0
1,000
2,000
3,000
4,000
5,000
6,000
FY11 FY12 FY13 FY14 FY15
Consolidated gross debt Cash & cash equivalents Consolidated net debt
Note: Gross debt includes all long-term debt, short-term debt, current maturities of long-term debt, current maturities of lease finance obligations, interest accrued but not due on borrowings, and book overdrafts
We have reduced our net debt by INR1,815cr in FY15
Indebtedness is now well under control, driven by
Qualified institutional placement
Strategic divestitures (sale of Camping)
Warrants issued to promoters
Cox & Kings consolidated gross debt, cash and net debt (in Rs. Crores)
8
0.0
0.5
1.0
1.5
2.0
2.5
3.0
3.5
4.0
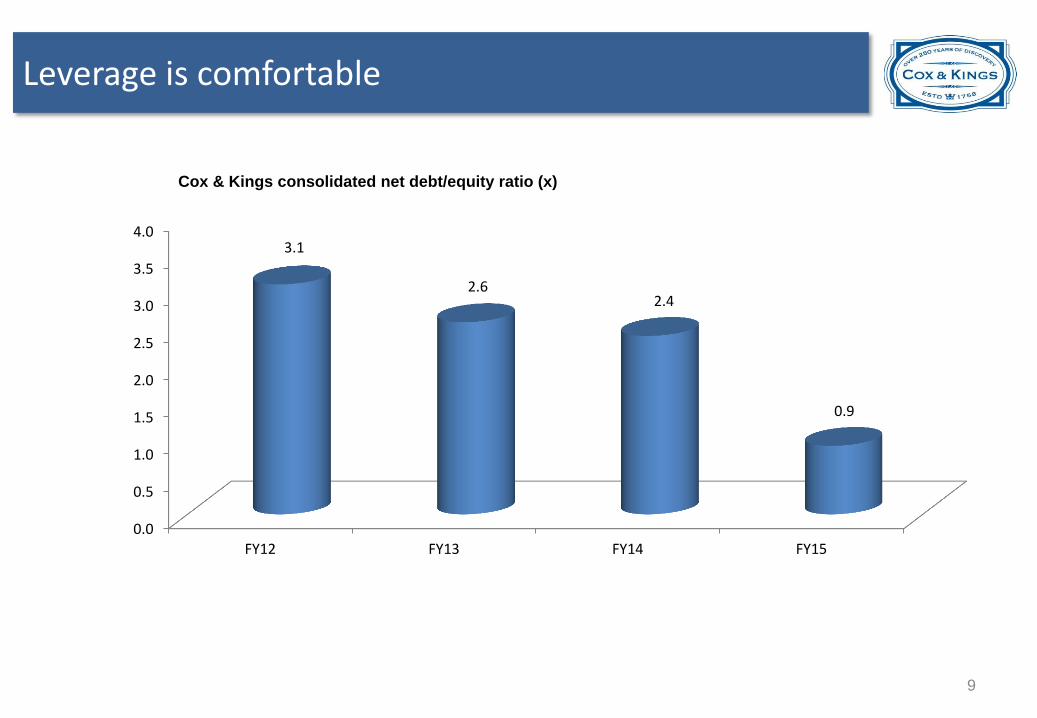
FY12 FY13 FY14 FY15
3.1
2.6 2.4
0.9
Leverage is comfortable
Cox & Kings consolidated net debt/equity ratio (x)
9
0%
10%
20%
30%
40%
50%
60%
0% 2% 4% 6% 8% 10% 12% 14% 16% 18%
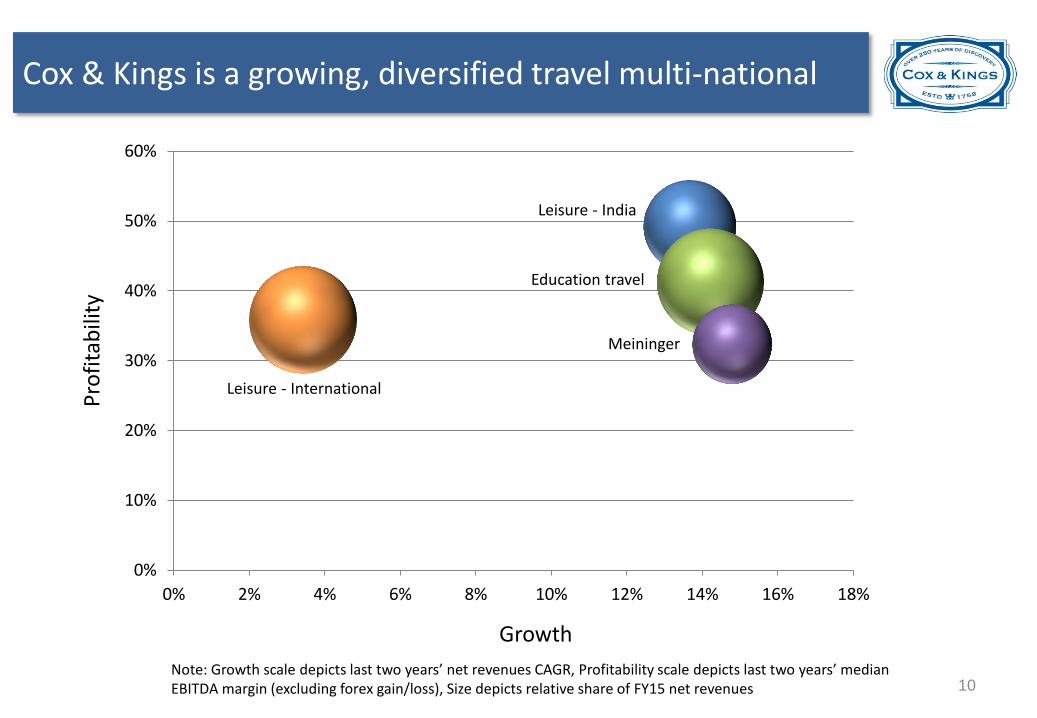
Cox & Kings is a growing, diversified travel multi-national
Growth
Pro
fita
bili
ty
Leisure - International
Education travel
Leisure - India
Meininger
Note: Growth scale depicts last two years’ net revenues CAGR, Profitability scale depicts last two years’ median EBITDA margin (excluding forex gain/loss), Size depicts relative share of FY15 net revenues 10
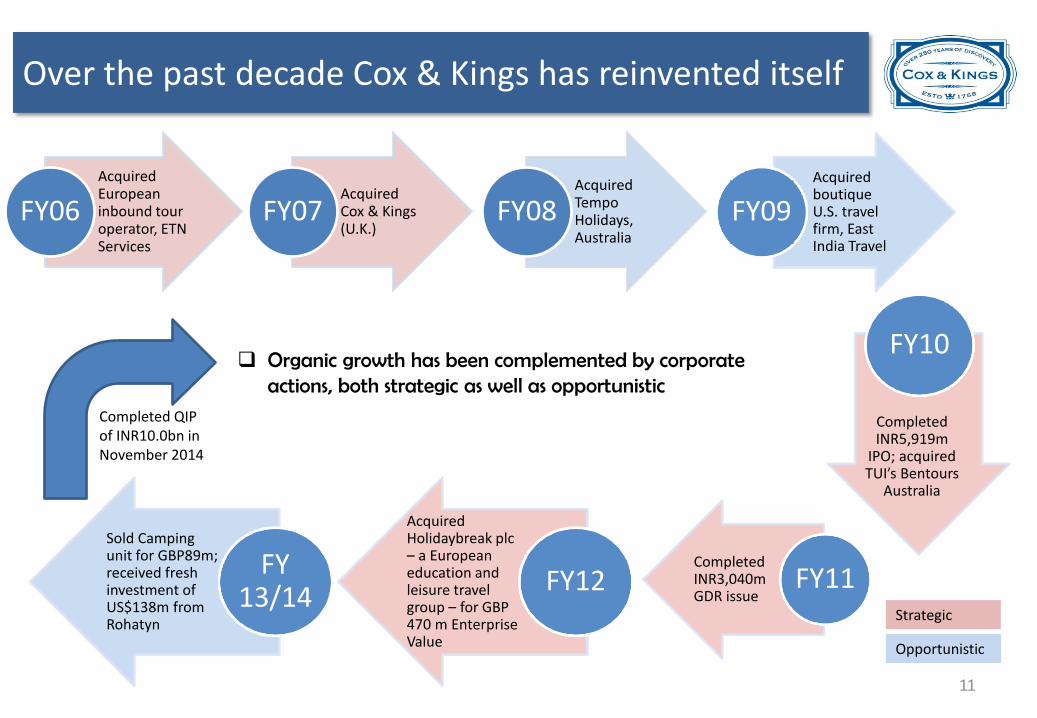
Over the past decade Cox & Kings has reinvented itself
Acquired European inbound tour operator, ETN Services
FY06 Acquired Cox & Kings (U.K.)
FY07 Acquired Tempo Holidays, Australia
FY08
Completed INR3,040m GDR issue
FY11
Acquired boutique U.S. travel firm, East India Travel
FY09
Completed INR5,919m
IPO; acquired TUI’s Bentours
Australia
FY10
Acquired Holidaybreak plc – a European education and leisure travel group – for GBP 470 m Enterprise Value
FY12
Sold Camping unit for GBP89m; received fresh investment of US$138m from Rohatyn
FY 13/14
Organic growth has been complemented by corporate actions, both strategic as well as opportunistic
Completed QIP of INR10.0bn in November 2014
Strategic
Opportunistic
11
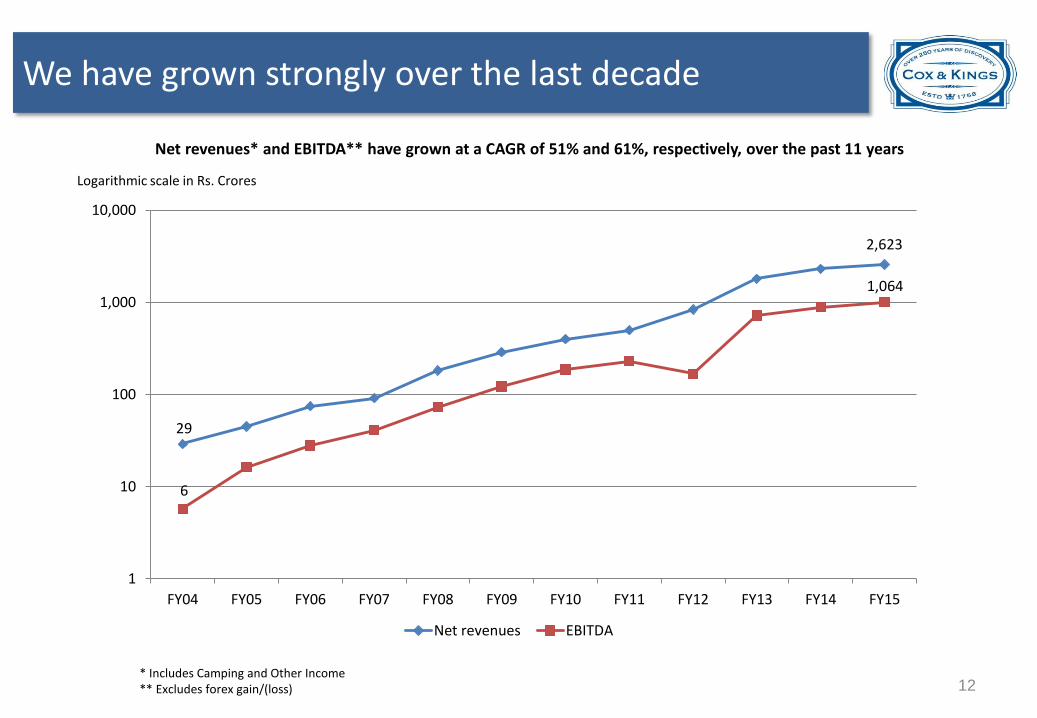
1
10
100
1,000
10,000
FY04 FY05 FY06 FY07 FY08 FY09 FY10 FY11 FY12 FY13 FY14 FY15
Net revenues EBITDA
We have grown strongly over the last decade
* Includes Camping and Other Income ** Excludes forex gain/(loss)
Net revenues* and EBITDA** have grown at a CAGR of 51% and 61%, respectively, over the past 11 years
Logarithmic scale in Rs. Crores
29
6
2,623
1,064
12
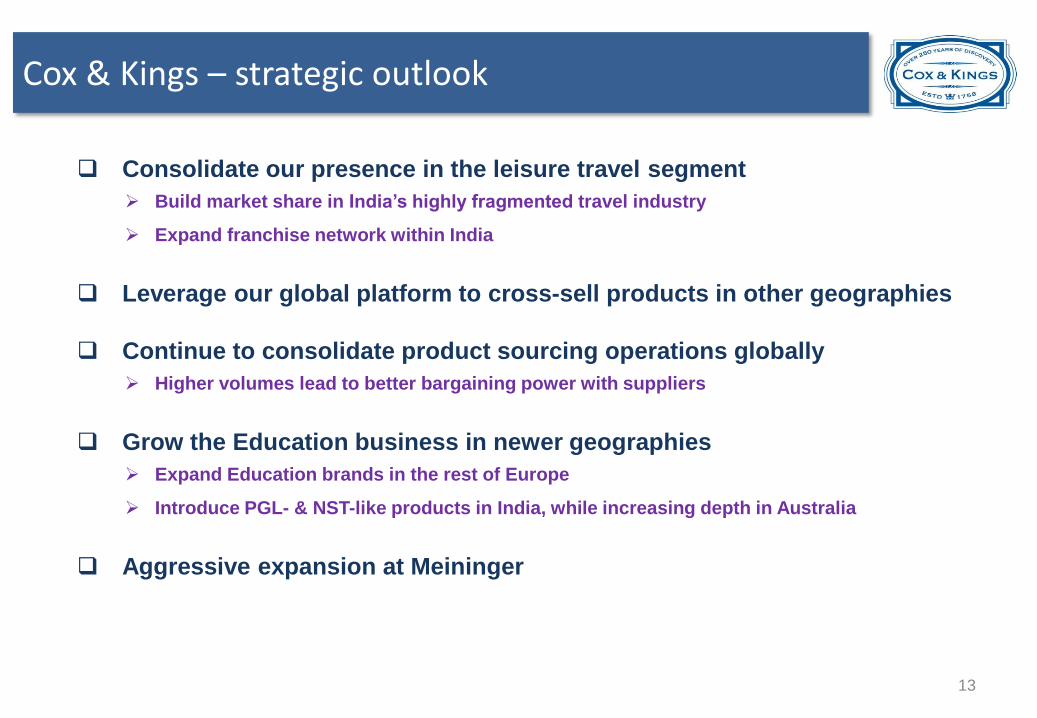
Cox & Kings – strategic outlook
Consolidate our presence in the leisure travel segment
Build market share in India’s highly fragmented travel industry
Expand franchise network within India
Leverage our global platform to cross-sell products in other geographies
Continue to consolidate product sourcing operations globally
Higher volumes lead to better bargaining power with suppliers
Grow the Education business in newer geographies
Expand Education brands in the rest of Europe
Introduce PGL- & NST-like products in India, while increasing depth in Australia
Aggressive expansion at Meininger
13
14
Individual business performance highlights and outlook
14
372 419
481
186 207 236
0%
10%
20%
30%
40%
50%
60%
70%
0
100
200
300
400
500
600
FY13 FY14 FY15
Net revenues EBITDA EBITDA margin (%) RHS
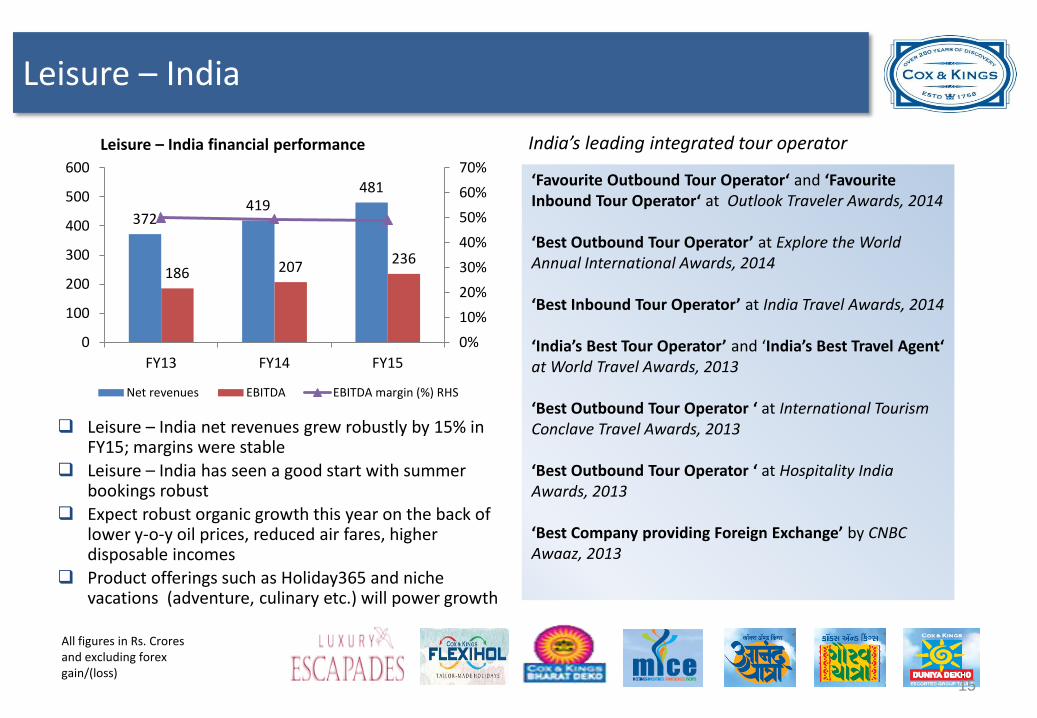
Leisure – India
Leisure – India financial performance
All figures in Rs. Crores and excluding forex gain/(loss)
India’s leading integrated tour operator
‘Favourite Outbound Tour Operator‘ and ‘Favourite Inbound Tour Operator‘ at Outlook Traveler Awards, 2014 ‘Best Outbound Tour Operator’ at Explore the World Annual International Awards, 2014 ‘Best Inbound Tour Operator’ at India Travel Awards, 2014 ‘India’s Best Tour Operator’ and ‘India’s Best Travel Agent‘ at World Travel Awards, 2013 ‘Best Outbound Tour Operator ‘ at International Tourism Conclave Travel Awards, 2013 ‘Best Outbound Tour Operator ‘ at Hospitality India Awards, 2013 ‘Best Company providing Foreign Exchange’ by CNBC Awaaz, 2013
Leisure – India net revenues grew robustly by 15% in FY15; margins were stable
Leisure – India has seen a good start with summer bookings robust
Expect robust organic growth this year on the back of lower y-o-y oil prices, reduced air fares, higher disposable incomes
Product offerings such as Holiday365 and niche vacations (adventure, culinary etc.) will power growth
15

India is a highly underpenetrated tourism market
India ranks a lowly 11th in the world stakes (inbound as well as domestic), despite the size of the country and the wealth of tourism opportunities available
The country ranks 18th in terms of visitor exports**, below smaller countries such as Thailand and Malaysia
in US$ billion (real 2014 prices) unless specified
Source: World Travel & Tourism Council 2015
* defined as total revenue generated within a country by industries that deal directly with tourists (excludes spending abroad by residents) minus purchases made by those
industries
** defined as spending within the country by international tourists, including business travelers
Travel market direct contribution to GDP* 2014 (US$ bn) Visitor exports** 2014 (US$ bn)
263.0
40.6 31.9 27.5 18.6 8.6 3.5 2.3 0
50
100
150
200
250
300
Ch
ina
Ind
ia
Thai
lan
d
Ind
on
esia
Mal
aysi
a
Vie
tnam
Sri L
anka
Cam
bo
dia
60.8
40.3
22.6 20.1
11.2 7.8
3.5 3.2
0
10
20
30
40
50
60
70
Ch
ina
Thai
lan
d
Mal
aysi
a
Ind
ia
Ind
on
esia
Vie
tnam
Sri L
anka
Cam
bo
dia
16

0
20
40
60
80
100
120
2010 2015 2020 2025 20300
20
40
60
80
100
120
2012 2017 2022 2027
Indian tourism will grow rapidly over the next 10 years
in INR billion (real 2014 prices) unless specified; INR:US$ conversion at 62
Source: World Travel & Tourism Council 2015
* defined as total revenue generated within a country by industries that deal directly with tourists (excludes spending abroad by residents) minus purchases made by those
industries
** defined as spending within the country by international tourists, including business travelers
Government initiatives will play a pivotal role in driving Indian tourism. Tourism can, in turn, play a critical role in driving the Indian economy as employment growth in other sectors plateaus
Direct, indirect and induced impacts of tourism generated US$7.6 trillion, or 9.8% of global GDP in 2014, yet India managed to derive only 6.7% of its own GDP from the sector
Tourism generated 277 million jobs (1 in 11) globally, of which 105 million were direct, according to WTTC. Yet, India has only 37 million employed in the sector. Every job in tourism almost triples upon itself
US$43bn
US$86bn
India's travel market* will double b/w 2015e-25F Visitors exports** will expand
US$21bn
US$38bn 7.8
15.3
0.0
2.0
4.0
6.0
8.0
10.0
12.0
14.0
16.0
18.0
2014 2025
Tourist arrivals will grow rapidly in million nos.
F F F
17
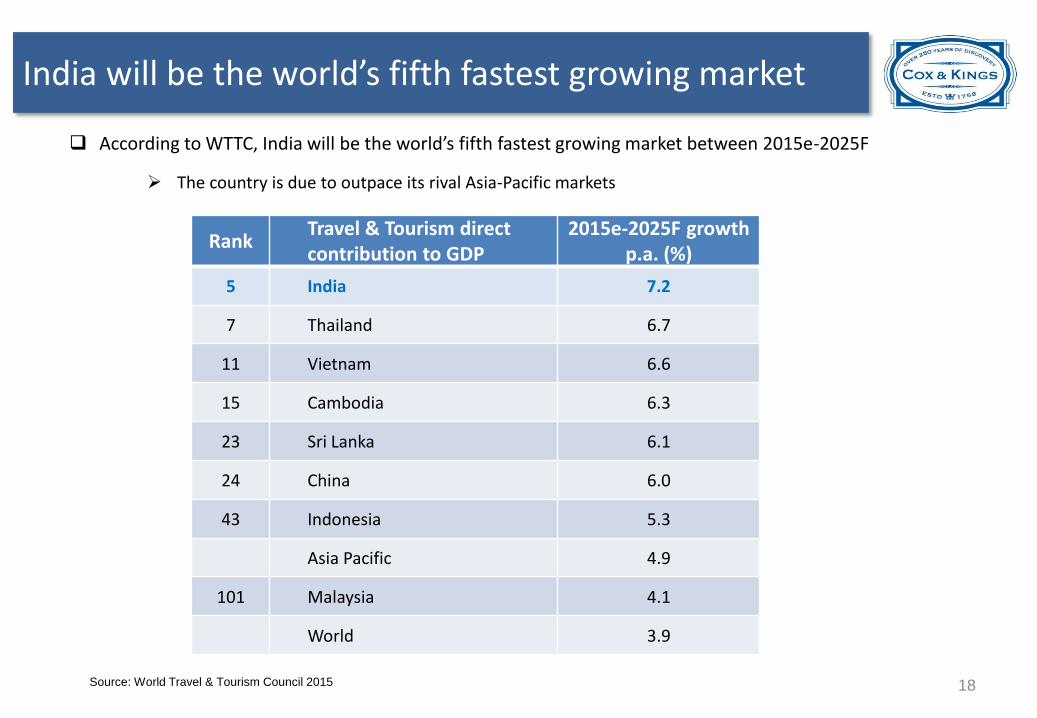
India will be the world’s fifth fastest growing market
According to WTTC, India will be the world’s fifth fastest growing market between 2015e-2025F
The country is due to outpace its rival Asia-Pacific markets
Source: World Travel & Tourism Council 2015
Rank Travel & Tourism direct contribution to GDP
2015e-2025F growth p.a. (%)
5 India 7.2
7 Thailand 6.7
11 Vietnam 6.6
15 Cambodia 6.3
23 Sri Lanka 6.1
24 China 6.0
43 Indonesia 5.3
Asia Pacific 4.9
101 Malaysia 4.1
World 3.9
18
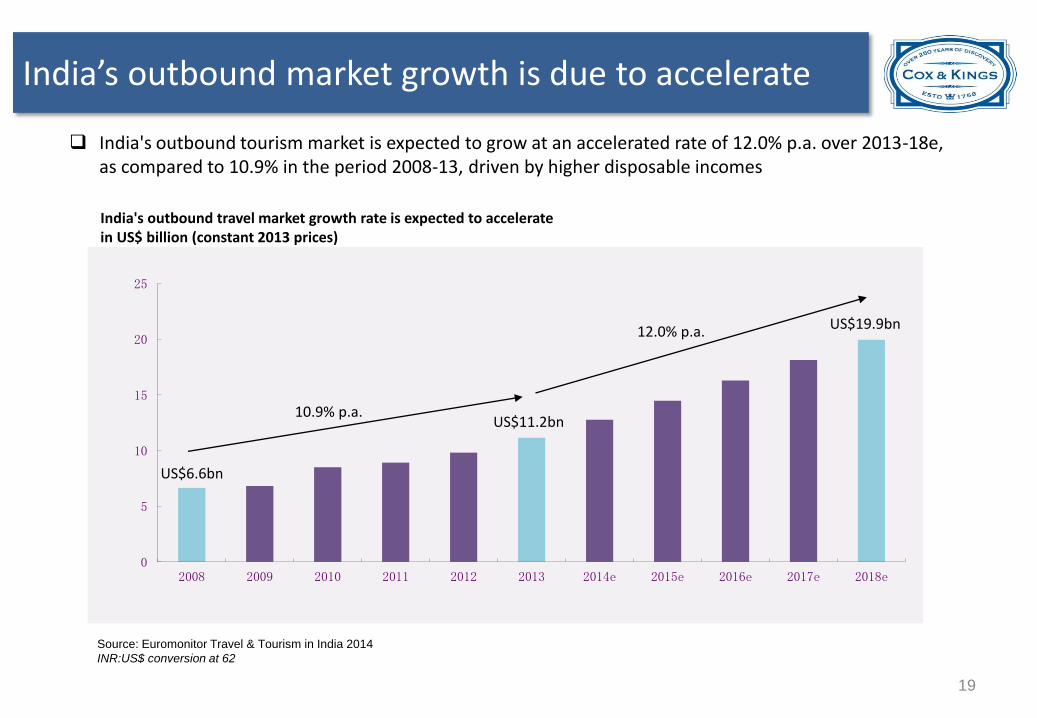
India’s outbound market growth is due to accelerate
0
5
10
15
20
25
2008 2009 2010 2011 2012 2013 2014e 2015e 2016e 2017e 2018e
India's outbound tourism market is expected to grow at an accelerated rate of 12.0% p.a. over 2013-18e, as compared to 10.9% in the period 2008-13, driven by higher disposable incomes
Source: Euromonitor Travel & Tourism in India 2014
INR:US$ conversion at 62
India's outbound travel market growth rate is expected to accelerate in US$ billion (constant 2013 prices)
10.9% p.a.
12.0% p.a.
US$11.2bn
US$19.9bn
US$6.6bn
19
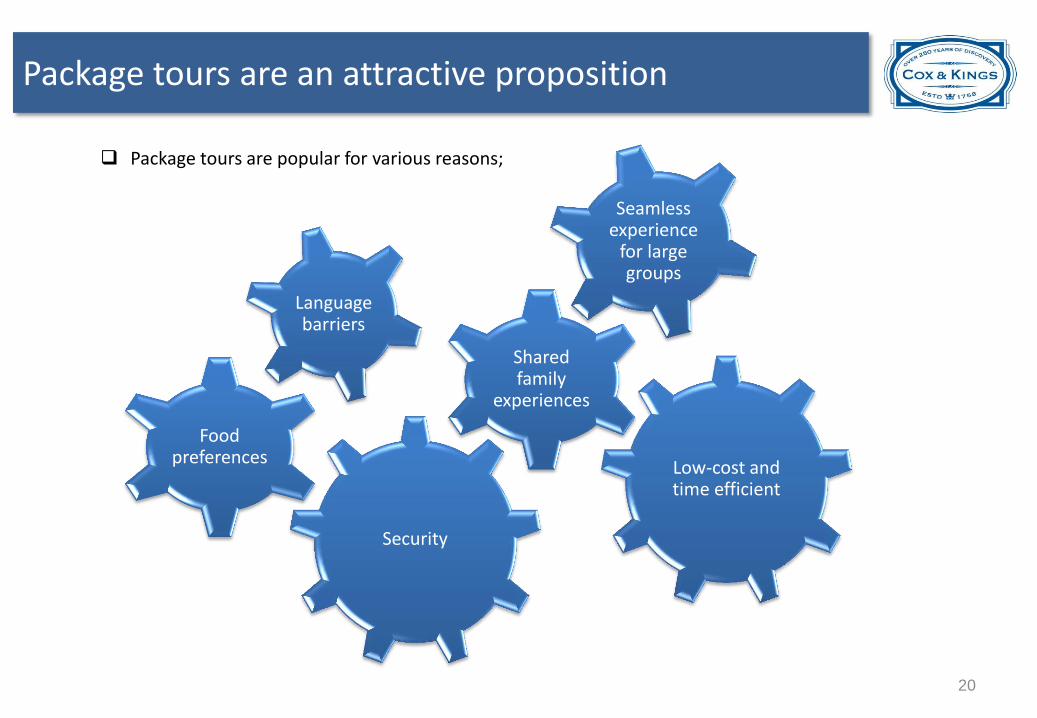
Low-cost and time efficient
Shared family
experiences
Seamless experience
for large groups
Package tours are an attractive proposition
Package tours are popular for various reasons;
Security
Food preferences
Language barriers
20
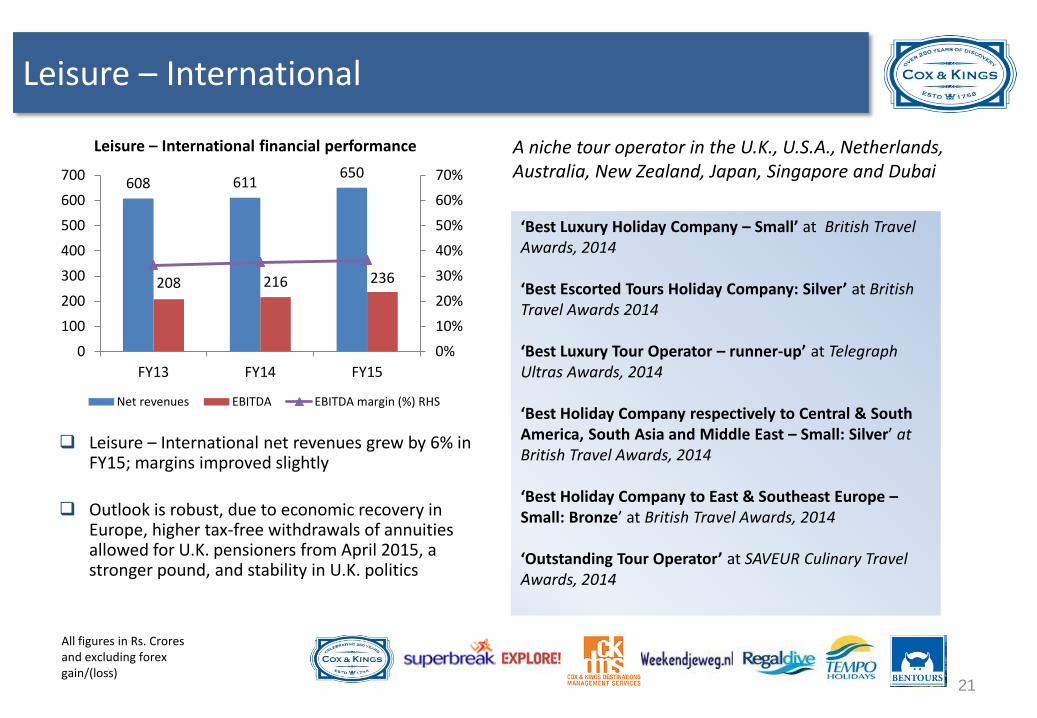
Leisure – International
Leisure – International financial performance
‘Best Luxury Holiday Company – Small’ at British Travel Awards, 2014 ‘Best Escorted Tours Holiday Company: Silver’ at British Travel Awards 2014 ‘Best Luxury Tour Operator – runner-up’ at Telegraph Ultras Awards, 2014 ‘Best Holiday Company respectively to Central & South America, South Asia and Middle East – Small: Silver’ at British Travel Awards, 2014 ‘Best Holiday Company to East & Southeast Europe – Small: Bronze’ at British Travel Awards, 2014 ‘Outstanding Tour Operator’ at SAVEUR Culinary Travel Awards, 2014
All figures in Rs. Crores and excluding forex gain/(loss)
A niche tour operator in the U.K., U.S.A., Netherlands, Australia, New Zealand, Japan, Singapore and Dubai
Leisure – International net revenues grew by 6% in FY15; margins improved slightly
Outlook is robust, due to economic recovery in Europe, higher tax-free withdrawals of annuities allowed for U.K. pensioners from April 2015, a stronger pound, and stability in U.K. politics
608 611 650
208 216 236
0%
10%
20%
30%
40%
50%
60%
70%
0
100
200
300
400
500
600
700
FY13 FY14 FY15
Net revenues EBITDA EBITDA margin (%) RHS
21
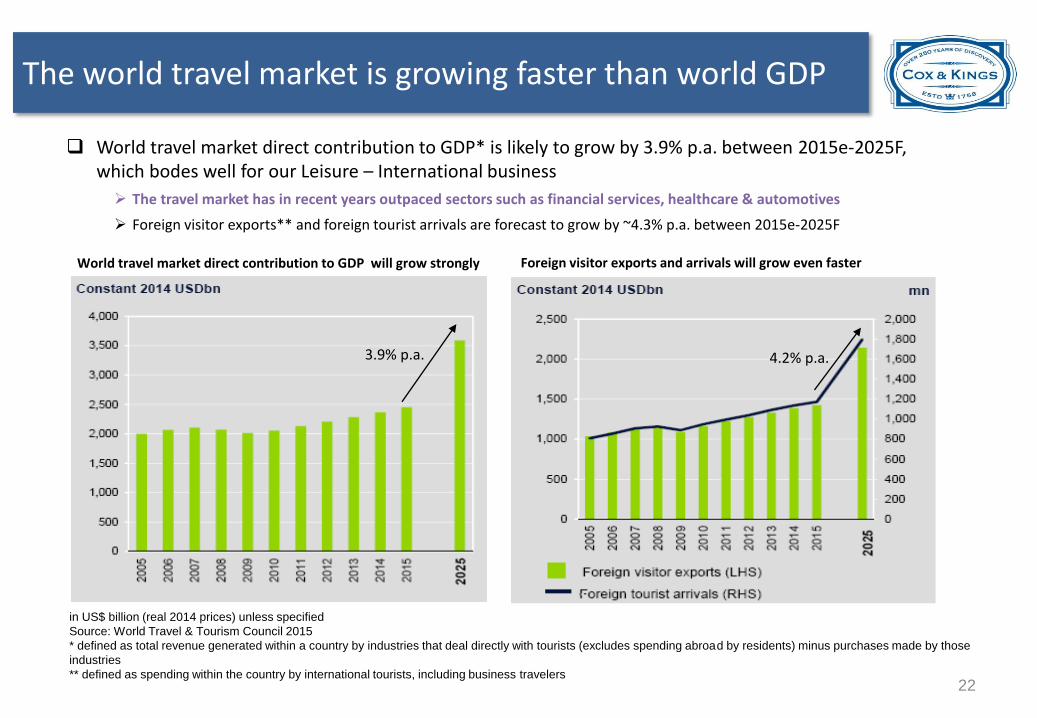
World travel market direct contribution to GDP* is likely to grow by 3.9% p.a. between 2015e-2025F, which bodes well for our Leisure – International business
The travel market has in recent years outpaced sectors such as financial services, healthcare & automotives
Foreign visitor exports** and foreign tourist arrivals are forecast to grow by ~4.3% p.a. between 2015e-2025F
in US$ billion (real 2014 prices) unless specified
Source: World Travel & Tourism Council 2015
* defined as total revenue generated within a country by industries that deal directly with tourists (excludes spending abroad by residents) minus purchases made by those
industries
** defined as spending within the country by international tourists, including business travelers
World travel market direct contribution to GDP will grow strongly Foreign visitor exports and arrivals will grow even faster
3.9% p.a. 4.2% p.a.
The world travel market is growing faster than world GDP
22

Education
Education financial performance
PGL (UK) operational metrics FY14 FY15
Owned beds (nos.) 6,917 7,267
Leased beds (nos.) 1,604 1,604
Total bed capacity (nos.) 8,521 8,871
Occupied bed nights (nos.) 9,67,116 11,12,549
Average revenue/bed night (GBP) 65.7 66.2
All figures in Rs. Crores and excluding forex gain/(loss)
Education net revenues grew 19% in rupee terms (up 16% in constant currency terms) in FY15; margins fell slightly
National Citizenship Service (NCS) programs partly led to increased occupancy at PGL this year, especially during the lean season of Nov-Feb
NST and EST, respectively, booked 14% and 11% more passengers y-o-y in FY15, partly due to the timing of Easter
PGL has 83% booked of internal revenue projections for FY16 and 37% for FY17
PGL Australia’s total no. of passengers exceeded internal expectations by 38%
Capex in FY16 at Liddington extension (392 beds), Marchants Hill (312) and Chateau Grande Romaine (192)
491 539
640
198 225 262
0%
10%
20%
30%
40%
50%
60%
70%
0
100
200
300
400
500
600
700
FY13 FY14 FY15
Net revenues EBITDA EBITDA margin (%) RHS
23
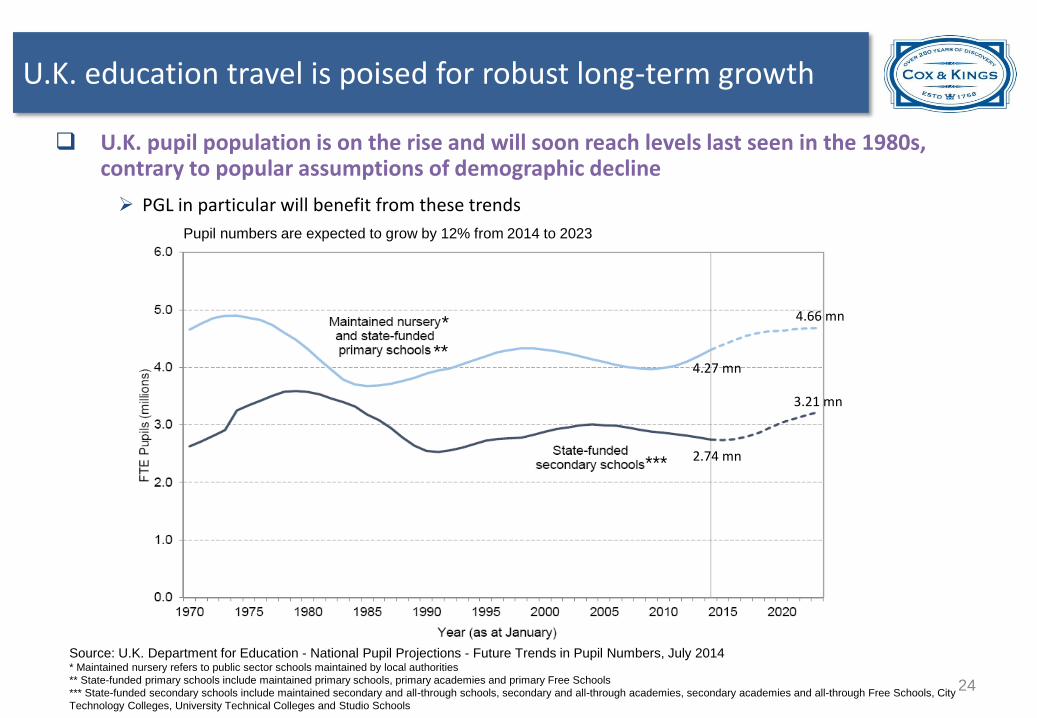
U.K. education travel is poised for robust long-term growth
U.K. pupil population is on the rise and will soon reach levels last seen in the 1980s, contrary to popular assumptions of demographic decline
PGL in particular will benefit from these trends
*
***
**
2.74 mn
3.21 mn
4.66 mn
4.27 mn
Pupil numbers are expected to grow by 12% from 2014 to 2023
Source: U.K. Department for Education - National Pupil Projections - Future Trends in Pupil Numbers, July 2014 * Maintained nursery refers to public sector schools maintained by local authorities
** State-funded primary schools include maintained primary schools, primary academies and primary Free Schools
*** State-funded secondary schools include maintained secondary and all-through schools, secondary and all-through academies, secondary academies and all-through Free Schools, City
Technology Colleges, University Technical Colleges and Studio Schools
24
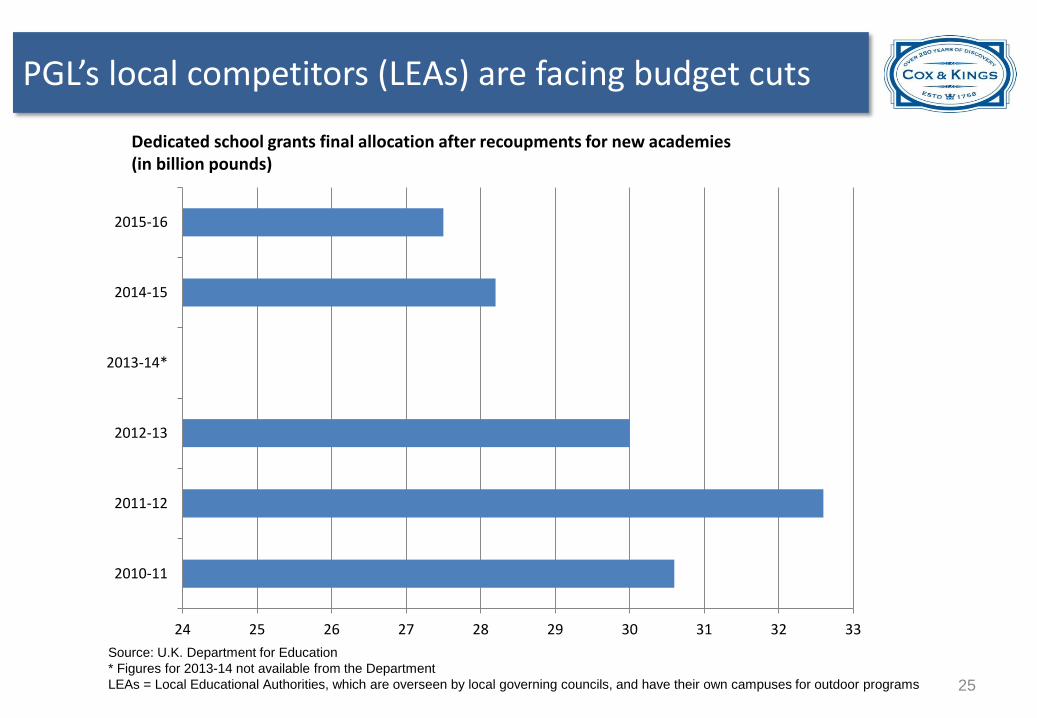
PGL’s local competitors (LEAs) are facing budget cuts
24 25 26 27 28 29 30 31 32 33
2010-11
2011-12
2012-13
2013-14*
2014-15
2015-16
Source: U.K. Department for Education
* Figures for 2013-14 not available from the Department
LEAs = Local Educational Authorities, which are overseen by local governing councils, and have their own campuses for outdoor programs
Dedicated school grants final allocation after recoupments for new academies (in billion pounds)
25

Meininger
Meininger financial performance
No.1 Large Hostel Chain 2014
Net revenues up 8% in INR terms in FY15 due to ~5% weaker y-o-y Euro/GBP (reporting currency) conversion; margins rose by 440bps y-o-y on higher RevPAB and better occupancy
Refurbishment projects underway in Munich, Hamburg, Berlin main station and Frankfurt airport
Full benefit of 132 new beds at the Amsterdam site will flow in FY16
~39% of internal revenue targets for FY16 already booked
We expect to add ~2,000 beds in FY17
Meininger operational metrics FY14 FY15
No. of rooms (nos.) 2,079 2,127
No. of beds (nos.) 6,923 7,023
No. of bed nights (nos.) 17,78,238 18,95,258
Bed occupancy rate (%) 70.8% 75.0%
RevPAB (EUR/bed) 18.9 20.5
All figures in Rs. Crores and excluding forex gain/(loss)
270
329 356
88 99 124
0%
10%
20%
30%
40%
50%
60%
70%
0
50
100
150
200
250
300
350
400
FY13 FY14 FY15
Net revenues EBITDA EBITDA margin (%) RHS
26
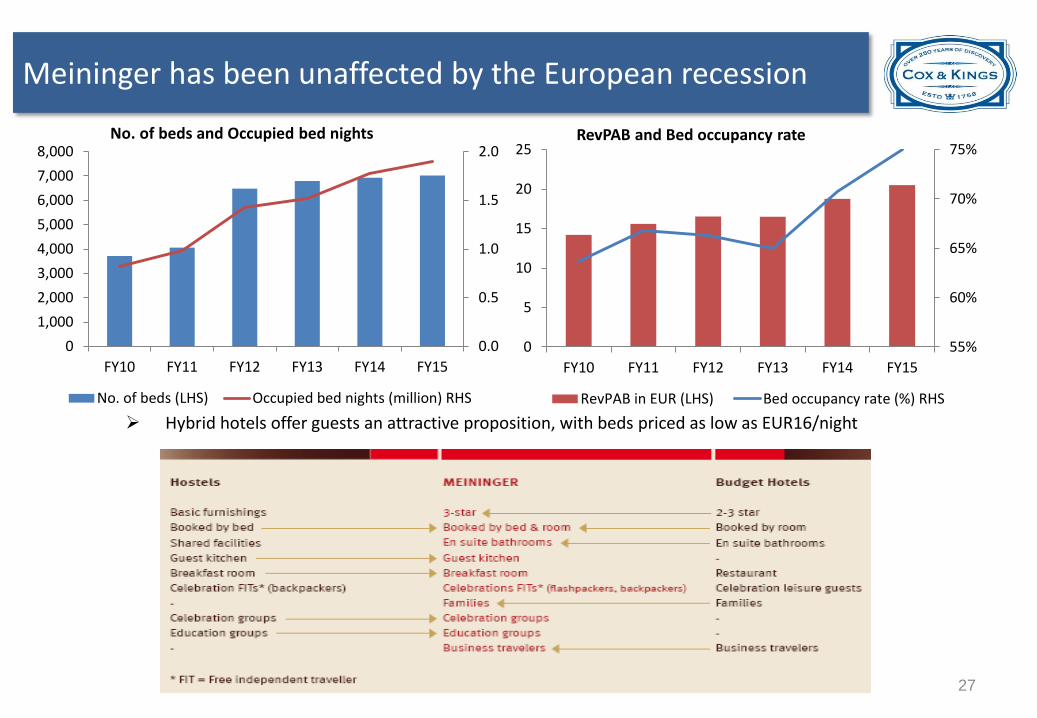
Meininger has been unaffected by the European recession
Hybrid hotels offer guests an attractive proposition, with beds priced as low as EUR16/night
No. of beds and Occupied bed nights RevPAB and Bed occupancy rate
27
0.0
0.5
1.0
1.5
2.0
0
1,000
2,000
3,000
4,000
5,000
6,000
7,000
8,000
FY10 FY11 FY12 FY13 FY14 FY15
No. of beds (LHS) Occupied bed nights (million) RHS
55%
60%
65%
70%
75%
0
5
10
15
20
25
FY10 FY11 FY12 FY13 FY14 FY15
RevPAB in EUR (LHS) Bed occupancy rate (%) RHS

We have a strong presence in Germany and Austria
28

Meininger is looking to expand aggressively
Targeted new locations in Europe
29
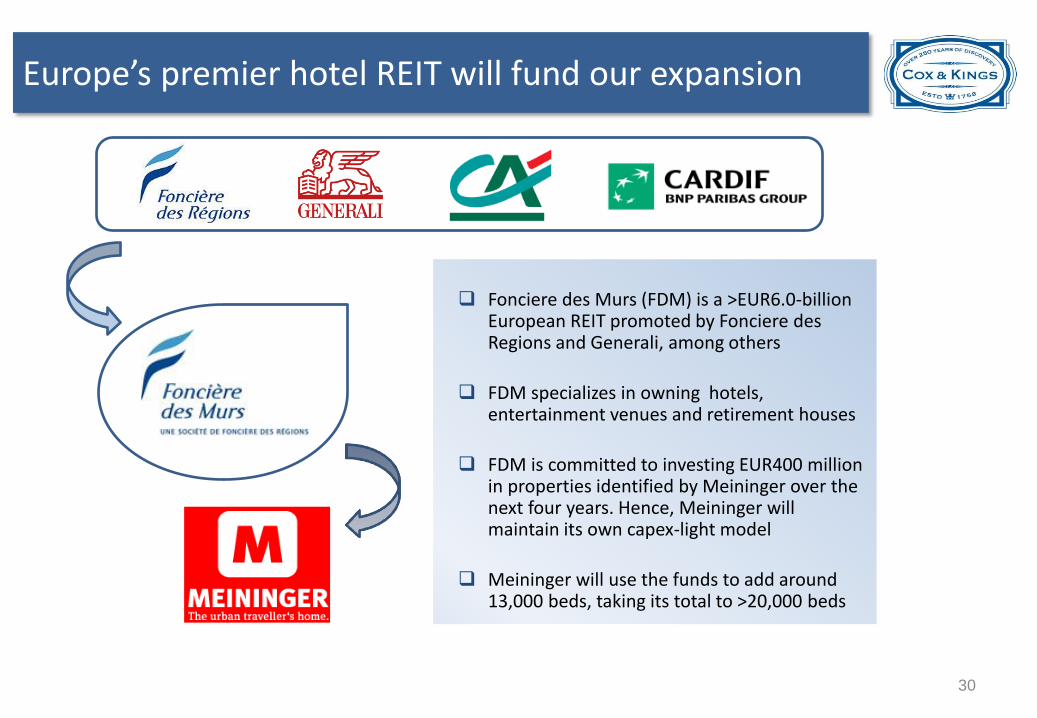
Europe’s premier hotel REIT will fund our expansion
Fonciere des Murs (FDM) is a >EUR6.0-billion European REIT promoted by Fonciere des Regions and Generali, among others
FDM specializes in owning hotels, entertainment venues and retirement houses
FDM is committed to investing EUR400 million in properties identified by Meininger over the next four years. Hence, Meininger will maintain its own capex-light model
Meininger will use the funds to add around 13,000 beds, taking its total to >20,000 beds
30
Quarterly performance
31
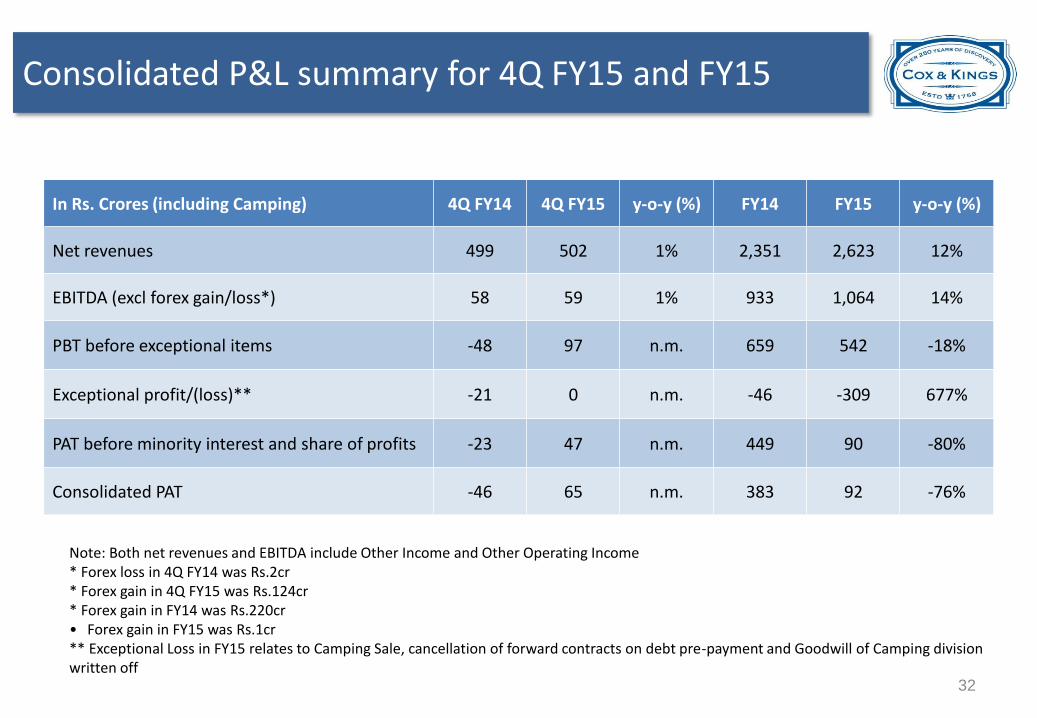
Consolidated P&L summary for 4Q FY15 and FY15
Note: Both net revenues and EBITDA include Other Income and Other Operating Income * Forex loss in 4Q FY14 was Rs.2cr * Forex gain in 4Q FY15 was Rs.124cr * Forex gain in FY14 was Rs.220cr • Forex gain in FY15 was Rs.1cr ** Exceptional Loss in FY15 relates to Camping Sale, cancellation of forward contracts on debt pre-payment and Goodwill of Camping division written off
In Rs. Crores (including Camping) 4Q FY14 4Q FY15 y-o-y (%) FY14 FY15 y-o-y (%)
Net revenues 499 502 1% 2,351 2,623 12%
EBITDA (excl forex gain/loss*) 58 59 1% 933 1,064 14%
PBT before exceptional items -48 97 n.m. 659 542 -18%
Exceptional profit/(loss)** -21 0 n.m. -46 -309 677%
PAT before minority interest and share of profits -23 47 n.m. 449 90 -80%
Consolidated PAT -46 65 n.m. 383 92 -76%
32
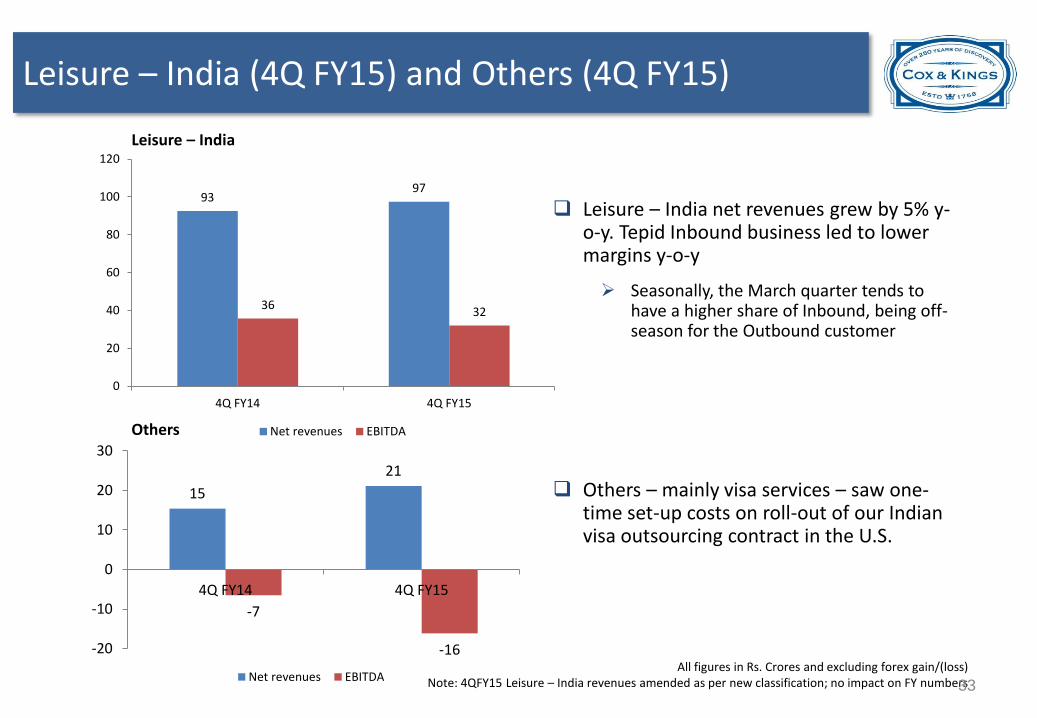
Leisure – India (4Q FY15) and Others (4Q FY15)
Leisure – India net revenues grew by 5% y-o-y. Tepid Inbound business led to lower margins y-o-y
Seasonally, the March quarter tends to have a higher share of Inbound, being off-season for the Outbound customer
Others – mainly visa services – saw one-time set-up costs on roll-out of our Indian visa outsourcing contract in the U.S.
Leisure – India
Others
All figures in Rs. Crores and excluding forex gain/(loss) Note: 4QFY15 Leisure – India revenues amended as per new classification; no impact on FY numbers
15
21
-7
-16 -20
-10
0
10
20
30
4Q FY14 4Q FY15
Net revenues EBITDA
93 97
36 32
0
20
40
60
80
100
120
4Q FY14 4Q FY15
Net revenues EBITDA
33
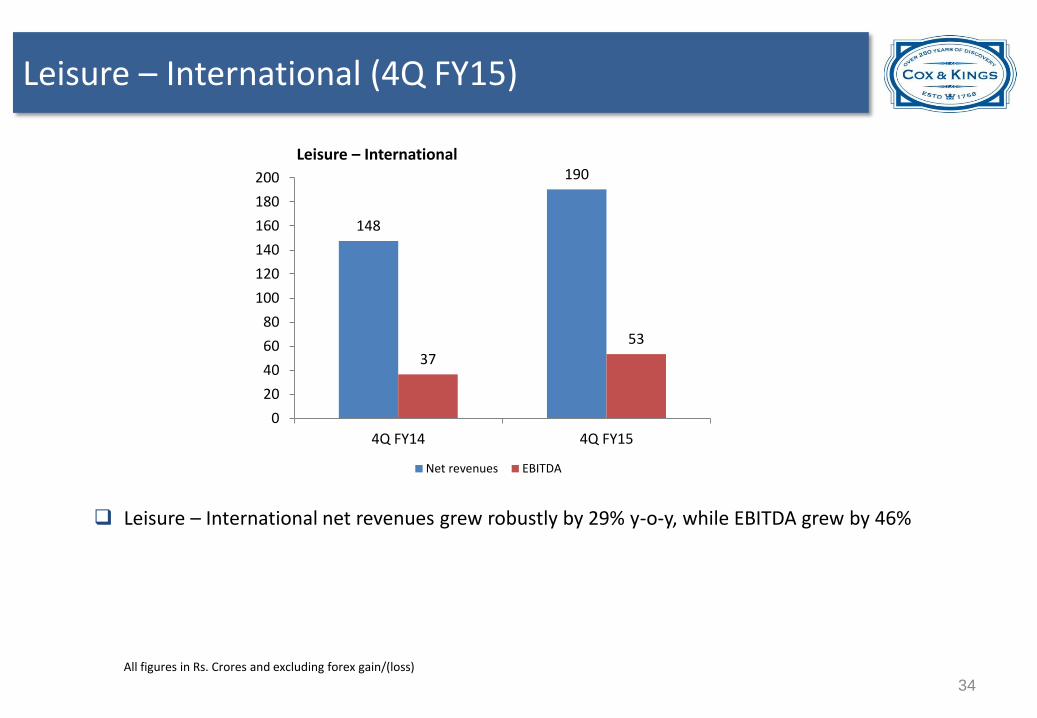
Leisure – International (4Q FY15)
All figures in Rs. Crores and excluding forex gain/(loss)
Leisure – International net revenues grew robustly by 29% y-o-y, while EBITDA grew by 46%
Leisure – International
148
190
37
53
0
20
40
60
80
100
120
140
160
180
200
4Q FY14 4Q FY15
Net revenues EBITDA
34
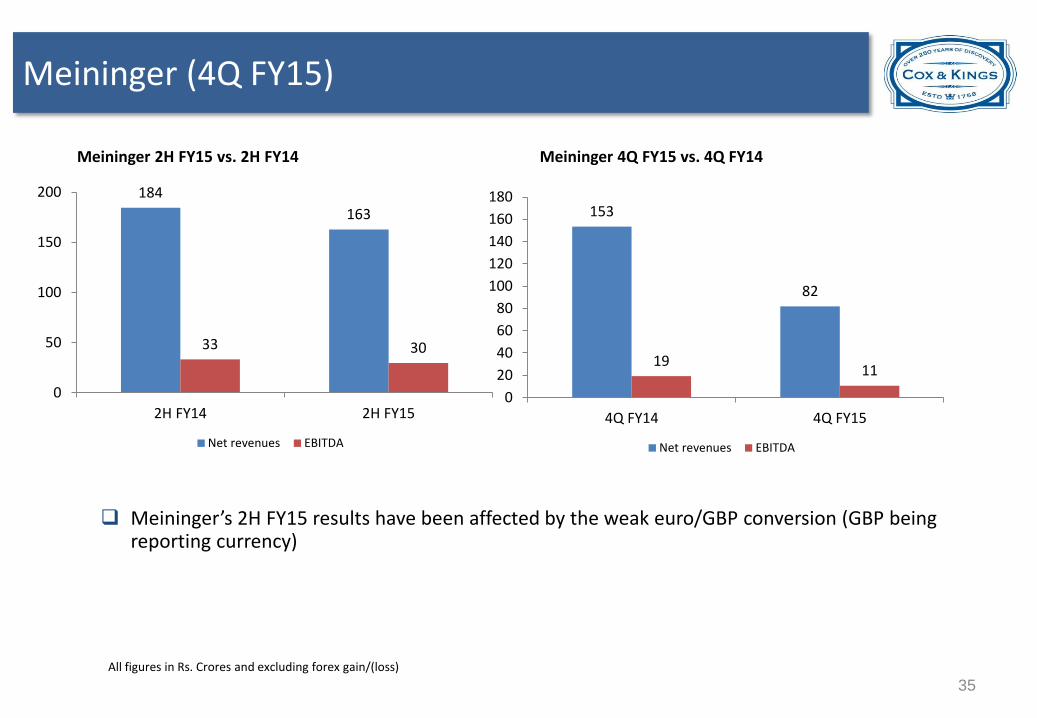
Meininger (4Q FY15)
All figures in Rs. Crores and excluding forex gain/(loss)
Meininger’s 2H FY15 results have been affected by the weak euro/GBP conversion (GBP being reporting currency)
Meininger 4Q FY15 vs. 4Q FY14
153
82
19 11
0
20
40
60
80
100
120
140
160
180
4Q FY14 4Q FY15
Net revenues EBITDA
184
163
33 30
0
50
100
150
200
2H FY14 2H FY15
Net revenues EBITDA
Meininger 2H FY15 vs. 2H FY14
35
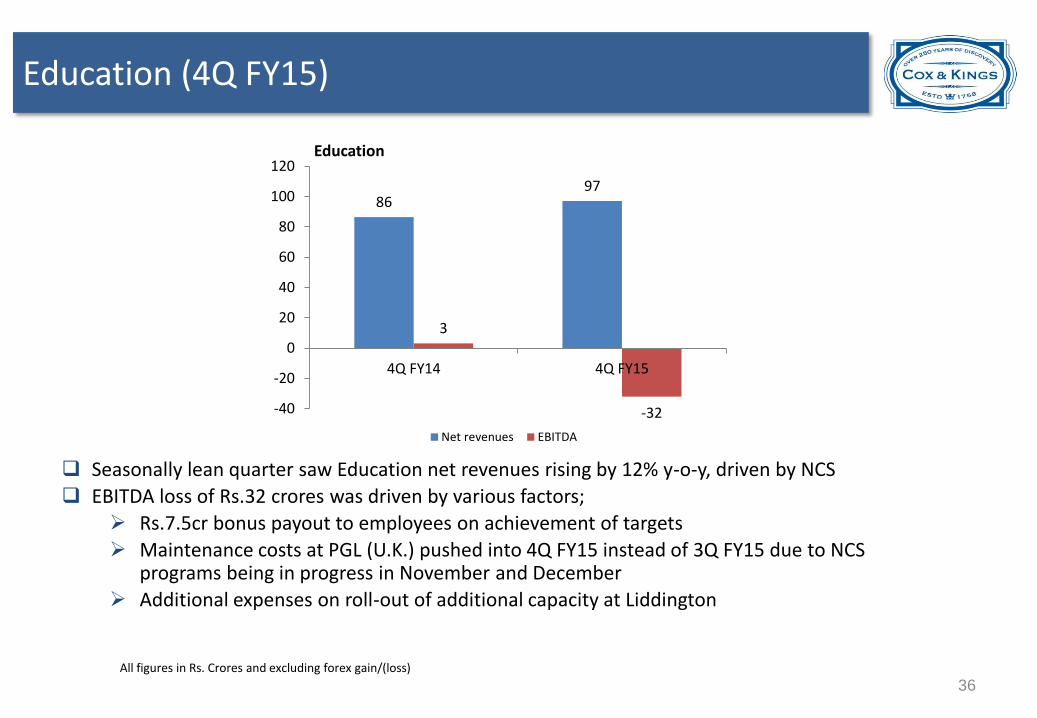
Education (4Q FY15)
All figures in Rs. Crores and excluding forex gain/(loss)
Seasonally lean quarter saw Education net revenues rising by 12% y-o-y, driven by NCS
EBITDA loss of Rs.32 crores was driven by various factors;
Rs.7.5cr bonus payout to employees on achievement of targets
Maintenance costs at PGL (U.K.) pushed into 4Q FY15 instead of 3Q FY15 due to NCS programs being in progress in November and December
Additional expenses on roll-out of additional capacity at Liddington
Education
86 97
3
-32 -40
-20
0
20
40
60
80
100
120
4Q FY14 4Q FY15
Net revenues EBITDA
36

Recap
37
FY15 in a nutshell
Robust growth across businesses
Education and Meininger saw standout performances Margin integrity maintained across businesses Leverage reduced to comfortable levels
38
For further details, please contact:
Cox & Kings Ltd, Turner Morrison Building, 16 Bank Street, Fort, Mumbai - 400 001
Website: www.coxandkings.com
Email: [email protected]
Thank You
39