cow/calf cost of production goals oklahoma state university
Post on 18-Dec-2015
217 views
TRANSCRIPT

Cow/Calf Cost of Production Goals
Oklahoma State University

IRM-SPA
Goal setting starts with an evaluation of ranch performance….
Determine profitability of the ranch Identify areas where the ranch business
has excelled Identify opportunities for improvement

IRM-SPA
Provide for more informed decisions!
Why Evaluate Ranch Performance?

IRM-SPA
Standardized Performance Analysis (SPA) is...
A management tool to integrate production and financial data in performance measures.
Cow-Calf SPA ...helps identify possibilities for change in the cow-calf enterprise.
It is not a record-keeping program!
Benchmarks from SPA DataBenchmarks from SPA Data
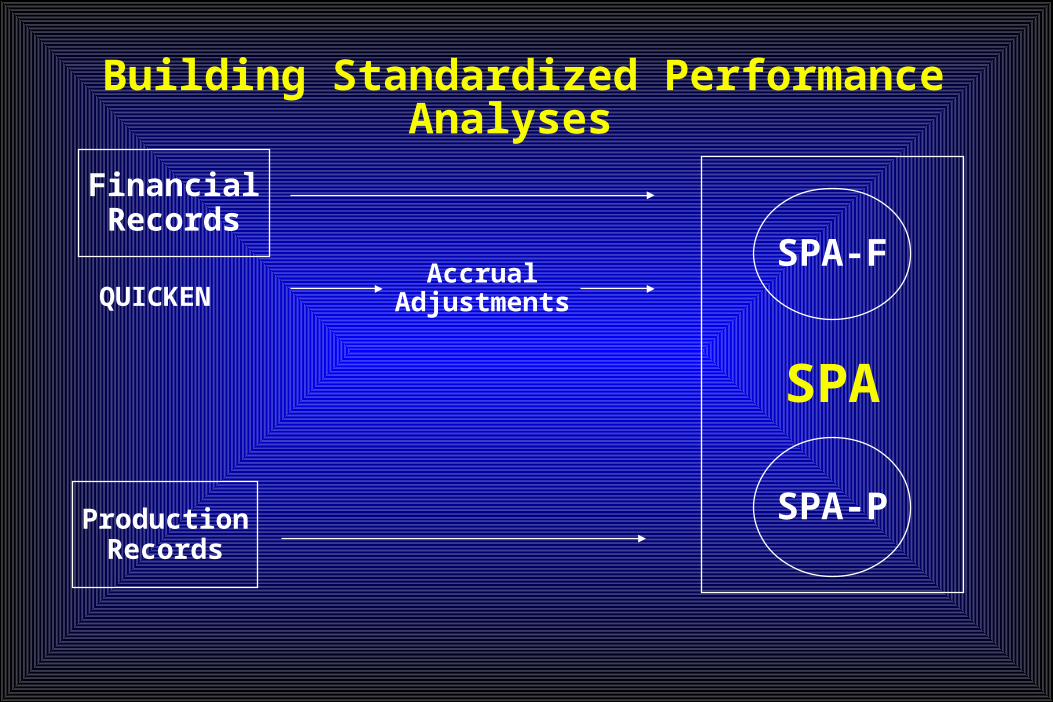
SPA-P
FinancialRecords
QUICKENAccrual
Adjustments
ProductionRecords
Building Standardized Performance Analyses
SPA
SPA-F

IRM-SPA
Why is standardization needed?
IRM-SPA
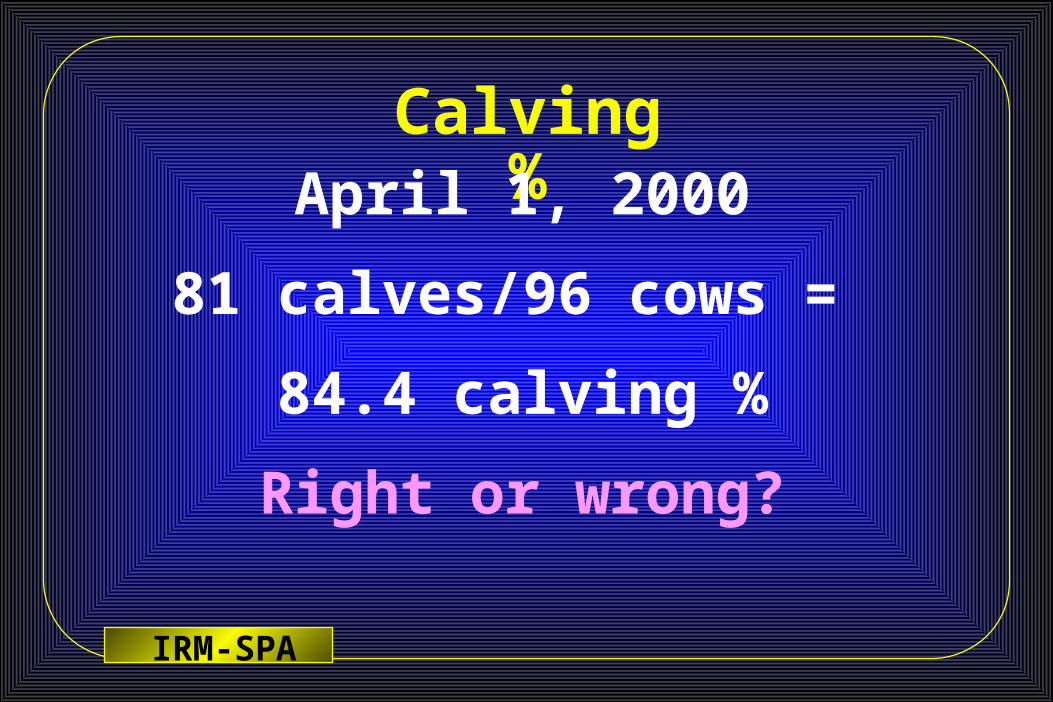
Calving %April 1, 2000
81 calves/96 cows =
84.4 calving %
Right or wrong?

IRM-SPA
Calving %
How many females were exposed at breeding?
96 cows now, culled 8 since breeding, one died...

IRM-SPA
What We Are LearningFrom SPA Data
What We Are LearningFrom SPA Data
Production is important...Marketing is important...
Managing production costs is critical!
Production is important...Marketing is important...
Managing production costs is critical!

Production Performance
87 83
4
0102030405060708090
100
Calving % Weaning % Death Loss %
TX, NM, OK
%
1991-98
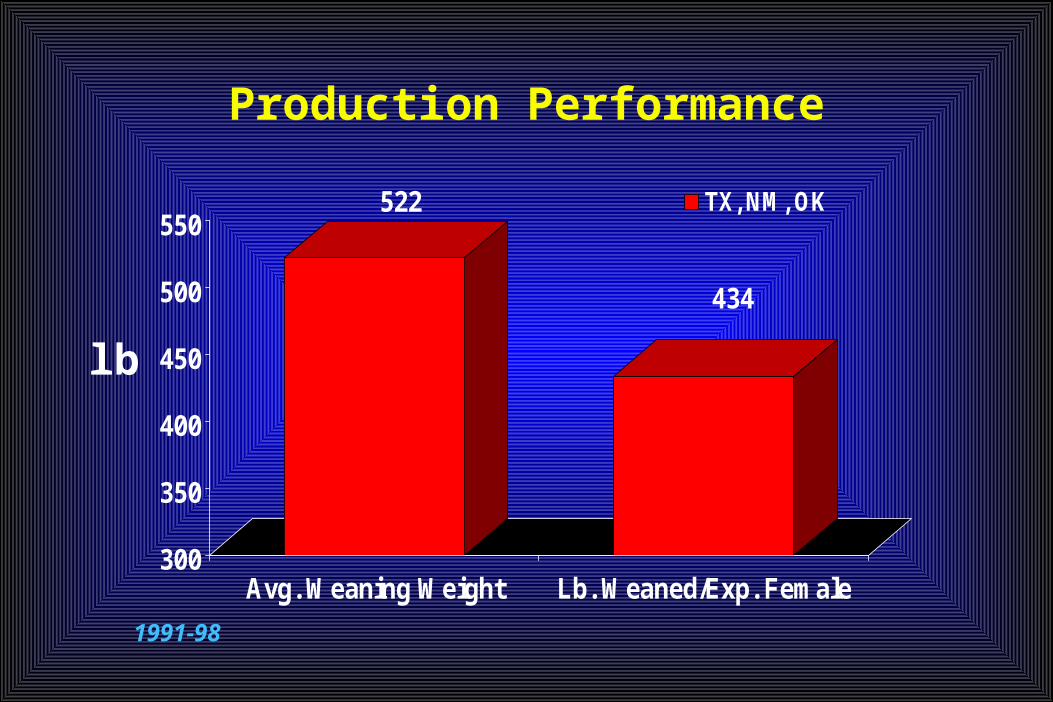
Production Performance
522
434
300
350
400
450
500
550
Avg. Weaning Weight Lb. Weaned/Exp. Female
TX, NM, OK
lb
1991-98

IRM-SPA
What are the differences between the most and least profitable herds?
1991-98
TX, NM, OK
291 herds

SPA Statistics
Weaning Percent
85 8581 82
0
30
60
90
Top 25% 2nd 25% 3rd 25% Low 25%
Income Quartile
Per
cent

SPA Statistics
Average Weaning Weight
539 528 523 500
0
100
200
300
400
500
600
Top 25% 2nd 25% 3rd 25% Low 25%
Income Quartile
Lb.

SPA Statistics
Pounds Weaned Per Exposed Cow
456 442 426 413
0
100
200
300
400
500
Top 25% 2nd 25% 3rd 25% Low 25%
Income Quartile
Lb.

SPA Statistics
Cost of Production Per Cow
$308 $357 $384$500
$0$100$200$300$400$500
Top 25% 2nd 25% 3rd 25% Low 25%
Income Quartile
Dol
lars

SPA Statistics
Grazing & Feed Cost Per Cow
$136$160 $166
$202
$0
$50
$100
$150
$200
$250
Top 25% 2nd 25% 3rd 25% Low 25%
Income Quartile
Dolla
rs

SPA Statistics
Net Income ($/Cow)
$140
$38
($30)
($181)-$200
-$100
$0
$100
$200
Income Quartile
Dol
lars
Top 25% 2nd 25% 3rd 25% Low 25%

SPA Statistics
ROA Market Value (%)
7.56
2.50
-0.43
-5.26-10
-5
0
5
10
Income Quartile
Per
cent
Top 25% 2nd 25% 3rd 25% Low 25%

IRM-SPA
What are the differences in production and financial statistics for small vs. large herds?

SPA Statistics
Pounds Weaned Per Exposed Cowby Herd Size
431 416 426 450 448 441 428 434
0
100
200
300
400
500
1-49 50-99 100-199 200-299 300-499 500-999 1000+ Average
Number of Head
Lb
.
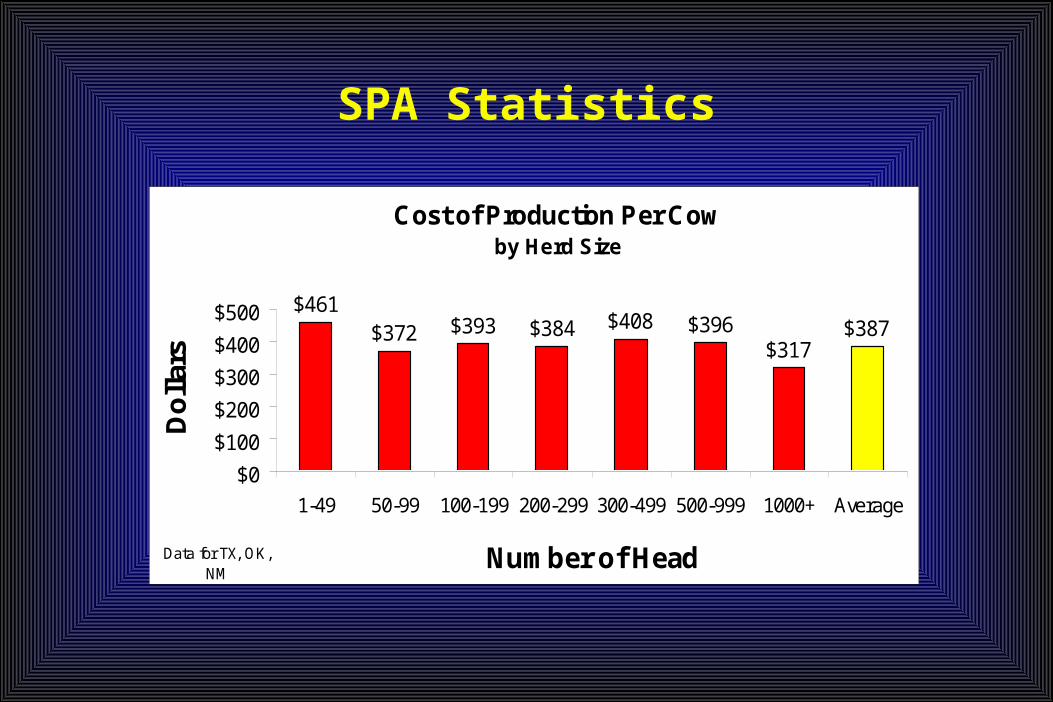
SPA Statistics
Cost of Production Per Cow by Herd Size
$461$372 $393 $384 $408 $396
$317$387
$0
$100
$200
$300
$400
$500
1-49 50-99 100-199 200-299 300-499 500-999 1000+ Average
Number of Head
Do
llars
Data for TX, OK, NM

SPA Statistics
Grazing & Feed Cost Per Cow by Herd Size
$226$197 $190
$144 $145 $133 $127$166
$0
$50
$100
$150
$200
$250
1-49 50-99 100-199 200-299 300-499 500-999 1000+ Average
Number of Head
Do
llars
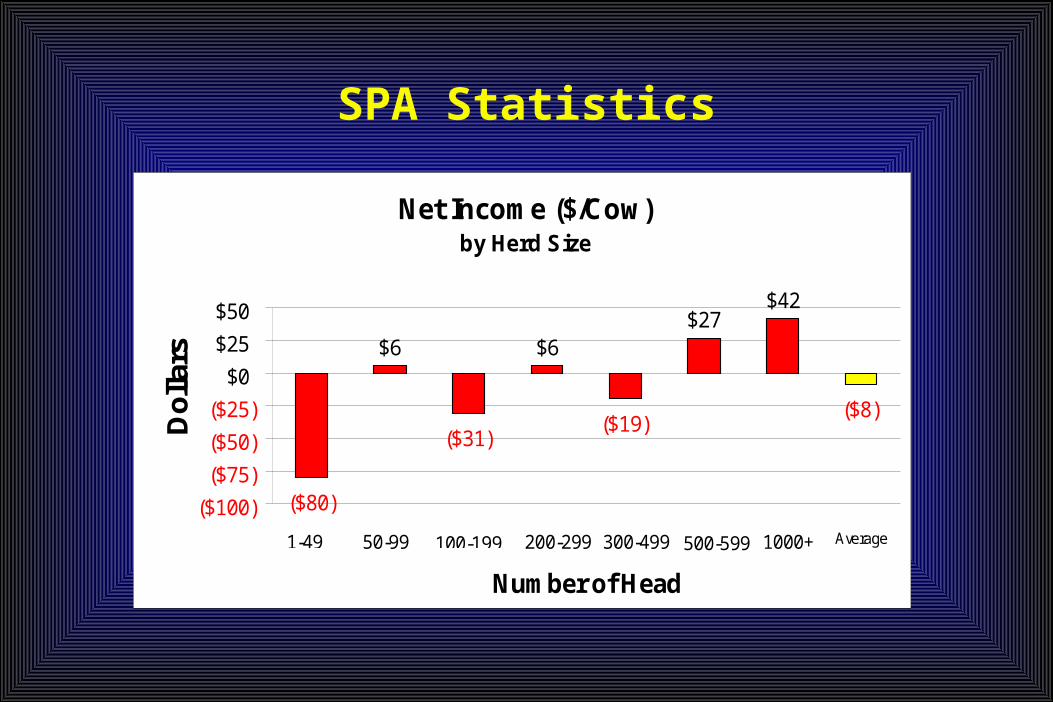
SPA Statistics
Net Income ($/Cow)by Herd Size
($80)
($31)($19)
($8)
$6$6$27
$42
($100)
($75)
($50)
($25)
$0
$25
$50
Number of Head
Do
llars
1-49 50-99 100-199 300-499 500-599 1000+ Average200-299

IRM-SPA
What We Are LearningFrom SPA Data
What We Are LearningFrom SPA Data
Production is important...Marketing is important...
Managing production costs is critical!
Production is important...Marketing is important...
Managing production costs is critical!

IRM-SPA
To be continued..… with your assistance!

IRM-SPA
Projections for one or more years lead
to better management decisions.
Control Implementation
Planning