covington county, mississippi · covington county, mississippi and incorporated areas 1.0...
TRANSCRIPT

COVINGTON COUNTY, MISSISSIPPI AND INCORPORATED AREAS
COMMUNITY NAME COMMUNITY NUMBER COLLINS, CITY OF 280047
COVINGTON COUNTY (UNINCORPORATED AREAS)
280291
MOUNT OLIVE, TOWN OF 280048
SEMINARY, VILLAGE OF 280049
EFFECTIVE:
Federal Emergency Management AgencyFLOOD INSURANCE STUDY NUMBER
28031CV000A
COVINGTON COUNTY

NOTICE TO FLOOD INSURANCE STUDY USERS
Communities participating in the National Flood Insurance Program (NFIP) have established repositories of flood hazard data for floodplain management and flood insurance purposes. This Flood Insurance Study (FIS) may not contain all data available within the repository. It is advisable to contact the community repository for any additional data. Part or all of this FIS may be revised and republished at any time. In addition, part of this FIS may be revised by the Letter of Map Revision process, which does not involve republication or redistribution of the FIS. It is, therefore, the responsibility of the user to consult with community officials and to check the community repository to obtain the most current FIS components. Initial Countywide FIS Effective Date: Revised Countywide FIS Dates:

i
TABLE OF CONTENTS
Page
1.0 INTRODUCTION 1
1.1 Purpose of Study 1
1.2 Authority and Acknowledgments 1
1.3 Coordination 2
2.0 AREA STUDIED 3
2.1 Scope of Study 3 2.2 Community Description 4 2.3 Principal Flood Problems 4 2.4 Flood Protection Measures 4
3.0 ENGINEERING METHODS 4
3.1 Hydrologic Analyses 4 3.2 Hydraulic Analyses 6 3.3 Vertical Datum 9
4.0 FLOODPLAIN MANAGEMENT APPLICATIONS 9
4.1 Floodplain Boundaries 10 4.2 Floodways 10
5.0 INSURANCE APPLICATIONS 10
6.0 FLOOD INSURANCE RATE MAP 12
7.0 OTHER STUDIES 14
8.0 LOCATION OF DATA 14
9.0 BIBLIOGRAPHY AND REFERENCES 14

ii
TABLE OF CONTENTS - continued
TABLES Table 1 - Summary of Discharges 6 Table 2 - Community Map History 13 EXHIBITS Exhibit 1 - Flood Profiles
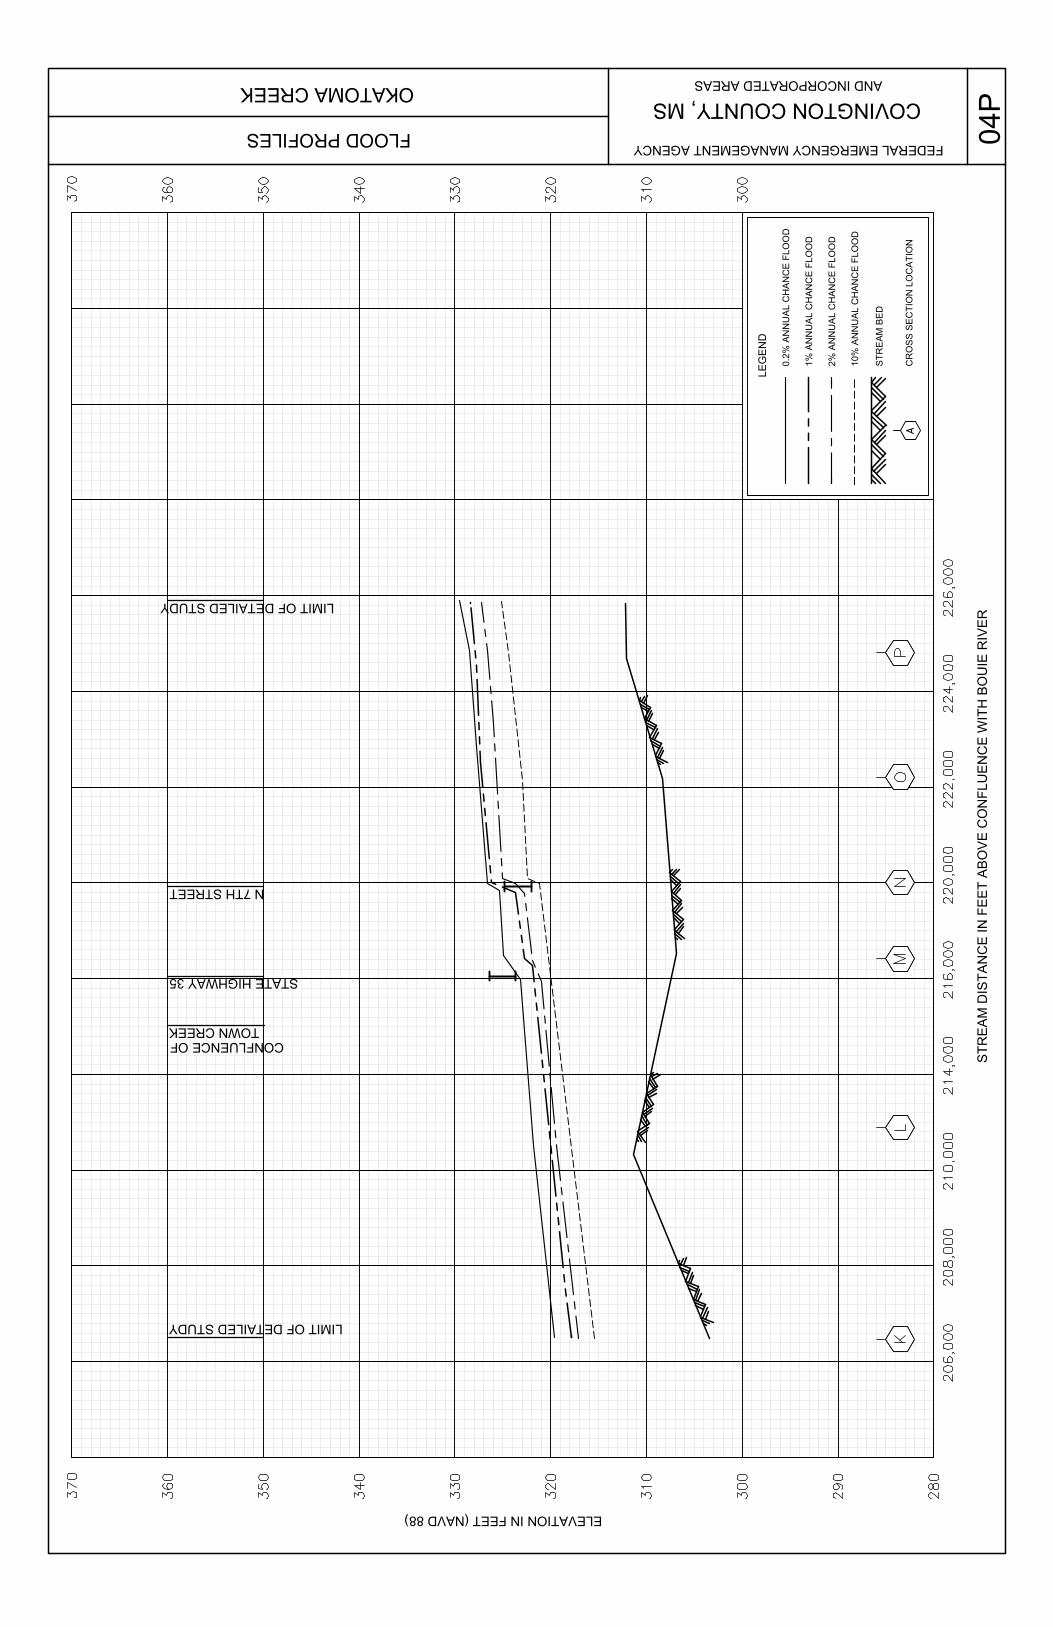
Okatoma Creek Panel 01P-04P Town Creek Panel 05P Town Creek Tributary Panel 06P
Exhibit 2 - Flood Insurance Rate Map Index
Flood Insurance Rate Map
Page

FLOOD INSURANCE STUDY COVINGTON COUNTY, MISSISSIPPI AND INCORPORATED AREAS 1.0 INTRODUCTION
1.1 Purpose of Study
This Flood Insurance Study (FIS) revises and supersedes the FIS reports and/or Flood Insurance Rate Maps (FIRMs) in the geographic area of Covington County, Mississippi, including the City of Collins, the Town of Mount Olive, the Village of Seminary, and unincorporated areas of Covington County (hereinafter referred to collectively as Covington County). This FIS aids in the administration of the National Flood Insurance Act of 1968 and the Flood Disaster Protection Act of 1973. This study has developed flood risk data for various areas of the community that will be used to establish actuarial flood insurance rates. This information will also be used by Covington County to update existing floodplain regulations as part of the Regular Phase of the National Flood Insurance Program (NFIP), and by local and regional planners to further promote sound land use and floodplain development. Minimum floodplain management requirements for participation in the NFIP are set forth in the Code of Federal Regulations at 44 CFR, 60.3. In some States or communities, floodplain management criteria or regulations may exist that are more restrictive or comprehensive than the minimum Federal requirements. In such cases, the more restrictive criteria take precedence and the State (or other jurisdictional agency) will be able to explain them.
1.2 Authority and Acknowledgments
The sources of authority for this FIS report are the National Flood Insurance Act of 1968 and the Flood Disaster Protection Act of 1973. December 15, 1990, Covington County (Unincorporated Areas) FIS The hydrologic and hydraulic analyses for this study were performed by the U.S. Army Corps of Engineers, Mobile District (the study contractor) for the Federal Emergency Management Agency (FEMA) under Inter-Agency Agreement No. EMW-87-E-2509, Project Order No. 2. This study was completed in February 1988. Additional information for Town Creek, Town Creek Tributary, and Okatoma Creek near the Town of Mount Olive was obtained form the Flood Insurance Study for the Town of Mount Olive. September 15, 1989, Town of Mount Olive FIS The hydrologic and hydraulic analyses for this study were performed by Neel-Schaffer, Inc., (the Study Contractor) for the Federal Emergency Management Agency (FEMA), under Contract No. EMW-86-C-2246. This study was completed in March 1987.

This Countywide FIS The hydrologic and hydraulic analyses for this countywide FIS were performed by the State of Mississippi for FEMA, under Contract No. EMA-2006-CA-5617. This study was completed in January 2009. The digital base map information files were provided by the U.S. Army Corps of Engineers—Vicksburg District, 4155 East Clay Street, Vicksburg, MS 39183, phone number (601) 631-5053. The digital orthophotography was acquired in March 2006, with the imagery processed to a 2-foot pixel resolution. The digital FIRM was produced using the Mississippi State Plane Coordinate System, East Zone, FIPSZONE 2301. The horizontal datum was the North American Datum of 1983, GRS 80 spheroid. Distance units were measured in U.S. feet.
1.3 Coordination
An initial Consultation Coordination Officer's (CCO) meeting is held with representatives from FEMA, the community, and the study contractor to explain the nature and purpose of a FIS, and to identify the streams to be studied by detailed methods. A final CCO meeting is held with representatives from FEMA, the community, and the study contractor to review the results of the study. December 15, 1990, Covington County (Unincorporated Areas) FIS On September 16, 1986, an initial coordination meeting was held with representatives of FEMA, Covington County, and the study contractor. Coordination has been accomplished with local officials and Federal, State, and regional agencies to secure available data. On January 26, 1990, the results of this Flood Insurance Study were reviewed and accepted at a final coordination meeting attended by representatives of the study contractor, FEMA, and the community. September 15, 1989, Town of Mount Olive FIS On October 19, 1988, the results of this Flood Insurance Study were reviewed and accepted at a final coordination meeting attended by representatives of the Study Contractor, FEMA, and the community. This Countywide Study For this countywide FIS, the Project Scoping Meeting was held on December 5, 2006 in Collins, MS. Attendees for these meetings included representatives from the Mississippi Department of Environmental Quality, Mississippi Emergency Management Agency, FEMA National Service Provider, Covington County, the City of Collins, Pat Harrison Waterway District, the State, and the Study Contractor. Coordination with county officials and Federal, State, and regional agencies produced a variety of information pertaining to floodplain regulations, available community maps, flood history, and other hydrologic data. All problems raised in the meetings have been addressed.
2

2.0 AREA STUDIED 2.1 Scope of Study
This FIS covers the geographic area of Covington County, Mississippi, and its incorporated communities listed in Section 1.1 Several flooding sources within the county were studied by approximate methods. Approximate analyses are used to study those areas having a low development potential or minimal flood hazards. The scope and methods of study were proposed to, and agreed upon, by FEMA and the State of Mississippi. December 15, 1990, Covington County (Unincorporated Areas) FIS This Flood Insurance Study covers the unincorporated areas of Covington County, MS. The incorporated areas within the county were excluded from this study. Flooding caused by overflow of Town Creek, Town Creek Tributary, and Okatoma Creek was studied in detail. Areas having low development potential or minimal flood hazards were previously studied using approximate analyses. The results were shown on the Flood Hazard Boundary Map for Covington County, MS (U.S. Housing and Urban Development, 1978) and are incorporated into this Flood Insurance Study. The areas studied were selected with priority given to all known flood hazard areas and areas of projected development or proposed construction through April 1993. The scope and methods of study were proposed to and agreed upon by FEMA and Covington County. September 15, 1989, Town of Mount Olive FIS
Flooding caused by overflow of Town Creek, Town Creek Tributary, and Okatoma Creek was studied in detail. Areas having low development potential or minimal flood hazards were studied using approximate analyses. The areas studied were selected with priority given to all known flood hazard areas and areas of projected development or proposed construction through March 1992. The scope and methods of study were proposed to and agreed upon by FEMA and the Town of Mount Olive. This Countywide Study For this countywide FIS, several flooding sources within the county were studied by approximate methods. Approximate analyses are used to study those areas having a low developmental potential or minimal flood hazards. The scope and methods of study were proposed to, and agreed upon, by FEMA and the State of Mississippi. Floodplain boundaries of stream that have been previously studied by detailed methods were redelineated based on best available topographic information.
3

2.2 Community Description Located in southeastern Mississippi, Covington County is bordered on the east by Jones County, MS; on the south by Forrest County, MS; on the west by Jefferson Davis County, MS; and on the north by Simpson and Smith Counties, MS. The county is served by the Canadian National Railroad, U.S. Highways 49 and 84, and State Highways 35, 37, 532, 535, 588, 590, and 598. The estimated 2007 population for Covington County is 20,361 (U.S. Census Bureau, 2008). The climate of Covington County is mild, with an average low of 46.4 oF in January to an average high of 80.7 oF in July. The average yearly precipitation is 59.6 inches.
2.3 Principal Flood Problems Significant flooding occurs in the low-lying areas along Okatoma Creek and its tributaries. Major floods have occurred in 1943, 1961, 1974, 1980, and 1983 (USGS, no date). The most severe flooding results from overflow of Okatoma Creek, generally during early spring, as a result of heavy rainfall from large frontal systems. The higher elevated land drained by Town Creek and Town Creek Tributary is generally subject to flash floods during periods of intense, short-duration rainfall.
2.4 Flood Protection Measures
There are no flood protection measures on the studied streams within Covington County.
3.0 ENGINEERING METHODS For the flooding sources studied by detailed methods in the communities, standard hydrologic and hydraulic study methods were used to determine the flood hazard data required for this study. Flood events of a magnitude that are expected to be equaled or exceeded once on the average during any 10-, 50-, 100-, or 500-year period (recurrence interval) have been selected as having special significance for floodplain management and for flood insurance rates. These events, commonly termed the 10-, 50-, 100-, and 500-year floods, have a 10-, 2-, 1-, and 0.2-percent chance, respectively, of being equaled or exceeded during any year. Although the recurrence interval represents the long-term, average period between floods of a specific magnitude, rare floods could occur at short intervals or even within the same year. The risk of experiencing a rare flood increases when periods greater than 1 year are considered. For example, the risk of having a flood that equals or exceeds the 1-percent-annual-chance flood in any 50-year period is approximately 40 percent (4 in 10); for any 90-year period, the risk increases to approximately 60 percent (6 in 10). The analyses reported herein reflect flooding potentials based on conditions existing in the community at the time of completion of this study. Maps and flood elevations will be amended periodically to reflect future changes.
3.1 Hydrologic Analyses
Hydrologic analyses were carried out to establish peak discharge-frequency relationships for each flooding source studied by detailed methods affecting the community.
4

December 15, 1990, Covington County (Unincorporated Areas) FIS Analyses Peak discharge-frequency relationships were computed for Okatoma Creek using USGS procedures (USGS, 1976). The discharges were initially computed using regional equations and the results were then compared to the hydrologically similar and adjacent Bouie Creek basin. The comparison was accomplished by using data from the gage on Bouie Creek located about 1 mile upstream from the confluence of Okatoma Creek at U.S. Highway 49. The gage has 47 years of systematic record and a historical period of 86 years. This discharge-frequency for the gage site was computed from the gage data using the HEC WRC computer program (USACE, 1982). The Bouie Creek basin above the gage site is very similar in size and shape to the Okatoma Creek basin in the study area, but the discharge-frequency values from regional equations were determined to be too low for the large, less frequent floods in the Okatoma Creek study area. The use of the USGS equation for transferring discharge-frequency upstream or downstream from a gage site (USGS, 1976) is restricted to points on the same stream with the gaging station. However, because of the similarity of the two basins and the proximity of the gage to the stream, the USGS equation was used. This methodology produced a more reasonable comparison with major flood peaks observed at the gage. The discharge-frequency obtained by transferring the Bouie Creek discharge-frequency to the study reach was therefore selected for use in the study. Peak discharge-frequency relationships computed for Town Creek, Town Creek Tributary, and Okatoma Creek near the Town of Mount Olive were done using USGS regression equations developed for ungaged sites (USGS, 1976). The peak discharge for the 0.2-percent chance annual flood was determined by developing a flood frequency curve from regression equations and extending the log plot to a flood of 0.2-percent probability. September 15, 1989, Town of Mount Olive FIS Analyses Hydrologic analyses were carried out to establish the peak discharge-frequency relationships for floods of the selected recurrence intervals for each stream segment studied in detail in the community. Flood frequency estimates of peak discharges were computed using regression equations developed by the U.S. Geological Survey (USGS) for ungaged sites (USGS, 1976). The peak discharge for the 0.2 percent annual chance flood was determined by developing a flood frequency curve from regression equations and extending the log plot to a flood having a 0.2-percent probability. This Countywide FIS Analysis Hydrologic analyses were carried out to establish peak discharge-frequency relationships for each flooding source studied by limited detail methods affecting the communities. Peak discharges were calculated based on USGS regional regression equations (U.S. Department of the Interior, 1991). For the discharges calculated based on regional
5

regression equations, the rural regression values were modified to reflect stream gage weighting and/or urbanization as necessary. A summary of the drainage area-peak discharge relationships for all the streams is shown in Table 1, “Summary of Discharges.”
TABLE 1. SUMMARY OF DISCHARGES
PEAK DISCHARGES (cfs) FLOODING SOURCE AND LOCATION
DRAINAGE AREA (sq. mi.) 10-percent 2-percent 1-percent 0.2-percent
OKATOMA CREEK At mouth 283 16,600 35,900 48,400 92,100 Approximately 1.36 miles above mouth 282 16,500 35,800 48,300 91,900 Just upstream of confluence of Shelton Creek 269 16,100 34,800 46,900 89,300 At State Highway 598 257 15,600 33,900 45,700 86,900 Just downstream of confluence of Curry Creek 249 15,300 33,300 44,800 85,300 Just upstream of confluence of Curry Creek 229 14,600 31,600 42,600 81,100 At State Highway 35 110 10,500 17,300 20,700 28,600 TOWN CREEK At mouth 5.9 1,950 3,040 3,510 4,600 TOWN CREEK TRIBUTARY At mouth 4.6 1,400 2,150 2,450 3,100
3.2 Hydraulic Analyses
Analyses of the hydraulic characteristics of flooding from the sources studied were carried out to provide estimates of the elevations of floods of the selected recurrence intervals. Users should be aware that flood elevations shown on the FIRM represent rounded whole-foot elevations and may not exactly reflect the elevations shown on the Flood Profiles or in the Floodway Data table in the FIS report. Flood elevations shown on the FIRM are primarily intended for flood insurance rating purposes. For construction and/or floodplain management purposes, users are cautioned to use the flood elevation data presented in this FIS report in conjunction with the data shown on the FIRM. December 15, 1990, Covington County (Unincorporated Areas) FIS Analyses Analyses of the hydraulic characteristics of flooding from the sources studied were carried out to provide estimates of the elevations of floods of the selected recurrence intervals. Cross-section data used in the study was obtained from field surveys. Structural geometry and elevation data for bridges were obtained from field surveys.
6

Locations of selected cross sections used in the hydraulic analyses are shown on the Flood Profiles and on the Flood Insurance Rate Map. For Okatoma Creek, the profiles of the selected recurrence interval floods were computed with standard step-backwater models using the HEC-2 computer program (USACE, 1982). Starting water-surface elevations were computed by the slope area method. A channel roughness coefficient (Manning’s “n”) of 0.04 was used in the model. Overbank roughness values ranged form 0.15 to 0.24. For Town Creek, Town Creek Tributary, and Okatoma Creek near the Town of Mount Olive, the IBM-PC-XT version of the HEC-2 computer model was used (USACE, 1985). Roughness coefficients for the computations were estimated on the basis of field inspection, ranged from 0.04 to 0.07 in the channel and from 0.08 to 0.18 for the overbank areas. Flood profiles were drawn showing the computed water-surface elevations for floods of the selected recurrence intervals. In cases where the 2- and 1-percent annual chance flood elevations are close together, due to limitations of the profile scale, only the 1-percent annual chance profile has been shown. The hydraulic analyses for this study are based on the effects of unobstructed flow. The flood elevations shown on the profiles are thus considered valid only if hydraulic structures remain unobstructed, operate properly, and do not fail. September 15, 1989, Town of Mount Olive FIS Analyses Analyses of the hydraulic characteristics of flooding from the sources studied were carried out to provide estimates of the elevations of floods of the selected recurrence intervals Cross-section data fro the streams in the study area were obtained by field survey. All roads and bridges were field surveyed to obtain elevation data and structural geometry. Locations of selected cross sections used in the hydraulic analyses are shown on the flood profiles. The water-surface elevations were developed using the HEC-2 step-backwater computer model (USACE, 1984). Roughness coefficients (Manning’s “n”) for the computations were estimated on the basis of field inspection. The roughness coefficients ranged from 0.04 to 0.07 in the channel and from 0.08 to 0.18 for the overbank areas. Flood profiles were drawn showing the computed water-surface elevations for floods of the selected recurrence intervals. In cases where the 2- and 1-percent annual chance flood elevations are close together, due to limitations of the profile scale, only the 1-percent annual chance profile has been shown. The hydraulic analyses for this study are based on the effects of unobstructed flow. The flood elevations shown on the profiles are thus considered valid only if hydraulic structures remain unobstructed, operate properly, and do not fail.
7

This Countywide FIS Analysis Cross section geometries were obtained from a combination of terrain data and field surveys. Bridges and culverts located within the limited detailed study limits were field surveyed to obtain elevation data and structural geometry. Downstream boundary conditions for the hydraulic models were set to normal depth using a starting slope calculated from values taken from topographic data, or where applicable, derived from the water-surface elevations. Water-surface profiles were computed through the use of the USACE HEC-RAS version 3.1.3 computer program (USACE, 2003). The model was run for the 1-percent annual chance storm for the limited detail and approximate studies. The hydraulic analyses for this countywide FIS were based on unobstructed flow. The flood elevations shown on the Flood Profiles (Exhibit 1) are thus considered valid only if hydraulic structures remain unobstructed, operate properly, and do not fail. Qualifying bench marks within a given jurisdiction that are cataloged by the National Geodetic Survey (NGS) and entered into the National Spatial Reference System (NSRS) as First or Second Order Vertical and have a vertical stability classification of A, B, or C are shown and labeled on the FIRM with their 6-character NSRS Permanent Identifier. Benchmarks cataloged by the NGS and entered into the NSRS vary widely in vertical stability classification. NSRS vertical stability classifications are as follows:
Stability A: Monuments of the most reliable nature, expected to hold position/elevation well (e.g., mounted in bedrock)
Stability B: Monuments which generally hold their position/elevation well (e.g., concrete bridge abutment)
Stability C: Monuments which may be affected by surface ground movements (e.g., concrete monuments below frost line)
Stability D: Mark of questionable or unknown vertical stability (e.g., concrete monument above frost line, or steel witness post)
In addition to NSRS benchmarks, the FIRM may also show vertical control monument established by a local jurisdiction; these monuments will be shown on the FIRM with the appropriate designations. Local monuments will only be placed on the FIRM if the community has requested that they be included, and if the monuments meet the aforementioned NSRS inclusion criteria. To obtain current elevation, description, and/or location information for benchmarks shown on the FIRM for this jurisdiction, please contact the Information Services Branch of the NGS at (301) 713-3242, or visit its website at http://www.ngs.noaa.gov. Temporary vertical monuments are often established during the preparation of a flood hazard analysis for the purpose of establishing local vertical control. Although these monuments are not shown on the FIRM, they may be found in the Technical Support Data Notebook associated with the FIS report and FIRM. Interested individuals may contact FEMA to access this data.
8

3.3 Vertical Datum All FIS reports and FIRMs are referenced to a specific vertical datum. The vertical datum provides a starting point against which flood, ground, and structure elevations can be referenced and compared. Until recently, the standard vertical datum in use for newly created or revised FIS reports and FIRMs was the National Geodetic Vertical Datum of 1929 (NGVD29). With the finalization of the North American Vertical Datum of 1988 (NAVD88), many FIS reports and FIRMs are being prepared using NAVD88 as the referenced vertical datum. All flood elevations shown in this FIS report and on the FIRM are referenced to NAVD88. Structure and ground elevations in the community must, therefore, be referenced to NAVD88. It is important to note that adjacent communities may be referenced to NGVD29. This may result in differences in Base Flood Elevations (BFEs) across the corporate limits between the communities. The elevations shown in the FIS report and on the FIRM for Covington County are referenced to NAVD88.
Ground, structure, and flood elevations may be compared and/or referenced to NGVD29 by applying a conversion factor. To convert elevations from NAVD88 to NGVD29, add 0.02 feet to the NAVD88 elevation. The 0.02 feet value is an average for the entire county. The adjustment value was determined using the USACE Corpscon 6.0.1 computer program (USACE, 2004) and topographic maps (U.S. Department of the Interior, 1965). The BFE’s shown on the FIRM represent whole-foot rounded values. For example, a BFE of 12.4 feet will appear as 12 feet on the FIRM, and 12.6 feet as 13 feet. Users who wish to convert the elevations in this FIS report to NGVD29 should apply the stated conversion factor to elevations shown on the Flood Profiles and supporting data tables in the FIS report, which are shown at a minimum to the nearest 0.1-foot. For more information regarding conversion between the NGVD and the NAVD, see the FEMA publication entitled Converting the National Flood Insurance Program to the North American Vertical Datum of 1988 or contact the Vertical Network Branch, National Geodetic Survey, Coast and Geodetic Survey, National Oceanic and Atmospheric Administration, Rockville, Maryland 20910 (Internet address http://www.ngs.noaa.gov).
4.0 FLOODPLAIN MANAGEMENT APPLICATIONS
The NFIP encourages State and local governments to adopt sound floodplain management programs. Therefore, each FIS provides 1-percent-annual-chance flood elevations and delineations of the 1- and 0.2-percent-annual-chance floodplain boundaries and 1-percent-annual-chance floodway to assist communities in developing floodplain management measures. This information is presented on the FIRM and in many components of the FIS report, including Flood Profiles, Floodway Data Table and Summary of Stillwater Elevations Table. Users should reference the data presented in the FIS report as well as additional information that may be available at the local map repository before making flood elevation and/or floodplain boundary determinations.
9

4.1 Floodplain Boundaries To provide a national standard without regional discrimination, the 1-percent-annual-chance flood has been adopted by FEMA as the base flood for floodplain management purposes. The 0.2-percent-annual-chance flood is employed to indicate additional areas of flood risk in the community. For each stream studied by detailed methods, the 1- and 0.2-annual-chance floodplain boundaries have been delineated using the flood elevations determined at each cross section. The 1- and 0.2-percent-annual-chance floodplain boundaries are shown on the FIRM (Exhibit 2), On this map, the 1-percent-annual-chance floodplain boundary corresponds to the boundary of the areas of special flood hazards (Zones A and AE), and the 0.2-percent-annual-chance floodplain boundary corresponds to the boundary of areas of moderate flood hazards. In cases where the 1- and 0.2-percent-annual-chance floodplain boundaries are close together, only the 1-percent-annual-chance floodplain boundary has been shown. Small areas within the floodplain boundaries may lie above the flood elevations but cannot be shown due to limitations of the map scale and/or lack of detailed topographic data. For the streams studied by limited detailed and approximate methods, only the 1-percent-annual-chance floodplain boundary is shown on the FIRM (Exhibit 2). Floodplain boundaries for these streams, as well as those streams that have been previously studied by detailed methods, were generated using USGS 10-meter Digital Elevation Models (USGS), then refined using detailed hydrographic data.
4.2 Floodways
The floodway is the channel of a stream plus any adjacent floodplain areas that must be kept free of encroachment so that the 1-percent annual-chance flood can be carried without substantial increases in flood heights. Floodways have not been shown or computed for this community. Along streams where floodways have not been computed, the community must ensure that the cumulative effect of development in the floodplain will not cause more than a 1.0-foot increase in the base flood elevations at any point within the community.
5.0 INSURANCE APPLICATIONS
For flood insurance rating purposes, flood insurance zone designations are assigned to a community based on the results of the engineering analyses. These zones are as follows:
Zone A Zone A is the flood insurance risk zone that corresponds to the 1-percent annual chance floodplains that are determined in the FIS by approximate methods. Because detailed hydraulic analyses are not performed for such areas, no base (1-percent annual chance) flood elevations (BFEs), or base flood depths are shown within this zone.
10

Zone AE Zone AE is the flood insurance risk zone that corresponds to the 1-percent annual chance floodplains that are determined in the FIS by detailed methods. In most instances, whole-foot BFEs derived from the detailed hydraulic analyses are shown at selected intervals within this zone.
Zone AH Zone AH is the flood insurance rate zone that corresponds to the areas of 1-percent annual chance shallow flooding (usually areas of ponding) where average depths are between 1 and 3 feet. Whole-foot base flood elevations derived from the detailed hydraulic analyses are shown at selected intervals within the zone. Zone AO Zone AO is the flood insurance rate zone that corresponds to the areas of 1-percent annual chance shallow flooding (usually sheet flow on sloping terrain) where the average depths are between 1 and 3 feet. Average whole-foot depths derived from the detailed hydraulic analyses are shown within the zone. Zone A99 Zone A99 is the flood insurance rate zone that corresponds to areas of the 1-percent floodplain that will be protected by a Federal flood protection system where construction has reached specified statutory milestones. No base flood elevations or depths are shown within this zone. Zone V Zone V is the flood insurance rate zone that corresponds to the 1-percent coastal floodplains that have additional hazards associated with storm waves. Because approximate hydraulic analyses are performed for such areas, no base flood elevations are shown within this zone. Zone VE Zone VE is the flood insurance rate zone that corresponds to the 1-percent coastal floodplains that have additional hazards associated with storm waves. Whole-foot base flood elevations derived from the detailed hydraulic analyses are shown at selected intervals within this zone. Zone X Zone X is the flood insurance risk zone that corresponds to areas outside the 0.2-percent annual chance floodplain, areas within the 0.2-percent annual chance floodplain, areas of 1-percent annual chance flooding where average depths are less than 1 foot, areas of 1-percent annual chance flooding where the contributing drainage area is less than 1 square mile, and areas protected from the base flood by levees. No BFEs or depths are shown within this zone. Zone D Zone D is the flood insurance rate zone that corresponds to unstudied areas where flood hazards are undetermined, but possible.
11

12
6.0 FLOOD INSURANCE RATE MAP The FIRM is designed for flood insurance and floodplain management applications. For flood insurance applications, the map designates flood insurance risk zones as described in Section 5.0 and, in the 1-percent-annual-chance floodplains that were studied by detailed methods, shows selected whole-foot BFEs or average depths. Insurance agents use the zones and BFEs in conjunction with information on structures and their contents to assign premium rates for flood insurance policies. For floodplain management applications, the map shows by tints, screens, and symbols, the 1- and 0.2-percent-annual-chance floodplains, floodways, and the locations of selected cross sections used in the hydraulic analyses and floodway computations. The countywide FIRM presents flooding information for the entire geographic area of Covington County. Previously, FIRMs were prepared for each incorporated community and the unincorporated areas of the County identified as flood-prone. This countywide FIRM also includes flood-hazard information that was presented separately on Flood Boundary and Floodway Maps (FBFMs), where applicable. Historical data relating to the maps prepared for each community, up to and including this countywide FIS are presented in Table 2, “Community Map History.”

CO
MM
UN
ITY
N
AM
E
INIT
IAL
ID
EN
TIF
ICA
TIO
N
FLO
OD
HA
ZAR
D
BO
UN
DA
RY
MA
P R
EV
ISIO
NS
DA
TE
FI
RM
E
FFE
CT
IVE
DA
TE
FI
RM
R
EV
ISIO
NS
DA
TE
C
ovin
gton
Cou
nty
Ja
nuar
y 27
, 197
8 --
D
ecem
ber 1
5, 1
990
--
(Uni
ncor
pora
ted
Are
as)
C
ity o
f Col
lins
Oct
ober
29,
197
6 --
A
ugus
t 5, 1
985
--
To
wn
of M
ount
Oliv
e A
ugus
t 1, 1
975
Dec
embe
r 8, 1
978
Sept
embe
r 15,
198
9 --
Vill
age
of S
emin
ary
Aug
ust 1
, 197
5 --
--
--
TABLE 2
FED
ER
AL
EM
ER
GE
NC
Y M
AN
AG
EM
EN
T A
GE
NC
Y
CO
VIN
GTO
N C
OU
NTY
, MS
AN
D IN
CO
RP
OR
ATE
D A
RE
AS
CO
MM
UN
ITY
MA
P H
ISTO
RY

7.0 OTHER STUDIES Information pertaining to revised and unrevised flood hazards for each jurisdiction within Covington County has been compiled into this FIS. Therefore, this FIS supersedes all previously printed FIS reports, FIRMs, and/or FBFMs for all of the incorporated and unincorporated jurisdictions within Covington County.
8.0 LOCATION OF DATA
Information concerning the pertinent data used in the preparation of this study can be obtained by contacting Federal Insurance and Mitigation Division, FEMA Region IV, Koger-Center — Rutgers Building, 3003 Chamblee Tucker Road, Atlanta, GA 30341.
9.0 BIBLIOGRAPHY AND REFERENCES
Mississippi State Climatologist (2007), Website, Starkville, Mississippi, http://www.msstate.edu/dept/GeoSciences/climate/
U.S. Army Corps of Engineers, Hydrologic Engineering Center, HEC-1 Flood Hydrograph Package, Davis, California, September 1990.
U.S. Army Corps of Engineers, Hydrologic Engineering Center, HEC-2 Water Surface Profiles Generalized Computer Program, Davis, California, 1982. U.S. Army Corps of Engineers, Hydrologic Engineering Center, Flood Flow Frequency Analysis (HEC WRC), Generalized Computer Program, Davis, California, February 1982. U.S. Army Corps of Engineers, Hydrologic Engineering Center, HEC-2 Water Surface Profiles, Computer Program 723-X6-L202A, April 1984. U.S. Army Corps of Engineers, Hydrologic Engineering Center, HEC-2 Water Surface Profiles, Generalized Computer Program, IBM-PC-XT Version, April 1985. U.S. Army Corps of Engineers, Hydrologic Engineering Center, HEC-RAS River Analysis System, User’s Manual, version 3.1.3, Davis, California, May 2003.
U.S. Army Corps of Engineers, Vicksburg District, Hydrologic Analysis of the Coldwater River Watershed, Final Report, August 1990. U.S. Army Corps of Engineers, Topographic Engineering Center, Corpscon Version 6.0.1,
Alexandria, Virginia, August 2004.
U.S. Census Bureau, Website–2007 Population Estimate, October 14, 2008. U.S. Census Bureau, Website–2008 Economic Fact Sheet, October 14, 2008. U.S. Department of Commerce, National Oceanic Atmospheric Adminstration, Monthly Normals of Temperature, Precipitation, and Heating and Cooling Degree Days, 1951-1980, Mississippi, Climatology of the United States No. 81, September 1982.
14

15
U.S. Geological Survey, Flood Frequency of Mississippi Streams, B.E. Colson and J.W. Hudson, Jackson, Mississippi, May 1976. U.S. Geological Survey, An Approach to Estimating Flood Frequency for Urban Areas in Oklahoma, July 1974. U.S. Geological Survey, District Office, Jackson, Mississippi, open files. U.S. Department of Housing and Urban Development, Federal Insurance Administration, Flood Hazard Boundary Map, Covington County, Unincorporated Areas, Mississippi, January 1978. U.S. Department of the Interior, Geological Survey, Interagency Advisory Committee on Water Data, Office of Water Data Coordination, Hydrology Subcommittee, Bulletin No. 17B, Guidelines for Determining Flood Flow Frequency, September, 1981, revised March, 1982. U.S. Department of the Interior, Geological Survey, Flood Characteristics of Mississippi Streams, Water-Resources Investigations Report 91-4037, Jackson, MS, 1991. U.S. Department of the Interior, Geological Survey, 7.5-Minute Series Topographic Maps, Scale 1:24,000, Contour interval 10 Feet: Collins, Mississippi, 1974; Hot Coffee, Mississippi, 1965; Lake Mike Conner, Mississippi, 1974; Lone Star, Mississippi, 1974; Magee South, Mississippi, 1975; Mize, Misssissippi, 1975; Sanford, Mississippi, 1965; Seminary, Mississippi, 1964; Sumrall, Mississippi, 1974; Taylorsville, Mississippi, 1975.

6,000
8,000
10,000
12,000
14,000
16,000
18,000
20,000
22,000
24,000
26,000
130
140
150
160
170
180
190
200
210
220
FEDERAL EMERGENCY MANAGEMENT AGENCY
ELEVATION IN FEET (NAVD 88)
STR
EA
M D
ISTA
NC
E IN
FE
ET
AB
OV
E C
ON
FLU
EN
CE
WIT
H B
OU
IE R
IVE
R
A
LEG
EN
D
0.2%
AN
NU
AL
CH
AN
CE
FLO
OD
1% A
NN
UA
L C
HA
NC
E F
LOO
D
STR
EA
M B
ED
CR
OS
S S
EC
TIO
N L
OC
ATI
ON
10%
AN
NU
AL
CH
AN
CE
FLO
OD
2% A
NN
UA
L C
HA
NC
E F
LOO
D
FLOOD PROFILES
AND INCORPORATED AREASOKATOMA CREEKCOVINGTON COUNTY, MS
150
160
170
180
190
200
210
220
AB
C
D
LUX ROAD
LIMIT OF DETAILED STUDY
01P

FEDERAL EMERGENCY MANAGEMENT AGENCY
ELEVATION IN FEET (NAVD 88)
A
LEG
EN
D
0.2%
AN
NU
AL
CH
AN
CE
FLO
OD
1% A
NN
UA
L C
HA
NC
E F
LOO
D
STR
EA
M B
ED
CR
OS
S S
EC
TIO
N L
OC
ATI
ON
10%
AN
NU
AL
CH
AN
CE
FLO
OD
2% A
NN
UA
L C
HA
NC
E F
LOO
D
FLOOD PROFILES
AND INCORPORATED AREAS
STATE HIGHWAY 598
OKATOMA CREEKCOVINGTON COUNTY, MS
STR
EA
M D
ISTA
NC
E IN
FE
ET
AB
OV
E C
ON
FLU
EN
CE
WIT
H B
OU
IE R
IVE
R
26,000
28,000
30,000
32,000
34,000
36,000
38,000
40,000
42,000
44,000
46,000
150
160
170
170
180
180
190
190
200
200
210
210
220
220
230
230
240
240
EF
G
H
48,000
02P

FEDERAL EMERGENCY MANAGEMENT AGENCY
ELEVATION IN FEET (NAVD 88)
FLOOD PROFILES
AND INCORPORATED AREASOKATOMA CREEKCOVINGTON COUNTY, MS
STR
EA
M D
ISTA
NC
E IN
FE
ET
AB
OV
E C
ON
FLU
EN
CE
WIT
H B
OU
IE R
IVE
R
48,000
50,000
52,000
54,000
56,000
58,000
60,000
62,000
64,000
66,000
68,000
70,000
72,000
170
160
180
170
190
180
200
190
210
210
220
220
230
230
240
240
250
250
260
260
A
LEG
EN
D
0.2%
AN
NU
AL
CH
AN
CE
FLO
OD
1% A
NN
UA
L C
HA
NC
E F
LOO
D
STR
EA
M B
ED
CR
OS
S S
EC
TIO
N L
OC
ATI
ON
10%
AN
NU
AL
CH
AN
CE
FLO
OD
2% A
NN
UA
L C
HA
NC
E F
LOO
D
IJ
LIMIT OF DETAILED STUDY
03P
FEDERAL EMERGENCY MANAGEMENT AGENCY
ELEVATION IN FEET (NAVD 88)
A
LEG
EN
D
0.2%
AN
NU
AL
CH
AN
CE
FLO
OD
1% A
NN
UA
L C
HA
NC
E F
LOO
D
STR
EA
M B
ED
CR
OS
S S
EC
TIO
N L
OC
ATI
ON
10%
AN
NU
AL
CH
AN
CE
FLO
OD
2% A
NN
UA
L C
HA
NC
E F
LOO
D
FLOOD PROFILES
AND INCORPORATED AREASOKATOMA CREEKCOVINGTON COUNTY, MS
STR
EA
M D
ISTA
NC
E IN
FE
ET
AB
OV
E C
ON
FLU
EN
CE
WIT
H B
OU
IE R
IVE
R
KL
300
310
320
330
340
350
360
370
290
280
300
310
320
330
340
350
360
370
206,000
208,000
210,000
214,000
216,000
220,000
222,000
224,000
226,000
N 7TH STREET
MN
OP
TOWN CREEK
STATE HIGHWAY 35
CONFLUENCE OF
LIMIT OF DETAILED STUDY
LIMIT OF DETAILED STUDY
04P

FEDERAL EMERGENCY MANAGEMENT AGENCY
ELEVATION IN FEET (NAVD 88)
STR
EA
M D
ISTA
NC
E IN
FE
ET
AB
OV
E C
ON
FLU
EN
CE
WIT
H O
KA
TOM
A C
RE
EK
A
LEG
EN
D
0.2%
AN
NU
AL
CH
AN
CE
FLO
OD
1% A
NN
UA
L C
HA
NC
E F
LOO
D
STR
EA
M B
ED
CR
OS
S S
EC
TIO
N L
OC
ATI
ON
10%
AN
NU
AL
CH
AN
CE
FLO
OD
2% A
NN
UA
L C
HA
NC
E F
LOO
D
FLOOD PROFILES
AND INCORPORATED AREASTOWN CREEKCOVINGTON COUNTY, MS
01,000
2,000
3,000
4,000
5,000
6,000
7,000
8,000
9,000
10,000
11,000
290
300
310
320
320
330
330
340
340
350
350
360
360
370
370
380
380
A
B
C
DE
F
CONFLUENCE WITHOKATOMA CREEK
HIGHWAY 35
RAILROAD
OLD HIGHWAY 49
COTTON STREET
FOURTH STREET
1% A
NN
UA
L C
HA
NC
E B
AC
KW
ATE
R E
FFE
CTS
FR
OM
OK
ATO
MA
CR
EE
K
LIMIT OF DETAILED STUDYTOWN CREEK TRIBUTARY
CONFLUENCE WITH
05P

01,000
2,000
3,000
4,000
5,000
6,000
7,000
8,000
9,000
10,000
11,000
12,000
290
300
310
310
320
320
330
330
340
340
350
350
360
360
370
370
380
380
STR
EA
M D
ISTA
NC
E IN
FE
ET
AB
OV
E C
ON
FLU
EN
CE
WIT
H T
OW
N C
RE
EK
TOWN CREEK TRIBUTARY
FEDERAL EMERGENCY MANAGEMENT AGENCYFLOOD PROFILES
ELEVATION IN FEET (NAVD 88)
A
LEG
EN
D
0.2
% A
NN
UA
L C
HA
NC
E F
LOO
D
1% A
NN
UA
L C
HA
NC
E F
LOO
D
STR
EA
M B
ED
CR
OS
S S
EC
TIO
N L
OC
ATI
ON
10%
AN
NU
AL
CH
AN
CE
FLO
OD
2%
AN
NU
AL
CH
AN
CE
FLO
OD
COVINGTON COUNTY, MSAND INCORPORATED AREAS
LIMIT OF DETAILED STUDY
CALHOUN ROAD
AB
C
TOWN CREEKCONFLUENCE WITH
06P