covid, trade agreements, and palm oil in latin america
TRANSCRIPT

November 2020 1
Commodity Market Intelligence Update No. 8
Commodity Market Intelligence Updates are a publication of the Good Growth Partnership’s Responsible Demand Project. Topics covered do not necessarily reflect the activities of the GGP, and content is the sole responsibility of WWF.
Supported by:
COVID, Trade Agreements, and Palm Oil in Latin America
Figure 1: 2020 Forecast Palm Oil and Soy Oil Use for BiodieselMillion Metric Tonnes and Percent Change from 2019
Figure 2: Brazil’s Soybean Exports to Top Destinations, Jan-Oct 2020Million Metric Tonnes and Percent Change from 2019
China57.6
+26%
E.U.8.2
+65%
Thailand 2.4
+87%Turkey
1.9+59%
Source: Oil World, author’s calculations. Note: Though lower than the previous year, the use of vegetable oil biodiesel remains high, consuming 24% of all palm oil and 19% of soy oil production. *Totals include 0.54 mmt soy oil and 1.71 mmt palm oil from countries not pictured.
Source: Oil World and author’s calculations. Note: 97% of Brazil’s exported soybean crop was shipped from January-October.
Pakistan1.2
+55%
Exports To Top 5 Countries 71.4 mmt
+32%
Though some countries are beginning to enter a “new normal”, the COVID-19 pandemic continues to impact food and agricultural markets in different ways. As lockdowns and reduced business activity have weakened demand for fuels, 2020 will see the world consume more than a combined 1 million tonnes less palm and soy oil for biodiesel, with declines in almost every consuming country (Figure 1).
0 10 20 30
0 10 20 300 10 20 30
0 10 20 30
Jan-Mar
Apr-Jun
Jul-Sept
18.5 mmt
23.1 mmt
26.2 mmt
Oct 2018-Sept 2019: 86 mmt (-11%)Oct 2019-Sept 2020: 91 mmt (+6%)Oct 2020-Sept 2021: 98 mmt (+8%)
Figure 3: China’s Soybean Crushing in 2020Million Metric Tonnes
80% sourced
from Brazil
Source: Oil World. Note: China’s October 2020-September 2021 soy crush forecast based on available data.
In Brazil, however, soy exports to its top five destinations rose 32% from January to October, including a 65% increase to the E.U and a 26% increase to China, where soy processing to supply the country’s animal protein industry continues to recover from African Swine Fever (Figures 2 and 3). These conditions appear to be driving the fastest expansion of soy production area in Brazil’s agricultural frontier in the past four years. This frontier includes large portions of the Amazon and Cerrado biomes, including the four-state Matopiba region and part of the state of Pará, where concerns about Brazilian deforestation and habitat conversion are greatest.
China’s soybean crushing by year
0
1
2
3
4
5
6
7
Indonesia E.U. U.S. Brazil Argentina Thailand Malaysia Singapore Colombia
Palm OilSoy Oil
Global Palm Oil for Biodiesel: 17 mmt (-5%)*Global Soy Oil for Biodiesel: 11 mmt (-2%)*Total Decline: 1.17 mmt (-4%)
-5%
-6%-1%
-23% -8%-17% -9% -12%
+5%

0
International Trade and Forest-Risk Commodities
2
Figure 4: Examples of Free Trade Agreements Relevant for Forest-Risk Commodities In Force/Under Consideration
*RCEP is a trade bloc of ASEAN members plus Australia, China, Japan, New Zealand, and Korea, and was ratified November 15th, 2020. Mercosur is a trade bloc of Brazil, Argentina, Paraguay, and Uruguay. ASEAN comprises Indonesia, Malaysia and eight other Southeast Asian countries. SACU is the Southern African Customs Union. GCC is the Gulf Cooperation Council. Source: ADB, OAS, WTO.
Mercosur-E.U.Mercosur-South KoreaMercosur-SingaporeMercosur-Canada
Indonesia-PakistanIndonesia-IndiaIndonesia-KenyaIndonesia-GCC
Figure 5: What Environmental Provisions are in Free Trade Agreements?Number of Appearances in 690 Current Agreements
FTAs can facilitate trade by lowering or eliminating tariffs on agricultural products and promoting regulatory alignment on issues like food safety, but rarely include requirements on how commodities are produced. For example, the developing E.U.-Mercosur FTA, which will expand access for Mercosur-produced agricultural products, reaffirms a commitment to the Paris Agreement but does not explicitly rule out trade in products linked to conversion of natural ecosystems. An analysis of environmental provisions in existing FTAs, though increasingly common, show a range of relevance for protecting forests and natural habitats (Figure 5).
There is growing consensus that trade rules can and should do more to address climate change, including recently proposed due diligence laws requiring importing companies to ensure the commodities they use are free of illegal deforestation. Though the COVID-19 pandemic may cause the volume of international trade to contract by 10% in 2020, new free trade agreements (FTAs) which dictate how forest-risk commodities enter global markets are under negotiation between major producing and consuming regions (Figure 4).
November 2020
Cooperation committments
Sovereignty over laws
0
20
40
60
80
100
120
140
160
Conserving forests/combatting illegal
deforestation
High
Fines for not enforcing
environmental laws
Joint environmental
monitoring
High Case Dependent
Low
Low
Legal Enforceability
160
120
80
40
ASEAN countries account for 92% of the world’s palm oil exports
Mercosur countries account for 65% of the world’s soy and 37% of its beef exports
While almost 90% of the world’s 690 FTAs contain at least one environmental provision, there are over 270 different types of environmental provisions, each with varying legal strength. Highly enforceable provisions to protect natural ecosystems are rare; more often, the most common enforceable provisions assert a country’s right to sovereignty over its environmental laws. Clear provisions addressing trade-driven habitat conversion, with credible enforcement mechanisms, could elevate FTAs as a tool for mainstreaming sustainable supply chains and fighting climate change.
Source: Design of Trade Agreements Database (DESTA) and author’s calculations.
Mercosur-IndiaMercosur-ChileMercosur-EgyptMercosur-IsraelMercosur-SACU
ASEAN Trade AreaASEAN-China RCEP (ASEAN+5)*
Indonesia-PakistanIndonesia-IndiaIndonesia-KenyaIndonesia-GCC Indonesia-E.U.

November 2020 3
Sustainable Palm Oil in Latin America
Figure 6: Latin American Palm Oil Production and Trade in 2020 Million Metric Tonnes
0 0.3 0.6 0.9 1.2 1.5 1.8
Costa Rica
Ecuador
Brazil
Honduras
Guatemala
Colombia
Exports
Domestic Consumption
Colombia
Guatemala
Honduras
Brazil
Ecuador
Costa Rica
0 0.3 0.6 0.9 1.2 1.5 1.80 0.3 0.6 0.9 1.2 1.5 1.8
Costa Rica
Ecuador
Brazil
Honduras
Guatemala
Colombia
Exports
Domestic Consumption
0 0.3 0.6 0.9 1.2 1.5 1.8
Costa Rica
Ecuador
Brazil
Honduras
Guatemala
Colombia
Exports
Domestic Consumption
E.U. 54%
Mexico23%
Other LatAm
22%
U.S.1%
Source: Oil World and author’s calculations, forecast for calendar year 2020. Smaller producing countries not included are Peru, Mexico, Nicaragua, and Panama. Other LatAm importers include Venezuela, El Salvador, Nicaragua, Brazil, and Dominican Republic.
55% (2.5 mmt) exported
6% (4.5 mmt)of global palm oil
production
45% (2 mmt) consumed
domestically
Though eclipsed by Southeast Asia, the world’s primary palm oil producing region, at least 10 Latin American countries are growing global suppliers of the commodity. Latin America’s six largest producing countries currently supply a combined 6% of the world’s palm oil, over half of which is exported and plays an important role in European and North American supply chains (Figure 6). While the growth of oil palm plantations in Latin America has generally been associated with lower levels of deforestation than Indonesia and Malaysia, data suggest about 20% of recent oil palm expansion has occurred into forests or other natural ecosystems.
Figure 7: RSPO-Certified Mills in Latin America, of which
Identity-Preserved (IP)Figure 8: Companies with Most Palm Oil Mills in Latin America
Yield (tonnes/hectare)
3.3
4.87
3.7
3.01
1.71
3.8
Despite these challenges, Latin America is a growing supplier of RSPO-certified sustainable palm oil (CSPO). The region produces over 1 million tonnes of CSPO annually from 47 RSPO-certified mills, half of which are in Colombia (Figure 7). For companies wanting to ensure full traceability to a certified supply base, nearly 70% of Latin America’s certified mills supply Identity-Preserved palm oil, a higher portion than Indonesia and Malaysia. Latin America’s top five companies in terms of mill ownership only operate five of the region’s 47 RSPO-certified mills (Figure 8), providing an opportunity for companies who source palm oil to support sustainable growth of the region’s sector by sourcing from a range of certified suppliers.
Source: Universal Mill List, RSPO, author’s calculations. Note: Others includes Mexico and Ecuador. 118 (35%) of Indonesia and Malaysia’s 337 certified mills are certified at the IP level, while 32 (68%) of Latin America’s 47 certified mills are.
Colombia, Guatemala, and Honduras, Latin America’s largest palm oil producers and exporters, have seen elevated levels of forest loss in recent years, and collectively lost 440,000 hectares of tree cover in 2019 alone. While not entirely driven by oil palm expansion, this forest loss has led to increasing recognition of the need to build a sustainable palm oil industry in Latin America, which in turn has led to sectoral zero-deforestation agreements in Colombia and Honduras. Although these agreements hold promise for addressing forest loss, the region’s non-forest ecosystems, like the vast Llanos savannah, continue to be at risk of conversion.
IDN/MYS average = 3.5
CompanyTotal Mills
(RSPO-Certified)
12 (2)
7 (1)
5 (0)
5 (0)
4 (2)
HQ
Colombia
Ecuador
Guatemala
Costa Rica
Honduras
47 RSPO-certified mills
(32 IP)
Colombia: 23 mills(15 IP)
Brazil: 5 mills(5 IP)
Guatemala: 10 mills(8 IP)
Costa Rica: 3 mills (2 IP)
Others: 3 mills (1 IP)Honduras: 3 mills
(1 IP)C.I. Biocosta
La Fabril
Grupo Hame
Grupo Numar
Grupo Jaremar
Key Company Updates
Walmart is expanding its presence in India’s burgeoning e-commerce market through a series of investments in Flipkart, an Indian e-commerce company. Walmart first acquired a 77% stake in Flipkart for $16 billion in 2018, and recently increased its stake by an additional $1.2 billion and transferred its India unit, Walmart India Pvt Ltd, to Flipkart. Though Walmart’s sustainable sourcing policies for commodities like palm oil cover Walmart India, it is unclear if they will apply to Flipkart, which may become its own publicly traded company. Walmart purchases over 100,000 tonnes of palm oil a year for its own-brand products. India is the largest importing country of palm and soy oil and imported 3 million tonnes of palm oil from Indonesia in the first half of 2020.
For more information, contact Owen Hauck at [email protected]. 4November 2020
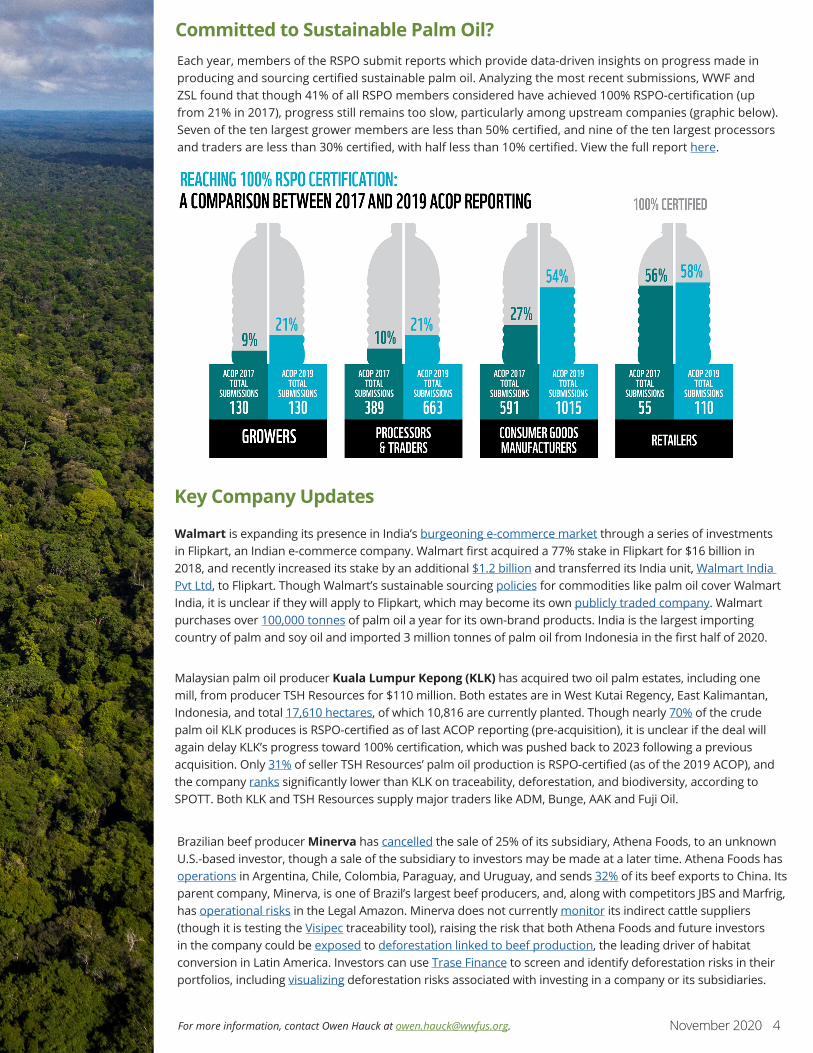
Each year, members of the RSPO submit reports which provide data-driven insights on progress made in producing and sourcing certified sustainable palm oil. Analyzing the most recent submissions, WWF and ZSL found that though 41% of all RSPO members considered have achieved 100% RSPO-certification (up from 21% in 2017), progress still remains too slow, particularly among upstream companies (graphic below). Seven of the ten largest grower members are less than 50% certified, and nine of the ten largest processors and traders are less than 30% certified, with half less than 10% certified. View the full report here.
Committed to Sustainable Palm Oil?
Brazilian beef producer Minerva has cancelled the sale of 25% of its subsidiary, Athena Foods, to an unknown U.S.-based investor, though a sale of the subsidiary to investors may be made at a later time. Athena Foods has operations in Argentina, Chile, Colombia, Paraguay, and Uruguay, and sends 32% of its beef exports to China. Its parent company, Minerva, is one of Brazil’s largest beef producers, and, along with competitors JBS and Marfrig, has operational risks in the Legal Amazon. Minerva does not currently monitor its indirect cattle suppliers (though it is testing the Visipec traceability tool), raising the risk that both Athena Foods and future investors in the company could be exposed to deforestation linked to beef production, the leading driver of habitat conversion in Latin America. Investors can use Trase Finance to screen and identify deforestation risks in their portfolios, including visualizing deforestation risks associated with investing in a company or its subsidiaries.
Malaysian palm oil producer Kuala Lumpur Kepong (KLK) has acquired two oil palm estates, including one mill, from producer TSH Resources for $110 million. Both estates are in West Kutai Regency, East Kalimantan, Indonesia, and total 17,610 hectares, of which 10,816 are currently planted. Though nearly 70% of the crude palm oil KLK produces is RSPO-certified as of last ACOP reporting (pre-acquisition), it is unclear if the deal will again delay KLK’s progress toward 100% certification, which was pushed back to 2023 following a previous acquisition. Only 31% of seller TSH Resources’ palm oil production is RSPO-certified (as of the 2019 ACOP), and the company ranks significantly lower than KLK on traceability, deforestation, and biodiversity, according to SPOTT. Both KLK and TSH Resources supply major traders like ADM, Bunge, AAK and Fuji Oil.