covid-19 vaccine effectiveness in the united states - cdc.gov
TRANSCRIPT

cdc.gov/coronavirus
COVID-19 Vaccine Effectivenessin the United States
Ruth Link-Gelles, PhD, MPHCo-Lead, Vaccine Effectiveness TeamCDC COVID-19 ResponseLCDR, US Public Health Service
ACIP MeetingSeptember 22, 2021

Monitoring vaccine effectiveness (VE) evidence by risk group, outcome, and product over time
X XOutcome Product
Desired, but often limited by sample size
By time since vaccination and/or pre-/post-Delta
Risk group
Increasing Community Access to Testing (ICATT) Partnership
Waning of immunity by Delta predominance in the general population

Nationwide community-based COVID-19 testing via pharmacies and partners Self-reported vaccine history at time of registration for COVID-19 testing; excluded
those who did not report vaccination status (18%) Design: Test-negative, case-control assessment Period: Pre-Delta: March 13–May 29 (N=255,519); Delta: July 18–August 31 (N=519,699) Population: Persons aged 20–64 years of age with COVID-like illness (CLI) and
laboratory-based nucleic acid amplification testing (NAAT) Adjusted for:
– Calendar day, race, ethnicity, gender, site’s HHS region and state, site census tract’s social vulnerability index (SVI)– Not adjusted for underlying conditions or prior infection
Increasing Community Access to Testing (ICATT) Partnership: VE analysis for symptomatic infection, March 13–August 31, 2021

Pfizer-BioNTech VE against symptomatic infection by age group and time since vaccination in pre-Delta vs Delta periods
Pre-Delta (March 13–May 29) with 95% CIs in dotted lines
Delta (July 18–August 31) with 95% CIs in dotted lines
• Significant waning of VE in both time periods
• VE is lower during Delta period at all time points
• Curves look similar across age groups

Moderna VE against symptomatic infection by age group and time since vaccination in pre-Delta and Delta periods
Pre-Delta (March 13–May 29) with 95% CIs in dotted lines
Delta (July 18–August 31) with 95% CIs in dotted lines
• Moderna VE is higher than Pfizer-BioNTech
• VE wanes during Delta• Curves look similar across age groups

Johnson & Johnson (J&J, Janssen) VE against symptomatic infection by age group and time since vaccination in pre-Delta and Delta periods
Pre-Delta (March 13–May 29) with 95% CIs in dotted lines
Delta (July 18–August 31) with 95% CIs in dotted lines
• VE increases with time in both periods• No clear Delta effect on VE• Curves look similar across age groups
Number of days from dose date Number of days from dose date
Number of days from dose date Number of days from dose date

Self-reported vaccination data, no clinical assessment– By limiting to persons with known vaccination status, a substantial proportion of records were lost, possibly
introducing bias
No information on co-morbidities, prior infection, risk behaviors Analysis based on tests, no unique identifiers to track individuals in data No genetic sequencing results
– Pre-Delta: March 13–May 29– Delta: July 18–August 31
ICATT limitations for VE against symptomatic infection

Vaccine effectiveness in individuals ≥65 years of age, including residents of long-term care facilities

*Vaccine effectiveness calculated using previously described methods: Moline et al. Effectiveness of COVID-19 Vaccines in Preventing Hospitalization Among Adults Aged ≥65 Years — COVID-NET, 13 States, February–April 2021. MMWR, August 13, 2021‡California, Colorado, Connecticut, Georgia, Maryland, Michigan, Minnesota, New Mexico, New York, Ohio, Oregon, Tennessee, and Utah are included in these analyses
COVID-19-Associated Hospitalization Surveillance Network (COVID-NET) Population-based surveillance for laboratory-
confirmed COVID-19-associated hospitalizations
Defined catchment area: >250 acute care hospitals in 99 counties in 14 states, representing 10% of U.S. population
Case definition: Resident of the surveillance area and positive SARS-CoV-2 test within 14 days prior to or during hospitalization
VE estimates: variation of screening method– Immunization information systems (ISS)– Representative sample of hospitalized cases
(>37,000 to date) – Underlying population in catchment area by
week
Represents ~10% of U.S. population (32 million people)
VE estimates adjusted for time, but cannot adjust for other important potential confounders (e.g., comorbidities, prior infection)

0%
10%
20%
30%
40%
50%
60%
70%
80%
90%
100%
April May June July August
Vacc
ine
Effe
ctiv
enes
s
18-29 years 30-49 years 50-64 years 65-74 years 75 years and up
11
COVID-NET vaccine effectiveness against hospitalization, by month and age group, mRNA vaccines
Among fully vaccinated patients, defined as receipt of both doses of Moderna or Pfizer-BioNTech vaccine, with second dose received ≥14 days before hospitalizationSource: Unpublished COVID-NET data, 2021
No significant differences in VE by age group or calendar month of hospitalization

COVID-19-associated hospitalizations among vaccinated adults ≥18 years with COVID-19 as primary reason for admission — COVID-NET, January 1–July 31, 2021
* All characteristics were significantly different on univariate analysis 12
Category Unvaccinatedweighted %
N=5,513
Fully vaccinatedweighted %
N=465Age group (median, IQR) 59 (47–71) 72 (62–80)
18–49 years 28 11
50–64 years 33 16
≥65 years 40 72
LTCF residence 5 13
DNR/DNI/CMO 6 16
Underlying medical conditions
Cardiovascular disease 34 50Neurologic disease 17 28Renal disease 16 29Immunosuppressive condition 12 29Rheumatologic or autoimmune 3 7Blood disorder 3 4
≥3 Underlying medical conditions 55 66
Fully vaccinated cases more likely to be:– Older – Long-term care
facility resident– DNR/DNI code More underlying
medical conditions

NY State linked lab, immunization, and hospitalization data to estimate VE from May 3–August 29, 2021– 147,937 new diagnoses among fully vaccinated and unvaccinated persons– 16,261 new hospitalizations among fully vaccinated and unvaccinated persons
Breakdown by vaccine:– Pfizer-BioNTech: 52%– Moderna: 39%– Johnson & Johnson/Janssen: 9%
Delta proportion: <2% (May 2–8) to >99% (August 22–28) (CDC NS3, HHS Reg. 2)
VE against infection and hospitalization: Data from NY State, May–July 2021
Update of published study: https://www.cdc.gov/mmwr/volumes/70/wr/mm7034e1.htm

VE against infection: Data from NY State, May–August 2021
Update of published study: https://www.cdc.gov/mmwr/volumes/70/wr/mm7034e1.htm
Age-adjusted VE against new COVID-19 infections declined from 92% (May 3–9) to 73% (July 12–18), when Delta reached 85%. Then, decline ceased, with plateau around 77%.

VE against hospitalization: Data from NY State, May-August 2021
Update of published study: https://www.cdc.gov/mmwr/volumes/70/wr/mm7034e1.htm
Age-adjusted VE against new COVID-19 hospitalizations remained stable at 90%–95%.

VISION Multi-State Network of Electronic Health Records for VE against hospitalization
Estimates are from over 74,000 hospitalizations across 187 hospitals
VE for adults aged ≥18 years
Cases: COVID-like illness (CLI) with positive PCR for SARS-CoV-2
Controls: CLI with negative PCR for SARS-CoV-2
VE adjusted for propensity to be vaccinated, calendar time, site-region, local virus circulation, and age– Waning VE models are matched on calendar week
and site and restricted to six of seven VISION sites
Vaccination documented by electronic health records and state and city registries
Median age of cases: 65 years (IQR 48-77)

82% 85% 82% 82% 93% 84% 86%73%
0%
20%
40%
60%
80%
100%
January toMay
June toAugust
January toMay
June toAugust
January toMay
June toAugust
January toMay
June toAugust
18-29 years 30-49 years 50-64 years 65+ years
Vacc
ine
effe
ctiv
enes
s (%
)
VISION Network: VE against hospitalization by time period and age group, Pfizer-BioNTech and Moderna
17
91% 82% 85% 99% 93% 91% 91%86%
0%
20%
40%
60%
80%
100%
Jan to May Jun to Aug Jan to May Jun to Aug Jan to May Jun to Aug Jan to May Jun to Aug
18-29 years 30-49 years 50-64 years 65+ years
Vacc
ine
effe
ctiv
enes
s (%
)
Pfizer-BioNTech
Moderna
* p<0.05
*

90%92% 90% 93% 89% 86%
78%
0%
10%
20%
30%
40%
50%
60%
70%
80%
90%
100%
14 days to <2mo
14 days to <2mo
2 to <4 mo 14 days to <2mo
2 to <4 mo 4 to <5 mo ≥5 mo
January toMarch 2021
April to May 2021 June to August 2021
Vacc
ine
effe
ctiv
enes
s (%
)VISION Network: Preliminary VE against hospitalization by time since vaccination in each calendar period, adults ≥18 years, mRNA products
*
* p<0.05 for trend

VISION Network: Preliminary VE against hospitalization by time since vaccination in each calendar period, adults ≥18 years, mRNA products
*
Among people recently vaccinated (<2 months), VE against hospitalization has remained high. VE has declined among those who have been vaccinated for longer periods of time.
90%92% 90% 93% 89% 86%
78%
0%
10%
20%
30%
40%
50%
60%
70%
80%
90%
100%
14 days to <2mo
14 days to <2mo
2 to <4 mo 14 days to <2mo
2 to <4 mo 4 to <5 mo ≥5 mo
January toMarch 2021
April to May 2021 June to August 2021
Vacc
ine
effe
ctiv
enes
s (%
)
* p<0.05 for trend

90%92% 90% 93% 89% 86%
78%
0%
10%
20%
30%
40%
50%
60%
70%
80%
90%
100%
14 days to <2mo
14 days to <2mo
2 to <4 mo 14 days to <2mo
2 to <4 mo 4 to <5 mo ≥5 mo
January toMarch 2021
April to May 2021 June to August 2021
Vacc
ine
effe
ctiv
enes
s (%
)VISION Network: Preliminary VE against hospitalization by time since vaccination in each calendar period, adults ≥18 years, mRNA products
*
Among people recently vaccinated (<2 months), VE against hospitalization has remained high. VE has declined among those who have been vaccinated for longer periods of time.
* p<0.05 for trend

68%
60%
0%
10%
20%
30%
40%
50%
60%
70%
80%
90%
100%
Pre-Delta Delta
Vacc
ine
Effe
ctiv
enes
sVISION Network: VE against hospitalization by time period and age group, Johnson & Johnson/Janssen
https://www.nejm.org/doi/full/10.1056/NEJMoa2110362 https://www.cdc.gov/mmwr/volumes/70/wr/mm7037e2.htm 21
≥18 years≥50 years

Data from National Healthcare Safety Network (NHSN) Nursing homes report weekly aggregate number of residents and cases by
vaccination status (product and number of doses received) to NHSN VE estimated for three periods:
1) Pre-Delta (March 1–May 9) 2) Intermediate (May 10–June 20)3) Delta (June 21–August 1)
VE of mRNA vaccines against infection among nursing home residents before and during widespread Delta circulation
Nanduri et al. MMWR: https://www.cdc.gov/mmwr/volumes/70/wr/mm7034e2.htm
Pre-Delta (Mar 1–May 9)
Intermediate (May 10–Jun 20)
Delta(Jun 20–Aug 1)
No. of weekly reports 17,407 33,160 85,593
No. of facilities 3,862 11,581 14,917

NHSN: VE against infection during Delta period differed significantly from pre-Delta period
Adapted from: Nanduri S. Effectiveness of Pfizer-BioNTech and Moderna Vaccines in Preventing SARS-CoV-2 Infection Among Nursing Home Residents Before and During Widespread Circulation of the SARS-CoV-2 B.1.617.2 (Delta) Variant — National Healthcare Safety Network, March 1–August 1, 2021. MMWR Morbidity and Mortality Weekly Report. 2021 2021;70. Slide courtesy of Ian Plumb.
74.7
67.5
53.1
74.2
66.5
52.4
74.770.4
50.6
0
10
20
30
40
50
60
70
80
90
100
Vacc
ine
effe
ctiv
enes
s aga
inst
infe
ctio
n
Pre-Delta Intermediate Delta Pre-Delta Intermediate Delta Pre-Delta Intermediate Delta
Pfizer-BioNTech ModernaOverall

NHSN (mRNA)
COVID-NET (mRNA)
VISION (Pfizer)
VISION (Moderna)
NYS (all products)
NYS (all products)
0%
10%
20%
30%
40%
50%
60%
70%
80%
90%
100%
Pre-Delta Delta
Vacc
ine
effe
ctiv
enes
s (%
)Magnitude of VE against infection or hospitalization by Delta predominance for adults ≥65 years of age, by study
NHSN: https://www.cdc.gov/mmwr/volumes/70/wr/mm7034e3.htmCOVID-NET: CDC unpublished VISION: CDC unpublished 24
Decline of 15–25 percentage points for point estimates against infection
Hospitalization data mixed Larger decline for Pfizer-BioNTech
(VISION) Smaller declines for combined
mRNA products and Moderna alone

Vaccine effectiveness for adults with underlying medical conditions
https://www.cdc.gov/mmwr/volumes/70/wr/mm7037e3.htm
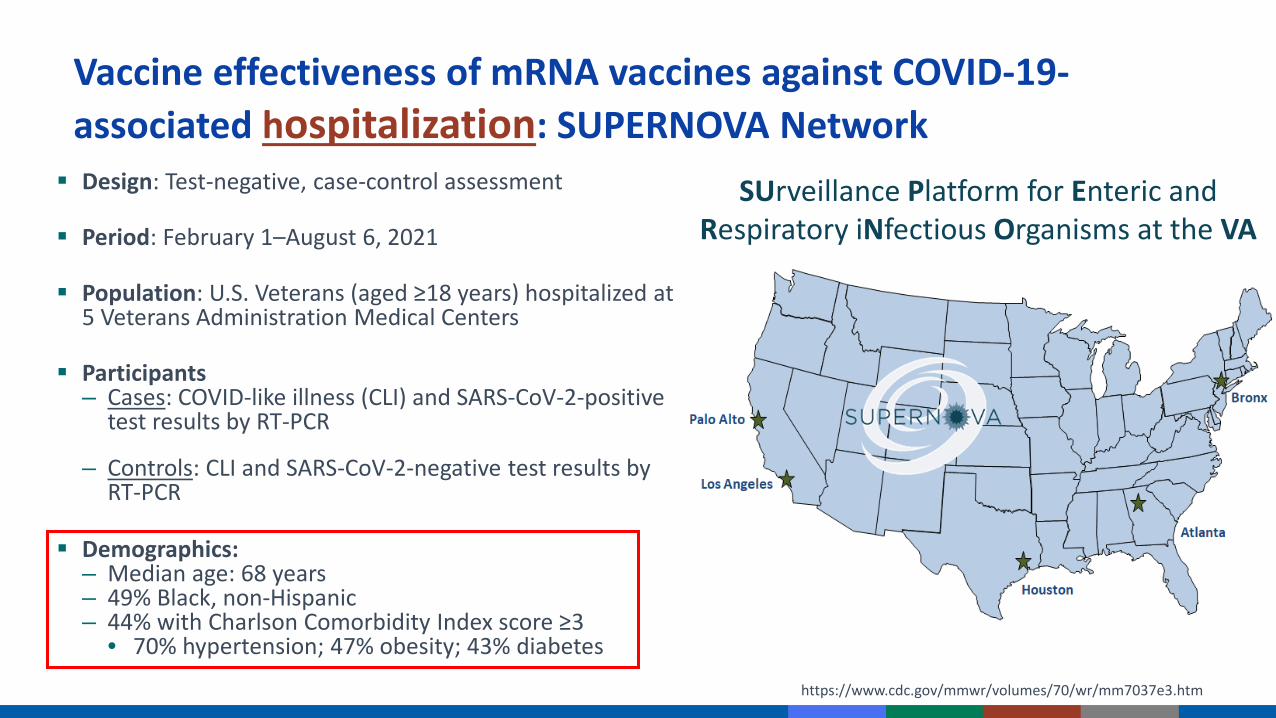
Vaccine effectiveness of mRNA vaccines against COVID-19-associated hospitalization: SUPERNOVA Network Design: Test-negative, case-control assessment
Period: February 1–August 6, 2021
Population: U.S. Veterans (aged ≥18 years) hospitalized at 5 Veterans Administration Medical Centers
Participants– Cases: COVID-like illness (CLI) and SARS-CoV-2-positive
test results by RT-PCR
– Controls: CLI and SARS-CoV-2-negative test results by RT-PCR
Demographics:– Median age: 68 years– 49% Black, non-Hispanic– 44% with Charlson Comorbidity Index score ≥3
• 70% hypertension; 47% obesity; 43% diabetes
SUrveillance Platform for Enteric and Respiratory iNfectious Organisms at the VA

SUPERNOVA: VE against COVID-19-associated hospitalization, by mRNA vaccine
https://www.cdc.gov/mmwr/volumes/70/wr/mm7037e3.htm
92%
77%
97%
87%95%
80%
0%
10%
20%
30%
40%
50%
60%
70%
80%
90%
100%
18-64 years ≥65 18-64 years ≥65 18-64 years ≥65
Vacc
ine
Effe
ctiv
enes
s (%
)
ModernaPfizer-BioNTech Combined mRNA

SUPERNOVA: mRNA VE against COVID-19-associated hospitalization, by Delta variant predominance and time since vaccination
https://www.cdc.gov/mmwr/volumes/70/wr/mm7037e3.htm 28
84%89% 86% 87%
0%
10%
20%
30%
40%
50%
60%
70%
80%
90%
100%
February 1-June 30 July 1-August 6 <90 days since full vaccination ≥90 days
Vacc
ine
Effe
ctiv
enes
s (%
)
Time since full vaccinationPre-Delta vs. Delta

Effectiveness of mRNA vaccines for preventing COVID-19 hospitalization, IVY Network
Tenforde et al. MMWR https://www.cdc.gov/mmwr/volumes/70/wr/mm7034e2.htm
Population: Adults (≥18 years) hospitalized at 21medical centers in 18 states
Case status:– Cases with COVID-19-like illness and
SARS-CoV-2 antigen / RT-PCR (+)
– Controls: SARS-CoV-2 RT-PCR (-)
SARS-CoV-2 testing within 10 days of admission, and admission within 14 days of illness onset
Analytic period: Admitted March 11–August 15, 2021

IVY Network: COVID-19 vaccine effectiveness against hospitalization by vaccine product and time since vaccination, adults ≥18 years without immunocompromising conditions
91%
77%
93% 92%
68%
0%
10%
20%
30%
40%
50%
60%
70%
80%
90%
100%
14-120 daysafter full
vaccination
>120 daysafter full
vaccination
14-120 daysafter full
vaccination
>120 daysafter full
vaccination
>28 days after fullvaccination
Vacc
ine
Effe
ctiv
enes
s
ModernaPfizer-BioNTech Janssen
* Adjusted for admission date (biweekly), HHS region, age, sex, race/ethnicity. Not enough recipients of Janssen to assess by time since vaccination.
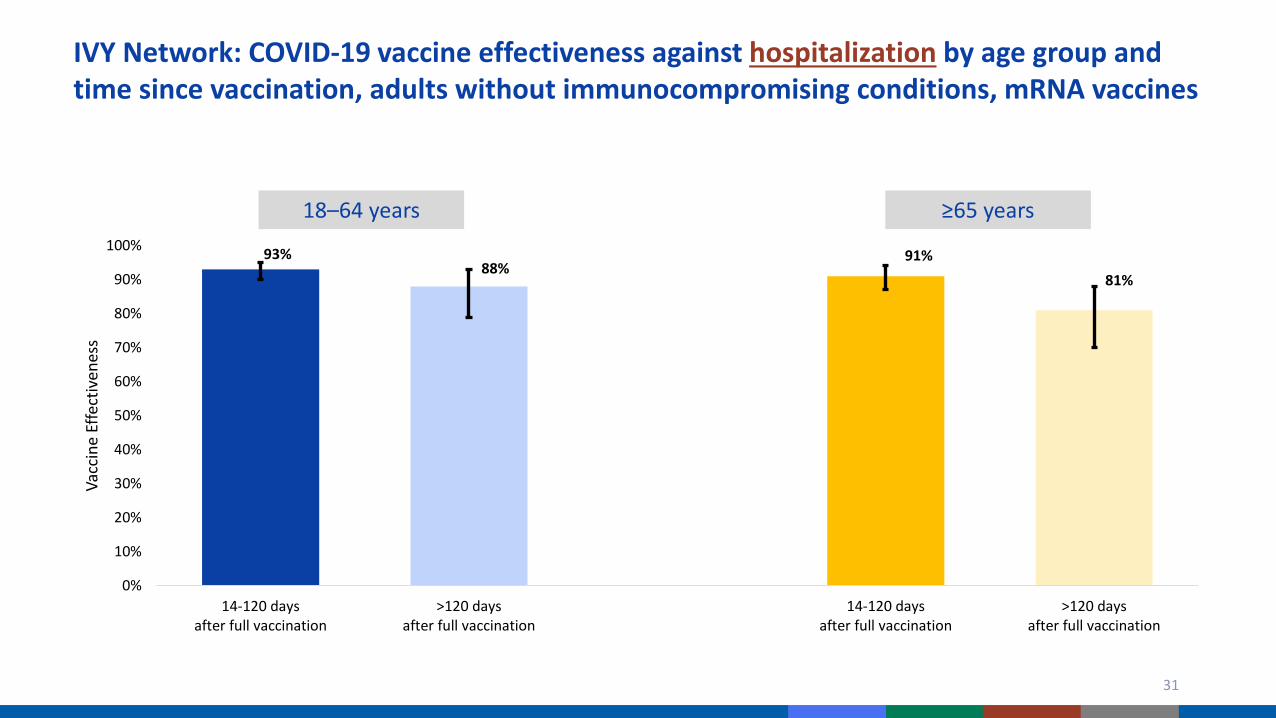
IVY Network: COVID-19 vaccine effectiveness against hospitalization by age group and time since vaccination, adults without immunocompromising conditions, mRNA vaccines
31
93%88%
91%81%
0%
10%
20%
30%
40%
50%
60%
70%
80%
90%
100%
14-120 daysafter full vaccination
>120 daysafter full vaccination
14-120 daysafter full vaccination
>120 daysafter full vaccination
Vacc
ine
Effe
ctiv
enes
s
≥65 years18–64 years

IVY Network: COVID-19 vaccine effectiveness against hospitalization by age group and Delta predominance, adults without immunocompromising conditions, mRNA vaccines
https://www.cdc.gov/mmwr/volumes/70/wr/mm7034e2.htm 32
92% 91% 91%87%
0%
10%
20%
30%
40%
50%
60%
70%
80%
90%
100%
Pre-Delta Delta Pre-Delta Delta
Vacc
ine
Effe
ctiv
enes
s
≥65 years18–64 years
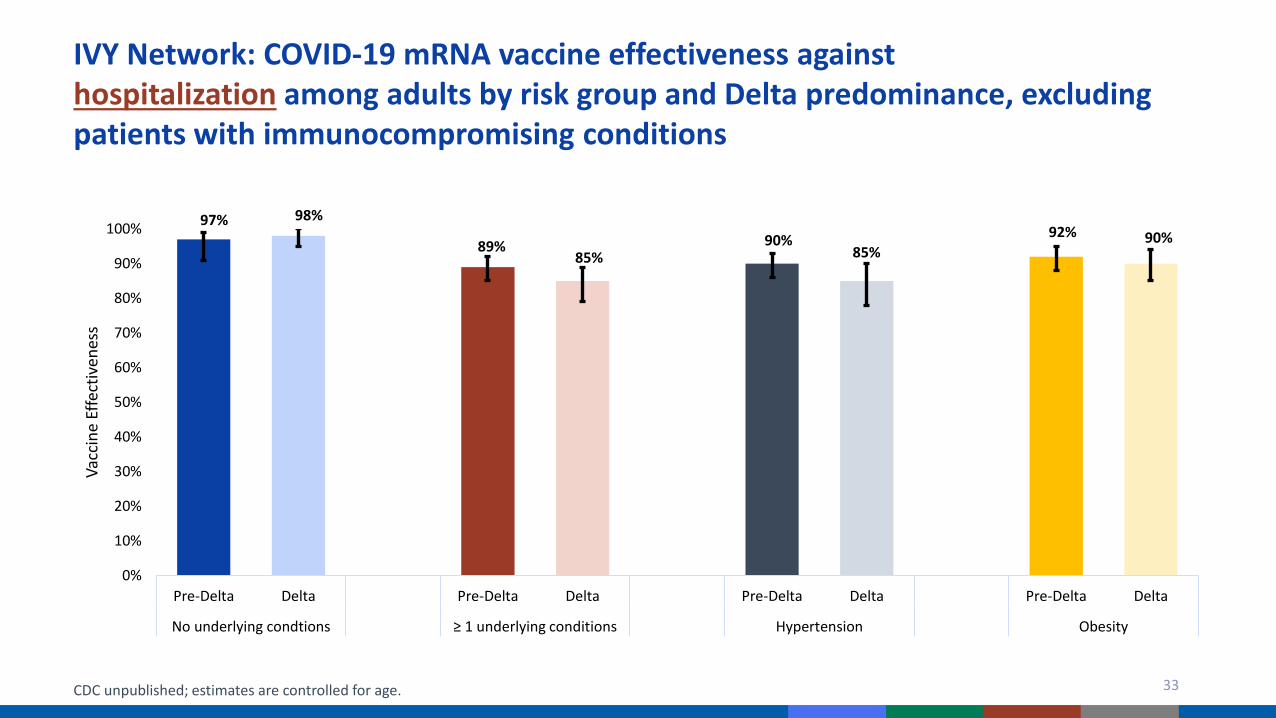
IVY Network: COVID-19 mRNA vaccine effectiveness against hospitalization among adults by risk group and Delta predominance, excluding patients with immunocompromising conditions
CDC unpublished; estimates are controlled for age. 33
97% 98%
89%85%
90%85%
92% 90%
0%
10%
20%
30%
40%
50%
60%
70%
80%
90%
100%
Pre-Delta Delta Pre-Delta Delta Pre-Delta Delta Pre-Delta Delta
No underlying condtions ≥ 1 underlying conditions Hypertension Obesity
Vacc
ine
Effe
ctiv
enes
s

SUPERNOVA (mRNA)
IVY ≥1 underlying
condtion (all products)
0%
10%
20%
30%
40%
50%
60%
70%
80%
90%
100%
Pre-Delta Delta
Vacc
ine
effe
ctiv
enes
s (%
)Magnitude of VE against infection or hospitalization by Delta predominance for adults with underlying medical conditions, by study
SUPERNOVA: https://www.cdc.gov/mmwr/volumes/70/wr/mm7037e3.htmIVY: CDC unpublished data 34
No VE estimates available for infection
VE estimates for hospitalization, remain high during Delta

Vaccine effectiveness for workers employed in occupations with high risk of exposure toSARS-CoV-2

HEROES-RECOVER Cohorts
https://www.cdc.gov/mmwr/volumes/70/wr/mm7034e4.htm
Prospective cohort of over 4,000 healthcare personnel, first responders, and other frontline workers in 8 U.S. locations
VE of full vaccination in preventing symptomatic and asymptomatic SARS-CoV-2 infection
– Routine weekly swabbing plus illness specimens– Multi-method vaccination documentation; 95% mRNA
vaccines– Hazard person-time model adjusted for study site,
occupation, and local virus circulation and weighted for propensity to be vaccinated (socio-demographics, health, frequency of close contact and mask use)
– 62% female; 72% aged 18–49 years; 31% with ≥1 underlying medical condition

Adjusted VE against infection
% (95% CI)Full cohort to date
Overall VE 80 (69-80)
14-119 days post dose 2 85 (68-93)
120-149 days post dose 2 81 (34-95)
≥150 days post dose 2 73 (49-86)
Pre-Delta variant predominance, overall VE 91 (81-96)
Delta variant predominance, overall VE 66 (26-84)
HEROES/RECOVER: VE against SARS-CoV-2 infection by Delta variant predominance and time since full vaccination
https://www.cdc.gov/mmwr/volumes/70/wr/mm7034e4.htm
VE against infection (80% symptomatic) declined from 91% pre-Delta to 66% during Delta Did not have enough power to look at time since vaccination pre-Delta and during Delta Do not see significant difference between mRNA products
0 20 40 60 80 100
Vaccine Effectiveness (%)

Summary and conclusions

HEROES-RECOVER (mRNA)
0%
10%
20%
30%
40%
50%
60%
70%
80%
90%
100%
Pre-Delta Delta
Vacc
ine
effe
ctiv
enes
s (%
)
SUPERNOVA (mRNA)
IVY ≥1 underlying
condtion (all products)
0%
10%
20%
30%
40%
50%
60%
70%
80%
90%
100%
Pre-Delta Delta
Vacc
ine
effe
ctiv
enes
s (%
)
Magnitude of VE against infection or hospitalization by Delta predominance and study, by risk group
NHSN: https://www.cdc.gov/mmwr/volumes/70/wr/mm7034e3.htmCOVID-NET: CDC unpublished VISION: https://www.nejm.org/doi/10.1056/NEJMoa2110362/ https://www.cdc.gov/mmwr/volumes/70/wr/mm7037e2.htmIVY: CDC unpublished data SUPERNOVA: https://www.cdc.gov/mmwr/volumes/70/wr/mm7037e3.htmNYS: https://www.cdc.gov/mmwr/volumes/70/wr/mm7034e1.htm HEROES-RECOVER: https://www.cdc.gov/mmwr/volumes/70/wr/mm7034e4.htm 39
Underlying medical conditions Frontline workers
NHSN (mRNA)
COVID-NET (mRNA)
VISION (Pfizer)
VISION (Moderna)
NYS (all products)
NYS (all products)
0%
10%
20%
30%
40%
50%
60%
70%
80%
90%
100%
Pre-Delta Delta
Vacc
ine
effe
ctiv
enes
s (%
)
≥ 65 years of age

Individuals ≥65 years of age– Significant declines in VE against infection for mRNA products in during Delta-variant predominant period– Declines for hospitalization (with Pfizer-BioNTech greater than Moderna) in Delta-variant predominant period– Evidence of waning in Delta-variant predominant period
Individuals with underlying conditions– No data on VE against infection; likely similar to overall population– Similar patterns for VE for hospitalization as in general adult population
Occupations with high risk of exposure to SARS-CoV-2 – No data on VE against hospitalization; likely similar to overall population– Similar patterns for VE for infection as in general adult population
Summary & conclusions

Acknowledgements New York State Health Department
– Eli Rosenberg and co-authors Site PIs and teams for IVY, VISION, Signature, NHSN,
HEROES/RECOVER, SUPERNOVA, COVID-NET
CDC– Sara Oliver– Stephanie Schrag– Katherine Fleming-Dutra– Jennifer Verani– John Jernigan– Nong Shang– Gordana Derado– Stephanie Bialek– Meredith McMorrow– Epi and Vaccine Task Forces
CDC– Heather Scobie– Mark Tenforde– Srinivas Nanduri– Tamara Pilishvili– Diya Surie– Mila Prill– Kristina Bajema– Mark Thompson– Jill Ferdinands– Ian Plumb– Fiona Havers– Heidi Moline– Jessica Smith– Manish Patel

For more information, contact CDC1-800-CDC-INFO (232-4636)TTY: 1-888-232-6348 www.cdc.gov
The findings and conclusions in this report are those of the authors and do not necessarily represent the official position of the Centers for Disease Control and Prevention.