covid-19 consortium report 30 economy dec 2020
TRANSCRIPT

www.covidstates.org
THE COVID STATES PROJECT: A 50-STATE COVID-19 SURVEY
REPORT #30: ECONOMIC HARDSHIPS DUE TO THE COVID-19 PANDEMIC
USA, December 2020
Matthew A. Baum, Harvard University Jennifer Lin, Northwestern University David Lazer, Northeastern University
Katherine Ognyanova, Rutgers University Roy H. Perlis, Harvard Medical School
James Druckman, Northwestern University Mauricio Santillana, Harvard Medical School
Alexi Quintana, Northeastern University Matthew Simonson, Northeastern University
Jon Green, Northeastern University Ata A. Uslu, Northeastern University
Adina Gitomer, Northeastern University Hanyu Chwe, Northeastern University
The COVID-19 Consortium for Understanding the Public’s Policy Preferences Across States 2
Report of December 17, 2020, v.1
The COVID States Project
From: The COVID-19 Consortium for Understanding the Public’s Policy Preferences Across States A joint project of: Northeastern University, Harvard University, Rutgers University, and Northwestern University Authors: Matthew A. Baum (Harvard University); Jennifer Lin (Northwestern University);
David Lazer (Northeastern University); Katherine Ognyanova (Rutgers University); Roy H. Perlis (Harvard Medical School); James Druckman (Northwestern University); Mauricio Santillana (Harvard Medical School); Alexi Quintana (Northeastern University); Matthew Simonson (Northeastern University); Jon Green (Northeastern University); Ata A. Uslu (Northeastern University); Adina Gitomer (Northeastern University), and Hanyu Chwe (Northeastern University)
This report is based on work supported by the National Science Foundation under grants SES-2029292 and SES-2029297. Any opinions, findings, and conclusions or recommendations expressed here are those of the authors and do not necessarily reflect the views of the National Science Foundation.
This research was partly supported by a grant from the Knight Foundation.
We also received generous support from the Russell Sage Foundation.
Our data collection was supported in part by Amazon.
The COVID-19 Consortium for Understanding the Public’s Policy Preferences Across States 3
COVER MEMO
Summary Memo — December 17, 2020
The COVID States Project
From: The COVID-19 Consortium for Understanding the Public’s Policy Preferences Across States
Partners: Northeastern University, Harvard University/Harvard Medical School, Rutgers University, and Northwestern University
Authors: Matthew A. Baum (Harvard University); Jennifer Lin (Northwestern University);
David Lazer (Northeastern University); Katherine Ognyanova (Rutgers University); Roy H. Perlis (Harvard Medical School); James Druckman (Northwestern University); Mauricio Santillana (Harvard Medical School); Alexi Quintana (Northeastern University); Matthew Simonson (Northeastern University); Jon Green (Northeastern University); Ata A. Uslu (Northeastern University); Adina Gitomer (Northeastern University), and Hanyu Chwe (Northeastern University)
From April through November, we conducted multiple waves of a large, 50-state survey, some results of which are presented here. You can find previous reports online at covidstates.org.
Note on methods:
Between November 3 and 30, we surveyed 24,019 individuals across all 50 states plus the District of Columbia. The survey was conducted by PureSpectrum via an online, nonprobability sample, with state-level representative quotas for race/ethnicity, age, and gender (for methodological details on the other waves, see covidstates.org). In addition to balancing on these dimensions, we reweighted our data using demographic characteristics to match the U.S. population with respect to race/ethnicity, age, gender, education, and living in urban, suburban, or rural areas. This was the latest in a series of surveys we have been conducting since April 2020, examining attitudes and behaviors regarding COVID-19 in the United States.
Contact information:
For additional information and press requests contact:
Matthew A. Baum at [email protected] David Lazer at [email protected] Katherine Ognyanova at [email protected] Roy H. Perlis at [email protected] James Druckman at [email protected] Mauricio Santillana at [email protected]
Or visit us at www.covidstates.org.
The COVID-19 Consortium for Understanding the Public’s Policy Preferences Across States 4
Economic hardships due to the COVID-19 pandemic
As of this writing, Congress appears to be in the late stages of negotiating the parameters of a possible COVID relief package, based on the roughly $908 billion proposal recently introduced by a bipartisan and bicameral group of Senators and Representatives. However, it remains uncertain whether Congress will pass, and the president will sign into law, another significant COVID relief package, or if it does, what elements such a package will contain. At the same time, reports of widespread economic suffering among Americans are rapidly proliferating, even as most previous relief measures, ranging from extended unemployment benefits to eviction student loan payment moratoriums, have already expired or are set to expire in the coming weeks. In order to better understand the economic circumstances of Americans in the pandemic economy, this report explores some of the economic hardships confronting Americans, both nationally and across the individual states.
Key findings:
● Parents with children at home are more likely than respondents without children at home to have experienced all five economic hardships, while women with kids at home are more likely than men with kids at home to have experienced four of the five hardships. The overall gaps range from a low of 4 percentage points for eviction from their home (6% for parents vs. 2% for non-parents), to highs of 11 points for taking pay cuts (26% vs. 17%) and being unable to make a rent or mortgage payment (21% vs. 10%)
● Economic hardships are fairly evenly distributed across partisan groups and regions of the country.
● Respondents who report having had COVID-19 (whether diagnosed by a medical professional or otherwise) are more likely than respondents who report not having had had COVID-19 to have suffered a series of five economic hardships we included in the survey, including losing a job, being evicted from their home, being unable to pay rent or their mortgage, taking a pay cut, or having to cut back on work to take care of a child.
● Hispanics are more likely than other racial/ethnic groups to have experienced all five economic hardships.
● We find fairly wide variations across the 50 states in the percentages of residents having experienced economic hardships, and no consistent geographic patterns. COVID-related hardships appear to be generally widespread across the country.

The COVID-19 Consortium for Understanding the Public’s Policy Preferences Across States 5
OVERALL
Overall, about 3% of respondents indicated that they had been evicted from their home, while over 13% indicated that they had missed rent or mortgage payments, 18% indicated that they had been laid off or lost a job, and another 18% indicated that they had taken a pay cut at work. Finally, over 9% reported having to stop or scale back work to take care of a child (Figure 1).
Figure 1
PARTISAN GAPS
Turning to different subgroups, and beginning with partisanship (Figure 1), we find some noteworthy differences. Independents are most likely to report having lost a job (19%), missed rent or mortgage payments (15%) or having taken a pay cut (20%). The corresponding figures for Democrats are 17%, 14%, and 19%, respectively, while, for Republicans, they are 14%, 10%, and 15%, respectively. We see only minor differences across partisan subgroups in the likelihood of having been evicted (2-3% across subgroups) and having been forced to scale back or stop working to take care of a child (8-10% across subgroups).

The COVID-19 Consortium for Understanding the Public’s Policy Preferences Across States 6
We also see modest gender differences across the several types of hardships (Figure 2), ranging from a maximum three point gap in the probability of having lost a job (19% for women and 16% for men) to a minimum one point gap for evictions (2% for women, 3% for men), scaling back or stopping work to take care of children (10% for women, 9% for men) and taking a pay cut (19% for women, 18% for men). The gender gap for missing rent or mortgage payments is 2 percentage points (14% for women, 12% for men).
Figure 2
Comparing across education groups (Figure 2), we find that highly educated respondents -- those with at least a bachelor’s degree -- are least likely to have experienced two of the pandemic-related hardships included in our survey. Fourteen percent of college graduates report having lost a job, compared to 18% of respondents with less than a high school education and 20% of respondents with a high school diploma or equivalent, or some college. The pattern is similar for missing rent or mortgage payments: 9% of college graduates, compared to 18% of respondents without less than a high school diploma and 15% of respondents with a high school diploma or some college. Conversely, college graduates are equivalent to respondents possessing a high school diploma or some college in their likelihood of having been evicted (3% each) or having to stop work to care for a child (10% each). The corresponding percentages for respondents without a high school diploma or equivalent are 2% and 8%, respectively. Finally, respondents with high school diplomas or some college are most likely to report having taken a pay cut (20%), followed by college graduates (19%), and respondents with less than a high school education (12%).
The COVID-19 Consortium for Understanding the Public’s Policy Preferences Across States 7
Comparing respondents who did or did not report having had COVID-19 (diagnosed or undiagnosed) (Figure 2), we find substantially higher percentages enduring all five economic hardships among respondents who report having had COVID-19, compared to those who report that they had not had COVID-19. The differences are 5 percentage points for job loss (22% vs. 17%), 9 points for missing rent (21% vs. 12%), 4 points for eviction (6% vs. 2%), 10 points for having stopped or scaled back work to take care of a child (18% vs. 8%), and 10 points for having taken a pay cut (27% vs. 17%).
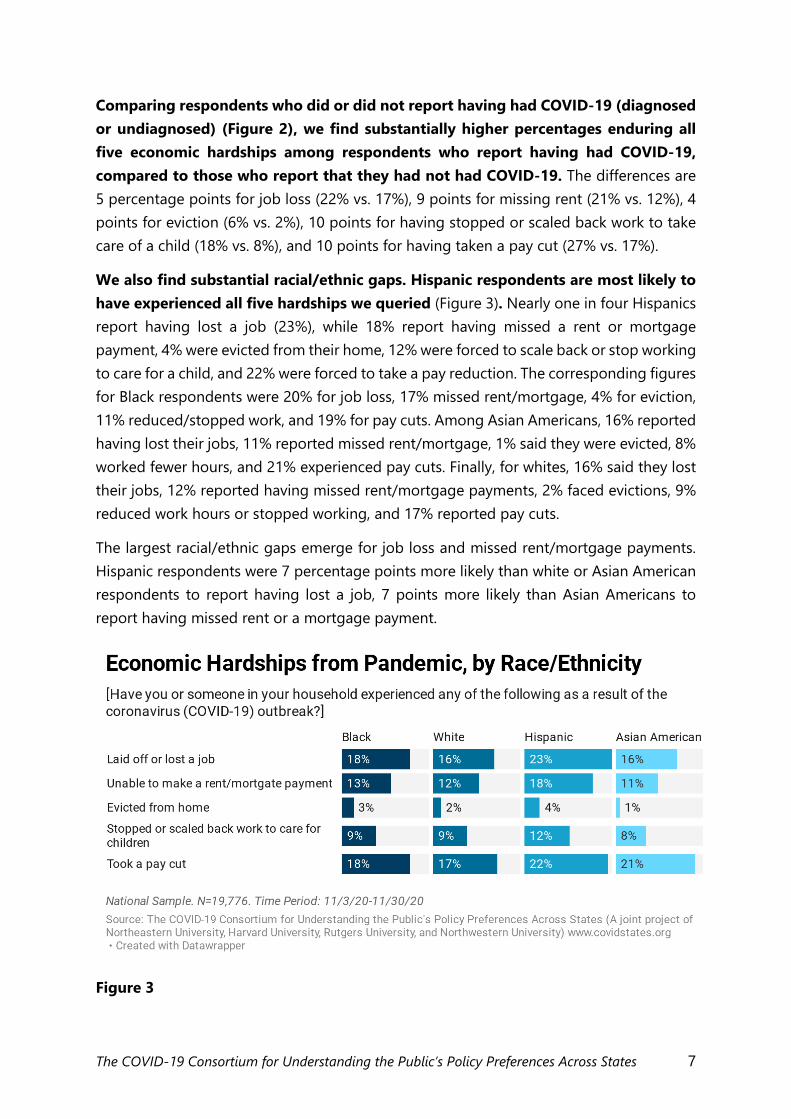
We also find substantial racial/ethnic gaps. Hispanic respondents are most likely to have experienced all five hardships we queried (Figure 3). Nearly one in four Hispanics report having lost a job (23%), while 18% report having missed a rent or mortgage payment, 4% were evicted from their home, 12% were forced to scale back or stop working to care for a child, and 22% were forced to take a pay reduction. The corresponding figures for Black respondents were 20% for job loss, 17% missed rent/mortgage, 4% for eviction, 11% reduced/stopped work, and 19% for pay cuts. Among Asian Americans, 16% reported having lost their jobs, 11% reported missed rent/mortgage, 1% said they were evicted, 8% worked fewer hours, and 21% experienced pay cuts. Finally, for whites, 16% said they lost their jobs, 12% reported having missed rent/mortgage payments, 2% faced evictions, 9% reduced work hours or stopped working, and 17% reported pay cuts.
The largest racial/ethnic gaps emerge for job loss and missed rent/mortgage payments. Hispanic respondents were 7 percentage points more likely than white or Asian American respondents to report having lost a job, 7 points more likely than Asian Americans to report having missed rent or a mortgage payment.
Figure 3
The COVID-19 Consortium for Understanding the Public’s Policy Preferences Across States 8
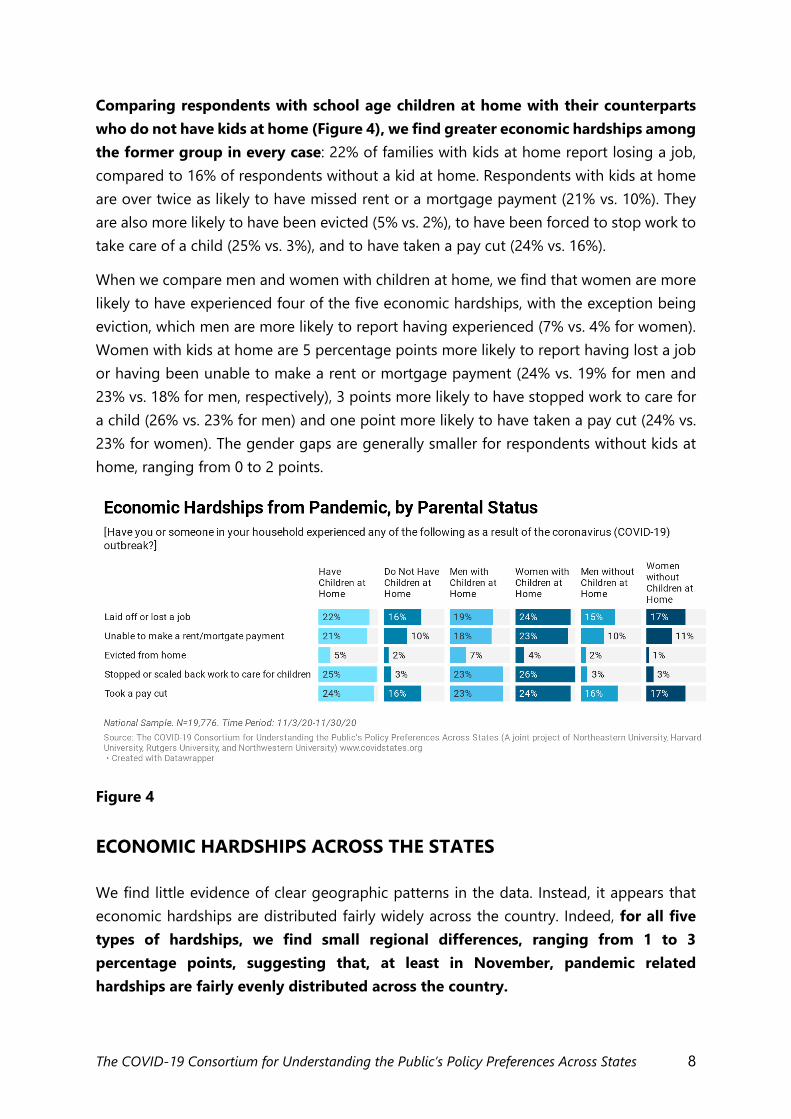
Comparing respondents with school age children at home with their counterparts who do not have kids at home (Figure 4), we find greater economic hardships among the former group in every case: 22% of families with kids at home report losing a job, compared to 16% of respondents without a kid at home. Respondents with kids at home are over twice as likely to have missed rent or a mortgage payment (21% vs. 10%). They are also more likely to have been evicted (5% vs. 2%), to have been forced to stop work to take care of a child (25% vs. 3%), and to have taken a pay cut (24% vs. 16%).
When we compare men and women with children at home, we find that women are more likely to have experienced four of the five economic hardships, with the exception being eviction, which men are more likely to report having experienced (7% vs. 4% for women). Women with kids at home are 5 percentage points more likely to report having lost a job or having been unable to make a rent or mortgage payment (24% vs. 19% for men and 23% vs. 18% for men, respectively), 3 points more likely to have stopped work to care for a child (26% vs. 23% for men) and one point more likely to have taken a pay cut (24% vs. 23% for women). The gender gaps are generally smaller for respondents without kids at home, ranging from 0 to 2 points.
Figure 4
ECONOMIC HARDSHIPS ACROSS THE STATES
We find little evidence of clear geographic patterns in the data. Instead, it appears that economic hardships are distributed fairly widely across the country. Indeed, for all five types of hardships, we find small regional differences, ranging from 1 to 3 percentage points, suggesting that, at least in November, pandemic related hardships are fairly evenly distributed across the country.

The COVID-19 Consortium for Understanding the Public’s Policy Preferences Across States 9
When we look at individual states, in our November wave a maximum of 13% of respondents in four states indicated that they “Had to stop or scale back work to take care of their children” during the pandemic, including North Dakota, Washington DC, Arkansas, and Maryland (Figure 5). At the low end, fewer than 8% reported having done so in Pennsylvania, Montana, Florida, California, Wyoming, Arizona, and Iowa.
Figure 5
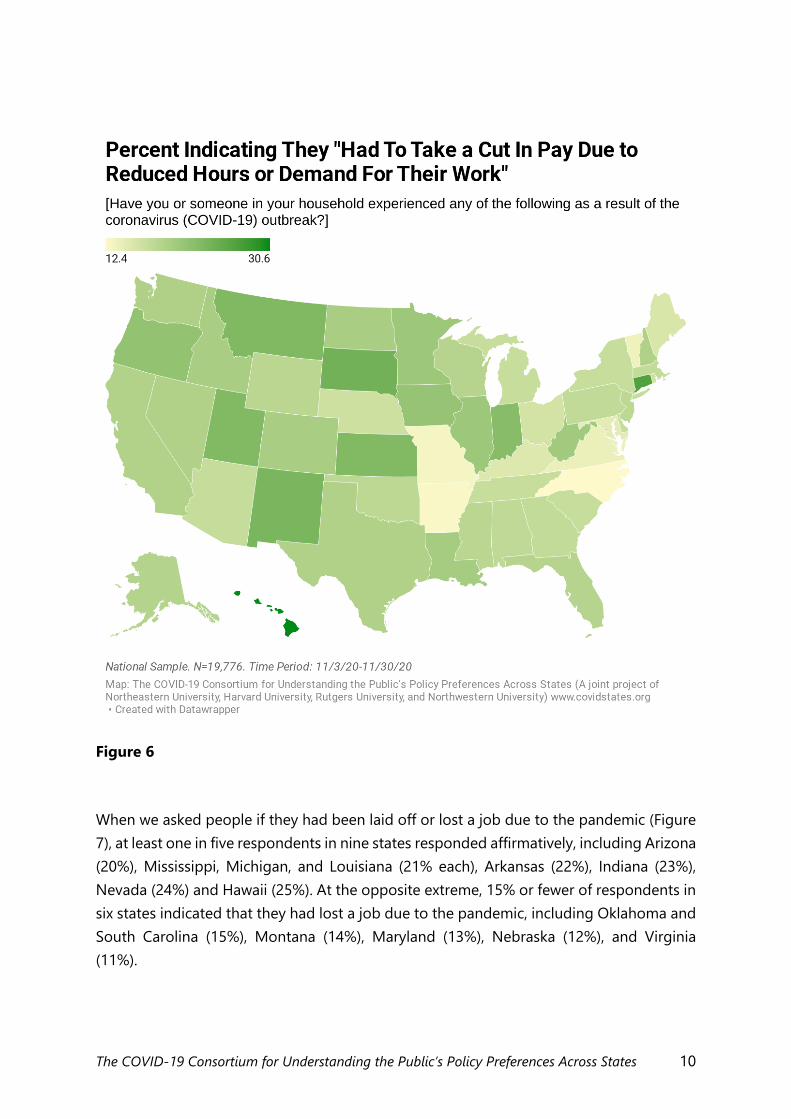
We next compared the percentages across states who report having taken a pay cut due to reduced hours or demand for their work (Figure 6). The states with the highest such percentages included Montana (23%), New Mexico and South Dakota (24% each), Connecticut (27%) and Hawaii (31%). Conversely, at the low end, fewer than 15% of respondents in six states reported having taken pay cuts, including Maryland (14.5%), Virginia and Vermont (14% each), Missouri and Arkansas (13% each) and North Carolina (12%).
The COVID-19 Consortium for Understanding the Public’s Policy Preferences Across States 10
Figure 6
When we asked people if they had been laid off or lost a job due to the pandemic (Figure 7), at least one in five respondents in nine states responded affirmatively, including Arizona (20%), Mississippi, Michigan, and Louisiana (21% each), Arkansas (22%), Indiana (23%), Nevada (24%) and Hawaii (25%). At the opposite extreme, 15% or fewer of respondents in six states indicated that they had lost a job due to the pandemic, including Oklahoma and South Carolina (15%), Montana (14%), Maryland (13%), Nebraska (12%), and Virginia (11%).

The COVID-19 Consortium for Understanding the Public’s Policy Preferences Across States 11
Figure 7
More than one in five respondents in two states indicated that they had missed rent or mortgage payments due to the pandemic, including 24% in Louisiana and 20% in Alaska. New Mexico followed closely at 19% (Figure 8). At the low end, 10% or fewer of respondents indicated that they had been unable to make mortgage or rent payments in California, Michigan, Washington DC, Nebraska, and Pennsylvania (10%), as well as Virginia (9%) and Massachusetts (8%).

The COVID-19 Consortium for Understanding the Public’s Policy Preferences Across States 12
Figure 8
Finally, when asked whether they had been evicted from their home, at least 4% of respondents in eight states indicated that they had indeed been evicted, including Arkansas, Alaska, and Oklahoma (4% each), as well as New Mexico, Louisiana, Maryland, and Georgia (5% each) (Figure 19). At the low end, only about 1% of respondents in Vermont, Maine, Minnesota, and Kentucky indicated that they had been evicted.

The COVID-19 Consortium for Understanding the Public’s Policy Preferences Across States 13
Figure 9
Appendix A: State Tables
Tables offering state-by-state information on economic hardships (as shown in Figure 5 through Figure 9) are available online at the following URL:
https://github.com/kateto/covidstates/tree/master/Report Data