covid-19 community vulnerability index training: using
TRANSCRIPT

Rhiannon Simon, MPH
12/17/2020
COVID-19 Community Vulnerability Index Training:
Using Data through an Equity Lens

Training Overview• Environmental Public Health Tracking Program
(EnviroHealthLink.org) • Available Data Tools/Views• Data Tools for local Health Equity work
• Community Snapshot Reports• Social Vulnerability Index (SVI) Interactive Map• COVID-19 Community Vulnerability Index Interactive Map –
NEW!!• Examples

Health Equity• KY Tracking is proud to partner with the KDPH Office of Health Equity• Our tools can support your work on health equity
• Data-driven health equity work• Support resource allocation decisions• Prioritizing vulnerable populations• Show how place (environment) can impact our health• Provoke thought and work on addressing root causes and social
determinants of health
• Health Equity should be in everyone’s public health practice!
3

Kentucky Environmental Public Health Tracking
• Federally funded through the CDC.
• Goal: Develop and maintain a queryable website (specific to KY) for the public.
• This website is known as “the portal” or EnviroHealthLink.org
EnviroHealthLink.org
Health Data
Hazard Data
Exposure Data

5

Ways to View the Data
Community Snapshot Reports
InteractiveMaps
QueryModules
6

7

8

9

10

11

12
Social Vulnerability Index https://ky-dph.maps.arcgis.com/apps/MapSeries/index.html?appid=b051448dfb4b4a69a39e8adf2e8ac44e

13
https://svi.cdc.gov/index.html
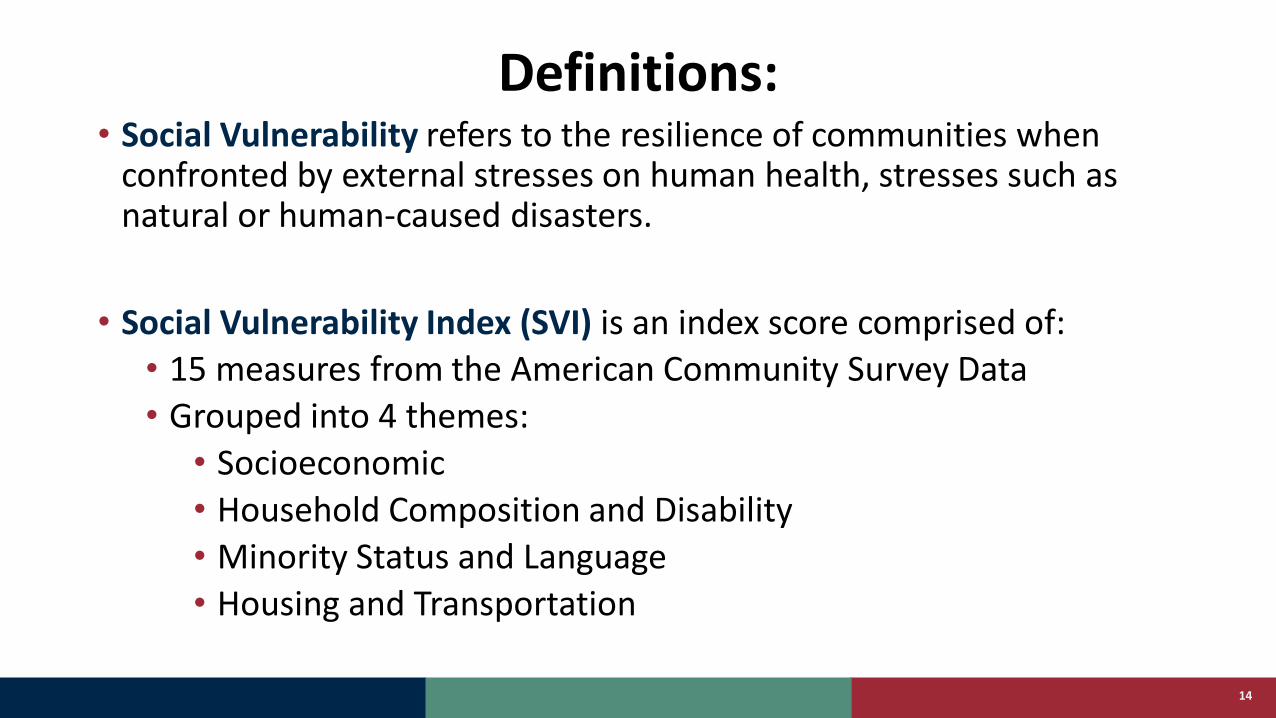
Definitions: • Social Vulnerability refers to the resilience of communities when
confronted by external stresses on human health, stresses such as natural or human-caused disasters.
• Social Vulnerability Index (SVI) is an index score comprised of:• 15 measures from the American Community Survey Data • Grouped into 4 themes:
• Socioeconomic• Household Composition and Disability • Minority Status and Language • Housing and Transportation
14

CCVI Interactive Map
15
https://ky-dph.maps.arcgis.com/apps/MapSeries/index.html?appid=fef62c767a734a1ab2a0140a7477920e

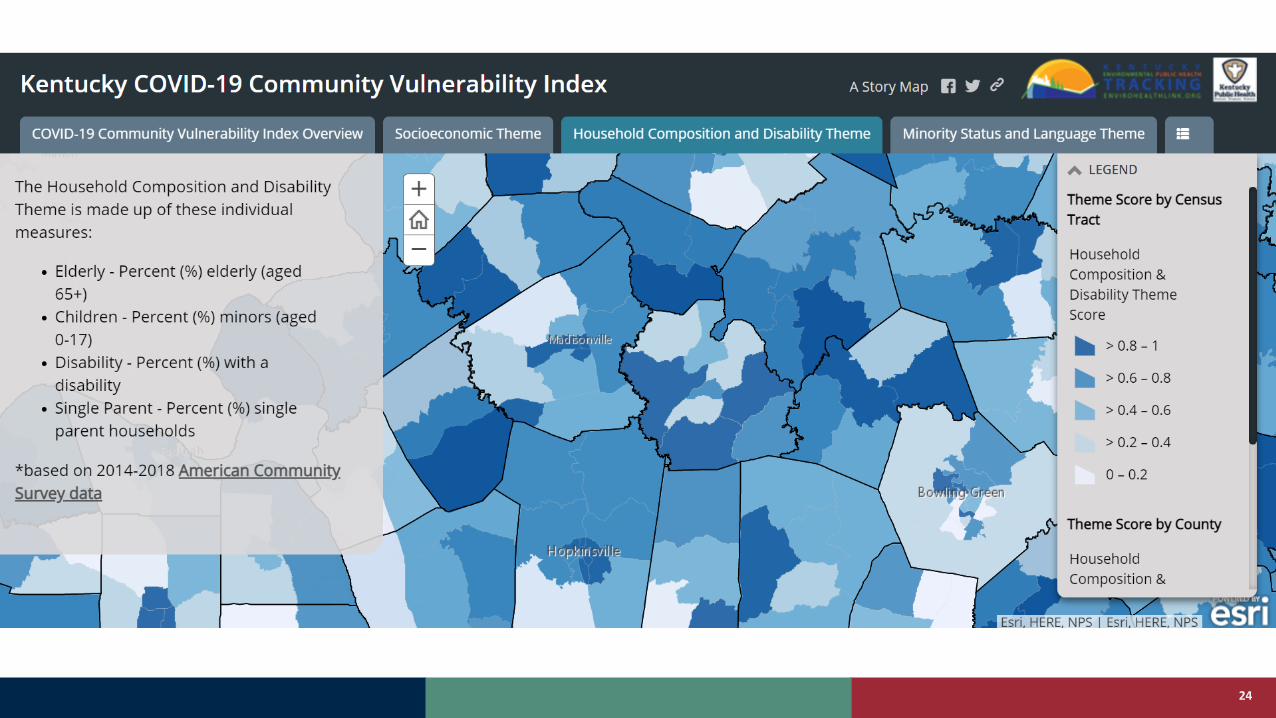
CCVI Additional Themes and Measures• COVID-19 Community Vulnerability: How resilient is the community
to COVID-19?
• COVID-19 Community Vulnerability Index (CCVI) is an index score comprised of:
• The 15 measures and 4 themes of the SVI and 10 addition variables and 2 additional themes
• 2 themes: • Epidemiologic Factors• Healthcare System Factors
16

How does the CCVI rank census tracts?
• These data are ranked using percentiles. A percentile rank is the percentage of tracts at or below that particular rank score.
• All tracts (or counties) are ranked on a scale from 0 (least vulnerable) to 1 (most vulnerable).
• A score is calculated for each theme and for an overall vulnerability ranking.
• This map shows Kentucky’s census tract rankings within the state.
17
Vulnerable
More
Less
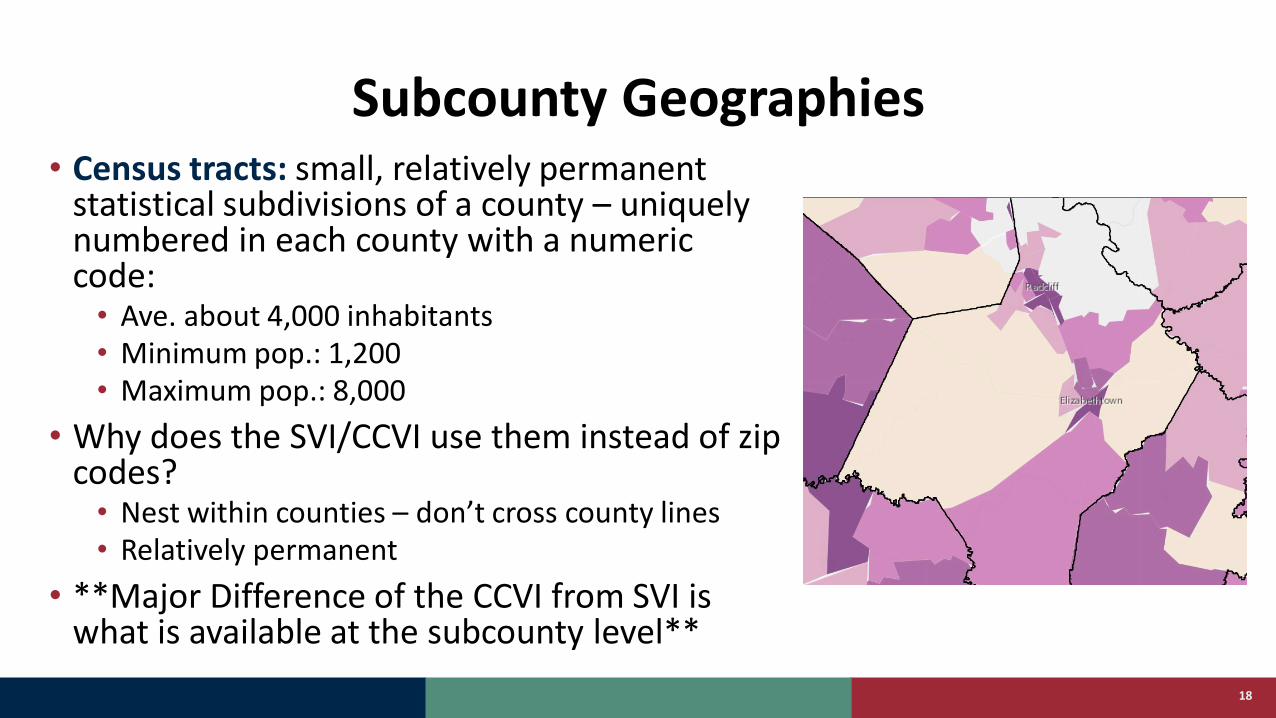
Subcounty Geographies• Census tracts: small, relatively permanent
statistical subdivisions of a county – uniquely numbered in each county with a numeric code:
• Ave. about 4,000 inhabitants• Minimum pop.: 1,200• Maximum pop.: 8,000
• Why does the SVI/CCVI use them instead of zip codes?
• Nest within counties – don’t cross county lines• Relatively permanent
• **Major Difference of the CCVI from SVI is what is available at the subcounty level**
18

CCVI structure =
CCVI interactive map
Socioeconomic
Poverty
Unemployment
Income
Education
Household Composition and Disability
Elderly
Children
Disability
Single Parents
Minority Status and Language
Minority
Limited English
Speakers
Housing and Transportation
Large Apartment Buildings
Mobile Homes
Crowding
No Vehicle
Group Quarters
Covid-19 Community Vulnerability Index Overall Index Score/ First Map Tab
Theme Scores/Next 6 Tabs
Individual Measures

CCVI structure =
CCVI interactive map
Epidemiological Factors
Cardiovascular Conditions
Respiratory Conditions
Immunocompromised
Obesity
Diabetes
Population Density
Influenza and Pneumonia Death Rates
Healthcare System Factors
Health System
Capacity
Health System
Strength
Health System
Preparedness
Covid-19 Community Vulnerability Index Overall Index Score/ First Map Tab
Theme Scores/Next 6 Tabs
Individual Measures

21
Socioeconomic Status
Below Poverty
Unemployed
Income
No High School Diploma
Household Composition &
Disability
Aged 65 or Older
Aged 17 or Younger
Older than age 5 with a disability
Single-Parent Households
Minority Status & Language
Minority
Speaks English “Less Than Well”
Housing Type & Transportation
Multi-Unit Structures
Crowding
No Vehicle
Group Quarters
Epidemiological Factors
Cardiovascular Conditions
Respiratory Conditions
Immunocompromised
Obesity
Diabetes
Population Density
Influenza and Pneumonia Death
Rates
Healthcare System Factors
Health System Capacity
Health System Strength
Health System Preparedness
Covid-19 Community Vulnerability Index

22

23
24

25

26

27

28

29

Potential Uses for the CCVI Map • Resource allocation for COVID-19 Response (vaccines)• Reaching vulnerable and minority populations for outreach and
communications• Doing Health Equity work (or adapting current work to have using a
health equity lens)• Source of sub-county data for CHA/CHIP & PHAB process• Program Planning and evaluation • Targeting interventions • Program justification and work plans• Grant writing
30

Data-Informed Decision Making – Targeting Intervention and Events
• Q1: Which themes/measures from the CCVI could help you decide where to locate events held for the public?
• Q2: Which themes/measures from the CCVI could help you target interventions that are related to age groups or people at high risk for COVID-19?
• Q3: Which themes/measures from the CCVI could help give you more information about where to focus efforts for a health issue that has poverty or low education as risk factors?
31

Local Technical Assistance
32

Questions?
