covid-19, australia: epidemiology report 13: …€¦ · web viewin the current reporting week,...
TRANSCRIPT

COVID-19, Australia: Epidemiology Report 13: Reporting week ending 23:59 AEST 26 April 2020
COVID-19 National Incident Room Surveillance Team
Notified cases of COVID-19 and associated deaths reported to the National Notifiable Diseases Surveillance System (NNDSS) to 26 April 2020.
SummaryConfirmed cases in Australia notified up to 26 April 2020i
Notifications 6,711Deaths 77
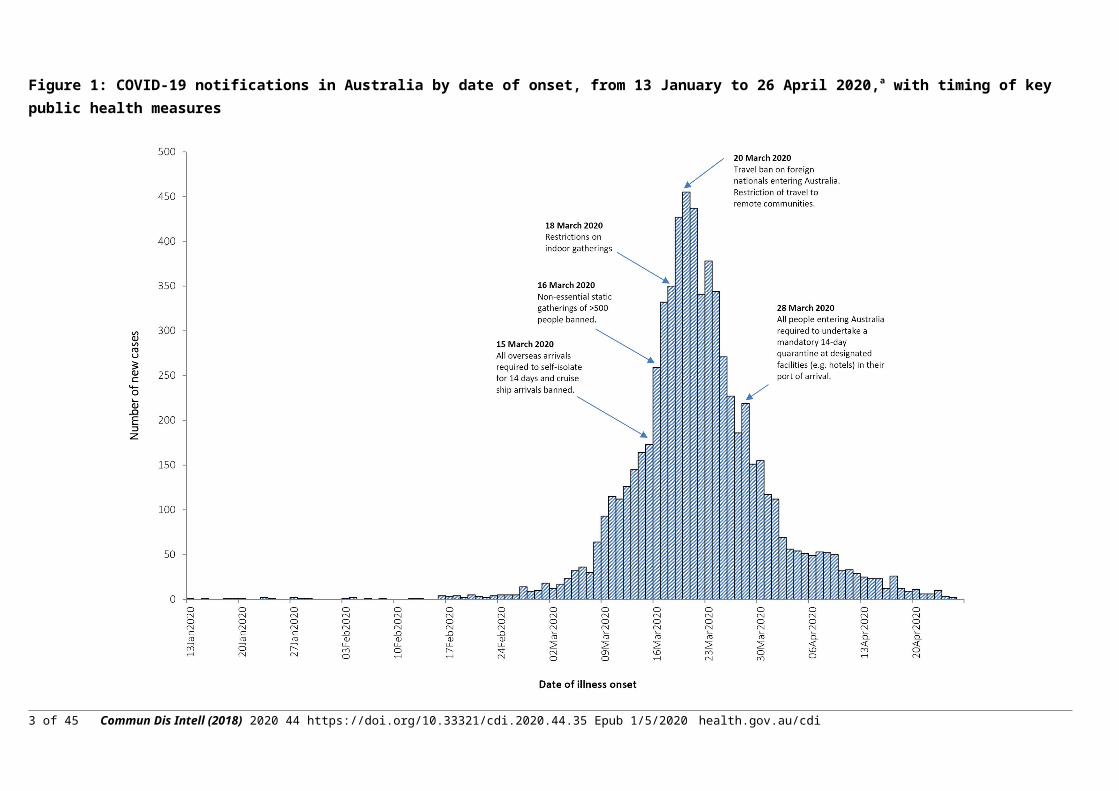
The reduction in international travel and domestic movement, social distancing measures and public health action have likely slowed the spread of COVID-19 in Australia (Figure 1).
Notifications in Australia remain predominantly among people with recent overseas travel, with some locally-acquired cases being detected. Most locally-acquired cases can be linked back to a confirmed case, with a small portion unable to be epidemiologically linked to another case. The ratio of overseas-acquired cases to locally-acquired cases varies by jurisdiction.
The crude case fatality rate (CFR) in Australia remains low (1.1%) compared to the World Health Organization’s globally-reported rate (6.9%) and to other comparable high-income countries such as the United States of America (5.1%) and the United Kingdom (13.7%). The lower CFR in Australia is likely reflective of high case ascertainment including detection of mild cases. High case ascertainment and prompt identification of contacts enables an effective public health response and a reduction of disease transmission.
Internationally, cases continue to increase. The rates of increase have started to slow in several regions, although it is too soon to tell whether this trend will be sustained. Interpretation of international epidemiology should be conducted with caution as it differs from country to country depending not only on the disease dynamics, but also on differences in case detection, testing and implemented public health measures.
Keywords: SARS-CoV-2; novel coronavirus; 2019-nCoV; coronavirus disease 2019; COVID-19; acute respiratory disease; epidemiology; Australia
i Data caveats: Based on data extracted from the National Notifiable Diseases Surveillance System (NNDSS) on 28 April 2020. Due to the dynamic nature of the NNDSS, data in this extract are subject to retrospective revision and may vary from data reported in published NNDSS reports and reports of notification data by states and territories.
1 of 30 Commun Dis Intell (2018) 2020 44 https://doi.org/10.33321/cdi.2020.44.35 Epub 1/5/2020health.gov.au/cdi

Figure 1: COVID-19 notifications in Australia by date of onset, from 13 January to 26 April 2020,a with timing of key public health measures
a Due to reporting delays, interpret the latest days’ new cases with caution.
2 of 30 Commun Dis Intell (2018) 2020 44 https://doi.org/10.33321/cdi.2020.44.35 Epub 1/5/2020health.gov.au/cdi
Australian cases: descriptive epidemiology
National trends For the week ending 26 April 2020, there were one hundred and five cases of COVID-19 notified to the NNDSS, bringing the total number of confirmed cases notified in Australia to 6,711 (up to 23:59 AEST 26 April 2020).
The number of new cases continues to decrease (Figure 1), which indicates a reduction in disease transmission, as demonstrated by a flattening of the cumulative cases curve. While reduction in international travel has decreased the number of imported cases, public health responses such as social distancing measures remain important in continuing to limit domestic spread.
In all jurisdictions, the rate of new cases per 100,000 population declined (Table 1, Figure 2). NSW, Vic, Qld, SA, and ACT reported their highest rates of new cases during the week 16–22 March. For Tasmania the highest rate of new cases was recorded in the week 6–12 April, which was the result of outbreak-associated cases in North West Tasmania.
Table 1: Rate of weekly confirmed cases (per 100,000 population) by date of illness onset,a by jurisdiction
Week NSW VIC QLD WA SA TAS ACT NT
30 March – 5 April 3.10 1.88 1.26 3.59 1.94 5.61 2.81 2.03
6–12 April 1.20 0.65 0.37 2.10 0.40 13.28 1.41 –
13–19 April 0.80 0.21 0.10 0.57 0.06 5.43 0.23 –
20–26 April 0.27 0.12 0.06 0.04 – 0.56 0.23 –
a Based on diagnosis date from NNDSS reporting period up to 23:59 AEST 26 April 2020.
3 of 30 Commun Dis Intell (2018) 2020 44 https://doi.org/10.33321/cdi.2020.44.35 Epub 1/5/2020health.gov.au/cdi

Figure 2: Weekly COVID-19 new case notifications per 100,000 population, as at 26 April 2020, by jurisdiction
4 of 30 Commun Dis Intell (2018) 2020 44 https://doi.org/10.33321/cdi.2020.44.35 Epub 1/5/2020health.gov.au/cdi

Aboriginal and Torres Strait Islander personsFifty-two cases (0.8%) have been reported in Aboriginal and Torres Strait Islander persons since the start of the outbreak. These cases were reported across several jurisdictions, with the majority reported in areas classified as ‘Major cities of Australia’ based on the case’s usual place of residence (Table 2). No cases were notified from remote or very remote Australia.
Across all Australian cases, completeness of the Indigenous status field was approximately 94%.
Table 2: COVID-19 cases notified among persons by remoteness classification, Australia
Population Major cities of Australia
Inner regional Australia
Outer regional Australia
Remote/very remote
Australia
Total
Aboriginal and Torres Strait Islander persons 35 11 6 0 52
All persons 5234 816 365 38 6711a
a Total includes 171 overseas residents and 87 persons with unknown remoteness classification.
Forty percent (n = 21) of cases in Aboriginal and Torres Strait Islander persons acquired their infection overseas, while 35% (n = 18) of cases acquired their infection domestically. Thirteen cases (25%) were still under investigation at the time of this report.
The median age of COVID-19 cases among Aboriginal and Torres Strait Islander persons is 36 years (interquartile range: 24.5–55.5 years), which is lower than the median age of non-Indigenous COVID-19 cases.
Of the cases notified amongst Aboriginal and Torres Strait Islander persons, 10% were admitted to hospital, with no such cases reported as being admitted to ICU. This is less than the proportion of cases hospitalised from the non-Indigenous population.
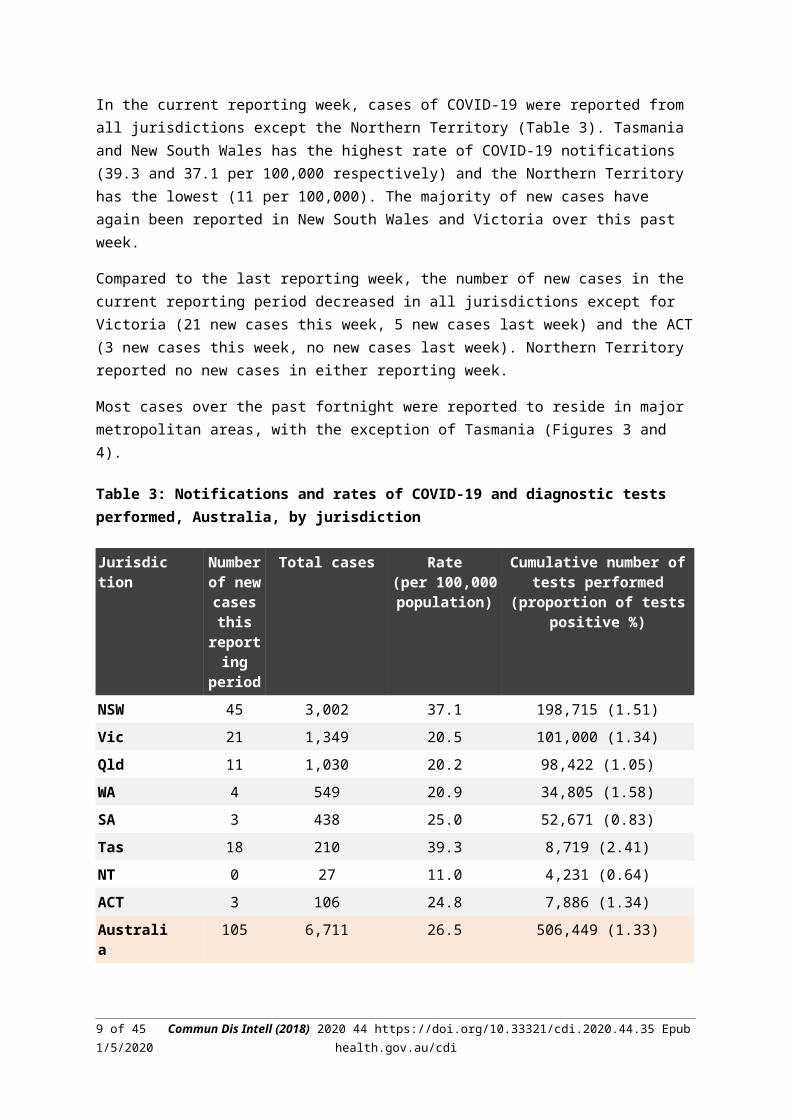
Geographical distributionIn the current reporting week, cases of COVID-19 were reported from all jurisdictions except the Northern Territory (Table 3). Tasmania and New South Wales has the highest rate of COVID-19 notifications (39.3 and 37.1 per 100,000 respectively) and the Northern Territory has the lowest (11 per 100,000). The majority of new cases have again been reported in New South Wales and Victoria over this past week.
Compared to the last reporting week, the number of new cases in the current reporting period decreased in all jurisdictions except for Victoria (21 new cases this week, 5 new cases last week) and the ACT (3 new cases this week, no new cases last week). Northern Territory reported no new cases in either reporting week.
Most cases over the past fortnight were reported to reside in major metropolitan areas, with the exception of Tasmania (Figures 3 and 4).
5 of 30 Commun Dis Intell (2018) 2020 44 https://doi.org/10.33321/cdi.2020.44.35 Epub 1/5/2020health.gov.au/cdi

Table 3: Notifications and rates of COVID-19 and diagnostic tests performed, Australia, by jurisdiction
Jurisdiction Number of new
cases this reporting
period
Total cases Rate(per 100,000 population)
Cumulative number of tests performed (proportion of tests
positive %)
NSW 45 3,002 37.1 198,715 (1.51)
Vic 21 1,349 20.5 101,000 (1.34)
Qld 11 1,030 20.2 98,422 (1.05)
WA 4 549 20.9 34,805 (1.58)
SA 3 438 25.0 52,671 (0.83)
Tas 18 210 39.3 8,719 (2.41)
NT 0 27 11.0 4,231 (0.64)
ACT 3 106 24.8 7,886 (1.34)
Australia 105 6,711 26.5 506,449 (1.33)
6 of 30 Commun Dis Intell (2018) 2020 44 https://doi.org/10.33321/cdi.2020.44.35 Epub 1/5/2020health.gov.au/cdi

Figure 3: Number of cumulative new confirmed cases of COVID-19, Australia, by location of usual residence and statistical area level 3 (SA3),a 7 day heat maps for the four most recent weekly reporting periodsb
a Represents the usual location of residence of a case, which does not necessarily mean that this is the place where they acquired their infection or were diagnosed. Overseas residents who do not have a usual place of residence in Australia are not shown.
b Based on diagnosis date from NNDSS reporting period up to 23:59 AEST 26 April 2020.
7 of 30 Commun Dis Intell (2018) 2020 44 https://doi.org/10.33321/cdi.2020.44.35 Epub 1/5/2020health.gov.au/cdi

Figure 4. Number of cumulative new confirmed cases of COVID-19, Australia, by location of usual residence and selected areas,a 7 day heat maps for the four most recent weekly reporting periodsb
a Represents the usual location of residence of a case, which does not necessarily mean that this is the place where they acquired their infection or were diagnosed. Overseas residents who do not have a usual place of residence in Australia are not shown.
b Based on diagnosis date from NNDSS reporting period up to 23:59 AEST 26 April 2020.
8 of 30 Commun Dis Intell (2018) 2020 44 https://doi.org/10.33321/cdi.2020.44.35 Epub 1/5/2020health.gov.au/cdi
Age and gender distribution The median age of all COVID-19 cases was 48 years (interquartile range, IQR: 30–63 years) (Figure 5).
The median ages of cases who were hospitalised (median: 61, IQR: 42–72 years) and died (median: 79, IQR: 74–84) were higher than for cases overall. This is consistent with international reporting and reflects a greater risk of severe disease, complications, and deaths in the elderly and those with comorbidities (Table 4, Figure 5).
Table 4: Demographics of all cases, hospitalised cases and deaths
All cases Hospitalisation Death
Crude CFR 1% 6% –
Median age (interquartile range) 48 (30–63) 61 (42–72) 79 (74–84)
Gender (male to female) 1:1 1:1 3:2
The number of cases was highest in the 20–29 years age group; a high proportion have reported recent overseas travel history. The highest rate of disease was among those in the 60–69 years age group, followed closely by the 70–79 years age group (Figure 6). The high rate amongst those in the 60–69 and 70–79 years age groups is linked to outbreaks on cruise ships, with 33% of cases in the 60–69 years age group and 49% in the 70–79 years age group acquiring their infection at sea.
Children make up a very small proportion of cases nationally, with 1% of cases aged less than 10 years and 3% aged 10–19 years. One hundred and fifty-nine cases were school-aged children aged 5–18 years. This is consistent with international studies.
Overall, notifications by gender were approximately equal with some variability by jurisdiction.
Notifications by gender differed by age group with a higher rate of disease in females in the 20–29 age group and a higher rate of disease in males in those aged over 60. It is unlikely that this disparity reflects differences in underlying susceptibility to COVID-19; instead, it is more likely linked to transmission and possibly to differences in travel patterns.
9 of 30 Commun Dis Intell (2018) 2020 44 https://doi.org/10.33321/cdi.2020.44.35 Epub 1/5/2020health.gov.au/cdi
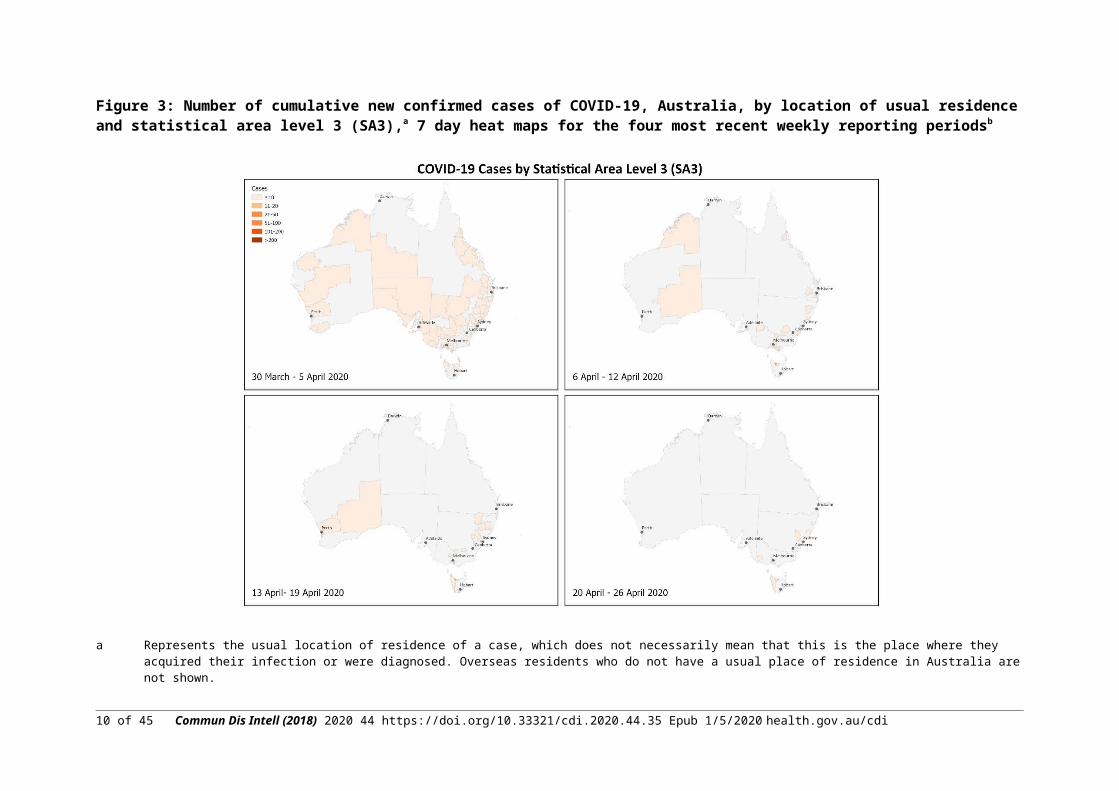
Figure 5: Age distribution of all cases, hospitalised cases, and deaths with median, interquartile range, and range
Figure 6: COVID-19 rates per 100,000 population of all cases notified in Australia, by age group and gender
10 of 30 Commun Dis Intell (2018) 2020 44 https://doi.org/10.33321/cdi.2020.44.35 Epub 1/5/2020health.gov.au/cdi

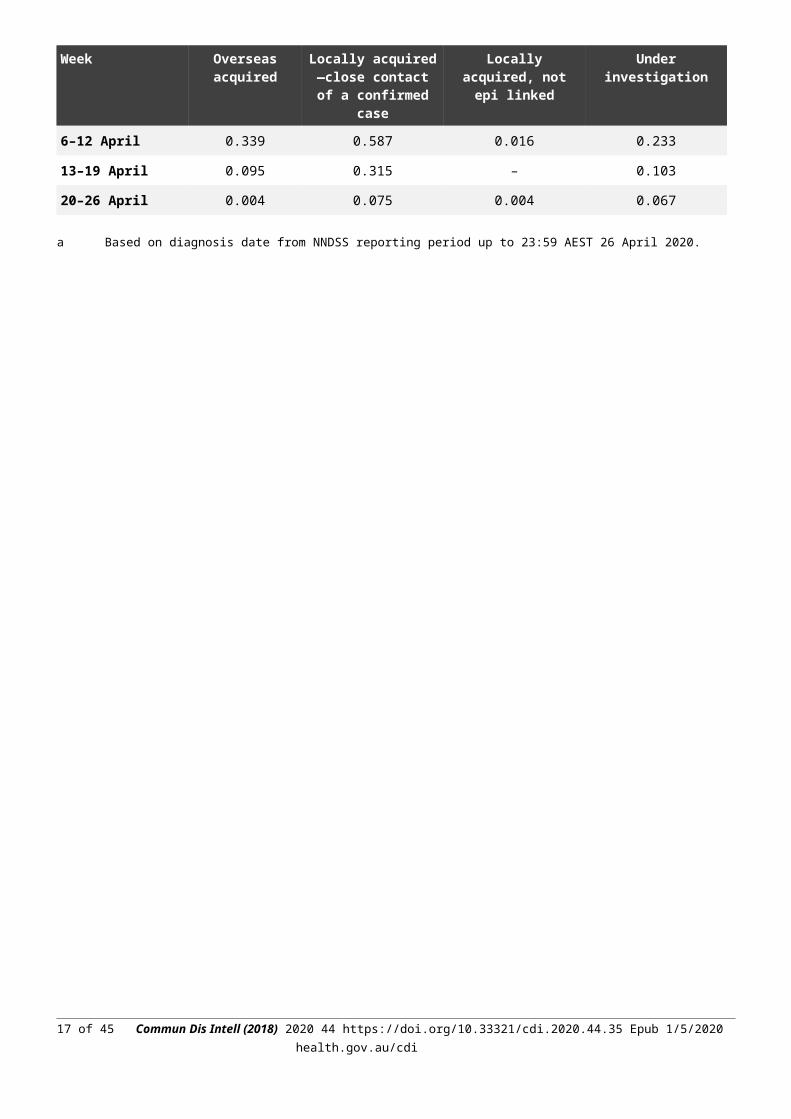
Source of infectionThe incidence rate of overseas-acquired COVID-19 cases in Australia has decreased in the last three weeks; the rate of locally-acquired cases without a known links decreased (Table 5, Figure 7 and 8).
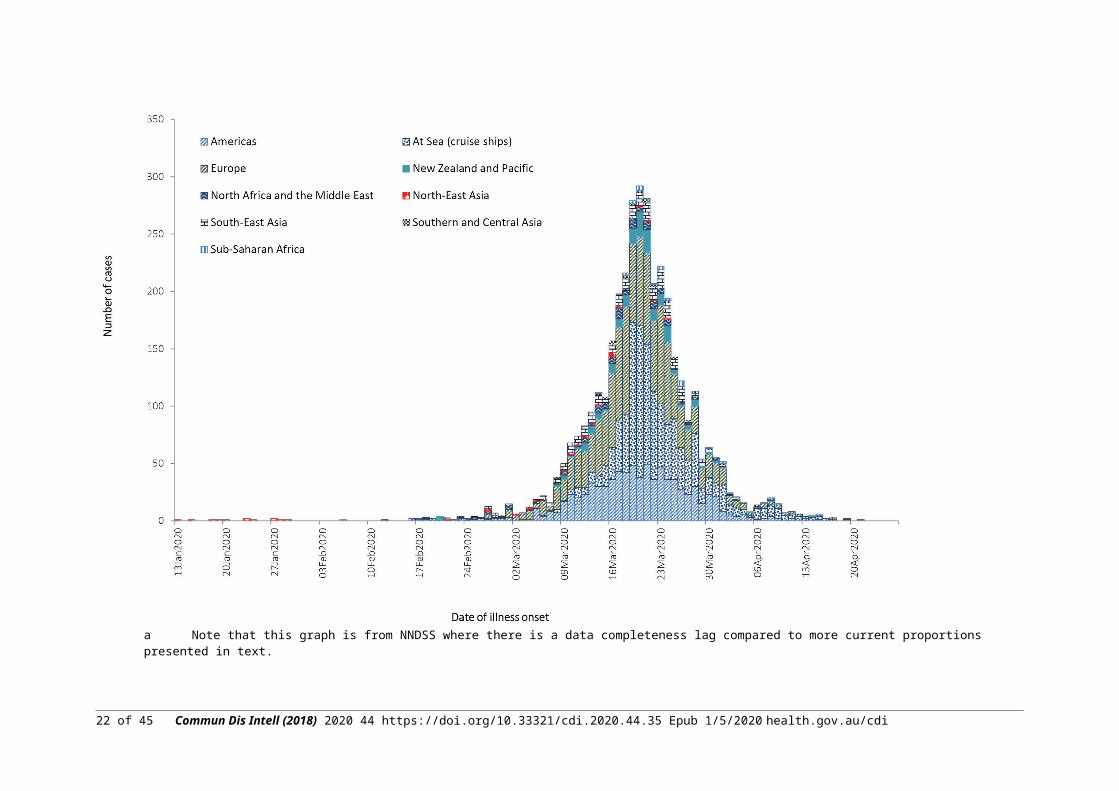
Of cases with a reported place of acquisition, 64% had a recent international travel history and 36% were considered to have been locally acquired. The majority of overseas-acquired cases continue to report a travel history to the European Region, the Americas Region or on board cruise ships (Figure 9). Of the locally-acquired cases, most were considered to be contacts of a confirmed case, with a very small proportion of cases not able to be epidemiologically linked to a confirmed case. Cases where a place of acquisition has not been reported (0.4%) are currently under public health investigation.
Table 5: Rate of weekly confirmed cases (per 100,000 population) by date of illness onseta and place of acquisition, Australia
Week Overseas acquired Locally acquired—close contact of a confirmed
case
Locally acquired, not epi linked
Under investigation
30 March – 5 April 0.950 0.840 0.032 0.599
6–12 April 0.339 0.587 0.016 0.233
13–19 April 0.095 0.315 – 0.103
20–26 April 0.004 0.075 0.004 0.067
a Based on diagnosis date from NNDSS reporting period up to 23:59 AEST 26 April 2020.
11 of 30 Commun Dis Intell (2018) 2020 44 https://doi.org/10.33321/cdi.2020.44.35 Epub 1/5/2020health.gov.au/cdi

Figure 7: Rate of weekly confirmed cases by date of illness onseta and place of acquisition, Australia
a Note that this graph is from NNDSS where there is a data completeness lag compared to more current proportions presented in text.
12 of 30 Commun Dis Intell (2018) 2020 44 https://doi.org/10.33321/cdi.2020.44.35 Epub 1/5/2020health.gov.au/cdi

13 of 30 Commun Dis Intell (2018) 2020 44 https://doi.org/10.33321/cdi.2020.44.35 Epub 1/5/2020health.gov.au/cdi

Figure 8: Number of COVID-19 cases by place of acquisition over time, Australiaa
a Note that this graph is from NNDSS where there is a data completeness lag compared to more current proportions presented in text.
14 of 30 Commun Dis Intell (2018) 2020 44 https://doi.org/10.33321/cdi.2020.44.35 Epub 1/5/2020health.gov.au/cdi
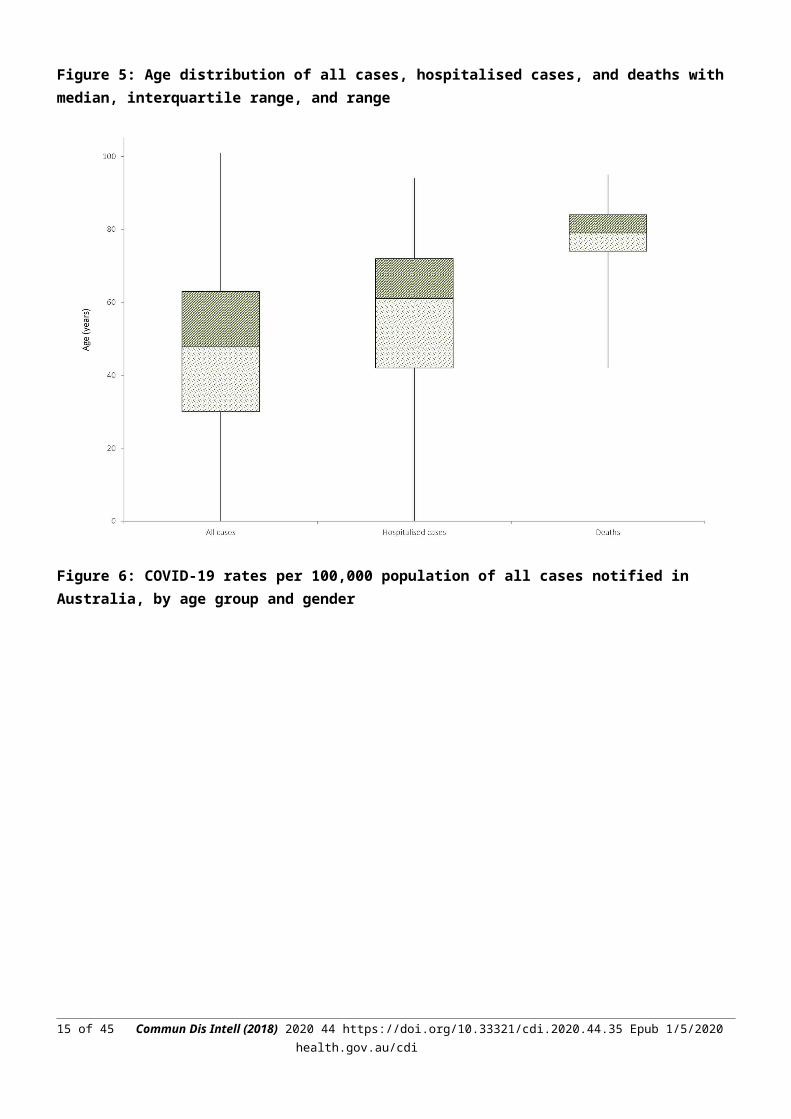
Figure 9: Confirmed cases of overseas-acquired COVID-19 infectionsa
15 of 30 Commun Dis Intell (2018) 2020 44 https://doi.org/10.33321/cdi.2020.44.35 Epub 1/5/2020health.gov.au/cdi

a Note that this graph is from NNDSS where there is a data completeness lag compared to more current proportions presented in text.
16 of 30 Commun Dis Intell (2018) 2020 44 https://doi.org/10.33321/cdi.2020.44.35 Epub 1/5/2020health.gov.au/cdi
Cluster and outbreak investigations
Investigations are taking place in states and territories in relation to a number of clusters and outbreaks of COVID-19. To date the largest outbreaks have been associated with cruise ships, with some other large domestic clusters associated with aged care and healthcare facilities and private functions, such as weddings.
Cruise ships account for a substantial proportion of cases of COVID-19 in Australia. Of cases with a reported place of acquisition, 18% (n = 1,069) were acquired at sea on a cruise ship. This is a 4% increase in COVID-19 cases acquired on a cruise ship since the last reporting period. There have been 24 deaths among cases acquired on cruise ships in Australia.
Residents of aged care facilities are at increased risk of COVID-19 infection due to the environment of communal living facilities and are more vulnerable to serious complications if they do become infected. As of 26 April 2020, there have been 103 cases of COVID-19 associated with 24 residential aged care facilities, with 28 recoveries and 16 deaths. Sixty of these cases occurred in aged care residents, with the remaining 43 cases occurring in care staff. In addition, there have been 40 cases associated with 29 Commonwealth funded aged care services that provide in-home support to older Australians, with 11 recoveries and two deaths. Twenty-nine of these cases occurred in care recipients, with the remaining eleven cases occurring in care staff. Advice and guidelines have been provided to aged care services, including the release of an outbreak management guide.
There have been instances of outbreaks of COVID-19 occurring in Australian healthcare settings. The outbreak of COVID-19 in hospitals in northwest Tasmania began in late March 2020. Cases occurred among healthcare workers, patients and household contacts. As of 27 April 2020, there were 125 persons associated with the outbreak, including 78 staff members. The outbreak resulted in widespread quarantine of healthcare workers, patients and visitors to the hospital. Investigations into the outbreak are continuing.
Symptom profileOf the symptoms reported among cases of COVID-19 in Australia, cough (69%) was the most common (Figure 10). Forty-seven percent of cases reported fever, 40% reported sore throat, and 37% reported headache. Pneumonia and/or acute respiratory disease (ARD) was reported in 3% of cases with symptoms. In addition, loss of taste was reported from 541 cases and loss of smell from 568 cases. These conditions were reported in approximately 11% of cases, noting that this is currently not a standard field in NNDSS, and is likely to under-represent those presenting with these symptoms.
17 of 30 Commun Dis Intell (2018) 2020 44 https://doi.org/10.33321/cdi.2020.44.35 Epub 1/5/2020health.gov.au/cdi
Cluster:
The term ‘cluster’ in relation to COVID-19 refers to two or more cases (who do not reside in the same household) that are epidemiologically related in time, place or person where a common source (such as an event or within a community) of infection is suspected but not yet established.
Outbreak:
The term ‘outbreak’ in relation to COVID-19 refers to two or more cases (who do not reside in the same household) among a specific group of people and/or over a specific period of time where illness is associated with a common source (such as an event or within a community).

Figure 10: Variation in combinations of COVID-19 symptoms in confirmed cases, Australiaa
a This figure shows the variation in combinations of symptoms observed in reported cases (n = 6,268) for the five most frequently observed symptoms (cough, fever, sore throat, headache, runny nose). The horizontal bars on the left show the frequency of symptom occurrence in any combination with other symptoms. The circles and lines indicate particular combinations of symptoms observed in individual patients. The vertical green bars indicate the frequency of occurrence of the corresponding combination of symptoms.
18 of 30 Commun Dis Intell (2018) 2020 44 https://doi.org/10.33321/cdi.2020.44.35 Epub 1/5/2020health.gov.au/cdi

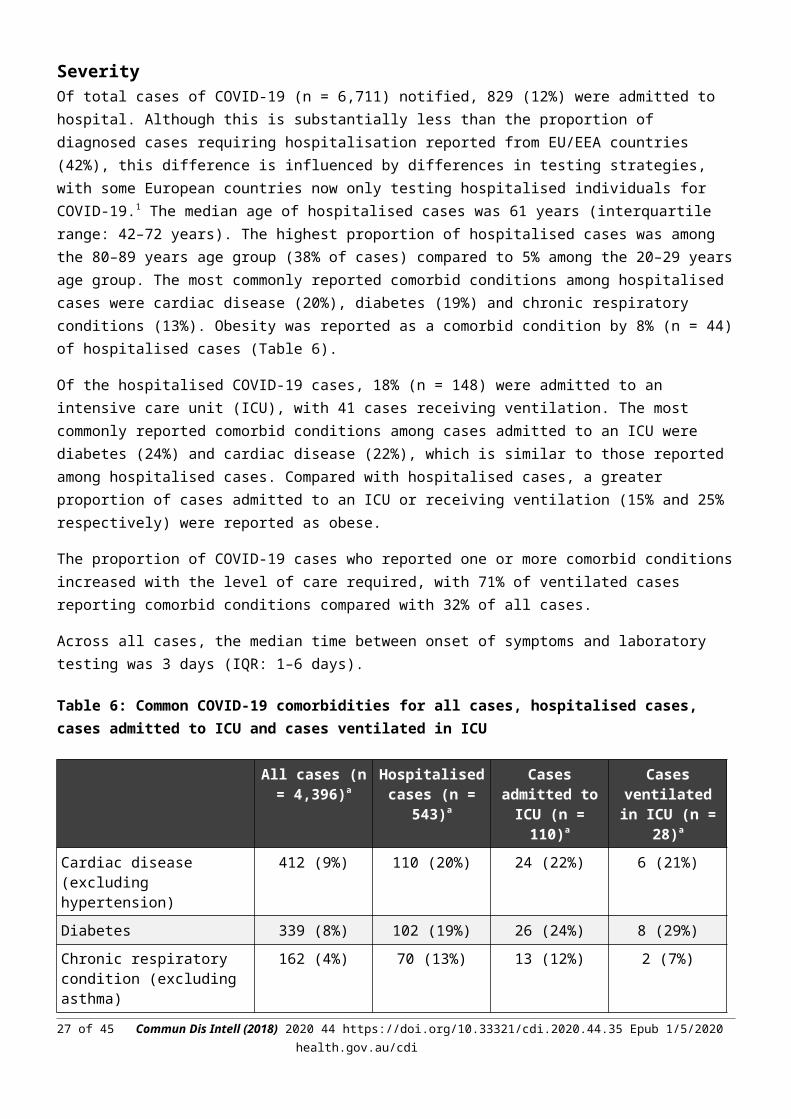
Severity Of total cases of COVID-19 (n = 6,711) notified, 829 (12%) were admitted to hospital. Although this is substantially less than the proportion of diagnosed cases requiring hospitalisation reported from EU/EEA countries (42%), this difference is influenced by differences in testing strategies, with some European countries now only testing hospitalised individuals for COVID-19.1 The median age of hospitalised cases was 61 years (interquartile range: 42–72 years). The highest proportion of hospitalised cases was among the 80–89 years age group (38% of cases) compared to 5% among the 20–29 years age group. The most commonly reported comorbid conditions among hospitalised cases were cardiac disease (20%), diabetes (19%) and chronic respiratory conditions (13%). Obesity was reported as a comorbid condition by 8% (n = 44) of hospitalised cases (Table 6).
Of the hospitalised COVID-19 cases, 18% (n = 148) were admitted to an intensive care unit (ICU), with 41 cases receiving ventilation. The most commonly reported comorbid conditions among cases admitted to an ICU were diabetes (24%) and cardiac disease (22%), which is similar to those reported among hospitalised cases. Compared with hospitalised cases, a greater proportion of cases admitted to an ICU or receiving ventilation (15% and 25% respectively) were reported as obese.
The proportion of COVID-19 cases who reported one or more comorbid conditions increased with the level of care required, with 71% of ventilated cases reporting comorbid conditions compared with 32% of all cases.
Across all cases, the median time between onset of symptoms and laboratory testing was 3 days (IQR: 1–6 days).
Table 6: Common COVID-19 comorbidities for all cases, hospitalised cases, cases admitted to ICU and cases ventilated in ICU
All cases (n = 4,396)a
Hospitalised cases (n = 543)a
Cases admitted to ICU (n = 110)a
Cases ventilated in ICU (n = 28)a
Cardiac disease (excluding hypertension)
412 (9%) 110 (20%) 24 (22%) 6 (21%)
Diabetes 339 (8%) 102 (19%) 26 (24%) 8 (29%)
Chronic respiratory condition (excluding asthma)
162 (4%) 70 (13%) 13 (12%) 2 (7%)
Obesity 182 (4%) 44 (8%) 16 (15%) 7 (25%)
One or more specified comorbiditiesb
1,388 (32%) 311 (57%) 72 (65%) 20 (71%)
a Excludes those with missing data on comorbidities or where comorbidity is unknown.
b Includes asthma, chronic respiratory conditions (excluding asthma), cardiac disease (excluding hypertension), immunosuppressive condition/therapy, diabetes, obesity, liver disease, renal disease and neurological disorder.
Seventy-seven COVID-19 associated deaths were confirmed in Australia up to 26 April 2020. The median age of cases who died was 79 years (IQR: 74–84 years). Forty-eight of the cases were male and 29 were female. The most commonly reported comorbid conditions among COVID-19 deaths were diabetes (34%), cardiac disease (28%) and chronic respiratory disease (22%). Almost three-quarters (74%) of COVID-19 associated deaths were reported to have one or more specified comorbid conditions.
19 of 30 Commun Dis Intell (2018) 2020 44 https://doi.org/10.33321/cdi.2020.44.35 Epub 1/5/2020health.gov.au/cdi

Public health responseSince COVID-19 first emerged internationally, Australia has implemented public health measures in response to the disease’s epidemiology, both overseas and in Australia. These measures are focused on domestic and international travel and public gatherings; priorities for testing and quarantining of suspected cases and close contacts; guidance on effective social distancing; and the protection of vulnerable populations such as those in residential care facilities and remote Aboriginal and Torres Strait Islander communities. Key aspects of Australia's evolving public health response are summarised in Table 7.
During the current reporting period, the Australian Health Protection Principal Committee (AHPPC) has issued advice to inform the national public health response to the pandemic including recommendations for residential aged care facilities about minimising the impact of COVID-19 with information on entry restrictions, managing illness in visitors and staff, and hygiene measures. AHPPC has also provided statements on the recommencement of kidney transplantation, updated advice regarding schools, and use of PPE in hospital with patients with COVID-19. The Australian Government has also announced the gradual ease of restrictions on elective surgery and launched a new voluntary coronavirus app called COVIDSafe to support prevention and control efforts.
20 of 30 Commun Dis Intell (2018) 2020 44 https://doi.org/10.33321/cdi.2020.44.35 Epub 1/5/2020health.gov.au/cdi

Table 7: Timeline of key COVID-19 related events, including Australian public health response activities, from 1 March to 26 April 2020
Date Event / response activity
26 April 2020 The Australian Government launches a new voluntary coronavirus app, COVIDSafe.2
24 April 2020 AHPPC provides statements on the recommencement of kidney transplantation, updated advice regarding schools, and use of PPE in hospital with patients with COVID-19.3
21 April 2020 AHPPC provides advice for residential aged care facilities about minimising the impact of COVID-19 with information on entry restrictions, managing illness in visitors and staff, and hygiene measures.4
21 April 2020 The Australian Government announces the gradual ease of restrictions on elective surgery from Tuesday 28 April 2020.5
16 April 2020 AHPPC provides advice on reducing the potential risk of COVID-19 transmission in schools.6
9 April 2020 Air crew on international flights will be required to self-isolate at their place of residence (or hotel if not in their local city) between flights or for 14 days, whichever is shorter.7
30 March 2020 Special provisions be applied to vulnerable people in the workplace and application of additional regional social distancing measures to combat COVID-19.8
29 March 2020 Both indoor and outdoor public gatherings limited to two persons only.
28 March 2020 All people entering Australia required to undertake a mandatory 14-day quarantine at designated facilities (e.g. hotels) in their port of arrival.
26 March 2020 Restricted movement into certain remote areas to protect community members from COVID-19.
24 March 2020 Temporary suspension of all non-urgent elective procedures in both the public and private sector;
Progressive scale up of social distancing measures with stronger measures in relation to non-essential gatherings, and considerations of further more intense options; and
Aged care providers limit visits to a maximum of two visitors at one time per day.
25 March 2020 School-based immunisation programs, with the exception of the delivery of meningococcal ACWY vaccine, are paused; and
Australian citizens and Australian permanent residents are restricted from travelling overseas.
21 March 2020 Qld, WA, NT and SA close borders to non-essential travellers.
20 March 2020 Travel ban on foreign nationals entering Australia; Restriction of travel to remote communities; and Tasmania closes borders to non-essential travellers.
18 March 2020 DFAT raises travel advice for all overseas destinations to Level 4 'Do Not Travel';
Continuation of a 14-day quarantine requirement for all returning travellers; and
Restrictions on indoor gatherings.
21 of 30 Commun Dis Intell (2018) 2020 44 https://doi.org/10.33321/cdi.2020.44.35 Epub 1/5/2020health.gov.au/cdi
Date Event / response activity
16 March 2020 Non-essential static gatherings of > 500 people banned.
15 March 2020 All overseas arrivals required to self-isolate for 14 days and cruise ship arrivals banned.
8 March 2020 Restrictions on COVID-19 contacts and travellers from listed higher risk countries.
5 March 2020 Restrictions on travel from Republic of Korea.
1 March 2020 Restrictions on travel from Islamic Republic of Iran.
International situation9
As at 23:59 AEST 26 April 2020, the number of confirmed COVID-19 cases reported to the World Health Organization (WHO) was 2,804,796 globally. COVID-19 was reported across a total of 216 countries, territories and areas.
Global cumulative cases reported as of 26 April 2020 were 25% higher than the total as of the previous week. The proportional rate of increase in new cases per week has been declining (Table 8).
Table 8: Global COVID-19 cases as reported to the WHO
Measures Reporting period end
5 April 2020 12 April 2020 19 April 2020 26 April 2020
Total cumulative cases 1,133,758 1,696,588 2,241,778 2,804,796
% difference from previous reporting + 78.6% + 49.6% + 32.1% + 25.1%
The reported epidemiology varies by country or region, with outbreaks following different trajectories after their first 100 cases. Figure 11 highlights that for a number of countries, their rates of increase of new cases continue to be high, particularly USA, Spain and Italy, although at a slower rate than the previous week. For Singapore and Japan, there continues to be a slow but steady rate of increase in their number of new cases, while the Republic of Korea and Hong Kong are reporting very few new cases each day. Reported case numbers will be influenced by rates of testing, case definition, and case detection as well as overall health system capacity.
Globally, 193,710 deaths have been reported. Of all deaths reported globally, approximately three-quarters have been from the USA (24%) and the European Region (notably Italy, 14%; Spain, 12%; France, 12%; and the United Kingdom, 10%). The number of deaths in Japan has increased by more than 50% in the past 5 days of the reporting period. In the Republic of Korea, there continues to be a slow increase in the number of deaths, with few new deaths reported daily, which is consistent with the broader epidemic case trends (Figure 12).
The crude case fatality rate (CFR) in Australia is 1.1%. This is substantially lower than the global WHO reported rate of 6.9%. Crude CFR is reflective not only of disease severity (with the risk of death reported to increase with age) and of health care capability in different countries, but also of case ascertainment. Cases with high severity are more likely to be detected by public health surveillance; under-ascertainment of cases with mild infections can therefore artificially inflate the reported CFR. Internationally the CFR varies by country. The low CFR in Australia is likely to be reflective of high case ascertainment.
22 of 30 Commun Dis Intell (2018) 2020 44 https://doi.org/10.33321/cdi.2020.44.35 Epub 1/5/2020health.gov.au/cdi
Figure 11: Number of COVID-19 cases (logarithmic scale) by selected country or region and days since passing 100 cases, up to 26 April 2020

Figure 12: Number of COVID-19 deaths (logarithmic scale) by selected country and days since passing 50 deaths, up to 26 April 2020
24 of 30 Commun Dis Intell (2018) 2020 44 https://doi.org/10.33321/cdi.2020.44.35 Epub 1/5/2020health.gov.au/cdi

Background
The current estimates on epidemiological parameters including severity, transmissibility and incubation period are uncertain. Estimates are likely to change as more information becomes available.
Transmission Human-to-human transmission of SARS-CoV-2 is via droplets and fomites from an infected person to a close contact.10 A virological analysis of hospitalised cases found active virus replication in upper respiratory tract tissues, with pharyngeal virus shedding during the first week of symptoms.11 However, current evidence does not support airborne or faecal-oral spread as major factors in transmission.10
Viral RNA has been identified in respiratory track specimens 1–2 days prior to symptoms onset, and has been observed after symptom cessation. In 50% of the patients, seroconversion occurred after seven days with a range of up to 14 days; this seroconversion was not followed by a rapid decline in viral load.12 However, it is unknown if detection of viral RNA correlates with shedding of live virus and transmission risk.1,12
A recent study suggests that children do not play a key role in household transmission and are unlikely to be the primary source of household infections.13 In a population-based study in Iceland, children under 10 years old had a lower incidence of SARS-CoV-2 infection than adults; 6.7% vs. 13.7% in children and adults respectively.14
Incubation period Estimates of median incubation period, based on seven published studies, are 5 to 6 days (ranging from 1 to 14 days). Patients with long incubation periods do occasionally occur; however, they are likely to be ‘outliers’ who should be studied further but who are unlikely to represent a change in epidemiology of the virus.15,16
Molecular epidemiology Since December 2019, the virus has diversified into multiple lineages as it has spread globally with some degree of geographical clustering. The whole genome sequences currently available from Australian cases are mostly in returned travellers from China, the Islamic Republic of Iran, Europe and the USA, and thereby reflect this global diversity.
Clinical features COVID-19 presents as mild illness in the majority of cases with cough and fever being the most commonly reported symptoms. Severe or fatal outcomes are more likely to occur in the elderly or those with comorbid conditions.10,17
Some COVID-19 patients show neurological signs such as headache, nausea and vomiting. There is evidence that SARS-CoV-2 viruses are not always confined to the respiratory tract and may invade the central nervous system inducing neurological symptoms. As such, it is possible that invasion of the central nervous system is partially responsible for the acute respiratory failure of COVID-19 patients.18
There is some evidence to suggest that impairment or loss of the sense of smell (hyposmia/anosmia) or taste (hypoguesia/aguesia) is associated with COVID-19.19,20 This is supported by research finding a biological mechanism for the SARS-CoV-2 virus to cause olfactory dysfunction.21,22
Examination of cases and their close contacts in China found a positive association between age and time from symptom onset to recovery. The study also found an association between clinical severity and time from symptom onset to time to recovery. Compared to people with mild disease, those with moderate and severe disease were associated with a 19% and 58% increase in time to recovery, respectively.23
25 of 30 Commun Dis Intell (2018) 2020 44 https://doi.org/10.33321/cdi.2020.44.35 Epub 1/5/2020health.gov.au/cdi
Weekly epidemiological report Communicable Diseases Intelligence
Several studies have identified cardiovascular implications resulting from COVID-19. Vascular inflammation has been observed in a number of cases and may be a potential mechanism for myocardial injury which can result in cardiac dysfunction and arrhythmias.
Recently published literature outside of Wuhan found that approximately 10% of all cases developed gastrointestinal symptoms associated with COVID-19 infection either on admission or during hospitalisation.24,25 This number is higher than the 3% previously reported in Wuhan.
Treatment Current clinical management of COVID-19 cases focuses on early recognition, isolation, appropriate infection control measures and provision of supportive care.26 Whilst there is no specific antiviral treatment currently recommended for patients with suspected or confirmed SARS-CoV-2 infection, multiple clinical trials are underway to evaluate a number of therapeutic agents, including remdesivir, lopinavir/ritonavir, and chloroquine or hydroxychloroquine.27,28
Several COVID-19 vaccines have commenced clinical trials.
Data considerations
Data were extracted from the NNDSS on 28 April 2020, by diagnosis date. Due to the dynamic nature of the NNDSS, data in this extract are subject to retrospective revision and may vary from data reported in published NNDSS reports and reports of notification data by states and territories.
Acknowledgements
This report represents surveillance data reported through CDNA as part of the nationally-coordinated response to COVID-19. We thank public health staff from incident emergency operations centres in state and territory health departments, and the Australian Government Department of Health, along with state and territory public health laboratories.
Author details
Corresponding author COVID-19 National Incident Room Surveillance Team, Australian Government Department of Health, GPO Box 9484, MDP 14, Canberra, ACT 2601. Email: [email protected]
26 of 30 Commun Dis Intell (2018) 2020 44 https://doi.org/10.33321/cdi.2020.44.35 Epub 1/5/2020health.gov.au/cdi
Weekly epidemiological report Communicable Diseases Intelligence
References
1. European Centre for Disease Prevention and Control (ECDC). Rapid risk assessment: Coronavirus disease 2019 (COVID-19) pandemic: increased transmission in the EU/EEA and the UK – eighth update. [Internet.] Solna: ECDC; 23 April 2020. Available from: https://www.ecdc.europa.eu/en/publications-data/rapid-risk-assessment-coronavirus-disease-2019-covid-19-pandemic-ninth-update.
2. Australian Government Department of Health. COVIDSafe: New app to slow the spread of coronavirus. [Internet.] Canberra: Australian Government Department of Health; 2020. [Accessed 26 April 2020.] Available from: https://www.health.gov.au/news/covidsafe-new-app-to-slow-the-spread-of-coronavirus.
3. Australian Government Department of Health. Australian Health Protection Principal Committee (AHPPC) coronavirus (COVID-19) statements on 24 April 2020. [Internet.] Canberra: Australian Government Department of Health; 2020. [Accessed 28 April 2020.] Available from: https://www.health.gov.au/news/australian-health-protection-principal-committee-ahppc-coronavirus-covid-19-statements-on-24-april-2020.
4. Australian Government Department of Health. Australian Health Protection Principal Committee (AHPPC) advice on residential aged care facilities. [Internet.] Canberra: Australian Government Department of Health; 2020. [Accessed 28 April 2020.] Available from: https://www.health.gov.au/news/australian-health-protection-principal-committee-ahppc-advice-on-residential-aged-care-facilities.
5. Australian Government Department of Health. Government eases elective surgery restrictions. [Internet.] Canberra: Australian Government Department of Health; 2020. [Accessed 28 April 2020.] Available from: https://www.health.gov.au/news/government-eases-elective-surgery-restrictions.
6. Australian Government Department of Health. Australian Health Protection Principal Committee (AHPPC) advice on reducing the potential risk of COVID-19 transmission in schools. [Internet.] Canberra: Australian Government Department of Health; 2020. [Accessed 20 April 2020.] Available from: https://www.health.gov.au/news/australian-health-protection-principal-committee-ahppc-advice-on-reducing-the-potential-risk-of-covid-19-transmission-in-schools.
7. Australian Government Department of Prime Minister and Cabinet. Media Statement, 9 April 2020. [Internet.] Canberra: Australian Government Department of Prime Minister and Cabinet; 2020. Available from: https://www.pm.gov.au/media/update-coronavirus-measures-3.
8. Australian Government Department of Health. Australian Health Protection Principal Committee (AHPPC) Advice to National Cabinet on 30 March 2020. [Internet.] Canberra: Australian Government Department of Health; 2020. [Accessed 8 April 2020.] Available from: https://www.health.gov.au/news/australian-health-protection-principal-committee-ahppc-advice-to-national-cabinet-on-30-march-2020.
9. World Health Organization (WHO). Coronavirus disease 2019 (COVID-19) situation report – 97. [Internet.] Geneva: WHO; 2020. [Accessed 28 April 2020.] Available from: https://www.who.int/docs/default-source/coronaviruse/situation-reports/20200426-sitrep-97-covid-19.pdf.
10. WHO. Report of the WHO-China joint mission on coronavirus disease 2019 (COVID-19). [Internet.] Geneva: WHO; 2020. [Accessed 1 Mar 2020.] Available from: https://www.who.int/docs/default-source/coronaviruse/who-china-joint-mission-on-covid-19-final-report.pdf.
11. Zhou F, Yu T, Du R, Fan G, Liu Y, Liu Z et al. Clinical course and risk factors for mortality of adult inpatients with COVID-19 in Wuhan, China: a retrospective cohort study. Lancet. 2020;395:1054–62.
27 of 30 Commun Dis Intell (2018) 2020 44 https://doi.org/10.33321/cdi.2020.44.35 Epub 1/5/2020health.gov.au/cdi

Weekly epidemiological report Communicable Diseases Intelligence
12. Wölfel R, Corman VM, Guggemos W, Seilmaier M, Zange S, Müller MA et al. Virological assessment of hospitalized patients with COVID-2019. Nature. 2020. doi: https://doi.org/10.1038/s41586-020-2196-x.
13. Zhu Y, Bloxham CJ, Hulme KD, Sinclair JE, Tong ZW, Steele LE et al. Children are unlikely to have been the primary source of household SARS-CoV-2 infections. medRxiv. 2020. doi: https://doi.org/10.1101/2020.03.26.20044826.
14. Gudbjartsson DF, Helgason A, Jonsson H, Magnusson OT, Melsted P, Norddahl GL et al. Spread of SARS-CoV-2 in the Icelandic population. N Engl J Med. 2020. doi: https://doi.org/10.1056/NEJMoa2006100.
15. WHO. Coronavirus disease 2019 (COVID-19) situation report – 29. [Internet.] Geneva: WHO; 2020. [Accessed 22 Feb 2020.] Available from: https://www.who.int/docs/default-source/coronaviruse/situation-reports/20200218-sitrep-29-covid-19.pdf.
16. Pung R, Chiew CJ, Young BE, Chin S, Chen M, Clapham HE. Investigation of three clusters of COVID-19 in Singapore: implications for surveillance and response measures. Lancet. 2020;395(10229):1039–46.
17. Sun P, Qiu S, Liu Z, Ren J, Xi JJ. Clinical characteristics of 50466 patients with 2019-nCoV infection. medRxiv. 2020. doi: https://doi.org/10.1101/2020.02.18.20024539.
18. Li B, Bai W, Hashikawa T. The neuroinvasive potential of SARS-CoV-2 may be at least partially responsible for the respiratory failure of COVID-19 patients. J Med Virol. 2020. doi: https://doi.org/10.1002/jmv.25728.
19. Mao L, Jin H, Wang M, Hu Y, Chen S, He Q et al. Neurological manifestations of hospitalized patients with coronavirus disease 2019 in Wuhan, China. JAMA Neurol. 2020;e201127. doi: https://doi.org/10.1001/jamaneurol.2020.1127.
20. Drew DA, Nguyen LH, Steves CJ, Wolf J, Spector TC, Chan AT. Rapid implementation of mobile technology for real-time epidemiology of COVID-19. medRxiv. 2020. doi: https://doi.org/10.1101/2020.04.02.20051334.
21. Venkatakrishnan AJ, Puranik A, Anand A, Zemmour D, Yao X, Wu X et al. Knowledge synthesis from 100 million biomedical documents augments the deep expression profiling of coronavirus receptors. bioRxiv. 2020. doi: https://doi.org/10.1101/2020.03.24.005702.
22. Brann DH, Tsukahara T, Weinreb C, Logan DW, Datta SR. Non-neural expression of SARS-CoV-2 entry genes in the olfactory epithelium suggests mechanisms underlying anosmia in COVID-19 patients. bioRxiv. 2020. doi: https://doi.org/10.1101/2020.03.25.009084.
23. Bi Q, Wu Y, Mei S, Ye C, Zou X, Zhang Z et al. Epidemiology and transmission of COVID-19 in Shenzhen China: analysis of 391 cases and 1286 of their close contacts. medRxiv. 2020. doi: https://doi.org/10.1101/2020.03.03.20028423.
24. Lin L, Jiang X, Zhang Z, Huang S, Zhang Z, Fang Z et al. Gastrointestinal symptoms of 95 cases with SARS-CoV-2 infection. Gut. 2020. doi: https://doi.org/10.1136/gutjnl-2020-321013.
25. Jin X, Lian JS, Hu JH, Gao J, Zheng L, Zhang YM et al. Epidemiological, clinical and virological characteristics of 74 cases of coronavirus-infected disease 2019 (COVID-19) with gastrointestinal symptoms. Gut. 2020. doi: https://doi.org/10.1136/gutjnl-2020-320926.
26. WHO. Clinical management of severe acute respiratory infection when novel coronavirus (nCoV) infection is suspected. [Internet.] Geneva: WHO; 2020. [Accessed 23 Feb 2020.] Available from: https://www.who.int/publications-detail/clinical-management-of-severe-acute-respiratory-infection-when-novel-coronavirus-(ncov)-infection-is-suspected.
27. Harrison C. Coronavirus puts drug re-purposing on the fast track. Nat Biotechnol. 2020. doi: https://doi.org/10.1038/d41587-020-00003-1.
28. Wang M, Cao R, Zhang L, Yang X, Liu J, Xu M et al. Remdesivir and chloroquine effectively inhibit the recently emerged novel coronavirus (2019-nCoV) in vitro. Cell Research. 2020;30;269–71.
28 of 30 Commun Dis Intell (2018) 2020 44 https://doi.org/10.33321/cdi.2020.44.35 Epub 1/5/2020health.gov.au/cdi

Weekly epidemiological report Communicable Diseases Intelligence
Appendix A: Frequently asked questions
Q: Can I request access to the COVID-19 data behind your CDI weekly reports?
A: National notification data on COVID-19 confirmed cases is collated in the National Notifiable Disease Surveillance System (NNDSS) based on notifications made to state and territory health authorities under the provisions of their relevant public health legislation.
Normally, requests for the release of data from the NNDSS requires agreement from states and territories via the Communicable Diseases Network Australia, and, depending on the sensitivity of the data sought and proposed, ethics approval may also be required.
Due to the COVID-19 response, unfortunately, specific requests for NNDSS data have been put on hold. We are currently looking into options to be able to respond to data requests in the near future.
We will continue to publish regular summaries and analyses of the NNDSS dataset and recommend the following resources be referred to in the meantime:
NNDSS summary tables: http://www9.health.gov.au/cda/source/cda-index.cfm Daily case summary of cases: https://www.health.gov.au/news/health-alerts/novel-coronavirus-2019-ncov-
health-alert/coronavirus-covid-19-current-situation-and-case-numbers Communicable Diseases Intelligence COVID-19 weekly epidemiology report:
https://www1.health.gov.au/internet/main/publishing.nsf/Content/novel_coronavirus_2019_ncov_weekly_epidemiology_reports_australia_2020.htm
State and territory public health websites.
Q: Can I request access to data at post-code level of confirmed cases?
A: Data at this level cannot be released without ethics approval and permission would need to be sought from all states and territories via the Communicable Diseases Network Australia. As noted above, specific requests for NNDSS data are currently on hold.
A GIS/mapping analysis of cases will be included in each Communicable Diseases Intelligence COVID-19 weekly epidemiology report. In order to protect privacy of confirmed cases, data in this map will be presented at SA3 level.
Q. Where can I find more detailed data on COVID-19 cases?
A: We are currently looking into ways to provide more in-depth epidemiological analyses of COVID-19 cases, with regard to transmission and severity, including hospitalisation. These analyses will continue to be built upon in future iterations of the weekly Communicable Diseases Intelligence report.
29 of 30 Commun Dis Intell (2018) 2020 44 https://doi.org/10.33321/cdi.2020.44.35 Epub 1/5/2020health.gov.au/cdi

Communicable Diseases IntelligenceISSN: 2209-6051 Online
Communicable Diseases Intelligence (CDI) is a peer-reviewed scientific journal published by the Office of Health Protection, Department of Health. The journal aims to disseminate information on the epidemiology, surveillance, prevention and control of communicable diseases of relevance to Australia.
Editor: Tanja FarmerDeputy Editor: Simon PetrieDesign and Production: Kasra YousefiEditorial Advisory Board: David Durrheim, Mark Ferson, John Kaldor, Martyn Kirk and Linda Selvey
Website: http://www.health.gov.au/cdi
ContactsCommunicable Diseases Intelligence is produced by: Health Protection Policy Branch, Office of Health Protection, Australian Government Department of HealthGPO Box 9848, (MDP 6) CANBERRA ACT 2601
Email: [email protected]
Submit an ArticleYou are invited to submit your next communicable disease related article to the Communicable Diseases Intelligence (CDI) for consideration. More information regarding CDI can be found at: http://health.gov.au/cdi. Further enquiries should be directed to: [email protected].
This journal is indexed by Index Medicus and Medline.
Creative Commons Licence - Attribution-NonCommercial-NoDerivatives CC BY-NC-ND© 2020 Commonwealth of Australia as represented by the Department of HealthThis publication is licensed under a Creative Commons Attribution-NonCommercial-NoDerivatives 4.0 International Licence from https://creativecommons.org/licenses/by-nc-nd/4.0/legalcode (Licence). You must read and understand the Licence before using any material from this publication.
RestrictionsThe Licence does not cover, and there is no permission given for, use of any of the following material found in this publication (if any):
the Commonwealth Coat of Arms (by way of information, the terms under which the Coat of Arms may be used can be found at www.itsanhonour.gov.au);
any logos (including the Department of Health’s logo) and trademarks; any photographs and images; any signatures; and any material belonging to third parties.
DisclaimerOpinions expressed in Communicable Diseases Intelligence are those of the authors and not necessarily those of the Australian Government Department of Health or the Communicable Diseases Network Australia. Data may be subject to revision.
EnquiriesEnquiries regarding any other use of this publication should be addressed to the Communication Branch, Department of Health, GPO Box 9848, Canberra ACT 2601, or via e-mail to: [email protected]
Communicable Diseases Network AustraliaCommunicable Diseases Intelligence contributes to the work of the Communicable Diseases Network Australia.http://www.health.gov.au/cdna
30 of 30 Commun Dis Intell (2018) 2020 44 https://doi.org/10.33321/cdi.2020.44.35 Epub 1/5/2020health.gov.au/cdi