covered employment and earnings state of arkansas … · 5 5 table 1. yearly comparison of covered...
TRANSCRIPT


COVERED EMPLOYMENT AND EARNINGS
STATE OF ARKANSAS CALENDAR YEAR 2004
MIKE HUCKABEE, GOVERNOR STATE OF ARKANSAS
ARTEE WILLIAMS, DIRECTOR DEPARTMENT OF WORKFORCE SERVICES
PUBLISHED BY BUREAU OF LABOR STATISTICS PROGRAMS
DEPARTMENT OF WORKFORCE SERVICES POST OFFICE BOX 2981
LITTLE ROCK, ARKANSAS 72203-2981 BERNADETTE COLEMAN, BLS PROGRAMS MANAGER
TELEPHONE: (501) 682-3159
STATE OF ARKANSAS HOME PAGE: http://www.arkansas.gov
DEPARMENT OF WORKFORCE SERVICES HOME PAGE: http://www.arkansas.gov/esd/
INTERNET SITE FOR LABOR MARKET INFORMATION: http://www.discoverarkansas.net
RELEASED: JUNE 2005

TABLE OF CONTENTS
DESCRIPTION OF DATA Page
Industry Classification 1
Definition of Covered Employment and Earnings 2
Federal Government Employment 2
County Classification 2
Significant Developments During Calendar Year 2004 3
LIST OF GRAPHS AND TABLES
Graph 1 Total Covered Employment for Selected Years, Arkansas 7
Graph 2 Total Covered Earnings, by Calendar Quarter for Selected Years, Arkansas 8
Table 1 Quarterly Comparison of Covered Employment and Wages, by Industry 5
Table 2 Total Covered Employment in Arkansas, 1997-2004 6
Table 3 Total Covered Earnings, 1997-2004 9
Table 4 Total Taxable Earnings, 1997-2004 10
Table 5 State Summary - Employment and Total Earnings, by Industry, Calendar Year 2004 11
Table 6 County Summary - Employment and Total Earnings, by Industry, Calendar Year 2004 25
Table 7 Federal Government Employment and Total Earnings in Arkansas, Calendar Year 2004 63
Table 8 Workforce Information Area – Employment and Total Earnings, by Industry, Calendar Year 2004 64
1
1
EMPLOYMENT AND EARNINGS UNDER THE ARKANSAS EMPLOYMENT SECURITY LAW
CALENDAR YEAR 2004 DESCRIPTION OF DATA This publication contains covered employment and payroll data by industry and county for the Calendar Year 2004. These data are compiled from quarterly contribution and wage reports submitted by employers subject to the Arkansas Employment Security Law. An employing unit is a single physical location where business is conducted, production takes place, or services are provided. Employment data have been tabulated for each month of the quarter by industry under the North American Industry Classification System (NAICS) (see "Industry Classification" below) on a statewide, county and workforce area basis. Payroll data represent the total wages paid during the quarter, and are also shown by
industry for the State and by publishable industry groups for each county and workforce area. The tabulation of this data is a joint effort in conjunction with the U.S. Bureau of Labor Statistics. In addition, there are tables included which set out total covered employment by months, quarterly payrolls, and average weekly earnings for the years 1997 through 2004. Data contained in this publication are subject to revision. These revisions will be reflected in the 2005 First Quarter Covered Employment and Earnings publication. Because of industry code changes between years, substantial employment and wage shifts among industries are anticipated. .
INDUSTRY CLASSIFICATION Previously published industry data will not be comparable in all instances with currently published data since industry codes have been revised according to the following Manuals: (a) between January 1, 1958 and December 31, 1967, industry codes were assigned under the 1957 Standard Industrial Classification (SIC) Manual; (b) between January 1, 1968 and December 31, 1974, industry codes were assigned under the 1967 Standard Industrial Classification (SIC) Manual; (c) between January 1, 1975 and December 31, 1987, industry codes were assigned under the 1972 Standard Industrial Classification (SIC) Manual; (d) between January 1, 1988 and December 31, 2000, industry codes were assigned under the 1987 Standard Industrial Classification (SIC) Manual; and (e) since January 1, 2001, industry codes have been assigned under the 2002 North American Industry Classification System (NAICS) Manual. The NAICS Manual represents a significant change in coding methodology as compared to the
SIC Manual. One of the most significant changes involves how NAICS treats auxiliary units. Auxiliary units are establishments primarily engaged in performing management or support services for other establishments of the same enterprise. The SIC code for these units was based on the activity of the enterprise served. The NAICS code is based on the actual activities that the establishment performs. Comparisons of many industries should not be made between this publication and previous Covered Employment and Earnings publications that were based on SIC. Even though some titles are the same or similar, in nature, NAICS and SIC could differ in the classification of employers. The implementation of NAICS represents a profound change for statistical programs, and will create significant benefits along with transition obstacles for both data collectors and data users. A summary is available on the NAICS home page at http://www.census.gov/naics.

2
2
DEFINITION OF COVERED EMPLOYMENT AND EARNINGS Covered Employment is the number of workers employed by employers subject to the Arkansas Employment Security Law who worked or received pay for the payroll period including the 12th of the month. An employer is subject to the law when they employ one or more employees in each of ten days during the current or preceding calendar year. Currently excluded from coverage is employment covered by the Railroad Unemployment Insurance Act, some domestic service workers, employees of small agricultural establishments, self-employed and unpaid family workers, insurance and real estate
agents who are on commission only, and employees of churches and religious organizations except separately incorporated schools. The payroll information in this publication includes all wages and salaries paid to any covered employees by their employers including bonuses, commissions, and cash values of remuneration received in any medium other than cash. These wages include both taxable and nontaxable wages. Only the first $10,000 paid to each worker by an employer in the calendar year is taxable under the Arkansas Employment Security Law.
FEDERAL GOVERNMENT EMPLOYMENT Table 7 on page 63 lists the total number of civilians employed by the Federal Government in Arkansas during the Calendar Year 2004. Employment and wage data are set out by industry divisions. These data are obtained from required reports submitted by various
government agencies having employment in the State. Civilian Federal workers are covered by the Unemployment Compensation for Federal Employees (UCFE) program.
COUNTY CLASSIFICATION Employment and payroll data by county are classified according to the county where the workers are employed. Employers with operations in more than one county are requested to furnish this agency with a breakdown of employment and wages for at least one quarter of each year by the counties in which they operate. Many such employers submit county data with each regular contribution report. Note: This information is invaluable in the preparation of monthly employment and payroll data by county.
Employment and payroll data for multi - area employers who do not furnish county data each quarter of the year, are prorated by county on the basis of one quarter's information. The "rest-of-state" table that appears on page 62 of this publication includes data on firms that did not provide a county breakdown of employment and payrolls. It also includes sales, and all other type of personnel with no permanent place of work, as well as employment of employers with no established place of business in Arkansas. .

3
3
SIGNIFICANT DEVELOPMENTS DURING CALENDAR YEAR 2004 AVERAGE EMPLOYMENT CHANGES
Covered employment averaged 1,108,654 during the Calendar Year 2004 (see table 1), an increase of 13,720 (+1.25%) from the previous year and 2,635 from 2001 above the average recorded previously. 2001 was the first year in Arkansas that average employment recorded a decline since 1982. This is the first year Arkansas has seen a recovery from the loss in employment from this time three years ago. This provides an indication that the economy in Arkansas is starting to recover from the recession in 2001.
Eight of the eleven major industries recorded gains over the year. Professional & Business Services added 4,400 jobs. The majority of the increase occurred within the computer and employment sectors. Education & Health Services had a jump in employment to 136,650 an increase of 3,125 jobs. Doctors offices (+910), individual & family services (+890), and child day care services (+321) all contributed to the gain in employment. Leisure & Hospitality added an additional 2,819 jobs. Accommodation & Food Services accounted for 99.0 percent of the increase. This large jump was driven by the food industries (+2,484). Three major industries experienced losses this year. The most significant loss occurred in the Manufacturing industry (-2,112). Sectors within the manufacturing group have continued to close up, downsize, and layoff workers. Slight losses occurred in Information (-152) and Other Services (-63). Pulaski ranked first among the counties in covered employment, averaging 232,134 during 2004. Second ranked Benton County averaged 84,172 followed by Washington County with 83,989. Sebastian and Craighead Counties averaged 70,907 and 39,853, respectively, to make the top five among the seventy-five counties in Arkansas . .
AVERAGE COVERED EMPLOYMENT BY NAICS GROUP
Information2%
Financial Activities4%
Professional & Business Services
10%
Education & Health Services
12%
Leisure & Hospitality8%
State & Local Government
15%
Natural Resources & Mining
2%
Manufacturing18%
Trade, Transportation & Utilities
22%
Other Services2%
Construction5%
4
4
$560.26
$639.55
$589.15
$550.76
$745.30
$711.26
$700.79
$599.10
$211.39
$428.54
$578.02
$0.00 $100.00 $200.00 $300.00 $400.00 $500.00 $600.00 $700.00 $800.00
Natural Resources & Mining
Manufacturing
Construction
Trade, Transportation & Utilities
Information
Financial Activities
Professional & Business Services
Education & Health Services
Leisure & Hospitality
Other Services
State & Local Government
AVERAGE WEEKLY WAGE BY NAICS GROUP
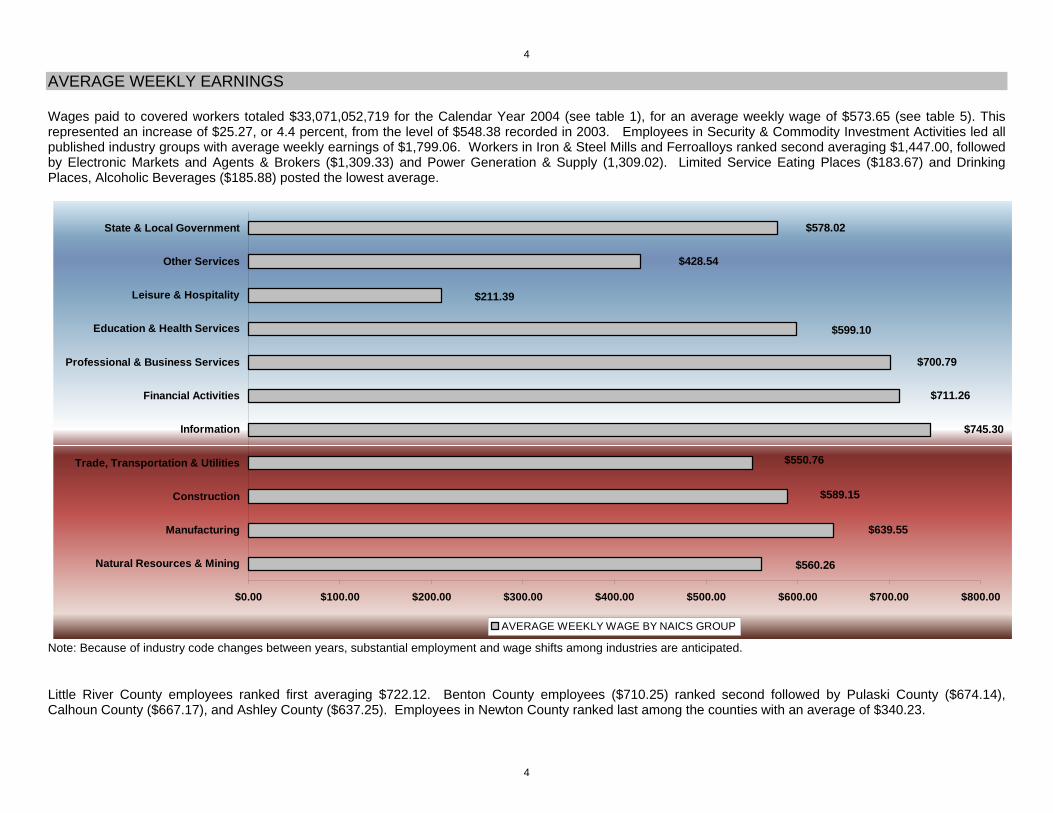
AVERAGE WEEKLY EARNINGS Wages paid to covered workers totaled $33,071,052,719 for the Calendar Year 2004 (see table 1), for an average weekly wage of $573.65 (see table 5). This represented an increase of $25.27, or 4.4 percent, from the level of $548.38 recorded in 2003. Employees in Security & Commodity Investment Activities led all published industry groups with average weekly earnings of $1,799.06. Workers in Iron & Steel Mills and Ferroalloys ranked second averaging $1,447.00, followed by Electronic Markets and Agents & Brokers ($1,309.33) and Power Generation & Supply (1,309.02). Limited Service Eating Places ($183.67) and Drinking Places, Alcoholic Beverages ($185.88) posted the lowest average.
Note: Because of industry code changes between years, substantial employment and wage shifts among industries are anticipated. Little River County employees ranked first averaging $722.12. Benton County employees ($710.25) ranked second followed by Pulaski County ($674.14), Calhoun County ($667.17), and Ashley County ($637.25). Employees in Newton County ranked last among the counties with an average of $340.23.

5
5
TABLE 1. YEARLY COMPARISON OF COVERED EMPLOYMENT AND WAGES, BY INDUSTRY
North American Industry Number of Average Net Change AverageClassification System Employing Covered % of From Total Earnings % of WeeklyIndustry Group Units Employment Total 2,003 2004 Total Earnings
Total 74,881 1,108,654 100.0 13,720 33,071,052,719 100.0 $573.65 Natural Resources & Mining 2,355 18,649 1.7 337 543,315,282 1.6% $560.26 Agriculture, Forestry, Fishing & Hunting 2,034 14,716 1.3 69 378,328,636 1.1% $494.40 Mining 321 3,933 0.4 268 164,986,646 0.5% $806.72 Construction 7,308 51,407 4.6 480 1,574,893,584 4.8% $589.15 Manufacturing 3,590 203,702 18.4 -2,112 6,774,424,603 20.5% $639.55 Trade, Transportation & Utilities 20,750 237,807 21.5 2,163 6,810,550,716 20.6% $550.75 Wholesale Trade 6,052 45,939 4.1 1,349 2,002,497,428 6.1% $838.28 Retail Trade 11,448 130,724 11.8 1,716 2,550,447,082 7.7% $375.20 Transportation & Warehousing 2,926 54,614 4.9 -720 1,859,452,208 5.6% $654.75 Utilities 324 6,530 0.6 -182 398,153,998 1.2% $1,172.56 Information 1,208 20,183 1.8 -152 782,203,784 2.4% $745.30 Financial Activities 7,420 49,182 4.4 674 1,819,026,060 5.5% $711.26 Finance & Insurance 4,400 35,940 3.2 189 1,493,293,683 4.5% $799.03 Real Estate & Rental & Leasing 3,020 13,242 1.2 485 325,732,377 1.0% $473.05 Professional & Business Services 9,990 108,091 9.7 4,400 3,938,956,435 11.9% $700.79 Professional & Technical Services 6,231 33,698 3.0 2,909 1,483,122,423 4.5% $846.39 Management of Companies & Enterprises 474 22,799 2.1 -782 1,483,322,376 4.5% $1,251.17 Administrative & Waste Services 3,093 48,818 4.4 -503 862,378,379 2.6% $339.71 Education & Health Services 7,793 136,650 12.3 3,125 4,257,171,676 12.9% $599.11 Educational Services 503 8,000 0.7 164 201,454,462 0.6% $484.27 Health Care & Social Assistance 7,290 128,650 11.6 2,961 4,055,717,214 12.3% $606.25 Leisure & Hospitality 5,792 90,993 8.2 2,819 1,000,212,053 3.0% $211.39 Arts, Entertainment & Recreation 880 9,133 0.8 29 126,461,299 0.4% $266.28 Accommodation & Food Services 4,912 81,860 7.4 2,790 873,750,754 2.6% $205.26 Other Services 5,493 25,775 2.3 -63 574,377,553 1.7% $428.54 State & Local Government 3,182 166,215 15.0 2,048 4,995,920,973 15.1% $578.02 Local Government 1,980 107,261 9.7 1,383 2,975,389,154 9.0% $533.46 State Government 1,202 58,954 5.3 665 2,020,531,819 6.1% $659.10 Nonclassifiable Establishments 0 0 0 0 0 0 $0.00
Note: Items do not necessarily add to totals because of rounding. Because of industry code changes between years, substantial employment and wage shifts among industries are anticipated.

6
6
TABLE 2. TOTAL COVERED EMPLOYMENT IN ARKANSAS Period 1997 1998 1999 2000 2001 2002 2003 2004
Average 1,057,350 1,073,732 1,092,351 1,108,490 1,106,053 1,098,558 1,094,904 1,108,654
January 1,025,949 1,050,970 1,065,920 1,089,956 1,096,009 1,081,635 1,082,740 1,089,798 February 1,034,361 1,057,593 1,074,315 1,096,126 1,101,616 1,086,793 1,084,880 1,094,946 March 1,046,551 1,066,099 1,084,653 1,109,157 1,112,143 1,098,500 1,092,172 1,105,592 April 1,057,633 1,074,416 1,093,574 1,111,543 1,115,526 1,103,399 1,095,341 1,111,410 May 1,067,078 1,083,133 1,098,539 1,116,779 1,119,815 1,111,998 1,103,099 1,117,470 June 1,066,728 1,086,125 1,101,748 1,121,245 1,119,734 1,112,028 1,099,688 1,117,324 July 1,028,510 1,046,396 1,062,563 1,075,096 1,071,830 1,065,697 1,056,155 1,071,561 August 1,050,656 1,063,680 1,081,260 1,096,841 1,094,068 1,086,011 1,080,681 1,094,977 September 1,075,759 1,088,772 1,108,212 1,123,735 1,115,996 1,113,148 1,108,905 1,122,823 October 1,079,093 1,089,836 1,110,604 1,122,884 1,110,994 1,108,447 1,112,900 1,123,901 November 1,076,715 1,087,855 1,112,003 1,120,620 1,109,012 1,107,611 1,110,041 1,125,910 December 1,079,166 1,089,913 1,114,823 1,117,892 1,105,887 1,107,425 1,112,243 1,128,139

7
7
AVERAGE TOTAL COVERED EMPLOYMENT GRAPH 1 In Thousands
1030
1040
1050
1060
1070
1080
1090
1100
1110
1120
1997 1998 1999 2000 2001 2002 2003 2004
8
8
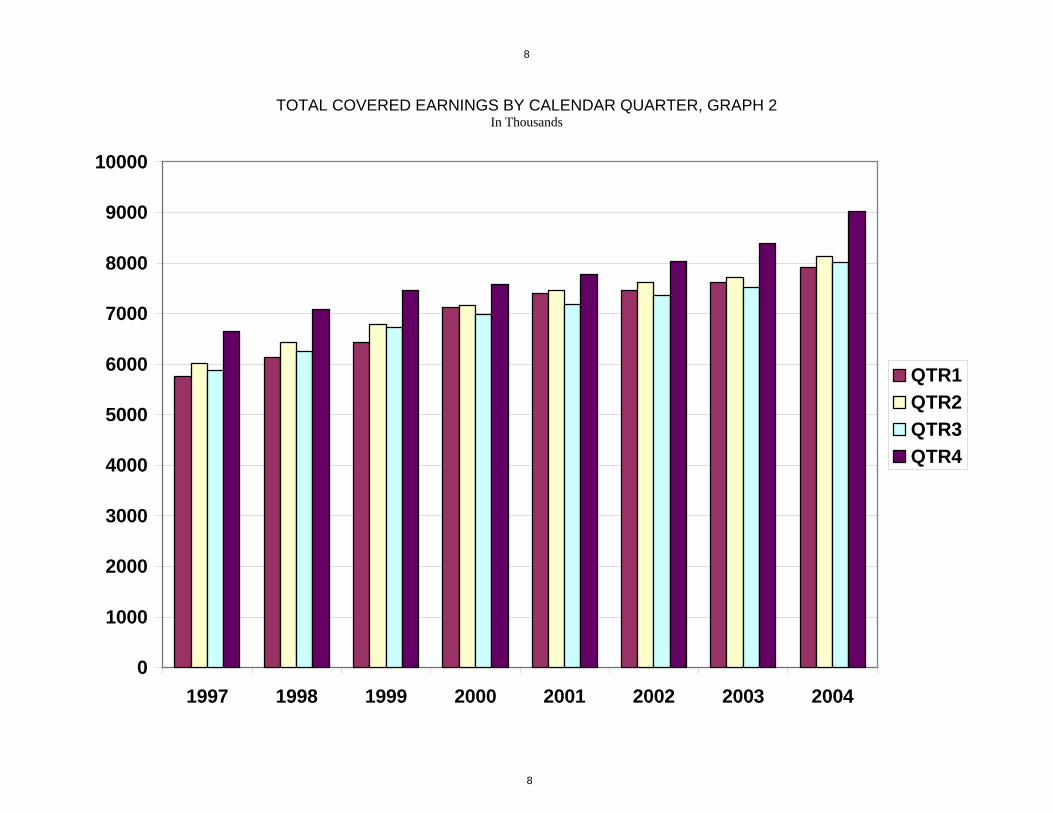
TOTAL COVERED EARNINGS BY CALENDAR QUARTER, GRAPH 2 In Thousands
0
1000
2000
3000
4000
5000
6000
7000
8000
9000
10000
1997 1998 1999 2000 2001 2002 2003 2004
QTR1QTR2QTR3QTR4

9
9
TABLE 3. TOTAL COVERED EARNINGS, 1997 - 2004
Period 1997 1998 1999 2000
Total $24,296,555,335 $25,914,345,060 $27,407,925,462 $28,853,825,155
January - March 5,751,056,136 6,145,178,755 6,418,456,638 7,122,666,917 April - June 6,021,537,518 6,441,129,069 6,791,960,679 7,166,110,114
July - September 5,877,681,886 6,246,775,598 6,733,480,079 6,986,103,157 October - December 6,646,279,795 7,081,261,638 7,464,028,066 7,578,944,967
Average Weekly
Earnings 441.90 464.13 482.51 500.57
Period 2001 2002 2003 2004
Total $29,807,669,666 $30,472,854,103 $31,226,612,657 $33,071,052,719
January - March 7,398,887,532 7,465,250,305 7,608,130,008 7,920,073,954 April - June 7,448,023,298 7,621,878,775 7,714,813,038 8,123,965,587
July - September 7,177,293,061 7,361,666,511 7,522,456,991 8,010,924,124 October - December 7,783,465,775 8,024,058,512 8,381,212,620 9,016,089,054
Average Weekly
Earnings 518.26 533.44 548.46 573.65

10
10
TABLE 4. TOTAL TAXABLE EARNINGS, 1997 - 2004
Period 1997 1998 1999 2000
Total $8,262,066,213 $8,554,973,370 $8,807,445,422 $9,048,033,534
January - March 3,871,667,342 4,063,795,529 4,203,067,856 4,560,814,012 April - June 2,223,918,770 2,271,303,325 2,325,649,764 2,260,741,187
July - September 1,208,701,615 1,236,054,184 1,267,562,743 1,250,850,348 October - December 957,778,486 983,820,332 1,011,165,059 975,627,987
Period 2001 2002 2003 2004
Total $9,003,189,480 $8,887,270,978 $9,155,945,780 $9,735,009,666
January - March 4,670,296,360 4,668,534,587 4,737,918,796 4,932,839,735 April - June 2,219,485,263 2,162,971,435 2,270,519,362 2,452,278,332
July - September 1,190,098,737 1,158,197,858 1,188,784,400 1,318,301,555 October - December 923,309,120 897,567,098 958,723,222 1,031,590,044

11
TABLE 5. STATEWIDE SUMMARY EMPLOYMENT AND TOTAL EARNINGS, BY INDUSTRY
CALENDAR YEAR 2004 AVERAGE AVERAGE TOTAL EARNINGS AVERAGE NORTH AMERICAN INDUSTRY CLASSIFICATION SYSTEM EMPLOYING COVERED WEEKLY INDUSTRY GROUPS UNITS EMPLOYMENT EARNINGS
*Note: Totals may not add due to rounding.
11
TOTAL, ALL INDUSTRIES 74,881 1,108,654 $33,071,052,719 $573.65
NATURAL RESOURCES & MINING 2,355 18,649 $543,315,282 $560.26 11 AGRICULTURE, FORESTRY, FISHING & HUNTING 2,034 14,716 $378,328,636 $494.40 111 CROP PRODUCTION 721 3,928 $80,357,515 $393.42 1111 Oilseed and Grain Farming 430 2,027 41,562,750 $394.32 1112 Vegetable and Melon Farming 8 134 1,610,496 $231.13 1113 Fruit and Tree Nut Farming 10 84 1,413,667 $323.64 1114 Greenhouse & Nursery Production 50 340 7,979,774 $451.34 1119 Other Crop Farming 224 1,342 27,790,828 $398.24
112 ANIMAL PRODUCTION 266 3,848 $115,176,581 $575.61 1121 Cattle Ranching and Farming 76 395 10,056,085 $489.59 1123 Poultry and Egg Production 94 2,643 82,410,912 $599.63 1125 Animal Aquaculture 66 572 16,092,486 $541.03
Other 30 239 6,617,098 $532.43 113 FORESTRY AND LOGGING 591 3,446 $93,430,536 $521.40 1131 Timber Tract Operations 45 268 8,942,134 $641.66 1132 Forest Nurseries & Gathering of Forest Products 6 30 970,918 $622.38 1133 Logging 540 3,148 83,517,484 $510.20
OTHER 457 3,495 $89,364,004 $491.71 21 MINING 321 3,933 $164,986,646 $806.72 211 OIL AND GAS EXTRACTION 73 372 $18,659,278 $964.60 212 MINING (EXCEPT OIL AND GAS) 111 2,041 $80,890,109 $762.17 213 SUPPORT ACTIVITIES FOR MINING 137 1,520 $65,437,259 $827.90

12
TABLE 5. STATEWIDE SUMMARY EMPLOYMENT AND TOTAL EARNINGS, BY INDUSTRY
CALENDAR YEAR 2004 AVERAGE AVERAGE TOTAL EARNINGS AVERAGE NORTH AMERICAN INDUSTRY CLASSIFICATION SYSTEM EMPLOYING COVERED WEEKLY INDUSTRY GROUPS UNITS EMPLOYMENT EARNINGS
*Note: Totals may not add due to rounding.
12
CONSTRUCTION 7,308 51,407 $1,574,893,584 $589.15 236 CONSTRUCTION OF BUILDINGS 1,933 11,778 $393,874,243 $643.11 2361 Residential Building Construction 1,332 4,034 111,867,541 $533.29 2362 Nonresidential Building Construction 601 7,744 282,006,702 $700.31
237 HEAVY & CIVIL ENGINEERING CONSTRUCTION 901 9,684 $316,152,610 $627.83 2371 Utility System Construction 427 4,751 151,048,016 $611.40 2372 Land Subdivision 119 377 13,369,852 $682.00 2373 Highway, Street & Bridge Construction 245 3,767 124,734,985 $636.78 2379 Other Heavy Construction 110 789 26,999,757 $658.08
238 SPECIALTY TRADE CONTRACTORS 4,475 29,946 $864,866,731 $555.40 2381 Building Foundation & Exterior Contractors 900 5,826 149,451,326 $493.32 2382 Building Equipment Contractors 1,934 14,300 459,775,553 $618.31 2383 Building Finishing Contractors 835 4,910 128,027,541 $501.44 2389 Other Specialty Trade Contractors 806 4,911 127,612,311 $499.71
MANUFACTURING 3,590 203,702 $6,774,424,603 $639.55 311 FOOD MANUFACTURING 295 51,708 $1,386,681,198 $515.72 3111 Animal Food Manufacturing 50 1,375 61,964,441 $866.64 3112 Grain and Oilseed Milling 30 2,440 80,471,844 $634.24 3114 Fruit, Vegetable & Specialty Food 39 6,588 210,787,578 $615.30 3115 Dairy Product Manufacturing 11 721 24,464,391 $652.52 3116 Animal Slaughtering & Processing 88 35,263 840,346,402 $458.29 3118 Bakeries and Tortilla Manufacturing 50 3,355 106,358,401 $609.64 3119 Other Food Manufacturing 19 1,769 58,866,899 $639.94
Other 9 197 3,421,242 $333.98 312 BEVERAGE & TOBACCO PRODUCT MFG. 38 1,252 $45,032,524 $691.70 313 TEXTILE MILLS 14 364 $15,182,442 $802.12 3132 Fabric Mills 4 302 13,770,218 $876.86 3133 Textile & Fabric Finishing Mills 10 62 1,412,224 $438.03

13
TABLE 5. STATEWIDE SUMMARY EMPLOYMENT AND TOTAL EARNINGS, BY INDUSTRY
CALENDAR YEAR 2004 AVERAGE AVERAGE TOTAL EARNINGS AVERAGE NORTH AMERICAN INDUSTRY CLASSIFICATION SYSTEM EMPLOYING COVERED WEEKLY INDUSTRY GROUPS UNITS EMPLOYMENT EARNINGS
*Note: Totals may not add due to rounding.
13
314 TEXTILE PRODUCT MILLS 60 1,594 $55,075,235 $664.45 315 APPAREL MANUFACTURING 38 2,118 $43,668,420 $396.50 3152 Cut & Sew Apparel Manufacturing 30 856 16,447,280 $369.50
Other 9 1,262 27,221,140 $414.80 316 LEATHER & ALLIED PRODUCT MANUFACTURING 21 2,534 $54,027,730 $410.02 3162 Footwear Manufacturing 10 2,331 48,461,197 $399.81 3169 Other Leather Product Manufacturing 11 204 5,566,533 $524.75
321 WOOD PRODUCT MANUFACTURING 401 13,888 $420,626,148 $582.44 3211 Sawmills and Wood Preservation 187 6,205 196,758,464 $609.80 3212 Veneer & Engineered Wood Products 48 3,290 114,491,000 $669.22 3219 Other Wood Product Manufacturing 166 4,392 109,376,684 $478.92
322 PAPER MANUFACTURING 87 12,226 $591,224,348 $929.96 3221 Pulp, Paper & Paperboard Mills 12 4,774 300,374,590 $1,209.98 3222 Converted Paper Product Manufacturing 75 7,452 290,849,758 $750.57
323 PRINTING & RELATED SUPPORT ACTIVITIES 307 4,775 $157,251,978 $633.31 324 PETROLEUM AND COAL PRODUCTS MFG. 23 949 $46,146,405 $935.12 325 CHEMICAL MANUFACTURING 118 5,140 $247,946,032 $927.66 3251 Basic Chemical Manufacturing 25 1,608 86,511,403 $1,034.63 3252 Resin, Rubber & Artificial Fibers 8 293 14,918,736 $979.18 3253 Agricultural Chemical Manufacturing 23 453 21,787,641 $924.93 3254 Pharmaceutical & Medicine Manufacturing 13 128 4,259,775 $639.99 3255 Paint, Coating & Adhesive Manufacturing 8 204 9,430,525 $889.00 3256 Cleaning Compound & Toiletry Manufacturing 18 1,075 46,689,749 $835.24 3259 Other Chemical Preparation Manufacturing 25 1,379 64,348,203 $897.36
326 PLASTICS & RUBBER PRODUCTS MFG. 181 13,125 $477,408,175 $699.50 3261 Plastics Product Manufacturing 138 7,644 234,089,350 $588.92 3262 Rubber Product Manufacturing 43 5,482 243,318,825 $853.56

14
TABLE 5. STATEWIDE SUMMARY EMPLOYMENT AND TOTAL EARNINGS, BY INDUSTRY
CALENDAR YEAR 2004 AVERAGE AVERAGE TOTAL EARNINGS AVERAGE NORTH AMERICAN INDUSTRY CLASSIFICATION SYSTEM EMPLOYING COVERED WEEKLY INDUSTRY GROUPS UNITS EMPLOYMENT EARNINGS
*Note: Totals may not add due to rounding.
14
327 NONMETALLIC MINERAL PRODUCT MFG. 253 4,448 $153,119,612 $662.01 3271 Clay Product & Refractory Manufacturing 20 523 17,695,781 $650.68 3272 Glass & Glass Product Manufacturing 14 403 13,391,707 $639.04 3273 Cement & Concrete Product Manufacturing 186 2,626 86,567,544 $633.95 3274 Lime & Gypsum Product Manufacturing 3 393 17,418,604 $852.35 3279 Other Nonmetallic Mineral Products 30 503 18,045,976 $689.94
331 PRIMARY METAL MANUFACTURING 67 8,095 $378,603,125 $899.42 3311 Iron & Steel Mills and Ferroalloys 7 2,067 155,529,521 $1,447.00 3312 Purchased Steel Product Manufacturing 13 2,231 81,101,174 $699.08 3313 Alumina & Aluminum Production 21 1,724 73,467,631 $819.51 3314 Other Nonferrous Metal Production 10 709 23,448,688 $636.02 3315 Foundries 16 1,364 45,056,111 $635.24
332 FABRICATED METAL PRODUCT MANUFACTURING 566 17,750 $617,389,210 $668.89 3321 Forging & Stamping 16 820 26,224,776 $615.03 3322 Cutlery & Hand Tool Manufacturing 18 1,286 41,170,585 $615.66 3323 Architectural & Structural Metals 179 4,956 173,193,792 $672.04 3324 Boilers, Tanks & Shipping Containers 20 1,104 40,647,922 $708.05 3325 Hardware Manufacturing 11 469 14,144,207 $579.97 3326 Spring & Wire Product Manufacturing 17 914 25,720,885 $541.17 3327 Machine Shops & Threaded Products 200 1,636 50,895,369 $598.26 3328 Coating, Engraving & Heat Treating Metals 36 979 29,214,208 $573.86 3329 Other Fabricated Metal Product Manufacturing 71 5,587 216,177,466 $744.10
333 MACHINERY MANUFACTURING 255 13,971 $469,816,401 $646.69 3331 Agri., Construction & Mining Machinery 38 2,945 70,416,174 $459.82 3333 Commercial & Service Industry Machinery 25 1,048 40,905,715 $750.62 3334 HVAC & Commercial Refrigeration Equipment 26 4,372 161,875,878 $712.03 3335 Metalworking Machinery Manufacturing 83 1,521 55,658,451 $703.72 3339 Other General Purpose Machinery Manufacturing 53 3,224 106,871,039 $637.47
Other 31 861 34,089,144 $761.39

15
TABLE 5. STATEWIDE SUMMARY EMPLOYMENT AND TOTAL EARNINGS, BY INDUSTRY
CALENDAR YEAR 2004 AVERAGE AVERAGE TOTAL EARNINGS AVERAGE NORTH AMERICAN INDUSTRY CLASSIFICATION SYSTEM EMPLOYING COVERED WEEKLY INDUSTRY GROUPS UNITS EMPLOYMENT EARNINGS
*Note: Totals may not add due to rounding.
15
334 COMPUTER & ELECTRONIC PRODUCT MFG. 71 6,182 $205,147,651 $638.17 3343 Audio & Video Equipment Manufacturing 10 1,604 48,034,113 $575.89 3344 Semiconductors & Electronic Components 24 1,967 66,461,319 $649.77 3345 Electronic Instrument Manufacturing 24 1,306 38,902,577 $572.84
Other 13 1,306 51,749,642 $762.01 335 ELECTRICAL EQUIPMENT & APPLIANCES 69 12,964 $469,139,010 $695.92 3353 Electrical Equipment Manufacturing 29 5,160 185,458,133 $691.18
Other 40 7,804 283,680,877 $699.05 336 TRANSPORTATION EQUIPMENT MANUFACTURING 184 16,200 $536,932,410 $637.38 3362 Motor Vehicle Body & Trailer Manufacturing 46 3,318 102,693,612 $595.20 3363 Motor Vehicle Parts Manufacturing 68 7,150 216,647,163 $582.70 3364 Aerospace Product & Parts Manufacturing 31 3,111 141,761,412 $876.30 3366 Ship & Boat Building 23 1,679 44,418,895 $508.76
Other 17 944 31,411,328 $639.90 337 FURNITURE & RELATED PRODUCT MFG. 270 7,922 $220,983,364 $536.44 3371 Household & Institutional Furniture 221 5,238 140,090,908 $514.33 3372 Office Furniture & Fixtures Manufacturing 39 2,535 77,696,543 $589.41 3379 Other Furniture Related Product Manufacturing 10 149 3,195,913 $412.48
339 MISCELLANEOUS MANUFACTURING 274 6,498 $183,023,185 $541.66 3391 Medical Equipment & Supplies Manufacturing 93 2,577 82,622,905 $616.57 3399 Other Miscellaneous Manufacturing 181 3,921 100,400,280 $492.42
16
TABLE 5. STATEWIDE SUMMARY EMPLOYMENT AND TOTAL EARNINGS, BY INDUSTRY
CALENDAR YEAR 2004 AVERAGE AVERAGE TOTAL EARNINGS AVERAGE NORTH AMERICAN INDUSTRY CLASSIFICATION SYSTEM EMPLOYING COVERED WEEKLY INDUSTRY GROUPS UNITS EMPLOYMENT EARNINGS
*Note: Totals may not add due to rounding.
16
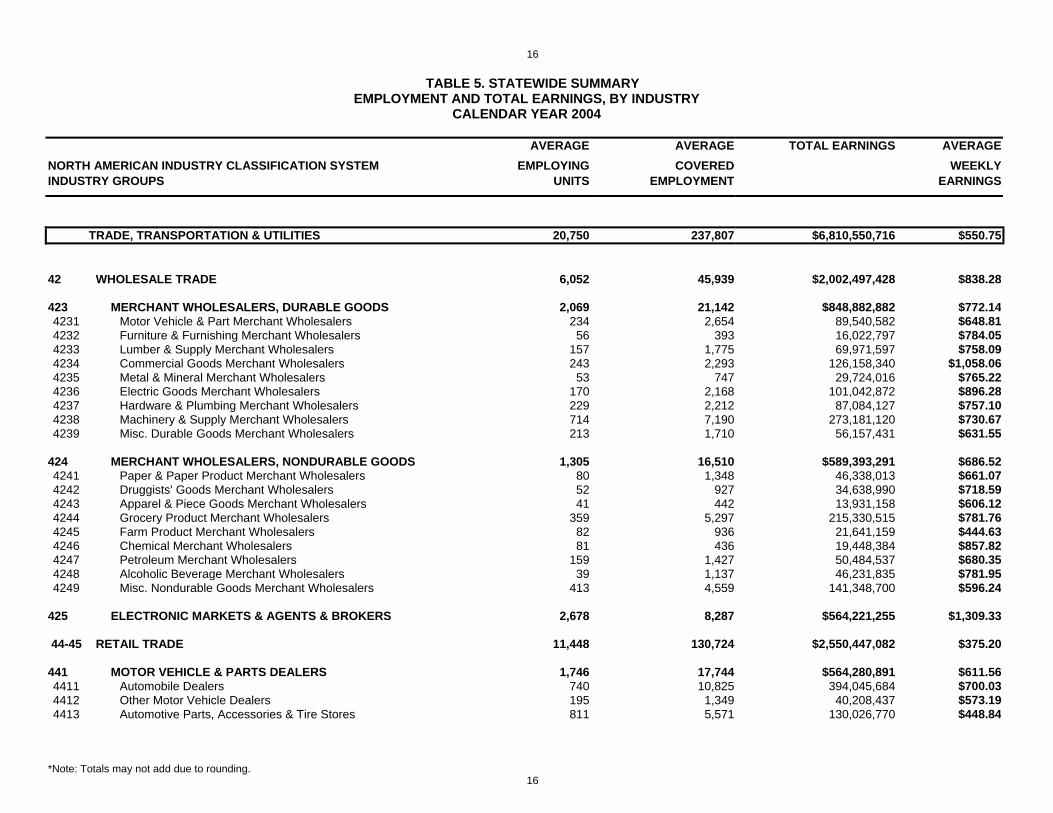
TRADE, TRANSPORTATION & UTILITIES 20,750 237,807 $6,810,550,716 $550.75 42 WHOLESALE TRADE 6,052 45,939 $2,002,497,428 $838.28 423 MERCHANT WHOLESALERS, DURABLE GOODS 2,069 21,142 $848,882,882 $772.14 4231 Motor Vehicle & Part Merchant Wholesalers 234 2,654 89,540,582 $648.81 4232 Furniture & Furnishing Merchant Wholesalers 56 393 16,022,797 $784.05 4233 Lumber & Supply Merchant Wholesalers 157 1,775 69,971,597 $758.09 4234 Commercial Goods Merchant Wholesalers 243 2,293 126,158,340 $1,058.06 4235 Metal & Mineral Merchant Wholesalers 53 747 29,724,016 $765.22 4236 Electric Goods Merchant Wholesalers 170 2,168 101,042,872 $896.28 4237 Hardware & Plumbing Merchant Wholesalers 229 2,212 87,084,127 $757.10 4238 Machinery & Supply Merchant Wholesalers 714 7,190 273,181,120 $730.67 4239 Misc. Durable Goods Merchant Wholesalers 213 1,710 56,157,431 $631.55
424 MERCHANT WHOLESALERS, NONDURABLE GOODS 1,305 16,510 $589,393,291 $686.52 4241 Paper & Paper Product Merchant Wholesalers 80 1,348 46,338,013 $661.07 4242 Druggists' Goods Merchant Wholesalers 52 927 34,638,990 $718.59 4243 Apparel & Piece Goods Merchant Wholesalers 41 442 13,931,158 $606.12 4244 Grocery Product Merchant Wholesalers 359 5,297 215,330,515 $781.76 4245 Farm Product Merchant Wholesalers 82 936 21,641,159 $444.63 4246 Chemical Merchant Wholesalers 81 436 19,448,384 $857.82 4247 Petroleum Merchant Wholesalers 159 1,427 50,484,537 $680.35 4248 Alcoholic Beverage Merchant Wholesalers 39 1,137 46,231,835 $781.95 4249 Misc. Nondurable Goods Merchant Wholesalers 413 4,559 141,348,700 $596.24
425 ELECTRONIC MARKETS & AGENTS & BROKERS 2,678 8,287 $564,221,255 $1,309.33 44-45 RETAIL TRADE 11,448 130,724 $2,550,447,082 $375.20 441 MOTOR VEHICLE & PARTS DEALERS 1,746 17,744 $564,280,891 $611.56 4411 Automobile Dealers 740 10,825 394,045,684 $700.03 4412 Other Motor Vehicle Dealers 195 1,349 40,208,437 $573.19 4413 Automotive Parts, Accessories & Tire Stores 811 5,571 130,026,770 $448.84

17
TABLE 5. STATEWIDE SUMMARY EMPLOYMENT AND TOTAL EARNINGS, BY INDUSTRY
CALENDAR YEAR 2004 AVERAGE AVERAGE TOTAL EARNINGS AVERAGE NORTH AMERICAN INDUSTRY CLASSIFICATION SYSTEM EMPLOYING COVERED WEEKLY INDUSTRY GROUPS UNITS EMPLOYMENT EARNINGS
*Note: Totals may not add due to rounding.
17
442 FURNITURE & HOME FURNISHINGS STORES 626 4,125 $101,081,646 $471.24 4421 Furniture Stores 322 2,502 62,150,798 $477.70 4422 Home Furnishings Stores 304 1,623 38,930,848 $461.29
443 ELECTRONICS & APPLIANCE STORES 505 3,069 $71,490,777 $447.97 444 BUILDING MATERIAL & GARDEN SUPPLY STORES 805 9,871 $240,370,837 $468.29 4441 Building Material & Supplies Dealers 623 8,961 221,495,220 $475.34 4442 Lawn & Garden Equipment & Supplies Stores 182 910 18,875,617 $398.89
445 FOOD & BEVERAGE STORES 1,169 19,508 $295,622,115 $291.42 4451 Grocery Stores 695 17,123 254,158,253 $285.44 4452 Specialty Food Stores 164 928 19,164,970 $397.15 4453 Beer, Wine & Liquor Stores 310 1,458 22,298,892 $294.12
446 HEALTH & PERSONAL CARE STORES 768 6,043 $158,323,936 $503.84 447 GASOLINE STATIONS 1,678 13,105 $171,550,916 $251.74 44711 Gasoline Stations with Convenience Stores 1,494 11,748 148,866,121 $243.68 44719 Other Gasoline Stations 184 1,357 22,684,795 $321.48 448 CLOTHING & CLOTHING ACCESSORIES STORES 1,074 8,158 $114,676,413 $270.33 4481 Clothing Stores 687 5,912 74,500,215 $242.34 4482 Shoe Stores 193 1,243 16,228,990 $251.08 4483 Jewelry, Luggage & Leather Goods Stores 195 1,003 23,947,208 $459.15
451 SPORTING GOODS, HOBBY, BOOK & MUSIC STORES 564 4,259 $59,550,733 $268.89 4511 Sporting Goods & Musical Instrument Stores 401 2,747 42,554,033 $297.91 4512 Book, Periodical & Music Stores 163 1,512 16,996,700 $216.18
452 GENERAL MERCHANDISE STORES 694 35,473 $594,471,969 $322.28 453 MISCELLANEOUS STORE RETAILERS 1,502 7,192 $121,640,837 $325.26 4531 Florists 293 1,114 15,193,470 $262.28 4532 Office Supplies, Stationery & Gift Stores 433 2,589 47,813,585 $355.15 4533 Used Merchandise Stores 219 736 11,028,743 $288.17 4539 Other Miscellaneous Store Retailers 558 2,753 47,605,039 $332.54

18
TABLE 5. STATEWIDE SUMMARY EMPLOYMENT AND TOTAL EARNINGS, BY INDUSTRY
CALENDAR YEAR 2004 AVERAGE AVERAGE TOTAL EARNINGS AVERAGE NORTH AMERICAN INDUSTRY CLASSIFICATION SYSTEM EMPLOYING COVERED WEEKLY INDUSTRY GROUPS UNITS EMPLOYMENT EARNINGS
*Note: Totals may not add due to rounding.
18
454 NONSTORE RETAILERS 317 2,176 $57,386,012 $507.16 4541 Electronic Shopping & Mail -Order Houses 64 458 14,134,522 $593.49 4542 Vending Machine Operators 86 746 16,678,996 $429.96 4543 Direct Selling Establishments 168 973 26,572,494 $525.19
48-49 TRANSPORTATION & WAREHOUSING 2,926 54,614 $1,859,452,208 $654.75 481 AIR TRANSPORTATION 45 1,094 $53,606,044 $942.31 484 TRUCK TRANSPORTATION 1,961 33,437 $1,168,634,563 $672.12 4841 General Freight Trucking 1,198 28,547 1,029,795,842 $693.72 4842 Specialized Freight Trucking 763 4,890 138,838,721 $546.01
485 TRANSIT & GROUND PASSENGER TRANS. 60 933 $14,691,360 $302.81 4853 Taxi & Limousine Service 21 208 2,395,753 $221.50 4854 School & Employee Bus Transportation 8 348 5,994,423 $331.26 4855 Charter Bus Industry Service 12 102 1,934,635 $364.75 4859 Other Ground Passenger Transportation 12 158 2,475,946 $301.36
Other 9 118 1,890,603 $308.12 486 PIPELINE TRANSPORTATION 69 984 $50,296,657 $982.97 488 SUPPORT ACTIVITIES FOR TRANSPORTATION 432 4,834 $173,322,064 $689.52 4881 Support Activities for Air Transportation 107 1,516 50,357,383 $638.79 4882 Support Activities for Rail Transportation 28 555 17,320,623 $600.16 4883 Support Activities for Water Transportation 28 712 24,404,868 $659.16 4884 Support Activities for Road Transportation 103 456 10,280,233 $433.55 4885 Freight Transportation Arrangement 147 1,442 66,889,170 $892.05 4889 Other Support Activities for Transportation 19 154 4,069,787 $508.22
492 COURIERS & MESSENGERS 132 3,256 $113,105,805 $668.03 4921 Couriers 87 3,043 108,199,056 $683.78 4922 Local Messengers & Local Delivery 44 213 4,906,749 $443.01

19
TABLE 5. STATEWIDE SUMMARY EMPLOYMENT AND TOTAL EARNINGS, BY INDUSTRY
CALENDAR YEAR 2004 AVERAGE AVERAGE TOTAL EARNINGS AVERAGE NORTH AMERICAN INDUSTRY CLASSIFICATION SYSTEM EMPLOYING COVERED WEEKLY INDUSTRY GROUPS UNITS EMPLOYMENT EARNINGS
*Note: Totals may not add due to rounding.
19
493 WAREHOUSING & STORAGE 212 9,896 $280,262,613 $544.63 OTHER 17 180 $5,533,102 $591.14 22 UTILITIES 324 6,530 $398,153,998 $1,172.56 2211 Power Generation & Supply 128 4,932 335,716,324 $1,309.02 2212 Natural Gas Distribution 33 809 41,368,243 $983.37 2213 Water, Sewage and Other Systems 164 789 21,069,431 $513.54
INFORMATION 1,208 20,183 $782,203,784 $745.30 511 PUBLISHING INDUSTRIES, EXCEPT INTERNET 255 6,487 $189,255,582 $561.05 5111 Newspaper, Book & Directory Publishers 220 6,243 175,135,095 $539.48 5112 Software Publishers 36 244 14,120,487 $1,112.90
512 MOTION PICTURE & SOUND RECORDING INDUSTRY 131 1,227 $18,128,723 $284.13 5121 Motion Picture & Video Industries 117 1,200 17,314,076 $277.47 5122 Sound Recording Industries 14 27 814,647 $580.23
515 BROADCASTING, EXCEPT INTERNET 145 2,152 $69,435,991 $620.50 5151 Radio & Television Broadcasting 130 2,071 66,256,249 $615.24 5152 Cable & Other Subscription Programming 15 81 3,179,742 $754.92
517 TELECOMMUNICATIONS 501 8,682 $430,357,274 $953.25 5171 Wired Telecommunications Carriers 217 4,971 290,643,192 $1,124.38 5172 Wireless Telecommunications Carriers 127 1,977 73,449,439 $714.46 5175 Cable & Other Program Distribution 68 1,149 39,339,543 $658.42
Other 90 585 26,925,100 $885.11 518 ISPS, SEARCH PORTALS, & DATA PROCESSING 146 1,314 $65,138,186 $953.32 5181 ISPs, & Web Search Portals 58 237 7,690,071 $623.99 5182 Data Processing & Related Services 87 1,077 57,448,115 $1,025.79
OTHER 31 322 $9,888,028 $590.54

20
TABLE 5. STATEWIDE SUMMARY EMPLOYMENT AND TOTAL EARNINGS, BY INDUSTRY
CALENDAR YEAR 2004 AVERAGE AVERAGE TOTAL EARNINGS AVERAGE NORTH AMERICAN INDUSTRY CLASSIFICATION SYSTEM EMPLOYING COVERED WEEKLY INDUSTRY GROUPS UNITS EMPLOYMENT EARNINGS
*Note: Totals may not add due to rounding.
20
FINANCIAL ACTIVITIES 7,420 49,182 $1,819,026,060 $711.26 52 FINANCE & INSURANCE 4,400 35,940 $1,493,293,683 $799.03 522 CREDIT INTERMEDIATION & RELATED ACTIVITIES 1,872 20,905 $721,351,207 $663.58 5221 Depository Credit Intermediation 1,215 17,451 578,938,743 $637.98 5222 Nondepository Credit Intermediation 392 2,680 119,091,169 $854.56 5223 Activities Related to Credit Intermediation 265 774 23,321,295 $579.44
523 FINANCIAL INVESTMENT & RELATED ACTIVITIES 581 3,106 $261,992,678 $1,622.13 5231 Security & Commodity Investment Activities 332 2,461 230,229,419 $1,799.06 5239 Other Financial Investment Activities 249 645 31,763,259 $947.03
524 INSURANCE CARRIERS & RELATED ACTIVITIES 1,917 11,457 $490,378,140 $823.11 5241 Insurance Carriers 349 5,026 237,728,070 $909.61 5242 Insurance Agencies, Brokerages & Support 1,568 6,432 252,650,070 $755.39
OTHER 30 472 $19,571,658 $797.41 53 REAL ESTATE & RENTAL & LEASING 3,020 13,242 $325,732,377 $473.05 531 REAL ESTATE 2,199 8,059 $205,586,343 $490.58 5311 Lessors of Real Estate 987 4,160 91,904,643 $424.86 5312 Offices of Real Estate Agents & Brokers 679 1,811 54,880,937 $582.77 5313 Activities Related to Real Estate 533 2,089 58,800,763 $541.30
532 RENTAL & LEASING SERVICES 795 5,091 $115,109,654 $434.82 5321 Automotive Equipment Rental & Leasing 125 991 25,550,588 $495.82 5322 Consumer Goods Rental 502 3,303 61,383,116 $357.39 5323 General Rental Centers 39 211 6,341,161 $577.94 5324 Machinery & Equipment Rental & Leasing 129 587 21,834,789 $715.33
533 LESSORS OF NONFINANCIAL INTANGIBLE ASSETS 27 91 $5,036,380 $1,064.32

21
TABLE 5. STATEWIDE SUMMARY EMPLOYMENT AND TOTAL EARNINGS, BY INDUSTRY
CALENDAR YEAR 2004 AVERAGE AVERAGE TOTAL EARNINGS AVERAGE NORTH AMERICAN INDUSTRY CLASSIFICATION SYSTEM EMPLOYING COVERED WEEKLY INDUSTRY GROUPS UNITS EMPLOYMENT EARNINGS
*Note: Totals may not add due to rounding.
21
PROFESSIONAL & BUSINESS SERVICES 9,990 108,091 $3,938,956,435 $700.79 54 PROFESSIONAL & TECHNICAL SERVICES 6,231 33,698 $1,483,122,423 $846.39 5411 Legal Services 1,563 6,507 287,004,736 $848.21 5412 Accounting & Bookkeeping Services 1,143 4,971 164,184,006 $635.16 5413 Architectural & Engineering Services 840 5,819 250,875,709 $829.10 5414 Specialized Design Services 147 442 11,617,099 $505.44 5415 Computer Systems Design & Related Services 703 7,130 478,277,351 $1,289.99 5416 Management & Technical Consulting Services 885 2,245 105,233,308 $901.43 5417 Scientific Research & Development Services 105 1,080 46,272,219 $823.94 5418 Advertising & Related Services 302 1,957 72,974,754 $717.10 5419 Other Professional & Technical Services 543 3,548 66,683,241 $361.43
55 MANAGEMENT OF COMPANIES & ENTERPRISES 474 22,799 $1,483,322,376 $1,251.17 56 ADMINISTRATIVE & WASTE SERVICES 3,285 51,594 $972,511,636 $362.49 561 ADMINISTRATIVE & SUPPORT SERVICES 3,093 48,818 $862,378,379 $339.71 5611 Office Administrative Services 290 1,100 52,785,157 $922.82 5612 Facilities Support Services 12 157 5,043,441 $617.77 5613 Employment Services 583 25,108 383,368,848 $293.63 5614 Business Support Services 352 5,017 93,096,414 $356.85 5615 Travel Arrangement & Reservation Services 105 439 13,157,056 $576.36 5616 Investigation & Security Services 204 4,244 85,571,311 $387.75 5617 Services to Buildings & Dwellings 1,230 11,176 183,895,942 $316.43 5619 Other Support Services 318 1,576 45,460,210 $554.72
562 WASTE MANAGEMENT & REMEDIATION SERVICES 192 2,777 $110,133,257 $762.67 5621 Waste Collection Services 85 1,040 35,218,912 $651.24 5622 Waste Treatment & Disposal Services 40 1,277 62,055,748 $934.52 5629 Remediation & Other Waste Services 67 459 12,858,597 $538.74

22
TABLE 5. STATEWIDE SUMMARY EMPLOYMENT AND TOTAL EARNINGS, BY INDUSTRY
CALENDAR YEAR 2004 AVERAGE AVERAGE TOTAL EARNINGS AVERAGE NORTH AMERICAN INDUSTRY CLASSIFICATION SYSTEM EMPLOYING COVERED WEEKLY INDUSTRY GROUPS UNITS EMPLOYMENT EARNINGS
*Note: Totals may not add due to rounding.
22
EDUCATION & HEALTH SERVICES 7,793 136,650 $4,257,171,676 $599.11 61 EDUCATIONAL SERVICES 503 8,000 $201,454,462 $484.27 6111 Elementary & Secondary Schools 77 2,798 54,931,210 $377.54 6112 Junior Colleges 8 227 6,478,825 $548.87 6113 Colleges & Universities 26 2,886 85,541,752 $570.00 6114 Business, Computer, & Management Training 45 220 11,835,713 $1,034.59 6115 Technical & Trade Schools 100 605 22,578,609 $717.69 6116 Other Schools & Instruction 201 1,112 16,008,849 $276.85 6117 Educational Support Services 45 150 4,079,504 $523.01
62 HEALTH CARE & SOCIAL ASSISTANCE 7,290 128,650 $4,055,717,214 $606.25 621 AMBULATORY HEALTH CARE SERVICES 4,541 39,623 $1,830,518,262 $888.43 6211 Offices of Physicians 2,032 19,633 1,204,212,885 $1,179.54 6212 Offices of Dentists 891 5,827 206,802,814 $682.51 6213 Offices of Other Health Practitioners 1,077 5,087 148,793,393 $562.49 6214 Outpatient Care Centers 198 3,081 108,122,922 $674.87 6215 Medical & Diagnostic Laboratories 81 666 29,159,600 $841.98 6216 Home Health Care Services 127 3,343 82,806,670 $476.35 6219 Other Ambulatory Health Care Services 135 1,987 50,619,978 $489.92
622 HOSPITALS 107 41,784 $1,421,058,030 $654.03 6221 General Medical & Surgical Hospitals 77 38,518 1,312,407,268 $655.24 6222 Psychiatric & Substance Abuse Hospitals 10 1,358 41,522,451 $588.00 6223 Other Hospitals 20 1,909 67,128,311 $676.23
623 NURSING & RESIDENTIAL CARE FACILITIES 496 25,663 $463,481,176 $347.31 6231 Nursing Care Facilities 233 19,341 345,955,449 $343.98 6232 Residential Mental Health Facilities 131 2,869 56,070,868 $375.84 6233 Community Care Facilities for the Elderly 88 2,098 33,998,833 $311.64 6239 Other Residential Care Facilities 45 1,356 27,456,026 $389.38

23
TABLE 5. STATEWIDE SUMMARY EMPLOYMENT AND TOTAL EARNINGS, BY INDUSTRY
CALENDAR YEAR 2004 AVERAGE AVERAGE TOTAL EARNINGS AVERAGE NORTH AMERICAN INDUSTRY CLASSIFICATION SYSTEM EMPLOYING COVERED WEEKLY INDUSTRY GROUPS UNITS EMPLOYMENT EARNINGS
*Note: Totals may not add due to rounding.
23
624 SOCIAL ASSISTANCE 2,146 21,579 $340,659,746 $303.59 6241 Individual & Family Services 1,039 9,592 164,691,634 $330.19 6242 Emergency & Other Relief Services 107 807 15,334,602 $365.42 6243 Vocational Rehabilitation Services 131 3,192 58,890,182 $354.79 6244 Child Day Care Services 869 7,989 101,743,328 $244.91
LEISURE & HOSPITALITY 5,792 90,993 $1,000,212,053 $211.39 71 ARTS, ENTERTAINMENT & RECREATION 880 9,133 $126,461,299 $266.28 711 PERFORMING ARTS & SPECTATOR SPORTS 189 2,067 $32,364,146 $301.11 7111 Performing Arts Companies 44 561 7,956,836 $272.76 7112 Spectator Sports 60 861 14,319,490 $319.83 7113 Performing Arts & Sports Promoters 34 525 7,114,569 $260.61 7114 Agents & Managers for Public Figures 9 17 513,634 $581.03 7115 Independent Artists, Writers & Performers 44 103 2,459,617 $459.23
712 MUSEUMS, PARKS & HISTORICAL SITES 46 210 $3,123,546 $286.04 713 GAMBLING, RECREATION & AMUSEMENT INDUSTRY 645 6,856 $90,973,607 $255.18 7139 Other Amusement & Recreation Industries 615 6,405 86,709,334 $260.34
Other 30 451 4,264,273 $181.83 72 ACCOMMODATION & FOOD SERVICES 4,912 81,860 $873,750,754 $205.26 721 ACCOMMODATION 780 10,979 $145,123,577 $254.20 7211 Traveler Accommodation 712 10,631 140,403,345 $253.98 7212 RV Parks & Recreational Camps 48 287 3,743,578 $250.84 7213 Rooming & Boarding Houses 20 61 976,654 $307.90
722 FOOD SERVICES & DRINKING PLACES 4,132 70,881 $728,627,177 $197.68 7221 Full -Service Restaurants 1,734 30,376 337,123,890 $213.43 7222 Limited-Service Eating Places 2,087 37,718 360,239,073 $183.67 7223 Special Food Services 144 1,815 21,869,091 $231.71 7224 Drinking Places, Alcoholic Beverages 167 972 9,395,123 $185.88

24
TABLE 5. STATEWIDE SUMMARY EMPLOYMENT AND TOTAL EARNINGS, BY INDUSTRY
CALENDAR YEAR 2004 AVERAGE AVERAGE TOTAL EARNINGS AVERAGE NORTH AMERICAN INDUSTRY CLASSIFICATION SYSTEM EMPLOYING COVERED WEEKLY INDUSTRY GROUPS UNITS EMPLOYMENT EARNINGS
*Note: Totals may not add due to rounding.
24
OTHER SERVICES 5,493 25,775 $574,377,553 $428.54 811 REPAIR & MAINTENANCE 2,248 9,625 $251,299,535 $502.10 8111 Automotive Repair & Maintenance 1,580 7,146 177,674,267 $478.14 8112 Electronic Equipment Repair & Maintenance 155 518 17,103,695 $634.98 8113 Commercial Machinery Repair & Maintenance 322 1,383 42,994,003 $597.84 8114 Household Goods Repair & Maintenance 191 578 13,527,570 $450.08
812 PERSONAL & LAUNDRY SERVICES 1,312 8,411 $160,477,482 $366.91 8121 Personal Care Services 555 2,428 34,456,888 $272.91 8122 Death Care Services 243 1,726 44,155,846 $491.98 8123 Drycleaning & Laundry Services 365 3,491 63,676,992 $350.78 8129 Other Personal Services 149 767 18,187,756 $456.02
813 MEMBERSHIP ASSOCIATIONS & ORGANIZATIONS 972 6,293 $136,398,368 $416.82 8131 Religious Organizations 38 219 4,415,811 $387.76 8132 Grantmaking & Giving Services 87 398 13,743,220 $664.05 8133 Social Advocacy Organizations 133 1,876 40,189,254 $411.98 8134 Civic & Social Organizations 212 1,587 19,658,569 $238.22 8139 Professional & Similar Organizations 503 2,212 58,391,514 $507.65
814 PRIVATE HOUSEHOLDS 962 1,446 $26,202,168 $348.47 LOCAL GOVERNMENT 1,980 107,261 $2,975,389,154 $533.46 STATE GOVERNMENT 1,202 58,954 $2,020,531,819 $659.10 NONCLASSIFIABLE ESTABLISHMENTS 0 0 $0

25
TABLE 6. COUNTY SUMMARY EMPLOYMENT AND TOTAL EARNINGS, BY INDUSTRY
CALENDAR YEAR 2004 NORTH AMERICAN INDUSTRY AVERAGE AVERAGE TOTAL EARNINGS AVERAGECLASSIFICATION SYSTEM EMPLOYING COVERED WEEKLYINDUSTRY GROUP UNITS EMPLOYMENT EARNINGS
*Note: Totals may not add due to rounding.
25
ARKANSAS COUNTY - TOTAL 649 9,742 $269,088,030 $531.18 Natural Resources & Mining 44 299 8,086,345 520.09
Construction 53 292 8,268,267 544.54 Manufacturing 30 3,425 105,102,959 590.13 Trade, Transportation & Utilities 207 2,114 63,490,136 577.56 Wholesale Trade 47 481 24,714,353 988.10 Retail Trade 109 1,102 20,437,811 356.66 Transportation, Warehousing & Utilities 52 531 18,337,972 664.13 Information 9 83 2,913,650 675.08 Financial Activities 46 350 11,085,603 609.10 Professional & Business Services 53 392 14,076,959 690.59 Education & Health Services 58 1,095 22,940,005 402.88 Leisure & Hospitality 55 521 4,840,400 178.67 Other Services 48 144 2,735,532 365.32 Local Government 31 823 20,200,675 472.02 State Government 16 205 5,347,499 501.64
ASHLEY COUNTY - TOTAL 542 8,407 $278,581,027 $637.25 Natural Resources & Mining 62 495 13,225,144 513.80
Construction 49 638 16,027,738 483.11 Manufacturing 28 3,022 151,671,849 965.18 Trade, Transportation & Utilities 145 1,230 27,352,171 427.64 Wholesale Trade 26 161 6,202,118 740.82 Retail Trade 95 835 14,049,860 323.58 Transportation, Warehousing & Utilities 24 234 7,100,193 583.51 Information 11 62 1,681,125 521.44 Financial Activities 39 340 10,402,375 588.37 Professional & Business Services 46 346 8,888,287 494.01 Education & Health Services 44 542 15,529,631 551.01 Leisure & Hospitality 32 401 3,780,682 181.31 Other Services 42 192 3,123,444 312.84 Local Government 32 933 22,578,711 465.39 State Government 12 208 4,319,870 399.40

26
TABLE 6. COUNTY SUMMARY EMPLOYMENT AND TOTAL EARNINGS, BY INDUSTRY
CALENDAR YEAR 2004 NORTH AMERICAN INDUSTRY AVERAGE AVERAGE TOTAL EARNINGS AVERAGECLASSIFICATION SYSTEM EMPLOYING COVERED WEEKLYINDUSTRY GROUP UNITS EMPLOYMENT EARNINGS
*Note: Totals may not add due to rounding.
26
BAXTER COUNTY - TOTAL 1,169 13,847 $351,622,005 $488.33 Natural Resources & Mining 6 99 2,450,438 476.00
Construction 121 604 13,222,481 420.99 Manufacturing 64 2,487 77,363,315 598.21 Trade, Transportation & Utilities 270 2,557 51,687,317 388.73 Wholesale Trade 31 176 5,034,796 550.13 Retail Trade 212 2,135 40,352,603 363.47 Transportation, Warehousing & Utilities 27 247 6,299,918 490.50 Information 24 295 8,494,192 553.73 Financial Activities 107 614 18,919,197 592.56 Professional & Business Services 133 793 21,759,810 527.69 Education & Health Services 163 3,042 98,818,875 624.71 Leisure & Hospitality 120 1,488 14,983,362 193.64 Other Services 113 432 6,995,906 311.43 Local Government 36 1,166 30,222,177 498.45 State Government 12 269 6,704,935 479.33
BENTON COUNTY - TOTAL 4,374 84,172 $3,108,727,690 $710.25 Natural Resources & Mining 30 644 28,243,214 843.38
Construction 626 4,130 128,082,950 596.40 Manufacturing 230 14,148 454,650,294 617.99 Trade, Transportation & Utilities 1,196 20,806 717,740,477 663.40 Wholesale Trade 484 2,929 166,122,428 1090.70 Retail Trade 556 6,879 151,227,735 422.77 Transportation, Warehousing & Utilities 156 10,997 400,390,314 700.17 Information 67 898 30,808,085 659.76 Financial Activities 472 3,158 114,149,808 695.12 Professional & Business Services 682 20,180 1,131,650,098 1078.42 Education & Health Services 366 5,891 188,194,103 614.35 Leisure & Hospitality 328 6,069 73,960,690 234.36 Other Services 284 1,659 40,025,943 463.97 Local Government 75 5,880 182,085,078 595.52 State Government 19 709 19,136,950 519.07

27
TABLE 6. COUNTY SUMMARY EMPLOYMENT AND TOTAL EARNINGS, BY INDUSTRY
CALENDAR YEAR 2004 NORTH AMERICAN INDUSTRY AVERAGE AVERAGE TOTAL EARNINGS AVERAGECLASSIFICATION SYSTEM EMPLOYING COVERED WEEKLYINDUSTRY GROUP UNITS EMPLOYMENT EARNINGS
*Note: Totals may not add due to rounding.
27
BOONE COUNTY - TOTAL 992 13,436 $370,645,576 $530.50 Construction 93 459 11,140,763 466.77 Manufacturing 69 2,179 66,760,340 589.19 Trade, Transportation & Utilities 264 4,163 130,289,962 601.87 Wholesale Trade 50 693 19,506,340 541.30 Retail Trade 166 1,947 39,925,890 394.35 Transportation, Warehousing & Utilities 49 1,524 70,857,732 894.13 Information 17 426 13,842,907 624.91 Financial Activities 96 599 19,330,752 620.61 Professional & Business Services 107 516 10,991,049 409.62 Education & Health Services 121 1,081 28,355,034 504.43 Leisure & Hospitality 83 1,168 11,517,427 189.63 Local Government 50 2,018 54,487,651 519.25 State Government 20 573 18,012,310 604.52 Other 73 254 5,917,381 448.01
BRADLEY COUNTY - TOTAL 342 4,207 $104,011,596 $475.45 Natural Resources & Mining 58 462 7,298,343 303.79
Construction 21 176 4,499,343 491.62 Manufacturing 11 1,058 33,058,217 600.88 Trade, Transportation & Utilities 92 602 12,754,142 407.43 Wholesale Trade 13 190 4,442,806 449.68 Retail Trade 50 321 5,504,657 329.78 Transportation, Warehousing & Utilities 29 92 2,806,679 586.68 Information 3 13 343,619 508.31 Financial Activities 22 184 4,366,120 456.33 Professional & Business Services 24 145 6,201,007 822.41 Education & Health Services 34 532 13,692,352 494.95 Leisure & Hospitality 19 200 1,452,156 139.63 Other Services 32 104 1,951,333 360.82 Local Government 16 491 11,986,456 469.47 State Government 12 239 6,408,508 515.65

28
TABLE 6. COUNTY SUMMARY EMPLOYMENT AND TOTAL EARNINGS, BY INDUSTRY
CALENDAR YEAR 2004 NORTH AMERICAN INDUSTRY AVERAGE AVERAGE TOTAL EARNINGS AVERAGECLASSIFICATION SYSTEM EMPLOYING COVERED WEEKLYINDUSTRY GROUP UNITS EMPLOYMENT EARNINGS
*Note: Totals may not add due to rounding.
28
CALHOUN COUNTY - TOTAL 126 3,663 $127,079,596 $667.17 Natural Resources & Mining 24 146 3,563,563 469.38
Construction 9 89 1,956,203 422.69 Manufacturing 16 2,468 97,793,873 762.01 Trade, Transportation & Utilities 28 199 4,605,587 445.07 Wholesale Trade & Retail Trade 17 73 987,478 260.14 Transportation, Warehousing & Utilities 10 127 3,618,109 547.87 Education & Health Services 4 42 1,191,946 545.76 Local Government 11 189 4,064,300 413.54 State Government 10 326 7,845,554 462.81 Other 25 204 6,058,570 571.13
CARROLL COUNTY - TOTAL 793 9,770 $212,582,160 $418.44 Natural Resources & Mining 15 281 7,569,847 518.06
Trade, Transportation & Utilities 214 1,638 34,578,329 405.96 Wholesale Trade 26 115 2,200,760 368.02 Retail Trade 170 1,258 23,108,752 353.26 Transportation, Warehousing & Utilities 19 265 9,268,817 672.63 Professional & Business Services 65 210 4,932,866 451.73 Education & Health Services 58 728 20,046,240 529.54 Leisure & Hospitality 177 1,675 17,699,771 203.21 Local Government 24 967 23,944,473 476.18 State Government 12 102 2,676,244 504.57 Other 230 4,171 101,134,390 466.29

29
TABLE 6. COUNTY SUMMARY EMPLOYMENT AND TOTAL EARNINGS, BY INDUSTRY
CALENDAR YEAR 2004 NORTH AMERICAN INDUSTRY AVERAGE AVERAGE TOTAL EARNINGS AVERAGECLASSIFICATION SYSTEM EMPLOYING COVERED WEEKLYINDUSTRY GROUP UNITS EMPLOYMENT EARNINGS
*Note: Totals may not add due to rounding.
29
CHICOT COUNTY - TOTAL 336 3,705 $82,454,439 $427.98 Natural Resources & Mining 53 275 6,569,373 459.40
Construction 22 259 7,905,128 586.96 Manufacturing 12 391 7,128,244 350.59 Trade, Transportation & Utilities 85 622 12,861,104 397.63 Wholesale Trade 15 110 3,374,032 589.87 Retail Trade 57 428 6,436,785 289.22 Transportation, Warehousing & Utilities 14 84 3,050,287 698.33 Information 5 21 434,283 397.70 Financial Activities 29 155 4,541,162 563.42 Professional & Business Services 26 139 3,637,052 503.19 Education & Health Services 38 445 9,752,516 421.46 Leisure & Hospitality 22 247 1,912,590 148.91 Other Services 19 61 1,146,294 361.38 Local Government 16 800 19,001,232 456.76 State Government 11 290 7,565,461 501.69
CLARK COUNTY - TOTAL 613 9,825 $236,466,421 $462.84 Natural Resources & Mining 44 278 7,389,457 511.17
Construction 39 108 2,465,379 438.99 Manufacturing 36 2,477 68,111,713 528.80 Trade, Transportation & Utilities 141 1,495 33,822,728 435.07 Wholesale Trade 23 79 2,173,393 529.06 Retail Trade 94 1,131 21,989,473 373.89 Transportation, Warehousing & Utilities 23 284 9,659,862 654.11 Information 10 53 1,529,904 555.12 Financial Activities 87 392 10,524,543 516.31 Professional & Business Services 47 331 12,959,627 752.94 Education & Health Services 62 1,440 34,746,411 464.03 Leisure & Hospitality 56 1,074 10,037,552 179.73 Other Services 50 219 4,727,263 415.11 Local Government 27 892 20,547,191 442.98 State Government 14 1,067 29,604,653 533.57

30
TABLE 6. COUNTY SUMMARY EMPLOYMENT AND TOTAL EARNINGS, BY INDUSTRY
CALENDAR YEAR 2004 NORTH AMERICAN INDUSTRY AVERAGE AVERAGE TOTAL EARNINGS AVERAGECLASSIFICATION SYSTEM EMPLOYING COVERED WEEKLYINDUSTRY GROUP UNITS EMPLOYMENT EARNINGS
*Note: Totals may not add due to rounding.
30
CLAY COUNTY - TOTAL 412 5,143 $108,465,054 $405.57 Natural Resources & Mining 57 215 4,432,599 396.48
Construction 44 180 3,932,923 420.18 Manufacturing 23 1,839 37,662,088 393.84 Trade, Transportation & Utilities 99 871 19,908,919 439.57 Wholesale Trade 25 234 6,269,852 515.27 Retail Trade 55 459 7,818,383 327.57 Transportation, Warehousing & Utilities 19 178 5,820,684 628.86 Information 8 140 3,638,608 499.81 Financial Activities 36 158 3,842,413 467.67 Professional & Business Services 23 59 1,180,182 384.67 Education & Health Services 38 475 8,857,987 358.62 Leisure & Hospitality 23 212 1,615,524 146.55 Other Services 26 52 1,060,961 392.37 Local Government 22 863 20,440,683 455.49 State Government 12 78 1,892,167 466.51
CLEBURNE COUNTY - TOTAL 654 6,512 $149,823,060 $442.45 Natural Resources & Mining 14 33 951,716 554.61
Construction 63 245 5,655,815 443.94 Manufacturing 49 1,790 50,727,149 544.98 Trade, Transportation & Utilities 191 1,479 32,217,535 418.91 Wholesale Trade 38 163 4,097,296 483.40 Retail Trade 114 973 17,594,786 347.75 Transportation, Warehousing & Utilities 39 343 10,525,453 590.12 Information 8 60 1,480,508 474.52 Financial Activities 65 251 6,368,768 487.95 Professional & Business Services 60 195 4,520,712 445.83 Education & Health Services 59 728 17,684,414 467.15 Leisure & Hospitality 62 729 7,616,542 200.92 Other Services 55 151 2,582,648 328.92 Local Government 20 745 17,415,002 449.54 State Government 10 108 2,602,251 463.36

31
TABLE 6. COUNTY SUMMARY EMPLOYMENT AND TOTAL EARNINGS, BY INDUSTRY
CALENDAR YEAR 2004 NORTH AMERICAN INDUSTRY AVERAGE AVERAGE TOTAL EARNINGS AVERAGECLASSIFICATION SYSTEM EMPLOYING COVERED WEEKLYINDUSTRY GROUP UNITS EMPLOYMENT EARNINGS
*Note: Totals may not add due to rounding.
31
CLEVELAND COUNTY - TOTAL 112 1,040 $22,939,530 $424.18 Natural Resources & Mining 19 160 4,283,866 514.89
Construction 9 44 581,656 254.22 Manufacturing 6 88 1,973,899 431.36 Trade, Transportation & Utilities 33 223 4,091,163 352.81 Wholesale Trade 6 50 926,120 356.20 Retail Trade 15 80 792,377 190.48 Transportation, Warehousing & Utilities 13 94 2,372,666 485.41 Financial Activities 4 28 716,112 491.84 Local Government 13 316 7,413,507 451.16 State Government 8 52 1,321,254 488.63 Other 22 128 2,558,073 384.33
COLUMBIA COUNTY - TOTAL 685 9,244 $257,613,536 $535.93 Natural Resources & Mining 46 406 17,064,413 808.28
Construction 48 314 9,325,092 571.11 Manufacturing 39 2,765 105,162,411 731.41 Trade, Transportation & Utilities 189 1,605 32,894,184 394.13 Wholesale Trade 29 272 6,677,645 472.12 Retail Trade 116 1,090 18,158,525 320.37 Transportation, Warehousing & Utilities 44 243 8,058,014 637.70 Information 9 79 2,141,124 521.21 Financial Activities 75 396 11,772,957 571.72 Professional & Business Services 61 338 7,184,554 408.77 Education & Health Services 73 845 16,600,627 377.80 Leisure & Hospitality 46 584 5,690,756 187.39 Other Services 54 232 3,786,887 313.90 Local Government 30 1,147 29,249,014 490.39 State Government 15 533 16,741,517 604.04

32
TABLE 6. COUNTY SUMMARY EMPLOYMENT AND TOTAL EARNINGS, BY INDUSTRY
CALENDAR YEAR 2004 NORTH AMERICAN INDUSTRY AVERAGE AVERAGE TOTAL EARNINGS AVERAGECLASSIFICATION SYSTEM EMPLOYING COVERED WEEKLYINDUSTRY GROUP UNITS EMPLOYMENT EARNINGS
*Note: Totals may not add due to rounding.
32
CONWAY COUNTY - TOTAL 466 6,472 $166,234,288 $493.95 Natural Resources & Mining 17 137 4,258,385 597.75
Construction 48 517 18,754,030 697.59 Manufacturing 29 1,079 42,474,041 757.01 Trade, Transportation & Utilities 133 1,372 30,374,597 425.75 Wholesale Trade 28 242 7,121,178 565.89 Retail Trade 80 890 16,077,937 347.41 Transportation, Warehousing & Utilities 25 240 7,175,482 574.96 Information 6 40 779,037 374.54 Financial Activities 39 184 4,785,099 500.11 Professional & Business Services 46 695 13,122,678 363.11 Education & Health Services 50 718 17,414,387 466.42 Leisure & Hospitality 39 454 4,037,511 171.02 Other Services 23 87 2,093,201 462.69 Local Government 27 843 20,442,476 466.34 State Government 11 347 7,698,846 426.67
CRAIGHEAD COUNTY - TOTAL 2,478 39,853 $1,105,504,538 $533.45 Natural Resources & Mining 58 271 6,715,740 476.56
Construction 219 1,870 50,402,396 518.33 Manufacturing 146 7,430 240,355,689 622.10 Trade, Transportation & Utilities 712 7,965 186,898,832 451.25 Wholesale Trade 176 1,465 50,028,965 656.72 Retail Trade 425 5,433 102,122,090 361.47 Transportation, Warehousing & Utilities 112 1,067 34,747,777 626.27 Information 32 634 21,389,825 648.81 Financial Activities 248 1,582 56,696,092 689.20 Professional & Business Services 297 3,319 78,321,830 453.81 Education & Health Services 338 6,604 239,445,174 697.26 Leisure & Hospitality 178 3,600 37,262,383 199.05 Other Services 187 1,103 21,033,569 366.72 Local Government 39 3,177 87,636,934 530.48 State Government 25 2,299 79,346,074 663.72
33
TABLE 6. COUNTY SUMMARY EMPLOYMENT AND TOTAL EARNINGS, BY INDUSTRY
CALENDAR YEAR 2004 NORTH AMERICAN INDUSTRY AVERAGE AVERAGE TOTAL EARNINGS AVERAGECLASSIFICATION SYSTEM EMPLOYING COVERED WEEKLYINDUSTRY GROUP UNITS EMPLOYMENT EARNINGS
*Note: Totals may not add due to rounding.
33
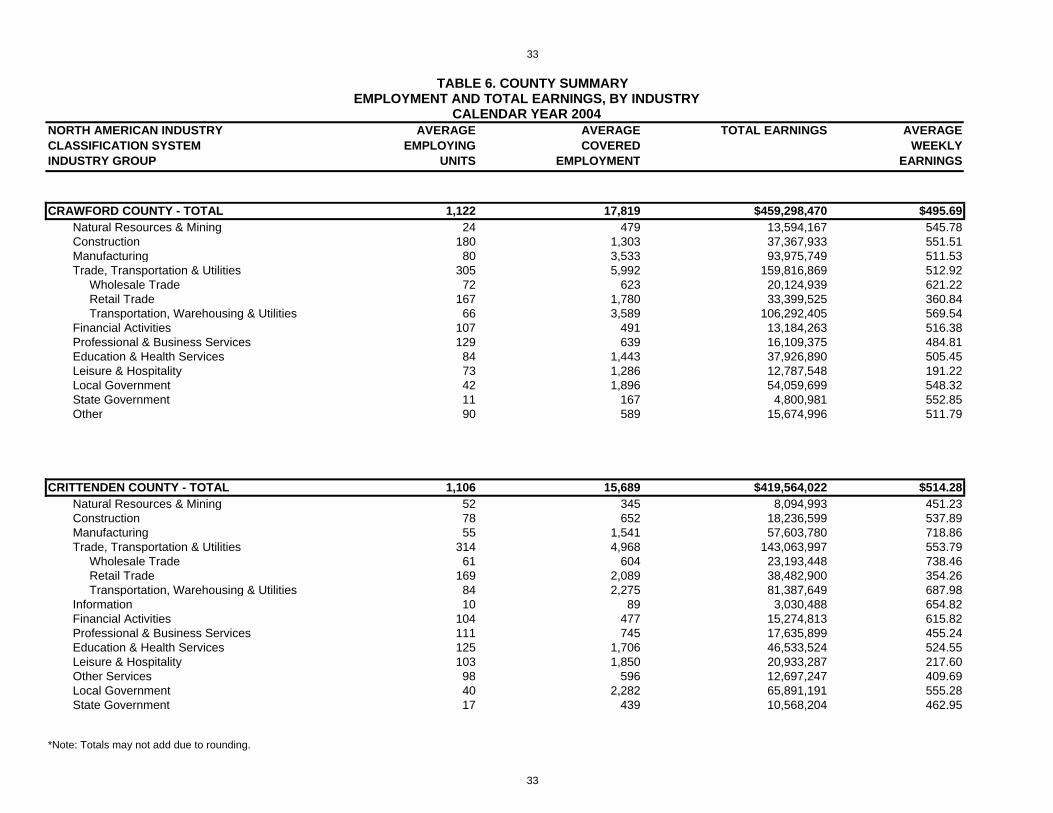
CRAWFORD COUNTY - TOTAL 1,122 17,819 $459,298,470 $495.69 Natural Resources & Mining 24 479 13,594,167 545.78
Construction 180 1,303 37,367,933 551.51 Manufacturing 80 3,533 93,975,749 511.53 Trade, Transportation & Utilities 305 5,992 159,816,869 512.92 Wholesale Trade 72 623 20,124,939 621.22 Retail Trade 167 1,780 33,399,525 360.84 Transportation, Warehousing & Utilities 66 3,589 106,292,405 569.54 Financial Activities 107 491 13,184,263 516.38 Professional & Business Services 129 639 16,109,375 484.81 Education & Health Services 84 1,443 37,926,890 505.45 Leisure & Hospitality 73 1,286 12,787,548 191.22 Local Government 42 1,896 54,059,699 548.32 State Government 11 167 4,800,981 552.85 Other 90 589 15,674,996 511.79
CRITTENDEN COUNTY - TOTAL 1,106 15,689 $419,564,022 $514.28 Natural Resources & Mining 52 345 8,094,993 451.23
Construction 78 652 18,236,599 537.89 Manufacturing 55 1,541 57,603,780 718.86 Trade, Transportation & Utilities 314 4,968 143,063,997 553.79 Wholesale Trade 61 604 23,193,448 738.46 Retail Trade 169 2,089 38,482,900 354.26 Transportation, Warehousing & Utilities 84 2,275 81,387,649 687.98 Information 10 89 3,030,488 654.82 Financial Activities 104 477 15,274,813 615.82 Professional & Business Services 111 745 17,635,899 455.24 Education & Health Services 125 1,706 46,533,524 524.55 Leisure & Hospitality 103 1,850 20,933,287 217.60 Other Services 98 596 12,697,247 409.69 Local Government 40 2,282 65,891,191 555.28 State Government 17 439 10,568,204 462.95

34
TABLE 6. COUNTY SUMMARY EMPLOYMENT AND TOTAL EARNINGS, BY INDUSTRY
CALENDAR YEAR 2004 NORTH AMERICAN INDUSTRY AVERAGE AVERAGE TOTAL EARNINGS AVERAGECLASSIFICATION SYSTEM EMPLOYING COVERED WEEKLYINDUSTRY GROUP UNITS EMPLOYMENT EARNINGS
*Note: Totals may not add due to rounding.
34
CROSS COUNTY - TOTAL 467 5,293 $127,902,570 $464.70 Natural Resources & Mining 41 224 4,739,061 406.86
Construction 32 142 3,066,553 415.30 Manufacturing 18 1,017 28,350,319 536.08 Trade, Transportation & Utilities 131 1,235 29,959,537 466.51 Wholesale Trade 33 317 9,895,364 600.30 Retail Trade 66 661 11,898,441 346.17 Transportation, Warehousing & Utilities 32 257 8,165,732 611.02 Information 9 57 1,459,900 492.54 Financial Activities 43 377 10,805,725 551.20 Professional & Business Services 39 177 4,753,854 516.50 Education & Health Services 53 600 13,201,770 423.13 Leisure & Hospitality 31 356 3,135,322 169.37 Other Services 42 82 1,402,905 329.01 Local Government 17 805 20,549,439 490.91 State Government 12 223 6,478,185 558.66
DALLAS COUNTY - TOTAL 274 3,219 $75,129,932 $448.84 Natural Resources & Mining 40 215 5,480,030 490.16
Construction 15 88 2,097,329 458.33 Manufacturing 16 883 24,603,347 535.83 Trade, Transportation & Utilities 80 497 9,828,809 380.31 Wholesale Trade 10 49 1,144,807 449.30 Retail Trade 49 376 6,883,889 352.08 Transportation, Warehousing & Utilities 21 72 1,800,113 480.80 Information 3 26 605,722 448.02 Financial Activities 21 103 2,805,186 523.75 Professional & Business Services 16 54 2,088,600 743.80 Education & Health Services 25 680 14,248,085 402.94 Leisure & Hospitality 17 129 1,117,058 166.53 Other Services 17 65 1,024,728 303.17 Local Government 16 413 9,568,367 445.54 State Government 9 65 1,662,671 491.91

35
TABLE 6. COUNTY SUMMARY EMPLOYMENT AND TOTAL EARNINGS, BY INDUSTRY
CALENDAR YEAR 2004 NORTH AMERICAN INDUSTRY AVERAGE AVERAGE TOTAL EARNINGS AVERAGECLASSIFICATION SYSTEM EMPLOYING COVERED WEEKLYINDUSTRY GROUP UNITS EMPLOYMENT EARNINGS
*Note: Totals may not add due to rounding.
35
DESHA COUNTY - TOTAL 447 4,952 $127,910,652 $496.73 Natural Resources & Mining 55 296 7,355,036 477.85
Construction 26 128 3,684,399 553.55 Manufacturing 16 1,051 36,200,787 662.39 Trade, Transportation & Utilities 140 1,149 24,295,455 406.63 Wholesale Trade 20 192 6,999,936 701.12 Retail Trade 87 732 11,597,586 304.69 Transportation, Warehousing & Utilities 33 226 5,697,933 484.85 Information 6 28 940,380 645.87 Financial Activities 38 226 5,357,011 455.84 Professional & Business Services 35 244 10,741,760 846.61 Education & Health Services 37 507 11,003,357 417.36 Leisure & Hospitality 35 290 2,352,107 155.98 Other Services 28 72 941,499 251.47 Local Government 21 801 20,696,361 496.89 State Government 11 160 4,342,500 521.94
DREW COUNTY - TOTAL 497 6,955 $161,377,636 $446.21 Natural Resources & Mining 44 327 9,102,329 535.31
Construction 25 125 3,176,249 488.65 Manufacturing 27 1,346 33,725,935 481.85 Trade, Transportation & Utilities 144 1,306 28,643,833 421.78 Wholesale Trade 27 270 8,286,766 590.23 Retail Trade 95 939 16,702,331 342.06 Transportation, Warehousing & Utilities 23 97 3,654,736 724.57 Information 9 90 2,422,754 517.68 Financial Activities 47 278 8,535,011 590.41 Professional & Business Services 40 265 6,530,833 473.94 Education & Health Services 53 754 14,278,445 364.17 Leisure & Hospitality 40 581 4,600,654 152.28 Other Services 30 95 1,471,718 297.92 Local Government 23 1,128 27,800,381 473.96 State Government 17 659 21,089,494 615.43

36
TABLE 6. COUNTY SUMMARY EMPLOYMENT AND TOTAL EARNINGS, BY INDUSTRY
CALENDAR YEAR 2004 NORTH AMERICAN INDUSTRY AVERAGE AVERAGE TOTAL EARNINGS AVERAGECLASSIFICATION SYSTEM EMPLOYING COVERED WEEKLYINDUSTRY GROUP UNITS EMPLOYMENT EARNINGS
*Note: Totals may not add due to rounding.
36
FAULKNER COUNTY - TOTAL 2,150 34,246 $1,014,498,334 $569.69 Natural Resources & Mining 9 48 1,715,643 687.36
Construction 305 2,607 76,036,006 560.89 Manufacturing 113 5,062 184,553,604 701.13 Trade, Transportation & Utilities 541 5,950 128,177,989 414.28 Wholesale Trade 118 667 21,732,408 626.58 Retail Trade 362 4,696 85,868,585 351.64 Transportation, Warehousing & Utilities 61 587 20,576,996 674.13 Information 38 390 11,807,778 582.24 Financial Activities 249 1,296 37,923,218 562.73 Professional & Business Services 285 5,036 230,814,536 881.40 Education & Health Services 257 4,320 128,167,534 570.55 Leisure & Hospitality 172 3,502 33,656,260 184.82 Other Services 129 600 11,584,618 371.30 Local Government 35 2,726 83,373,103 588.16 State Government 19 2,709 86,688,045 615.38
FRANKLIN COUNTY - TOTAL 312 4,296 $104,678,791 $468.59 Natural Resources & Mining 8 148 6,006,411 780.46
Construction 26 149 3,804,677 491.05 Manufacturing 21 1,059 27,431,404 498.14 Trade, Transportation & Utilities 98 867 20,995,289 465.69 Wholesale Trade 13 53 842,907 305.84 Retail Trade 60 508 8,004,202 303.01 Transportation, Warehousing & Utilities 26 306 12,148,180 763.46 Information 7 59 1,026,861 334.70 Financial Activities 25 177 4,658,820 506.17 Professional & Business Services 19 55 1,107,087 387.09 Education & Health Services 37 534 12,499,527 450.14 Leisure & Hospitality 26 312 2,721,040 167.72 Other Services 17 54 1,061,025 377.86 Local Government 20 750 19,716,464 505.55 State Government 10 132 3,650,186 531.79
37
TABLE 6. COUNTY SUMMARY EMPLOYMENT AND TOTAL EARNINGS, BY INDUSTRY
CALENDAR YEAR 2004 NORTH AMERICAN INDUSTRY AVERAGE AVERAGE TOTAL EARNINGS AVERAGECLASSIFICATION SYSTEM EMPLOYING COVERED WEEKLYINDUSTRY GROUP UNITS EMPLOYMENT EARNINGS
*Note: Totals may not add due to rounding.
37
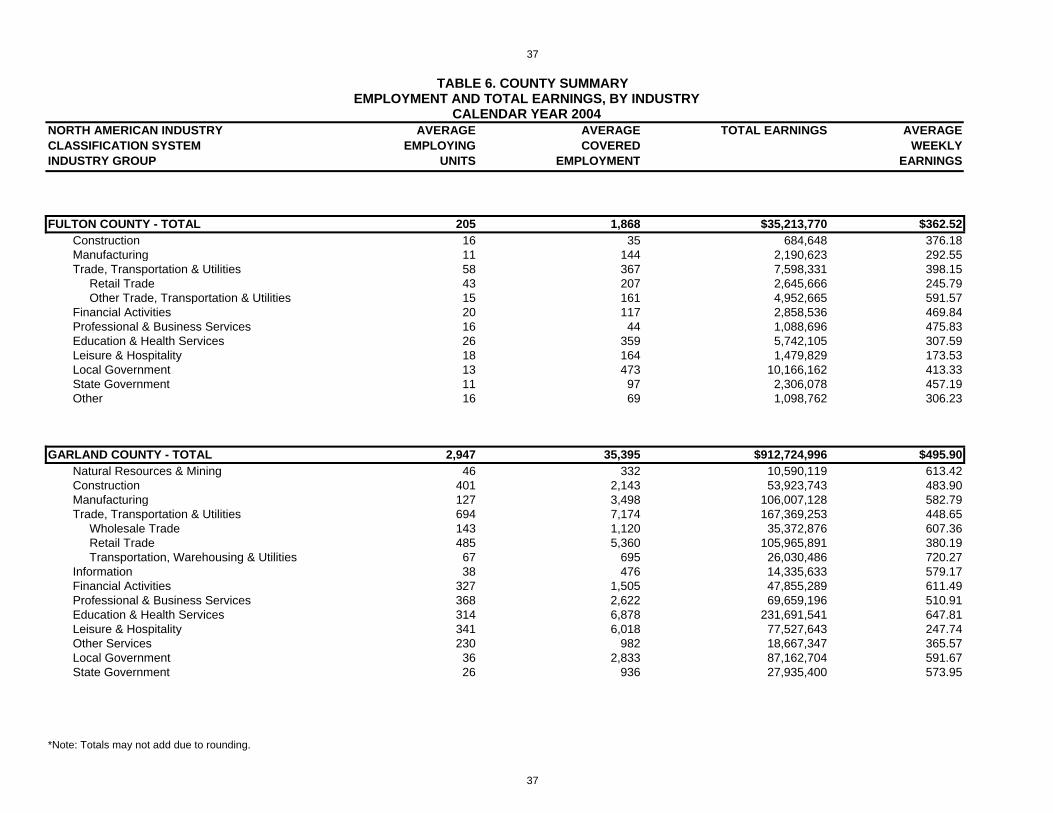
FULTON COUNTY - TOTAL 205 1,868 $35,213,770 $362.52 Construction 16 35 684,648 376.18 Manufacturing 11 144 2,190,623 292.55 Trade, Transportation & Utilities 58 367 7,598,331 398.15 Retail Trade 43 207 2,645,666 245.79 Other Trade, Transportation & Utilities 15 161 4,952,665 591.57 Financial Activities 20 117 2,858,536 469.84 Professional & Business Services 16 44 1,088,696 475.83 Education & Health Services 26 359 5,742,105 307.59 Leisure & Hospitality 18 164 1,479,829 173.53 Local Government 13 473 10,166,162 413.33 State Government 11 97 2,306,078 457.19 Other 16 69 1,098,762 306.23
GARLAND COUNTY - TOTAL 2,947 35,395 $912,724,996 $495.90 Natural Resources & Mining 46 332 10,590,119 613.42
Construction 401 2,143 53,923,743 483.90 Manufacturing 127 3,498 106,007,128 582.79 Trade, Transportation & Utilities 694 7,174 167,369,253 448.65 Wholesale Trade 143 1,120 35,372,876 607.36 Retail Trade 485 5,360 105,965,891 380.19 Transportation, Warehousing & Utilities 67 695 26,030,486 720.27 Information 38 476 14,335,633 579.17 Financial Activities 327 1,505 47,855,289 611.49 Professional & Business Services 368 2,622 69,659,196 510.91 Education & Health Services 314 6,878 231,691,541 647.81 Leisure & Hospitality 341 6,018 77,527,643 247.74 Other Services 230 982 18,667,347 365.57 Local Government 36 2,833 87,162,704 591.67 State Government 26 936 27,935,400 573.95

38
TABLE 6. COUNTY SUMMARY EMPLOYMENT AND TOTAL EARNINGS, BY INDUSTRY
CALENDAR YEAR 2004 NORTH AMERICAN INDUSTRY AVERAGE AVERAGE TOTAL EARNINGS AVERAGECLASSIFICATION SYSTEM EMPLOYING COVERED WEEKLYINDUSTRY GROUP UNITS EMPLOYMENT EARNINGS
*Note: Totals may not add due to rounding.
38
GRANT COUNTY - TOTAL 290 3,497 $89,843,049 $494.07 Natural Resources & Mining 27 246 9,066,649 708.77
Construction 30 219 5,970,904 524.32 Manufacturing 21 839 26,160,674 599.63 Trade, Transportation & Utilities 87 555 12,198,638 422.68 Wholesale Trade 16 140 4,428,700 608.34 Retail Trade 40 356 6,045,580 326.58 Transportation, Warehousing & Utilities 30 59 1,724,358 562.05 Information 3 38 1,137,798 575.81 Financial Activities 21 96 2,565,446 513.91 Professional & Business Services 22 73 2,211,479 582.58 Education & Health Services 23 226 4,736,725 403.06 Leisure & Hospitality 21 270 2,540,285 180.93 Other Services 16 40 703,376 338.16 Local Government 10 834 21,026,587 484.84 State Government 10 63 1,524,488 465.35
GREENE COUNTY - TOTAL 849 14,334 $372,112,623 $499.23 Natural Resources & Mining 36 188 4,695,682 480.33
Construction 73 379 9,077,789 460.61 Manufacturing 55 5,159 169,373,818 631.36 Trade, Transportation & Utilities 253 2,235 48,007,699 413.08 Wholesale Trade 54 449 13,203,843 565.52 Retail Trade 167 1,602 28,890,596 346.81 Transportation, Warehousing & Utilities 32 184 5,913,260 618.02 Information 13 103 2,332,532 435.50 Financial Activities 83 453 11,102,579 471.33 Professional & Business Services 75 1,322 30,938,314 450.05 Education & Health Services 100 1,630 38,213,834 450.85 Leisure & Hospitality 63 1,047 9,232,593 169.58 Other Services 55 172 3,114,663 348.24 Local Government 32 1,398 38,437,572 528.74 State Government 11 249 7,585,548 585.85
39
TABLE 6. COUNTY SUMMARY EMPLOYMENT AND TOTAL EARNINGS, BY INDUSTRY
CALENDAR YEAR 2004 NORTH AMERICAN INDUSTRY AVERAGE AVERAGE TOTAL EARNINGS AVERAGECLASSIFICATION SYSTEM EMPLOYING COVERED WEEKLYINDUSTRY GROUP UNITS EMPLOYMENT EARNINGS
*Note: Totals may not add due to rounding.
39
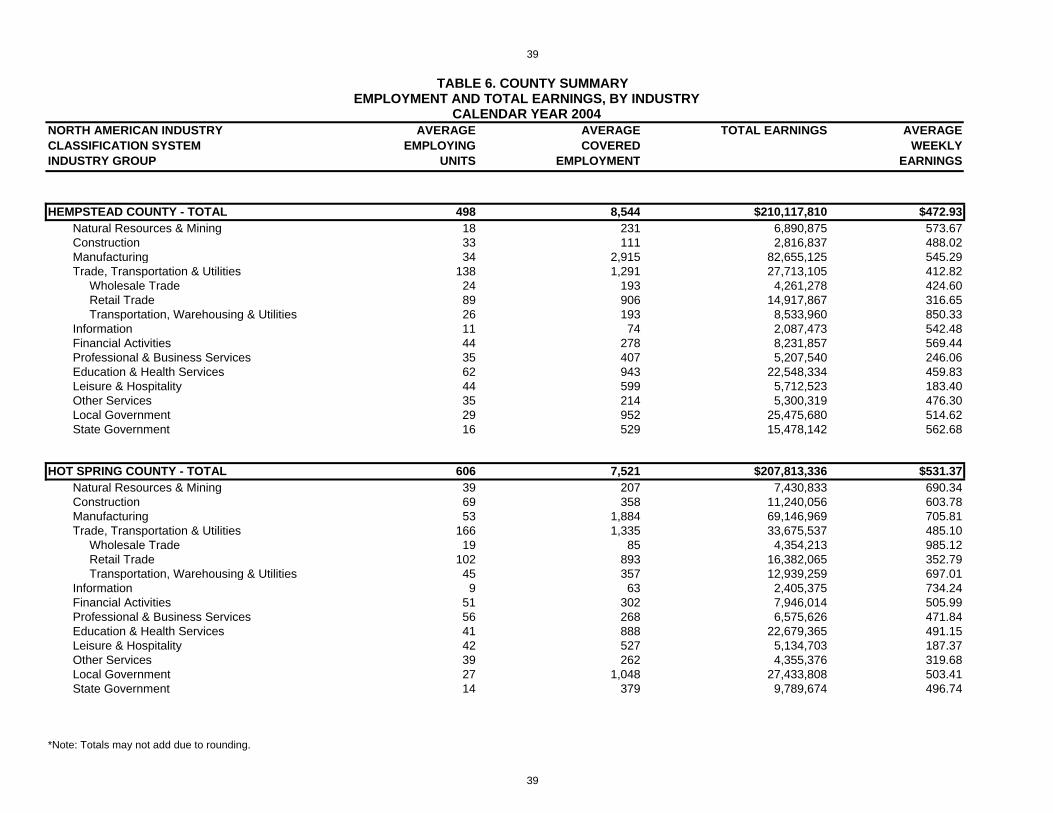
HEMPSTEAD COUNTY - TOTAL 498 8,544 $210,117,810 $472.93 Natural Resources & Mining 18 231 6,890,875 573.67
Construction 33 111 2,816,837 488.02 Manufacturing 34 2,915 82,655,125 545.29 Trade, Transportation & Utilities 138 1,291 27,713,105 412.82 Wholesale Trade 24 193 4,261,278 424.60 Retail Trade 89 906 14,917,867 316.65 Transportation, Warehousing & Utilities 26 193 8,533,960 850.33 Information 11 74 2,087,473 542.48 Financial Activities 44 278 8,231,857 569.44 Professional & Business Services 35 407 5,207,540 246.06 Education & Health Services 62 943 22,548,334 459.83 Leisure & Hospitality 44 599 5,712,523 183.40 Other Services 35 214 5,300,319 476.30 Local Government 29 952 25,475,680 514.62 State Government 16 529 15,478,142 562.68
HOT SPRING COUNTY - TOTAL 606 7,521 $207,813,336 $531.37 Natural Resources & Mining 39 207 7,430,833 690.34
Construction 69 358 11,240,056 603.78 Manufacturing 53 1,884 69,146,969 705.81 Trade, Transportation & Utilities 166 1,335 33,675,537 485.10 Wholesale Trade 19 85 4,354,213 985.12 Retail Trade 102 893 16,382,065 352.79 Transportation, Warehousing & Utilities 45 357 12,939,259 697.01 Information 9 63 2,405,375 734.24 Financial Activities 51 302 7,946,014 505.99 Professional & Business Services 56 268 6,575,626 471.84 Education & Health Services 41 888 22,679,365 491.15 Leisure & Hospitality 42 527 5,134,703 187.37 Other Services 39 262 4,355,376 319.68 Local Government 27 1,048 27,433,808 503.41 State Government 14 379 9,789,674 496.74

40
TABLE 6. COUNTY SUMMARY EMPLOYMENT AND TOTAL EARNINGS, BY INDUSTRY
CALENDAR YEAR 2004 NORTH AMERICAN INDUSTRY AVERAGE AVERAGE TOTAL EARNINGS AVERAGECLASSIFICATION SYSTEM EMPLOYING COVERED WEEKLYINDUSTRY GROUP UNITS EMPLOYMENT EARNINGS
*Note: Totals may not add due to rounding.
40
HOWARD COUNTY - TOTAL 362 7,994 $192,137,312 $462.22 Natural Resources & Mining 23 264 7,227,031 526.44
Construction 25 111 2,573,646 445.88 Manufacturing 26 4,622 120,124,857 499.80 Trade, Transportation & Utilities 110 929 19,872,283 411.37 Wholesale Trade 17 94 2,975,294 608.69 Retail Trade 71 653 10,923,080 321.68 Transportation, Warehousing & Utilities 23 182 5,973,909 631.22 Information 7 36 918,696 490.76 Financial Activities 36 168 4,039,366 462.38 Professional & Business Services 26 105 2,486,589 455.42 Education & Health Services 35 611 11,396,294 358.69 Leisure & Hospitality 23 285 2,462,900 166.19 Other Services 20 105 1,833,792 335.86 Local Government 18 637 15,853,257 478.60 State Government 12 123 3,348,601 523.55
INDEPENDENCE COUNTY - TOTAL 918 16,106 $416,435,878 $497.23 Natural Resources & Mining 13 133 3,840,240 555.27
Construction 68 433 11,375,516 505.22 Manufacturing 54 5,069 155,376,070 589.47 Trade, Transportation & Utilities 295 3,014 75,744,489 483.29 Wholesale Trade 53 456 13,103,411 552.61 Retail Trade 186 1,738 30,852,773 341.38 Transportation, Warehousing & Utilities 57 819 31,788,305 746.41 Information 11 168 4,805,469 550.08 Financial Activities 83 416 11,461,121 529.82 Professional & Business Services 92 1,025 19,129,763 358.91 Education & Health Services 103 2,516 73,488,038 561.70 Leisure & Hospitality 75 1,115 9,778,931 168.66 Other Services 69 347 5,986,772 331.79 Local Government 37 1,416 33,048,046 448.83 State Government 19 455 12,401,423 524.15

41
TABLE 6. COUNTY SUMMARY EMPLOYMENT AND TOTAL EARNINGS, BY INDUSTRY
CALENDAR YEAR 2004 NORTH AMERICAN INDUSTRY AVERAGE AVERAGE TOTAL EARNINGS AVERAGECLASSIFICATION SYSTEM EMPLOYING COVERED WEEKLYINDUSTRY GROUP UNITS EMPLOYMENT EARNINGS
*Note: Totals may not add due to rounding.
41
IZARD COUNTY - TOTAL 254 2,919 $65,997,855 $434.80 Natural Resources & Mining 5 79 2,488,041 605.66
Construction 27 72 1,315,146 351.27 Manufacturing 13 489 14,675,759 577.15 Trade, Transportation & Utilities 71 515 10,032,656 374.63 Retail Trade 52 396 6,641,631 322.53 Other Trade, Transportation & Utilities 20 120 3,391,025 543.43 Information 3 8 148,383 356.69 Financial Activities 25 141 3,905,262 532.63 Professional & Business Services 23 79 1,409,002 342.99 Education & Health Services 22 416 8,048,140 372.05 Leisure & Hospitality 24 159 1,362,978 164.85 Other Services 14 38 607,423 307.40 Local Government 18 509 11,189,970 422.77 State Government 11 413 10,815,095 503.59
JACKSON COUNTY - TOTAL 524 5,832 $148,181,480 $488.62 Natural Resources & Mining 46 239 5,301,172 426.55
Construction 31 195 5,216,236 514.42 Manufacturing 30 1,067 34,425,359 620.46 Trade, Transportation & Utilities 141 1,239 28,549,570 443.12 Wholesale Trade 35 241 7,939,652 633.55 Retail Trade 86 742 12,873,207 333.64 Transportation, Warehousing & Utilities 20 257 7,736,711 578.92 Information 5 41 1,306,111 612.62 Financial Activities 43 188 4,796,503 490.64 Professional & Business Services 39 131 3,404,107 499.72 Education & Health Services 67 1,024 29,140,196 547.25 Leisure & Hospitality 36 315 3,272,492 199.79 Other Services 40 120 2,092,923 335.40 Local Government 34 723 15,359,164 408.53 State Government 14 552 15,317,647 533.64
42
TABLE 6. COUNTY SUMMARY EMPLOYMENT AND TOTAL EARNINGS, BY INDUSTRY
CALENDAR YEAR 2004 NORTH AMERICAN INDUSTRY AVERAGE AVERAGE TOTAL EARNINGS AVERAGECLASSIFICATION SYSTEM EMPLOYING COVERED WEEKLYINDUSTRY GROUP UNITS EMPLOYMENT EARNINGS
*Note: Totals may not add due to rounding.
42
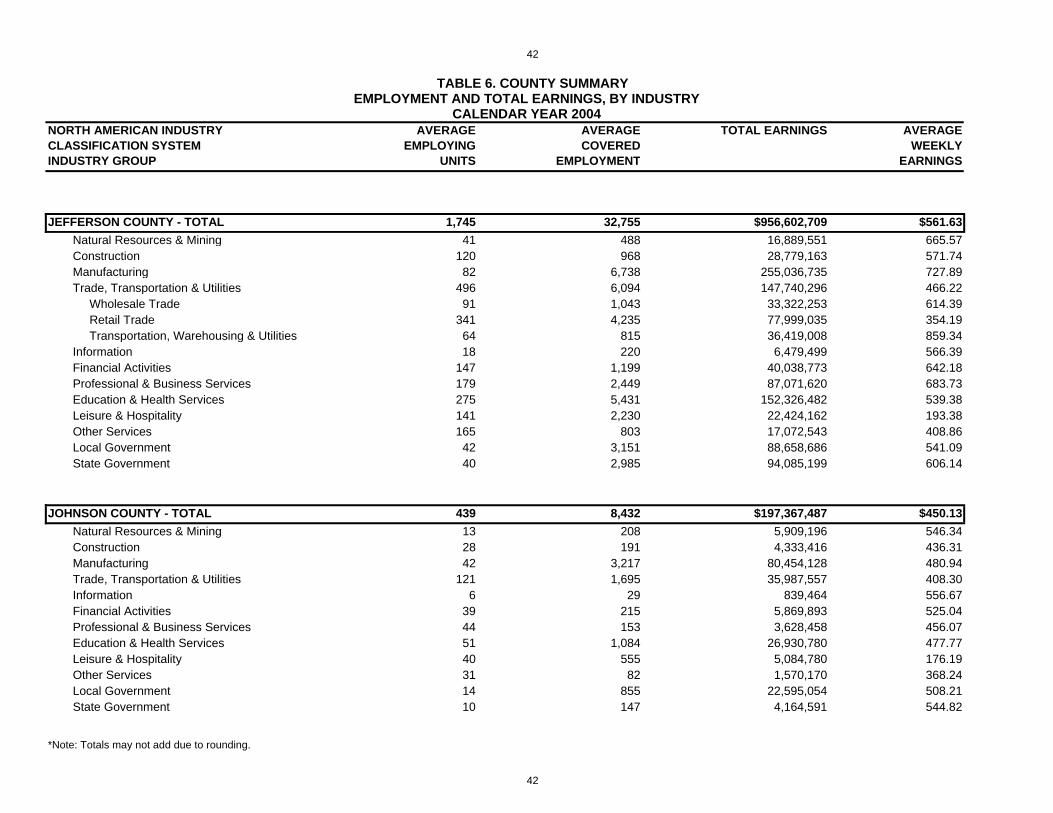
JEFFERSON COUNTY - TOTAL 1,745 32,755 $956,602,709 $561.63 Natural Resources & Mining 41 488 16,889,551 665.57
Construction 120 968 28,779,163 571.74 Manufacturing 82 6,738 255,036,735 727.89 Trade, Transportation & Utilities 496 6,094 147,740,296 466.22 Wholesale Trade 91 1,043 33,322,253 614.39 Retail Trade 341 4,235 77,999,035 354.19 Transportation, Warehousing & Utilities 64 815 36,419,008 859.34 Information 18 220 6,479,499 566.39 Financial Activities 147 1,199 40,038,773 642.18 Professional & Business Services 179 2,449 87,071,620 683.73 Education & Health Services 275 5,431 152,326,482 539.38 Leisure & Hospitality 141 2,230 22,424,162 193.38 Other Services 165 803 17,072,543 408.86 Local Government 42 3,151 88,658,686 541.09 State Government 40 2,985 94,085,199 606.14
JOHNSON COUNTY - TOTAL 439 8,432 $197,367,487 $450.13 Natural Resources & Mining 13 208 5,909,196 546.34
Construction 28 191 4,333,416 436.31 Manufacturing 42 3,217 80,454,128 480.94 Trade, Transportation & Utilities 121 1,695 35,987,557 408.30 Information 6 29 839,464 556.67 Financial Activities 39 215 5,869,893 525.04 Professional & Business Services 44 153 3,628,458 456.07 Education & Health Services 51 1,084 26,930,780 477.77 Leisure & Hospitality 40 555 5,084,780 176.19 Other Services 31 82 1,570,170 368.24 Local Government 14 855 22,595,054 508.21 State Government 10 147 4,164,591 544.82
43
TABLE 6. COUNTY SUMMARY EMPLOYMENT AND TOTAL EARNINGS, BY INDUSTRY
CALENDAR YEAR 2004 NORTH AMERICAN INDUSTRY AVERAGE AVERAGE TOTAL EARNINGS AVERAGECLASSIFICATION SYSTEM EMPLOYING COVERED WEEKLYINDUSTRY GROUP UNITS EMPLOYMENT EARNINGS
*Note: Totals may not add due to rounding.
43
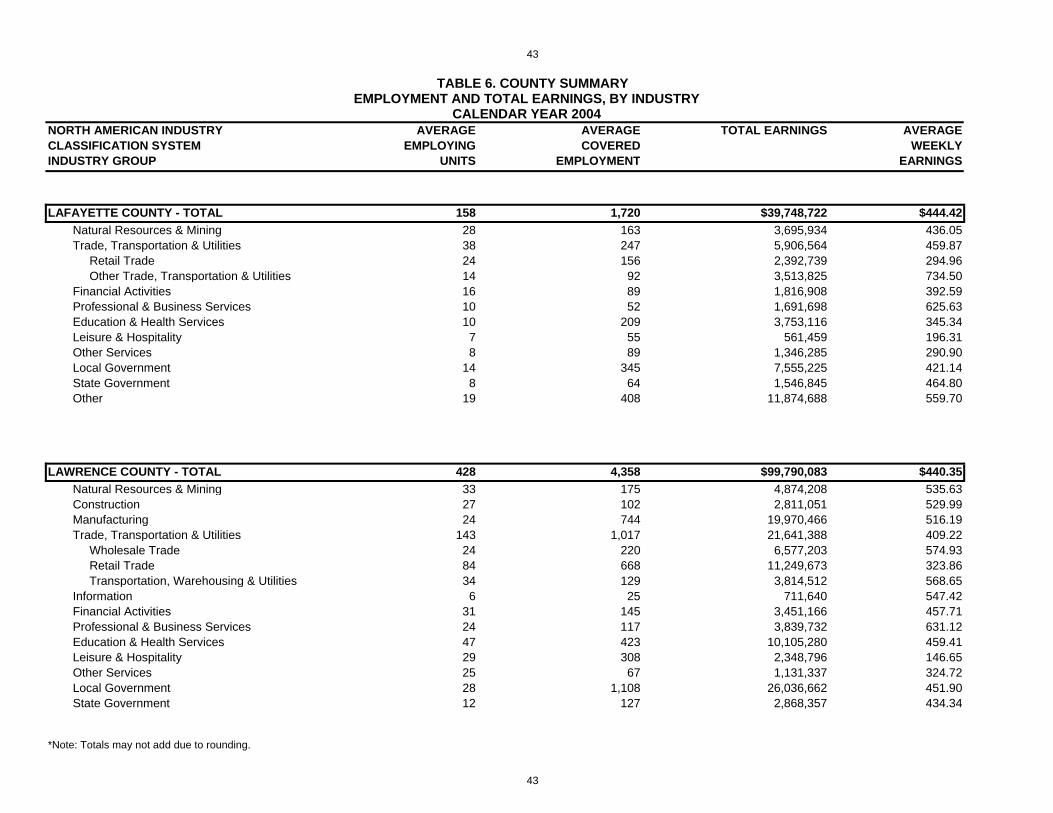
LAFAYETTE COUNTY - TOTAL 158 1,720 $39,748,722 $444.42 Natural Resources & Mining 28 163 3,695,934 436.05
Trade, Transportation & Utilities 38 247 5,906,564 459.87 Retail Trade 24 156 2,392,739 294.96 Other Trade, Transportation & Utilities 14 92 3,513,825 734.50 Financial Activities 16 89 1,816,908 392.59 Professional & Business Services 10 52 1,691,698 625.63 Education & Health Services 10 209 3,753,116 345.34 Leisure & Hospitality 7 55 561,459 196.31 Other Services 8 89 1,346,285 290.90 Local Government 14 345 7,555,225 421.14 State Government 8 64 1,546,845 464.80 Other 19 408 11,874,688 559.70
LAWRENCE COUNTY - TOTAL 428 4,358 $99,790,083 $440.35 Natural Resources & Mining 33 175 4,874,208 535.63
Construction 27 102 2,811,051 529.99 Manufacturing 24 744 19,970,466 516.19 Trade, Transportation & Utilities 143 1,017 21,641,388 409.22 Wholesale Trade 24 220 6,577,203 574.93 Retail Trade 84 668 11,249,673 323.86 Transportation, Warehousing & Utilities 34 129 3,814,512 568.65 Information 6 25 711,640 547.42 Financial Activities 31 145 3,451,166 457.71 Professional & Business Services 24 117 3,839,732 631.12 Education & Health Services 47 423 10,105,280 459.41 Leisure & Hospitality 29 308 2,348,796 146.65 Other Services 25 67 1,131,337 324.72 Local Government 28 1,108 26,036,662 451.90 State Government 12 127 2,868,357 434.34

44
TABLE 6. COUNTY SUMMARY EMPLOYMENT AND TOTAL EARNINGS, BY INDUSTRY
CALENDAR YEAR 2004 NORTH AMERICAN INDUSTRY AVERAGE AVERAGE TOTAL EARNINGS AVERAGECLASSIFICATION SYSTEM EMPLOYING COVERED WEEKLYINDUSTRY GROUP UNITS EMPLOYMENT EARNINGS
*Note: Totals may not add due to rounding.
44
LEE COUNTY - TOTAL 221 2,141 $50,662,903 $455.06 Natural Resources & Mining 30 228 5,215,624 439.91
Construction 8 13 231,351 342.24 Trade, Transportation & Utilities 65 381 8,438,143 425.91 Wholesale Trade 9 68 1,994,527 564.06 Retail Trade 38 217 3,340,242 296.02 Transportation, Warehousing & Utilities 18 97 3,103,374 615.26 Financial Activities 12 79 1,805,067 439.40 Professional & Business Services 18 75 1,642,632 421.19 Education & Health Services 28 295 6,642,920 433.05 Leisure & Hospitality 8 75 642,966 164.86 Local Government 17 369 9,173,465 478.08 State Government 8 445 12,149,551 525.05 Other 29 181 4,721,184 501.61
LINCOLN COUNTY - TOTAL 216 3,108 $75,444,201 $466.81 Natural Resources & Mining 31 210 5,588,301 511.75
Construction 17 92 1,943,063 406.16 Manufacturing 10 486 12,901,371 510.50 Trade, Transportation & Utilities 55 396 9,840,493 477.88 Wholesale Trade 8 33 1,068,023 622.39 Retail Trade 28 214 3,108,445 279.34 Transportation, Warehousing & Utilities 18 149 5,664,025 731.03 Financial Activities 22 94 2,224,844 455.16 Professional & Business Services 11 25 629,651 484.35 Education & Health Services 20 319 6,122,460 369.09 Leisure & Hospitality 15 120 1,093,694 175.27 Local & State Government 22 1,317 34,233,937 499.88 Other 14 48 866,387 347.11

45
TABLE 6. COUNTY SUMMARY EMPLOYMENT AND TOTAL EARNINGS, BY INDUSTRY
CALENDAR YEAR 2004 NORTH AMERICAN INDUSTRY AVERAGE AVERAGE TOTAL EARNINGS AVERAGECLASSIFICATION SYSTEM EMPLOYING COVERED WEEKLYINDUSTRY GROUP UNITS EMPLOYMENT EARNINGS
*Note: Totals may not add due to rounding.
45
LITTLE RIVER COUNTY - TOTAL 253 4,511 $169,390,087 $722.12 Natural Resources & Mining 12 80 2,319,020 557.46
Trade, Transportation & Utilities 76 1,062 32,284,053 584.60 Wholesale Trade 9 32 860,914 517.38 Retail Trade 45 349 5,826,856 321.07 Transportation, Warehousing & Utilities 22 682 25,596,283 721.75 Information 4 11 331,042 578.74 Financial Activities 27 126 2,980,476 454.90 Professional & Business Services 21 167 4,149,095 477.79 Education & Health Services 14 158 3,319,743 404.06 Leisure & Hospitality 19 226 1,998,451 170.05 Other Services 16 100 1,201,376 231.03 Local Government 20 726 17,270,603 457.48 State Government 12 91 2,138,739 451.97 Other 32 1,763 101,397,489 1106.04
LOGAN COUNTY - TOTAL 440 5,768 $135,244,698 $450.91 Natural Resources & Mining 14 81 2,657,328 630.89
Construction 44 136 2,758,802 390.10 Manufacturing 25 1,956 55,820,446 548.81 Trade, Transportation & Utilities 121 875 14,996,849 329.60 Wholesale Trade 20 55 941,056 329.04 Retail Trade 76 757 12,209,391 310.17 Transportation, Warehousing & Utilities 26 63 1,846,402 563.61 Information 9 40 1,332,220 640.49 Financial Activities 43 230 7,105,227 594.08 Professional & Business Services 37 105 2,378,091 435.55 Education & Health Services 47 709 15,041,180 407.97 Leisure & Hospitality 30 340 3,046,167 172.29 Other Services 32 90 1,757,415 375.52 Local Government 23 772 18,294,285 455.72 State Government 16 433 10,056,688 446.65

46
TABLE 6. COUNTY SUMMARY EMPLOYMENT AND TOTAL EARNINGS, BY INDUSTRY
CALENDAR YEAR 2004 NORTH AMERICAN INDUSTRY AVERAGE AVERAGE TOTAL EARNINGS AVERAGECLASSIFICATION SYSTEM EMPLOYING COVERED WEEKLYINDUSTRY GROUP UNITS EMPLOYMENT EARNINGS
*Note: Totals may not add due to rounding.
46
LONOKE COUNTY - TOTAL 1,115 11,330 $279,689,446 $474.73 Natural Resources & Mining 73 460 14,322,425 598.76
Construction 152 953 27,475,651 554.44 Manufacturing 35 1,364 46,911,837 661.40 Trade, Transportation & Utilities 310 2,423 54,846,152 435.30 Wholesale Trade 71 412 15,073,215 703.57 Retail Trade 171 1,727 31,480,738 350.55 Transportation, Warehousing & Utilities 68 283 8,292,199 563.48 Information 16 122 4,566,701 719.85 Financial Activities 122 570 16,787,414 566.38 Professional & Business Services 128 469 12,033,433 493.42 Education & Health Services 97 1,320 28,270,082 411.86 Leisure & Hospitality 76 1,093 10,929,743 192.30 Other Services 62 177 3,512,058 381.58 Local Government 28 2,232 56,446,243 486.34 State Government 16 147 3,587,707 469.35
MADISON COUNTY - TOTAL 233 3,110 $72,088,330 $445.76 Natural Resources & Mining 15 65 1,551,029 458.88
Construction 37 93 2,115,814 437.51 Manufacturing 21 1,151 28,183,410 470.89 Trade, Transportation & Utilities 60 580 12,415,037 411.64 Wholesale Trade 12 43 2,151,640 962.27 Retail Trade 35 411 6,888,990 322.34 Transportation, Warehousing & Utilities 13 126 3,374,407 515.02 Information 4 37 1,556,111 808.79 Financial Activities 18 91 2,503,556 529.07 Professional & Business Services 19 118 2,696,550 439.46 Education & Health Services 20 235 4,251,725 347.93 Leisure & Hospitality 11 123 815,802 127.55 Other Services 13 28 618,164 424.56 Local Government 8 536 13,939,505 500.13 State Government 8 53 1,441,627 523.09

47
TABLE 6. COUNTY SUMMARY EMPLOYMENT AND TOTAL EARNINGS, BY INDUSTRY
CALENDAR YEAR 2004 NORTH AMERICAN INDUSTRY AVERAGE AVERAGE TOTAL EARNINGS AVERAGECLASSIFICATION SYSTEM EMPLOYING COVERED WEEKLYINDUSTRY GROUP UNITS EMPLOYMENT EARNINGS
*Note: Totals may not add due to rounding.
47
MARION COUNTY - TOTAL 276 3,903 $86,312,058 $425.27 Natural Resources & Mining 6 41 845,668 396.65
Construction 15 46 771,095 322.36 Manufacturing 27 1,683 41,987,458 479.77 Trade, Transportation & Utilities 59 553 9,484,161 329.82 Financial Activities 33 193 4,610,761 459.42 Professional & Business Services 24 42 1,000,741 458.21 Education & Health Services 24 338 6,345,637 361.04 Leisure & Hospitality 41 270 2,859,319 203.66 Local Government 20 534 12,691,948 457.07 State Government 8 110 2,564,803 448.39 Other 19 93 3,150,467 651.46
MILLER COUNTY - TOTAL 825 12,592 $377,680,190 $576.80 Natural Resources & Mining 33 159 4,691,712 567.45
Construction 86 872 24,344,991 536.90 Manufacturing 37 2,779 144,001,130 996.49 Trade, Transportation & Utilities 243 2,880 74,649,662 498.46 Wholesale Trade 65 614 21,705,143 679.82 Retail Trade 135 1,467 25,987,546 340.67 Transportation, Warehousing & Utilities 44 799 26,956,973 648.82 Information 9 94 4,424,721 905.22 Financial Activities 80 430 13,235,756 591.94 Professional & Business Services 79 808 16,177,990 385.04 Education & Health Services 74 949 21,928,395 444.36 Leisure & Hospitality 78 1,350 14,529,770 206.98 Other Services 67 389 5,803,061 286.88 Local Government 23 1,453 39,908,002 528.19 State Government 18 430 13,985,000 625.45

48
TABLE 6. COUNTY SUMMARY EMPLOYMENT AND TOTAL EARNINGS, BY INDUSTRY
CALENDAR YEAR 2004 NORTH AMERICAN INDUSTRY AVERAGE AVERAGE TOTAL EARNINGS AVERAGECLASSIFICATION SYSTEM EMPLOYING COVERED WEEKLYINDUSTRY GROUP UNITS EMPLOYMENT EARNINGS
*Note: Totals may not add due to rounding.
48
MISSISSIPPI COUNTY - TOTAL 1,121 17,748 $546,120,823 $591.75 Natural Resources & Mining 103 858 19,421,370 435.30
Construction 57 366 11,184,515 587.67 Manufacturing 55 4,718 240,812,659 981.56 Trade, Transportation & Utilities 310 3,028 73,272,354 465.35 Wholesale Trade 63 566 19,994,145 679.33 Retail Trade 198 1,904 32,213,501 325.36 Transportation, Warehousing & Utilities 50 558 21,064,708 725.97 Financial Activities 106 620 16,106,643 499.59 Professional & Business Services 93 954 24,199,651 487.82 Education & Health Services 149 1,605 39,242,835 470.20 Leisure & Hospitality 78 1,058 10,221,233 185.79 Local Government 46 2,352 56,958,082 465.71 State Government 26 666 17,045,700 492.20 Other 99 1,524 37,655,781 475.16
MONROE COUNTY - TOTAL 292 2,590 $52,300,431 $388.33 Natural Resources & Mining 32 183 3,807,900 400.16
Construction 15 50 1,024,359 393.98 Manufacturing 9 188 4,369,303 446.94 Trade, Transportation & Utilities 90 687 15,367,221 430.17 Wholesale Trade 23 199 5,542,477 535.61 Retail Trade 41 340 5,784,941 327.20 Transportation, Warehousing & Utilities 26 148 4,039,803 524.92 Information 7 41 753,417 353.39 Financial Activities 16 101 2,818,216 536.60 Professional & Business Services 15 39 881,267 434.55 Education & Health Services 28 350 5,704,666 313.44 Leisure & Hospitality 30 323 2,701,299 160.83 Other Services 18 69 1,206,127 336.16 Local Government 22 424 10,486,338 475.61 State Government 10 135 3,180,318 453.04

49
TABLE 6. COUNTY SUMMARY EMPLOYMENT AND TOTAL EARNINGS, BY INDUSTRY
CALENDAR YEAR 2004 NORTH AMERICAN INDUSTRY AVERAGE AVERAGE TOTAL EARNINGS AVERAGECLASSIFICATION SYSTEM EMPLOYING COVERED WEEKLYINDUSTRY GROUP UNITS EMPLOYMENT EARNINGS
*Note: Totals may not add due to rounding.
49
MONTGOMERY COUNTY - TOTAL 167 1,636 $31,914,914 $375.15 Natural Resources & Mining 14 59 1,305,130 425.40 Construction 22 170 4,274,002 483.48
Trade, Transportation & Utilities 44 218 4,020,705 354.68 Wholesale Trade 11 67 1,328,387 381.28 Retail Trade 25 126 2,117,054 323.12 Transportation, Warehousing & Utilities 8 26 575,264 425.49 Financial Activities 9 70 1,823,033 500.83 Education & Health Services 12 58 941,480 312.16 Leisure & Hospitality 20 225 2,995,628 256.04 Other Services 10 62 1,052,769 326.54 Local Government 9 444 9,162,944 396.87 State Government 8 57 1,429,622 482.33 Other 21 274 4,909,601 344.58
NEVADA COUNTY - TOTAL 196 2,540 $68,852,825 $521.30 Natural Resources & Mining 17 58 1,452,098 481.46
Construction 13 37 735,238 382.14 Manufacturing 7 716 30,543,034 820.34 Trade, Transportation & Utilities 48 450 9,538,616 407.63 Retail Trade 32 288 4,528,625 302.39 Other Trade, Transportation & Utilities 16 163 5,009,991 591.08 Financial Activities 12 66 1,861,712 542.46 Education & Health Services 12 381 7,249,260 365.90 Leisure & Hospitality 17 133 1,134,948 164.10 Other Services 17 84 965,396 221.02 Local Government 27 457 10,034,524 422.26 State Government 11 89 2,156,975 466.07 Other 15 70 3,181,024 873.91

50
TABLE 6. COUNTY SUMMARY EMPLOYMENT AND TOTAL EARNINGS, BY INDUSTRY
CALENDAR YEAR 2004 NORTH AMERICAN INDUSTRY AVERAGE AVERAGE TOTAL EARNINGS AVERAGECLASSIFICATION SYSTEM EMPLOYING COVERED WEEKLYINDUSTRY GROUP UNITS EMPLOYMENT EARNINGS
*Note: Totals may not add due to rounding.
50
NEWTON COUNTY - TOTAL 130 1,046 $18,505,832 $340.23 Natural Resources & Mining 8 17 194,076 219.54
Construction 8 7 67,952 186.68 Manufacturing 14 62 1,220,531 378.58 Trade, Transportation & Utilities 31 169 2,631,102 299.40 Wholesale Trade 4 10 262,719 505.23 Retail Trade 17 113 1,350,982 229.92 Transportation, Warehousing & Utilities 10 47 1,017,401 416.29 Education & Health Services 13 181 2,342,882 248.92 Leisure & Hospitality 19 72 774,184 206.78 Other Services 5 13 176,193 260.64 Local Government 12 372 7,929,858 409.94 State Government 7 92 1,593,391 333.07 Other 14 62 1,575,663 488.73
OUACHITA COUNTY - TOTAL 631 7,481 $180,642,418 $464.36 Natural Resources & Mining 48 438 13,778,089 604.94
Construction 46 196 4,448,692 436.49 Manufacturing 29 832 25,978,101 600.46 Trade, Transportation & Utilities 192 1,702 39,726,814 448.87 Wholesale Trade 33 290 10,128,485 671.65 Retail Trade 130 1,134 19,096,213 323.84 Transportation, Warehousing & Utilities 29 278 10,502,116 726.49 Information 9 94 2,636,147 539.31 Financial Activities 63 363 10,043,430 532.07 Professional & Business Services 44 392 7,703,965 377.94 Education & Health Services 66 1,243 30,428,642 470.77 Leisure & Hospitality 38 524 4,459,533 163.66 Other Services 54 175 3,373,635 370.73 Local Government 30 1,222 28,705,819 451.75 State Government 13 301 9,359,551 597.98

51
TABLE 6. COUNTY SUMMARY EMPLOYMENT AND TOTAL EARNINGS, BY INDUSTRY
CALENDAR YEAR 2004 NORTH AMERICAN INDUSTRY AVERAGE AVERAGE TOTAL EARNINGS AVERAGECLASSIFICATION SYSTEM EMPLOYING COVERED WEEKLYINDUSTRY GROUP UNITS EMPLOYMENT EARNINGS
*Note: Totals may not add due to rounding.
51
PERRY COUNTY - TOTAL 150 1,157 $25,274,442 $420.09 Natural Resources & Mining 6 29 933,478 619.02
Construction 25 77 2,150,205 537.01 Manufacturing 7 77 1,809,679 451.97 Trade, Transportation & Utilities 29 183 3,371,464 354.29 Wholesale Trade 4 7 291,579 801.04 Retail Trade 19 154 2,113,997 263.99 Transportation, Warehousing & Utilities 6 21 965,888 884.51 Financial Activities 14 56 1,977,783 679.18 Education & Health Services 15 166 3,021,134 349.99 Local Government 12 364 8,189,697 432.68 State Government 8 57 1,373,289 463.32 Other 34 150 2,447,713 313.81
PHILLIPS COUNTY - TOTAL 655 6,884 $160,073,311 $447.17 Natural Resources & Mining 76 498 10,482,953 404.81
Construction 32 135 3,091,088 440.33 Manufacturing 15 476 14,744,626 595.69 Trade, Transportation & Utilities 178 1,641 38,996,148 456.99 Wholesale Trade 37 418 13,021,325 599.07 Retail Trade 108 921 15,822,794 330.38 Transportation, Warehousing & Utilities 34 302 10,152,029 646.46 Information 12 62 1,759,294 545.69 Financial Activities 54 296 7,934,720 515.51 Professional & Business Services 57 318 7,432,573 449.48 Education & Health Services 104 1,125 25,311,185 432.67 Leisure & Hospitality 36 386 3,302,809 164.55 Other Services 43 107 1,888,273 339.37 Local Government 34 1,293 31,182,745 463.78 State Government 16 547 13,946,897 490.33
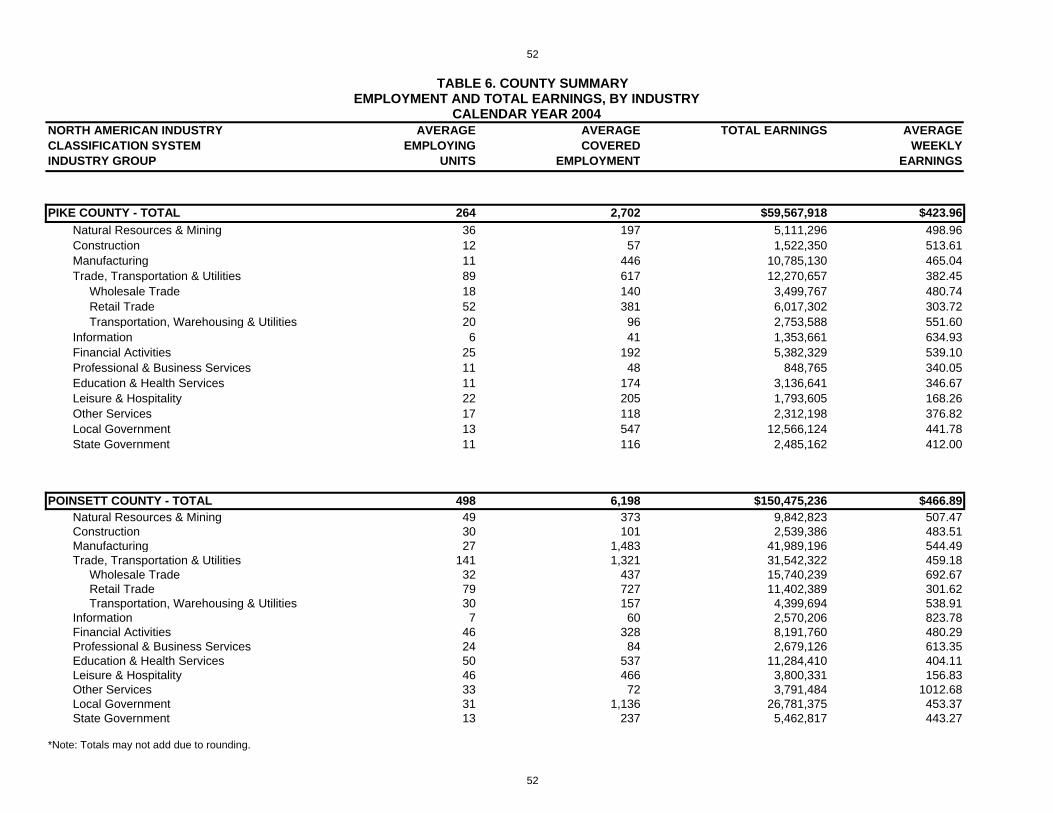
52
TABLE 6. COUNTY SUMMARY EMPLOYMENT AND TOTAL EARNINGS, BY INDUSTRY
CALENDAR YEAR 2004 NORTH AMERICAN INDUSTRY AVERAGE AVERAGE TOTAL EARNINGS AVERAGECLASSIFICATION SYSTEM EMPLOYING COVERED WEEKLYINDUSTRY GROUP UNITS EMPLOYMENT EARNINGS
*Note: Totals may not add due to rounding.
52
PIKE COUNTY - TOTAL 264 2,702 $59,567,918 $423.96 Natural Resources & Mining 36 197 5,111,296 498.96
Construction 12 57 1,522,350 513.61 Manufacturing 11 446 10,785,130 465.04 Trade, Transportation & Utilities 89 617 12,270,657 382.45 Wholesale Trade 18 140 3,499,767 480.74 Retail Trade 52 381 6,017,302 303.72 Transportation, Warehousing & Utilities 20 96 2,753,588 551.60 Information 6 41 1,353,661 634.93 Financial Activities 25 192 5,382,329 539.10 Professional & Business Services 11 48 848,765 340.05 Education & Health Services 11 174 3,136,641 346.67 Leisure & Hospitality 22 205 1,793,605 168.26 Other Services 17 118 2,312,198 376.82 Local Government 13 547 12,566,124 441.78 State Government 11 116 2,485,162 412.00
POINSETT COUNTY - TOTAL 498 6,198 $150,475,236 $466.89 Natural Resources & Mining 49 373 9,842,823 507.47
Construction 30 101 2,539,386 483.51 Manufacturing 27 1,483 41,989,196 544.49 Trade, Transportation & Utilities 141 1,321 31,542,322 459.18 Wholesale Trade 32 437 15,740,239 692.67 Retail Trade 79 727 11,402,389 301.62 Transportation, Warehousing & Utilities 30 157 4,399,694 538.91 Information 7 60 2,570,206 823.78 Financial Activities 46 328 8,191,760 480.29 Professional & Business Services 24 84 2,679,126 613.35 Education & Health Services 50 537 11,284,410 404.11 Leisure & Hospitality 46 466 3,800,331 156.83 Other Services 33 72 3,791,484 1012.68 Local Government 31 1,136 26,781,375 453.37 State Government 13 237 5,462,817 443.27

53
TABLE 6. COUNTY SUMMARY EMPLOYMENT AND TOTAL EARNINGS, BY INDUSTRY
CALENDAR YEAR 2004 NORTH AMERICAN INDUSTRY AVERAGE AVERAGE TOTAL EARNINGS AVERAGECLASSIFICATION SYSTEM EMPLOYING COVERED WEEKLYINDUSTRY GROUP UNITS EMPLOYMENT EARNINGS
*Note: Totals may not add due to rounding.
53
POLK COUNTY - TOTAL 525 6,127 $131,655,197 $413.23 Natural Resources & Mining 26 260 7,270,567 537.76
Construction 37 166 3,167,675 366.97 Manufacturing 48 1,418 35,017,419 474.90 Trade, Transportation & Utilities 154 1,318 25,159,559 367.10 Wholesale Trade 25 141 3,022,544 412.24 Retail Trade 84 845 13,782,723 313.67 Transportation, Warehousing & Utilities 45 331 8,354,292 485.38 Information 9 53 1,472,282 534.21 Financial Activities 38 216 5,549,731 494.10 Professional & Business Services 46 185 4,790,192 497.94 Education & Health Services 60 898 19,102,452 409.08 Leisure & Hospitality 39 409 3,338,542 156.97 Other Services 34 135 2,290,222 326.24 Local Government 21 754 18,134,943 462.53 State Government 15 314 6,361,613 389.61
POPE COUNTY - TOTAL 1,608 24,330 $678,111,072 $535.99 Natural Resources & Mining 20 541 12,780,114 454.29
Construction 164 1,118 36,436,861 626.75 Manufacturing 88 4,403 142,497,179 622.38 Trade, Transportation & Utilities 472 6,363 217,511,389 657.38 Wholesale Trade 104 757 22,267,465 565.68 Retail Trade 277 3,127 57,270,513 352.21 Transportation, Warehousing & Utilities 92 2,479 137,973,411 1070.32 Information 22 301 9,465,577 604.75 Financial Activities 155 740 22,346,768 580.74 Professional & Business Services 205 2,216 46,413,271 402.78 Education & Health Services 179 2,713 67,875,513 481.13 Leisure & Hospitality 129 2,262 21,634,757 183.93 Other Services 117 479 9,796,874 393.32 Local Government 39 2,114 54,858,442 499.04 State Government 17 1,080 36,494,327 649.83

54
TABLE 6. COUNTY SUMMARY EMPLOYMENT AND TOTAL EARNINGS, BY INDUSTRY
CALENDAR YEAR 2004 NORTH AMERICAN INDUSTRY AVERAGE AVERAGE TOTAL EARNINGS AVERAGECLASSIFICATION SYSTEM EMPLOYING COVERED WEEKLYINDUSTRY GROUP UNITS EMPLOYMENT EARNINGS
*Note: Totals may not add due to rounding.
54
PRAIRIE COUNTY - TOTAL 226 1,681 $38,283,631 $437.97 Natural Resources & Mining 24 135 3,763,363 536.09
Trade, Transportation & Utilities 69 398 8,076,550 390.25 Wholesale Trade 10 67 1,812,914 520.35 Retail Trade 37 238 3,078,527 248.75 Transportation, Warehousing & Utilities 22 93 3,185,109 658.62 Information 4 11 402,471 703.62 Financial Activities 17 65 1,795,712 531.28 Professional & Business Services 16 60 1,240,710 397.66 Education & Health Services 17 194 3,790,188 375.71 Leisure & Hospitality 19 113 999,375 170.08 Other Services 15 49 822,209 322.69 Local Government 15 339 7,634,423 433.09 State Government 10 50 1,272,263 489.33 Other 21 267 8,486,367 611.23
PULASKI COUNTY - TOTAL 13,168 232,134 $8,137,560,126 $674.14 Natural Resources & Mining 42 689 30,346,572 847.01
Construction 1,099 10,326 374,206,893 696.91 Manufacturing 428 16,126 641,576,961 765.10 Trade, Transportation & Utilities 3,188 51,043 1,682,347,450 633.83 Wholesale Trade 1,068 12,874 599,737,410 895.87 Retail Trade 1,738 24,980 556,942,196 428.76 Transportation, Warehousing & Utilities 382 13,189 525,667,844 766.47 Information 225 8,627 405,311,557 903.50 Financial Activities 1,604 16,210 781,248,591 926.84 Professional & Business Services 2,496 32,466 1,092,753,332 647.28 Education & Health Services 1,596 31,444 1,224,778,309 749.06 Leisure & Hospitality 971 18,841 240,406,050 245.38 Other Services 1,221 7,049 193,146,118 526.93 Local Government 103 15,937 535,623,425 646.32 State Government 196 23,377 935,814,868 769.84
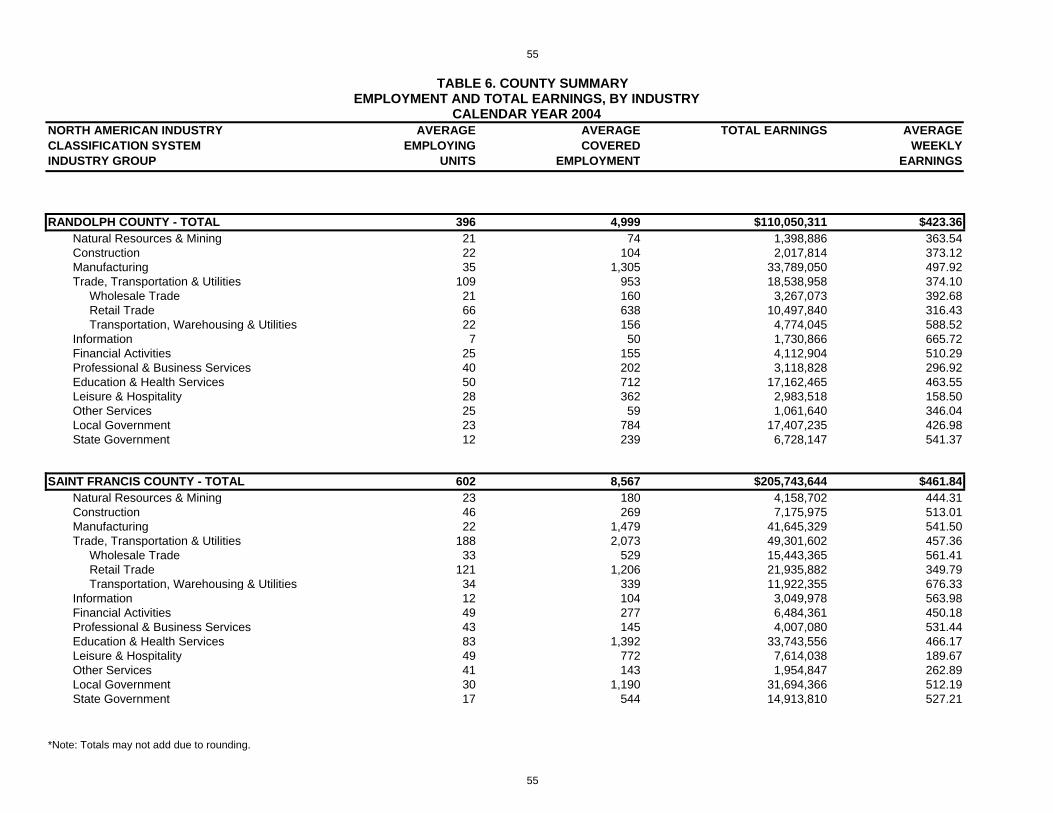
55
TABLE 6. COUNTY SUMMARY EMPLOYMENT AND TOTAL EARNINGS, BY INDUSTRY
CALENDAR YEAR 2004 NORTH AMERICAN INDUSTRY AVERAGE AVERAGE TOTAL EARNINGS AVERAGECLASSIFICATION SYSTEM EMPLOYING COVERED WEEKLYINDUSTRY GROUP UNITS EMPLOYMENT EARNINGS
*Note: Totals may not add due to rounding.
55
RANDOLPH COUNTY - TOTAL 396 4,999 $110,050,311 $423.36 Natural Resources & Mining 21 74 1,398,886 363.54
Construction 22 104 2,017,814 373.12 Manufacturing 35 1,305 33,789,050 497.92 Trade, Transportation & Utilities 109 953 18,538,958 374.10 Wholesale Trade 21 160 3,267,073 392.68 Retail Trade 66 638 10,497,840 316.43 Transportation, Warehousing & Utilities 22 156 4,774,045 588.52 Information 7 50 1,730,866 665.72 Financial Activities 25 155 4,112,904 510.29 Professional & Business Services 40 202 3,118,828 296.92 Education & Health Services 50 712 17,162,465 463.55 Leisure & Hospitality 28 362 2,983,518 158.50 Other Services 25 59 1,061,640 346.04 Local Government 23 784 17,407,235 426.98 State Government 12 239 6,728,147 541.37
SAINT FRANCIS COUNTY - TOTAL 602 8,567 $205,743,644 $461.84 Natural Resources & Mining 23 180 4,158,702 444.31
Construction 46 269 7,175,975 513.01 Manufacturing 22 1,479 41,645,329 541.50 Trade, Transportation & Utilities 188 2,073 49,301,602 457.36 Wholesale Trade 33 529 15,443,365 561.41 Retail Trade 121 1,206 21,935,882 349.79 Transportation, Warehousing & Utilities 34 339 11,922,355 676.33 Information 12 104 3,049,978 563.98 Financial Activities 49 277 6,484,361 450.18 Professional & Business Services 43 145 4,007,080 531.44 Education & Health Services 83 1,392 33,743,556 466.17 Leisure & Hospitality 49 772 7,614,038 189.67 Other Services 41 143 1,954,847 262.89 Local Government 30 1,190 31,694,366 512.19 State Government 17 544 14,913,810 527.21

56
TABLE 6. COUNTY SUMMARY EMPLOYMENT AND TOTAL EARNINGS, BY INDUSTRY
CALENDAR YEAR 2004 NORTH AMERICAN INDUSTRY AVERAGE AVERAGE TOTAL EARNINGS AVERAGECLASSIFICATION SYSTEM EMPLOYING COVERED WEEKLYINDUSTRY GROUP UNITS EMPLOYMENT EARNINGS
*Note: Totals may not add due to rounding.
56
SALINE COUNTY - TOTAL 1,523 18,853 $495,921,744 $505.86 Natural Resources & Mining 13 50 1,842,566 708.68
Construction 274 1,675 48,192,634 553.30 Manufacturing 80 1,774 68,263,485 740.00 Trade, Transportation & Utilities 398 4,398 111,653,767 488.22 Wholesale Trade 103 525 18,975,344 695.07 Retail Trade 252 3,618 84,042,827 446.71 Transportation, Warehousing & Utilities 44 255 8,635,596 651.25 Information 16 137 3,749,845 526.37 Financial Activities 144 676 18,594,870 528.98 Professional & Business Services 181 1,321 31,470,570 458.14 Education & Health Services 132 2,418 61,551,035 489.53 Leisure & Hospitality 113 2,017 21,964,651 209.42 Other Services 122 550 12,020,833 420.31 Local & State Government 51 3,839 116,617,488 584.17
SCOTT COUNTY - TOTAL 182 2,818 $61,430,026 $419.21 Natural Resources & Mining 17 175 4,951,120 544.08
Construction 11 38 742,289 375.65 Manufacturing 19 1,106 25,964,194 451.46 Trade, Transportation & Utilities 49 482 8,862,073 353.58 Wholesale Trade 8 58 1,468,767 486.99 Retail Trade 32 342 5,047,701 283.83 Transportation, Warehousing & Utilities 10 82 2,345,605 550.09 Information 4 13 377,332 558.18 Financial Activities 16 75 1,540,817 395.08 Professional & Business Services 8 15 235,538 301.97 Education & Health Services 19 300 6,614,728 424.02 Leisure & Hospitality 17 149 1,179,092 152.18 Other Services 11 57 1,789,770 603.84 Local Government 5 343 7,743,407 434.14 State Government 8 64 1,429,666 429.59

57
TABLE 6. COUNTY SUMMARY EMPLOYMENT AND TOTAL EARNINGS, BY INDUSTRY
CALENDAR YEAR 2004 NORTH AMERICAN INDUSTRY AVERAGE AVERAGE TOTAL EARNINGS AVERAGECLASSIFICATION SYSTEM EMPLOYING COVERED WEEKLYINDUSTRY GROUP UNITS EMPLOYMENT EARNINGS
*Note: Totals may not add due to rounding.
57
SEARCY COUNTY - TOTAL 150 1,580 $29,220,951 $355.66
Construction 5 14 260,015 357.16 Manufacturing 17 299 4,875,174 313.56 Trade, Transportation & Utilities 40 286 4,214,939 283.41 Retail Trade 30 208 2,872,260 265.56 Other Trade, Transportation & Utilities 10 78 1,342,679 331.04 Financial Activities 14 58 1,257,503 416.94 Professional & Business Services 17 38 777,806 393.63 Education & Health Services 14 275 4,763,166 333.09 Leisure & Hospitality 14 105 850,460 155.76 Local Government 9 293 6,973,566 457.70 State Government 9 172 4,293,376 480.03 Other 10 41 954,946 447.91
SEBASTIAN COUNTY - TOTAL 3,494 70,907 $2,148,099,986 $582.59 Natural Resources & Mining 60 993 43,444,059 841.35
Construction 280 2,729 84,451,584 595.12 Manufacturing 220 21,096 732,339,483 667.59 Trade, Transportation & Utilities 915 12,199 318,953,721 502.81 Wholesale Trade 226 2,315 87,506,214 726.92 Retail Trade 567 7,816 154,569,725 380.31 Transportation, Warehousing & Utilities 123 2,069 76,877,782 714.56 Information 56 1,222 49,243,866 774.96 Financial Activities 384 2,439 85,514,029 674.25 Professional & Business Services 509 9,141 243,137,588 511.51 Education & Health Services 409 9,120 332,473,299 701.07 Leisure & Hospitality 303 5,135 57,805,961 216.49 Other Services 294 1,474 32,500,933 424.03 Local Government 43 4,104 129,690,622 607.71 State Government 23 1,255 38,544,841 590.64

58
TABLE 6. COUNTY SUMMARY EMPLOYMENT AND TOTAL EARNINGS, BY INDUSTRY
CALENDAR YEAR 2004 NORTH AMERICAN INDUSTRY AVERAGE AVERAGE TOTAL EARNINGS AVERAGECLASSIFICATION SYSTEM EMPLOYING COVERED WEEKLYINDUSTRY GROUP UNITS EMPLOYMENT EARNINGS
*Note: Totals may not add due to rounding.
58
SEVIER COUNTY - TOTAL 318 5,641 $132,087,013 $450.30 Natural Resources & Mining 23 189 4,719,486 480.21
Construction 26 139 3,544,601 490.40 Manufacturing 13 2,220 51,881,376 449.42 Trade, Transportation & Utilities 92 870 19,138,540 423.04 Wholesale Trade 16 135 5,679,100 808.99 Retail Trade 57 631 9,952,014 303.30 Transportation, Warehousing & Utilities 19 103 3,507,426 654.86 Information 7 44 1,352,772 591.25 Financial Activities 25 169 4,301,945 489.52 Professional & Business Services 29 132 8,289,477 1207.67 Education & Health Services 37 524 11,496,113 421.91 Leisure & Hospitality 20 280 2,626,044 180.36 Other Services 31 166 2,670,837 309.41 Local Government 12 738 17,399,053 453.38 State Government 9 171 4,666,769 524.83
SHARP COUNTY - TOTAL 383 3,869 $78,428,214 $389.83 Construction 34 183 4,410,295 463.46 Manufacturing 22 165 3,131,904 365.02 Trade, Transportation & Utilities 104 1,068 23,417,746 421.67 Retail Trade 74 658 10,423,165 304.63 Other Trade, Transportation & Utilities 31 411 12,994,581 608.02 Information 10 59 3,013,112 982.11 Financial Activities 30 259 6,773,746 502.95 Professional & Business Services 37 127 3,299,223 499.58 Education & Health Services 46 621 12,105,100 374.86 Leisure & Hospitality 38 470 3,746,964 153.31 Local Government 26 730 15,022,576 395.75 State Government 9 92 2,135,831 446.45 Other 29 95 1,371,717 277.68

59
TABLE 6. COUNTY SUMMARY EMPLOYMENT AND TOTAL EARNINGS, BY INDUSTRY
CALENDAR YEAR 2004 NORTH AMERICAN INDUSTRY AVERAGE AVERAGE TOTAL EARNINGS AVERAGECLASSIFICATION SYSTEM EMPLOYING COVERED WEEKLYINDUSTRY GROUP UNITS EMPLOYMENT EARNINGS
*Note: Totals may not add due to rounding.
59
STONE COUNTY - TOTAL 245 2,723 $54,147,463 $382.41 Construction 21 91 1,726,058 364.76 Manufacturing 25 466 9,948,279 410.54 Trade, Transportation & Utilities 78 574 12,430,471 416.46 Wholesale Trade 10 54 1,034,783 368.51 Retail Trade 54 476 9,973,576 402.94 Transportation, Warehousing & Utilities 14 44 1,422,112 621.55 Financial Activities 21 89 2,398,273 518.21 Professional & Business Services 9 24 554,348 444.19 Education & Health Services 22 420 9,315,560 426.54 Leisure & Hospitality 32 385 3,182,256 158.95 Other Services 12 25 428,762 329.82 Local Government 10 415 8,998,513 416.98 State Government 10 171 3,662,212 411.85 Other 6 62 1,502,731 466.11
UNION COUNTY - TOTAL 1,341 20,021 $603,329,623 $579.52 Natural Resources & Mining 102 549 16,325,901 571.88
Construction 101 1,468 56,027,130 733.95 Manufacturing 66 5,321 197,855,614 715.08 Trade, Transportation & Utilities 374 3,582 93,658,105 502.82 Wholesale Trade 82 527 22,650,196 826.53 Retail Trade 236 2,341 42,227,138 346.89 Transportation, Warehousing & Utilities 57 714 28,780,771 775.18 Information 21 219 5,529,978 485.60 Financial Activities 126 778 23,924,845 591.38 Professional & Business Services 136 1,711 61,727,453 693.79 Education & Health Services 128 2,198 61,773,403 540.47 Leisure & Hospitality 93 1,163 12,504,442 206.77 Other Services 139 641 11,780,199 353.42 Local Government 38 1,852 47,608,292 494.35 State Government 18 540 14,614,261 520.45
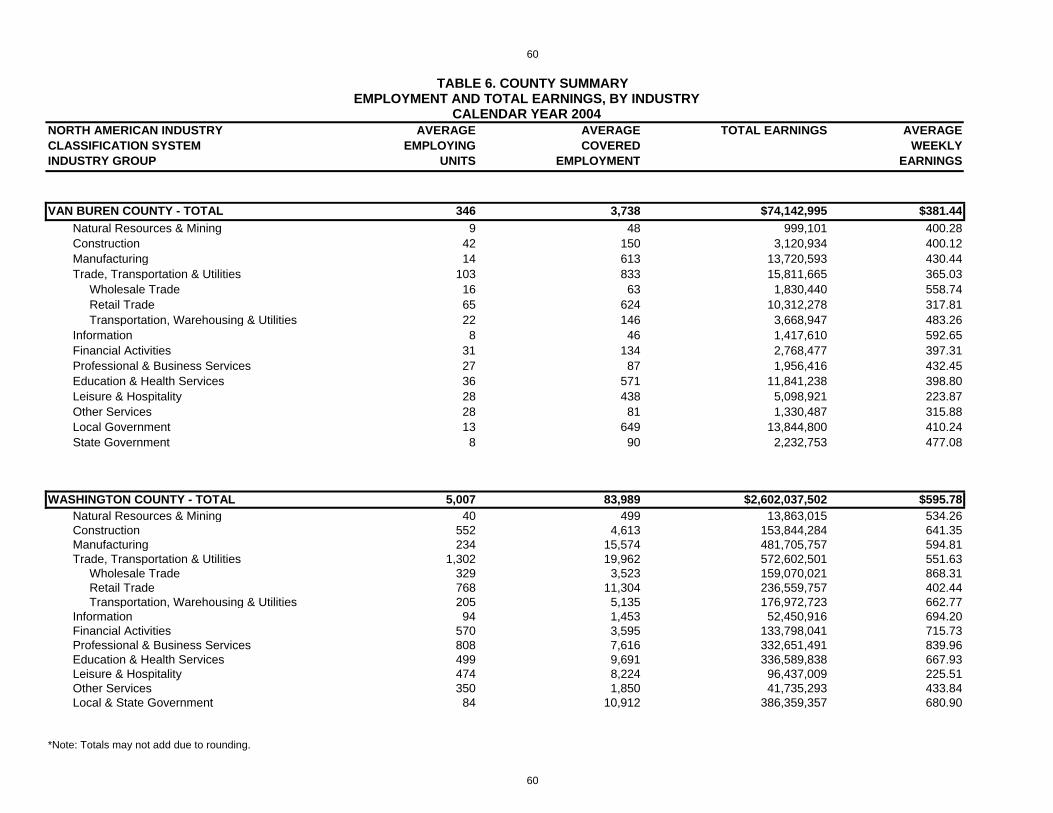
60
TABLE 6. COUNTY SUMMARY EMPLOYMENT AND TOTAL EARNINGS, BY INDUSTRY
CALENDAR YEAR 2004 NORTH AMERICAN INDUSTRY AVERAGE AVERAGE TOTAL EARNINGS AVERAGECLASSIFICATION SYSTEM EMPLOYING COVERED WEEKLYINDUSTRY GROUP UNITS EMPLOYMENT EARNINGS
*Note: Totals may not add due to rounding.
60
VAN BUREN COUNTY - TOTAL 346 3,738 $74,142,995 $381.44 Natural Resources & Mining 9 48 999,101 400.28
Construction 42 150 3,120,934 400.12 Manufacturing 14 613 13,720,593 430.44 Trade, Transportation & Utilities 103 833 15,811,665 365.03 Wholesale Trade 16 63 1,830,440 558.74 Retail Trade 65 624 10,312,278 317.81 Transportation, Warehousing & Utilities 22 146 3,668,947 483.26 Information 8 46 1,417,610 592.65 Financial Activities 31 134 2,768,477 397.31 Professional & Business Services 27 87 1,956,416 432.45 Education & Health Services 36 571 11,841,238 398.80 Leisure & Hospitality 28 438 5,098,921 223.87 Other Services 28 81 1,330,487 315.88 Local Government 13 649 13,844,800 410.24 State Government 8 90 2,232,753 477.08
WASHINGTON COUNTY - TOTAL 5,007 83,989 $2,602,037,502 $595.78 Natural Resources & Mining 40 499 13,863,015 534.26
Construction 552 4,613 153,844,284 641.35 Manufacturing 234 15,574 481,705,757 594.81 Trade, Transportation & Utilities 1,302 19,962 572,602,501 551.63 Wholesale Trade 329 3,523 159,070,021 868.31 Retail Trade 768 11,304 236,559,757 402.44 Transportation, Warehousing & Utilities 205 5,135 176,972,723 662.77 Information 94 1,453 52,450,916 694.20 Financial Activities 570 3,595 133,798,041 715.73 Professional & Business Services 808 7,616 332,651,491 839.96 Education & Health Services 499 9,691 336,589,838 667.93 Leisure & Hospitality 474 8,224 96,437,009 225.51 Other Services 350 1,850 41,735,293 433.84 Local & State Government 84 10,912 386,359,357 680.90
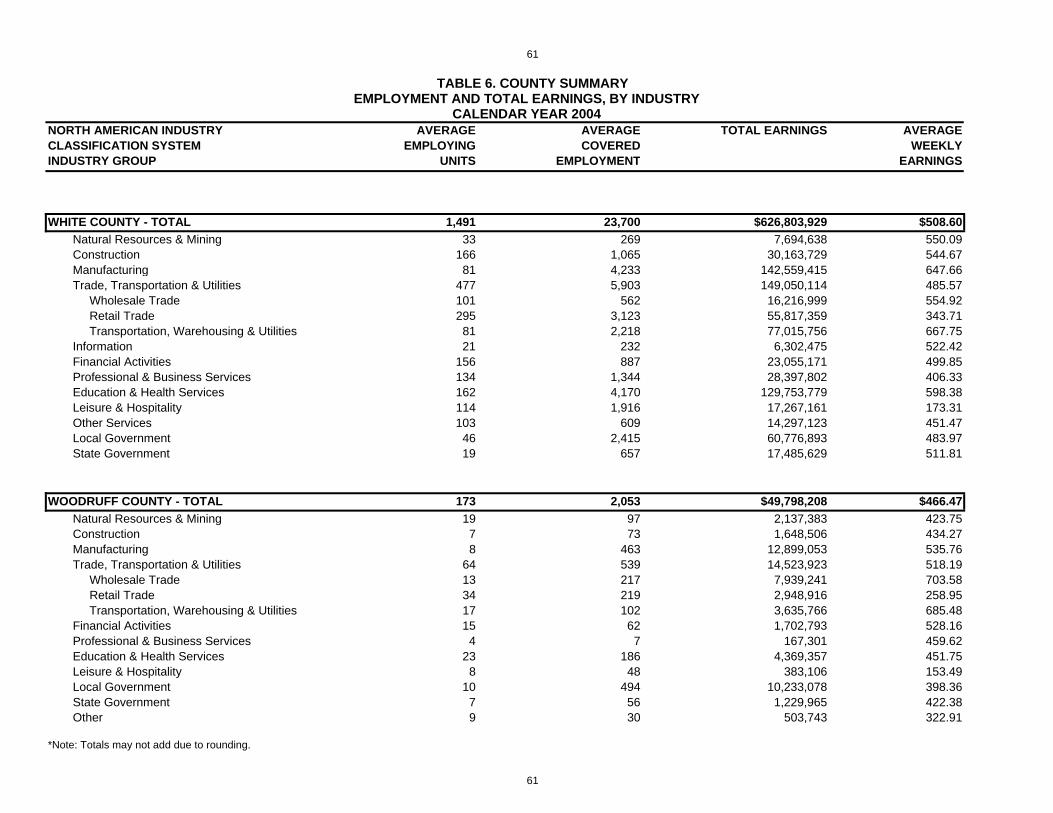
61
TABLE 6. COUNTY SUMMARY EMPLOYMENT AND TOTAL EARNINGS, BY INDUSTRY
CALENDAR YEAR 2004 NORTH AMERICAN INDUSTRY AVERAGE AVERAGE TOTAL EARNINGS AVERAGECLASSIFICATION SYSTEM EMPLOYING COVERED WEEKLYINDUSTRY GROUP UNITS EMPLOYMENT EARNINGS
*Note: Totals may not add due to rounding.
61
WHITE COUNTY - TOTAL 1,491 23,700 $626,803,929 $508.60 Natural Resources & Mining 33 269 7,694,638 550.09
Construction 166 1,065 30,163,729 544.67 Manufacturing 81 4,233 142,559,415 647.66 Trade, Transportation & Utilities 477 5,903 149,050,114 485.57 Wholesale Trade 101 562 16,216,999 554.92 Retail Trade 295 3,123 55,817,359 343.71 Transportation, Warehousing & Utilities 81 2,218 77,015,756 667.75 Information 21 232 6,302,475 522.42 Financial Activities 156 887 23,055,171 499.85 Professional & Business Services 134 1,344 28,397,802 406.33 Education & Health Services 162 4,170 129,753,779 598.38 Leisure & Hospitality 114 1,916 17,267,161 173.31 Other Services 103 609 14,297,123 451.47 Local Government 46 2,415 60,776,893 483.97 State Government 19 657 17,485,629 511.81
WOODRUFF COUNTY - TOTAL 173 2,053 $49,798,208 $466.47 Natural Resources & Mining 19 97 2,137,383 423.75
Construction 7 73 1,648,506 434.27 Manufacturing 8 463 12,899,053 535.76 Trade, Transportation & Utilities 64 539 14,523,923 518.19 Wholesale Trade 13 217 7,939,241 703.58 Retail Trade 34 219 2,948,916 258.95 Transportation, Warehousing & Utilities 17 102 3,635,766 685.48 Financial Activities 15 62 1,702,793 528.16 Professional & Business Services 4 7 167,301 459.62 Education & Health Services 23 186 4,369,357 451.75 Leisure & Hospitality 8 48 383,106 153.49 Local Government 10 494 10,233,078 398.36 State Government 7 56 1,229,965 422.38 Other 9 30 503,743 322.91

62
TABLE 6. COUNTY SUMMARY EMPLOYMENT AND TOTAL EARNINGS, BY INDUSTRY
CALENDAR YEAR 2004 NORTH AMERICAN INDUSTRY AVERAGE AVERAGE TOTAL EARNINGS AVERAGECLASSIFICATION SYSTEM EMPLOYING COVERED WEEKLYINDUSTRY GROUP UNITS EMPLOYMENT EARNINGS
*Note: Totals may not add due to rounding.
62
YELL COUNTY - TOTAL 390 6,896 $156,525,980 $436.50 Natural Resources & Mining 27 353 8,151,576 444.08
Construction 52 373 8,736,929 450.45 Manufacturing 23 2,924 69,454,813 456.80 Trade, Transportation & Utilities 89 608 11,019,394 348.54 Wholesale Trade 10 24 530,364 424.97 Retail Trade 60 492 7,641,262 298.67 Transportation, Warehousing & Utilities 18 92 2,847,768 595.27 Information 6 52 2,217,803 820.19 Financial Activities 35 198 4,910,290 476.91 Professional & Business Services 33 235 8,028,091 656.96 Education & Health Services 39 465 8,750,461 361.89 Leisure & Hospitality 27 366 3,495,757 183.68 Other Services 19 63 1,067,514 325.86 Local Government 28 1,140 28,074,243 473.59 State Government 13 120 2,619,109 419.73
REST-OF-STATE-TOTAL 4,273 14,748 731,148,978 $953.39 Natural Resources & Mining 53 228 7,832,173 660.61
Construction 536 2,274 75,089,088 635.01 Manufacturing 41 139 6,689,069 925.44 Trade, Transportation & Utilities 1,789 6,577 424,199,969 1240.34 Wholesale Trade 1,549 5,498 386,798,660 1352.93 Retail Trade 99 473 15,708,206 638.65 Transportation, Warehousing & Utilities 143 605 21,693,103 689.55 Information 114 294 12,628,715 826.05 Financial Activities 236 562 33,313,518 1139.94 Professional & Business Services 1,237 3,460 127,654,579 709.51 Education & Health Services 105 724 25,113,581 667.06 Leisure & Hospitality 41 84 2,259,630 517.31 Other 122 406 16,368,656 775.32

63
*Note: Totals may not add due to rounding.
63
TABLE 7. FEDERAL GOVERNMENT EMPLOYMENT AND EARNINGS IN ARKANSAS CALENDAR YEAR 2004
NORTH AMERICAN INDUSTRY AVERAGE AVERAGE TOTAL EARNINGS AVERAGECLASSIFICATION SYSTEM EMPLOYING COVERED WEEKLYINDUSTRY GROUP UNITS EMPLOYMENT EARNINGSManufacturing 2 212 $7,837,066 $710.91 Trade, Transportation & Utilities 449 6,862 $296,312,548 $830.42 Information 1 23 $1,249,352 $1,044.61 Financial Activities 24 193 $11,456,197 $1,141.51 Professional & Business Services 33 881 $49,691,535 $1,084.68 Education & Health Services 6 4,057 $269,330,659 $1,276.67 Leisure & Hospitality 16 225 $8,368,867 $715.29 Other Services 2 290 $3,977,507 $263.76 Public Administration 451 8,036 $429,746,560 $1,028.42
TOTAL 984 20,779 $1,077,970,291 $997.65

64
TABLE 8. WORKFORCE INFORMATION AREA, SUMMARY EMPLOYMENT AND TOTAL EARNINGS, BY INDUSTRY
CALENDAR YEAR 2004
NORTH AMERICAN INDUSTRY AVERAGE AVERAGE TOTAL EARNINGS AVERAGECLASSIFICATION SYSTEM EMPLOYING COVERED WEEKLYINDUSTRY GROUP UNITS EMPLOYMENT EARNINGS
64
CENTRAL WORKFORCE INFORMATION* 5,307 68,700 $1,880,693,586 $526.45 Natural Resources & Mining 151 876 25,451,897 558.74 Construction 762 5,371 155,837,170 557.97 Manufacturing 240 8,569 309,476,076 694.53 Trade, Transportation & Utilities 1,407 13,856 318,121,679 441.52 Information 81 702 21,280,212 582.96 Financial Activities 548 2,707 77,919,430 553.55 Professional & Business Services 625 6,924 276,440,516 767.79 Education & Health Services 531 8,602 227,483,505 508.57 Leisure & Hospitality 410 7,049 70,251,328 191.66 Other Services 346 1,444 29,145,845 388.16 Local Government 134 8,609 249,547,250 557.44 State Government 72 3,991 119,738,678 576.96 *Note: Pulaski County is not included in the Central Workforce Information. Please refer to Page 55 for information on Pulaski County. Central Workforce includes these counties: Faulkner, Lonoke Monroe, Prairie, and Saline. EASTERN WORKFORCE INFORMATION 3,052 38,574 $963,946,450 $480.57 Natural Resources & Mining 223 1,475 32,691,333 426.22 Construction 195 1,211 31,801,566 505.01 Manufacturing 115 4,635 146,127,966 606.29 Trade, Transportation & Utilities 876 10,298 269,759,427 503.76 Information 44 319 9,442,485 569.24 Financial Activities 260 1,506 42,304,686 540.21 Professional & Business Services 267 1,460 35,472,038 467.23 Education & Health Services 392 5,118 125,432,955 471.31 Leisure & Hospitality 226 3,439 35,628,422 199.23 Other Services 246 978 18,737,719 368.45 Local Government 138 5,938 158,491,206 513.29 State Government 70 2,197 58,056,647 508.18 Eastern Workforce includes these counties: Crittenden, Cross, Lee, Phillips, and Saint Francis.
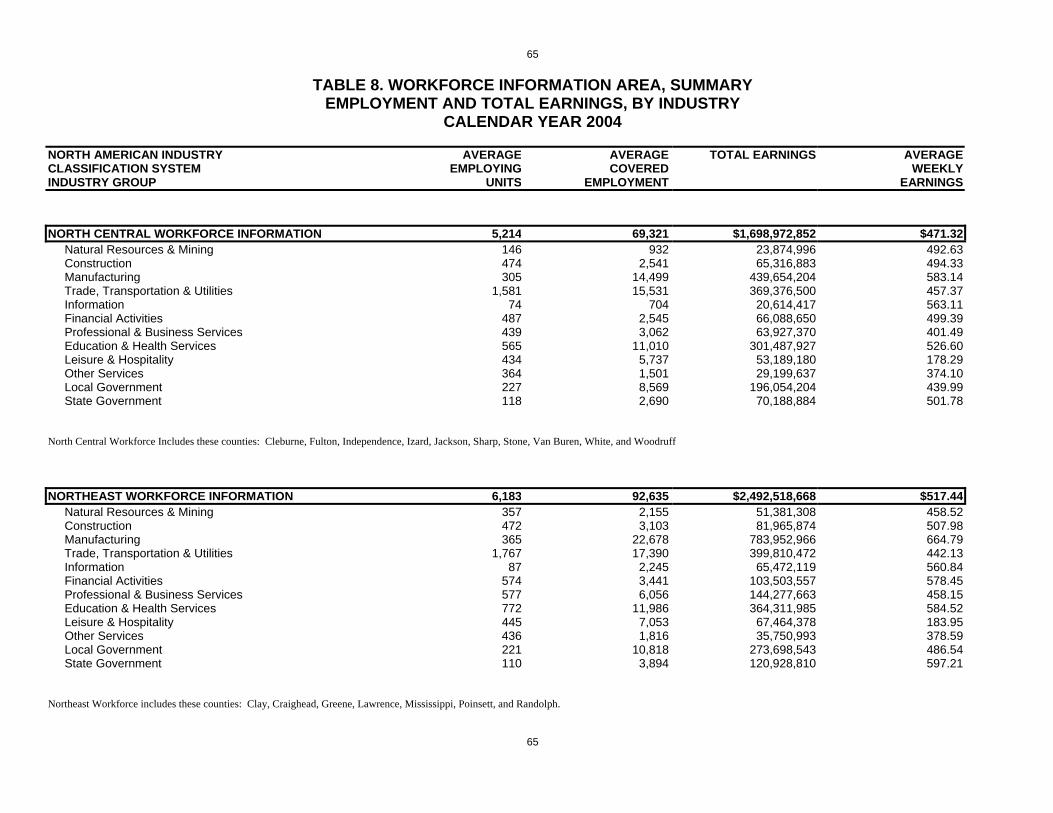
65
TABLE 8. WORKFORCE INFORMATION AREA, SUMMARY EMPLOYMENT AND TOTAL EARNINGS, BY INDUSTRY
CALENDAR YEAR 2004
NORTH AMERICAN INDUSTRY AVERAGE AVERAGE TOTAL EARNINGS AVERAGECLASSIFICATION SYSTEM EMPLOYING COVERED WEEKLYINDUSTRY GROUP UNITS EMPLOYMENT EARNINGS
65
NORTH CENTRAL WORKFORCE INFORMATION 5,214 69,321 $1,698,972,852 $471.32 Natural Resources & Mining 146 932 23,874,996 492.63 Construction 474 2,541 65,316,883 494.33 Manufacturing 305 14,499 439,654,204 583.14 Trade, Transportation & Utilities 1,581 15,531 369,376,500 457.37 Information 74 704 20,614,417 563.11 Financial Activities 487 2,545 66,088,650 499.39 Professional & Business Services 439 3,062 63,927,370 401.49 Education & Health Services 565 11,010 301,487,927 526.60 Leisure & Hospitality 434 5,737 53,189,180 178.29 Other Services 364 1,501 29,199,637 374.10 Local Government 227 8,569 196,054,204 439.99 State Government 118 2,690 70,188,884 501.78 North Central Workforce Includes these counties: Cleburne, Fulton, Independence, Izard, Jackson, Sharp, Stone, Van Buren, White, and Woodruff NORTHEAST WORKFORCE INFORMATION 6,183 92,635 $2,492,518,668 $517.44 Natural Resources & Mining 357 2,155 51,381,308 458.52 Construction 472 3,103 81,965,874 507.98 Manufacturing 365 22,678 783,952,966 664.79 Trade, Transportation & Utilities 1,767 17,390 399,810,472 442.13 Information 87 2,245 65,472,119 560.84 Financial Activities 574 3,441 103,503,557 578.45 Professional & Business Services 577 6,056 144,277,663 458.15 Education & Health Services 772 11,986 364,311,985 584.52 Leisure & Hospitality 445 7,053 67,464,378 183.95 Other Services 436 1,816 35,750,993 378.59 Local Government 221 10,818 273,698,543 486.54 State Government 110 3,894 120,928,810 597.21 Northeast Workforce includes these counties: Clay, Craighead, Greene, Lawrence, Mississippi, Poinsett, and Randolph.

66
TABLE 8. WORKFORCE INFORMATION AREA, SUMMARY EMPLOYMENT AND TOTAL EARNINGS, BY INDUSTRY
CALENDAR YEAR 2004
NORTH AMERICAN INDUSTRY AVERAGE AVERAGE TOTAL EARNINGS AVERAGECLASSIFICATION SYSTEM EMPLOYING COVERED WEEKLYINDUSTRY GROUP UNITS EMPLOYMENT EARNINGS
66
NORTHWEST WORKFORCE INFORMATION 13,124 214,852 $6,851,742,104 $613.28 Natural Resources & Mining 127 1,661 55,280,678 640.03 Construction 1,530 10,257 316,318,193 593.06 Manufacturing 717 40,852 1,234,724,691 581.24 Trade, Transportation & Utilities 3,436 50,714 1,535,643,825 582.32 Information 228 3,294 113,038,650 659.93 Financial Activities 1,377 8,708 306,212,069 676.24 Professional & Business Services 1,862 29,551 1,507,468,619 981.01 Education & Health Services 1,277 21,461 689,707,500 618.03 Leisure & Hospitality 1,267 19,194 219,898,024 220.32 Other Services 891 4,401 98,392,606 429.94 Local Government 292 17,898 521,733,363 560.58 State Government 120 6,861 253,323,886 710.04 Northwest Workforce includes these counties: Baxter, Benton, Boone, Carroll, Madison, Marion, Newton, Searcy, and Washington. SOUTHEAST WORKFORCE INFORMATION 5,176 78,368 $2,168,252,869 $532.07 Natural Resources & Mining 433 3,258 87,464,937 516.27 Construction 370 2,941 80,835,910 528.57 Manufacturing 242 18,443 662,960,670 691.28 Trade, Transportation & Utilities 1,483 14,290 343,267,431 461.95 Information 68 569 16,851,842 569.55 Financial Activities 413 2,950 89,832,457 585.61 Professional & Business Services 435 4,079 140,003,048 660.06 Education & Health Services 589 9,936 252,076,167 487.88 Leisure & Hospitality 384 4,879 45,129,189 177.88 Other Services 396 1,568 30,230,412 370.76 Local Government 213 9,663 248,876,924 495.30 State Government 150 5,792 170,723,882 566.84 Southeast Workforce includes these counties: Arkansas, Ashley, Bradley, Chicot, Cleveland, Desha, Drew, Grant, Jefferson, and Lincoln.

67
TABLE 8. WORKFORCE INFORMATION AREA, SUMMARY EMPLOYMENT AND TOTAL EARNINGS, BY INDUSTRY
CALENDAR YEAR 2004
NORTH AMERICAN INDUSTRY AVERAGE AVERAGE TOTAL EARNINGS AVERAGECLASSIFICATION SYSTEM EMPLOYING COVERED WEEKLYINDUSTRY GROUP UNITS EMPLOYMENT EARNINGS
67
SOUTHWEST WORKFORCE INFORMATION 5,674 87,171 $2,433,809,064 $536.92 Natural Resources & Mining 413 2,899 87,208,152 578.50 Construction 433 3,754 117,392,076 601.37 Manufacturing 302 27,337 983,660,461 691.98 Trade, Transportation & Utilities 1,607 15,314 369,816,322 464.40 Information 87 735 23,191,773 606.80 Financial Activities 531 3,072 87,629,174 548.56 Professional & Business Services 472 4,266 120,573,746 543.54 Education & Health Services 539 8,783 205,933,958 450.90 Leisure & Hospitality 406 5,342 52,913,882 190.49 Other Services 465 2,278 39,252,759 331.37 Local Government 268 10,130 252,692,136 479.71 State Government 151 3,261 93,544,625 551.65 Southwest Workforce includes these counties: Calhoun, Columbia, Dallas, Hempstead, Howard, Lafayette, Little River, Miller, Nevada, Ouachita, Sevier, and Union. WEST CENTRAL WORKFORCE INFORMATION 7,650 104,421 $2,672,000,854 $492.09 Natural Resources & Mining 262 2,341 63,859,584 524.59 Construction 860 5,110 143,836,971 541.31 Manufacturing 427 20,256 595,052,844 564.94 Trade, Transportation & Utilities 1,977 21,060 549,423,281 501.70 Information 107 1,064 33,151,308 599.18 Financial Activities 780 3,853 113,421,041 566.10 Professional & Business Services 833 6,628 162,627,653 471.85 Education & Health Services 773 14,584 417,187,713 550.11 Leisure & Hospitality 721 11,743 132,193,620 216.49 Other Services 546 2,399 46,619,483 373.71 Local Government 232 11,079 291,032,683 505.17 State Government 132 4,304 123,594,673 552.24 West Central Workforce Includes these counties: Clark, Conway, Garland, Hot Spring, Johnson, Montgomery, Perry, Pike, Pope, and Yell

68
TABLE 8. WORKFORCE INFORMATION AREA, SUMMARY EMPLOYMENT AND TOTAL EARNINGS, BY INDUSTRY
CALENDAR YEAR 2004
NORTH AMERICAN INDUSTRY AVERAGE AVERAGE TOTAL EARNINGS AVERAGECLASSIFICATION SYSTEM EMPLOYING COVERED WEEKLYINDUSTRY GROUP UNITS EMPLOYMENT EARNINGS
68
WESTERN WORKFORCE INFORMATION 6,077 107,734 $3,040,407,168 $542.72 Natural Resources & Mining 149 2,136 77,923,652 701.56 Construction 577 4,521 132,292,960 562.73 Manufacturing 411 30,168 970,548,695 618.68 Trade, Transportation & Utilities 1,642 21,734 548,784,360 485.58 Information 95 1,629 61,220,706 722.73 Financial Activities 611 3,628 117,552,887 623.11 Professional & Business Services 747 10,141 267,757,871 507.76 Education & Health Services 656 13,003 423,658,076 626.57 Leisure & Hospitality 487 7,632 80,878,350 203.79 Other Services 465 2,157 47,306,216 421.76 Local Government 154 8,619 247,639,420 552.53 State Government 83 2,366 64,843,975 527.05 Western Workforce includes these counties: Crawford, Franklin, Logan, Polk, Scott, and Sebastian.