cover story - crescent · cover story dating back to ancient times, the history of steel is a ......
TRANSCRIPT


COVER STORYDATING BACK TO ANCIENT TIMES, THE HISTORY OF STEEL IS A SPELLBINDING CHRONICLE OF THE POWER OF HUMAN GENIUS IN ELEVATING THE EARTH’S NATURAL TREASURES. THIS EPIC TALE OF MANKIND’S MOST PRIZED DISCOVERY SPREADS ACROSS THE PREHISTORIC AGES OF COPPER AND BRONZE TO THE REVOLUTIONARY ERAS OF MODERN METALLURGY – BESPEAKING A TALE THAT IS AWE-INSPIRING IN ITS OWN RIGHT.
AT CRESCENT STEEL AND ALLIED PRODUCTS LIMITED, WE BELIEVE IN SHARING THIS REVERENTIAL STORY, WHICH HAS SHAPED THE WORLD AS WE KNOW IT TODAY. TO US, ONLY TRUE LEGENDS STOOD THE TEST OF TIME, LEAVING BEHIND A TIMELESS LEGACY FOR THE FUTURE TO BEHOLD.
OUR COVER THIS YEAR IS A TRIBUTE TO THE LASTING LEGACY OF STEEL – A PERENNIAL LEGEND WHICH CONTINUES TO COME THROUGH TIME AFTER TIME.
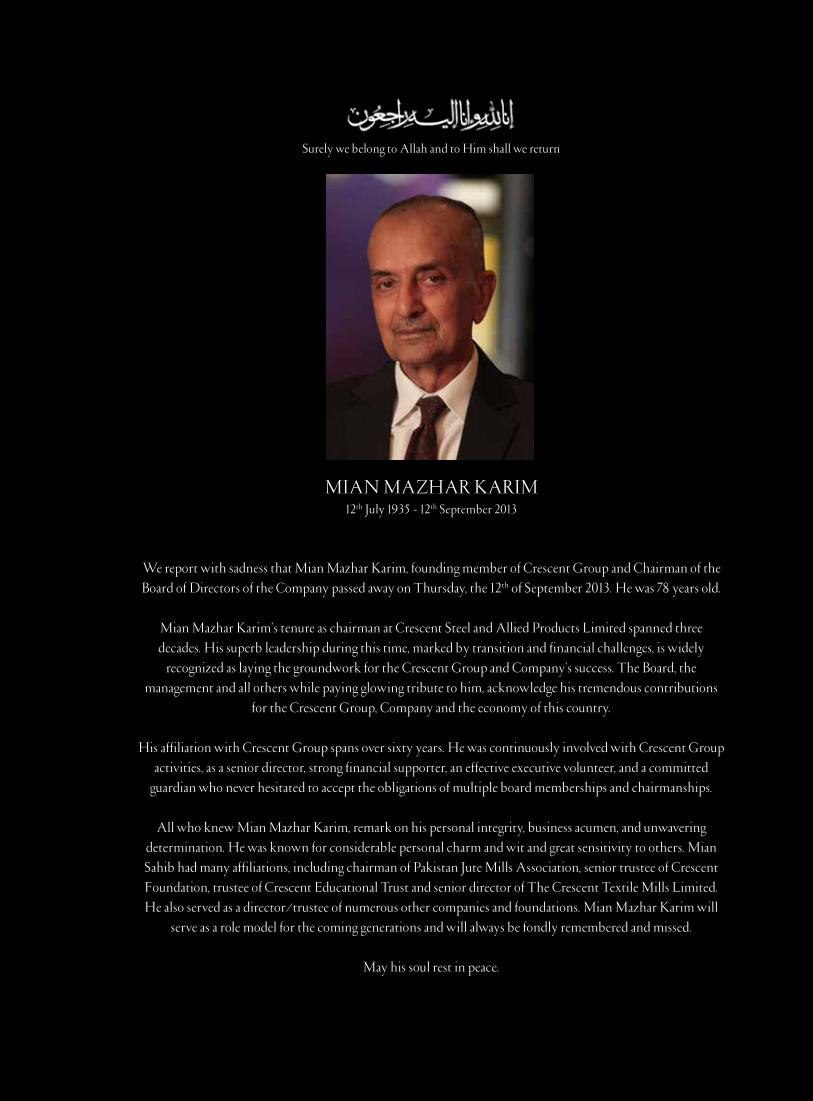
We report with sadness that Mian Mazhar Karim, founding member of Crescent Group and Chairman of the Board of Directors of the Company passed away on Thursday, the 12th of September 2013. He was 78 years old.
Mian Mazhar Karim’s tenure as chairman at Crescent Steel and Allied Products Limited spanned three decades. His superb leadership during this time, marked by transition and financial challenges, is widely
recognized as laying the groundwork for the Crescent Group and Company’s success. The Board, the management and all others while paying glowing tribute to him, acknowledge his tremendous contributions
for the Crescent Group, Company and the economy of this country.
His affiliation with Crescent Group spans over sixty years. He was continuously involved with Crescent Group activities, as a senior director, strong financial supporter, an effective executive volunteer, and a committed
guardian who never hesitated to accept the obligations of multiple board memberships and chairmanships.
All who knew Mian Mazhar Karim, remark on his personal integrity, business acumen, and unwavering determination. He was known for considerable personal charm and wit and great sensitivity to others. Mian Sahib had many affiliations, including chairman of Pakistan Jute Mills Association, senior trustee of Crescent Foundation, trustee of Crescent Educational Trust and senior director of The Crescent Textile Mills Limited. He also served as a director/trustee of numerous other companies and foundations. Mian Mazhar Karim will
serve as a role model for the coming generations and will always be fondly remembered and missed.
May his soul rest in peace.
MIAN MAZHAR KARIM12th July 1935 - 12th September 2013
Surely we belong to Allah and to Him shall we return

CONTENTSMANAGEMENTKey Figures ............................................................................4Vision, Mission and Core Values ...........................................7Our Governing Principles .....................................................9Mechanism for providing information and recomendation to the Board .............................................13Corporate Strategy ..............................................................14Our History ...........................................................................16Year in Brief ..........................................................................18Company Information ..........................................................20Company Profile ..................................................................22Board of Directors ...............................................................24Board of Directors and its Committees .............................26Management Committees ..................................................28Report of the Audit Committee ...........................................30Management Structure .......................................................32Directors’ Report .................................................................35Chief Executive’s Review .....................................................41Major Business Risks and their Mitigation ........................58Statement of Value Addition ...............................................61Performance Indicators ......................................................62Vertical Analysis ..................................................................64Horizontal Analysis .............................................................65Comments on six year Profit and Loss ..............................66Comments on six year Balance Sheet ...............................67Financial Calendar ...............................................................67Key Operating and Financial Data ..................................... 68Quarterly Analysis ...............................................................70Statement of Compliance with the Code of Corporate Governance .......................................71
UNCONSOLIDATED FINANCIAL STATEMENTSReview Report to the Members on Statement of Compliance with Best Practices of Code of Corporate Governance ........................................74Auditors’ Report to the Members ......................................75Unconsolidated Balance Sheet ..........................................76Unconsolidated Profit and Loss Account ...........................78Unconsolidated Statement of Comprehensive Income ....79Unconsolidated Cash Flow Statement ...............................80Unconsolidated Statement of Changes in Equity .............81Notes to the Unconsolidated Financial Statements ..........82
CONSOLIDATED FINANCIAL STATEMENTSKey Figures - Consolidated ...............................................138Performance Indicators - Consolidated ...........................140Vertical Analysis - Consolidated .......................................142Horizontal Analysis - Consolidated ..................................143Key Operating and Financial Data - Consolidated ..........144Statement of Value Addition - Consolidated ....................146Comments on Consolidated Analysis Six Years ..............147Directors’ Report - Consolidated ......................................148Auditors’ Report to the Members - Consolidated ...........149Consolidated Balance Sheet ............................................150Consolidated Profit and Loss Account .............................152Consolidated Statement of Comprehensive Income.......153Consolidated Cash Flow Statement .................................154Consolidated Statement of Changes in Equity ...............155Notes to the Consolidated Financial Statements ............156
Pattern of Shareholding ....................................................213Notice of Annual General Meeting ...................................216Glossary / List of Abbreviations ........................................218Form of ProxyConsent Form for Electronic Transmission of Annual Report and Notice of AGM
2 Crescent Steel and Allied Products Limited
A GLIMPSE OFCRESCENT HADEED (PRIVATE) LIMITED

SALES REVENUE (Rs. in million)
EBITDA (Rs. in million)
PROFIT BEFORE TAXATION AND DEPRECIATION (Rs. in million)
EARNINGS PER SHARE(BASIC AND DILUTED) (Rupees)
CASH DIVIDEND (INCLUDING FINAL PROPOSED) (Rupees per share)
RETURN ON AVERAGE CAPITAL EMPLOYED(%)
PROFIT AFTER TAXATION (Rs. in million)
PRICE EARNINGS RATIO (TIMES)
CAPITAL EXPENDITURE (Rs. in million)
4,032563
474360
5.8
7.52.5
132
10.5
KEY FIGURES
4 Crescent Steel and Allied Products Limited

TOTAL ASSETS (Rs. in million)
CURRENT RATIO (Ratio)
BREAK-UP VALUE PER SHARE(Rupees)
• EMPLOYER OF THE YEAR AWARD 2012
• BEST CORPORATE REPORT AWARD 2013
• BEST SUTAINABILITY REPORT AWARD 2013
• BEST PRACTICES AWARD ON OCCUPATIONAL SAFETY, HEALTH AND ENVIRONMENT
• BEST CEO AWARD
• CORPORATE PHILANTHROPY AWARD 2012
SHAREHOLDERS’ EQUITY (Rs. in million)
4,7332.3:1
4,007
64.5AWARDS AND ACCOLADES
5Annual Report 2014
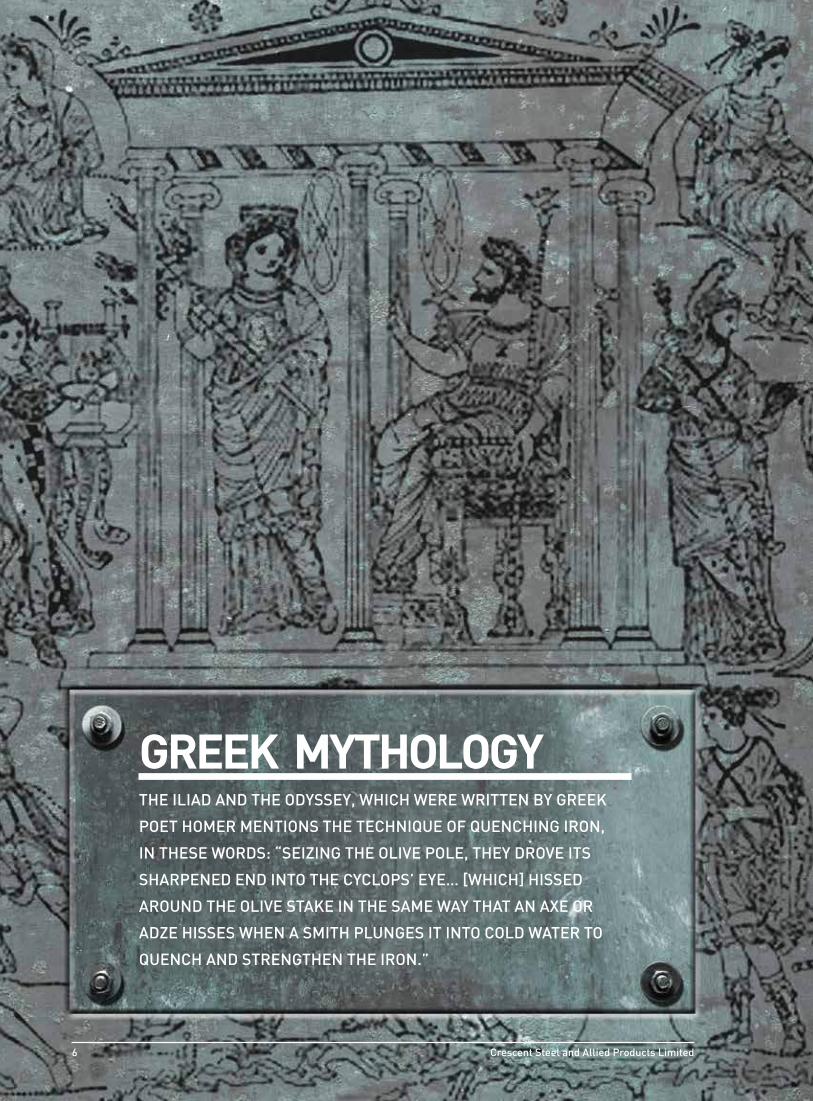
GREEK MYTHOLOGYTHE ILIAD AND THE ODYSSEY, WHICH WERE WRITTEN BY GREEK
POET HOMER MENTIONS THE TECHNIQUE OF QUENCHING IRON,
IN THESE WORDS: “SEIZING THE OLIVE POLE, THEY DROVE ITS
SHARPENED END INTO THE CYCLOPS’ EYE… [WHICH] HISSED
AROUND THE OLIVE STAKE IN THE SAME WAY THAT AN AXE OR
ADZE HISSES WHEN A SMITH PLUNGES IT INTO COLD WATER TO
QUENCH AND STRENGTHEN THE IRON.”
6 Crescent Steel and Allied Products Limited

VISION, MISSION & CORE VALUES
To be the leader in every business we do, by delivering sustainable value to all stakeholders.
Our core values are at the heart of our business because they define who we are, how we work, what we believe in and what we stand for. Our core values set out how we act and how we expect to be treated as part of Crescent Steel.
• To grow and enhance company value and pursue new growth opportunities; • Maintain cost and quality leadership in an internationally competitive environment;• Promote best use of human talent in a safe environment, as an equal opportunity employer; and • To conduct business as a responsible corporate citizen and to seek and support local communities with focus on
education, health and environment.
CONSISTENTLY DOING THE RIGHT
THING. Being ethically unyielding and honest in the
way we carry on business even when nobody is looking.
ACTING WITH STEWARDSHIPto build a better,
stronger and more dynamic organization.
LEVERAGING RELATIONSHIPS FOR OUT PERFORMANCE.
Knowing our customers, anticipating their needs, and being responsive to deliver
the best value internally and externally.
CONTINUOUS IMPROVEMENT
GIVES US COMPETITIVE ADVANTAGE.
We foster collaboration, innovation and
creativity and have a passion for challenges – as individuals and as
teams.
SOCIAL RESPONSIBILITY IS AT THE HEART
OF OUR BUSINESS.We strive to make a positive difference in the lives of the people we work with and in the communities
where we operate through strategic
impact investment programs.
VISION
MISSION
CORE VALUES
7Annual Report 2014

COPPER AGEALMOST 6000 YEARS AGO, PRE-HISTORIC POTTERS USED TO
ADORN THEIR POTTERY WITH GREEN MALACHITE. ONE DAY OUT OF
SHEER COINCIDENCE, THE USE OF PARTICULARLY HOT FIRE WHILE
HEATING THE MALACHITE LEAD TO THE DISCOVERY OF EXTREMELY
PRECIOUS COPPER. UNTIL THEN, COPPER WAS RARELY FOUND IN
MOUNTAIN RANGES AND RIVERBEDS.
8 Crescent Steel and Allied Products Limited

OUR GOVERNING PRINCIPLES
INTEGRITYCSAPL does not use bribe as an instrument for any business or financial gain. Employees are not authorized to give or receive any gift or payment which may be construed as such. Employees are also required to avoid engaging in any personal activity or financial interests which would conflict with their responsibility to the Company.
ROLE OF THE BOARD OF DIRECTORSThe Board has a fiduciary responsibility for the proper direction and control of the activities of the Company. This responsibility includes such areas of stewardship as the identification and control of the Company’s business risks, the integrity of management information systems and transparent reporting to shareholders. The Board accepts its primary responsibility for the overall control architecture of the Company. However, it recognizes that the internal control system has to be cost effective and that no cost effective system will preclude all errors or irregularities. The system is based upon written procedures, policies, guidelines, an organogram that provides an appropriate division of responsibility, a programme of internal audit, manning of all key functions by qualified personnel and constant training.
REMUNERATION OF BOARD OF DIRECTORS AND CHAIRMANAll directors of the Company are Non-Executive except for the Chief Executive Officer. The CEO is paid fixed salary as determined by the Board; performance of CEO is evaluated against approved criteria by the HR & R Committee and recommended to the Board for approval. All the other directors are paid Director’s fee for attending board meetings which is also fixed in light of applicable laws and regulations. Further from January 2014 onwards chairman of the board is paid honorarium for his services to the company as approved by the Board.
CODE OF CONDUCTThe Board has adopted a code of conduct for its members, executives and staff, specifying the business standards and ethical considerations in conducting its business. The code includes: • Corporate governance • Relationship with employees, customers and
regulators• Confidentiality of information• Trading in Company’s shares• Environmental responsibilities
CSAPL CONDUCTS ITS BUSINESS IN A RESPONSIBLE MANNER AND WITH HONESTY, AND INTEGRITY. WE ALSO HAVE THE SAME EXPECTATIONS FROM ALL THOSE WITH WHOM WE HAVE RELATIONSHIPS. WE INSIST ON DOING WHAT IS RIGHT WHICH SETS THE TONE OF OUR ACTIONS AND UNDERPINS THE FUNCTIONING OF OUR EMPLOYEES. WE ALSO INSIST THAT ALL TRANSACTIONS BE OPEN, TRANSPARENT AND WITHIN THE LEGAL FRAMEWORK CULMINATING IN RESPONSIBLE FINANCIAL REPORTING.
9Annual Report 2014

BOARD COMMITTEESThe Board has constituted the following committees:• Audit Committee• Human Resource and Remuneration Committee• Governance and Evaluation Committee
Through its committees, the Board provides proactive oversight in some of the key areas of business and the performance of CEO. The Board regularly reviews the respective charters of these committees.
AUDIT COMMITTEE
The Audit Committee operates under a charter approved by the Board. The governing charter of the Audit Committee addresses the requirement of the code of corporate governance issued by the SECP and includes the requirements of best practices. The Committee is accountable to the Board for the recommendation of appointment of external auditors, directing and monitoring the audit function and reviewing the adequacy and quality of the audit process. CEO and the CFO are responsible for the accuracy of financial information for inclusion in the annual report; the Committee provides the Board with additional assurance.
The Committee also ensures that the Company has an effective internal control framework. These controls include safe-guarding of assets, maintaining of proper accounting records complying with legislation and ensuring the reliability of financial information.
HUMAN RESOURCE AND REMUNERATION COMMITTEE (HR & R)
The HR & R Committee reviews the human resource architecture of the Company and addresses the requirement of the Code of Corporate Governance. The committee has been constituted to address and improve the crucial area of human resource development. Its aim is to assist the Board and guide the management in the formulation of the market driven HR policies regarding performance management, HR staffing,
compensation and benefits. The expanded role of the Committee is to review CEO performance and to recommend CEO compensation for the approval of the Board. Further, the selection, evaluation and compensation of CFO, Company Secretary and Head of Internal Audit is also reviewed and recommended to the Board by the Committee.
GOVERNANCE AND EVALUATION COMMITTEE
The role of Governance and Evaluation Committee is to assist the Board in the discharge of its function as well as compliance with the Company’s governing principles. The Committee takes a leadership role in shaping the code of business conduct (governing principles) in order to keep them in line with International best practices. The committee will also monitor compliance with the Code of Corporate Governance other than those areas which fall under the oversight of the Audit Committee. The Committee also reviews from time to time, the adequacy of succession and alignment of key factors with the Company strategy.
The Board has established a mechanism for the evaluation of Board’s performance on the recommendation of the Governance and Evaluation Committee. This evaluation is based on the mechanism of self-assessment by the individual Board members. For this purpose, a toolkit has been designed for assessing Board’s performance.
Governance and Evaluation Committee evaluates the Board’s Performance in line with the methodology approved by the Board and recommends the same to the Board for their review and approval.
MANAGEMENT STRUCTUREThe Company has three distinct business units, a Steel Division, a Cotton Division, and an Investment and Infrastructure Development Division. The accounting for these units is done separately in an arm’s length manner to arrive at the true profit before tax for each unit. Three business unit heads and three corporate
10 Crescent Steel and Allied Products Limited

functional heads as defined in the management structure with clear responsibility and authority matrix have direct reporting lines to the Chief Executive Officer. Limits of authority at all levels are clearly defined in our control manual. The Internal Audit function is responsible to monitor compliance with the manual.
The Company also has three wholly owned subsidiaries:
• CS Capital (Private) Limited• Shakarganj Energy (Private) Limited• Crescent Hadeed (Private) Limited
RESPONSIBILITY TO STAKEHOLDERSOur primary purpose is to run our business efficiently and profitably to enhance shareholders’ value but we do it with responsibility to all stakeholders. Profitability is essential to discharge this responsibility and the corporate resources are primarily deployed in the achievement of this end. However, the Company does not operate in isolation with its environment and accordingly feels responsible to all stakeholders which are:
• Our Shareholders: To protect shareholders’ investments and provide an acceptable return to them.
• Our Customers: To win and maintain customers by developing and providing products and services, which offer value in terms of price, quality, safety and environmental impact supported by requisite technological expertise.
• Our People: To respect the human and legal rights of its employees with good and safe conditions of work and competitive terms of service.
• Our Business Partners: To seek mutually beneficial relationships with contractors and suppliers of goods and services to the Company.
• Our Society: To conduct business as a responsible member of society, to observe laws, express support for basic human rights and give proper regard to health, safety and environment not only at our various campuses but also beyond, extending it to society at large.
SERVICE TO SOCIETYWe are committed to be active as responsible corporate citizens. We believe in “giving something back” by addressing issues such as education, healthcare, public safety, environmental health etc. This is also arising from our belief that individual entities when they work together can create powerful synergies and help to improve the conditions of the society in which they are operating. These principles are not just put forth on paper but we have over the years actively strived to promote issues of education, health and environment. Major portion of our budget for philanthropy and sponsorship is allocated to primary and secondary schooling for less privileged children.
HEALTH, SAFETY AND ENVIRONMENTAt CSAPL we take maintenance of health and safety standards at our plants and offices seriously. We are committed to actively managing health and safety risks associated with our business and are actively working towards improving our procedures to reduce, remove or control the risk of fire, accidents or injuries to employees and visitors. All activities at all our campuses are required to conform to international standards for health and safety certified by ISO14001:2004 and OHSAS 18001:2007.
We also ensure that our products are shipped in a safe manner complying with the safety standards and legal requirements.
SHAREHOLDERSThe Board aims to ensure that shareholders are informed of all major developments affecting the Company’s state of affairs. Information is communicated to the shareholders in the annual report, interim quarterly reports and through information portal of Karachi Stock Exchange as and when required. The Board encourages the shareholders’ participation at the Annual General Meetings to ensure a high level of accountability. The Company’s financial statements are available on the Company’s website and an officer is designated to answer all shareholders enquiries.
11Annual Report 2014

BRONZE AGEAFTER THE SIGNIFICANT DISCOVERY OF COPPER, EARLY
ALCHEMISTS FIGURED THAT COMBINING COPPER AND TIN ORE
AT HIGH TEMPERATURES COULD MAKE SUPERIOR BRONZE. THIS
BROUGHT INTO EXISTENCE WHAT CAME TO BE KNOWN AS THE
BRONZE AGE, WHICH LASTED FOR ABOUT 2000 YEARS. DURING
THIS TIME, SUPERIOR METAL OBJECTS WERE CREATED SUCH AS
BRONZE TOOLS; WEAPONS, ARMOR AND BUILDING MATERIALS
WHICH WERE HARDER AND MORE DURABLE THAN THEIR STONE
AND COPPER PREDECESSORS.
12 Crescent Steel and Allied Products Limited

FORMAL REPORTING LINEThe operational structure of the Company consists of various divisions, each of which is headed by a Business Unit Head (BUH). The BUHs are responsible for the performance of the respective division / department and Board Committees have access to BUHs for any information they require pertaining to their respective division.
Further information regarding any matter of concern or recommendation is also put forward by the CEO to the respective committees of the Board.
EMPLOYEESWe believe in a culture of openness and freedom of expression. We do this by providing several forums for employees to bring their valuable suggestions and feedback to the management and the Board. Company has provided an e-suggestion box on the dashboard of every employee’s workstation. Their feedback and recommendations are received directly by the CEO on his email. CEO monitors and tracks all such e-mails, and where the issue is of a significant nature the same is addressed in the meetings of Board of Directors or the relevant Board Committee.
Moreover, the Company has a Whistle Blowing Policy in place to provide an avenue for employees to raise concerns and reassurances that they will be protected from reprisals or victimization for whistle blowing.
The company also conducts annual open house session with the employees to engage on a one to one conversation with the CEO. It helps increase the information flow from the bottom-up to create a positive and receptive environment in the workplace.
SHAREHOLDERSEvery year the Annual General Meeting of shareholders is called in accordance with the requirements of the
Companies Ordinance, 1984 which is attended by the CEO and CFO. The interactive session between the Company’s management and shareholders allows the shareholders to ask questions on financial, economic, social and any other issues and also to provide any recommendation. The CEO responds to all such queries and takes necessary actions accordingly.
Moreover, the Company has provided contact details of all the relevant personnel who should be contacted for general and specific queries on its website: www.crescent.com.pk/shareholders-information/ and also prints the same on the Annual Report sent to the shareholders.
MANAGING CONFLICT OF INTERESTThe Company in compliance with the Code of Corporate Governance annually circulates and obtains a signed copy of Code of Conduct applicable to all its employees and Directors, which also relates to matters relating to conflict of interest. Further, the directors are annually reminded of the insider trading circular issued by the Securities & Exchange Commission of Pakistan to avoid dealing in shares while they are in possession of the insider information.
As per the provisions of the Companies Ordinance, 1984, every director is required to provide to the Board complete details regarding any material transaction which may bring conflict of interest with the Company for prior approval of the Board. The interested director(s) do not participate in the discussion neither they vote on such matters.
The transactions with all the related parties are made on arms-length basis and complete details are provided to the board for their approval. Further all the transactions with the related parties are fully disclosed in the annual financial statements of the Company.
MECHANISM FOR PROVIDING INFORMATION AND RECOMMENDATION TO THE BOARD
13Annual Report 2014

CORPORATE STRATEGY
Given the volatile business environment and political imperatives in Pakistan, we are steering the Company with a medium-term strategy that spans three years. Our strategy setting and accomplishment reviews are conducted annually by a designated Business Strategy Committee (the Committee) that drives and channels the process. The Committee comprises of the Company’s executive management team that meets regularly to review progress on strategic objectives and annually to review, renew and reposition Business level strategic objectives for the next three fiscal years.
The annual review process includes a review of the Company’s Vision and Mission Statements, Values, strategic objectives and extensive business level SWOT analyses that assess internal and external issues and dependencies, counter measures, new opportunities and strengths. Other than formulating the Corporate Strategy, the Committee works to develop annual plans designed to achieve our strategic objectives and to realize our Vision and Mission. The process of translating the vision helps the leadership team build a consensus around a strategy theme that captures the organization’s purpose. The theme serves as a useful guide to action at the local and unit levels. This year the Strategic Theme to enable action is ACT: Agility – Creativity - Tenacity.
Using the Balanced Scorecard approach, the Committee agrees on the strategic direction and objectives under the four defined perspectives:
1. Financial2. Customer3. Internal / Operational, and4. Innovation / Learning
To enable our people to act on the vision and strategy, we close in on integrated set of objectives and measures, agreed upon by all senior executives, which describe the long-term drivers of success for our business. The Business Strategy Committee ensures that everyone understands the long term goal of the Company and that departmental and individual goals are aligned with these. We measure and realign performance at the individual, departmental and entity
level through regular feedback enabling real time learning and calibration.
Enhancing shareholder value through cost and quality leadership lies at the core of our corporate strategic objectives. We do this by ensuring that we hold strong to our mission and values by acting responsibly, maintaining cost and quality leadership and seeking to attract, develop and retain talent.
Our operational strategy is centered on:
• Enhancing shareholders’ value by generating reasonable returns
• Conservative, sound risk management• Ethical behaviour, observing the letter and spirit of
rules and regulations• Growing responsibly through business acquisitions
and organic growth,• Operational agility: Leveraging cost and quality
leadership to enhance customers’ value • Meeting international standards of quality, safety
and health• Retaining, developing and leveraging quality human
capital• Impact investments and giving back to the people
we work with and the communities where we operate, and
• Creating meaningful societal capital
The operational strategy aims to continuously identify processes for improvement, strengthen supply chain management, expand supplier-base and improve risk management.
Our business strategy focuses on the profitability of business segments which will primarily entail expanding our existing base (steel line pipes, line pipe coatings, cotton yarn and other core assets) and projects in the pipeline (steel billets and renewable energy). We have taken steps to proactively reshape the portfolio of businesses in line with our long term mission of creating multiple, sizeable businesses while deploying management resources to the most promising opportunities. At the same time, we will refocus on capital and operational costs to improve our competitiveness.
THE BASIS OF OUR STRATEGY IS OUR LONG-TERM VISION: “TO BE THE LEADER IN EVERY BUSINESS WE DO, BY DELIVERING SUSTAINABLE VALUE TO ALL STAKEHOLDERS.”
14 Crescent Steel and Allied Products Limited

Our market strategy calls for us to accelerate our business development by leveraging our shift towards the engineering sector with the objective to ensure sustainable growth by capturing business in this sector. This will entail securing global supply sources to meet increasing demand in Pakistan and regional markets where relatively strong growth is expected.
In order to optimize our business portfolio, we had already introduced the concept of Business Units across the Company and future additions to the business portfolio are being structured as fully owned subsidiaries. The move is geared towards making evaluation of businesses easier, achieving improved transparency of business strategies and, fostering a culture of high autonomy and accountability. This will not only enable us to effectively divest in underperforming segments but also to select and strengthen outperforming units.
We plan to remain at the cutting edge of technology by upgrading our plants and carrying out regular process innovations. Our strategic direction is geared to achieve capacity enhancements, diversify revenue streams and to deliver value to our customers through product development, manufacturing excellence, and supply chain management. We have invested and will continue investing in energy saving equipment and remain committed to reducing and sustainably managing waste. We aim to further fine tune our investment strategy, by reducing exposure to high risk.
Our Information Technology strategy is tightly aligned with business goals, and is designed to continuously enhance enterprise value of Crescent Steel, reform administrative procedures and develop operations. We plan to leverage our investment in enterprise resource planning systems for business intelligence to support and enable calculated decision making.
The Human Resource strategy is designed to contribute to our durability by providing our people with good jobs and working environments that maximize their skills and realize the potential of both individual employees and teams. The HR strategy focuses on developing programs to supplement Crescent Steel’s policies on recruitment, training, performance evaluation and remuneration in a manner that strengthens the organization’s human capital, develops corporate culture, improves working environments and delivers on upholding our values. The Human Resource strategy focuses on enhanced training of our people with measurable outcomes, promoting an interactive environment, improving succession readiness for
future leadership, and fostering a culture of innovation and accountability where people are listened to and assessed with fairness.
The Social Investment and Corporate Social Responsibility strategy integrates our business, environmental and citizenship activities to create shared value. We take pride in supporting our community and are committed to our investment in Pakistan through strategic and targeted contributions to the education, environment and health sectors. By engaging community partners in effective dialogue, we plan to enhance employee engagement in our CSR efforts and regularly measure the impact of our social investments. Sustainability and business success are two sides of the same coin for us, as we’ve already showcased in numerous examples in our Corporate Responsibility Report: Crescent Steel is sustainably managed. We have consciously decided to carve out our Strategic Objectives for sustainable growth from our Corporate Strategy instead of formulating a separate Sustainability Strategy, since our Corporate Strategy is already geared to making long-term progress in terms of profitability, the environment and society.
We are committed to further fine tune our portfolio investment strategy, by rationalizing exposure to high risk/volatile stocks. Business continuity and effective financial management are driven by adequate gearing, real-time funds forecasting, and reasonable returns from supplemental investments.
The operational strategy aims to continuously identify processes for improvement, strengthen supply chain management, expand supplier-base and improve risk management.
Our subsidiaries in the Energy sector (Shakarganj Energy (Private) Limited) and the Engineering sector (Crescent Hadeed (Private) Limited) are expected to commence operations during FY15. Notwithstanding the apparent and limited opportunities available for expansion and diversification, our strategic thrust will be to expand in the energy and engineering sectors, organically as well as through acquisitions.
Over the long term, our strategy is to be forward-looking, grow responsibly, generate a competitive return on capital and meet our financial and stakeholder obligations. We remain committed to being a leader in safety and environmental stewardship; improving our quality, cost competitiveness and customer service; and to attracting, developing and retaining a diverse workforce with the talent and skills needed for our long-term success.
15Annual Report 2014
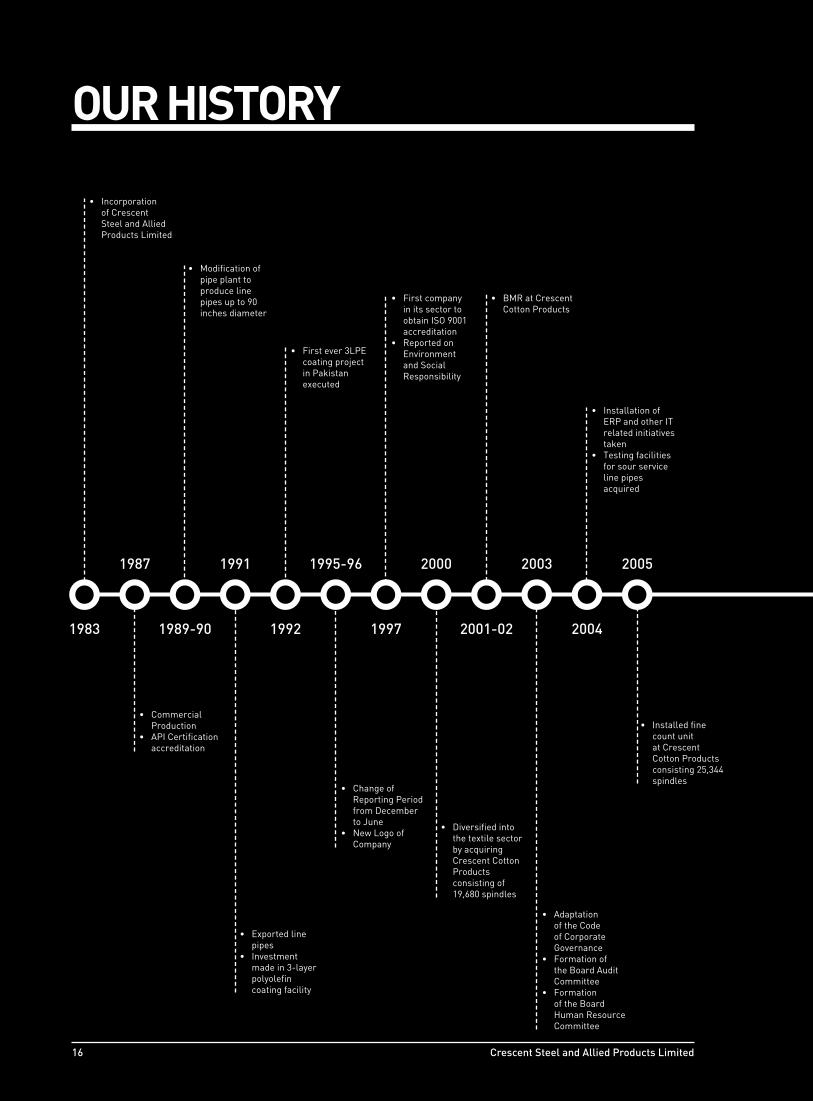
OUR HISTORY
1983
20051987
1989-90
1991
1992
1995-96
1997
2000
2001-02
2003
2004
• Incorporation of Crescent Steel and Allied Products Limited
• Commercial Production
• API Certification accreditation
• Modification of pipe plant to produce line pipes up to 90 inches diameter
• Exported line pipes
• Investment made in 3-layer polyolefin coating facility
• First ever 3LPE coating project in Pakistan executed
• Change of Reporting Period from December to June
• New Logo of Company
• First company in its sector to obtain ISO 9001 accreditation
• Reported on Environment and Social Responsibility
• Diversified into the textile sector by acquiring Crescent Cotton Products consisting of 19,680 spindles
• BMR at Crescent Cotton Products
• Installation of ERP and other IT related initiatives taken
• Testing facilities for sour service line pipes acquired
• Adaptation of the Code of Corporate Governance
• Formation of the Board Audit Committee
• Formation of the Board Human Resource Committee
• Installed fine count unit at Crescent Cotton Products consisting 25,344 spindles
16 Crescent Steel and Allied Products Limited

2006
2007
2008
2009
2010
2011
2012
2013
2014
• Pipe manufacturing and coating plant significantly upgraded to produce pipes for cross country pipelines
• New spinning mill completed and commenced production
• Acknowledged among KSE - Top 25 Companies 2005
• First Pakistani Company to acquire oil and gas industry specifics ISO/TS 29001, QMS Certification from API
• 1st Position - Best Corporate Report Awards 2005 (ICAP and ICMAP)
• Implementation of Oracle e-business suite initiated
• The Investment and Infrastructure Development Division (IID) was carved out as a separate business unit
• 1st Position – Best Corporate Report Awards 2007
• Port piles work executed
• Oracle e-business suite go - live
• SAFA Merit certificate - Best Presented Accounts and Corporate Governance Disclosure Awards 2009
• Acknowledged among KSE - Top 25 Companies 2008
• 2nd Position – Best Corporate Report Awards 2008
• Upgraded coating plant capacity to 60” making it the only coating plant of this capacity
• Migrated entire ERP system to Cloud Infrastructure
• Acknowledged among KSE - Top 25 Companies 2010
• 2nd Position – Best Corporate Report Awards 2010
• Machinery enhancement at Crescent Cotton Products
• Acquired 100% stake in CS Capital (Private) Limited
• Steel division upgraded with state of the art digital control systems and HMI (Human Machine Interface) capabilities
• 1st position for “Best Management and Decent Work Practices” by the Employers’ Federation of Pakistan
• Acknowledged among KSE - Top 25 Companies 2011
• 2nd Position – Best Corporate Report Awards 2011
• 2nd Position - Best Practices Awards on OSH&E (Occupational Safety, Health and Environment) in 7th Employers’ Federation of Pakistan Awards
• BMR at Crescent Cotton Products
• Acquired a 100% stake in Shakarganj Energy (Private) Limited, a bagasse fired thermal generation power plant
• Adapted horizontal and vertical integration in the steel business
• ISO 14001 and OHSAS 18001 requirements complied for the first time
• 2nd Position – Best Corporate Report Awards 2009
• Incorporated wholly owned subsidiary Crescent Hadeed (Private) Limited to manufacture steel billets
• High energy efficient motors installed for reducing consumption of energy during production
• As a permanent cost reduction and quality assurance measure the Cotton Division was upgraded with production cards
• 1st Position – Best Corporate Report Awards 2012
• 2nd Prize – Corporate Excellence Awards by Management Association of Pakistan
• BMR at Crescent Cotton Products
• Redefined Core Values• Launched Crescent
Communications, an internal communication platform
• Developed a sustainability reporting framework
• LC opened for Crescent Hadeed (Private) Limited
• Ground breaking of Crescent Hadeed
• Incorporated Solution de Energy (Private) Limited, a wholly owned subsidiary of Shakarganj Energy (Private) Limited
• Obtained LOI of Solar Power Plant from Punjab Power Development Board by wholly owned subsidiary Shakarganj Energy (Private) Limited
• 1st Position – Employer of the Year Awards 2012
• 1st Position – 9th Best Practice Awards on OSH&E 2013
• 2nd Position – Best Corporate Report Awards 2013
• 4th Position – Best Sustainability Report Awards 2013
• 3rd Best CEO Awards 2013
• 5th Position - Corporate Philanthropy Awards 2012
17Annual Report 2014

YEAR IN BRIEF(HIGHLIGHTS OF MAJOR EVENTS DURING THE YEAR)
PERFORMANCE• The Company’s after tax profit and EPS for the year
stood at Rs. 360.2 million and Rs. 5.8 respectively. Based on the performance, an interim cash dividend of 10% was announced together with a final cash dividend of 15% totaling a distribution of 25% (i.e. Rs. 2.5 per share) for the year.
• Sales revenue and gross profit of Steel division were lower by 34.7% and 47.6% respectively, compared to last year.
• Break-up value per share increased to Rs. 64.5 from Rs. 64.0 as at 30 June 2014 in the separate Financial Statements and from Rs. 79.8 to Rs. 84.5 in the Consolidated Financial Statements.
• Investment income increased to Rs. 440.1 million (FY13: 298.4 million).
• The Company’s share of profits from associates (Consolidated Financial Statements) amounted to a record Rs. 340.6 million.
DEVELOPMENTS• Ground-breaking for Crescent Hadeed (Private)
Limited.
• SPECTROLAB, a world class cutting edge technology in metal analysis added to our laboratory.
• Compact attachments were installed on ring machines at cotton plant to increase efficiency.
• LED bay lights have been installed in the factory sheds replacing conventional bay lights which will help reduce energy consumption.
18 Crescent Steel and Allied Products Limited

MILESTONES ACHIEVED DURING THE YEAR• Successfully introduced ‘Scholarship Program‘ for employee’s children.• Published our first Sustainability Report 2013 in accordance with Global Reporting Initiative (GRI) G3.1
guidelines.• Launched Crescent Matches - A program for matching donation to community partners by employees and the
Company.
AWARDS AND ACCOLADES BEST CORPORATE REPORT AWARDS 2013 (ICAP & ICMAP)
The Annual Report of the Company for the year 2013 secured 2nd position in the Engineering Sector of ‘Best Corporate and Sustainability Report Awards 2013‘.
BEST SUSTAINABILITY REPORT AWARDS 2013 (ICAP & ICMAP)
Our Sustainability Report for the year 2013 secured 4th position among all the participants in the ‘Best Corporate and Sustainability Report Awards 2013‘.
BEST PRACTICES AWARDS ON OSH&E (OCCUPATIONAL SAFETY, HEALTH AND ENVIRONMENT)
Secured 1st Prize in the 9th Employers’ Federation of Pakistan Best Practices Awards on OSH&E in the Processing and Allied Sector.
EMPLOYER OF THE YEAR AWARDS 2012
At the Employers’ Federation of Pakistan’s Employer of the Year Awards 2012 ceremony Crescent Steel was awarded for Best Enterprise for Work Place Safety in the large sector.
This award recognizes our contribution and commitment towards the provision of a safe and supportive work environment.
BEST CEO AWARD 2012
Our CEO, Mr. Ahsan M. Saleem was awarded the “Best CEO of the Year” award for significant contributions in the field of Industrial Metals and Mining by The Federation of Pakistan Chambers of Commerce and Industry.
CORPORATE PHILANTHROPY AWARDS 2012
Crescent Steel and Allied Products Limited was selected by Pakistan Centre for Philanthropy for the “Corporate Philanthropy Awards 2012”. The award is based on two assessments: Donations in value and as a percentage of PBT. CSAPL donated approximately 2% of PBT due to which our Company was awarded with a Certificate of Recognition for our philanthropic contribution made during 2012.
19Annual Report 2014

COMPANY INFORMATIONBOARD OF DIRECTORSAhmad WaqarChairman, Non-Executive Director (Independent)
Ahsan M. SaleemChief Executive Officer and Managing Director
Nasir ShafiNon-Executive Director
Khurram M. KarimNon-Executive Director
S.M. EhtishamullahNon-Executive Director
Syed Zahid HussainNon-Executive Director (Independent)
Zahid BashirNon-Executive Director
COMPANY SECRETARY Muhammad Saad Thaniana
AUDIT COMMITTEESyed Zahid Hussain Chairman, Non-Executive Director (Independent)
Nasir ShafiMember, Non-Executive Director
S.M. EhtishamullahMember, Non-Executive Director
HUMAN RESOURCE AND REMUNERATION COMMITTEE Syed Zahid Hussain Chairman, Non-Executive Director (Independent)
S.M. EhtishamullahMember, Non-Executive Director
Zahid BashirMember, Non-Executive Director
GOVERNANCE AND EVALUATION COMMITTEEAhmad WaqarChairman, Non-Executive Director (Independent)
Zahid BashirMember, Non-Executive Director
THE MANAGEMENTChief Executive Officer and Managing DirectorAhsan M. Saleem – 1983*
Chief Financial OfficerMuhammad Saad Thaniana – 2007*
BU Head – Steel Division Iqbal Zafar Siddiqui – 2008*
BU Head – Cotton Division Abdul Rouf – 2000*
Human Resource Advisor Ehsan Durrani – 2008*
Head of Marketing – Steel Division Arif Raza – 1985*
Head of Manufacturing – Steel Division Mushtaque Ahmed – 1985*
Head of Corporate AffairsHajerah A. Saleem – 2012*
Resident Director (CCP)Hasan Altaf Saleem – 2010*
STOCK EXCHANGE LISTING Crescent Steel and Allied Products Limited is a listed Company and its shares are traded on all the three stock exchanges of Pakistan. The Company’s shares are quoted in leading dailies under the Industrial metals and Mining Sector.
PUBLIC INFORMATION Financial analysts, stock brokers, interested investors and financial media desiring information regarding the Company should contact Mr. Abdul Wahab at the Company’s Principal Office, Karachi.Telephone: +92 21 3567 4881-85 Email: [email protected] SHAREHOLDERS’ INFORMATIONEnquiries concerning lost share certificates, dividend payments, change of address, verification of transfer deeds and share transfers should be directed to M/s CorpTec Associates (Private) Limited,503-E Johar Town, Lahore. Telephone: +92 42 3517 0336-37Fax: +92 42 3517 0338Email: [email protected]
PRODUCTS STEEL DIVISION
Manufacturer of DSAW steel linepipes in diameters ranging from 8” to 90” and applicator of internal and external coating conforming to international standards.Fabrication of machinery for sugar and cement industry
COTTON DIVISION
Manufacturer of quality cotton yarn of various counts of 6s to 30s including compact, slub and siro.
* Year joined Company
20 Crescent Steel and Allied Products Limited

ANNUAL GENERAL MEETINGThe 30th Annual General Meeting of Crescent Steel and Allied Products Limited will be held on 23rd October 2014 at 12:00 noon at Qasr-e-Noor, 9 E-2, Main Boulevard, Gulberg- III, Lahore.
AUDITORSKPMG Taseer Hadi & Co.
LEGAL ADVISOR Hassan and Hassan, Advocates, Lahore
BANKERS Allied Bank Limited Al- Baraka Bank (Pakistan) Ltd.Barclays Bank PLC, PakistanHabib Metropolitan Bank Limited Industrial Commercial Bank of China MCB Bank LimitedSummit Bank LimitedStandard Chartered Bank (Pakistan) Limited
REGISTERED OFFICE 10th Floor, BOP Tower, 10-B, Block E-2, Main Boulevard, Gulberg-III, Lahore.Telephone: +92 42 3578 3801-03,Fax: +92 42 3578 3811
LIAISON OFFICE LAHORE 10th Floor, BOP Tower, 10-B, Block E-2, Main Boulevard, Gulberg-III, Lahore.Telephone: +92 42 3578 3801-03Fax: +92 42 3578 3811Email: [email protected] PRINCIPAL OFFICE 9th Floor, Sidco Avenue Centre, 264 R.A. Lines, Karachi-74200. Telephone: +92 21 3567 4881-85Fax: +92 21 3568 0476Email: [email protected]
FACTORY – STEEL DIVISION PIPE AND COATING PLANTS
A/25, S.I.T.E., Nooriabad, DistrictJamshoro, Sindh.Telephone: +92 25 4670 020-22 +92 25 4670 055Email: [email protected]
ENGINEERING UNIT
17 Km Summundri Road, Dalowal, District Faisalabad, Punjab. Telephone: +92 41 2569 825-26Fax: +92 41 2679 825
MILLS – COTTON DIVISION
Crescent Cotton Products (Spinning Unit)1st Mile, Lahore Road, Jaranwala, District Faisalabad, Punjab. Telephone: +92 41 4318 061-65Fax: +92 41 4318 066Email: [email protected] POWER PLANT Shakarganj Energy (Private) Limited 57 Km Jhang Sargodha Road, Bhone, District Jhang.Telephone: +92 48 6889 210 -12
CRESCENT HADEED (PRIVATE) LIMITED57 Km, Jhang Sargodha Road, Bhone, District Jhang.Tel: 047 6006111
CORPORATE WEBSITE To visit our website, go to www.crescent.com.pk or scan QR code
For Annual Report for the year ended June 2014, go to http://www.crescent. com.pk/annual-report-2014-june/ or scan QR code
21Annual Report 2014

COMPANY PROFILE
Crescent Steel and Allied Products Limited is an equal opportunity employer with a sense of social responsibility and strongly supports education, healthcare and environmental causes.
STEEL DIVISIONThe Spiral Pipe Plant has the capability of manufacturing high quality steel pipes in the diameter range of 8” – 90” (219 mm – 2,286 mm) in wall thickness from 4 mm – 20 mm and material grades up to API 5L X-80. The Company has been gradually enhancing the pipe production capacity which has increased to the present notional capacity of 90,000 tonnes extendable up to maximum 200,000 tonnes per annum. The Company has authorization to use API monogram of the American Petroleum Institute (API) – the highest international standard accredited for quality of steel line pipe. It also has the ISO 9001:2008 certification. In addition, CSAPL is the first Pakistani company to acquire oil and gas industry specific ISO/TS 29001, Quality Management System Certification from API.
The external Coating Plant is capable of applying coatings such as Multi Layer Polyolefin coatings, Single Layer Fusion Bonded Epoxy coatings, Liquid Epoxy coatings and High Temperature Heat Shrink Tape Coatings on steel pipes ranging from 4” – 60” (114 mm – 1,524 mm). Furthermore, the division is also capable for cold applied tape coatings on pipe diameter above 60” (1,524 mm) and internal epoxy coating for flow efficiency
and / or corrosion protection on diameters ranging from 8” – 60” (219 mm – 1524 mm).
CSAPL has diversified its product offering by adding capabilities to fabricate and erect machinery especially for sugar and cement industry. This diversification enables the Company to manufacture machineries such as boilers, cane shredders up to diameter 1700mm, juice heaters, evaporators, batch and continuous vacuum pans, centrifugal machines, stainless steel spray clusters and multi-jet condensers, perforated plates and vibro screens, and high voltage transformer tanks.
Crescent Steel maintains high quality norms in all its products and has consistently exceeded the requirements of international standards both in steel line pipe manufacturing and coatings and will continue to remain at the cutting edge of technology, quality control and quality assurance.
COTTON DIVISION The Company is running cotton spinning mill located at Jaranwala near Faisalabad, which is the hub of textile industry and carries out this activity under the name and title of “Crescent Cotton Products” (CCP) a division of Crescent Steel and Allied Products Limited. CCP is a division of the Company but its operating results are shown separately. CCP as a division holds ISO 9001: 2008 Quality Management Credentials, is registered with Ministry of Textile Industry Pakistan and is a member of
CRESCENT STEEL AND ALLIED PRODUCTS LIMITED (CSAPL) IS A PUBLIC LIMITED COMPANY LISTED ON ALL THE STOCK EXCHANGES OF PAKISTAN. IT STARTED COMMERCIAL PRODUCTION IN MARCH 1987. THE MANUFACTURING FACILITIES CONSIST OF A SPIRAL PIPE PRODUCTION LINE AND AN INTERNAL/EXTERNAL COATING LINE, BOTH LOCATED SIDE BY SIDE AT THE SINDH INDUSTRIAL TRADING ESTATE, NOORIABAD IN JAMSHORO, SINDH AND A COTTON SPINNING UNIT OF 19,680 SPINDLES AT JARANWALA, PUNJAB. COMPANY’S INVESTMENT AND INFRASTRUCTURE DEVELOPMENT DIVISION MANAGES AN INVESTMENT PORTFOLIO AND REAL ESTATE.
22 Crescent Steel and Allied Products Limited

International Cotton Association Limited (ICA Limited) and All Pakistan Textile Mills Association (APTMA). CCP produces good quality cotton yarn with value addition of Slub, Siro and Compact Attachments. CCP consisting of 19,680 spindles is equipped with modern high-tech European and Japanese machinery ensuring a high-quality yarn making process, producing various counts from 6s to 30s and having a notional capacity (based on 20s) of 6.5 million kgs per annum. CCP products are consistently in demand and generally sold at a premium.
INVESTMENT AND INFRASTRUCTURE DEVELOPMENT DIVISIONThe division manages a portfolio of equity investments and real estate. The portfolio is balanced in a way that spreads risk over a diversified spectrum and offers potential for growth as well as dividend yields.
SUBSIDIARY COMPANIESCS CAPITAL (PRIVATE) LIMITED
CS Capital (Private) Limited is a fully owned subsidiary. The principal activity of the subsidiary is to manage investment portfolios in shares, real estate, commodities and other securities (strategic as well as short term).
SHAKARGANJ ENERGY (PRIVATE) LIMITED
Shakarganj Energy (Private) Limited (SEL) has developed a co-generation, bagasse fired thermal
generation power plant due to commence commercial operations in November 2013. The primary business of the subsidiary is to generate, accumulate, distribute, sell and supply electricity to FESCO, PEPCO and to other distribution companies as permitted. This plant is currently under commissioning at Bhone, Punjab.
• Solution De Energy (Private) Limited:
Solution De Energy (Private) Limited was incorporated as a private limited company in Pakistan as a result of Joint Venture (JV) agreement executed on 8 October 2013. The principal activity of the company is to build, own, operate and maintain 100MW solar power project and to generate, accumulate, distribute, sell, and supply electricity/ power to PEPCO/DISCOS under the agreement with the Government of Pakistan or to any other consumer as permitted.
CRESCENT HADEED (PRIVATE) LIMITED
Crescent Hadeed (Private) Limited (the Company) was incorporated on 15 May 2013 as a private limited company in Pakistan under the provisions of the Companies Ordinance, 1984. The principal business of the Company is to manufacture and sale of steel billets through a Steel Melting plant, to be located at Bhone, District Jhang, Punjab. The Company is currently in the process of setting up its plant / factory.
23Annual Report 2014

BOARD OF DIRECTORSMr. AHMAD WAQAR, 65 Chairman (Non-Executive, Independent)
Masters in English Literature, MBA
Joined Board: 30 January 2012
Other engagements: Chairman Pangea Growth (Private) Limited
Past engagements: Secretary Revenue Division / Chairman FBR Investment Division and Board of Investment Finance Division Ministry of Petroleum and Natural Resources Privatization Commission
Mr. AHSAN M. SALEEM, 61 Chief Executive OfficerMasters in Economics
Joined Board: 01 August 1983
Other engagements: Chairman Commecs Institute of Business and Emerging Sciences Chief Executive Shakarganj Mills Limited Director The Citizens Foundation Pakistan Centre for Philanthropy Managing Trustee Commecs Educational Trust
Mr. NASIR SHAFI, 65 Director (Non-Executive)
MBA
Joined Board: 01 August 1983
Other engagements: Chief Executive Officer Crescent Bahuman Limited The Crescent Textile Mills Limited
Mr. KHURRAM M. KARIM, 49 Director (Non-Executive)
MBAJoined Board: 29 October 2013
Other engagements: Director Crescent Jute Products Limited The Crescent Textile Mills Limited Crescent Software Products Limited Crescent Agrifarms (Private) Limited Crescent Venture International (Private) Limited Crescent holding (Private) Limited Shams Textile Mills Limited
24 Crescent Steel and Allied Products Limited
Mr. S.M. Ehtishamullah, 75 Director (Non-Executive)
FCA
Joined Board: 30 January 2000
Mr. Zahid Bashir, 69 Director (Non-Executive)
MBA
Joined Board: 01 August 1983
Other engagements: Chairman Equity Textile Mills Limited Mohammad Amin Mohammad Bashir Limited Premier Financial Services (Private) Limited Premier Insurance Co. of Pakistan Limited Director Asian Care Health and Life Insurance Company Limited Crescent Powertec Limited
SYED ZAHID HUSSAIN, 69 Director (Non-Executive, Independent)
B.Sc, LLB, MA
Joined Board: 01 September 2010
Other engagements: Director Nishat Mills LimitedPast engagements: Chairman Pakistan Industrial Development Corporation Cement Corporation of Pakistan Petroleum Corporation of Pakistan Oil & Gas Development Company Limited High Commissioner / Ambassador Kenya*
MUHAMMAD SAAD THANIANA, 47 Company Secretary and Chief Financial Officer
FCA, ACMA, Certified Director of Corporate Governance from PICG
Other engagements: Chief Executive Officer Shakarganj Energy (Private) Limited Director Crescent Hadeed (Private) Limited Shakarganj Food Products Limited
* with accredited assignments of Ambassadorship in Tanzania, Uganda, Rwanda, Krundse, Ethiopia and Eritrea
25Annual Report 2014

BOARD OF DIRECTORS AND ITS COMMITTEES
THE BOARDThe Company has a unitary board structure which consists of seven directors, of which four are non-executive, two are independent directors, and one executive director who is also the Chief Executive Officer of the Company. All the directors bring a wide range of experience to the Board, thereby ensuring best interest of stakeholders and the Company.
Crescent gives due consideration to the qualifications and expertise of individuals when deciding on the board of directors’ composition ensuring that there is a vast range of expertise and experience on the board preserving the best interests of the stakeholders of the Company. The composition of the Board is in accordance with the applicable laws and regulations.
The Board has formulated formal policies including risk management, procurement of fixed assets, goods and services, investments, borrowings, donations, charities and contributions, delegation of financial authority, transactions with related parties and transfer pricing, provision for slow moving stores and spares and impairment of assets etc. which are implemented and monitored through delegation of duties to three standing committees of the Board i.e. the Audit Committee, the Human Resources and Remuneration Committee and the Governance and Evaluation Committee.
BOARD COMMITTEESAUDIT
The Committee comprises of three members who all are Non-Executive Directors including an Independent Director as Chairman.
The terms of reference of the Audit Committee include the following:
• To provide the Board of Directors (“the Board”) with an independent and objective evaluation of the operations, policies, procedures and controls implemented within the Company.
• To provide supplemental assistance and resources to the internal audit department of the Company in order for them to provide the management and the Board of the Company with an independent, objective evaluation of their operations, policies, procedures and controls.
• To provide the Board with an oversight of the internal audit department in the Company to assure that an effective internal audit function is in place system- wide, which includes a risk based annual and long-range audit plan, a reporting mechanism and a quality control plan.
• To provide assistance to the Board in fulfilling their oversight responsibility relating to integrity of the financial statements and financial reporting.
• To review and evaluate procedures established to comply with laws and regulations and to monitor compliance thereof.
• To assess the Company’s risk management process including risk related to Financial Statements and Financial Reporting.
26 Crescent Steel and Allied Products Limited

HUMAN RESOURCES AND REMUNERATION
The Committee comprises of three members who are Non-Executive Directors including one Independent Director as Chairman. The Committee has been constituted to address and improve the area of Human Resource Development. The main aim of the committee is to assist the Board and guide the management in the formulation of the market driven HR policies regarding performance management, HR staffing, compensation and benefits, that are compliant with the laws and regulations.
The terms of reference of the Committee includes the following:
• Recommending human resource management policies to the Board.
• Recommending to the Board the selection, evaluation, compensation (including retirement benefits) of the CEO, CFO, Company Secretary and Head of Internal Audit.
• Ensure a proper system of succession planning for top management is in place and the adequacy of the same in the rest of the organization.
• Review the organizational structure and recommend changes, if any, to increase the effectiveness and efficiency of reporting lines and the division of authority and responsibility.
• Review the effectiveness of the recruitment and recommend changes, if any.
• Guide management in development/revision of all employees benefits, policies and rewards.
• Oversee employee development by monitoring HR aspects of organizational learning and development.
• Ensure that the performance management system is achieving its objectives of fairly rewarding employees’ performance and is in line with company objectives.
GOVERNANCE AND EVALUATION
The Committee comprises of two Non-Executive Directors of the Board including an Independent Director as Chairman. The role of the Committee is to assist the Board in the discharge of its function as well as compliance with the Company’s governing principles. The Committee takes a leadership role in shaping the Company’s governing principles in order to keep them in line with International best practices.
It is responsible for the following:
• Monitoring compliance with the Code of Corporate Governance (SECP’s and Company’s Governing Principles) other than those areas which fall under the oversight of the Audit Committee.
• Advising Directors on Governance principles periodically and changes in the requirements of the Code of Corporate Governance whenever required.
• Reviewing that the key functions of the Company and assignment/responsibilities of main functionaries are consistent with the business objectives.
• Advising the CEO on the adequacy of available skills and expertise for achieving the business objectives.
• Examining the need for additional Board Committees and recommending changes/modifications in the structure/ functions of the existing Board Committees.
• Evaluating the performance of the Board and its
committees.
Attendance in Meetings
Board Audit Committee HR and Remuneration Committee
Governance and Evaluation Committee
Required Attended Required Attended Required Attended Required Attended
NON-EXECUTIVE DIRECTORS
Mr. Mazhar Karim* 1 - - - - - - -
Mr. Ahmad Waqar 4 4 - - - - - -
Mr. Nasir Shafi 4 2 4 3 - - - -
Mr. S.M. Ehtishamullah 4 3 4 3 2 1 - -
Mr. Syed Zahid Hussain 4 4 4 4 2 2 - -
Mr. Zahid Bahir 4 4 - - 2 2 - -
Mr. Khurram Mazhar Karim** 2 1 - - - - - -
EXECUTIVE DIRECTOR
Mr. Ahsan M. Saleem 4 4 - - - - - -
* Mr. Mazhar Karim passed away on 12th September 2013.** He was appointed on the Board on 29th October 2013 to fill in the casual vacancy arising due to the death of Mr.Mazhar Karim.
27Annual Report 2014

MANAGEMENT COMMITTEES
EXECUTIVE COMMITTEE Ahsan M. Saleem, Chairman Abdul RoufIqbal Zafar SiddiquiMuhammad Saad Thaniana
The Committee devises long term policies and visions for the Company with the sole objective for providing the best returns to shareholders by optimum allocation of existing resources. The Committee is also responsible for review of Company’s operation on ongoing basis, establishing and ensuring adequacy of internal controls and monitoring compliance of key policies. Executive Committee meets on quarterly basis. Terms of reference of the committee include the following:
• Prepare, approve and keep an updated long term plan.
• Provide guidelines to the Business Strategy Committee for medium and short term tactics.
• Discuss new ideas and new business lines, new product lines, new markets, and / or refer new opportunities and feasible ideas to another committee for refinement.
• To analyse current market situation with a view to maintain sustainable competitive advantage.
• To discuss in detail the plans of the Group and accordingly adjust the policies of the Company to avoid any conflict.
• Analyse any group investment opportunities and refer to investment committee, if required.
BUSINESS STRATEGY COMMITTEEAhsan M. Saleem, Chairman Abdul RoufArif RazaHajerah A. Saleem Hasan Altaf Saleem Iqbal Zafar SiddiquiMuhammad Saad Thaniana
The Committee is responsible for formulation of business strategy, review of risks and their mitigation plan. Further, the Committee is also responsible for staying abreast of developments and trends in the Industry to assist the Board in planning for future capital intensive investments and growth of the Company. The committee meets at least twice a year. The terms of reference include the following:
• Prepare, approve and recommend to the Board a framework of business strategy.
• To develop and approve medium term plan(s) to meet interim objectives and milestone for any long term project approved by the Executive Committee.
• Review the progress of different new projects of the Company.
• Approve short term goals which will be qualitative and quantitative for different segments of the Company.
• Reviews periodically the targets achieved and revise the operational targets, if required.
• Review allocation of resources to different segments such as investments, core business etc.
• Gather information of the competitors’ business and prepare an updated SWOT analysis of the Company, to be submitted to the Executive Committee.
IT STEERING COMMITTEEAhsan M. Saleem, Chairman Muhammad Saad ThanianaIqbal Abdullah
The Committee monitors the implementation of IT Strategy on a regular basis. It ensures that CSAPL stays current with the evolving new technologies and Information System Processes. The Committee prepares long term IT plan including fostering an IT culture at all levels. Terms of reference of the committee include the following:
• Guide the IS Department and Management in preparing the IT Strategy of the Company in a cost effective manner.
• Monitor the implementation of the IT Strategy on a regular basis.
• Ensure that CSAPL stays current with the evolving new technologies and the latest Information System Processes as applicable to the business and growth of CSAPL.
• Provide the basis for preparing long term IT plans while not losing sight of the immediate goals and objectives.
• Facilitate the promotion of IT Culture in the Company at all levels. This has been done by traditional training interventions including company-wide workshops at all levels.
• Assist the Board to ensure that the IT vision provided by the Board is manifested in the IT Strategy and its subsequent implementation.
28 Crescent Steel and Allied Products Limited
INVESTMENT COMMITTEE Ahsan M. Saleem, Chairman Hajerah A. Saleem Muhammad Saad Thaniana
The Committee helps to maintain a balanced portfolio of investments and maximize returns while keeping risk at a desirable low level. Terms of reference of the committee include the following:
• Determine the sector wise weight-age of the portfolio based on market condition.
• Assess and monitor the risk associated to the portfolio.
• Review the performance of the investment and take decision relating to scrip wise entry and exit.
SOCIAL INVESTMENT AND CSR COMMITTEEMuhammad Saad Thaniana, Chairman Abdul RoufHasan Altaf SaleemHajerah A. Saleem Iqbal Zafar Siddiqui
The Committee reviews the distribution of charitable contribution in line with Company’s Policy for donations, charities and contributions. Terms of reference of the committee include the following:
• Review and recommend any changes to Company’s policy relating to Corporate Social Responsibility for the approval of BOD.
• Review and recommend the distribution of charitable contribution in line with the Corporate Social Responsibility policy.
• Review and monitor CSR activities.
• Engage and measure social investments for impact.
OTHERCOMMITTEESIn addition to the above committees, the Company has also constituted the following committees which work in their respective domains as per approved terms of references:
• Budget Committee
• Capital Assets Committee
• HSE Council
• Tender Committee
• Website Committee
29Annual Report 2014

REPORT OF THE AUDIT COMMITTEEThe Audit Committee (the Committee) comprises only of non-executive directors. Details of the directors are set out in the Board of Directors section of this report. The Chief Executive Officer (CEO), the Chief Financial Officer (CFO), the Internal Auditor and the External Auditor attend Audit Committee’s meetings by invitation. The Committee meets with the Internal Auditor and the External Auditor with and without both CEO and CFO being present.
The Audit Committee has concluded its annual review of the conduct and operations of the Company during 2014, and reports that:
• Four meetings of the Audit Committee were held during the year 2014 and presided by the Chairman, Audit Committee.
• The Audit Committee reviewed and approved the quarterly and annual financial statements of the Company and recommended them for approval of the Board.
• The Board has issued a “Statement of Compliance with the Code of Corporate Governance” which has also been reviewed by the auditors of the Company.
• Understanding and compliance with Company’s Code of Business Practice and Ethics has been affirmed by the members of the Board, the management and employees of the Company individually. Equitable treatment of shareholders has also been ensured.
• Appropriate accounting policies have been consistently applied, except those mentioned in note 4.1.1 to the financial statements. All core and other applicable International Accounting Standards were followed in the preparation of the financial statements of the Company on a going concern basis, for the financial year ended 30 June 2014, which present fairly the state of affairs, results of operations, cash flows and change in equity of the Company and its subsidiaries.
• The CEO and the CFO have reviewed the financial statements of the Company, consolidated financial statements and the Directors’ Report. They acknowledge their responsibility for true and fair presentation of the Company’s financial condition
and results, compliance with regulations and applicable accounting standards and design and effectiveness of internal control system of the Company.
• Accounting estimates are based on reasonable and prudent judgment. Proper and adequate accounting records have been maintained by the Company in accordance with the Companies Ordinance, 1984 and the external reporting is consistent with management processes and adequate for shareholders needs.
• The Audit Committee has reviewed and approved all related party transactions.
• No cases of complaints regarding accounting, internal accounting controls or audit matters, or Whistle Blowing were received by the Committee.
• The Company’s system of internal control is sound in design and has been continually evaluated for effectiveness and adequacy.
• The Audit Committee has ensured the achievement of operational, compliance, risk management, financial reporting and control objectives, safeguarding of the assets of the Company and the shareholders wealth at all levels within the Company.
• The Audit Committee ensured that their statutory obligations and requirements of best practices of governance have been met through a tool-kit developed by the management.
• During the year, the Committee also reviewed adequacy of the Audit Charter, and recommended few changes which were subsequently approved by the Board of directors.
• Closed periods were duly determined and announced by the Company, precluding the Directors, the CEO and Executives of the Company from dealing in Company shares, prior to each Board meeting involving announcement of interim /final results, distribution to shareholders or any other business decision, which could materially affect the share market price of Company, along with maintenance of confidentiality of all business information.
30 Crescent Steel and Allied Products Limited

INTERNAL AUDIT• The Board has effectively implemented the internal
control framework through an outsourced Internal Audit function via BDO Ebrahim and Co., Chartered Accountants on full time basis, who are suitably qualified and experienced for the purpose and are conversant with the policies and procedures of the Company.
• Internal auditor independently reviews the risks and control processes operated by management. The Internal Auditor carries out its duties under the charter approved by the Committee. It carries out independent audits in accordance with an internal audit plan which is approved by the Audit Committee before the start of the financial year.
• The internal audit plan provides a high degree of financial and business segment wise coverage and devotes significant effort to the review of the risk management framework surrounding the major business risks.
• Internal audit reports include recommendations to improve internal controls together with agreed management action plans to resolve the issues raised. Internal audit follows up the implementation of recommendations and reports progress to senior management and the Audit Committee.
• The Audit Committee reviews the findings of the internal audits completed during the year, taking appropriate action or bringing the matters to the Board’s attention where required.
• The effectiveness of the internal auditor is reviewed and discussed by the Audit Committee on an annual basis. Based on the Committee’s review of the performance of the internal auditor, the Committee has recommended to the Board for the appointment of BDO Ebrahim and Co., Chartered Accountants for FY15.
• Coordination between the External and Internal Auditors was facilitated to ensure efficiency and contribution to the Company’s objectives, including a reliable financial reporting system and compliance with laws and regulations.
EXTERNAL AUDIT• The statutory Auditors of the Company, KPMG
Taseer Hadi and Co., Chartered Accountants, have completed their Audit assignment of the “Company’s Financial Statements”, the “Consolidated Financial Statements” and the “Statement of Compliance with the Code of Corporate Governance” for the financial year ended 30 June 2014.
• The Auditors have been allowed direct access to the Audit Committee to ensure the effectiveness, independence and objectivity of the Auditors.
• The Audit Committee has reviewed and discussed Audit observations with the external auditors for the year ended 30 June 2014.
• The performance, cost and independence of the external auditor is reviewed annually by the Committee. Based on the Committee’s review of the performance of external auditor, the Committee has recommended to the Board that a resolution to reappoint KPMG Taseer Hadi and Co., Chartered Accountants, for FY15 be proposed at the forthcoming Annual General Meeting.
By order of the Audit Committee
Syed Zahid HussainChairman, Audit Committee21 August 2014
31Annual Report 2014

MANAGEMENT STRUCTURE / ORGANIZATION CHART
Human Resource and Remuneration Committee
CS Capital (Private) Limited
Projects and Information Manager
Head of Manufacturing
Manager Supply Chain
Shakarganj Energy (Private) Limited
Back Office Manager
Head of Marketing and Steel
Crescent Hadeed (Private) Limited
PortfolioManager
Manager QHS&E
GM – Engineering Unit
Manager Accounts (Factory)
Audit Committee
Governance and Evaluation Committee
Head of Internal Audit
Group Chief Executive Officer
Head of Risk & Compliance
CEO’s of Subsidiaries
Head of Supply Chain
Business Unit Head - IID
Business Unit Head - Steel
Company Secretary
Board of Directors
Maintenance Engineering Services Manager
Manager Pipe Production and Coating
IT & MIS Officer
Material Planning and Projects Manager
Factory HR and Admin Manager
Unit Manager (Engineering)
Factory Accounts Manager
32 Crescent Steel and Allied Products Limited

Manager IT Infrastructure
MillsManager
Treasury Manager
Manager Human Resources
Manager MIS
Electrical Engineer
Manager Accounts & MIS
Manager Administration
Power HouseIncharge
Manager Taxation
Manager CSR & Communication
CFO’s of Subsidaries
Spinning Manager QA
Manager Payroll
Manager HR & Administration - at
Locations
Manager Insurance
IT & MIS Officer
Manager Budgeting and Costing
Manager Accounts Payables
Manager Accounts Factory
Stores Manager
Manager Human Resource &
Administration
Business Unit Head - Cotton CFO CIO Head of
Corporate Affairs
33Annual Report 2014

IRON AGETHE FIRST KIND OF IRON PRODUCTION CAME INTO PLAY ALMOST
1000 YEARS AFTER THE INITIAL DISCOVERY OF BRONZE. THE
HITTITES DEVELOPED IRON WEAPONS IN NORTHERN ASIA MINOR
IN 2000 B.C., BECOMING THE FIRST TRIBE TO MAKE TOOLS AND
WEAPONS OF IRON. THEY HEATED THE IRON ORE AND POUNDED
OUT THE IMPURITIES, BEFORE PLUNGING IT INTO COLD WATER.
ALTHOUGH THEY TRIED TO KEEP THIS VALUABLE TECHNOLOGY A
SECRET, THE HITTITE EMPIRE COLLAPSED IN ABOUT 1200 B.C. AND
ITS PEOPLE MIGRATED ALL ACROSS THE WORLD, TAKING THEIR
KNOWLEDGE WITH THEM, SPREADING IT ACROSS ASIA, AFRICA
AND EUROPE, THEREBY USHERING IN THE IRON AGE.
34 Crescent Steel and Allied Products Limited
DIRECTORS’ REPORTTHE DIRECTORS OF THE COMPANY HAVE THE PLEASURE IN SUBMITTING THEIR REPORT TOGETHER WITH AUDITED FINANCIAL STATEMENTS OF THE COMPANY FOR THE YEAR ENDED 30 JUNE 2014.
OPERATING RESULTSThe financial results of the Company are summarized below:
2014 2013Rupees in‘000 Restated
Profit for the year before taxation 379,007 1,086,908Taxation (18,819) (270,978)Profit after taxation 360,188 815,930Total other comprehensive (loss)/income for the year (5,565) 65,836Unappropriated profit brought forward 1,037,550 325,164Profit available for appropriation 1,329,173 1,206,930
Appropriations: - Final dividend 2012 - @ 10% - (56,460) - First interim dividend 2013 - @ 10% - (56,460) - Second interim dividend 2013 - @ 10% - (56,460) - Final dividend 2013 - @ 15% (84,690) - - First interim dividend 2014 - @ 10% (62,106) - (146,796) (169,380)Transfer to general reserve (800,000) -Unappropriated profit carried forward 445,377 1,037,550Basic and diluted earnings per share Rs. 5.8 Rs. 13.1
The Board of Directors of the Company in their meeting held on 21 August 2014 have proposed a final cash dividend for the year ended 30 June 2014 of Rs. 1.5 per share (i.e. 15%) (2013: Rs. 1.5 per share) amounting to Rs. 93.159 million. This is in addition to the first interim cash dividend of Re. 1 per share (i.e. 10%) already distributed and recorded in these financial statements; this totals to a cash distribution of Rs. 2.5 per share (i.e. 25%) for the year ended 30 June 2014.
The proposed final cash dividend is subject to the approval of the members at the Annual General Meeting to be held on 23 October 2014. These financial statements do not include the effect of above proposal which will be accounted for in the period in which it is approved by the members.
35Annual Report 2014

STATEMENT ON CORPORATE AND FINANCIAL REPORTING FRAMEWORK• These financial statements, prepared by the
management of the Company, present fairly its state of affairs, the result of its operations, cash flows and changes in equity.
• Proper books of accounts of the Company have been maintained.
• Appropriate accounting policies have been consistently applied in preparation of financial statements except those mentioned in note 4.1.1 to the financial statements and accounting estimates are based on reasonable and prudent judgment.
• International Financial Reporting Standards (IFRS), as applicable in Pakistan, have been followed in preparation of financial statements.
• The system of internal control is sound in design and has been effectively implemented. The system is continuously monitored by Internal Audit and through other such monitoring procedures. The process of monitoring internal controls will continue as an ongoing process with the objective to further strengthen the controls and bring improvements in the system.
• There are no significant doubts upon the Company’s ability to continue as a going concern.
• There has been no material departure from the best practices of corporate governance, as detailed in the listing regulations.
• Details of significant changes in the Company’s operations during the current year as compared to last year and significant plans and decisions for the future prospects of profits are stated in the Chief Executive’s Review as endorsed by the Board of Directors.
• Key operating and financial data for last six years in summarized form is annexed.
• Information about taxes and levies is given in the notes to the financial statements.
• The number of employees as at 30 June 2014 were 724 (2013: 852).
• Value of Investment of following funds based on the audited accounts are as follows:
Name of Fund Value of Investment Period of latest audited accounts
Provident Fund Rs. 87.6 million 31 December 2009
Gratuity Fund Rs. 27.9 million 31 December 2009
Pension Fund Rs. 108.8 million 31 December 2009
CCP Provident Fund Rs. 16.5 million 30 June 2011
• During the year four meetings each of Board of Directors and Audit Committee were held whereas two meetings of Human Resource and Remuneration Committee were held. Attendance by each director is attached separately.
PATTERN OF SHAREHOLDING AND SHARES TRADEDThe pattern of shareholding and additional information regarding pattern of shareholding is attached separately.
No trading in the shares of the Company was carried out by the Directors, the Chief Executive Officer, the Chief Financial Officer, the Company Secretary, Executives and their spouses and minor children.
DIRECTORSElection of directors was held on 28 January 2012 and a seven member Board was elected unopposed whose term of office will expire on 29 January 2015. On 12th September 2013, Mr. Mazhar Karim, Director and Chairman of the Board passed away (Inna Iillahi wa inna ilaihi raji’un). The casual vacancy was filled by co-opting Mr. Khurram Mazhar Karim to the Board.
On 28 Jan 2012, the board constituted an audit committee comprising of one independent and two non – executive Directors. In addition to Audit Committee, the Board has also constituted the Human Resource and Remuneration committee and a Governance and Evaluation Committee; both comprise solely of Non-Executive Directors and are mandated to assist the Board to discharge its functions as well as monitor compliance with the Company’s governing principles.
36 Crescent Steel and Allied Products Limited

The above committees were already in place before they were incorporated in the revised Code of Corporate Governance introduced by SECP on 10 April 2012.
Four meetings of the Board were held during the year to review and approve all issues and matters referred by the board committees. The issues discussed included periodical and annual financial statements, corporate and financial reporting framework, corporate strategy, budget reviews, budget forecasts with actual cash flows, management letters issued by the external auditors, compliance with relevant laws and regulations including the amendments introduced during the year, the development and finalization of a formal whistle blowing policy and framework, acquisitions and disposals of fixed assets, review of risks identified and their mitigation, accounting and internal control system including IS controls and other significant management issues.
During the year, four Audit Committee meetings were held to review periodical and annual financial statements, audit plans and reports issued by the internal audit function.
Two meetings of the Human Resource and Remuneration (HR & R) committee were held to address changes in the regulatory environment, review policies relating to employee compensation and benefit plans and evaluate the performance of the Chief Executive Officer. The Board of Directors approved the appointment, remuneration and terms and conditions of employment of the Chief Executive Officer, the Chief Financial Officer, the Company Secretary and Head of Internal Audit, as recommended by the Human Resource and Remuneration Committee. The Chief Executive Officer, the Chief Financial Officer and the Company Secretary did not take part during the discussion in the Board when their respective employment contracts were being discussed.
Further, for the purposes of clause xvi(l) of the Code of Corporate Governance, the Board had set the threshold that Functional Heads of all the Departments of the Company shall be considered as “Executive”. The Board has reviewed the threshold and found it satisfactory keeping in view the management structure of the Company.
ROLE OF CHAIRMAN AND CHIEF EXECUTIVE OFFICERThe Chairman and the Chief Executive Officer have separate and distinct roles. The Chairman has all the powers vested under the Code of Corporate Governance and presides over Board meetings. The principal role of the Chairman is to manage and to provide leadership to the Board of Directors of the Company. The Chairman is accountable to the Board and acts as a direct liaison between the Board and the management of the Company through the Chief Executive Officer. The Chairman is independent from management and free from any interest and any business or other relationship which could conflict with the Chairman’s independent judgement.
The Chief Executive Officer performs his duties under the powers vested by the law and the Board, and recommends and implements the business plans, and is responsible for overall control and operation of the Company.
BOARD’S PERFORMANCE EVALUATIONGovernance and Evaluation Committee has assessed the Board’s performance based on the established mechanism of self-assessment by the individual Board members. The above mechanism was approved by the Board on the recommendation of Governance and Evaluation Committee.
37Annual Report 2014

INDUSTRIAL AGEONE OF THE MOST IMPORTANT DEVELOPMENTS IN MAKING THE
FIRST APPRECIABLE QUANTITIES OF HIGH-GRADE BAR-IRON
DURING THE INDUSTRIAL REVOLUTION WAS THE PROCESS OF
PUDDLING. INVENTED BY HENRY CORT IN HAMPSHIRE, THE
ORIGINAL PUDDLING TECHNIQUE REVOLVED AROUND STIRRING
MOLTEN IRON WITH RODS IN A REVERBATORY FURNACE. IT WAS
ONE OF THE FIRST PROCESSES FOR MAKING BAR IRON WITHOUT
CHARCOAL IN EUROPE. BY 1843, THE LEGENDARY STEAM SHIP
CALLED ‘GREAT BRITAIN’ WAS DESIGNED PURELY FROM PUDDLED
WROUGHT IRON.
38 Crescent Steel and Allied Products Limited
CEO’S PERFORMANCE EVALUATIONDuring the year, the Human Resource and Remuneration Committee of the Board evaluated the performance of the CEO in line with the established performance based evaluation system.The evaluation was reviewed against the following criteria:• Leadership• Policy and strategy• People Management• Business Processes/Excellence• Governance and Compliance• Financial Performance• Societal Impact Investment
Committee’s recommendations were, thereafter, reviewed and approved by the Board.
ABSTRACT UNDER SECTION 218(1) OF THE COMPANIES ORDINANCE, 1984During the year ended 30 June 2014, the Board of Directors has revised the remuneration of Mr. Ahsan M. Saleem, Chief Executive Officer from Rs. 852,400 to Rs. 900,000 per month effective from 1 January 2014. There was no change in other terms and conditions of his appointment.
Mr. Ahsan M. Saleem is an elected director of the Company and is considered as interested in the aforesaid revision of his terms of appointment.
FINANCIAL STATEMENTSAs required under listing regulations 35(xxi) of Karachi Stock Exchange, the Chief Executive Officer and Chief Financial Officer present the financial statements, duly endorsed under their respective signatures, for consideration and approval of the Board of Directors and the Board, after consideration and approval, authorize the signing of financial statements for issuance and circulation.
The financial statements of the Company have been duly audited and approved without qualification by the auditors of the Company, KPMG Taseer Hadi & Co., Chartered Accountants and their report is attached with the financial statements.
No material changes and commitments affecting the financial position of your Company have occurred between the end of the financial year to which this Balance Sheet relates and the date of the Directors’ Report.
AUDITORSThe auditors, KPMG Taseer Hadi & Co., Chartered Accountants are due to retire in the forthcoming annual general meeting of the company and have offered themselves for re-appointment. The Board Audit Committee and the Board of Directors of the Company have recommended their appointment for shareholders consideration and approval at the forthcoming annual general meeting.
CHIEF EXECUTIVE’S REVIEWThe Directors endorse the contents of the Chief Executive’s Review for the year ended 30 June 2014 which contains the state of the Company’s affairs, operational performance, future prospects of profits and other requisite information. The contents of the said review shall be read along with this report and shall form an integral part of the Directors’ Report in terms of section 236 of the Companies Ordinance, 1984 and the requirements of the Code of Corporate Governance under the Listing Regulations of the Stock Exchanges.
By order of the Board
Ahsan M. SaleemChief Executive Officer21 August 2014
39Annual Report 2014

Ahsan M. SaleemChief Executive Officer
40 Crescent Steel and Allied Products Limited

I take pleasure in presenting the Annual Report of your company along with audited Financial Statements (Separate and Consolidated) for the year ended 30 June 2014.
ECONOMIC AND DEVELOPMENT OUTLOOKPakistan’s growth for FY14 clocked in at 4.1%, higher than the ADB forecast of 3.4%. The outgoing fiscal year indicated mild economic recovery with single digit inflation, higher tax collections, a reduced fiscal deficit, and local currency appreciation largely on the back of improved growth in the large-scale manufacturing sector, expansion in private sector credit and accumulation of foreign exchange reserves; exports remained mildly positive and strong remittances supported the national FX position. In addition, recent efforts to remove tax exemptions and broaden the tax base contributed to higher tax revenues, though the revenue to GDP ratio still remains unsustainably low at about 8.5%.
Pakistan faces significant economic, governance and security challenges to achieve durable development outcomes. The persistence of conflict in the border areas and security challenges throughout the country is a reality that affects all aspects of life in Pakistan and impedes development. The sharp rise in international
oil and food prices, combined with the recent floods can have a devastating impact on growth. Accelerating progress in human development remains the key underpinning factor for sustained economic gains; the Net Enrollment rates in education have been increasing but still lag behind other South Asian countries. Large capital inflows have helped to boost foreign-exchange reserves, but the country’s balance of payments position remains weak.
Encouragingly, inflation is expected to remain stable, enabling status-quo in the country’s Monetary Policy – a pull factor for investments. Lower debt servicing obligations than in FY14, coupled with a stronger Rupee and higher FX inflows on the back of stable remittances, strong market multiples, and higher exports given the GSP Plus status, will ease pressure on the country’s FX position.
As we move into FY15 consumer spending remains the main driver of growth. Security challenges are likely to remain largely unchanged over the short to medium term. The absence of reliable power supply to the industry and low investment in human capital will continue to limit GDP growth, which the ADB expects will average 3.8% in FY15. Performance in FY15 will largely depend on the government’s ability to follow through on reforms and provide greater energy security.
CHIEF EXECUTIVE’S REVIEWI AM PLEASED TO REPORT ANOTHER PROFITABLE YEAR IN WHICH, EVEN THOUGH WE WERE NOT ABLE TO SUSTAIN REVENUES AND OPERATING MARGINS FOR KEY BUSINESS SEGMENTS, WE HAVE OUTPERFORMED OUR INDUSTRY IN CASH GENERATION AND LARGELY ACHIEVED OUR TARGETS FOR NEW BUSINESS. THIS IS A CREDITABLE PERFORMANCE IN THE WAKE OF ECONOMIC AND STRUCTURAL CHALLENGES AND I AM PROUD OF THE COMMITMENT AND HARD WORK OF MY LEADERSHIP TEAM AND ALL MY COLLEAGUES ACROSS THE GROUP.
41Annual Report 2014

MARKET REVIEW AND PERFORMANCE OUTLOOKSTEEL LINE PIPES
Gas shortages continue to loom in Pakistan as the country awaits the development of required import infrastructure. Domestic consumption continues to rise rapidly, boosted by the start-up of additional gas-fired power stations and continued use of compressed natural gas (CNG) cars. With struggling production, a limited potential for significant increases in gas production and the lack of an import infrastructure, the demand for line pipes may not pick up in the short-medium term.
Plans to import LNG with two planned fast-track regasification projects are in the pipeline and, if constructed, could generate demand for line pipes in FY15-FY16 at the earliest. The recent start-up of shale gas exploration is also promising, especially as the United States Energy Investment Administration (EIA) now estimates that Pakistan could hold as much as 3 tcm in shale reserves. Similarly, exploration for shale oil could also accelerate as it is now projects that Pakistan sits on nearly 9bn barrels. The EIA estimates place gas output peaking at 40.13 bcm in 2015 and falling afterward to slightly above 36.65 bcm by 2022 as the Sui and Qadirpur Gas fields - the two main producing fields in Pakistan - reach the end of their producing lives.
Going forward, a surge in oil and gas exploration activities remains a major demand stimulant of large diameter steel line pipes necessary for transmission. Increasing energy shortages call for new explorations and remain the key drivers for demand of large diameter line pipes in the short to medium term.
Limited opportunities for demand growth are also available in the Water and Sewerage and, Construction sectors. Ageing of pipeline infrastructure and the need to replace old pipelines also holds long term opportunities for growth in this segment. In addition the Government’s recent decision to allow fertilizer companies to procure gas directly from E&P companies has also opened up new markets for large diameter pipe manufacturers.
With the Federal Budget targeting an aggregate outlay of Rs. 3.98 trillion of which proportioned amount for the Public Sector Development Programme (PSDP) is Rs. 1.2 trillion, and, greater focus on developing the country’s energy infrastructure, we are optimistic on business prospects for our engineering sector businesses, in the medium to long term.
PIPE COATINGS
The market for external pipe coatings in Pakistan is gradually expanding, with increasing demand for line pipe coatings; the market for internal coating remains underdeveloped. Crescent Steel led local market development in external as well as internal line pipe coatings. Our vast experience in high temperature external coatings with several coating systems including 3-layer polyolefin, heat shrink tape and epoxy coatings give us a competitive edge.
OUTLOOK ON LINE PIPE AND PIPE COATINGS
Performance in FY14 for both line pipe manufacturing and line pipe coatings remained dull. We have however, participated in recent tenders and bids that are currently under evaluation. We are hopeful that the business activity will pick up during the second quarter
42 Crescent Steel and Allied Products Limited

of FY15 and provide momentum for the remainder of FY15. Major projects in the water sector are also expected to be initiated during FY15 – FY16 including the Karachi Bulk Water Supply (K4) project and Islamabad Water Supply Project. In addition to these, Port/Jetty Construction Projects if initiated will also generate demand for steel line pipes.
Outlook on steel prices is stable, and prices are expected to remain range-bound over the next six months.
MARKET SHARE
During the year our market share for both bare line pipe and pipe coatings declined to 39.77% (FY13: 47.26%) and 17.65% (FY13: 29.83%), respectively. The fall in market share is primarily on account of the nature and size of tenders and the price cutting competition (both foreign and local bidders) in a low activity environment.
COTTON YARN
The textile sector is one of the most important industrial sectors of Pakistan and has a wide-range production chain, with inherent potential for value addition at each stage of processing, from cotton to ginning, spinning, fabric, processing, made ups and garments. It is the major export supporter and contributes to 60% of the country’s export value while employing 40% of industrial labour force.
Non-availability of gas and electricity affected the performance of the sector as a whole and compelled units to run under capacity boosting up their cost of production. Due to stiff competition and devaluation of the US Dollar, the sector could not fully reap the benefits of GSP plus status awarded in FY14. Dampened demand from China for yarn was another factor which kept local yarn prices under pressure.
Cotton is the dominant fiber used as raw material in the textile industry. Pakistan is the fourth largest world producer and third largest consumer of cotton. Pakistani cotton is more contaminated compared to other countries. This requires intensive work to eliminate impurities, affects quality, and fetches lower rates for cotton products. Due to a crash in cotton prices in the last quarter of FY14, spinning units holding inventories at higher value remained under pressure.
As per USDA estimates, Pakistan’s Marketing Year (MY) 2014-15 cotton crop is forecast at 10.5 million (480 lb.) bales, 10.5% higher than the MY 2013-14 production level of 9.5 million bales.
To promote the textile sector, the GOP announced duty draw back at 1%, 2% and 4% for processed fabric, made ups and garments respectively, for exports beyond 10% over the previous year. Additionally, the government reduced the mark-up rate for export refinance from 9.4% to 7.5%, expedited the refund system, offered a long term finance facility through the State Bank of Pakistan at the rate of 9% for 3-10 year tenors and extended allowance of duty free import of machinery up to June 30, 2016 under textile policy 2009-14.
Cotton Yarn Outlook
The USDA’S first world FY15 cotton projections anticipate that production will exceed consumption for the fifth consecutive season with the potential for record global stocks to exceed 100 million bales. China’s government now intends to reduce support levels; however world stocks are unlikely to fall in FY15 as the adoption of new policies will be gradual and world production and consumption responses will lag changes in policy and price. Lower Chinese support levels and higher stock outside of China however dampen world cotton prices.
After the arrival of new crop, cotton prices have gone down significantly, improving margins for spinners. Expectations of better quality cotton is expected to push up yields. In the event that gas supply to the industry is restored during FY15, spinning units especially those situated in Punjab will be able to operate at full capacity, lowering cost of production and pushing up margins.
CAPITAL MARKETS – KSE100 INDEX
FY14 has been one of the best years for Pakistan stocks, as the benchmark KSE-100 index gained 41%, or 8,647 points. The annual return of 41% in the fiscal year compares favourably with the 20-year average annual return of 21%. In FY14, MSCI Pakistan gained 23% compared to a 31% gain of MSCI Frontier Markets (MSCI-FM) and 16% gain of MSCI FM-Asia. Among Asian frontier markets categorised by MSCI, Pakistan ranks first, outpacing Bangladesh (21%), Vietnam (13%) and Sri Lanka (-1%).
43Annual Report 2014

The Pakistan market welcomed the structural reforms introduced by the Government. A growth rate of 5.6% in the large-scale manufacturing (LSM) sector supported the KSE-100 index; historically, there has been a positive correlation between the LSM and KSE performance as a significant percentage of listed companies constitute manufacturing sector corporates.
During the year FX reserves stood strong, crossing the USD 14 billion mark, consequently the Rupee appreciated benefiting net importers and the country’s FX reserves. Foreign investors, who held $5.7 billion worth of Pakistan shares – 33% of free-float and 8% of market cap – remained net buyers in FY14. According to reports net foreign buying for FY14 stood at USD 248 million.
We continue to maintain a positive stance on the market, ceteris paribus, we expect blue chip stocks on the KSE-100 index to continue to yield healthy returns.
Equities Market Outlook
Going forward, the key drivers over the next year will be the rate of growth in consumer spending, structural and fiscal consolidation, foreign inflows – both as FDI and aid from bilateral and multilateral aid agencies and improved overall governance. Economic indicators are generally improving, with growth continuing to gain momentum, inflation on a downward trajectory, and credit to the private sector rebounding sharply. The industrial sector contributed 20.8% to GDP in FY14 –it constitutes a majority of the listed companies on the benchmark KSE–100 index. Disinvestment in state owned entities may have an adverse impact on the index performance in the short term, however, it will likely be set off as liquidity generated in the market through the upcoming public offerings and privatisation activities is reinvested in the equities market. Inflation is expected to remain contained within single digit figures and status quo is likely in the SBP’s monetary policy in the short term. Security challenges and power shortages continue to dampen growth potential, however, a stronger Rupee, backed by healthy corporate earnings and retail sector growth are expected to support the KSE–100 index over FY15.
CHALLENGESTARIFF ANOMALIES
Industry and trade regulations remain a core challenge as regional players, strengthened by government subsidies, sell steel products across international markets to capitalize on attractive dumping margins. Local manufacturers in Pakistan face survival challenges as large diameter pipe imports are largely unregulated, with no variance between duties on imported raw material and finished product (for large diameter welded pipes). We have been consistently pursuing this issue with Engineering Development Board (EDB), Board of Investment (BoI) and FBR in an attempt to seek trade remedies/protection for local manufacturers. We believe that to get to the next level Pakistan needs a robust and thriving engineering sector. Unfortunately, the Engineering sector as a whole and large diameter pipe manufacturers in particular do not have a level playing field. The long established principle of cascading duties has been compromised after the withdrawal of concessionary duty on raw material (Hot Rolled Coil) - as a result, both the raw material and finished goods are subject to the same duty of 10%. This leaves the sector open to threat from low quality import at dumping prices.
ENERGY INSECURITY
Increasing shortages in power and gas supply particularly at the cotton spinning unit is adversely affecting production activities, pushing up input costs, eroding margins. The Company is looking at alternate energy resources to address and mitigate the risk associated with power and gas outages.
FINANCIAL AND OPERATIONAL PERFORMANCEOVERALL FINANCIAL PERFORMANCE
The Company’s after tax profit for the year ended 30 June 2014 (FY14) decreased to Rs. 360.2 million as compared to Rs. 815.9 million in FY13. EPS for the current year stood at Rs. 5.8 as compared to FY13 EPS of Rs. 13.1. The Company has paid an interim dividend of Re. 1.0 (10%) per share and announced Rs. 1.5 (15%) at the end of year making an aggregate of Rs. 2.5 (25%) for the year.
44 Crescent Steel and Allied Products Limited

On Group basis [including the results of the wholly owned subsidiary companies Shakarganj Energy (Private) Limited (SEL), CS Capital (Private) Limited and Crescent Hadeed (Private) Limited], consolidated profit after taxation for the year amounted to Rs. 553.4 million and EPS stood at Rs. 8.9.
FINANCIAL AND OPERATIONAL PERFORMANCE BASED ON SEPARATE FINANCIAL STATEMENTS
The financial year ended with Steel and IID divisions contributing positively to the bottom line while Cotton division incurred a loss. The IID division contributed the most to the bottom line; whereas, Steel Division remained low as compared to last year.
Sales revenue decreased by 19.4% to Rs. 4,032 million for FY14 (FY13: Rs. 5,002 million). Profit before tax of Steel and IID divisions amounted to Rs. 91.8 million and Rs. 392.8 million (FY13: Rs. 269.9 million and Rs. 442.7 million) respectively, whereas the Cotton division incurred a loss before tax of Rs. 105.5 million (FY13: PBT Rs. 374.3 million). The total profit after tax of Rs. 360.2 million includes gain on sale of investment amounting to Rs. 282.4 million and a provision on impairment of investments aggregating Rs. 51.3 million.
Summary of operating results as per Separate Financial Statements:
• Sales revenue stood at Rs. 4,032 million (FY13: Rs. 5,002 million).
• Investment income increased to Rs. 440 million (FY13: Rs. 298 million).
• Gross profit margin was 5.7% for current year as compared to 13% last year.
• EBIT declined to Rs. 463 million for the current year (FY13: 1,150 million).
• EBITDA stood at Rs. 563 million in FY14 (FY13: Rs. 1,245 million).
• EPS decreased to Rs. 5.8 for the current year (FY13: Rs. 13.1 restated).
• Return on average capital employed was 10.5% (FY13: 29.0%).
• Return on average equity was 9% for the current period (FY13: 23%).
• Break-up value per share increased to Rs. 64.5 (FY13: Rs. 64.0).
BUSINESS SEGMENTSSTEEL DIVISION – OPERATIONAL AND FINANCIAL REVIEW
The actual mix diameter bare pipe production during FY14 declined by 16% to 10,248 tons (FY13: 12,266 tons), while capacity utilization of the pipe plant was 24% (FY13: 30%). Coating activities decreased by 76% in terms of volume and stood at 58,650 square meters of pipe (FY13: 245,505 square meters).
On account of sluggish business activity and lower sales the division’s performance remained under pressure. Revenue from the unit decreased by Rs. 683 million in FY14 to Rs. 1,282 million or 35% (FY13: 1,965 million). Fixed costs remained unabsorbed and consequently, GP during FY14 was lower by 48% at Rs. 243 million compared to Rs. 464 million during FY13.
OPERATING RESULTS – STEEL Rs. in million
Sales
0 500 1000 1500 2000
FY14
FY13
Gross Profit Net Profit
COMPOSITION OF TOTAL PBT (FY14)
Steel – 24%
Cotton – (28%)
IID – 104%
TOTAL REVENUE AND INCOME (FY14)
Steel Division
0 1000 2000 3000 4000 5000 6000
FY14
FY13
Cotton Division Investment Income Other Income
45Annual Report 2014

COTTON DIVISION – OPERATIONAL AND FINANCIAL REVIEW
Precarious energy supply resulted in stoppages and restricted the unit from running at full swing to meet targeted production. The unit produced 18.7 million Lbs. of mixed count yarn (FY13: 22.5 million Lbs.).
Cotton division recorded sales revenue of Rs. 2,749 million (FY13: Rs. 3,037 million), which includes revenue from yarn sales at outsourced facilities totalling Rs. 792 million and raw cotton sales of Rs. 132 million.
The gross loss for the period was Rs. 13 million against gross profit of Rs. 186.6 million in FY13; this is primarily due to an increase in cost of sales, underutilization of capacity.
The net loss for the year was Rs. 105.5 million, against a net profit of Rs. 89.3 million (excluding insurance claim settlement) in the previous year.
INVESTMENT AND INFRASTRUCTURE DEVELOPMENT (IID) DIVISION – OPERATIONAL AND FINANCIAL REVIEW
Fiscal year 2014 came to an end with the benchmark KSE-100 index posting a gain of 41% (FY13: 52%) to close at 29,653 points on the back of better corporate earnings, interest of offshore investors, and an improved economic environment. Addition of stocks on the MSCI index and government steps to address the looming energy crisis added to the positive sentiment however, the fragile security condition and political nuances affected activities at the bourse at the end of the year. Market capitalization, up by 36%, hit Rs. 7.02 trillion at the end of the year (FY13: Rs. 5.15 trillion). Key activities on the economic front kept the market volatile during the last quarter, specifically, given the news of privatization activities that led to investors seeking possible arbitrage opportunities.
The division’s profit before tax for the year ended 30 June 2014 stood at Rs. 392.8 million, 11.3% lower when compared to Rs. 442.7 million last year. This includes an impairment provision of Rs. 51.3 million (FY13: An impairment reversal of Rs. 167.3 million), on shares of Shakarganj Mills Limited. Exclusive of the impairment impact FY14 PBT is Rs. 168.7 million (61%) higher at Rs. 444.1 million (FY13 PBT – net of impairment reversal: Rs. 275.4 million). The profit is mainly attributable to income from investments amounting to Rs. 440.1
PROFITABILITY Rs. in million
Sales
-500 0 500 1000 1500 2000 2500 3000 3500
FY14
FY13
Gross (loss)/profit Operating (loss)/profit
PRODUCTION In million Lbs
0 5 10 15 20 25
FY14(mix)
FY14(20s)
FY13(mix)
FY13(20s)
INVESTMENT PORTFOLIO
Strategic Investments – 83%
Held for Trading – 17%
million. Total investment income includes dividend income of Rs. 97.6 million (includes dividend returns of Rs. 60.5 on investments in equity accounted associate, Altern Energy Limited) compared to Rs. 60.3 million last year.
Income from the HFT investments stood at Rs. 145.4 million, on average investments of Rs. 482 million. During the year, the IID division’s portfolio of equity investments (HFT and AFS investments, excluding strategic and unquoted investments) recorded a return of 68% on average investments of Rs. 542.6 million – higher than the benchmark KSE–100 index, which increased by 41%.
At the year end, the value of investments in marketable securities (excluding strategic investments) amounted to Rs. 432.0 million (FY13: Rs. 768.1 million). During the period under review, shares valuing Rs. 213.1 million were purchased while shares equaling Rs. 719.6 million were sold on account of trading activities and switching positions.
46 Crescent Steel and Allied Products Limited
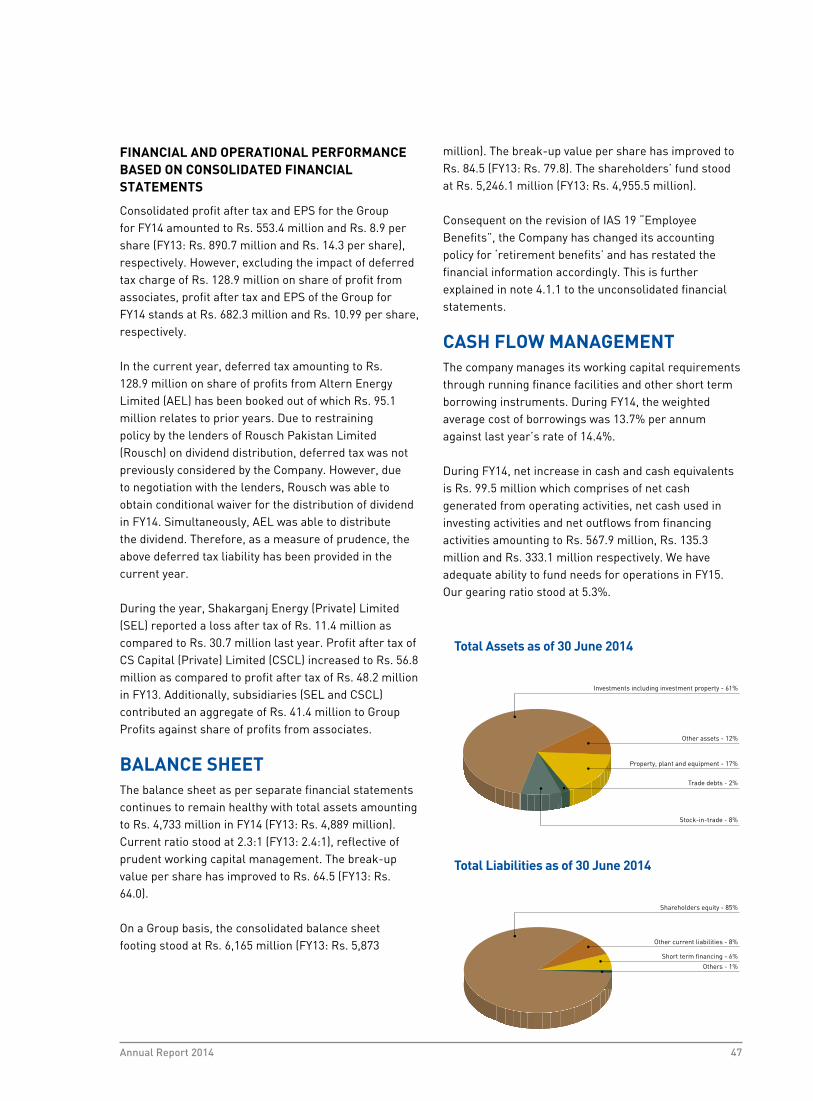
FINANCIAL AND OPERATIONAL PERFORMANCE BASED ON CONSOLIDATED FINANCIAL STATEMENTS
Consolidated profit after tax and EPS for the Group for FY14 amounted to Rs. 553.4 million and Rs. 8.9 per share (FY13: Rs. 890.7 million and Rs. 14.3 per share), respectively. However, excluding the impact of deferred tax charge of Rs. 128.9 million on share of profit from associates, profit after tax and EPS of the Group for FY14 stands at Rs. 682.3 million and Rs. 10.99 per share, respectively.
In the current year, deferred tax amounting to Rs. 128.9 million on share of profits from Altern Energy Limited (AEL) has been booked out of which Rs. 95.1 million relates to prior years. Due to restraining policy by the lenders of Rousch Pakistan Limited (Rousch) on dividend distribution, deferred tax was not previously considered by the Company. However, due to negotiation with the lenders, Rousch was able to obtain conditional waiver for the distribution of dividend in FY14. Simultaneously, AEL was able to distribute the dividend. Therefore, as a measure of prudence, the above deferred tax liability has been provided in the current year.
During the year, Shakarganj Energy (Private) Limited (SEL) reported a loss after tax of Rs. 11.4 million as compared to Rs. 30.7 million last year. Profit after tax of CS Capital (Private) Limited (CSCL) increased to Rs. 56.8 million as compared to profit after tax of Rs. 48.2 million in FY13. Additionally, subsidiaries (SEL and CSCL) contributed an aggregate of Rs. 41.4 million to Group Profits against share of profits from associates.
BALANCE SHEET The balance sheet as per separate financial statements continues to remain healthy with total assets amounting to Rs. 4,733 million in FY14 (FY13: Rs. 4,889 million). Current ratio stood at 2.3:1 (FY13: 2.4:1), reflective of prudent working capital management. The break-up value per share has improved to Rs. 64.5 (FY13: Rs. 64.0).
On a Group basis, the consolidated balance sheet footing stood at Rs. 6,165 million (FY13: Rs. 5,873
million). The break-up value per share has improved to Rs. 84.5 (FY13: Rs. 79.8). The shareholders’ fund stood at Rs. 5,246.1 million (FY13: Rs. 4,955.5 million).
Consequent on the revision of IAS 19 “Employee Benefits”, the Company has changed its accounting policy for ‘retirement benefits’ and has restated the financial information accordingly. This is further explained in note 4.1.1 to the unconsolidated financial statements.
CASH FLOW MANAGEMENT The company manages its working capital requirements through running finance facilities and other short term borrowing instruments. During FY14, the weighted average cost of borrowings was 13.7% per annum against last year’s rate of 14.4%.
During FY14, net increase in cash and cash equivalents is Rs. 99.5 million which comprises of net cash generated from operating activities, net cash used in investing activities and net outflows from financing activities amounting to Rs. 567.9 million, Rs. 135.3 million and Rs. 333.1 million respectively. We have adequate ability to fund needs for operations in FY15. Our gearing ratio stood at 5.3%.
Total Assets as of 30 June 2014
Property, plant and equipment - 17%
Trade debts - 2%
Stock-in-trade - 8%
Investments including investment property - 61%
Other assets - 12%
Total Liabilities as of 30 June 2014
Short term financing - 6%
Others - 1%
Shareholders equity - 85%
Other current liabilities - 8%
47Annual Report 2014

INITIATIVES Innovation, machinery optimisation and process improvement initiatives are of great value to us at Crescent Steel. We remain relentless in our pursuit of enhancing output through continuous improvements in our processes and infrastructure. We believe that targeted improvement initiatives lead to increased productivity, enhanced uptime, better quality products, better service and environmental conservation.
STEEL DIVISION
During the year, our Quality lab was upgraded with SPECTROLAB, for reliable metal analysis. As a result requisite tests can be conducted in-house reducing turnaround time on product delivery to our line pipe clients. It also enables us to offer quality testing services to other manufacturers in the country. Our Engineering Services team also carried out extensive preventive checks and quality audits on the SP machine to replace certain parts and upgrade the unit.
We stay committed to remaining at the cutting edge of technology and in ensuring quality of our products, to maintain cost and quality leadership and, to uphold our position as market leaders.
COTTON DIVISION
To mitigate production losses and improve product quality and total productivity a compact attachment on 8 Ring machines was installed.
Steps were also taken to conserve energy and manage input costs at the unit by shutting down one shift of back process during peak tariff and process re-engineering of the blow room machinery line.
INVESTMENT AND INFRASTRUCTURE DEVELOPMENT DIVISION
The division invested in an Investment Management System to track and monitor equity investments in a real time environment providing decision support and reducing time costs on operations.
CONTRIBUTION TO NATIONAL EXCHEQUER AND ECONOMYContribution to the National Exchequer and the Economy aggregated Rs. 873.0 million. The Company has contributed Rs. 357.9 million towards the national exchequer on account of government levies and taxes (FY13: Rs. 730.2 million). Contribution to the Economy included Rs. 84.1 million on account of payments to providers of capital, societal investments of Rs. 22.3 million in the form of donations and sponsorships and Rs. 155.3 million in the shape of shareholders’ returns through cash dividends. Crescent Steel continued to contribute to economic prosperity by providing employment for 742 full and part-time employees with compensation and benefits of Rs. 253.4 million.
During the year, the Company manufactured 10,248 tons of steel pipes and 18.7 million lbs. of cotton yarn; bought Rs. 3,629 million worth of goods and services from various suppliers.
SHARE PRICE SENSITIVITY ANALYSISThe Company share price is generally related to its performance and operating results. The price is also sensitive to industry trends and cycles of the various business segments that it operates i.e. Engineering, Textiles and Capital Markets. During the first half of FY14 activity was low in the steel business segment, but picked up pace in the 3rd and 4th quarter. During the year, cotton spinning segment remained under pressure given cotton price fluctuations and the impact of China’s yarn procurement policy. This affected the industry negatively and eroded profit margins.
‘CSAP’ opened in FY14 at Rs. 44.99, peaking at Rs. 74.80 in August 2013, mainly on back of FY13 results which
Company Share Price
40
45
50
55
60
65
70
75
80
July
-13
Aug
-13
Sep-
13
Oct
-13
Nov
-13
Dec
-13
Jan-
14
Feb-
14
Mar
-14
Apr
-14
May
-14
Jun-
14
48 Crescent Steel and Allied Products Limited
were significantly higher when compared to FY12. For the remainder of the first half of FY14 the share price remained largely range bound between Rs. 50 and Rs. 60, dipping and remaining below Rs. 50 in the second half of FY14, closing the year at Rs. 43.51 – the lowest price seen during the fiscal year. The share price however, was adjusted for the total dividend pay-out of 10% announced after the third quarter of FY14 in addition to the 15% dividend and 10% bonus issue announced for FY13 during the first quarter of FY14.
QUALITYCrescent Steel is committed to the highest standards of quality in product delivery and services while maintaining strong customer focus. We strive to apply cutting edge technology and remain client centric to drive profitability and efficiency, without compromising on quality. Every year, we make sure incremental improvements are made through specific quality improvement projects that run in parallel to our strategic and process improvement initiatives. Effectiveness of our Quality Management System is ensured through an independent quality function.
STEEL DIVISION
Since inception, the Company retains authorization to use the American Petroleum Institute (API) monogram; API signifies the highest international standard accredited for quality of steel line pipes. In 1997, the Company was awarded Certificate of ISO 9001 “Quality Management Systems-Requirements” which it continues to retain as ISO 9001:2008, and became the first Pakistani company to have acquired certification of API Specification Q1 “Specification for Quality Management System Requirements for Manufacturing
Organizations for the Petroleum and Natural Gas Industry.”
Crescent Steel also retains ISO 14001:2004 & OHSAS 18001:2007 standards certification awarded in 2010. Obtaining this HSE certification was possible through consistent dedication and hard work of all our people and reinforces our commitment to the highest standards of HSE and Quality.
COTTON DIVISION
The Division strives to make quality yarn for weaving mills in counts ranging from 6s to 30s and strives to maintain product quality. To achieve and maintain this level a competent quality team is established for both in-house and out sourced processing.
To ensure the highest quality standards, the division consistently retains Lloyd’s Register Quality Assurance (LRQA) and ISO 9001:2008 certifications, applicable to manufacturers of Carded and Carded Compact Spun Yarn.
INFORMATION TECHNOLOGY GOVERNANCEInformation Management and Information Technology is built into our corporate strategy; our IT team is not structured as cost centre but a business partner. We strive to develop an agile IT infrastructure with well-integrated systems and resources to streamline operations, add value to business and enable informed decision making to channel growth.
BUSINESS CONTINUITY MANAGEMENT: DISASTER RECOVERY PLAN
Our Disaster Recovery Plan (DRP) refer to an action plan devised in advance to prevent breakdown of important
49Annual Report 2014

Company operations and restoring and restarting them in as little time as possible if they are interrupted by the occurrence of any man-made disaster or due to any natural catastrophe. The data loss and time to recover is measured within the defined concepts of Recovery Time Objective (RTO) and the Recovery Point Objective (RPO).The Company has a star network topology for internal Data Communication. Business sites are inter-connected for the various sort of data communication through high speed fiber over a Point to Point (PPP) dedicated connection with a secured backup link over the internet for redundancy.
The Primary Server, housed at a Tier-3 data center, is a state of the art machine, which has integrated servers, SAN storage, networking and I/O into a single chassis with inbuilt redundancy for each component. The server operates in a clustered virtual mode which ensures a high degree of availability. Backup of all data is a regimented practice with a copy of the backup stored safely at an offsite location.
On occurrence of any untoward event Company IT is fully equipped to initiate DRP response protocols at red alert to ensure full recovery, restoration and restarting of systems in minimum time.
STRATEGIC ALIGNMENT WITH ORACLE ERP:
Our information systems are integrated with manufacturing processes to capture real time data for process owners consistently providing business intelligence for enabling target oriented decision making. Implemented in 2009, our information management system consists of Oracle financials with 13 Modules covering all layers of Financials, Order Management, Inventory, Supply Chain, and Project Management.
SECURE AND UNINTERRUPTED INFRASTRUCTURE WITH OPEN CLOUD:
As a process improvement and cost reduction initiative, the entire IT infrastructure has been established at a Tier-3 Data Centre with a Tier-1 network and a backup link which gives us immense capability to grow and expand our services in a cost effective manner.
MOBILITY AND VALUE DELIVERY:
During the year our in-house IT team designed and developed a customer interface to provide real time order status information to Steel Division clients. The
interface is currently under User Acceptance Testing (UAT) and is expected to be launched shortly.
RECORD MANAGEMENT:
Historical records are maintained offsite with adequate access controls. We are working to digitize records and information as far as possible to ensure a sustainable data warehousing and paperless environment. This will not only ensure safety of data, but also offer the advantage of being able to access this information anytime, anywhere.
CORPORATE SOCIAL RESPONSIBILITY AND IMPACT INVESTINGCorporate Social Responsibility (CSR) is a strategic management-driven initiative that integrates our business, environmental and citizenship activities in a manner that upholds our values. While Crescent Steel competes hard to achieve leadership and business success, we are not concerned only with results, but with how the results are achieved and the impact of our activities for our stakeholders.
We believe that the long term success of our business is dependent on the socio-economic well-being of the communities in which we operate. We believe that if we are to function in a healthy climate in the future we must take actions now that will ensure our viability. Our success in business depends on our ability to meet a range of environmental and social challenges. We must show we can operate safely and manage the effect our activities can have on neighbouring communities and society as a whole.
The Crescent Steel Corporate Strategy includes a commitment to sustainable development that involves balancing short and long-term interests, and integrating economic, environmental and social aspects into our business decisions.
Our CSR is divided into four categories: the economic, legal, ethical and philanthropic/discretionary responsibilities to our stakeholders – these principles are already well integrated into our day to day work. Our philanthropic CSR policy allocates 2% to 5% of pre-tax profits towards focused community investments in the education, environment and health sectors. Working with selected community partners the Company made social investments of Rs. 22.3 million (FY13: Rs. 35.1 million) in the form of donations and sponsorships.
50 Crescent Steel and Allied Products Limited

Impact Investing Initiatives for FY14 include investment in an Endowment Fund to support our educational investments, allocation to Scholarship Funds, and investment in hospital equipment – all these initiatives enable our community partners to invest funds for a financial or social return on a rolling basis. During the year we launched a matching contribution scheme enabling employees to donate to partner organisations directly through our counters and multiply their impact. Detailed data and information on our 2014 environmental and social performance is published in the Crescent Steel Corporate Responsibility Report 2014 while selected partnerships are also captured below.
COMMITMENT TO EDUCATION:
EDUCATION NON-PROFIT PARTNER: THE CITIZENS FOUNDATION (TCF)
One out of every ten out of school children in the world are from Pakistan; Education is the right of every child. We support a robust community development program focusing on primary education through our non-profit partner, The Citizens Foundation (TCF).
Our Eighteen-year journey with TCF has been a tremendous experience. Starting with Crescent Steel campus I in 1997, today the Company has built 21 schooling units (16 primary and 5 secondary) and continues to support 15 schooling units (12 primary and 3 secondary). An estimated 2,000 children have graduated from primary schools supported by us, over 200 secondary school graduates from campuses supported by us have been awarded tertiary level scholarships arranged by TCF and in 2014 alone 75 students graduated from secondary schools supported by us. Combined enrolment in these schools today is 3,272 students, the majority of whom reside in some of the most impoverished communities of the country; 45% of these students are female.
JUGNOO SABAQ
An adult literacy program launched in 2003 within the Company to help improve literacy levels among workers at our facilities. This year three Employees from Nooriabad who had cleared their SSC Part-I from the Board of Secondary & Intermediate Education in Hyderabad appeared and have cleared their Matriculation Examination, held in April 2014.
51Annual Report 2014

COMMITMENT TO HEALTH:
We continue to support health care initiatives through selected partners by allocating a budget and volunteer activities in the Health Sector.
HEALTH NON-PROFIT PARTNER: THE HEALTH FOUNDATION (THF)
THF’s main mandate is to educate the public on prevention and management methods of viral hepatitis - a disease that is affecting millions of people in Pakistan. Crescent Steel supported THF’s “A Hepatitis Free Community – Model” project that spanned a period of four years and concluded in FY14.
COMMITMENT TO COMMUNITY AND THE ENVIRONMENT:
ENVIRONMENT NON-PROFIT PARTNER: WWF - PAKISTAN
WWF-Pakistan is a member of the WWF International Network, one of the world’s largest environmental conservation organisations.
In addition to supporting conservation activities through targeted employee engagement initiatives, at the head office, 800 Square Feet of office space has been allocated
to WWF Pakistan enabling them to free up funds and labor in rent and maintenance so that the organization is able to focus on its core mission. We have enjoyed sharing our facilities with WWF for the past 18.5 years. RECYCLE, REDUCE AND REUSE
Crescent Steel donated 211 kg of waste paper and plastic in FY14 to Gul Bahao – a not for profit recycling organisation. 70% of this annual report is printed on 100% recycled paper.
TREE PLANTATION ACTIVITIES AT OUR CAMPUSES
During the year 200 trees were added at our Nooriabad premises and a massive plantation of 1,100 bizrumia trees was added to our Jaranwala and Dalowal facilities.
Over the years our plantation size has increased to over 5,720 trees. These trees will help us reduce our carbon
footprint by 34 tons of carbon annually.
MARINE CONSERVATION
MANGROVE PLANTATION
This fiscal year 75 mangrove saplings were planted by Crescent Steel volunteers at the WWF Wetland Centre. We also continue to maintain the 50 mangroves planted
52 Crescent Steel and Allied Products Limited

last year through monetary contributions that ensure that for every mangrove that doesn’t survive WWF will plant another sapling. This totals our mangrove plantation to 125, reducing our carbon footprint by an additional 739 kgs annually.
HEALTH, SAFETY, ENVIRONMENT AND SUSTAINABILITYWe have resolved to redouble our safety efforts and intensify our focus to avoid any accidents or incidents which could result in serious harm.
We manage safety risk across our businesses through controls and compliance systems combined with a safety-focused culture. Our standards and operating procedures define the controls and physical barriers we require to prevent incidents. We regularly inspect, test and maintain these barriers to ensure they meet our standards. The Company is committed to continually improve the work place environment by educating and briefing all its employees, contractors and visitors with regards to Health, Safety and Environment standards.
Through our reporting system we are building a culture in which all employees can discuss safety openly. This is reflected in the growing number of preventive reports,
which enable us to take prompt and more effective action to prevent unsafe situations. Our Mission Zero (zero incidents and accidents) campaign continues and we are shifting the focus from the measurement of lagging indicators to increase the focus on leading indicators with emphasis on major risks. We have also strengthened our engagement and encourage employees to participate more meaningfully in this critical agenda.
We have achieved positive progress in our safety agenda during the year and a particular success has been a marked performance improvement in our Cotton Division. Employee engagement and reward systems were introduced to encourage safety and health practices particularly by the unskilled workforce, which is inherently unsafe. One such reward system awarded bicycles to employees that remained true to health and safety standards at the unit.
PEOPLEThe strength of our business and financial performance reflects in the positive contributions we have been able to make throughout the year. In everything from new projects and initiatives through to workplace diversity and charitable partnerships we have been mindful of our opportunities and our responsibilities to influence positive change.
53Annual Report 2014
Our employees have shown their desire to make a positive contribution, at work and in their communities. One of the things of which I am most proud is the continued improvement in our employee engagement and participation levels.
EMPLOYEE COMMUNICATION AND ENGAGEMENT
At Crescent Steel, we want an open and creative culture that harnesses diversity and inclusion to inspire ideas and ignite innovation. By designing new and creative models of engagement, we equip future leaders with tools to create a culture of openness and innovation, where new perspectives and ideas are invited, heard and considered. More ideas lead to better ideas, and better ideas lead to innovation. Our focus is on culture and innovation as an approach to diversity inclusion.
Two-way dialogue between management and staff – directly and, where appropriate, via employee representative bodies – is important and embedded in our work practices. On a quarterly basis, we brief our staff about Crescent Steel’s operational and financial results through various channels, including electronic communications, publications and face-to-face gatherings.
The Crescent Steel Employee Satisfaction Survey is one of the principal tools used to measure employee engagement: the degree of affiliation and commitment to Crescent Steel. It provides insights into employees’ views, and has had a consistently high response rate. The average employee engagement score in FY14 was 69.6% favourable, a 0.15 point increase from FY13.The Open House with the CEO is one of the key drivers of process improvements at Crescent Steel. The Open House is designed to enable direct employee communication with the CEO, one on one and face to face. 81% of employees that participate in the Open House are from lower management tiers. Feedback from employees through these sessions have brought to light key issues relating to work place processes and the workplace environment.
We promote safe reporting of views about our processes and practices. Our drop box to the CEO and whistle blowing mechanisms enable employees to report, confidentially and anonymously, breaches of the Crescent Steel Governing Principles and Code of Conduct.
DIVERSITY AND INCLUSION
We have a culture that embraces diversity and fosters inclusion. By embedding these principles in our operations, we have a better understanding of the needs of our varied customers, partners and stakeholders and can benefit from a wider talent pool. We provide equal opportunity in recruitment, career development, promotion, training and reward for all employees, including those with disabilities.
We actively monitor representation of women in senior leadership positions, and have talent-development processes to support us in delivering more diverse representation.
TRAINING, DEVELOPMENT AND SUSTAINABILITY
Crescent Steel’s commitment to its workforce includes enabling managers and leaders to be pedals for accelerating the company’s growth. We invest in our leaders by providing learning and development opportunities that teach managers how to amplify talent, energy and capabilities.
Our approach on talent multipliers rests on four core principles: to lead, coach, drive and inspire. These principles define how we reach our individual and collective potential. Managers are role models who inspire their teams, live the passion of our products and promote creative environments for innovative thinking and relevant work.
In building our teams, we focus on Crescent Steel’s future business needs and how we can plan for growth. We have transitioned from a single product-based approach to a diverse product suite and multi-faceted businesses.
Our talent strategy focuses on critical assignment planning, manager accountability for coaching and mentoring, and a variety of innovative approaches to individual and team learning. We also work to ensure successful leadership transitions, develop the next generation of leaders and grow emerging and diverse talent.
DEVELOPING EMPLOYEES – FROM TRAINEE TO MANAGER:
Employee development is aimed at all levels – starting from career training through to further development
54 Crescent Steel and Allied Products Limited

of top management. The aim is to contribute to the successful professional and personal development of the employees.
SUCCESSION PLANNING
Talent management and succession planning is carried out annually. A performance development and retention plan is designed for selected candidates. This process allows us to strategize and develop management roles for the business ensuring that a talented pool of able employees is ready to step up once the need arises.
To ensure that we have an adequate leadership in pipeline required for Crescent Steel to continue to grow, we are investing significantly in the areas of sustainable talent practices and infrastructure.
REWARDS AND BENEFITS
We celebrate and compensate successful employee results through excellent benefits and rewards. Crescent Steel offers competitive compensation, including benefits that provide employees the opportunity to remain healthy, ensure the wellness of their families and create a positive working environment.
In addition to basic remuneration, our remuneration system reflects the particular responsibility and performance with which each employee contributes to the company’s success. Variable - performance based remuneration components are becoming increasingly important in this context: Each year the management shares the company profits, which influences the amount of the variable remuneration. The basis for this is the business unit’s key financial figures. In addition, variable remuneration is also influenced by individual achievement of operational and strategic objectives that are defined by mutual agreement in a target setting process.
As a Company located across Pakistan – every location is different yet each location provides for variable health coverage; our manufacturing facilities are equipped with designated fitness centers, provide adequate time off, retirement savings and more.
HR INTEGRATION – PROGRAM FOR IMPROVING HR MANAGEMENT
To better meet the requirements of a diverse workforce, we initiated HR Integration, a project to realign our HR role, in the year under review. The project focuses on harmonization, a stronger orientation of our HR processes and, based on this, redefining roles and responsibilities in our network of more than 742 staff members.
The aim of HR integration is to increase the efficiency, effectiveness and quality of HR work. We want everyone to think like an HR manager, to make our processes more efficient so that we can place an even stronger focus on strategic issues and challenges. In line with this, the project consists of four strands: HR processes, HR organization, HR shared services, and HR IT systems. In the year under review, the key aspects for the future alignment of the HR role were defined based on a comprehensive analysis and plans were approved for implementation in the coming years.
FIVE VALUES AS BASIS FOR CORPORATE CULTURE
Our five values are pivotal for all employees: Integrity, Ownership, Customer Focus, Continuous Improvement and Community Care. Always doing the right thing, the courage and freedom to act on one’s own authority, always giving one’s best in a fair manner, striving for better and giving back - all pulling together are the basis of our corporate culture. This provides the framework for how we work together, interact with each another, put leadership into practice and solve conflicts in our organization. We are convinced that our employees’ involvement and participation on the basis of our shared values is crucial to our success.
GOVERNANCEThe Board places paramount importance on good governance and to this effect has developed effective governance structures through various processes and frameworks. These include “Core values”, “Standard of Conduct for Directors”, “Standard of Conduct for Employees” and “Policy statement of ethics and business practices” in conformance with the Code of Corporate Governance in Pakistan and International best practices.
55Annual Report 2014

Values and ethics exemplify an organization’s relationship with its business and strategic alliances. Governance standards are regularly reviewed and updated to ensure their effectiveness and relevance in line with the long-term objectives of the Company. The Board acknowledges its responsibility for the overall strategy, management, identification of and solution for risks and challenges, sustained business prosperity and safeguarding shareholders’ rights.
The Board endorses the Best Practices of the Code of Corporate Governance as an effective tool in discharging these duties in addition to enhancing the timeliness, accuracy, comprehensiveness and transparency of financial and non-financial information through accountability and integrity.
At the management level, we have a robust system of monitoring performance of all business segments and overall entity performance. Each functional area has clearly spelt out objectives and key performance indicators. Employee performance measures and incentive compensation plans are linked to meeting the established goals and objectives, whereas entity performance is measured against a set of 48 financial and non-financial metrics that include: key financial ratios and operating statistics, Health & Safety indicators, sustainability indicators, customer and supply chain data, production parameters, a quality index, employee satisfaction results and employee turnover numbers.
The Board continuously reviews and approves its existing policies on rotation basis so that the said policies are reviewed at least once every three years.
WHISTLE BLOWING POLICY
Crescent Steel is committed to high standards of ethical, moral and legal business conduct. In line with this commitment, and our commitment to open communication, a whistle blowing policy is in place to provide an avenue for employees to raise concerns and reassurance that they will be protected from reprisals or victimization for whistle blowing.
The whistle blowing framework covers the following:
• Incorrect financial reporting;
• Unlawful activity;
• Activities that are not in line with Company’s policies, including the Code of Conduct; or
• Activities, which otherwise amount to serious improper conduct.
No such incidence was highlighted or reported under the framework during the year.
AWARDS AND ACCOLADESBEST CORPORATE REPORT AWARDS 2013 (ICAP AND ICMAP)
The Annual Report of the Company for the year 2013 secured 2nd position in the Engineering Sector of ‘Best Corporate and Sustainability Report Awards 2013’.
BEST SUSTAINABILITY REPORT AWARDS 2013 (ICAP AND ICMAP).
Our Sustainability Report for the year 2013 secured 4th position among all participants in the ‘Best Corporate and Sustainability Report Awards 2013’.
BEST CEO AWARD
Crescent Steel was awarded Best CEO Award for the industrial and mining sector in the 3rd CEO, CFO, CIO Conference & Leadership Awards ceremony, organized by the Mass Human Resource Services in collaboration with the Karachi Stock Exchange.
EMPLOYER OF THE YEAR AWARDS 2012
At the Employers’ Federation of Pakistan’s Employer of the Year Awards 2012 ceremony Crescent Steel was awarded for Best Enterprise for Work Place Safety in the large sector.
This award recognizes our contribution and commitment towards the provision of a safe and supportive work environment.
BEST PRACTICES AWARDS ON OSH&E (OCCUPATIONAL SAFETY, HEALTH AND ENVIRONMENT)
During the year, the Company secured 1st Prize in the 9th Employers’ Federation of Pakistan Best Practices Award on OSH&E (Occupational Safety, Health and Environment) in the Processing and Allied Sector.
56 Crescent Steel and Allied Products Limited

CORPORATE PHILANTHROPY AWARDS 2012
Crescent Steel and Allied Products Limited was selected by Pakistan Center of Philanthropy for the “Corporate Philanthropy Award 2012”. Our Company was also awarded a Certificate of Recognition for the philanthropic contribution made and related activities carried out during 2012.
MAJOR BUSINESS RISKS AND THEIR MITIGATIONThe Company is conducting business in a complex and challenging environment and is therefore exposed to a number of external and internal risks that may present threats to its success and profitability. Every business decision taken is based on weighing the associated risks against rewarding opportunities. We take measured risks as we strive to seize business opportunities that are compatible with our policies helping ensure measured sustainable growth.
Risk management is one of the essential elements of the Company’s corporate governance and creates a balance between entrepreneurial attitude and risk levels associated with business opportunities. Given the changes in our business environment and the new projects that we have undertaken, we have undertaken a review of our enterprise wide risk management framework which will be implemented over the course of FY15. The aim of this system is to review identified risks as well as to assess, manage, and deal with them in a timely manner. It supports recognition of developments likely to jeopardize the future performance of the Company and helps take pre-emptive action against unnecessary risks.
The risk management system also serves as a means to systematically record business risks of the Company and present and control these risks in a transparent and comparable manner. It provides reasonable assurance that our business objectives can be achieved and our obligations to stakeholders; namely, customers, shareholders, employees and the surrounding communities are met with the highest level of compliance and integrity. Risk management is primarily the responsibility of the business managers; however, top management takes responsibility for the oversight of key risks, their associated controls and compliance with legal requirements.
Major risks and their mitigations are covered separately in this report.
ACKNOWLEDGEMENTWe have faced some extraordinary challenges in our main business segments – Steel and Cotton; however, as a Group we stayed true to our mission and guiding principles. We put in place the building blocks to ensure we emerged from these challenges a stronger and more focused business, able to respond to the changing dynamics of the markets we operate in.
Our business model is resilient, and is underpinned by a management and performance framework that ensures we remain selective in securing projects which embrace our strength in engineering.
We expect to see strong performance from our engineering and capital markets businesses over the course of FY15. Our aim is to expand our product offering to capitalize on improving market conditions in the building and construction markets.
This financial year has proven our resilience. I would like to thank the Board and its committees for their proactive role in guiding us, and to all our employees and my management team for their strong commitment and their outstanding contribution to achieving this profitable result, in a very challenging time.
I would also like to thank you, our shareholders, and also our customers, for your continued patronage.
For and on behalf of the Board of Directors
Ahsan M. SaleemChief Executive Officer21 August 2014
57Annual Report 2014
MAJOR BUSINESS RISKS MITIGATING FACTORS / ACTIONS IN PLACE
MACRO-ECONOMIC SITUATION AND POLITICAL INSTABILITY
The overall liquidity position in the economy, fiscal deficit, reduction in PSDP and political instability in the Country may adversely affect the business of our customers, in particular of the Steel segment, thereby indirectly having an impact on the Company’s operations.
The Company operates through diversified business segments competing in different industries each with its distinct opportunities and risks. The Company constantly seeks to increase its customer base and product offering to maintain and grow its revenues.
RAW MATERIAL SOURCING / PRICING
Inability to access raw materials and growth in cost and expenses for raw materials may adversely influence the operations and non-availability of raw materials may lead to liquidated damages. Further, sensitivity in price movements of raw materials may lead to erosion of margins.
The Company aims to use its purchasing power and long term relationships with suppliers to acquire raw materials and safeguard their constant delivery at the best conditions. The supplier base is constantly increased to ensure uninterrupted procurement and reduction in lead times. The Company uses various available means including hedging to minimize any losses due to adverse price movements.
INVESTMENT RISK
Adverse stock market developments may affect the profitability and valuation of assets.
The Company has significant investments in marketable securities. To reduce this risk to an acceptably low level, it follows a diversified investment policy and actively manages its portfolio to match the required risk profiles.
CURRENCY RISK
Exchange rate fluctuations may have an impact on financial results due to reliance on imported raw material.
The Company uses various available means to hedge against currency fluctuations to minimize any resulting exchange losses.
CREDIT RISK
Credit risk is the risk of financial loss to the Company if a customer or counterparty to a financial instrument fails to meet their contractual obligations, and arises principally from trade receivables, bank balances, security deposits, mark-up accrued and investment in debt securities.
To manage exposure to credit risk in respect of trade receivables, management performs credit reviews taking into account the customer’s financial position, past experience and other factors. The tender approval committee approves sales tenders and credit terms. Where considered necessary, advance payments are obtained from certain parties whereas sales made to major customers are secured through letters of credit. Further, we limit our exposure to credit risk by investing in counterparties that have high credit ratings.
WITH AN EXPLICIT UNDERSTANDING THAT THIS IS NOT AN EXHAUSTIVE ENUMERATION, THE MAJOR RISKS AND CHALLENGES FACED BY THE COMPANY ALONG WITH MEASURES TAKEN FOR THEIR MITIGATIONS ARE SET FORTH BELOW
MAJOR BUSINESS RISKS AND THEIR MITIGATION
58 Crescent Steel and Allied Products Limited

MAJOR BUSINESS RISKS MITIGATING FACTORS / ACTIONS IN PLACE
SAFETY AND SECURITY OF ASSET
There is a risk that operational assets of the company may be lost, damaged or made redundant due to theft, fire or any other unforeseen events that will adversely affect the operations of the Company.
The company has designed and implemented high quality standards for safety and security of all the operational assets and compliance with such standards is strictly ensured and monitored. Apart from safety and security policies and procedures, the Company has fully insured all the assets of the Company to safeguard them from any unforeseen adverse event and to reduce the resulting financial and operational loss to a minimum level.
COST AND AVAILABILITY OF FUNDS
Exhaustion in the steady availability of funds and rise in interest rates may adversely affect liquidity and overall financial conditions.
The significant portion of working capital requirements of the Company is arranged through short term financing. To successfully mitigate these risks, the Company has secured sufficient financing facilities to meet these requirements. Further, the Company’s held for trading investments portfolio is also managed to meet the working capital needs, if required.
INTERNAL CONTROLS
In the absence of effective internal controls, the Company may be exposed to financial irregularities and resultant losses.
A robust internal control system is in place that is continuously monitored by the Company’s Internal Audit Function and through other monitoring procedures. The process of monitoring internal controls is an ongoing process with the objective to further strengthen the controls and bring improvements in the system. The controls in place also cover areas ranging from safeguarding of assets, compliance with laws and regulations and accuracy and reliability of records and financial reporting.
POWER AND GAS OUTAGE
Power and gas shortage may adversely impact the continuity of operations.
Smooth operations of the Company may get affected; in particular, of the Cotton segment which relies primarily on gas generators to meet its power requirements. The Company has made arrangements to provide alternative power source to ensure that operations are carried out uninterrupted and as planned.
INCREASE IN COMPETITION THROUGH LEVERAGING OF TECHNOLOGICAL CHANGES
Competitors may be able to identify and implement a major technological step, resulting in product substitution, improvement in their production efficiencies and lower costs. The Company’s inability to implement similar steps may make it uncompetitive.
Through corporate agility and strong market sensing, the Company remains abreast with information on product changes, demand and any technological advancements in current manufacturing processes to ensure that the Company at least matches but ideally, exceeds the quality and service performance of competitors. The Company continuously adds to its product and service offering along with constant expansion efforts to meet growing capacity demands and specific product needs.
EMPLOYEE RECRUITMENT AND RETENTION
Failure to attract and retain the right people may adversely affect the achievement of the Company’s growth plans.
A strong emphasis is placed on the Company’s human resource and its skill set. We operate the best talent management and human resource instruments to attract, retain, motivate, educate and nurture personnel and staff.
59Annual Report 2014

MODERN AGEDEVELOPED BY SIR WILLIAM SIEMENS AND FREDRICK SIEMENS,
OPEN-HEARTH FURNACES ARE ONE OF A NUMBER OF KINDS OF
FURNACES WHERE EXCESS CARBON AND OTHER IMPURITIES ARE
BURNT OUT OF PIG IRON TO PRODUCE STEEL. SIMILAR TO THE
PUDDLING PROCESS, BUT ON A MUCH LARGER SCALE, HEAT IS
RECYCLED USING A LABYRINTH OF BRICKWORK, WHICH IS HEATED
WITH THE EXHAUST GASES BEFORE CHANGING THE DIRECTION
OF FLOW AND USING IT TO PREHEAT THE INCOMING AIR.THIS
PROCESS BECAME MORE VIABLE DUE TO THE AMOUNT OF STEEL
PRODUCED FROM SCRAP RISING, SINCE THE BESSEMER PROCESS
ONLY PRODUCED ENOUGH HEAT IN THE VESSEL TO USE 5% SCRAP
IN PRODUCTION.
60 Crescent Steel and Allied Products Limited

STATEMENT OF VALUE ADDITION 2014 2013 Rupees in ‘000 % Rupees in ‘000 % WEALTH GENERATED Total revenue 4,813,105 100 6,203,194 100Bought-in-material and services (3,628,808) 75 (4,232,419) 68 1,184,297 25 1,970,775 32
WEALTH DISTRIBUTED
To Employees Salaries, wages and other benefits 253,376 22 252,397 13
To Government Income tax, sales tax, custom duties, WWF and WPPF 357,962 30 730,236 37
To Shareholders Dividend * 155,265 13 197,610 10
To providers of finance Finance costs 84,146 7 62,903 3
To Society Donation towards education, health and environment 22,275 2 35,150 2
Retained within the business for future growth Depreciation, amortization and retained earnings 311,273 26 692,479 35 1,184,297 100 1,970,775 100 * This includes final dividend recommended by the Board of Directors subsequent to year end.
Distribution of Wealth 2014
To Society - 2%
Retained within the business - 26%
To Government - 30%
To providers of finance - 7%
To Employees - 22%
To Shareholders - 13%
Distribution of Wealth 2013
To Society - 2%
Retained within the business - 35%
To Government - 37%
To providers of finance - 3%
To Employees - 13%
To Shareholders - 10%
61Annual Report 2014

PERFORMANCE INDICATORSFOR THE CURRENT AND PAST SIX FINANCIAL YEARS
2014* 2013* 2012* 2011* 2010* 2009* 2008PERFORMANCE INDICATORS Restated Restated
A - Profitability Ratios
Earnings before interest, taxation, depreciation and amortization (EBITDA) (Rs. in millions) 562.9 1,245.0 541.3 942.0 903.9 120.1 954.7 Profit / (loss) before taxation and deprecation (Rs. in millions) 473.5 1,179.7 453.4 787.1 771.5 (85.0) 801.4 Gross profit ratio (%) 5.7 13.0 12.9 18.4 22.1 21.6 21.3 Operating profit / (loss) margin to sales (net) (%) 11.5 23.0 11.0 17.5 19.4 (1.8) 17.4 Net profit / (loss) margin to sales (net) (%) 8.9 16.3 8.7 9.8 11.2 (12.0) 9.9 EBITDA margin to sales (net) (%) 14.0 24.9 14.6 21.4 24.4 3.6 22.7 Operating leverage ratio 3.1 6.2 4.2 0.4 (108.5) 5.1 (0.2) Return on equity (%) 9.0 20.5 11.0 15.0 15.9 (17.1) 13.9 Return on average equity (%) 9.0 23.0 11.4 15.7 16.8 (15.0) 13.4 Return on capital employed (RoCE) (%) 10.7 25.8 12.5 21.3 20.8 (1.8) 17.4 Return on average capital employed (%) 10.5 29.0 12.2 21.8 21.0 (1.5) 18.0 Return on average assets (%) 7.5 18.0 8.3 10.2 10.0 (9.1) 8.7 B - Liquidity Ratios
Current ratio 2.3 : 1 2.4 : 1 1.8:1 1.6 : 1 1.2 : 1 1.2 : 1 1.4 : 1 Quick / Acid-test ratio 1.6 : 1 1.7 : 1 1.2:1 0.9 : 1 0.6 : 1 0.8 : 1 1.1 : 1 Cash to current liabilities (%) (18.6) (25.3) (24.1) (49.8) (28.7) (45.8) (52.7) Cash flows from operations to sales (%) 14.1 (1.6) 7.3 2.5 12.2 10.1 13.5 Working capital (Net current assets) 830.6 1,233.5 851.2 683.9 374.7 308.0 706.0 Working capital turnover (times) 3.9 4.8 5.1 8.9 10.9 6.5 4.8 C - Activity / Turnover Ratios
Debtors turnover ratio (times) 28.2 17.7 15.3 20.9 20.5 32.7 28.0 No. of days in receivables / Average collection period (days) 13 21 24 17 18 11 13 Inventory turnover ratio (times) 7.1 7.0 4.8 3.8 3.5 4.2 5.3 No. of days in inventory (days) 51 52 76 95 104 86 68 Creditors turnover ratio (times) 38.1 19.9 16.2 23.1 14.1 24.6 19.7 No. of days in creditors / Average payment period (days) 9.6 18 23 16 26 15 19 Property, plant and equipment turnover (times) 5.1 6.4 5.9 4.3 3.5 2.7 3.4 Total assets turnover (times) 0.9 1.0 0.9 1.1 0.8 0.9 0.9 Operating cycle (days) 55 55 77 97 96 82 63 D - Investment / Market Ratios
Basic and diluted earnings / (loss) per share (Rs.) ** 5.80 13.14 5.50 6.95 6.71 (6.42) 6.69 Price earnings ratio (times) *** 7.5 3.4 4.2 3.8 3.7 - 9.2 Dividend yield (%) *** 5.7 7.8 8.6 13.4 12.0 - 4.9 Dividend payout ratio (%) *** 43.1 31.1 33.0 45.8 40.7 - 49.4 Dividend cover ratio (times) *** 2.3 3.8 2.8 2.0 2.2 - 2.2 Cash dividend (Rs. in millions) *** 155.3 197.6 112.9 197.6 169.4 - 154.0 Cash dividend per share (Rs.) *** 2.5 3.5 2.0 3.5 3.0 - 3.0 Stock dividend / Bonus shares (Rs. in millions) *** - 56.4 - - - - 51.3 Stock dividend / Bonus shares (%) *** - 10 - - - - 10 Market value per share (at the end of the year) (Rs.) 43.5 45.0 23.2 26.1 25.1 18.0 61.7 - Lowest during the year (Rs.) 43.5 21.6 18.0 23.8 18.0 13.0 58.0 - Highest during the year (Rs.) 74.8 54.5 28.5 31.7 34.0 61.0 108.0 Break-up value per share (Rs.) 64.5 64.0 50.1 46.3 42.2 37.5 48.2 E - Capital Structure Ratios
Financial leverage ratio (%) 8.3 12.2 11.7 25.5 31.9 46.0 49.2 Long term debt to equity ratio (%) 1.5 0.9 0.6 0.5 - 2.4 5.6 Cost of debt 13.7 14.4 16.7 17.0 14.4 15.8 12.5 Long term debt : Equity ratio 2 : 98 1 : 99 1 : 99 1 : 99 0 : 100 2 : 98 5 : 95 Total liabilities to total assets (%) 15.3 18.7 25.7 29.1 40.9 40.2 38.2 Gearing ratio (%) 5.3 9.6 8.8 20.0 20.7 31.4 32.9 Interest coverage (times) 5.5 18.3 3.9 5.4 5.9 (0.3) 5.1
Notes: * The figures presented in this analysis for the financial years ended 30 June 2014, 2013, 2012, 2011, 2010 and 2009 are those based on the Company’s separate financial
statements (please refer to note 2.1 to the financial statements for further information). The figures presented for the financial years prior to 2009 are based on the Company’s individual financial statements as published in the annual reports in those respective years.
** The basic and diluted earnings / (loss) per share for prior years have been restated to take into account the issue of bonus shares in the financial year ended 2013.
*** This includes declaration of final cash dividend and issue of bonus shares recommended by the Board of Directors subsequent to year end.
62 Crescent Steel and Allied Products Limited

Asset Management
-
5
10
15
20
25
30
35
40
(10)
(5)
0
5
10
15
20
2008 2009 2010 2011 2012 2013 2014
Debtors turnover (times) Inventory turnover (times)
Creditors turnover (times)Total assets turnover (times) Return on average assets (%)
Property, plant and equipment turnover (times)
Tim
es
Per
cent
age
Debt Management
-
10
20
30
40
50
(5)
-
5
10
15
20
2008 2009 2010 2011 2012 2013 2014
Total liabilities to total assets (%) Long term debt to equity (%)
Gearing ratio (%) Interest Coverage (times)
Per
cent
age
Tim
es
Dividend and Returns
-
10
20
30
40
50
-
0.5
1.0
1.5
2.0
2.5
3.0
3.5
4.0
2008 2009 2010 2011 2012 2013 2014
Dividend yield (%) Dividend payout ratio (%)
Bonus shares (%) Dividend per share (Rs.)
Rup
ees
Per
cent
age
Liquidity
-
300
600
900
1,200
1,500
2008 2009 2010 2011 2012 2013 2014
Rup
ees
in M
illio
n
Tim
es
0.5
1.0
1.5
2.0
2.5
Net current assets (Rs. in Millions) Current Ratio
Quick/Acid test Ratio
Per Share Result
(10)
-
10
20
30
40
50
60
70
80
(1)
-
1
2
3
4
5
6
7
8
9
10
2008 2009 2010 2011 2012 2013 2014
Earnings per share (Rs.) Dividend per share (Rs.)
Break-up value (Rs.)Price earnings ratio (times)
Market value (Year end) (Rs.)
Rup
ees
Tim
es
Return on capital and equity
(20)
(15)
(10)
(5)
-
5
10
15
20
25
30
2008 2009 2010 2011 2012 2013 2014
Return on capital employed (%) Return on average capital employed (%)
Return on equity (%) Return on average equity (%)
Per
cent
age
63Annual Report 2014
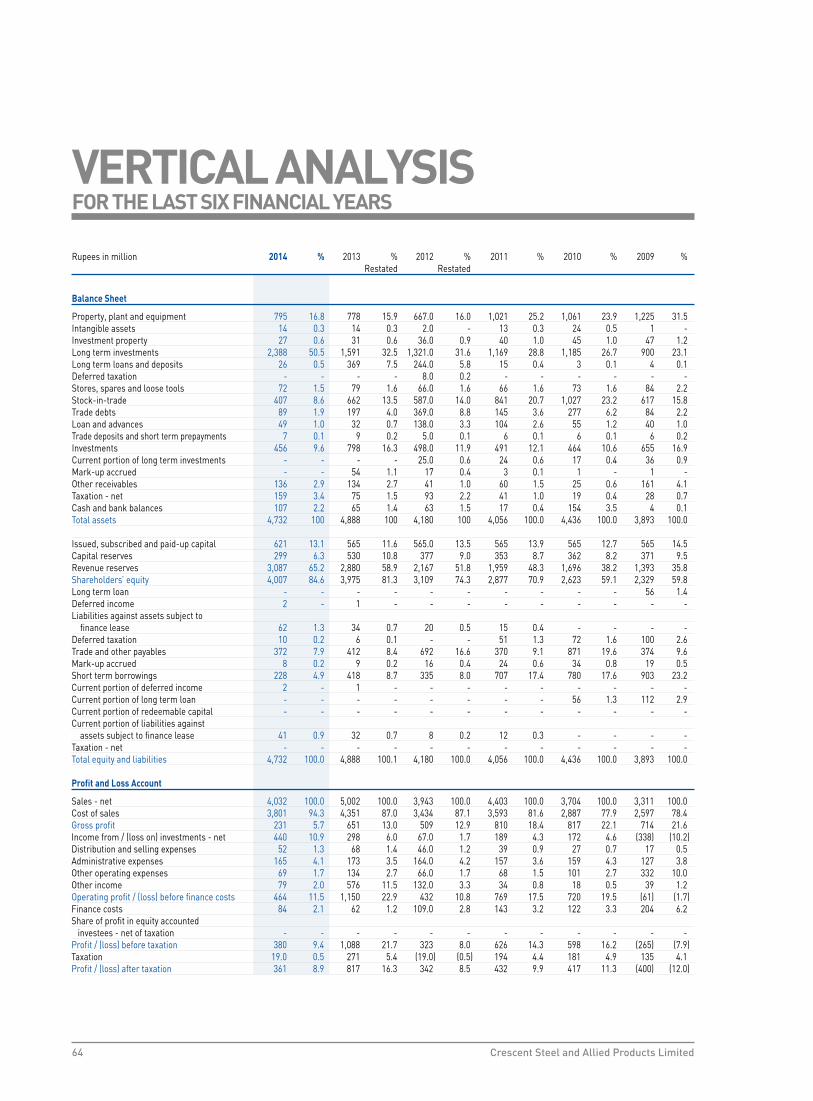
Rupees in million 2014 % 2013 % 2012 % 2011 % 2010 % 2009 % Restated Restated
Balance Sheet
Property, plant and equipment 795 16.8 778 15.9 667.0 16.0 1,021 25.2 1,061 23.9 1,225 31.5 Intangible assets 14 0.3 14 0.3 2.0 - 13 0.3 24 0.5 1 - Investment property 27 0.6 31 0.6 36.0 0.9 40 1.0 45 1.0 47 1.2 Long term investments 2,388 50.5 1,591 32.5 1,321.0 31.6 1,169 28.8 1,185 26.7 900 23.1 Long term loans and deposits 26 0.5 369 7.5 244.0 5.8 15 0.4 3 0.1 4 0.1 Deferred taxation - - - - 8.0 0.2 - - - - - - Stores, spares and loose tools 72 1.5 79 1.6 66.0 1.6 66 1.6 73 1.6 84 2.2 Stock-in-trade 407 8.6 662 13.5 587.0 14.0 841 20.7 1,027 23.2 617 15.8 Trade debts 89 1.9 197 4.0 369.0 8.8 145 3.6 277 6.2 84 2.2 Loan and advances 49 1.0 32 0.7 138.0 3.3 104 2.6 55 1.2 40 1.0 Trade deposits and short term prepayments 7 0.1 9 0.2 5.0 0.1 6 0.1 6 0.1 6 0.2 Investments 456 9.6 798 16.3 498.0 11.9 491 12.1 464 10.6 655 16.9 Current portion of long term investments - - - - 25.0 0.6 24 0.6 17 0.4 36 0.9 Mark-up accrued - - 54 1.1 17 0.4 3 0.1 1 - 1 - Other receivables 136 2.9 134 2.7 41 1.0 60 1.5 25 0.6 161 4.1 Taxation - net 159 3.4 75 1.5 93 2.2 41 1.0 19 0.4 28 0.7 Cash and bank balances 107 2.2 65 1.4 63 1.5 17 0.4 154 3.5 4 0.1 Total assets 4,732 100 4,888 100 4,180 100 4,056 100.0 4,436 100.0 3,893 100.0 Issued, subscribed and paid-up capital 621 13.1 565 11.6 565.0 13.5 565 13.9 565 12.7 565 14.5 Capital reserves 299 6.3 530 10.8 377 9.0 353 8.7 362 8.2 371 9.5 Revenue reserves 3,087 65.2 2,880 58.9 2,167 51.8 1,959 48.3 1,696 38.2 1,393 35.8 Shareholders’ equity 4,007 84.6 3,975 81.3 3,109 74.3 2,877 70.9 2,623 59.1 2,329 59.8 Long term loan - - - - - - - - - - 56 1.4 Deferred income 2 - 1 - - - - - - - - - Liabilities against assets subject to finance lease 62 1.3 34 0.7 20 0.5 15 0.4 - - - - Deferred taxation 10 0.2 6 0.1 - - 51 1.3 72 1.6 100 2.6 Trade and other payables 372 7.9 412 8.4 692 16.6 370 9.1 871 19.6 374 9.6 Mark-up accrued 8 0.2 9 0.2 16 0.4 24 0.6 34 0.8 19 0.5 Short term borrowings 228 4.9 418 8.7 335 8.0 707 17.4 780 17.6 903 23.2 Current portion of deferred income 2 - 1 - - - - - - - - - Current portion of long term loan - - - - - - - - 56 1.3 112 2.9 Current portion of redeemable capital - - - - - - - - - - - - Current portion of liabilities against assets subject to finance lease 41 0.9 32 0.7 8 0.2 12 0.3 - - - - Taxation - net - - - - - - - - - - - - Total equity and liabilities 4,732 100.0 4,888 100.1 4,180 100.0 4,056 100.0 4,436 100.0 3,893 100.0
Profit and Loss Account
Sales - net 4,032 100.0 5,002 100.0 3,943 100.0 4,403 100.0 3,704 100.0 3,311 100.0 Cost of sales 3,801 94.3 4,351 87.0 3,434 87.1 3,593 81.6 2,887 77.9 2,597 78.4 Gross profit 231 5.7 651 13.0 509 12.9 810 18.4 817 22.1 714 21.6 Income from / (loss on) investments - net 440 10.9 298 6.0 67.0 1.7 189 4.3 172 4.6 (338) (10.2)Distribution and selling expenses 52 1.3 68 1.4 46.0 1.2 39 0.9 27 0.7 17 0.5 Administrative expenses 165 4.1 173 3.5 164.0 4.2 157 3.6 159 4.3 127 3.8 Other operating expenses 69 1.7 134 2.7 66.0 1.7 68 1.5 101 2.7 332 10.0 Other income 79 2.0 576 11.5 132.0 3.3 34 0.8 18 0.5 39 1.2 Operating profit / (loss) before finance costs 464 11.5 1,150 22.9 432 10.8 769 17.5 720 19.5 (61) (1.7)Finance costs 84 2.1 62 1.2 109.0 2.8 143 3.2 122 3.3 204 6.2 Share of profit in equity accounted investees - net of taxation - - - - - - - - - - - - Profit / (loss) before taxation 380 9.4 1,088 21.7 323 8.0 626 14.3 598 16.2 (265) (7.9)Taxation 19.0 0.5 271 5.4 (19.0) (0.5) 194 4.4 181 4.9 135 4.1 Profit / (loss) after taxation 361 8.9 817 16.3 342 8.5 432 9.9 417 11.3 (400) (12.0)
VERTICAL ANALYSISFOR THE LAST SIX FINANCIAL YEARS
64 Crescent Steel and Allied Products Limited

Rupees in million 2014 % 2013 % 2012 % 2011 % 2010 % 2009 % Restated Restated
Balance Sheet
Property, plant and equipment 795 2.2 778 16.6 667 (34.7) 1,021 (3.8) 1,061 (13.4) 1,225 (0.6)Intangible assets 14 - 14 600.0 2 (84.6) 13 (45.8) 24 2,300.0 1 - Investment property 27 (12.9) 31 (13.9) 36 (10.0) 40 (11.1) 45 (4.3) 47 (6.0)Long term investments 2,388 50.1 1,591 20.4 1,321 13.0 1,169 (1.4) 1,185 31.7 900 (29.7)Long term loans and deposits 26 (93.0) 369 51.2 244 1,526.7 15 400.0 3 (25.0) 4 - Deferred taxation - - - (100.0) 8 100.0 - - - - - - Stores, spares and loose tools 72 (8.9) 79 19.7 66 - 66 (9.6) 73 (13.1) 84 9.1 Stock-in-trade 407 (38.5) 662 12.8 587 (30.2) 841 (18.1) 1,027 66.5 617 1.8 Trade debts 89 (54.8) 197 (46.6) 369 154.5 145 (47.7) 277 229.8 84 (29.4)Loan and advances 49 53.1 32 (76.8) 138 32.7 104 89.1 55 37.5 40 60.0 Trade deposits and short term prepayments 7 (22.2) 9 80.0 5 (16.7) 6 - 6 - 6 200.0 Investments 456 (42.9) 798 60.2 498 1.4 491 5.8 464 (29.2) 655 (53.5)Current portion of long term investments - - - (100.0) 25 4.2 24 41.2 17 (52.8) 36 100.0 Mark-up accrued - (100.0) 54 217.6 17 466.7 3 200.0 1 - 1 (50.0)Other receivables 136 1.5 134 226.8 41 (31.7) 60 140.0 25 (84.5) 161 403.1 Taxation - net 159 112.0 75 (19.4) 93 126.8 41 115.8 19 (32.1) 28 100.0 Cash and bank balances 107 64.6 65 3.2 63 270.6 17 (89.0) 154 3,750.0 4 (50.0)Total assets 4,732 (3.2) 4,888 16.9 4,180 3.1 4,056 (8.6) 4,436 13.9 3,893 (19.7) Issued, subscribed and paid-up capital 621 9.9 565 - 565 - 565 - 565 - 565 10.1 Capital reserves 299 (43.6) 530 40.6 377 6.8 353 (2.5) 362 (2.4) 371 - Revenue reserves 3,087 7.2 2,880 32.9 2,167 10.6 1,959 15.5 1,696 21.8 1,393 (34.0)Shareholders’ equity 4,007 0.8 3,975 27.9 3,109 8.1 2,877 9.7 2,623 12.6 2,329 (22.2)Long term loan - - - - - - - - - (100.0) 56 (66.7)Deferred income 2 100.0 1 100.0 - - - - - - - - Liabilities against assets subject to finance lease 62 82.4 34 70.0 20 33.3 15 100.0 - - - - Deferred taxation 10 66.7 6 100.0 - (100.0) 51 (29.2) 72 (28.0) 100 (10.7)Trade and other payables 372 (9.7) 412 (40.5) 692 87.0 370 (57.5) 871 132.9 374 55.2 Mark-up accrued 8 (11.1) 9 (43.8) 16 (33.3) 24 (29.4) 34 78.9 19 (5.0)Short term borrowings 228 (45.5) 418 24.8 335 (52.6) 707 (9.4) 780 (13.6) 903 (19.3)Current portion of deferred income 2 100.0 1 100.0 - - - - - - - - Current portion of long term loan - - - - - - - (100.0) 56 (50.0) 112 - Current portion of redeemable capital - - - - - - - - - - - (100.0)Current portion of liabilities against assets subject to finance lease 41 28.1 32 300.0 8 (33.3) 12 100.0 - - - - Taxation - net - - - - - - - - - - - (100.0)Total equity and liabilities 4,732 (3.2) 4,888 16.9 4,180 3.1 4,056 (8.6) 4,436 13.9 3,893 (19.7) Profit and Loss Account
Sales - net 4,032 (19.4) 5,002 26.9 3,943 (10.4) 4,403 18.9 3,704 11.9 3,311 (21.2)Cost of sales 3,801 (12.6) 4,351 26.7 3,434 (4.4) 3,593 24.5 2,887 11.2 2,597 (21.4)Gross profit 231 (64.5) 651 27.9 509 (37.2) 810 (0.9) 817 14.4 714 (20.3)Income from / (loss on) investments - net 440 47.7 298 344.8 67 (64.6) 189 9.9 172 150.9 (338) (556.8)Distribution and selling expenses 52 (23.5) 68 47.8 46 17.9 39 44.4 27 58.8 17 13.3 Administrative expenses 165 (4.6) 173 5.5 164 4.5 157 (1.3) 159 25.2 127 (6.6)Other operating expenses 69 (48.5) 134 103.0 66 (2.9) 68 (32.7) 101 (69.6) 332 201.8 Other income 79 (86.3) 576 336.4 132 288.2 34 88.9 18 (53.8) 39 95.0 Operating profit / (loss) before finance costs 464 (59.7) 1,150 166.2 432 (43.8) 769 6.8 720 1,280.3 (61) (108.4)Finance costs 84 35.5 62 (43.1) 109 (23.8) 143 17.2 122 (40.2) 204 33.3 Share of profit in equity accounted investees - net of taxation - - - - - - - - - - - (100.0)Profit / (loss) before taxation 380 (65.1) 1,088 236.8 323 (48.4) 626 4.7 598 325.7 (265) (142.3)Taxation 19 (93.0) 271 1,526.3 (19) (109.8) 194 7.2 181 34.1 135 (36.0)Profit / (loss) after taxation 361 (55.8) 817 138.9 342 (20.8) 432 3.6 417 204.3 (400) (196.2)
HORIZONTAL ANALYSISFOR THE LAST SIX FINANCIAL YEARS
65Annual Report 2014

COMMENTS ON SIX YEAR PROFIT AND LOSSThe Company has two core businesses i.e. Steel line pipe and Cotton spinning. Revenue and bottom line of steel segment is directly related to infrastructure and development projects of Gas industry. Execution of such projects is largely dependent on financial position of those industries and the prevailing circular debt crisis. Steel segment operating performance mainly affected due to international competition, supply issues and non-availability of raw material at reasonable prices.
Cotton spinning industry is sensitive to fluctuation in international cotton and yarn prices and its demand and supply. The industry faces challenges in achieving targets due to increased price of raw cotton, frequent power shut downs and hike in electricity and gas tariff.
SALES During last six years sales have created a business cycle. However, last year sales revenue was record high due to increase in sales of bare pipes while in 2012, sales were low as compared to that of previous years due to loss of cotton plant in that year. This year sales revenue was Rs. 4,032 million which is lower as compared to Rs. 5,002 million in 2013. This was primarily due to lack of orders in steel division, and decrease in sales volume of cotton.
GROSS PROFITGross profit margin dipped to 5.7% from 13% in 2013. A decreasing trend was observed in prior years but this year GP has dived by 7.3%.
Steel margins have reduced over the years due to international competition and unabsorbed fixed cost because of underutilization of capacity during substantial part of the year.
Cotton division cost of sales surpassed the revenues for the year mainly due to rising costs of cotton, frequent power breakages and increase in electricity and gas tariffs.
DISTRIBUTION AND SELLING, ADMINISTRATIVE AND OTHER OPERATING EXPENSESIn order to expand business, the Company focused on exploring revenue opportunities outside Pakistan for yarn and raw cotton from 2010. Due to this increased agency commission and export related expenses impact on distribution and selling expenses every year by an increasing trend till last year, but Company this year has controlled this expenditure and reduced the distribution and selling expenses from Rs. 68 million in 2013 to Rs. 52 million in 2014. Moreover, administrative expenses have also come down from Rs. 173 million last year to Rs. 165 million in current year due to cost control measure taken by the Company.
FINANCE COST/ CASH FLOWSFinance cost has increased by 35% in 2014 to Rs. 84 million. This increase in finance cost is due to short term trade-financing, lease financing for capital expenditures and an increase in discount rate. However, in the past decreasing trend was observed from 2009 (Rs. 204 million) to 2013 (Rs. 62 million) that was mainly due to consistent profitability, improved cash flows and reduction in policy rates.
PROFIT AFTER TAXATIONProfit after taxation has been relatively consistent from 2008 – 12, in 2013 it jumped with an increase of over 135% to Rs. 817 million mainly due to insurance claim settlement and reversal of impairment amounting to Rs. 147 million. Increased cost of sales, loss incurred by cotton division has mainly resulted in lower profit after tax in 2014 as compare to 2013. Further in year 2009, the Company incurred loss after tax of Rs. 400 million mainly due to realized and unrealized losses and impairment in investments after the crash of equity markets.
66 Crescent Steel and Allied Products Limited

COMMENTS ON SIX YEAR BALANCE SHEETEQUITYEquity has grown from Rs. 2.3 billion in 2009 to Rs. 4 billion in 2014. This increase in equity is attributable to consistent performance of the Company over the last six year.
SHORT TERM BORROWINGSShort term borrowings has decreased from Rs. 903 million in 2009 to Rs. 228 million in 2014. The decrease in short term borrowings is due to consistent increase in profitability and improved working capital position.
PROPERTY, PLANT AND EQUIPMENTReduction in net book value of property plant and equipment over the years is due to disposal and depreciation, whereas, a major decline in 2012 was due to fire incident in Unit-2 of cotton division resulting in its shut down. In 2013 and 2014 an increase is observed which is due to acquisition of plant and machineries for BMR.
LONG TERM INVESTMENTSLong term investments has consistently increased over the years from Rs. 900 million in 2009 to Rs. 2,388 million in 2014. This increase mainly represents diversification of businesses through capital injection in subsidiaries.
FINANCIAL CALENDARTHE COMPANY FOLLOWS THE PERIOD OF JULY 01 TO JUNE 30 AS THE FINANCIAL YEAR.
Financial Results will be announced as per the following tentative schedule:
Annual General Meeting 23rd October 20141st Quarter ending 30 September 2014 Last week of October, 20142nd Quarter ending 30 December 2014 Last week of January, 20153rd Quarter ending 30 March 2015 Last week of April, 2015Year ending 30 June 2015 Last week of July, 2015
67Annual Report 2014

SUMMARIZED FINANCIAL DATA 2014 2013 2012 2011 2010 2009 2008 Restated Restated A - Summary of Profit and Loss Account (Rupees in millions) Sales - net 4,031.6 5,001.7 3,942.9 4,402.7 3,704.4 3,310.9 4,200.2 Cost of sales 3,801.3 4,350.8 3,434.1 3,592.5 2,887.3 2,597.2 3,303.8 Gross profit 230.3 650.9 508.8 810.2 817.1 713.7 896.4 Income from / (loss on) investments - net 440.1 298.4 67.2 188.6 171.6 (337.9) 73.6 Distribution, selling and administrative expenses 217.2 241.1 210.0 196.1 186.2 143.8 151.0 Other operating expenses 68.7 134.0 65.8 68.1 101.4 331.5 109.7 Other income 78.6 575.7 132.2 34.4 18.3 39.0 19.6 Operating profit / (loss) before finance costs 463.1 1,149.9 432 769.0 719.4 (60.5) 728.9 Finance costs 84.1 62.9 109.5 143.2 121.9 203.6 153.0 “Share of profit in equity accounted investees - net of taxation” - - - - - - 50.8 Profit / (loss) before taxation 379.0 1,087.0 322.9 625.8 597.5 (264.1) 626.7 Taxation 18.8 271.0 (18.9) 194.1 181.0 134.7 210.9 Net income / (loss) 360.2 816.0 341.8 431.7 416.5 (398.8) 415.8 B - Summary of Balance Sheet (Rupees in millions) Current assets 1,482.4 2,106.1 1,902.0 1,796.7 2,116.8 1,716.2 2,279.1 Stock-in-trade 407.2 662.4 586.7 840.6 1,026.6 616.4 606.1 Trade debts 89.5 196.9 368.9 145.1 276.9 83.9 118.7 Current liabilities 651.8 872.6 1,050.8 1,112.8 1,742.1 1,408.2 1,573.1 Trade and other payables 372.4 412.3 691.5 370.1 871.5 373.9 240.8 Property, plant and equipment 795.1 777.8 666.8 1,020.8 1,061.4 1,224.6 1,233.2 Total assets 4,733.0 4,888.7 4,179.7 4,054.9 4,436.3 3,892.7 4,846.7 Long term financing (excluding current maturity) 62.0 34.5 19.8 15.4 - 55.9 168.1 Deferred income (including current maturity) 4.1 2.2 - - - - - Deferred liabilities 9.7 6.2 - 50.4 71.6 99.8 111.5 Short term financing (including current maturity of long-term financing) 269.4 450.5 343.0 719.0 836.4 1,015.3 1,306.4 Reserves 3,386.1 3,409.5 2,544.5 2,311.7 2,058.0 1,764.2 2,480.7 Shareholders’ equity 4,007.2 3,974.1 3,109.1 2,876.3 2,622.6 2,328.8 2,994.0 C - Summary of Cash Flow Statement (Rupees in millions) Cash and cash equivalents at the beginning of the year (220.7) (253.1) (553.7) (499.2) (644.7) (828.9) 26.3 Net cash (used in) /generated from operating activities 568.0 (81.4) 288.7 111.6 451.3 335.9 565.9 Net cash inflows / (outflows) from investing activities (135.3) 192.3 284.5 15.5 3.3 70.4 (893.3) Net cash (outflows) / inflows from financing activities (333.1) (78.5) (272.6) (181.6) (309.1) (222.1) (527.8) Net increase / (decrease) in cash and cash equivalents 99.6 32.4 300.6 (54.5) 145.5 184.2 (855.2) Cash and cash equivalents at the end of the year (121.1) (220.7) (253.1) (553.7) (499.2) (644.7) (828.9) D - Other Data (Rupees in millions) Depreciation and amortization 99.8 95.1 141.9 173.1 184.5 180.6 175.0 Capital expenditure 131.8 220.5 68.2 113.9 34.5 169.1 153.5 No. of ordinary shares (no. of shares in millions) 62.1 56.5 56.5 56.5 56.5 56.5 51.3 Payments to National Exchequer 358.0 730.2 290.3 360.3 499.2 520.4 712.3 * Note: The figures presented in this analysis for the financial years ended 30 June 2014, 2013, 2012, 2011, 2010 and 2009 are those based on the Company’s separate financial statements (please refer to note 2.1 to the financial statements for further information). The figures presented for the financial years prior to 2009 are based on the Company’s individual financial statements as published in the annual reports in those respective years.
KEY OPERATING AND FINANCIAL DATAFOR THE CURRENT AND PAST SIX FINANCIAL YEAR(S)
68 Crescent Steel and Allied Products Limited

Rs. 4,032Rs. 360
8.9%
8%
85%
9.0%
0.85 Times
Rs. 4,007
Rs. 4,733
Rs. 3,671
Rs. 1,482
Rs. 3,251
Rs. 652
Rs. 74
SALESNET PROFIT
Rs. 4,032
SALES
Rs. 4,733
TOTAL ASSETS
OWNERS'EQUITY
TOTALASSETS
ASSETSTURNOVER
RETURN ONASSETS
RETURN ONEQUITY
OWNERSHIPRATIO
Rs. 726
TOTAL COST
CURRENTASSETS
NON-CURRENTASSETS
NET PROFIT MARGIN
CURRENTLIABILITIESTOTAL
LIABILITIES
Rs. 4,007
OWNERS'EQUITY
NON-CURRENTLIABILITIES
DuPont Analysis 2014 2013Tax burden 5.0% 24.9%Interest burden 22.2% 5.8%EBIT margin - Restated 11.5% 23.0%Asset Turnover (times) - Reststed 0.9 1.0Leverage - Restated 7.1% 9.9%
Return on equity 9.0% 20.5%
Earnings Before Interest, Taxation, Depreciation and Amortization (EBITDA)
(700)
(600)
(500)
(400)
(300)
(200)
(100)
-
100
200
300
400
500
600
700
2008 2009 2010 2011 2012 2013 2014
Steel segment Cotton segment IID segment
Rup
ees
in M
illio
n
Management of Working Capital
-
20
40
60
80
100
120
-
2
4
6
8
10
12
2008 2009 2010 2011 2012 2013 2014
Average collection period (days) Inventory turnover (days)
Average payment days (days)Working Capital turnover (times)
Operating cycle (days)
Day
s
Tim
es
Movement in Stock Prices
-
20
40
60
80
100
120
2008 2009 2010 2011 2012 2013 2014
Increase in Price Decrease in Price
Rup
ees
Profit/(loss) before and after taxation
(400)
(200)
-
200
400
600
800
1,000
1,200
2008 2009 2010 2011 2012 2013 2014
Profit/(loss) before taxation Profit/(loss) after taxation
Rup
ees
in M
illio
n
Profitability and Return
(15)
(10)
(5)
-
5
10
15
20
25
30
2008 2009 2010 2011 2012 2013 2014
Gross profit margin to sales (%) Operating profit/(loss) margin to sales (%)
Net income/(loss) margin to sales (%)Return on average equity (%) Return on average assets (%)
Return on average capital employed (%)
Per
cent
age
Shareholders' equity and Break-up value per share
0
1,000
2,000
3,000
4,000
5,000
2008 2009 2010 2011 2012 2013 2014
Rup
ees
in M
illio
n
-
10
20
30
40
50
60
70
80
Rup
ees
Shareholders' equity (Rs. in millions) Break-up value per share (Rs.)
DuPont Analysis for the year 2014
69Annual Report 2014

QUARTERLY ANALYSISSALESThe first, second and fourth quarter remained relatively consistent in sales while third quarter contributed highest of all i.e. 32% to annual revenue. The increase in revenue from third quarter was due to increased sales of bare pipes as sizeable orders for bare pipes were obtained as compare to first and second quarter where sales of bare pipes remained low. Coating of pipes were lower in second quarter while relatively consistent in other quarters due to low activities in coating industry. Revenue from cotton division remained consistent throughout the year.
INCOME FROM INVESTMENTS Income from investment for the first quarter was highest of all that posted Rs. 180 million mainly due to gain on derecognition of available for sale investment. Second quarter was relatively dull with major contribution from unrealized gain on held for trading investment of Rs. 80 million and dividend income amounted to Rs. 12.6 million. Third quarter made development as compare to second quarter with dividend income being main contributor with Rs. 66.7 million while unrealized gain for held for trading investment stood at Rs.45 million. Fourth quarter investment income stood at Rs. 45 million out of which dividend income was Rs. 3 million, gain on sale of investment amounted to Rs. 65 million which was set off by loss on held for trading investment amounting to Rs. 29 million.
PROFIT AFTER TAXATIONProfit after taxation for the first quarter was recorded at Rs. 119 million mainly due to income from investments. However, profit after tax for second quarter decreased more than half of first quarter due to increased cost of sales. Third quarter recorded the highest profit after tax due to positive gross profit of Rs. 154 million as sales revenue from steel division increased and income from investment amounted to Rs. 125 million. Fourth quarter contributed the lowest profit after tax to the bottom line amounting to Rs. 30 million mainly due to diminution in the value of investment amounted to Rs. 51 million.
Quarterly Trend Analysis
0
300,00
600,00
900,00
1,200,000
1,500,000
Qtr 01 Qtr 02 Qtr 03 Qtr 04
Sales Income from investments
Profit after taxation for the period
70 Crescent Steel and Allied Products Limited

STATEMENT OF COMPLIANCE WITH THE CODE OF CORPORATE GOVERNANCETHIS STATEMENT IS BEING PRESENTED TO COMPLY WITH THE CODE OF CORPORATE GOVERNANCE (CCG) AS CONTAINED IN THE LISTING REGULATIONS OF THE STOCK EXCHANGES OF PAKISTAN FOR THE PURPOSE OF ESTABLISHING A FRAMEWORK OF GOOD GOVERNANCE, WHEREBY A LISTED COMPANY IS MANAGED IN COMPLIANCE WITH THE BEST PRACTICES OF CORPORATE GOVERNANCE.The company has applied the principles contained in the CCG in the following manner:
1. The company encourages representation of independent non-executive directors and directors representing minority interests on its board of directors. At present the board includes:
Independent Directors
Mr. Ahmad Waqar Mr. Syed Zahid Hussain
Executive Director
Mr. Ahsan M. Saleem
Non-Executive Directors
Mr. Khurram Mazhar Karim Mr. Nasir Shafi Mr. S.M. Ehtishamullah Mr. Zahid Bashir
The independent directors meet the criteria of independence under clause i(b) of the CCG.
2. The Directors have confirmed that none of them is serving as a Director in more than seven listed companies, including this company.
3. All the resident Directors of the company are registered as taxpayers and none of them has defaulted in payment of any loan to a banking company, a DFI or an NBFI or being a member of a Stock Exchange has been declared as a defaulter by that stock exchange.
4. A casual vacancy occurred on the board on 12 September 2013 and was filled up by the directors within 90 days.
5. The company has prepared a ‘Code of Conduct’, and has ensured that appropriate steps have been taken to disseminate it throughout the company along with its supporting policies and procedures.
6. The Board has developed a vision, mission and values statement, and significant policies of the Company. A complete record of particulars of significant policies along with the dates on which they were approved or amended has been maintained. The corporate strategy of the Company is reviewed and approved by the Board along with the annual plan.
7. All the powers of the Board have been duly exercised and decisions on material transactions, including appointment and determination of remuneration and terms and conditions of employment of the Chief Executive Officer, other executive and non-executive directors, have been taken by the board/shareholders.
8. All the meetings of the Board were presided over by the Chairman and, in his absence, by a Director elected by the Board for this purpose. The Board met once in every quarter during the year ended 30 June 2014 to approve the financial statements of the Company. Written notices of the Board meetings, along with agenda and working papers, were circulated at least seven days prior to the meetings. The minutes of the meetings were appropriately recorded and circulated in time.
71Annual Report 2014

9. The directors were apprised about the changes in the CCG, applicable laws and their duties and responsibilities to effectively manage the affairs of the company for and on behalf of the shareholders.
10. The directors of the Company having 15 years of experience on the board of a listed company are exempted from the requirement of directors’ training program. All the board members except one director qualify for exemption under this provision of the CCG. One director has been exempted by SECP from this provision due to his other experience.
11. The Board has approved appointment of Company Secretary / CFO and the Head of Internal Audit, including their remuneration and terms and conditions of employment, as recommended by the HR and Remuneration Committee.
12. The Directors’ Report for this year has been prepared in compliance with the requirements of the CCG and it fully describes the salient matters required to be disclosed.
13. The financial statements of the company were duly endorsed by the CEO and CFO before approval by the Board.
14. The directors, CEO and executives do not hold any interest in the shares of the Company, other than that disclosed in the pattern of shareholding.
15. The Company has complied with all the corporate and financial reporting requirements of the CCG.
16. The Board has formed an Audit Committee. It comprises of three (3) members, of whom two (2) are non-executive Directors and one independent director. The Chairman of the Committee is an independent director.
17. The meetings of the Audit Committee were held at least once every quarter prior to approval of interim and final results of the Company and as required by the CCG. The terms of reference of the Committee have been framed and advised to the Committee for compliance.
18. The board has formed an HR and Remuneration Committee. It comprises of three (3) members, of whom two (2) are non-executive directors and one independent director. The Chairman of the committee is an independent director.
19. The Board has set-up an effective internal audit function. This function has been outsourced to BDO Ebrahim & Co., Chartered Accountants, who are considered suitably qualified and experienced for the purpose and are conversant with the policies and procedures of the Company, and they (or their representatives) are involved in the internal audit function on a full time basis. The Company has also designated a full time employee as Head of Internal Audit.
20. The statutory auditors of the Company have confirmed that they have been given a satisfactory rating under the quality control review programme of the Institute of Chartered Accountants of Pakistan, that they or any of the partners of the firm, their spouses and minor children do not hold shares of the Company and that the firm and all its partners are in compliance with International Federation of Accountants (IFAC) guidelines on code of ethics as adopted by the Institute of Chartered Accountants of Pakistan.
21. The statutory auditors or the persons associated with them have not been appointed to provide other services except in accordance with the Listing Regulations and the auditors have confirmed that they have observed IFAC guidelines in this regard.
22. The ‘closed period’, prior to the announcement of interim/final results, and business decisions, which may materially affect the market price of company’s securities, was determined and intimated to directors, employees and stock exchange(s).
23. Material/price sensitive information has been disseminated among all market participants at once through stock exchange(s).
24. We confirm that all other material principles enshrined in the CCG have been complied with.
By order of the Board
Ahsan M. SaleemChief Executive Officer21 August 2014
72 Crescent Steel and Allied Products Limited

Crescent Steel and Allied Products Limited
Unconsolidated Financial StatementsFor the year ended 30 June 2014
Financial Statements of this Annual Report are printed on 100% recycled paper.

74 Crescent Steel and Allied Products Limited
We have reviewed the enclosed Statement of Compliance with the best practices contained in the Code of Corporate Governance (“the Code”) prepared by the Board of Directors of Crescent Steel and Allied Products Limited (“the Company”) for the year ended 30 June 2014 to comply with the requirements of Listing Regulations of Karachi Stock Exchange where the Company is listed.
The responsibility for compliance with the Code is that of the Board of Directors of the Company. Our responsibility is to review, to the extent where such compliance can be objectively verified, whether the Statement of Compliance reflects the status of the Company’s compliance with the provisions of the Code and report if it does not and to highlight any non-compliance with the requirements of the Code. A review is limited primarily to inquiries of the Company’s personnel and review of various documents prepared by the Company to comply with the Code.
As part of our audit of the financial statements we are required to obtain an understanding of the accounting and internal control systems sufficient to plan the audit and develop an effective audit approach. We are not required to consider whether the Board of Directors’ statement on internal control covers all risks and controls or to form an opinion on the effectiveness of such internal controls, the Company’s corporate governance procedures and risks.
The Code requires the Company to place before the Audit Committee, and upon recommendation of the Audit Committee, place before the Board of Directors for their review and approval its related party transactions distinguishing between transactions carried out on terms equivalent to those that prevail in arm’s length transactions and transactions which are not executed at arm’s length price and recording proper justification for using such alternate pricing mechanism. We are only required and have ensured compliance of this requirement to the extent of the approval of the related party transactions by the Board of Directors upon recommendation of the Audit Committee. We have not carried out any procedures to determine whether the related party transactions were under taken at arm’s length price or not.
Based on our review, nothing has come to our attention which causes us to believe that the Statement of Compliance does not appropriately reflect the Company’s compliance, in all material respects, with the best practices contained in the Code as applicable to the Company for the year ended 30 June 2014.
Date: 21 August 2014 KPMG Taseer Hadi & Co.Karachi Chartered Accountants Muhammad Nadeem
REVIEW REPORT TO THE MEMBERS on Statement of Compliance with Best Practices of Code of Corporate Governance

75Unconsolidated Financial Statements 2014
We have audited the annexed unconsolidated balance sheet of Crescent Steel and Allied Products Limited (“the Company”) as at 30 June 2014 and the related unconsolidated profit and loss account, unconsolidated statement of comprehensive income, unconsolidated cash flow statement and unconsolidated statement of changes in equity together with the notes forming part thereof, for the year then ended and we state that we have obtained all the information and explanations which, to the best of our knowledge and belief, were necessary for the purposes of our audit.
It is the responsibility of the Company’s management to establish and maintain a system of internal control, and prepare and present the above said statements in conformity with the approved accounting standards and the requirements of the Companies Ordinance, 1984. Our responsibility is to express an opinion on these statements based on our audit.
We conducted our audit in accordance with the auditing standards as applicable in Pakistan. These standards require that we plan and perform the audit to obtain reasonable assurance about whether the above said statements are free of any material misstatement. An audit includes examining, on a test basis, evidence supporting the amounts and disclosures in the above said statements. An audit also includes assessing the accounting policies and significant estimates made by management, as well as, evaluating the overall presentation of the above said statements. We believe that our audit provides a reasonable basis for our opinion and, after due verification, we report that:
a) in our opinion, proper books of account have been kept by the Company as required by the Companies Ordinance, 1984;
b) in our opinion:
i) the unconsolidated balance sheet and unconsolidated profit and loss account together with the notes thereon have been drawn up in conformity with the Companies Ordinance, 1984, and are in agreement with the books of account and are further in accordance with accounting policies consistently applied except for the change in accounting policy as disclosed in note 4.1.1 to the accompanying financial statements, with which we concur;
ii) the expenditure incurred during the year was for the purpose of the Company’s business; and
iii) the business conducted, investments made and the expenditure incurred during the year were in accordance with the objects of the Company;
c) in our opinion and to the best of our information and according to the explanations given to us, the unconsolidated balance sheet, unconsolidated profit and loss account, unconsolidated statement of comprehensive income, unconsolidated cash flow statement and unconsolidated statement of changes in equity together with the notes forming part thereof conform with approved accounting standards as applicable in Pakistan and give the information required by the Companies Ordinance, 1984, in the manner so required and respectively give a true and fair view of the state of the Company’s affairs as at 30 June 2014 and of the profits, its cash flows and changes in equity for the year then ended; and
d) in our opinion, Zakat deductible at source under the Zakat and Ushr Ordinance, 1980, was deducted by the Company and deposited in the Central Zakat Fund established under section 7 of that Ordinance.
Date: 21 August 2014 KPMG Taseer Hadi & Co.Karachi Chartered Accountants Muhammad Nadeem
AUDITORS’ REPORT TO THE MEMBERS
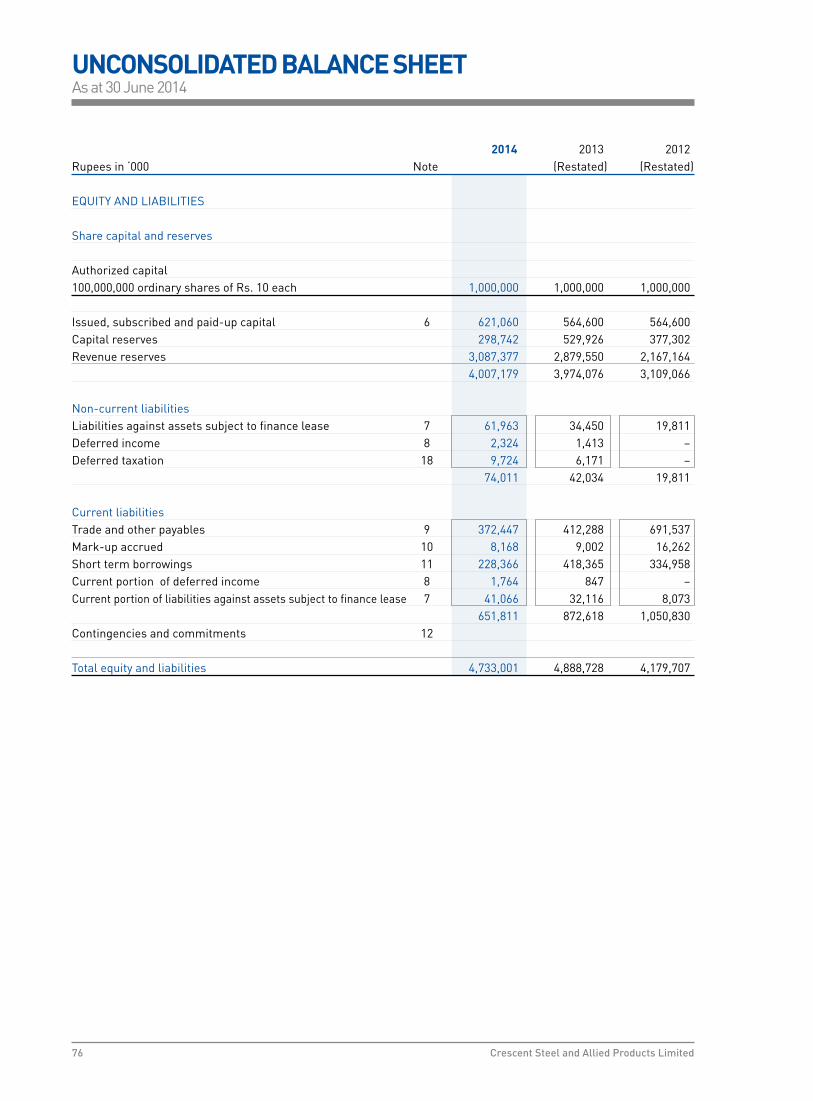
76 Crescent Steel and Allied Products Limited
2014 2013 2012Rupees in ‘000 Note (Restated) (Restated)
EQUITY AND LIABILITIES Share capital and reserves Authorized capital 100,000,000 ordinary shares of Rs. 10 each 1,000,000 1,000,000 1,000,000 Issued, subscribed and paid-up capital 6 621,060 564,600 564,600 Capital reserves 298,742 529,926 377,302 Revenue reserves 3,087,377 2,879,550 2,167,164 4,007,179 3,974,076 3,109,066 Non-current liabilities Liabilities against assets subject to finance lease 7 61,963 34,450 19,811 Deferred income 8 2,324 1,413 – Deferred taxation 18 9,724 6,171 – 74,011 42,034 19,811 Current liabilities Trade and other payables 9 372,447 412,288 691,537 Mark-up accrued 10 8,168 9,002 16,262 Short term borrowings 11 228,366 418,365 334,958 Current portion of deferred income 8 1,764 847 – Current portion of liabilities against assets subject to finance lease 7 41,066 32,116 8,073 651,811 872,618 1,050,830 Contingencies and commitments 12 Total equity and liabilities 4,733,001 4,888,728 4,179,707
UNCONSOLIDATED BALANCE SHEETAs at 30 June 2014

77Unconsolidated Financial Statements 2014
2014 2013 2012Rupees in ‘000 Note (Restated) (Restated)
ASSETS Non-current assets Property, plant and equipment 13 795,085 777,834 666,793 Intangible assets 14 14,031 13,645 1,617 Investment property 15 27,135 31,268 35,632 Long term investments 16 2,388,183 1,590,521 1,321,397 Long term loans and deposits 17 26,169 369,388 243,867 Deferred taxation 18 – – 8,394 3,250,603 2,782,656 2,277,700
Current assets Stores, spares and loose tools 19 71,956 78,639 65,860 Stock-in-trade 20 407,199 662,419 586,720 Trade debts 21 89,479 196,857 368,930 Advances 22 48,581 31,654 137,895 Trade deposits and short term prepayments 23 7,074 9,147 5,471 Investments 24 455,963 798,095 522,734 Mark-up accrued 25 – 54,337 16,989 Other receivables 26 136,081 134,274 40,984 Taxation - net 27 158,819 75,430 93,090 Cash and bank balances 28 107,246 65,220 63,334 1,482,398 2,106,072 1,902,007
Total assets 4,733,001 4,888,728 4,179,707 The annexed notes from 1 to 49 form an integral part of these unconsolidated financial statements.
Chief Executive Director Chief Financial Officer

78 Crescent Steel and Allied Products Limited
2014 2013 Rupees in ‘000 Note (Restated)
Sales - net 29 4,031,570 5,001,667 Cost of sales 30 3,801,268 4,350,808 Gross profit 230,302 650,859 Income from investments 31 440,132 298,399 670,434 949,258 Distribution and selling expenses 32 52,072 68,065 Administrative expenses 33 165,111 173,059 Other operating expenses 34 68,746 134,023 285,929 375,147 384,505 574,111
Other income 35 78,648 575,700 Operating profit before finance costs 463,153 1,149,811 Finance costs 36 84,146 62,903 Profit before taxation 379,007 1,086,908 Taxation 37 18,819 270,978 Profit after taxation 360,188 815,930
(Rupees) Basic and diluted earnings per share 38 5.80 13.14 The annexed notes from 1 to 49 form an integral part of these unconsolidated financial statements.
Chief Executive Director Chief Financial Officer
UNCONSOLIDATED PROFIT AND LOSS ACCOUNTFor the year ended 30 June 2014

79Unconsolidated Financial Statements 2014
2014 2013 Rupees in ‘000 Note (Restated)
Profit after taxation for the year 360,188 815,930 Other comprehensive income Items that may be reclassified subsequently to profit and loss Unrealized appreciation during the year on remeasurement of investments classified as ‘available for sale’ 36,669 153,595
(Loss) / gain on remeasurement of staff retirement benefit plans - net of tax (5,565) 65,836
Reclassification adjustments relating to gain realized on disposal of investments classified as ‘available for sale’ (211,393) (971)
Other comprehensive income for the year (180,289) 218,460 Total comprehensive income for the year 179,899 1,034,390 The annexed notes from 1 to 49 form an integral part of these unconsolidated financial statements.
Chief Executive Director Chief Financial Officer
UNCONSOLIDATED STATEMENT OF COMPREHENSIVE INCOMEFor the year ended 30 June 2014

80 Crescent Steel and Allied Products Limited
2014 2013 Rupees in ‘000 Note (Restated)
Cash flows from operating activities Cash generated from operations 39 497,947 411,440 Taxes paid (117,399) (278,057)Finance costs paid (83,593) (67,941)Contribution to gratuity and pension funds (12,252) (12,232)Contribution to Workers’ Profit Participation Fund (49,610) – Infrastructure fee and liquidated damages paid (10,554) (5,890)Compensated absences paid (157) (547)Deferred income on sale and lease back 2,752 2,260 10-C bonus paid (2,360) (4,909)Long term loans and deposits - net 343,219 (125,526)Net cash generated from / (used in) operating activities 567,993 (81,402) Cash flows from investing activities Capital expenditure (131,759) (220,529)Acquisition of intangible assets (5,674) (14,457)Proceeds from disposal of operating fixed assets 34,355 25,368 Proceeds from disposal of operating fixed assets under sale and leaseback arrangement 69,898 62,150 Proceeds from assets subject to insurance claim – 281,531 Investments - net (292,319) 2,702 Dividend income received 103,170 54,809 Interest income received 86,984 749 Net cash (used in) / flows from investing activities (135,345) 192,323 Cash flows from financing activities Payments against finance lease obligations (42,807) (25,005)(Repayments against short term loans) / proceeds from short term loans obtained - net (132,475) 113,927 Dividends paid (157,816) (167,437)Net cash used in financing activities (333,098) (78,515)Net increase in cash and cash equivalents 99,550 32,406 Cash and cash equivalents at beginning of the year (220,670) (253,076)Cash and cash equivalents at end of the year 40 (121,120) (220,670) The annexed notes from 1 to 49 form an integral part of these unconsolidated financial statements.
UNCONSOLIDATED CASH FLOW STATEMENTFor the year ended 30 June 2014
Chief Executive Director Chief Financial Officer

81Unconsolidated Financial Statements 2014
Rupees in ‘000 Issued, Capital reserves Revenue reserves Total subscribed Share Unrealized General Unappropriated and paid-up premium appreciation / reserve profit capital (diminution) on remeasurement of investments classified as ‘available for sale’
Balance as at 1 July 2012 - as previously reported 564,600 349,959 27,343 1,842,000 317,343 3,101,245 Change in accounting policy for reversal of defined benefit liability recognition of actuarial gains and losses (refer note 4.1.1) – – – – 7,821 7,821 Balance as at 1 July 2012 - as restated 564,600 349,959 27,343 1,842,000 325,164 3,109,066
Total comprehensive income for the year ended 30 June 2013 Profit after taxation – – – – 815,930 815,930 Other comprehensive income Total Other comprehensive income for the year - restated – – 152,624 – 65,836 218,460 Total comprehensive income for the period – – 152,624 – 881,766 1,034,390
Transactions with owners Dividend: - Final @ 10% (i.e. Re. 1 per share) for the year ended 30 June 2012 – – – – (56,460) (56,460)- First interim @ 10% (i.e. Re. 1 per share) for the year ended 30 June 2013 – – – – (56,460) (56,460)- Second interim @ 10% (i.e. Re. 1 per share) for the year ended 30 June 2013 – – – – (56,460) (56,460) – – – – (169,380) (169,380)Balance as at 30 June 2013 - as restated 564,600 349,959 179,967 1,842,000 1,037,550 3,974,076
Balance as at 1 July 2013 as previously reported 564,600 349,959 179,967 1,842,000 963,703 3,900,229
Effect of change in accounting policy (refer note 4.1.1) – – – – 73,847 73,847 Balance as at 1 July 2013 - restated 564,600 349,959 179,967 1,842,000 1,037,550 3,974,076 Transfer to general reserve – – – 800,000 (800,000) –
Total comprehensive income for the year ended 30 June 2014 Profit after taxation – – – – 360,188 360,188 Other comprehensive income Total Other comprehensive income for the year – – (174,724) – (5,565) (180,289)Total comprehensive income for the year – – (174,724) – 354,623 179,899
Transactions with owners Dividend: - Final @ 15% (i.e. Rs. 1.5 per share) for the year ended 30 June 2013 – – – – (84,690) (84,690)- First interim @ 10% (i.e. Re. 1 per share) for the year ended 30 June 2014 – – – – (62,106) (62,106) – – – – (146,796) (146,796)Issuance of Bonus shares final 2013 (10%) 56,460 (56,460) – – – – Balance as at 30 June 2014 621,060 293,499 5,243 2,642,000 445,377 4,007,179 The annexed notes from 1 to 49 form an integral part of these unconsolidated financial statements.
UNCONSOLIDATED STATEMENT OF CHANGES IN EQUITYFor the year ended 30 June 2014
Chief Executive Director Chief Financial Officer

82 Crescent Steel and Allied Products Limited
1. THE COMPANY AND ITS OPERATIONS
1.1 Crescent Steel and Allied Products Limited (“the Company”) was incorporated on 1 August 1983 as a public limited company in Pakistan under the Companies Act, 1913 (now Companies Ordinance, 1984) and is quoted on all stock exchanges of Pakistan. The registered office of the Company is located at 10th floor, BOP Tower, 10-B, Block E-2, Main Boulevard, Gulberg-III, Lahore. Whereas its principal office is situated at 9th floor Sidco Avenue Centre 264 R.A. Lines, Karachi.
1.2 The Company’s steel segment is one of the down stream industries of Pakistan Steel Mills, manufacturing
large diameter spiral arc welded steel line pipes at Nooriabad (District Dadu). The Company has a coating facility capable of applying three layer high density polyethylene coating on steel line pipes. The coating plant commenced commercial production from 16 November 1992.
1.3 The Company acquired a running spinning unit of 14,400 spindles (now 19,680 spindles) at Jaranwala (District
Faisalabad) on 30 June 2000 from Crescent Jute Products Limited. The cotton spinning activity is carried out by the Company under the name and title of “Crescent Cotton Products a division of Crescent Steel and Allied Products Limited”.
1.4 The Company deals in equity shares and has investment in subsidiaries and associates, the details of which are
stated in notes 16.1 and 16.2. 2. BASIS OF PREPARATION
2.1 Separate financial statements
These unconsolidated financial statements (therein after referred to as the financial statements) are the separate financial statements of the Company in which investments in subsidiaries and associates are accounted for on the basis of direct equity interest rather than on the basis of reported results and net assets of the investees. Consolidated financial statements of the Company are prepared separately.
2.2 Statement of compliance
These financial statements have been prepared in accordance with the approved accounting standards as applicable in Pakistan. Approved accounting standards comprise of such International Financial Reporting Standards (IFRS) issued by the International Accounting Standards Board as are notified under the Companies Ordinance, 1984, provisions of and directives issued under the Companies Ordinance, 1984. In case requirements differ, the provisions of and directives of the Companies Ordinance, 1984 shall prevail.
2.3 Basis of measurement
These financial statements have been prepared under the historical cost convention except for investments classified as held for trading and available for sale which are stated at fair value and obligations in respect of gratuity and pension schemes which are measured at present value of defined benefit obligation less fair value of plan assets.
2.4 Functional and presentation currency
These financial statements are presented in Pakistan Rupees which is also the Company’s functional currency and has been rounded to the nearest thousand.
3. USE OF ESTIMATES AND JUDGEMENTS
The preparation of financial statements in conformity with approved accounting standards, as applicable in Pakistan, requires management to make judgements, estimates and assumptions that affect the application of accounting policies and the reported amounts of assets, liabilities, income and expenses. The estimates and associated assumptions are based on historical experience and various other factors that are believed to be
NOTES TO THE UNCONSOLIDATED FINANCIAL STATEMENTSFor the year ended 30 June 2014

83Unconsolidated Financial Statements 2014
reasonable under the circumstances, the results of which form the basis of making the judgements about the carrying values of assets and liabilities that are not readily apparent from other sources. Actual results may differ from these estimates.
The estimates and underlying assumptions are reviewed on an ongoing basis. Revisions to accounting estimates are recognized in the period in which the estimates are revised if the revision affects only that period, or in the period of the revision and future periods if the revision affects both current and future periods.
Judgements made by the management in the application of approved accounting standards, as applicable in
Pakistan, that have significant effect on the financial statements and estimates with a significant risk of material adjustment in the next financial year are set forth below:
Property, plant and equipment and depreciation (refer note 5.1) Intangible assets and amortization (refer note 5.2) Investments (refer note 5.4) Stock-in-trade and stores, spares and loose tools (refer note 5.6 and 5.7) Staff retirement benefits (refer note 5.10) Leases (refer note 5.12) Income taxes (refer note 5.14) Impairment (refer note 5.1, 5.2, 5.4 and 5.18) 4. NEW OR AMENDMENTS / INTERPRETATION TO EXISTING STANDARD AND FORTHCOMING REQUIREMENTS
4.1 Standards, amendments or interpretations which became effective during the year
During the year, certain amendments to standards became effective. However, they did not have material affect on these financial statements except for the revised IAS 19 ‘Employees Benefits’ detail of which are stated in note 4.1.1.
4.1.1 Employee Benefits - change in accounting policy
With effect from 01 January 2013, the revised IAS 19 ‘Employee Benefits’ became effective. The revised IAS 19 requires actuarial gains and losses to be recognized immediately in other comprehensive income. Previously, actuarial gains and losses over and above the corridor limit were amortized over the expected average remaining working lives of employees as allowed under the relevant provision of previous IAS 19. Further, any past service cost is now recognized immediately in the profit and loss as soon as the change in the benefit plans are made. Previously, only vested past service cost was recognized immediately in profit and loss account and non-vested cost was amortised to profit and loss account over the vesting period. The standard also replaces the interest cost on the defined benefit obligation and the expected return on plan assets with a net interest cost based on the net defined benefit assets or liability and the discount rate, measured at the beginning of the year. Refer note 5.10.2.2 for revised accounting policy.
These changes have been accounted for retrospectively in accordance with International Accounting Standard
- 8 “Accounting Policies, Changes in Accounting Estimates and Errors”, resulting in restatement of financial statements of prior periods. Resultantly, the cumulative balance for un-recognised actuarial losses that existed as at 1 July 2012 have been presented and disclosed as part of the statement of changes in equity, while the corresponding period adjustment through other comprehensive income is re-stated and disclosed as part of the Statement of Comprehensive Income. The Balance Sheet also presents the prior year numbers as restated, due to the said change.
NOTES TO THE UNCONSOLIDATED FINANCIAL STATEMENTSFor the year ended 30 June 2014

84 Crescent Steel and Allied Products Limited
The effect of the change in accounting policy has been demonstrated below:
30 June 2013 1 July 2012 As Effect due As As Effect due As previously to change in restated previously to change in restatedRupees in ‘000 reported policy reported policy
Effect on balance sheet Trade and other payables 412,519 (231) 412,288 691,904 (367) 691,537 Deferred taxation (33,593) 39,764 6,171 (12,606) 4,212 (8,394) Revenue reserves 2,805,703 73,847 2,879,550 2,159,343 7,821 2,167,164 Other receivables 20,894 113,380 134,274 29,318 11,666 40,984
Rupees in ‘000 2013
Effect on profit and loss account Decrease in profit before tax due to recognition of past service cost in prior years (190)
Effect on other comprehensive income Recognition of actuarial gain (101,388) Recognized tax charge 35,552 (65,836)
4.2 New / revised accounting standards, amendments to published accounting standards, and interpretations that are not yet effective
The following new standards, amendments to existing standards and interpretations of approved accounting standards will be effective for accounting periods beginning on or after 01 July 2014:
- IFRIC 21- Levies ‘an Interpretation on the accounting for levies imposed by governments’ (effective for
annual periods beginning on or after 1 January 2014). IFRIC 21 is an interpretation of IAS 37 Provisions, Contingent Liabilities and Contingent Assets. IAS 37 sets out criteria for the recognition of a liability, one of which is the requirement for the entity to have a present obligation as a result of a past event (known as an obligating event). The Interpretation clarifies that the obligating event that gives rise to a liability to pay a levy is the activity described in the relevant legislation that triggers the payment of the levy. The interpretation is not likely to have an impact on the Company’s financial statements.
- Offsetting Financial Assets and Financial Liabilities (Amendments to IAS 32) – (effective for annual periods
beginning on or after 1 January 2014). The amendments address inconsistencies in current practice when applying the offsetting criteria in IAS 32 Financial Instruments: Presentation. The amendments clarify the meaning of ‘currently has a legally enforceable right of set-off’; and that some gross settlement systems may be considered equivalent to net settlement. The amendments are not likely to have an impact on the Company’s financial statements.
- Amendment to IAS 36 “Impairment of Assets” Recoverable Amount Disclosures for Non-Financial Assets
(effective for annual periods beginning on or after 1 January 2014). These narrow-scope amendments to IAS 36 Impairment of Assets address the disclosure of information about the recoverable amount of impaired assets if that amount is based on fair value less costs of disposal. The amendments are not likely to have an impact on the Company’s financial statements.
NOTES TO THE UNCONSOLIDATED FINANCIAL STATEMENTSFor the year ended 30 June 2014

85Unconsolidated Financial Statements 2014
- Amendments to IAS 39 “Financial Instruments: Recognition and Measurement” Continuing hedge accounting after derivative novation (effective for annual periods beginning on or after 1 January 2014). The amendments add a limited exception to IAS 39, to provide relief from discontinuing an existing hedging relationship when a novation that was not contemplated in the original hedging documentation meets specific criteria. The amendments are not likely to have an impact on the Company’s financial statements.
- Amendments to IAS 19 “Employee Benefits” Employee contributions – a practical approach (effective
for annual periods beginning on or after 1 July 2014). The practical expedient addresses an issue that arose when amendments were made in 2011 to the previous pension accounting requirements. The amendments introduce a relief that will reduce the complexity and burden of accounting for certain contributions from employees or third parties. The amendments are relevant only to defined benefit plans that involve contributions from employees or third parties meeting certain criteria. The amendments are not likely to have an impact on the Company’s financial statements.
- Amendments to IAS 38 Intangible Assets and IAS 16 Property, Plant and Equipment (effective for annual
periods beginning on or after 1 January 2016) introduce severe restrictions on the use of revenue-based amortization for intangible assets and explicitly state that revenue-based methods of depreciation cannot be used for property, plant and equipment. The rebuttable presumption that the use of revenue-based amortisation methods for intangible assets is inappropriate can be overcome only when revenue and the consumption of the economic benefits of the intangible asset are ‘highly correlated’, or when the intangible asset is expressed as a measure of revenue. The amendments are not likely to have an impact on Company’s financial statements.
- Agriculture: Bearer Plants [Amendment to IAS 16 and IAS 41] (effective for annual periods beginning on
or after 1 January 2016). Bearer plants are now in the scope of IAS 16 Property, Plant and Equipment for measurement and disclosure purposes. Therefore, a company can elect to measure bearer plants at cost. However, the produce growing on bearer plants will continue to be measured at fair value less costs to sell under IAS 41 Agriculture. A bearer plant is a plant that: is used in the supply of agricultural produce; is expected to bear produce for more than one period; and has a remote likelihood of being sold as agricultural produce. Before maturity, bearer plants are accounted for in the same way as self-constructed items of property, plant and equipment during construction. The amendments are not likely to have an impact on Company’s financial statements.
- Annual Improvements 2010-2012 and 2011-2013 cycles (most amendments will apply prospectively for
annual period beginning on or after 1 July 2014). The new cycle of improvements contain amendments to the following standards:
- IFRS 2 ‘Share-based Payment’. IFRS 2 has been amended to clarify the definition of ‘vesting
condition’ by separately defining ‘performance condition’ and ‘service condition’. The amendment also clarifies both: how to distinguish between a market condition and a non-market performance condition and the basis on which a performance condition can be differentiated from a vesting condition.
- IFRS 3 ‘Business Combinations’. These amendments clarify the classification and measurement
of contingent consideration in a business combination. Further IFRS 3 has also been amended to clarify that the standard does not apply to the accounting for the formation of all types of joint arrangements including joint operations in the financial statements of the joint arrangement themselves.
- IFRS 8 ‘Operating Segments’ has been amended to explicitly require the disclosure of judgments
made by management in applying the aggregation criteria. In addition this amendment clarifies that a reconciliation of the total of the reportable segment’s assets to the entity assets is required
NOTES TO THE UNCONSOLIDATED FINANCIAL STATEMENTSFor the year ended 30 June 2014

86 Crescent Steel and Allied Products Limited
only if this information is regularly provided to the entity’s chief operating decision maker. This change aligns the disclosure requirements with those for segment liabilities.
- Amendments to IAS 16 ‘Property, plant and equipment’ and IAS 38 ‘Intangible Assets’. The amendments clarify the requirements of the revaluation model in IAS 16 and IAS 38, recognizing that the restatement of accumulated depreciation (amortization) is not always proportionate to the change in the gross carrying amount of the asset.
- IAS 24 ‘Related Party Disclosure’. The definition of related party is extended to include a
management entity that provides key management personnel services to the reporting entity, either directly or through a group entity.
- IAS 40 ‘Investment Property’. IAS 40 has been amended to clarify that an entity should assess whether an acquired property is an investment property under IAS 40 and perform a separate assessment under IFRS 3 to determine whether the acquisition of the investment property constitutes a business combination.
The above amendments are not likely to have an impact on the Company’s financial statements.
5. SUMMARY OF SIGNIFICANT ACCOUNTING POLICIES
Significant accounting policies applied in the preparation of these financial statements are set forth below and have been applied consistently to all years presented except as disclosed in note 4.1.1 and 5.10.2.2.
5.1 Property, plant and equipment and depreciation
Owned assets
Property, plant and equipment, except freehold land and capital work-in-progress are stated at cost less accumulated depreciation and impairment losses, if any. Freehold land and capital work-in-progress are stated at cost.
Cost includes expenditure that is directly attributable to the acquisition of the asset. The cost of self-constructed
assets include the cost of materials and direct labour, any other cost directly attributable to bring the assets to a working condition for their intended use, the cost of dismantling and removing the items and restoring the site on which they are located, and capitalized borrowing costs, if any.
Subsequent cost
The cost of replacing part of an item of property, plant and equipment is recognized in the carrying amount of the item if it is probable that the future economic benefits embodied within that part will flow to the Company and its cost can be measured reliably. The carrying amount of the part so replaced is derecognized. The costs relating to day-to-day servicing of property, plant and equipment are recognized in profit and loss account as incurred.
Depreciation
Depreciation is charged to income on a straight line basis at the rates specified in note 13.1 to these financial statements. Depreciation on additions to property, plant and equipment is charged from the month in which an item is acquired or capitalized while no depreciation is charged for the month in which the item is disposed off or retained.
The assets’ residual values and useful lives are reviewed at each financial year end and adjusted if appropriate. Disposal
The gain or loss on disposal or retirement of an asset represented by the difference between the sale proceeds and the carrying amount of the asset is recognized as an income or expense in profit and loss account.
NOTES TO THE UNCONSOLIDATED FINANCIAL STATEMENTSFor the year ended 30 June 2014
87Unconsolidated Financial Statements 2014
Leased assets
Upon initial recognition, an asset acquired by way of finance lease is stated at an amount equal to the lower of its fair value and the present value of minimum lease payments, each determined at the inception of the lease. Subsequent to initial recognition, the asset is stated at the amount determined at initial recognition less accumulated depreciation and impairment losses, if any.
Depreciation is charged on the same basis as used for owned assets. Capital work in progress
Capital work in progress is stated at cost and consists of expenditure incurred and advances made in respect of tangible and intangible assets in the course of their construction and installation. Transfers are made to relevant assets category as and when assets are available for intended use.
Impairment
The carrying amount of property, plant and equipment is reviewed at each balance sheet date to determine whether there is any indication of impairment. If any such indication exists then the assets recoverable amount is estimated. The recoverable amount is the greater of its value in use and fair value less cost to sell. An impairment is recognized if the carrying amount exceeds its estimated recoverable amount.
5.2 Intangible assets
Intangible assets acquired by the Company are stated at cost less accumulated amortization and impairment losses, if any.
Subsequent expenditure
Subsequent expenditure on capitalized intangible assets is capitalized only when it increases the future economic benefits embodied in the specific assets to which it relates. All other expenditure is expensed as incurred.
Amortization
Amortization is charged to the income statement on a straight line basis over the estimated useful lives of intangible assets unless such lives are indefinite. Amortization on additions to intangible assets is charged from the month in which an item is acquired or capitalized while no amortization is charged for the month in which the item is disposed off.
Impairment
All intangible assets with an indefinite useful life are systematically tested for impairment at each balance sheet date. Where the carrying amount of an asset exceeds its estimated recoverable amount it is written down immediately to its recoverable amount. The carrying amount of other intangible assets are reviewed at each balance sheet date to determine whether there is any indication of impairment. If any such indication exist than the assets recoverable amount is estimated. The recoverable amount is the greater of its value in use and fair value less cost to sell. An impairment is recognized if the carrying amount exceeds its estimated recoverable amount.
5.3 Investment property
Investment property, principally comprising of land and buildings, is held for long term rental yields / capital appreciation. The investment property of the Company comprises of land and buildings and is valued using the cost method i.e. at cost less any accumulated depreciation and impairment losses, if any.
NOTES TO THE UNCONSOLIDATED FINANCIAL STATEMENTSFor the year ended 30 June 2014

88 Crescent Steel and Allied Products Limited
Cost includes expenditure that is directly attributable to the acquisition of the investment property. The cost of self-constructed investment property includes the cost of materials and direct labour, any other costs directly attributable to bringing the investment property to a working condition for their intended use and capitalized borrowing costs, if any.
Depreciation is charged to profit on the straight line method so as to allocate the depreciable amount over its
estimated useful life. Depreciation on additions to investment property is charged from the month in which a property is acquired or capitalized while no depreciation is charged for the month in which the property is disposed off.
The residual values and useful lives of investment property are reviewed at each balance sheet date and adjusted if appropriate.
The Company assesses at each balance sheet date whether there is any indication that investment property may
be impaired. If such indication exists, the carrying amounts of such assets are reviewed to assess whether they are recorded in excess of their recoverable amount. Where carrying values exceed the respective recoverable amounts, assets are written down to their recoverable amounts and the resulting impairment loss is recognized in the profit and loss account. The recoverable amount is the higher of an asset’s fair value less costs to sell and value in use. Where an impairment loss is recognized, the depreciation charge is adjusted in the future period to allocate the asset’s revised carrying amount over its estimated useful life.
The gain or loss on disposal of investment property, represented by the difference between the sale proceeds
and the carrying amount of the asset is recognized as income or expense in profit and loss account. 5.4 Investments
Investments in subsidiaries
Investments in subsidiaries are stated at cost less accumulated impairment, if any.
Investments in associates
Entities in which the Company has significant influence directly or indirectly (through subsidiaries) but not control and which are neither subsidiaries nor joint ventures of the members of the Company are associates. Investments in associates are stated at cost less accumulated impairment, if any.
Financial assets at fair value through profit or loss
A non-derivative financial asset is classified as at fair value through profit or loss if it is held for trading or is designated as such upon initial recognition. Investments are designated at fair value through profit or loss if the Company manages such investments and makes purchase and sale decisions based on their fair value. Upon initial recognition, attributable transaction costs are recognized in the profit and loss account when incurred. Investments at fair value through profit or loss are measured at fair value and changes therein are recognized in the profit and loss account.
Held to maturity investments
Held to maturity investments are non-derivative financial assets with fixed or determinable payments and fixed maturity that the Company has positive intention and ability to hold to maturity. Investments classified as held to maturity are recognized initially at fair value, plus attributable transaction costs. Subsequent to initial recognition, held to maturity financial assets are measured at amortized cost using the effective interest method, less any impairment loss, if any.
Loans and receivables
Loans and receivables are recognized initially at fair value, plus attributable transaction costs. Subsequent to initial recognition, loans and receivables measured at amortized cost using the effective interest method, less any impairment losses, if any.
NOTES TO THE UNCONSOLIDATED FINANCIAL STATEMENTSFor the year ended 30 June 2014

89Unconsolidated Financial Statements 2014
Available for sale investments
Other investments not covered in any of the above categories are initially recognized at fair value plus attributable transactions costs. Subsequent to initial recognition these are measured at fair value, with any resultant gain or loss being recognized in other comprehensive income. Gains or losses on available for sale investments are recognized in other comprehensive income until the investments are sold or disposed off or until the investments are determined to be impaired, at that time cumulative gain or loss previously reported in other comprehensive income is included in current period’s profit and loss account.
Fair value of listed securities are the quoted prices on stock exchange on the date it is valued. Unquoted securities
are valued at cost. The Company follows trade date accounting for regular way purchase and sale of securities, except for sale and
purchase of securities in the future market. Impairment
The carrying amount of all investments including interest in associates and subsidiaries, other than those at fair value through profit or loss, is reviewed at each balance sheet date to determine whether there is any indication of impairment. A financial asset is impaired if there is objective evidence of impairment as a result of one or more events that occurred after the initial recognition of the asset and that loss event(s) had an impact on the estimated future cashflows of that asset that can be estimated reliably. In case of investment in equity security, a significant or prolonged decline in its fair value below its cost is objective evidence of impairment.
An impairment loss in respect of financial assets measured at amortized cost is calculated as the difference
between its carrying amount and the present value of the estimated future cashflows discounted at the assets original effective interest rate. Losses are recognized in profit and loss account. When an event occurring after the impairment was recognized causes the amount of impairment loss to decrease, the decrease in impairment loss is reversed through profit and loss account. Impairment losses on available for sale financial assets are recognized by reclassifying the losses accumulated in reserves in equity to profit and loss account. The cumulative loss that is reclassified from equity to profit and loss account is the difference between the acquisition cost, net of any principal repayment and amortization, and the current fair value, less any impairment loss recognized previously in profit and loss account. If in subsequent period, the fair value of an impaired available for sale debt security increases and the increase can be related objectively to an event occurring after the impairment loss was recognized, then the impairment loss is reversed with the amount of reversal recognized in profit and loss account. However, any subsequent recovery in the fair value of an impaired available for sale equity security is recognized in other comprehensive income. An impairment loss in respect of interest in associates and subsidiaries is measured by comparing the recoverable amount (i.e higher of fair value less cost to sell and value in use) of investment with its carrying amount. An impairment loss is recognized in profit and loss account. An impairment loss is reversed if there has been a favorable change in the estimates used to determine the recoverable amount. An impairment loss is reversed only to the extent that the assets carrying amount does not exceed the carrying amount that would have been determined if no impairment loss had been recognized.
Derivative financial instruments
The Company enters into derivative financial instruments, which include future contracts in stock market. Derivatives are initially recorded at fair value and are remeasured to fair value on subsequent balance sheet dates. The fair value of a derivative is equivalent to the unrealized gain or loss from marking to market the derivative using prevailing market rates. Derivatives with positive market values (unrealized gains) are included in other receivables and derivatives with negative market values (unrealized losses) are included in other liabilities in the balance sheet. The resultant gains and losses from derivatives held for trading purposes are recognized in the profit and loss account. No derivative is designated as hedging instrument by the Company.
NOTES TO THE UNCONSOLIDATED FINANCIAL STATEMENTSFor the year ended 30 June 2014

90 Crescent Steel and Allied Products Limited
5.5 Non-current assets held for sale
Non-current assets or disposal groups comprising of assets or liabilities that are expected to be recovered primarily through sale rather than through continuing use, are classified as held for sale. Immediately before classification as held for sale, the assets or components of a disposal group, are remeasured in accordance with Company’s accounting policies. Thereafter these are measured at lower of their carrying amount and fair value less costs to sell.
5.6 Stores, spares and loose tools
Stores, spares and loose tools are valued at lower of weighted average cost and net realizable value, less provision for impairment, if any. Items in transit are valued at cost comprising invoice value plus other charges incurred thereon.
Provision for obsolete and slow moving stores, spares and loose tools is determined based on management’s
estimate regarding their future usability. Net realizable value signifies the estimated selling price in the ordinary course of business less the estimated
costs necessary to be incurred to make the sale. Spare parts of capital nature which can be used only in connection with an item of property, plant and equipment
are classified as fixed assets under the ‘plant and machinery’ category and are depreciated over a time period not exceeding the useful life of the related assets.
5.7 Stock-in-trade
Stock-in-trade is stated at the lower of cost and net realizable value. Cost is arrived at on a weighted average basis. Cost of work-in-process and finished goods include cost of materials and appropriate portion of production overheads. Net realizable value is the estimated selling price in the ordinary course of business less costs of completion and selling expenses. The cost of finished goods of Steel segment is assigned by using specific identification of their individual costs. Scrap stocks are valued at their estimated net realizable value.
5.8 Trade debts and other receivables
These are initially stated at fair value and subsequently measured at amortized cost using the effective interest rate method less provisions for any uncollectible amounts. An estimate is made for doubtful receivables when collection of the amount is no longer probable. Debts considered irrecoverable are written off.
5.9 Cash and cash equivalents
Cash and cash equivalents comprise of cash balances and call deposits. Bank overdrafts that are repayable on demand and form an integral part of the Company’s cash management are included as a component of cash and cash equivalents for the purpose of cash flow statement.
5.10 Employee benefits
5.10.1 Compensated absences
The Company accounts for all accumulated compensated absences when employees render services that increase their entitlement to future compensated absences.
NOTES TO THE UNCONSOLIDATED FINANCIAL STATEMENTSFor the year ended 30 June 2014

91Unconsolidated Financial Statements 2014
5.10.2 Post retirement benefits
5.10.2.1 Defined contribution plan - Provident fund
The Company operates a provident fund scheme for its permanent employees. Equal monthly contributions are made by the Company and its employees. Obligation for contributions to the fund are recognized as an expense in the profit and loss account when they are due.
Cotton segment
Provision and collection from employees are made at the rate of 6.25% of basic pay plus Cost Of Living Allowance (COLA) of Cotton segment employees. A trust has been established and its approval has been obtained from the Commissioner of Income Tax.
All employees except Cotton segment
Contributions to the fund are made at the rate of 8.33% of basic pay plus COLA for those employees who have served the Company for a period of less than five years and after completion of five years, contributions are made at the rate of 10%.
5.10.2.2 Defined benefit plans
Pension and gratuity fund schemes
The Company provides pension and gratuity benefits to all its permanent management employees who have completed their minimum qualifying service as per the terms of employment and funds rules. The pension scheme provides life time pension to retired employees or to their spouses as per pension fund rules.
The Company’s obligation is determined through actuarial valuations carried out under the “Projected Unit
Credit Method”. Remeasurements which comprise actuarial gains and losses and the return on plan assets (excluding interest) are recognized immediately in other comprehensive income. The Company determines the net interest expense (income) on the net defined benefit liability (asset) for the period by applying the discount rate used to measure the defined benefit obligation at the beginning of the annual period to the then-net defined benefit liability (asset), taking into account any changes in the net defined benefit liability (asset) during the period as a result of contribution and benefit payments. Net interest expense, current service cost and any past service cost are recognized in profit and loss account. Any assets resulting from this calculation is limited to the present value of available refunds or reductions in future contributions to the plan. The latest Actuarial valuation was conducted at the balance sheet date by a qualified professional firm of actuaries.
5.11 Mark-up bearing borrowings
Mark-up bearing borrowings are recognized initially at fair value, less attributable transaction costs. Subsequent to initial recognition, mark-up bearing borrowings are stated at amortized cost with any difference between cost and redemption value being recognized in the profit and loss account over the period of the borrowings on an effective interest basis.
5.12 Leases
Leases are classified as finance leases whenever the terms of the lease transfer substantially all the risks and rewards of ownership to the Company. All other leases are classified as operating leases.
Assets held under finance leases along with corresponding lease liabilities are initially recognized at their fair
value at the inception of the lease or, if lower, at the present value of the minimum lease payments. Lease
NOTES TO THE UNCONSOLIDATED FINANCIAL STATEMENTSFor the year ended 30 June 2014
92 Crescent Steel and Allied Products Limited
payments are apportioned between finance costs and reduction of the lease liability so as to achieve a constant rate of interest on the remaining balance of the liability. Finance costs are recognized in the profit and loss account, unless they are directly attributable to qualifying assets, in which case they are capitalized as more fully explained in note 5.16 below.
Payments made under operating leases (net of any incentives received from the lessor) are charged to the
income statement on a straight-line basis over the period of the lease. In the context of sale and leaseback transactions, where a sale and leaseback transaction is classified as a
finance lease, any excess of the sale proceeds over the carrying values is deferred and recognized in the profit and loss account over the lease term. Any loss representing the excess of the carrying values over the sale proceeds is recognized immediately in the profit and loss account.
5.13 Trade and other payables
Trade and other amounts payable are recognized initially at fair value and subsequently carried at amortized cost.
5.14 Taxation
Current
Provision for current taxation is based on taxable income at the current rates of taxation after taking into account tax credits and tax rebates available, if any.
Deferred
Deferred tax is provided using the balance sheet liability method, providing for temporary differences between the carrying amount of assets and liabilities for financial reporting purposes and the amounts used for taxation purposes. The amount of deferred tax provided is based on the expected manner of realization or settlement of the carrying amount of assets and liabilities, using the rates that are expected to apply to the period when the differences reverse based on tax rates that have been enacted at the balance sheet date.
Deferred tax liabilities are recognized for all taxable temporary differences. A deferred tax asset is recognized
only to the extent that it is probable that future taxable profits will be available against which the asset can be utilized. Deferred tax asset is reduced to the extent that it is no longer probable that the related tax benefits will be realized.
5.15 Revenue recognition
Revenue from sales is recognized when significant risks and rewards of ownership are transferred to the buyer.
Interest income is recognized using the effective interest method. Dividend income is recognized when the right to receive the same is established i.e. the book closure date of the
investee company declaring the dividend. Gains and losses on sale of investments are accounted for when the commitment (trade date) for sale of security
is made. Unrealized gains and losses arising on revaluation of securities classified as ‘held for trading’ are recognized in
the profit and loss account in the period in which they arise. Gains and losses arising on revaluation of derivatives to the fair value are also recognized in the profit and loss account.
NOTES TO THE UNCONSOLIDATED FINANCIAL STATEMENTSFor the year ended 30 June 2014

93Unconsolidated Financial Statements 2014
Rental income (net of any incentives given to lessees) from investment property is recognized on a straight line basis over the lease term.
Miscellaneous income is recognized on receipt basis. 5.16 Borrowing costs
Borrowing costs incurred on long term finances directly attributable for the construction / acquisition of qualifying assets are capitalized up to the date the respective assets are available for intended use. All other mark-up, interest and other related charges are taken to the profit and loss account currently.
5.17 Provisions
A provision is recognized in the balance sheet when the Company has a legal or constructive obligation as a result of past events, it is probable that an outflow of economic benefits will be required to settle the obligation and a reliable estimate can be made of the amount of the obligation. Provisions are reviewed at each balance sheet date and adjusted to reflect the current best estimate.
5.18 Impairment
The carrying amount of the Company’s assets is reviewed at each balance sheet date to determine whether there is any objective evidence that an asset or group of assets may be impaired. If any such evidence exists, the asset’s or group of assets’ recoverable amount is estimated. An impairment loss is recognized whenever the carrying amount of an asset exceeds its recoverable amount. Recoverable amount is the higher of value in use and fair value less cost to sell. Impairment losses are recognized in profit and loss account.
5.19 Foreign currency translation
Foreign currency transactions are translated into Pakistan Rupees at exchange rates prevailing on the date of transaction. Monetary assets and liabilities in foreign currencies are translated into Pakistan Rupees at the rates of exchange prevailing at the balance sheet date. Exchange differences, if any, are recognized in profit and loss account.
5.20 Offsetting of financial assets and financial liabilities
Financial assets and financial liabilities are set off and only the net amount is reported in the balance sheet when there is a legally enforceable right to set off the recognized amount and the Company intends to either settle on a net basis, or to realize the asset and settle the liability simultaneously.
5.21 Segment reporting
Operating segments are reported in a manner consistent with the internal reporting structure. Management monitors the operating results of its business units separately for the purpose of making decisions regarding resource allocation and performance assessment.
Segment capital expenditure is the total cost incurred during the period to acquire property, plant and equipment
and intangible assets. 5.22 Proposed dividend and transfer between reserves
Dividend distributions to the Company’s shareholders are recognized as a liability in the period in which dividends are approved. Transfer between reserves made subsequent to the balance sheet date is considered as a non-adjusting event and is recognized in the financial statements in the period in which such transfers are made.
NOTES TO THE UNCONSOLIDATED FINANCIAL STATEMENTSFor the year ended 30 June 2014
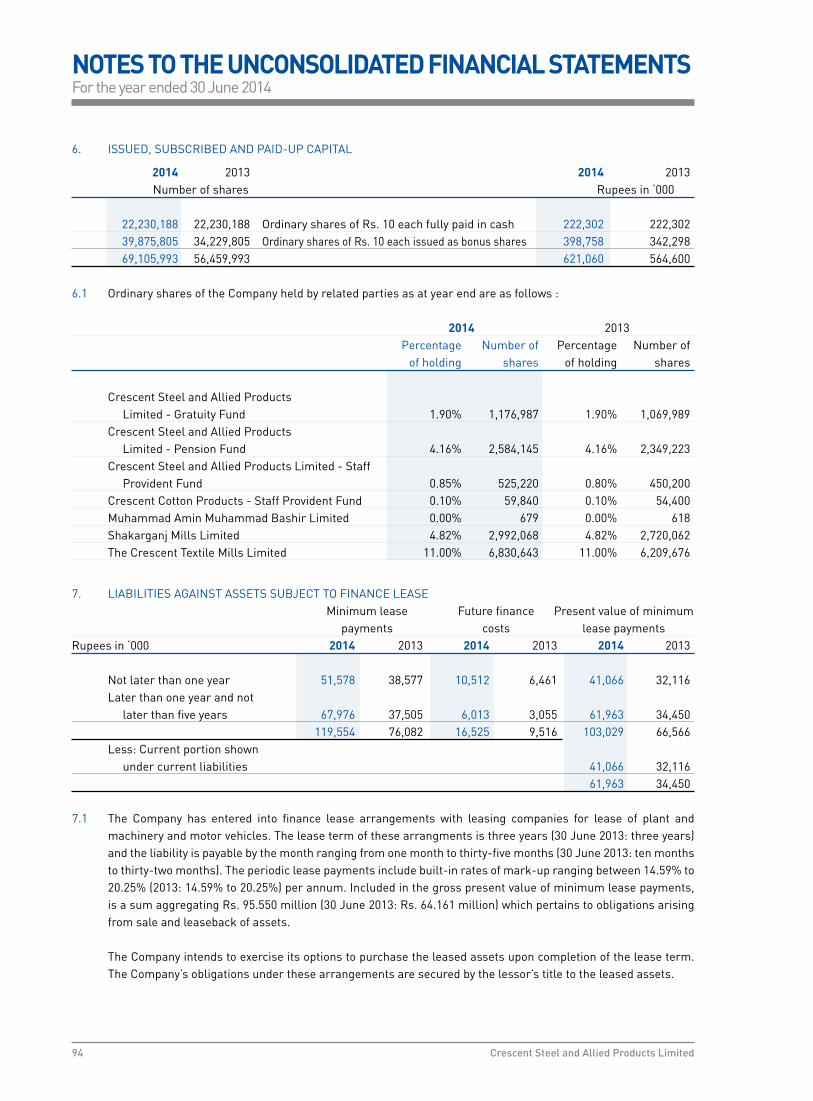
94 Crescent Steel and Allied Products Limited
6. ISSUED, SUBSCRIBED AND PAID-UP CAPITAL
2014 2013 2014 2013 Number of shares Rupees in ‘000 22,230,188 22,230,188 Ordinary shares of Rs. 10 each fully paid in cash 222,302 222,302 39,875,805 34,229,805 Ordinary shares of Rs. 10 each issued as bonus shares 398,758 342,298 69,105,993 56,459,993 621,060 564,600 6.1 Ordinary shares of the Company held by related parties as at year end are as follows : 2014 2013 Percentage Number of Percentage Number of of holding shares of holding shares
Crescent Steel and Allied Products Limited - Gratuity Fund 1.90% 1,176,987 1.90% 1,069,989 Crescent Steel and Allied Products Limited - Pension Fund 4.16% 2,584,145 4.16% 2,349,223 Crescent Steel and Allied Products Limited - Staff Provident Fund 0.85% 525,220 0.80% 450,200 Crescent Cotton Products - Staff Provident Fund 0.10% 59,840 0.10% 54,400 Muhammad Amin Muhammad Bashir Limited 0.00% 679 0.00% 618 Shakarganj Mills Limited 4.82% 2,992,068 4.82% 2,720,062 The Crescent Textile Mills Limited 11.00% 6,830,643 11.00% 6,209,676
7. LIABILITIES AGAINST ASSETS SUBJECT TO FINANCE LEASE Minimum lease Future finance Present value of minimum payments costs lease payments Rupees in ‘000 2014 2013 2014 2013 2014 2013 Not later than one year 51,578 38,577 10,512 6,461 41,066 32,116 Later than one year and not later than five years 67,976 37,505 6,013 3,055 61,963 34,450 119,554 76,082 16,525 9,516 103,029 66,566 Less: Current portion shown under current liabilities 41,066 32,116 61,963 34,450 7.1 The Company has entered into finance lease arrangements with leasing companies for lease of plant and
machinery and motor vehicles. The lease term of these arrangments is three years (30 June 2013: three years) and the liability is payable by the month ranging from one month to thirty-five months (30 June 2013: ten months to thirty-two months). The periodic lease payments include built-in rates of mark-up ranging between 14.59% to 20.25% (2013: 14.59% to 20.25%) per annum. Included in the gross present value of minimum lease payments, is a sum aggregating Rs. 95.550 million (30 June 2013: Rs. 64.161 million) which pertains to obligations arising from sale and leaseback of assets.
The Company intends to exercise its options to purchase the leased assets upon completion of the lease term.
The Company’s obligations under these arrangements are secured by the lessor’s title to the leased assets.
NOTES TO THE UNCONSOLIDATED FINANCIAL STATEMENTSFor the year ended 30 June 2014

95Unconsolidated Financial Statements 2014
8. DEFERRED INCOME
The Company entered into sale and lease back arrangements resulting in deferred income (representing excess of sales proceed over the carrying amount of respective assets) out of which Rs. 1.764 million (30 June 2013: Rs. 0.847 million) is classified in current liabilities; being current portion of deferred income of Rs. 4.088 million (30 June 2013: Rs. 2.260 million). The deferred income will be amortized to profit and loss account over the lease term. During the year Rs. 0.924 million (2013: 0.284 million) is amortized in profit and loss account.
2014 2013 Rupees in ‘000 Note (Restated)
9. TRADE AND OTHER PAYABLES
Trade creditors 26,720 55,414 Bills payable 15,784 – Commission payable 2,707 12,601 Customer’s security deposits 2,528 200 Accrued liabilities 9.1 71,223 81,300 Advances from customers 25,505 15,123 Provisions 9.2 89,805 93,849 Due to related parties 9.3 340 198 Payable against purchase of investments 55,813 – Payable to provident fund 1,492 87 Retention money 287 486 Sales tax payable 89 – Withholding tax payable 4,441 50 Workers’ Profit Participation Fund 9.4 9,023 52,395 Workers’ Welfare Fund 12.2 589 18,794 Unclaimed dividend 56,853 67,873 Others 9,248 13,918 372,447 412,288
9.1 Accrued liabilities
Salaries, wages and other benefits 12,792 17,807 Accrual for 10-C bonus 1,204 2,405 Compensated absences 11,198 11,544 Others 9.1.1 46,029 49,544 71,223 81,300
9.1.1 This includes liability against Gas Infrastructre Development Cess of Rs. 3.381 million (2013: Nil).
9.2 Movement in provisions Infrastructure Sales Liquidated Total fee Tax damages Rupees in ‘000 Note 9.2.1 Note 9.2.2 Note 9.2.3 Opening balance as at 1 July 2013 56,656 3,242 33,951 93,849 Reversal of provision for the year – – (3,456) (3,456) Provision for the year 7,814 – 2,152 9,966 Payments during the year (3,955) – (6,599) (10,554) Closing balance as at 30 June 2014 60,515 3,242 26,048 89,805
NOTES TO THE UNCONSOLIDATED FINANCIAL STATEMENTSFor the year ended 30 June 2014

96 Crescent Steel and Allied Products Limited
9.2.1 This provision has been recognized against infrastructure fee levied by the Government of Sindh through Sindh Finance (Amendment) Ordinance, 2001. The Company has contested this issue in the High Court. The Company filed an appeal in the Supreme Court against the judgement of the High Court dated 15 September 2008 partly accepting the appeal by declaring that the levy and collection of infrastructure fee prior to 28 December 2006 was illegal and ultra vires and after that it was legal. Additionally, the Government of Sindh also filed appeal against the part of judgement decided against them.
The above appeals were disposed off in May 2011 with a joint statement of the parties that, during the pendency of
the appeal, another law came into existence which was not subject matter in the appeal. Therefore, the decision thereon be first obtained from the High Court before approaching the Supreme Court with the right to appeal. The petition was filed in the High Court in respect of the above view. During the pendency of the appeal an interim arrangement was agreed whereby bank guarantee furnished for consignments cleared upto 27 December 2006 were returned. Bank guarantees were furnished for 50% of the levy for consignment released subsequent to 28 December 2006 while payment was made against the balance amount. Similar arrangement continued for the consignments released during the current year.
Under the arrangement if the Company succeed in the petition, Government of Sindh will refund the amount
subject to their right to appeal before Honourable Supreme Court. To date the Company has provided bank guarantees amounting to Rs. 34.119 million (2013: Rs. 31.618 million) in favour of Excise and Taxation Department. Based on the legal advice, the management believes that the chance of success in the petition is in the Company’s favor. Current year charge has been estimated on the value of imports during the year and forms a component of cost of such imported raw materials. Any subsequent adjustment with respect to increase or decrease in the estimate has been recognized in profit and loss account. However, on a prudent basis full provision has been recognized.
9.2.2 These have been made against sales tax claims long outstanding with the sales tax department.
9.2.3 The provision has been recognized on account of liquidated damages claimed by customers on delayed supply of goods. The Company is in the process of negotiating this matter and expects that this may be resolved. However, on a prudent basis full provision has been recognized.
9.3 This represents balances due to Shakarganj Mills Limited (Associated Company) and Premier Insurance Company amounting to Rs. 0.258 million (2013: Rs. 0.198 million ) and Rs. 0.082 million (2013: Rs. Nil) respectively.
Rupees in ‘000 Note 2014 2013
9.4 Workers’ Profit Participation Fund
Opening balance as at 1 July 52,395 15,376 Allocation for the year 34 4,851 34,797 Mark-up on funds utilized in the Company’s business 36 1,387 2,222 58,633 52,395 Amount paid to the trustees of the fund (49,610) – Closing balance as at 30 June 9,023 52,395
10. MARK-UP ACCRUED
Mark-up accrued on : - Finance lease obligations 345 207 - Running finance and short term loans 7,823 8,795 8,168 9,002
11. SHORT TERM BORROWINGS
Secured from banking companies Running finances under mark-up arrangements 11.1 228,366 285,890 Short term loans 11.2 – 132,475 228,366 418,365
NOTES TO THE UNCONSOLIDATED FINANCIAL STATEMENTSFor the year ended 30 June 2014

97Unconsolidated Financial Statements 2014
11.1 Short term running finance available from various commercial banks under mark-up arrangements amounted to Rs. 500 million (2013: Rs. 500 million) out of which Rs. 250 million (2013: Rs. 250 million) is interchangeable with letters of credit facility. During the year, mark-up on such arrangements ranged between 10.58% to 12.38% (2013: 10.81% to 15.10%) per annum.
11.2 Short term loan available from various commercial banks under mark-up arrangements amounted to Rs. 1,300 million (2013: Rs. 1,100 million) out of which Rs. 400 million (2013: Rs. 300 million) is interchangeable with letters of credit. During the year, mark-up on such arrangements ranged between 11.26% to 13.20% (2013: 11.27% to 14.35%) per annum.
11.3 The facilities for opening letters of credit amounted to Rs. 1,500 million (2013: Rs. 1,400 million) out of which Rs. 250 million (2013: Rs. 250 million) and Rs. 400 million (2013: Rs. 300 million) are interchangeable with short term running finance and short term loans respectively as mentioned in notes 11.1 and 11.2 above. The facility for letters of guarantee as at 30 June 2014 amounted to Rs. 526 million (2013: Rs. 500 million). Amounts unutilized for letters of credit and guarantees as at 30 June 2014 were Rs. 1,431.518 million and Rs. 278.360 million (2013: Rs. 1,356.764 million and Rs. 191.017 million) respectively.
11.4 The above facilities are expiring on various dates and are secured by way of hypothecation of plant and machinery, stock-in-trade, trade debts and other current assets, pledge of shares and cotton / cotton yarn; and lien over import / export document.
12. CONTINGENCIES AND COMMITMENTS
12.1 The Company has filed a suit in the Sindh High Court against the Federation of Pakistan and others, for levy of import license fee at the rate of 6% against import of coating plant in 1992. The Company contested that as per SRO 1317(I)/94 dated 22 December 1990, the coating plant being located in rural area, is only liable to pay import license fee at the rate of 2%. The Company has provided demand draft of Rs. 3.420 million (Refer note 17.2) directed by the Honourable Court. The petition was dismissed by the High Court as having been incompetently filed. The Company has filed the appeal with Honourable Supreme Court and no hearing has taken place since then. No provision has been recognized in these financial statements as management considers that the case would be decided in the Company’s favour.
12.2 The Finance Act, 2008 introduced an amendment to the Workers’ Welfare Fund Ordinance, 1971 (WWF Ordinance), thus rendering the Company liable to pay contribution to WWF at the rate of two percent of their accounting or taxable income, whichever is higher. In 2011, the Honourable Lahore High Court (LHC) in a Constitutional Petition relating to the amendments brought in the WWF Ordinance, 1971 through the Finance Act, 2008, has declared the said amendments as unlawful and unconstitutional. However, in 2013, a larger bench of Sindh High Court (SHC) passed an order declaring that the amendments introduced through Finance Act 2008 do not suffer from any constitutional and legal infirmity. Both the decisions of LHC and SHC are pending before Supreme Court for adjudication. The management’s tax advisor is of the view that the decision of LHC will remain applicable to the Company as the Company’s registered office is situated in its jurisdiction till the decision of Supreme Court. Accordingly, aggregate net of tax provision of Rs. 8.626 million has not been recorded in these financial statements.
12.3 Sindh Industrial Trade Estate (SITE) has cancelled allotment of plot A-26 and A-27 and charged non-utilization fees of Rs. 0.285 million and Rs. 0.621 million respectively. The Company has challenged the cancellation and filed a suit in the Sindh High Court. The High Court has restrained SITE from taking any adverse action against the Company. Therefore, management considers that the case would be decided in the Company’s favour and no provision is required to be recognized.
12.4 Aggregate amount of guarantees issued by banks on behalf of the Company against various contracts aggregated Rs. 247.640 million (2013: Rs. 308.983 million).
12.5 Commitments in respect of capital expenditure contracted for as at 30 June 2014 amounted to Rs. 7.462 million (2013: Rs. 7.462 million) in relation to office premises located in Islamabad payable on completion of project.
12.6 Commitments under letters of credit as at 30 June 2014 amounted to Rs. 55.021 million (2013: Rs. 43.236 million).
NOTES TO THE UNCONSOLIDATED FINANCIAL STATEMENTSFor the year ended 30 June 2014

98 Crescent Steel and Allied Products Limited
Rupe
es in
‘000
N
ote
20
14
2013
13.
PR
OP
ERTY
, PLA
NT
AN
D E
QU
IPM
ENT
O
pera
ting
fixed
ass
ets
13.1
684
,392
68
2,34
5
Cap
ital w
ork-
in-p
rogr
ess
13.4
110
,693
9
5,48
9
7
95,0
85
777
,834
13
.1
Oper
atin
g fix
ed a
sset
s
De
scrip
tion
Land
Bu
ildin
gs
Offic
e Pl
ant a
nd m
achi
nery
El
ectri
cal /
Fu
rnitu
re
Com
pute
rs
Mot
or ve
hicle
s To
tal
Fr
eeho
ld
Leas
ehol
d On
On
pr
emise
s Ow
ned
* Le
ased
of
fice
an
d
Owne
d Le
ased
in
clud
ing
fre
ehol
d
leas
ehol
d
eq
uipm
ent a
nd
fittin
gs
Ru
pees
in ‘0
00
im
prov
emen
ts
land
la
nd
in
stal
latio
n
N
et c
arry
ing
valu
e as
at 1
Jul
y 20
13
Op
enin
g ne
t boo
k va
lue
(NBV
)
217
,479
3
,970
9
8,27
7
4,1
92
29
2
22,5
19
70,
771
1
3,56
8
2,6
05
2,9
77
19,
921
2
6,03
7
682
,345
Addi
tions
/ tr
ansf
ers
-
-
4,5
93
-
- 9
1,94
3
69,
708
1
,799
4
95
4,2
47
13,
478
9
,562
1
95,8
25
Di
spos
als
(at N
BV)
13.5
(8
,336
) -
-
-
-
(6
9,35
8)
(15,
163)
-
-
-
(4
,502
) (6
,041
) (1
03,4
00)
De
prec
iatio
n ch
arge
13
.1.1
-
(5
3)
(14,
232)
(1
,132
) (6
) (4
7,01
4)
(9,9
26)
(4,1
30)
(486
) (1
,657
) (5
,082
) (6
,660
) (9
0,37
8)
Bala
nce
as a
t 30
June
201
4 (N
BV)
2
09,1
43
3,9
17
88,
638
3
,060
2
3
198
,090
1
15,3
90
11,
237
2
,614
5
,567
2
3,81
5
22,
898
6
84,3
92
Gr
oss
carr
ying
valu
e as
at
30
June
201
4
Cost
13
.2
209
,143
5
,646
2
06,7
50
70,
027
4
0,49
3
1,2
42,8
20
125
,139
4
9,42
1
18,
469
5
5,20
4
65,
018
3
2,24
1
2,1
20,3
71
Ac
cum
ulat
ed d
epre
ciat
ion
-
(1
,729
) (1
18,1
12)
(66,
967)
(4
0,47
0)
(1,0
44,7
30)
(9,7
49)
(38,
184)
(1
5,85
5)
(49,
637)
(4
1,20
3)
(9,3
43)
(1,4
35,9
79)
N
et b
ook
valu
e
209
,143
3
,917
8
8,63
8
3,0
60
23
1
98,0
90
115
,390
1
1,23
7
2,6
14
5,5
67
23,
815
2
2,89
8
684
,392
Net
car
ryin
g va
lue
as a
t 1 J
uly
2012
Open
ing
net b
ook
valu
e (N
BV)
1
47,4
79
4,0
23
86,
877
5
,470
2
,641
2
29,6
68
23,
906
1
5,56
8
2,8
96
960
1
3,22
4
15,
892
5
48,6
04
Ad
ditio
ns /
tran
sfer
s
70,
000
-
2
5,15
2
-
-
93,
204
5
0,37
6
1,9
39
205
2
,801
2
6,82
0
14,
290
2
84,7
87
Di
spos
als
(at N
BV)
-
-
-
-
-
(4
7,91
4)
-
-
-
- (1
4,77
9)
-
(62,
693)
De
prec
iatio
n ch
arge
-
(53)
(1
3,75
2)
(1,2
78)
(2,6
12)
(52,
439)
(3
,511
) (3
,939
) (4
96)
(784
) (5
,344
) (4
,145
) (8
8,35
3)
Bala
nce
as a
t 30
June
201
3 (N
BV)
2
17,4
79
3,9
70
98,
277
4
,192
2
9
222
,519
7
0,77
1
13,
568
2
,605
2
,977
1
9,92
1
26,
037
6
82,3
45
Gr
oss
carr
ying
valu
e as
at
30
June
201
3
Cost
217
,479
5
,646
2
02,1
57
70,
027
4
0,49
3
1,2
21,3
36
77,
093
4
7,62
2
17,
974
5
0,99
7
59,
938
3
1,78
3
2,0
42,5
45
Ac
cum
ulat
ed d
epre
ciat
ion
-
(1
,676
) (1
03,8
80)
(65,
835)
(4
0,46
4)
(998
,817
) (6
,322
) (3
4,05
4)
(15,
369)
(4
8,02
0)
(40,
017)
(5
,746
) (1
,360
,200
)
Net
boo
k va
lue
2
17,4
79
3,9
70
98,
277
4
,192
2
9
222
,519
7
0,77
1
13,
568
2
,605
2
,977
1
9,92
1
26,
037
6
82,3
45
De
prec
iatio
n ra
te (%
per
ann
um)
-
1
5 &
10
5 &
10
10
5 -
20
10
5 -
20
10
33.3
3 20
20
*
Net
boo
k va
lue
of p
lant
and
mac
hine
ry (o
wne
d) in
clud
es a
n ag
greg
ate
amou
nt o
f Rs.
0.8
05 m
illio
n (2
013:
Rs.
0.9
89 m
illio
n) re
pres
entin
g ne
t boo
k va
lue
of c
apita
lized
spa
res.
NOTES TO THE UNCONSOLIDATED FINANCIAL STATEMENTSFor the year ended 30 June 2014
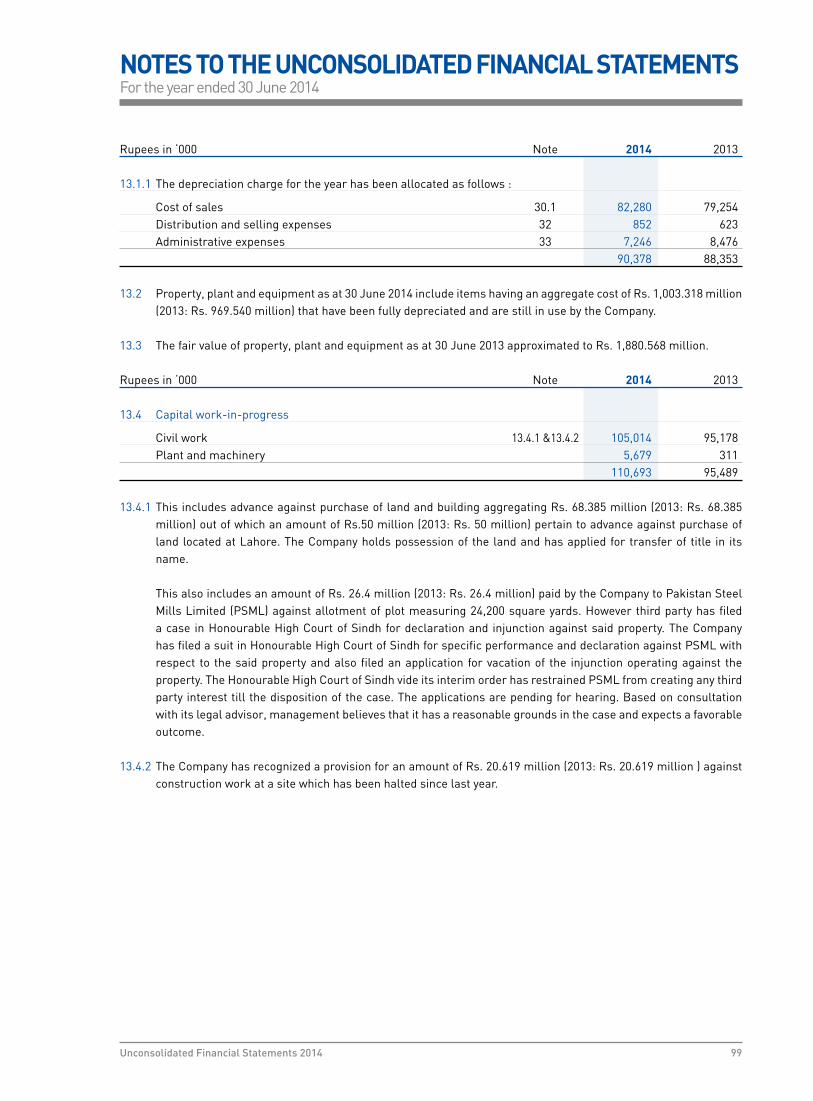
99Unconsolidated Financial Statements 2014
Rupees in ‘000 Note 2014 2013 13.1.1 The depreciation charge for the year has been allocated as follows :
Cost of sales 30.1 82,280 79,254 Distribution and selling expenses 32 852 623 Administrative expenses 33 7,246 8,476 90,378 88,353
13.2 Property, plant and equipment as at 30 June 2014 include items having an aggregate cost of Rs. 1,003.318 million (2013: Rs. 969.540 million) that have been fully depreciated and are still in use by the Company.
13.3 The fair value of property, plant and equipment as at 30 June 2013 approximated to Rs. 1,880.568 million.
Rupees in ‘000 Note 2014 2013
13.4 Capital work-in-progress
Civil work 13.4.1 &13.4.2 105,014 95,178 Plant and machinery 5,679 311 110,693 95,489 13.4.1 This includes advance against purchase of land and building aggregating Rs. 68.385 million (2013: Rs. 68.385
million) out of which an amount of Rs.50 million (2013: Rs. 50 million) pertain to advance against purchase of land located at Lahore. The Company holds possession of the land and has applied for transfer of title in its name.
This also includes an amount of Rs. 26.4 million (2013: Rs. 26.4 million) paid by the Company to Pakistan Steel Mills Limited (PSML) against allotment of plot measuring 24,200 square yards. However third party has filed a case in Honourable High Court of Sindh for declaration and injunction against said property. The Company has filed a suit in Honourable High Court of Sindh for specific performance and declaration against PSML with respect to the said property and also filed an application for vacation of the injunction operating against the property. The Honourable High Court of Sindh vide its interim order has restrained PSML from creating any third party interest till the disposition of the case. The applications are pending for hearing. Based on consultation with its legal advisor, management believes that it has a reasonable grounds in the case and expects a favorable outcome.
13.4.2 The Company has recognized a provision for an amount of Rs. 20.619 million (2013: Rs. 20.619 million ) against construction work at a site which has been halted since last year.
NOTES TO THE UNCONSOLIDATED FINANCIAL STATEMENTSFor the year ended 30 June 2014

100 Crescent Steel and Allied Products Limited
13.5 The following assets were disposed off during the year: Description Cost Accumulated Book Sale Mode of Particular of buyers depreciation value proceeds disposal Rupees in ‘000 Plant and machinery 70,460 1,102 69,358 68,863 Sales & Lease Pak Gulf Leasing Company back Limited 21,662 6,498 15,164 15,164 Transfer to own Pak Gulf Leasing Company asset Limited Land 8,336 - 8,336 10,080 Negotiation Mr. Mehmood Ahmed Motor vehicles 3,787 - 3,787 3,787 Sales & Lease Orix Leasing Pakistan back Limited 1,759 1,759 - 600 Negotiation 1,900 1,900 - 1,600 Negotiation 6,763 2,145 4,618 4,557 Transfer to own Orix Leasing Pakistan asset Limited 942 279 663 562 Company Scheme Mr. Hussain Babar 1,614 560 1,054 1,361 Insurance Claim EFU General Insurance Others 614 194 420 431 Various Various 2014 117,837 14,437 103,400 107,005 2013 105,215 42,522 62,693 89,785
Rupees in ‘000 Note 2014 2013
14. INTANGIBLE ASSETS
Net carrying value as at 1 July Net book value as at 1 July 13,645 1,617 Additions 5,674 14,457 Amortization 14.1 (5,288) (2,429) Net book value as at 30 June 14.2 14,031 13,645 Gross carrying value as at 30 June Cost 65,909 60,232 Accumulated amortization (49,238) (43,947) Accumulated impairment (2,640) (2,640) Net book value 14,031 13,645
Amortization rate (% per annum) 33.33 33.33 14.1 The amortization charge for the year has been allocated to administrative expenses (Note 33). 14.2 Intangible assets as at 30 June 2014 include items having an aggregate cost of Rs. 43.139 million (2013: Rs.
43.099 million) that have been fully amortized and are still in use of the Company.
NOTES TO THE UNCONSOLIDATED FINANCIAL STATEMENTSFor the year ended 30 June 2014

101Unconsolidated Financial Statements 2014
15. INVESTMENT PROPERTY
Description Note Leasehold Buildings on Office Total land and leasehold premises Rupees in ‘000 improvements land Net carrying value as at 1 July 2013 Opening net book value (NBV) 3,773 15,854 11,641 31,268 Depreciation charge 15.1 (238) (1,080) (2,815) (4,133) Balance as at 30 June 2014 (NBV) 15.2 3,535 14,774 8,826 27,135 Gross carrying value as at 30 June 2014 Cost 4,609 21,608 29,655 55,872 Accumulated depreciation (1,074) (6,834) (20,829) (28,737) Net book value 3,535 14,774 8,826 27,135 Net carrying value as at 1 July 2012 Opening net book value (NBV) 4,011 16,936 14,685 35,632 Depreciation charge (238) (1,082) (3,044) (4,364) Balance as at 30 June 2013 (NBV) 3,773 15,854 11,641 31,268 Gross carrying value as at 30 June 2013 Cost 4,609 21,608 29,655 55,872 Accumulated depreciation (836) (5,754) (18,014) (24,604) Net book value 3,773 15,854 11,641 31,268 Depreciation rate (% per annum) 1 & 10 5 10 - 20 15.1 Depreciation charged for the year has been allocated to administrative expenses. 15.2 Fair value of the investment property based on recent valuation is Rs. 170.806 million (2013: Rs. 146.125
million). Rupees in ‘000 Note 2014 2013
16. LONG TERM INVESTMENTS
Subsidiary companies - at cost 16.1 964,770 504,871 - share deposit money Crescent Hadeed (Private) Limited – 10,000 CS Capital (Private) Limited 16.1.5 35,000 – Shakarganj Energy (Private) Limited 16.1.5 358,039 – Associated companies - at cost 16.2 851,428 896,704 Other long term investments 16.3 178,946 178,946 2,388,183 1,590,521
NOTES TO THE UNCONSOLIDATED FINANCIAL STATEMENTSFor the year ended 30 June 2014

102 Crescent Steel and Allied Products Limited
16.1 Subsidiary companies - at cost
2014 2013 Note 2014 2013 Number of shares Rupees in ‘000 Unquoted 50,000,000 33,010,000 Shakarganj Energy (Private) Limited 16.1.1 500,000 330,100 (Chief Executive Officer - Mr. Muhammad Saad Thaniana) 37,476,995 17,476,995 CS Capital (Private) Limited 16.1.2 374,770 174,770 (Chief Executive Officer - Ms. Hajerah Ahsan Saleem) 9,000,000 100 Crescent Hadeed (Private) Limited 16.1.3 90,000 1 (Chief Executive Officer - Mr. Iqbal Zafar Siddiqui) 2 2 Crescent Continental Gas Pipelines Limited (US $ 1 each) 16.1.4 - - 964,770 504,871
16.1.1 This represents the Company’s investment in 100% ordinary shares of Shakarganj Energy (Private) Limited. The Company has acquired Shakarganj Energy (Private) Limited on 4 January 2010. During the year, the Company has further subscribed right issues offered on various dates by the investee company aggregating 16.990 million ordinary shares for Rs. 169.900 million, making a total holding of 50 million ordinary shares as at 30 June 2014.
16.1.2 This represents the Company’s investment in 100% ordinary shares of CS Capital (Private) Limited. The Company has acquired CS Capital (Private) Limited on 26 September 2011. During the year, the Company has further subscribed right issues offered on various date by the investee company aggregating 20 million ordinary shares for Rs. 200 million, making a total holding of 37.477 million ordinary shares as at 30 June 2014.
16.1.3 This represents the Company’s investment in 100% ordinary shares of Crescent Hadeed (Private) Limited which was incorporated on 15 May 2013. During the year, the Company has further subscribed right issues offered on various date by the investee company aggregating 8.999 million ordinary shares for Rs. 89.999 million, making a total holding of 9 million ordinary shares as at 30 June 2014.
16.1.4 This represents investment in subsidiary of Rs. 90 only. The subsidiary company has not commenced operation and accordingly no financial statements have been prepared.
16.1.5 This represents share deposit money of Rs. 35 million against right shares of CS Capital (Private) Limited and
358.039 million against right shares of Shakarganj Energy (Private) Limited (refer note 17.1).
16.2 Associated companies - at cost
2014 2013 Note 2014 2013 Number of shares Rupees in ‘000 Quoted 60,475,416 60,475,416 Altern Energy Limited 16.2.1 593,488 593,488 (Chief Executive Officer - Mr. Taimur Dawood) 15,244,665 15,244,665 Shakarganj Mills Limited 388,562 388,562 (Chief Executive Officer - Mr. Ahsan M. Saleem) 982,050 982,050 Less: Provision for impairment 16.2.2 130,622 85,346 851,428 896,704
NOTES TO THE UNCONSOLIDATED FINANCIAL STATEMENTSFor the year ended 30 June 2014

103Unconsolidated Financial Statements 2014
16.2.1 The Company directly holds 16.64% shareholding in Altern Energy Limited and there is no common directorship in the investee company. However, the Company directly and / or indirectly has significant influence as per the requirements of IAS 28 ‘Investments in Associates’, therefore it has been treated as an accociate as per IAS 28.
16.2.2 This represents provision for diminution in the value of investments of ordinary shares of Shakarganj Mills Limited. During the year, a further provision amounting to Rs. 45.276 million has been made.
Rupees in ‘000 Note 2014 2013
16.2.3 Market value of investments in associates is as follows :
Quoted Altern Energy Limited 1,301,431 747,476 Shakarganj Mills Limited 257,940 333,248 1,559,371 1,080,724
Percentage of holding 2014 2013
16.2.4 Percentage of holding of equity in associates is as follows :
Quoted Altern Energy Limited 16.64 16.64 Shakarganj Mills Limited 21.93 21.93
Rupees in ‘000 2014 2013
16.3 Other long term investments
Investments in related parties Available for sale 16.3.1 – – Other investments Available for sale 16.3.4 178,946 178,946 178,946 178,946 16.3.1 Available for sale
2014 2013 2014 2013 Number of shares Rupees in ‘000
Unquoted 2,403,725 2,403,725 Crescent Bahuman Limited 16.3.2 24,037 24,037 1,470,000 1,470,000 Crescent Industrial Chemicals Limited 16.3.3 10,470 10,470 34,507 34,507 Less: Provision for impairment 34,507 34,507 – –
NOTES TO THE UNCONSOLIDATED FINANCIAL STATEMENTSFor the year ended 30 June 2014

104 Crescent Steel and Allied Products Limited
16.3.2 The chief executive of Crescent Bahuman Limited is Mr. Nasir Shafi. The break-up value of shares of the investee company is Rs. Nil per share (2013: Rs. Nil per share), calculated on the basis of audited annual financial statements for the year ended 30 June 2013.
16.3.3 The chief executive of Crescent Industrial Chemicals Limited is Mr. Tariq Shafi. The investee company’s break-up ue of shares could not be ascertained as the financial statements of the investee company are not available.
16.3.4 Available for sale
2014 2013 2014 2013 Number of shares Note Rupees in ‘000
Unquoted 1,852,500 1,852,500 Central Depository Company of Pakistan Limited (CDC) 58,946 58,946 12,000,000 12,000,000 Shakarganj Food Products Limited 16.3.4.1 120,000 120,000 178,946 178,946
16.3.4.1 The Company has assessed the recoverable amount of investment in Shakarganj Food Products Limited based on value in use calculation. This calculation has been made on discounted cash flow methodology which assumes gross profit margin of 13.59% - 14.70%, EBITDA of 3.98% - 5.05%, terminal growth rate of 3% and discount rate of approximately 18.95%. Based on valuation the recoverable amount exceeds the carrying amount and accordingly, no impairment is required.
Rupees in ‘000 Note 2014 2013
17. LONG TERM LOANS AND DEPOSITS
Long term loan - Considered good (Unsecured) - to subsidiary company 17.1 – 349,444 Security deposits - leasing companies 13,552 7,327 Security deposits - others 17.2 12,617 12,617
26,169 369,388 17.1 This represents long term loan to the wholly owned subsidiary company namely; Shakarganj Energy (Private)
Limited. The approved limit as per agreement of long term loan was Rs. 385 million. During the year, the Company agreed to convert the outstanding balance of this long term loan amounting to Rs. 358.059 million into ordinary shares of Rs. 10 each of the subsidiary company which have been approved by the Board and as per approval of the Board markup has been stopped since 1 April 2014. Therefore, the outstanding balance of this long term loan has been reclassified and treated as advance against issue of share capital in these unconsolidated financial statements.
The effective mark-up charged during the year was 11.45% to 12.59% (2013: 11.58% to 14.49%) per annum.
17.2 This includes demand drafts of Rs. 3.420 million (2013: Rs. 3.420 million) provided to the Secretary Ministry of
Commerce as explained in note no. 12.1.
NOTES TO THE UNCONSOLIDATED FINANCIAL STATEMENTSFor the year ended 30 June 2014

105Unconsolidated Financial Statements 2014
2014 2013 Rupees in ‘000 Note (Restated)
18. DEFERRED TAXATION Deferred tax (debits) / credits arising in respect of :
Taxable temporary differences Accelerated tax depreciation / amortization 27,178 28,951 Finance lease obligations 12,341 10,284 Effect of change in IAS-19 (revised) Employee Benefits - Defined Benefit Plan 36,767 39,764 Unrealized gain on held for trading investments 6,649 – 82,935 78,999 Deductible temporary differences Provision for slow moving stores, spares and loose tools (24,464) (21,539) Provisions for doubtful trade debts, doubtful advances and others (31,289) (35,481) Provisions for impairment of fixed assets (7,217) (7,010) Provision of Gas Infrastructure Development Cess (1,183) – Provision for diminution in the value of investments (9,058) (8,798) (73,211) (72,828) 9,724 6,171 18.1 Break up of deferred tax charge / (reversal) is as following: Profit and loss 6,551 20,987 Other comprehensive income (2,998) (35,552) 3,553 (14,565)
19. STORES, SPARES AND LOOSE TOOLS Stores - steel segment 7,735 9,870 Spare parts - steel segment 55,512 50,185 Loose tools - steel segment 1,135 1,193 Stores and spares - cotton segment 53,388 56,657 117,770 117,905 Less: Provision for slow moving items 19.1 45,814 39,266 71,956 78,639 19.1 Movement in provision for slow moving items Opening balance 39,266 38,554 Provision made during the year 6,548 1,277 Reversal of provision made during the year – (565) Closing balance 45,814 39,266
NOTES TO THE UNCONSOLIDATED FINANCIAL STATEMENTSFor the year ended 30 June 2014

106 Crescent Steel and Allied Products Limited
Rupees in ‘000 Note 2014 2013
20. STOCK-IN-TRADE Raw materials Hot rolled steel coils (HR Coil) 19,823 11,142 Coating materials 20.1 88,798 103,232 Others 15,246 16,762 Raw cotton 20.1 144,193 313,503 Stock-in-transit (HR Coil) 19,401 – 20.2 287,461 444,639 Work-in-process 20.3 & 30.1 42,007 17,574 Finished goods 20.2 & 30.1 71,054 196,283 Scrap / cotton waste 6,677 3,923 119,738 217,780 407,199 662,419 20.1 This includes raw cotton amounting to Rs. Nil (2013: Rs. 132.475 million) pledged as security with financial
institutions. 20.2 Stock-in-trade as at 30 June 2014 includes items valued at net realisable value (NRV) as follows. The write down
to NRV amounting to Rs. 9.936 million (2013: Rs. 51.626 million) has been recognized in cost of goods sold.
Rupees in ‘000 Cost NRV Finished goods 79,557 71,054 Raw material 288,894 287,461 368,451 358,515 20.3 Work in Process include Rs.13.801 million (2013: Nil) which is held with third parties for the purpose of conversion
of yarn into Fabric.
Rupees in ‘000 Note 2014 2013
21. TRADE DEBTS Secured Considered good 72,110 36,605 Unsecured Considered good 17,369 160,252 Considered doubtful 2,786 13,701 Provision for doubtful trade debts 21.1 (2,786) (13,701) 17,369 160,252 89,479 196,857 21.1 Movement in provision for doubtful trade debts Opening balance 13,701 1,139 Provision made during the year – 12,662 Reversal of provision made during the year (10,915) (100) Closing balance 2,786 13,701
NOTES TO THE UNCONSOLIDATED FINANCIAL STATEMENTSFor the year ended 30 June 2014
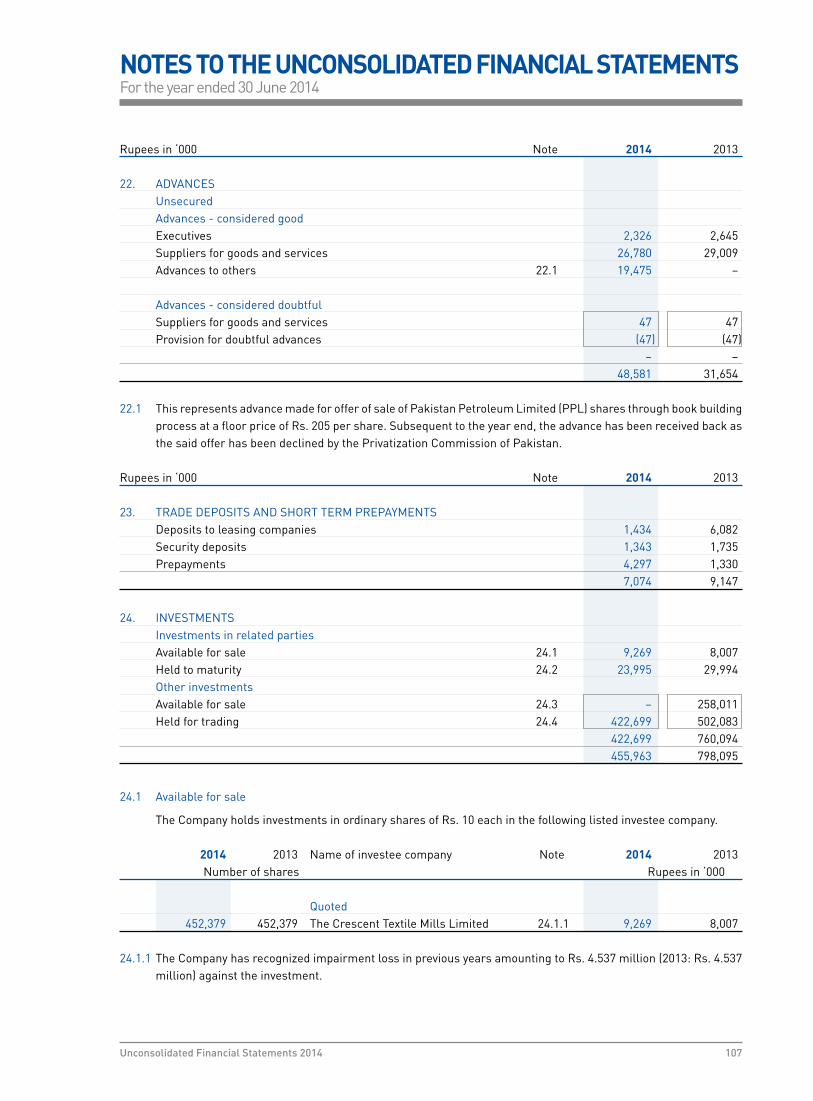
107Unconsolidated Financial Statements 2014
Rupees in ‘000 Note 2014 2013
22. ADVANCES Unsecured Advances - considered good Executives 2,326 2,645 Suppliers for goods and services 26,780 29,009 Advances to others 22.1 19,475 – Advances - considered doubtful Suppliers for goods and services 47 47 Provision for doubtful advances (47) (47) – – 48,581 31,654 22.1 This represents advance made for offer of sale of Pakistan Petroleum Limited (PPL) shares through book building
process at a floor price of Rs. 205 per share. Subsequent to the year end, the advance has been received back as the said offer has been declined by the Privatization Commission of Pakistan.
Rupees in ‘000 Note 2014 2013 23. TRADE DEPOSITS AND SHORT TERM PREPAYMENTS Deposits to leasing companies 1,434 6,082 Security deposits 1,343 1,735 Prepayments 4,297 1,330 7,074 9,147
24. INVESTMENTS Investments in related parties Available for sale 24.1 9,269 8,007 Held to maturity 24.2 23,995 29,994 Other investments Available for sale 24.3 – 258,011 Held for trading 24.4 422,699 502,083 422,699 760,094 455,963 798,095
24.1 Available for sale
The Company holds investments in ordinary shares of Rs. 10 each in the following listed investee company. 2014 2013 Name of investee company Note 2014 2013 Number of shares Rupees in ‘000
Quoted 452,379 452,379 The Crescent Textile Mills Limited 24.1.1 9,269 8,007 24.1.1 The Company has recognized impairment loss in previous years amounting to Rs. 4.537 million (2013: Rs. 4.537
million) against the investment.
NOTES TO THE UNCONSOLIDATED FINANCIAL STATEMENTSFor the year ended 30 June 2014

108 Crescent Steel and Allied Products Limited
24.2 This represents 2,999,396 (2013: 2,999,396) preference shares of Rs. 10 each of Shakarganj Mills Limited, a related party, issued in October 2004. These shares carry dividend rate of 8.5% per annum payable annually and were due for redemption in October 2009. The preference shares are convertible into ordinary shares of Rs. 10 each. The conversion option is exercisable at the end of every financial year of the investee company.
The Company does not intend to exercise the option to convert the preference shares into ordinary shares as
mentioned above. Aggregate provision of Rs. 11.105 million (2013: Rs. 5.106 million) has been recognized against the exposure as the balance amount is considered to be recovered in due course of time.
The fair value of preference shares as at 30 June 2014 amounts to Rs. 23.995 million (2013: Rs. 29.994 million). 24.3 Available for sale
The Company holds investments in ordinary shares of Rs. 10 each in the following listed investee companies 2014 2013 Name of investee company Note 2014 2013 (Number of share / certificates) Rupees in ‘000
Quoted – 9,060,000 Asian Stocks Fund Limited – 94,677 91,300 91,300 Crescent Jute Products Limited 24.3.1 – – 1,996 1,996 Innovative Investment Bank Limited – – 26,490 26,490 Jubilee Spinning and Weaving Mills Limited 24.3.2 – – – 7,944,263 Safeway Mutual Fund Limited – 163,334 – 258,011
24.3.1 The investment in Crescent Jute Products Limited is carried at break-up value, which is Rs. Nil per share (2013: Rs. Nil) [break-up value including surplus on revaluation of property, plant and equipment Rs. Nil (Rs. Nil per share based on audited financial statements for the year ended 30 June 2013)], calculated on the basis of the unaudited condensed interim financial information for the nine months ended 31 March 2014.
24.3.2 Investment in Jubilee Spinning and Weaving Mills Limited is carried at Rs. Nil per share (2013: Rs. Nil). The
break-up value of shares of the investee company is Rs. Nil per share (2013: Rs. Nil) [break-up value including surplus on revaluation of property, plant and equipment and investment property Rs. 15.91 per share (2013 : Rs. 16.49 per share)], calculated on the basis of the unaudited condensed interim financial information for the nine months ended 31 March 2014.
24.3.3 Investments having an aggregate market value of Rs. 727.980 million (2013: Rs. 909.398 million) have been pledged with financial institutions as security against financing facilities (see note 11.4) out of which Rs. 570.280 million (2013: Rs. 664.659 million) relates to long term investments.
NOTES TO THE UNCONSOLIDATED FINANCIAL STATEMENTSFor the year ended 30 June 2014

109Unconsolidated Financial Statements 2014
24.4 Held for trading The Company holds investments in ordinary shares of listed companies and certificates of close end mutual
funds. Details are as follows. The face value of the shares is Rs. 10 per share unless otherwise stated. 2014 2013 Name of investee company Note 2014 2013 (Number of share / certificates) Rupees in ‘000
41,466 – Adamjee Insurance Company Limited 1,898 – 165,859 165,859 Agriauto Industries Limited * 16,005 12,461 – 56,507 Al-Ghazi Tractors Limited * – 11,556 40,000 – Avanceon Limited 971 – 51,000 – Century Insurance Company Limited 837 – 55,000 – Cherat Cement Company Limited 3,600 – 933,000 1,402,500 D.G. Khan Cement Company Limited 82,067 117,375 10,000 50,000 Engro Corporation Limited 1,785 6,094 4,000 – Engro Fertilizer Limited 229 – 85,000 – Fatima Fertilizer Company Limited 2,465 – 182,500 150,000 Fauji Fertilizer Bin Qasim Limited 7,258 5,631 55,000 55,000 Fauji Fertilizer Company Limited 6,174 5,909 20,000 – IGI Insurance Limited 4,554 – 1,350 1,350 Innovative Investment Bank Limited – – 90,000 90,000 International Industries Limited 4,450 4,060 – 68,801 International Steels Limited – 1,217 87,500 – K-Electric Limited 743 – 100,000 100,000 Kohinoor Energy Limited 4,142 3,750 60,000 – Kohat Cement Limited 7,669 – 10,000 – Maple Leaf Cement Limited 301 – – 350,000 Nishat Mills Limited – 32,974 200,000 – Nishat Power Limited 7,116 – 50,000 30,000 Oil and Gas Development Company Limited 13,064 6,862 170,000 50,000 Pak Suzuki Motor Company Limited 46,561 7,436 100,000 100,000 Pakgen Power Limited 1,804 2,453 78,000 50,000 Pakistan Oilfields Limited 44,795 24,869 330,000 391,560 Pakistan Petroleum Limited 74,032 82,846 24,500 239,368 Pakistan State Oil Company Limited 9,527 76,689 130,000 130,000 Pakistan Telecommunication Company Limited 3,311 2,885 1,285,719 1,285,719 PICIC Growth Fund 40,809 31,050 501,173 501,173 PICIC Investment Fund 7,117 5,743 14,000 – Pioneer Cement Limited 653 – – 8,329,764 Samba Bank Limited – 21,407 3,906 3,125 Shell Pakistan Limited 1,079 447 100,000 – Telecard Limited 412 – 440,376 622,376 The Hub Power Company Limited 25,868 38,369 100,000 – TRG Pakistan Limited 1,403 – 422,699 502,083 * The face value of these ordinary shares / certificate is Rs. 5 per share.
NOTES TO THE UNCONSOLIDATED FINANCIAL STATEMENTSFor the year ended 30 June 2014
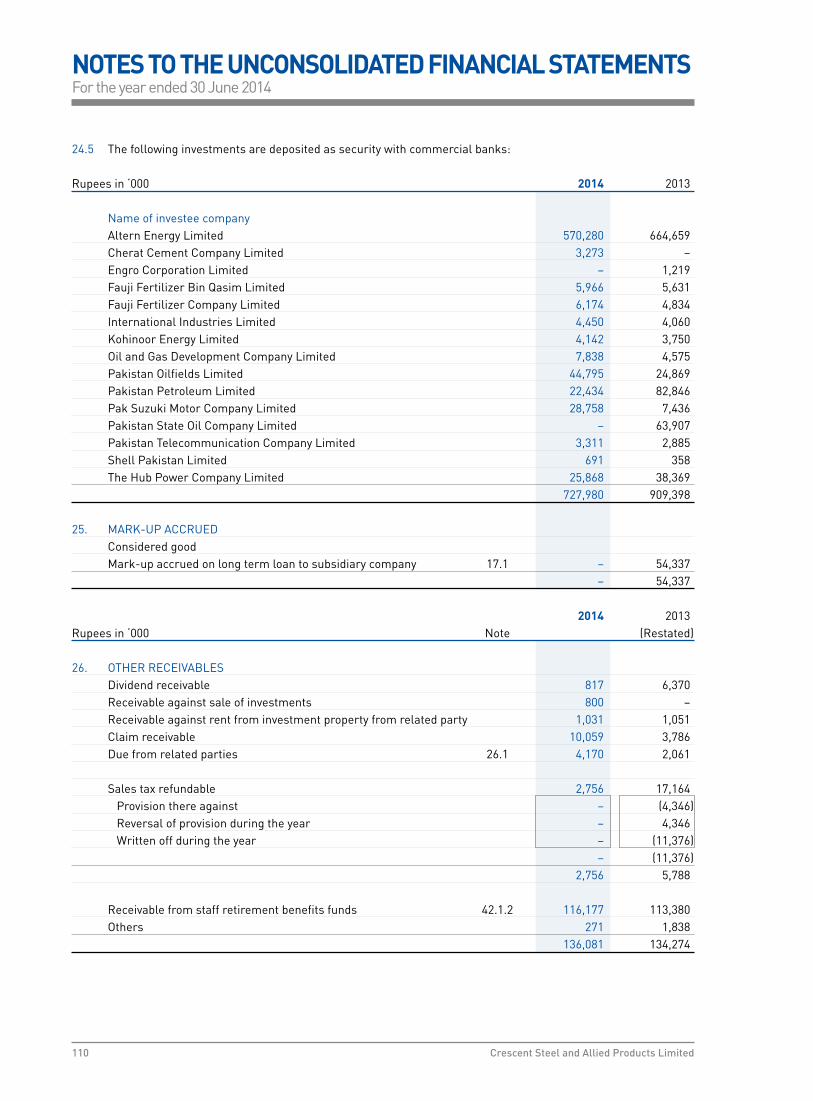
110 Crescent Steel and Allied Products Limited
24.5 The following investments are deposited as security with commercial banks: Rupees in ‘000 2014 2013
Name of investee company Altern Energy Limited 570,280 664,659 Cherat Cement Company Limited 3,273 – Engro Corporation Limited – 1,219 Fauji Fertilizer Bin Qasim Limited 5,966 5,631 Fauji Fertilizer Company Limited 6,174 4,834 International Industries Limited 4,450 4,060 Kohinoor Energy Limited 4,142 3,750 Oil and Gas Development Company Limited 7,838 4,575 Pakistan Oilfields Limited 44,795 24,869 Pakistan Petroleum Limited 22,434 82,846 Pak Suzuki Motor Company Limited 28,758 7,436 Pakistan State Oil Company Limited – 63,907 Pakistan Telecommunication Company Limited 3,311 2,885 Shell Pakistan Limited 691 358 The Hub Power Company Limited 25,868 38,369 727,980 909,398 25. MARK-UP ACCRUED Considered good Mark-up accrued on long term loan to subsidiary company 17.1 – 54,337 – 54,337
2014 2013 Rupees in ‘000 Note (Restated)
26. OTHER RECEIVABLES Dividend receivable 817 6,370 Receivable against sale of investments 800 – Receivable against rent from investment property from related party 1,031 1,051 Claim receivable 10,059 3,786 Due from related parties 26.1 4,170 2,061 Sales tax refundable 2,756 17,164 Provision there against – (4,346) Reversal of provision during the year – 4,346 Written off during the year – (11,376) – (11,376) 2,756 5,788
Receivable from staff retirement benefits funds 42.1.2 116,177 113,380 Others 271 1,838 136,081 134,274
NOTES TO THE UNCONSOLIDATED FINANCIAL STATEMENTSFor the year ended 30 June 2014

111Unconsolidated Financial Statements 2014
Rupees in ‘000 2014 2013
26.1 Due from related parties Crescent Jute Products Limited 118 – Shakarganj Mills Limited 127 226 CS Capital (Private) Limited 108 – Shakarganj Energy (Private) Limited 301 – Crescent Hadeed (Private) Limited 3,516 1,835 4,170 2,061 27. TAXATION - NET Advance taxation 1,572,323 1,451,387 Provision for taxation (1,413,504) (1,375,957) 158,819 75,430 27.1 The Income Tax assessments of the Company have been finalized up to and including tax year 2003, except
for pending appeal effect orders in respect of assessment years 2001-2002 and 2002-2003. Tax returns of subsequent tax years, except for certain tax years, are deemed to be assessed under section 120 of the Income Tax Ordinance, 2001 unless selected for an amendment / audit by the taxation authorities. Deemed assessments for certain tax years were amended by the department and currently appeals in respect of these tax years are pending before the Appellate Tribunal Inland Revenue. Additional tax liability of Rs. 109.277 million may arise against the above mentioned assessments in case decisions are made against the Company.
Full provision has been made in these financial statements up to tax year 2013 except for short credit of taxes
paid & deducted at source, and adjustments of refunds in respect of the said Assessment / Tax years. However, additional provision has not been made in these financial statements in respect of certain tax years as mentioned above, since based on the tax consultant’s opinion the management is confident of favourable outcome of these appeals.
During the current year, order under section 161/205 of the Income Tax Ordinance, 2001 relating to monitoring of withholding taxes has been issued for the tax year 2010 where by demand aggregating to Rs. 61.953 million has been raised, the appeal against which is pending before the Commissioner Inland Revenue (Appeals). No provision has been made in these financial statements as management is of the view that the demand is frivolous based on tax consultant’s opinion favourable outcome is expected.
Rupees in ‘000 Note 2014 2013
28. CASH AND BANK BALANCES With banks - In saving account - local currency 28.1 35,461 9,894 - foreign currency 2 2 35,463 9,896
- In current accounts 69,793 50,506 Cash in hand 1,990 4,818 107,246 65,220 28.1 These carry profit at the rate 5% to 7.25% (2013: 5% to 7.25%).
NOTES TO THE UNCONSOLIDATED FINANCIAL STATEMENTSFor the year ended 30 June 2014

112 Crescent Steel and Allied Products Limited
Rupees in ‘000 2014 2013
29. SALES - NET Local sales Bare pipes (own product excluding coating revenue) 1,385,656 1,522,072 Revenue from conversion 13,645 9,839 Coating of pipes 53,434 644,859 Cotton yarn / raw cotton 2,533,891 2,537,542 Others (including pipes laboratory testing) 20,359 60,983 Scrap / waste 65,291 83,709 Sales returns (30,529) (28,607) 4,041,747 4,830,397 Export sales Cotton yarn 252,578 498,698 4,294,325 5,329,095 Sales tax (262,755) (327,428) 4,031,570 5,001,667 30. COST OF SALES Steel segment 30.1 1,038,766 1,500,309 Cotton segment 30.1 2,762,502 2,850,499 3,801,268 4,350,808
30.1 Cost of sales Steel segment Cotton Segment Total 2014 2013 2014 2013 2014 2013Rupees in ‘000 Note (Restated) (Restated) (Restated)
Raw materials consumed 846,570 1,158,021 1,891,841 2,007,209 2,738,411 3,165,230 Cost of raw cotton sold – – 122,261 321,549 122,261 321,549 Packing materials consumed – – 24,568 25,137 24,568 25,137 Outside Conversion charges – – 171,161 241,067 171,161 241,067 Store and spares consumed 35,845 35,466 29,680 49,095 65,525 84,561 Fuel, power and electricity 26,253 43,507 192,343 153,839 218,596 197,346 Salaries, wages and other benefits 30.2 75,328 80,985 99,520 92,997 174,848 173,982 Insurance 1,780 1,552 2,962 3,770 4,742 5,322 Repairs and maintenance 7,319 3,884 2,875 19,428 10,194 23,312 Depreciation 13.1.1 23,698 18,821 58,582 60,433 82,280 79,254 Stock-in-trade written down to NRV 20.2 7,508 45,645 2,428 5,981 9,936 51,626 Other expenses 53,443 57,142 24,507 15,753 77,950 72,895 1,077,744 1,445,023 2,622,728 2,996,258 3,700,472 4,441,281 Opening stock of work-in-process 20 3,661 13,089 13,913 9,179 17,574 22,268 Closing stock of work-in-process (10,153) (3,661) (31,854) (13,913) (42,007) (17,574) (6,492) 9,428 (17,941) (4,734) (24,433) 4,694 Cost of goods manufactured 1,071,252 1,454,451 2,604,787 2,991,524 3,676,039 4,445,975 Opening stock of finished goods 20 22,580 68,438 173,703 32,678 196,283 101,116 Closing stock of finished goods (55,066) (22,580) (15,988) (173,703) (71,054) (196,283) (32,486) 45,858 157,715 (141,025) 125,229 (95,167) 1,038,766 1,500,309 2,762,502 2,850,499 3,801,268 4,350,808
NOTES TO THE UNCONSOLIDATED FINANCIAL STATEMENTSFor the year ended 30 June 2014

113Unconsolidated Financial Statements 2014
30.2 Detail of salaries, wages and other benefits
Steel segment Cotton Segment Total 2014 2013 2014 2013 2014 2013Rupees in ‘000 Note (Restated) (Restated) (Restated) Salaries, wages and other benefits 72,749 74,994 97,539 90,569 170,288 165,563 Gratuity fund 30.3 (91) 796 (7) 31 (98) 827 Pension fund 30.3 344 3,013 122 753 466 3,766 Provident fund contributions 2,326 2,182 1,866 1,644 4,192 3,826 75,328 80,985 99,520 92,997 174,848 173,982
2014 2013 Pension Gratuity Pension GratuityRupees in ‘000 (Restated)
30.3 Staff retirement benefits Current service costs 4,168 1,109 4,158 1,014 Interest costs 8,592 2,014 9,285 2,118 Return on plan assets, excluding interest income (12,294) (3,221) (9,677) (2,305) 466 (98) 3,766 827
Rupees in ‘000 Note 2014 2013
31. INCOME FROM INVESTMENTS Return on UBL’s Term Finance Certificates – 76 Dividend income 97,617 60,335 Gain on sale of investments - net 282,397 90,185 Unrealized gains on held for trading investments 48,689 137,023 Rent from investment property 31.1 11,429 10,780 440,132 298,399 31.1 Direct operating expenses incurred against rental income from investment property amounted to Rs. 4.331
million (2013: Rs. 3.657 million). Further Rs. 1.293 million (2013: Rs. 1.209 million) were incurred against the non rented out area.
32. DISTRIBUTION AND SELLING EXPENSES Steel segment Cotton Segment Total 2014 2013 2014 2013 2014 2013Rupees in ‘000 Note (Restated) (Restated) (Restated) Salaries, wages and other benefits 32.1 8,026 6,785 4,334 3,934 12,360 10,719 Commission – – 23,100 27,675 23,100 27,675 Travelling, conveyance and entertainment 472 450 192 1,244 664 1,694 Depreciation 13.1.1 852 622 – 1 852 623 Insurance 156 181 20 18 176 199 Postage, telephone and telegram 202 105 214 231 416 336 Advertisement 3,039 1,242 – 135 3,039 1,377 Bid bond expenses 902 644 – – 902 644 Legal and professional charges 1,138 2,154 11 126 1,149 2,280 Others 810 947 8,604 21,571 9,414 22,518 15,597 13,130 36,475 54,935 52,072 68,065
NOTES TO THE UNCONSOLIDATED FINANCIAL STATEMENTSFor the year ended 30 June 2014

114 Crescent Steel and Allied Products Limited
32.1 Detail of salaries, wages and other benefits Steel segment Cotton Segment Total 2014 2013 2014 2013 2014 2013Rupees in ‘000 Note (Restated) (Restated) (Restated) Salaries, wages and other benefits 7,711 5,841 4,319 3,929 12,030 9,770 Gratuity fund 32.2 (16) 136 – – (16) 136 Pension fund 32.2 65 559 – – 65 559 Provident fund contributions 266 249 15 5 281 254 8,026 6,785 4,334 3,934 12,360 10,719
2014 2013 Rupees in ‘000 Pension Gratuity Pension Gratuity (Restated)
32.2 Staff retirement benefits Current service costs 581 181 617 167 Interest costs 1,199 329 1,378 350 Return on plan assets, excluding interest income (1,715) (526) (1,436) (381) 65 (16) 559 136
33. ADMINISTRATIVE EXPENSES
Steel segment Cotton segment IID segment Total 2014 2013 2014 2013 2014 2013 2014 2013Rupees in ‘000 Note (Restated) (Restated) (Restated) (Restated)
Salaries, wages and other benefits 33.1 49,293 51,653 13,254 12,160 3,614 3,914 66,161 67,727 Rents, rates and taxes 2,442 2,643 3,031 624 1,080 376 6,553 3,643 Travelling, conveyance and entertainment 8,266 5,885 2,223 1,421 517 345 11,006 7,651 Fuel and power 9,153 7,831 831 1,148 475 421 10,459 9,400 Postage, telephone and telegram 2,433 1,786 776 511 149 91 3,358 2,388 Insurance 1,089 835 231 227 127 112 1,447 1,174 Repairs and maintenance 3,698 4,305 762 634 323 365 4,783 5,304 Auditors’ remuneration 33.3 1,089 1,069 250 439 117 120 1,456 1,628 Legal, professional and corporate service charges 7,672 8,410 1,363 1,804 1,989 1,811 11,024 12,025 Advertisement 64 90 7 9 3 3 74 102 Donations 33.4 11,369 26,772 10,272 7,232 634 1,146 22,275 35,150 Depreciation 13.1.1 & 15.1 5,623 7,129 1,299 1,066 4,456 4,645 11,378 12,840 Amortization of intangible assets 14.1 4,230 1,943 846 389 212 97 5,288 2,429 Printing, stationery and office supplies 3,634 3,597 856 774 269 328 4,759 4,699 Newspapers, subscriptions and periodicals 566 530 1,001 431 43 39 1,610 1,000 Others 2,261 4,308 568 1,096 651 495 3,480 5,899 112,882 128,786 37,570 29,965 14,659 14,308 165,111 173,059
33.1 Detail of salaries, wages and other benefits
Salaries, wages and other benefits 46,822 44,517 12,735 10,764 3,420 3,358 62,977 58,639 Gratuity 33.2 (120) 1,025 (23) 198 (10) 80 (153) 1,303 Pension fund 33.2 492 4,181 96 808 40 327 628 5,316 Provident fund contributions 2,099 1,930 446 390 164 149 2,709 2,469 49,293 51,653 13,254 12,160 3,614 3,914 66,161 67,727
NOTES TO THE UNCONSOLIDATED FINANCIAL STATEMENTSFor the year ended 30 June 2014

115Unconsolidated Financial Statements 2014
2014 2013 Pension Gratuity Pension GratuityRupees in ‘000 (Restated)
33.2 Staff retirement benefits Current service costs 5,618 1,732 5,870 1,598 Interest costs 11,578 3,144 13,106 3,338 Return on plan assets, excluding interest income (16,568) (5,029) (13,660) (3,633) 628 (153) 5,316 1,303
Rupees in ‘000 Note 2014 2013
33.3 Auditors’ remuneration Audit fee 33.3.1 1,284 1,200 Fee for audit of funds’ financial statements and other reports 20 220 Out of pocket expenses 152 208 1,456 1,628 33.3.1 Audit fee includes services for audit of annual separate and consolidated financial statements, limited review of
unconsolidated condensed interim financial information for the six months period, review report on statement of compliance with best practices of the Code of Corporate Governance and audit of reconciliation statement of nominee shareholding of Central Depository Company of Pakistan Limited.
33.4 Donations
Donations include the following in which a director is interested : Name of director Interest Name and address of the donee Amount donated in donee 2014 2013Rupees in ‘000 Mr. Ahsan M. Saleem Director The Citizens Foundation Plot No. 20, Sector - 14, Near Brookes Chowrangi, Korangi Industrial Area, Karachi. 19,820 26,580 Director Pakistan Centre for Philanthropy 1-A, Street 14, F-8/3, Islamabad. – 2,500 Managing Commecs Educational Trust Trustee Gulistan-e-Johar Block-13, Karachi. – 2,000 Chairman CSAP Foundation 10th Floor, BOP Tower, 10-B, Block E-2, Main Boulevard, Gulberg - III, Lahore. 285 1,945
20,105 33,025 33.4.1 Donations other than those mentioned above were not made to any donee in which a director or his spouse had
any interest at any time during the year.
NOTES TO THE UNCONSOLIDATED FINANCIAL STATEMENTSFor the year ended 30 June 2014
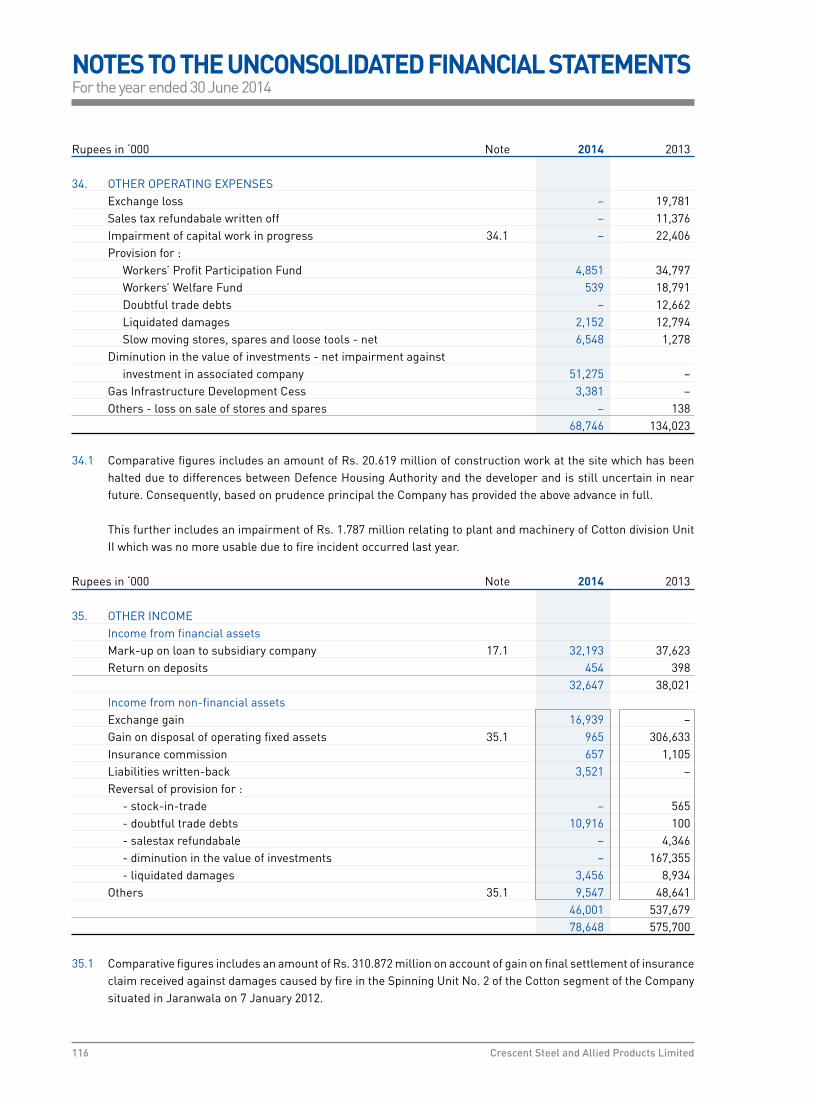
116 Crescent Steel and Allied Products Limited
Rupees in ‘000 Note 2014 2013
34. OTHER OPERATING EXPENSES Exchange loss – 19,781 Sales tax refundabale written off – 11,376 Impairment of capital work in progress 34.1 – 22,406 Provision for : Workers’ Profit Participation Fund 4,851 34,797 Workers’ Welfare Fund 539 18,791 Doubtful trade debts – 12,662 Liquidated damages 2,152 12,794 Slow moving stores, spares and loose tools - net 6,548 1,278 Diminution in the value of investments - net impairment against investment in associated company 51,275 – Gas Infrastructure Development Cess 3,381 – Others - loss on sale of stores and spares – 138 68,746 134,023 34.1 Comparative figures includes an amount of Rs. 20.619 million of construction work at the site which has been
halted due to differences between Defence Housing Authority and the developer and is still uncertain in near future. Consequently, based on prudence principal the Company has provided the above advance in full.
This further includes an impairment of Rs. 1.787 million relating to plant and machinery of Cotton division Unit
II which was no more usable due to fire incident occurred last year.
Rupees in ‘000 Note 2014 2013
35. OTHER INCOME Income from financial assets Mark-up on loan to subsidiary company 17.1 32,193 37,623 Return on deposits 454 398 32,647 38,021 Income from non-financial assets Exchange gain 16,939 – Gain on disposal of operating fixed assets 35.1 965 306,633 Insurance commission 657 1,105 Liabilities written-back 3,521 – Reversal of provision for : - stock-in-trade – 565 - doubtful trade debts 10,916 100 - salestax refundabale – 4,346 - diminution in the value of investments – 167,355 - liquidated damages 3,456 8,934 Others 35.1 9,547 48,641 46,001 537,679 78,648 575,700
35.1 Comparative figures includes an amount of Rs. 310.872 million on account of gain on final settlement of insurance claim received against damages caused by fire in the Spinning Unit No. 2 of the Cotton segment of the Company situated in Jaranwala on 7 January 2012.
NOTES TO THE UNCONSOLIDATED FINANCIAL STATEMENTSFor the year ended 30 June 2014

117Unconsolidated Financial Statements 2014
Rupees in ‘000 2014 2013
36. FINANCE COSTS Incurred on : - finance lease obligations 9,427 5,208 - running finances 38,354 36,433 - short term loans 30,719 15,126 - Workers’ Profit Participation Fund 1,387 2,222 Bank charges 4,259 3,914 84,146 62,903
2014 2013 Rupees in ‘000 (Restated) 37. TAXATION Current - for the year 15,059 299,572 - for prior years (2,791) (7,607) 12,268 291,965 Deferred 6,551 (20,987) 18,819 270,978 37.1 Relationship between taxation expense and accounting profit Profit before taxation 379,007 1,086,908 Tax at the applicable rate of 34% (2013: 35%) 128,862 380,418 Tax effect of inadmissible expenses / losses 3,536 (160,768) Tax effect of income taxed at a lower rate (114,040) (37,101) Reduction in tax rate – 988 Tax effect of operating fixed assets subject to insurance claim – 106,736 Prior year tax effect (2,791) (19,295) Tax effect of change in effective tax rate 3,252 – 18,819 270,978 38. BASIC AND DILUTED EARNINGS PER SHARE Profit after taxation 360,188 815,930
(Restated) (Number of shares)
Weighted average number of ordinary shares in issue during the year 62,105,993 62,105,993
Rupees Basic and diluted earnings per share 5.80 13.14
NOTES TO THE UNCONSOLIDATED FINANCIAL STATEMENTSFor the year ended 30 June 2014
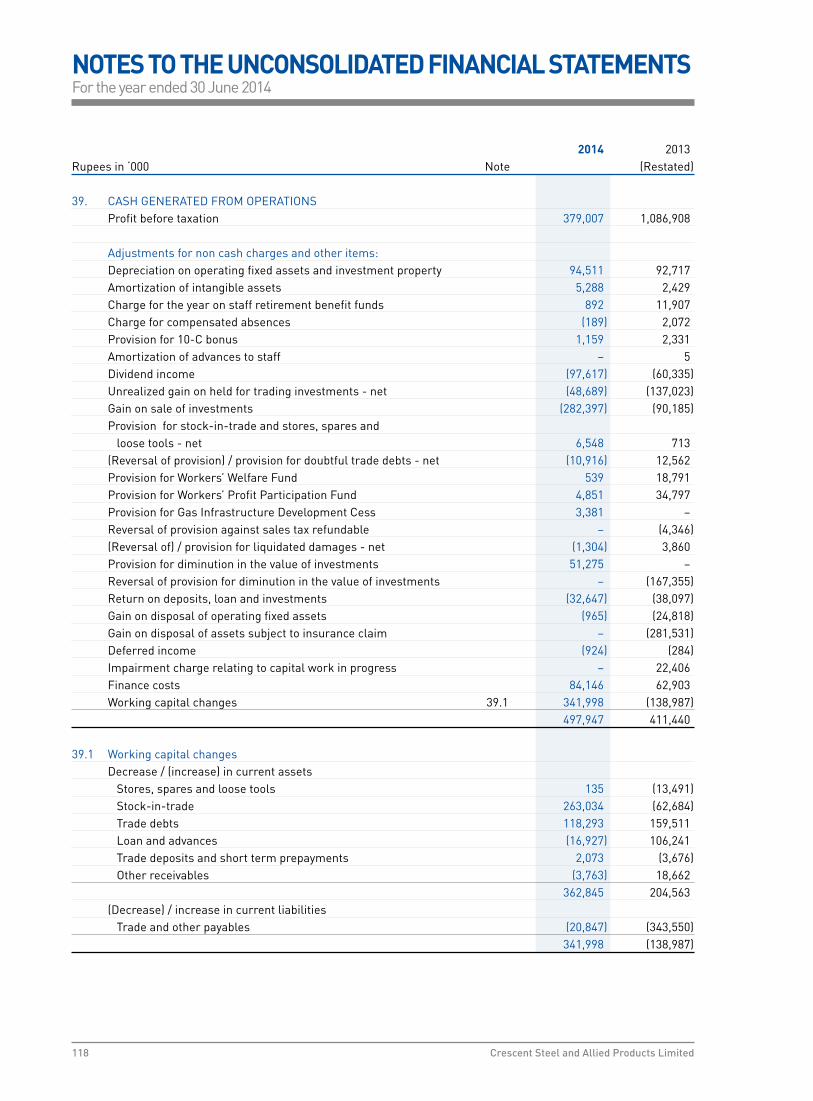
118 Crescent Steel and Allied Products Limited
2014 2013 Rupees in ‘000 Note (Restated)
39. CASH GENERATED FROM OPERATIONS Profit before taxation 379,007 1,086,908 Adjustments for non cash charges and other items: Depreciation on operating fixed assets and investment property 94,511 92,717 Amortization of intangible assets 5,288 2,429 Charge for the year on staff retirement benefit funds 892 11,907 Charge for compensated absences (189) 2,072 Provision for 10-C bonus 1,159 2,331 Amortization of advances to staff – 5 Dividend income (97,617) (60,335) Unrealized gain on held for trading investments - net (48,689) (137,023) Gain on sale of investments (282,397) (90,185) Provision for stock-in-trade and stores, spares and loose tools - net 6,548 713 (Reversal of provision) / provision for doubtful trade debts - net (10,916) 12,562 Provision for Workers’ Welfare Fund 539 18,791 Provision for Workers’ Profit Participation Fund 4,851 34,797 Provision for Gas Infrastructure Development Cess 3,381 – Reversal of provision against sales tax refundable – (4,346) (Reversal of) / provision for liquidated damages - net (1,304) 3,860 Provision for diminution in the value of investments 51,275 – Reversal of provision for diminution in the value of investments – (167,355) Return on deposits, loan and investments (32,647) (38,097) Gain on disposal of operating fixed assets (965) (24,818) Gain on disposal of assets subject to insurance claim – (281,531) Deferred income (924) (284) Impairment charge relating to capital work in progress – 22,406 Finance costs 84,146 62,903 Working capital changes 39.1 341,998 (138,987) 497,947 411,440 39.1 Working capital changes Decrease / (increase) in current assets Stores, spares and loose tools 135 (13,491) Stock-in-trade 263,034 (62,684) Trade debts 118,293 159,511 Loan and advances (16,927) 106,241 Trade deposits and short term prepayments 2,073 (3,676) Other receivables (3,763) 18,662 362,845 204,563 (Decrease) / increase in current liabilities Trade and other payables (20,847) (343,550) 341,998 (138,987)
NOTES TO THE UNCONSOLIDATED FINANCIAL STATEMENTSFor the year ended 30 June 2014
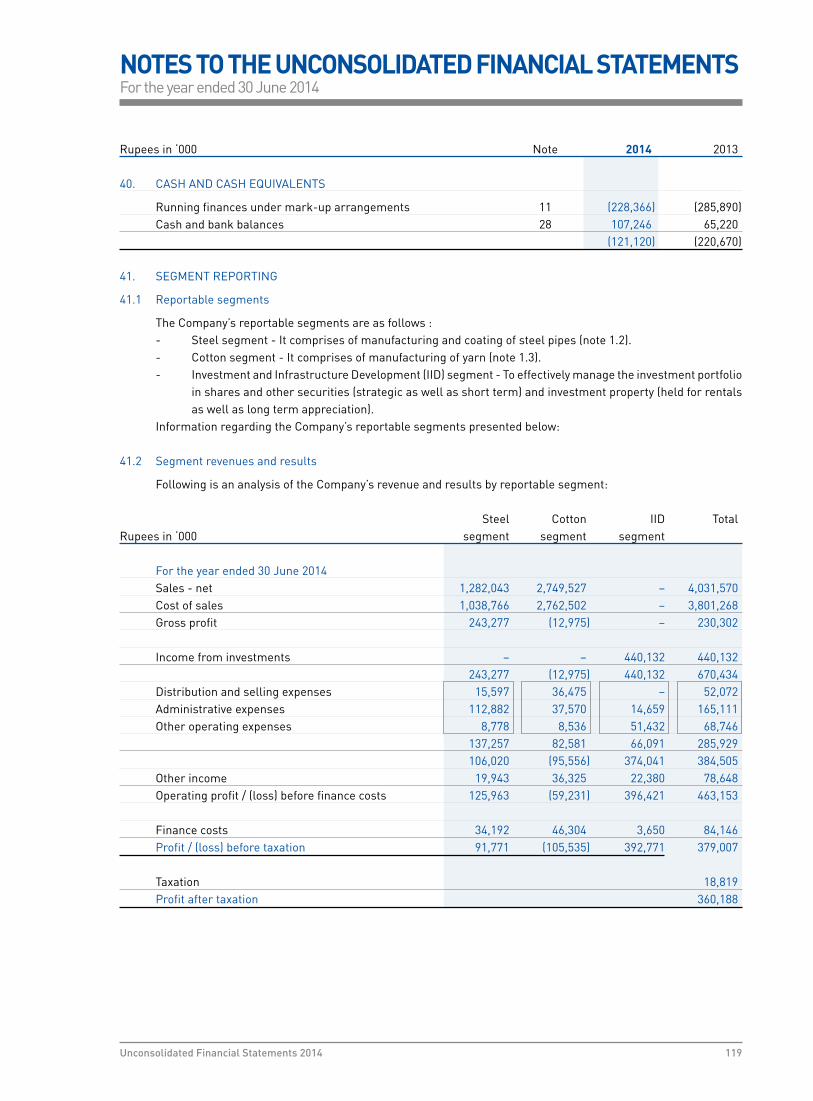
119Unconsolidated Financial Statements 2014
Rupees in ‘000 Note 2014 2013
40. CASH AND CASH EQUIVALENTS
Running finances under mark-up arrangements 11 (228,366) (285,890) Cash and bank balances 28 107,246 65,220 (121,120) (220,670)
41. SEGMENT REPORTING
41.1 Reportable segments
The Company’s reportable segments are as follows : - Steel segment - It comprises of manufacturing and coating of steel pipes (note 1.2). - Cotton segment - It comprises of manufacturing of yarn (note 1.3). - Investment and Infrastructure Development (IID) segment - To effectively manage the investment portfolio
in shares and other securities (strategic as well as short term) and investment property (held for rentals as well as long term appreciation).
Information regarding the Company’s reportable segments presented below:
41.2 Segment revenues and results
Following is an analysis of the Company’s revenue and results by reportable segment:
Steel Cotton IID TotalRupees in ‘000 segment segment segment For the year ended 30 June 2014 Sales - net 1,282,043 2,749,527 – 4,031,570 Cost of sales 1,038,766 2,762,502 – 3,801,268 Gross profit 243,277 (12,975) – 230,302 Income from investments – – 440,132 440,132 243,277 (12,975) 440,132 670,434 Distribution and selling expenses 15,597 36,475 – 52,072 Administrative expenses 112,882 37,570 14,659 165,111 Other operating expenses 8,778 8,536 51,432 68,746 137,257 82,581 66,091 285,929 106,020 (95,556) 374,041 384,505 Other income 19,943 36,325 22,380 78,648 Operating profit / (loss) before finance costs 125,963 (59,231) 396,421 463,153 Finance costs 34,192 46,304 3,650 84,146 Profit / (loss) before taxation 91,771 (105,535) 392,771 379,007 Taxation 18,819 Profit after taxation 360,188
NOTES TO THE UNCONSOLIDATED FINANCIAL STATEMENTSFor the year ended 30 June 2014

120 Crescent Steel and Allied Products Limited
Steel Cotton IID Total segment segment segment Rupees in ‘000 (Restated) For the year ended 30 June 2013 Sales - net 1,964,574 3,037,093 – 5,001,667 Cost of sales 1,500,309 2,850,499 – 4,350,808 Gross profit 464,265 186,594 – 650,859 Income from investments – – 298,399 298,399 464,265 186,594 298,399 949,258 Distribution and selling expenses 13,130 54,935 – 68,065 Administrative expenses 128,786 29,965 14,308 173,059 Other operating expenses 62,705 48,987 22,331 134,023 204,621 133,887 36,639 375,147 259,644 52,707 261,760 574,111 Other income 30,149 349,716 195,835 575,700 Operating profit before finance costs 289,793 402,423 457,595 1,149,811 Finance costs 19,870 28,116 14,917 62,903 Profit before taxation 269,923 374,307 442,678 1,086,908 Taxation 270,978 Profit after taxation 815,930
41.2.1 Revenue reported above represents revenue generated from external customers. There were no inter-segment sales during the year (2013: Nil).
41.2.2 The accounting policies of the reportable segments are the same as the Company’s accounting policies
described in note 5 to these financial statements. The Steel segment allocates certain percentage of the common expenditure to the Cotton and IID segments. In addition, finance costs between Steel and Cotton segments are allocated at average mark-up rate on the basis of funds utilized. This is the measure reported to management for the purposes of resource allocation and assessment of segment performance.
41.3 Revenue from major products and services The analysis of the Company’s revenue from external customers for major products and services is given in note
29 to these financial statements. 41.4 Information about major customers Revenue from major customers of Steel segment represents an aggregate amount of Rs. 1,197.032 million
(2013: Rs. 1,516.231 million) of total Steel segment revenue of Rs. 1,282.043 million (2013: Rs. 1,964.574 million). Further, revenue from major customers of Cotton segment represents an aggregate amount of Rs. 260.990 million (2013: Rs. 873.076 million) of total Cotton segment revenue of Rs. 2,749.527 million (2013: Rs. 3,037.093 million).
NOTES TO THE UNCONSOLIDATED FINANCIAL STATEMENTSFor the year ended 30 June 2014

121Unconsolidated Financial Statements 2014
41.5 Geographical information
41.5.1 The Company’s revenue from external customers by geographical location is detailed below : Rupees in ‘000 2014 2013
Far East 252,578 498,697 Pakistan 3,778,992 4,502,970 4,031,570 5,001,667 41.5.2 All non-current assets of the Company as at 30 June 2014 and 2013 were located and operating in Pakistan. 41.6 Segment assets and liabilities
Reportable segments’ assets and liabilities are reconciled to total assets and liabilities as follows: Steel Cotton IID TotalRupees in ‘000 segment segment segment
As at 30 June 2014 Segment assets for reportable segments 1,125,658 882,112 2,562,193 4,569,963 Unallocated corporate assets 163,038 Total assets as per balance sheet 4,733,001 Segment liabilities for reportable segments 198,479 130,675 57,574 386,728 Unallocated corporate liabilities and deferred income 339,094 Total liabilities as per balance sheet 725,822 As at 30 June 2013 - as restated Segment assets for reportable segments 877,871 1,256,882 2,517,874 4,652,627 Unallocated corporate assets 236,101 Total assets as per balance sheet 4,888,728 Segment liabilities for reportable segments 148,375 210,486 2,806 361,667 Unallocated corporate liabilities and deferred income 552,985 Total liabilities as per balance sheet 914,652 41.6.1 For the purposes of monitoring segment performance and allocating resources between segments :
- all assets are allocated to reportable segments other than those directly relating to corporate and taxation assets; and
- all liabilities are allocated to reportable segments other than those directly relating to corporate and taxation.
Cash and bank balances, borrowings and related mark-up receivable therefrom and payable thereon, respectively
are not allocated to reporting segments as these are managed by the Company’s central treasury function.
NOTES TO THE UNCONSOLIDATED FINANCIAL STATEMENTSFor the year ended 30 June 2014
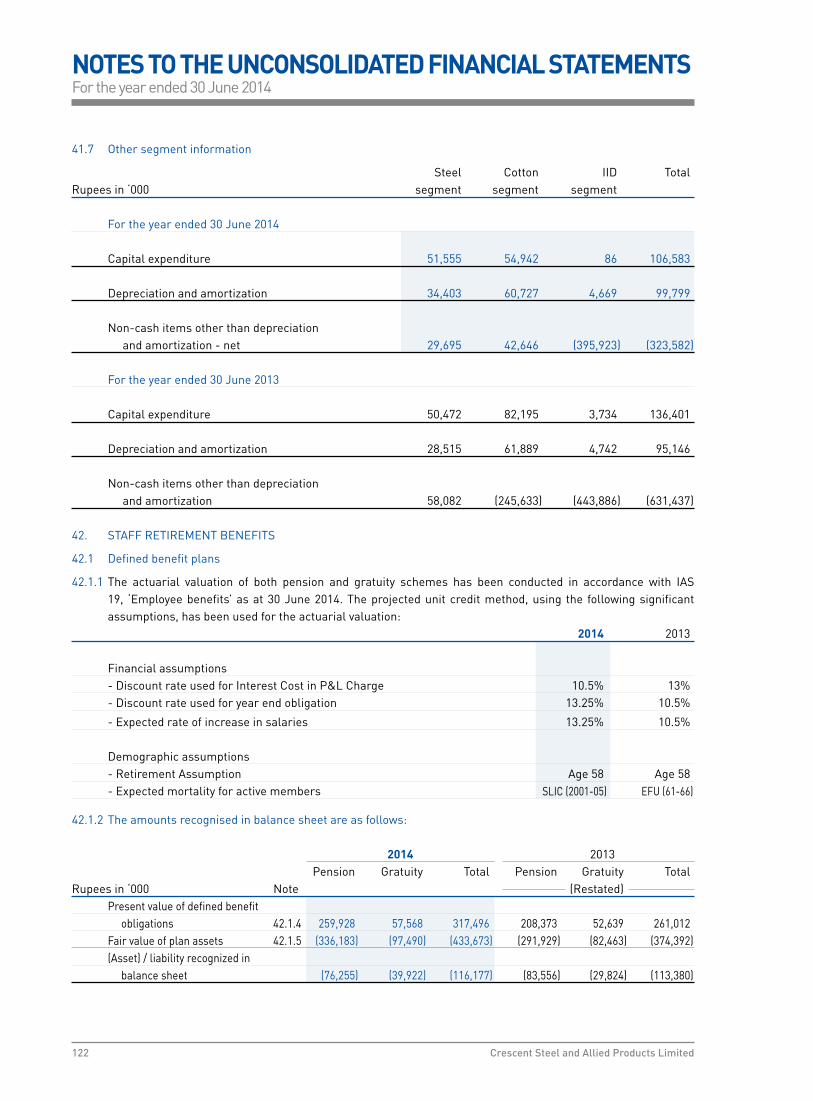
122 Crescent Steel and Allied Products Limited
41.7 Other segment information
Steel Cotton IID TotalRupees in ‘000 segment segment segment
For the year ended 30 June 2014 Capital expenditure 51,555 54,942 86 106,583 Depreciation and amortization 34,403 60,727 4,669 99,799 Non-cash items other than depreciation and amortization - net 29,695 42,646 (395,923) (323,582) For the year ended 30 June 2013
Capital expenditure 50,472 82,195 3,734 136,401 Depreciation and amortization 28,515 61,889 4,742 95,146 Non-cash items other than depreciation and amortization 58,082 (245,633) (443,886) (631,437) 42. STAFF RETIREMENT BENEFITS
42.1 Defined benefit plans
42.1.1 The actuarial valuation of both pension and gratuity schemes has been conducted in accordance with IAS 19, ‘Employee benefits’ as at 30 June 2014. The projected unit credit method, using the following significant assumptions, has been used for the actuarial valuation:
2014 2013
Financial assumptions - Discount rate used for Interest Cost in P&L Charge 10.5% 13% - Discount rate used for year end obligation 13.25% 10.5%
- Expected rate of increase in salaries 13.25% 10.5%
Demographic assumptions - Retirement Assumption Age 58 Age 58 - Expected mortality for active members SLIC (2001-05) EFU (61-66)
42.1.2 The amounts recognised in balance sheet are as follows:
2014 2013 Pension Gratuity Total Pension Gratuity TotalRupees in ‘000 Note (Restated) Present value of defined benefit obligations 42.1.4 259,928 57,568 317,496 208,373 52,639 261,012 Fair value of plan assets 42.1.5 (336,183) (97,490) (433,673) (291,929) (82,463) (374,392) (Asset) / liability recognized in balance sheet (76,255) (39,922) (116,177) (83,556) (29,824) (113,380)
NOTES TO THE UNCONSOLIDATED FINANCIAL STATEMENTSFor the year ended 30 June 2014

123Unconsolidated Financial Statements 2014
42.1.3 Movement in the net defined benefit liability / (asset)
2014 2013 Pension Gratuity Total Pension Gratuity TotalRupees in ‘000 Note (Restated)
Opening balance (83,556) (29,824) (113,380) (7,723) (3,943) (11,666) Net benefit cost / (income) charged to profit and loss 42.1.7 1,166 (269) 897 9,641 2,266 11,907 Remeasurements recognized in other comprehensive income 14,925 (6,362) 8,563 (76,734) (24,654) (101,388) Contributions by the Company 42.1.5 (8,790) (3,467) (12,257) (8,740) (3,493) (12,233) Closing balance (76,255) (39,922) (116,177) (83,556) (29,824) (113,380) 42.1.4 Movement in the present value of defined benefit obligations
2014 2013 Pension Gratuity Total Pension Gratuity TotalRupees in ‘000 (Restated) Present value of defined benefit obligations - 1 July 208,373 52,639 261,012 182,831 44,661 227,492 Current service cost 10,430 3,045 13,475 10,645 2,779 13,424 Interest cost 21,497 5,527 27,024 23,768 5,806 29,574 Benefits paid (6,716) – (6,716) (6,338) (939) (7,277) Benefit due but not paid (571) – (571) – – – Remeasurement (gain) / loss from changes in demographic assumptions 24,298 – 24,298 – – – Remeasurement (gain) / loss of experience adjustments 2,617 (3,643) (1,026) (2,533) 332 (2,201) Remeasurement (gain) / loss of defined benefit obligation 26,915 (3,643) 23,272 (2,533) 332 (2,201) Present value of defined benefit obligations - 30 June 259,928 57,568 317,496 208,373 52,639 261,012
42.1.5 Movement in the fair value of plan assets are as follows
2014 2013 Pension Gratuity Total Pension Gratuity TotalRupees in ‘000 (Restated) Fair value of plan assets - 1 July 291,929 82,463 374,392 190,554 48,604 239,158 Contributions by the Company 8,790 3,467 12,257 8,740 3,493 12,233 Interest income on plan assets 30,761 8,841 39,602 24,772 6,319 31,091 Benefits paid (6,716) – (6,716) (6,338) (939) (7,277) Benefit due but not paid (571) – (571) – – – Return on plan assets, excluding interest income 11,990 2,719 14,709 74,201 24,986 99,187 Fair value of plan assets - 30 June 336,183 97,490 433,673 291,929 82,463 374,392 42.1.6 Actual return on plan assets 42,751 11,560 54,311 98,973 31,305 130,278
NOTES TO THE UNCONSOLIDATED FINANCIAL STATEMENTSFor the year ended 30 June 2014

124 Crescent Steel and Allied Products Limited
42.1.7 Following amounts have been charged in the profit and loss account in respect of these benefits
2014 2013 Pension Gratuity Total Pension Gratuity TotalRupees in ‘000 (Restated) Current service cost 10,430 3,045 13,475 10,645 2,779 13,424 Interest cost 21,497 5,527 27,024 23,768 5,806 29,574 Interest income on plan assets (30,761) (8,841) (39,602) (24,772) (6,319) (31,091) Charge recognized in profit and loss account 1,166 (269) 897 9,641 2,266 11,907 42.1.8 Following amounts of remeasurements have been charged in the other comprehensive income in respect of
these benefits 2014 2013 Pension Gratuity Total Pension Gratuity TotalRupees in ‘000 (Restated) Remeasurement (gain) / loss from changes in demographic assumptions 24,298 – 24,298 – – – Remeasurement (gain) / loss of experience adjustments 2,617 (3,643) (1,026) (2,533) 332 (2,201) Remeasurement (gain) / loss of defined benefit obligation 26,915 (3,643) 23,272 (2,533) 332 (2,201) Return on plan assets, excluding interest income (11,990) (2,719) (14,709) (74,201) (24,986) (99,187) Remeasurement loss / (gain) charged in the other comprehensive income 14,925 (6,362) 8,563 (76,734) (24,654) (101,388) 42.1.9 Total defined benefit cost recognized in profit and loss account and other comprehensive income 16,091 (6,631) 9,460 (67,093) (22,388) (89,481) Expected contributions to funds in the following year 11,238 4,365 15,603 9,993 3,902 13,895 Re-measurements: Accumulated actuarial (gains) / losses recognised in equity 14,925 (6,362) 8,563 (76,734) (24,654) (101,388) Weighted average duration of the defined benefit obligation (years) 11 4 Analysis of present value of defined benefit obligation Type of Members: Pensioners 21 – 21 – Beneficiaries 70 69 68 67 91 69 89 67 Vested / Non-Vested Vested benefits 32,201 500 32,701 179,790 52,237 232,027 Non - vested benefits 227,727 57,068 284,795 28,584 401 28,985 259,928 57,568 317,496 208,374 52,638 261,012
NOTES TO THE UNCONSOLIDATED FINANCIAL STATEMENTSFor the year ended 30 June 2014

125Unconsolidated Financial Statements 2014
2014 2013 Pension Gratuity Total Pension Gratuity TotalRupees in ‘000 (Restated)
Disaggregation of fair value of plan assets The fair value of the plan assets at balance sheet date for each category are as follows: Cash and cash equivalents (comprising bank balances and adjusted for current liabilities) - quoted 6,669 1,288 7,957 13,669 383 14,052 Debt instruments AA+ 24,645 – 24,645 23,687 – 23,687 A+ 3,970 – 3,970 – – – AA- 233 – 233 7,812 498 8,310 AM2- 14,282 – 14,282 9,860 – 9,860 B- 100,294 27,475 127,769 55,259 14,292 69,551 143,424 27,475 170,899 96,618 14,790 111,408 Equity instruments Beverages 630 – 630 – – – Chemicals 1,873 331 2,204 1,349 317 1,666 Commercial Banks 1,458 – 1,458 454 – 454 Construction and Materials (Cement) 7,418 – 7,418 6,672 – 6,672 Electricity 29,201 8,442 37,643 30,461 8,860 39,321 Food Producer 1,091 321 1,412 1,410 415 1,825 Industrial Metals and Minning 112,436 51,211 163,647 105,691 48,139 153,830 Non Life Insurance 167 – 167 121 – 121 Oil and Gas 13,372 3,777 17,149 10,331 3,213 13,544 Personal Goods (Textile) 2,798 – 2,798 2,355 – 2,355 170,444 64,082 234,526 158,844 60,944 219,788 Mutual funds Income Fund 3,409 2,272 5,681 3,233 2,155 5,388 Equity Fund 11,014 2,371 13,385 11,053 2,486 13,539 Capital Protected Fund – – – 7,388 1,705 9,093 Money Market Fund 1,222 – 1,222 1,122 – 1,122 15,645 4,643 20,288 22,796 6,346 29,142 329,513 96,200 425,713 278,258 82,080 360,338 Sensitivity analysis
Reasonably possible changes at the reporting date to one of the relevant actuarial assumptions, holding other assumptions constant, would have affected the defined benefit obligation by the amounts shown below.
Discount rate +1% 233,385 55,576 Discount rate -1% 291,929 59,807 Long term pension / salary increase +1% 266,109 59,786 Long term pension / salary decrease -1% 254,339 55,559 Long term pension increase +1% 285,342 – Long term pension decrease -1% 237,920 – The actuary of the company has assessed that present value of future refunds or reduction in future contribution is not lower
than receivable from pension and gratuity funds recorded by the Company.
NOTES TO THE UNCONSOLIDATED FINANCIAL STATEMENTSFor the year ended 30 June 2014
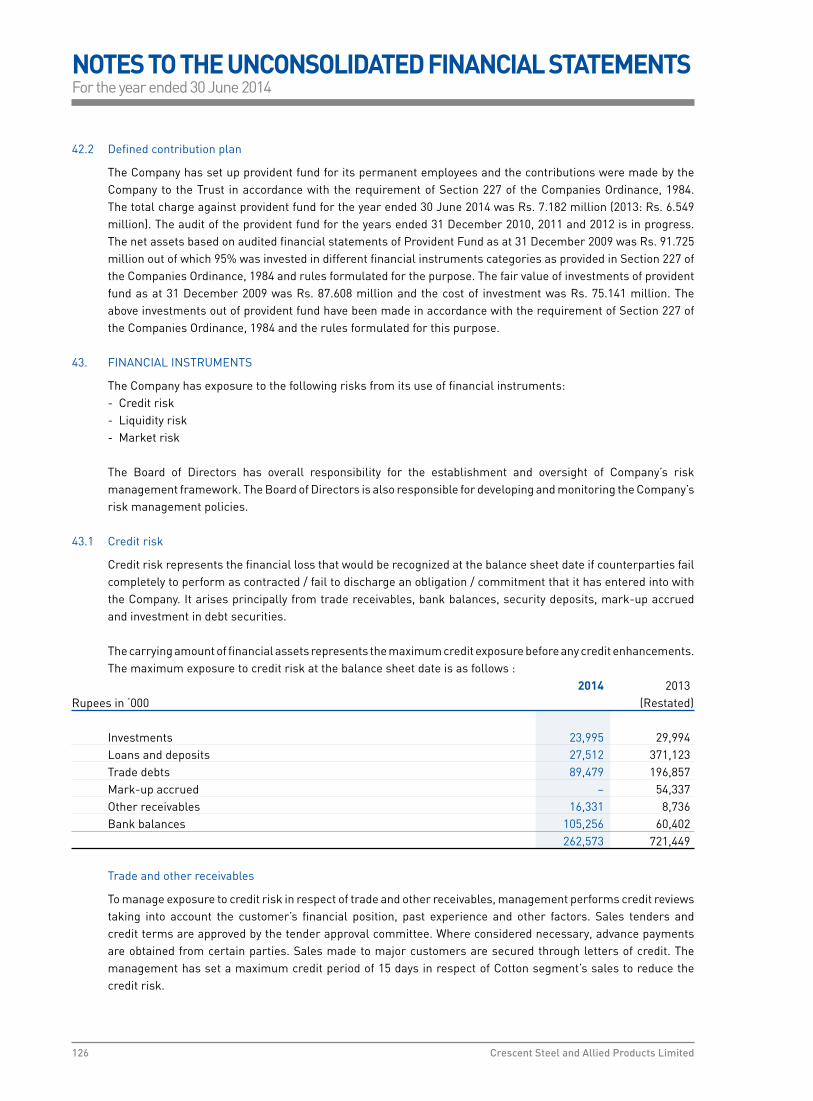
126 Crescent Steel and Allied Products Limited
42.2 Defined contribution plan
The Company has set up provident fund for its permanent employees and the contributions were made by the Company to the Trust in accordance with the requirement of Section 227 of the Companies Ordinance, 1984. The total charge against provident fund for the year ended 30 June 2014 was Rs. 7.182 million (2013: Rs. 6.549 million). The audit of the provident fund for the years ended 31 December 2010, 2011 and 2012 is in progress. The net assets based on audited financial statements of Provident Fund as at 31 December 2009 was Rs. 91.725 million out of which 95% was invested in different financial instruments categories as provided in Section 227 of the Companies Ordinance, 1984 and rules formulated for the purpose. The fair value of investments of provident fund as at 31 December 2009 was Rs. 87.608 million and the cost of investment was Rs. 75.141 million. The above investments out of provident fund have been made in accordance with the requirement of Section 227 of the Companies Ordinance, 1984 and the rules formulated for this purpose.
43. FINANCIAL INSTRUMENTS
The Company has exposure to the following risks from its use of financial instruments: - Credit risk - Liquidity risk - Market risk The Board of Directors has overall responsibility for the establishment and oversight of Company’s risk
management framework. The Board of Directors is also responsible for developing and monitoring the Company’s risk management policies.
43.1 Credit risk
Credit risk represents the financial loss that would be recognized at the balance sheet date if counterparties fail completely to perform as contracted / fail to discharge an obligation / commitment that it has entered into with the Company. It arises principally from trade receivables, bank balances, security deposits, mark-up accrued and investment in debt securities.
The carrying amount of financial assets represents the maximum credit exposure before any credit enhancements.
The maximum exposure to credit risk at the balance sheet date is as follows : 2014 2013 Rupees in ‘000 (Restated) Investments 23,995 29,994 Loans and deposits 27,512 371,123 Trade debts 89,479 196,857 Mark-up accrued – 54,337 Other receivables 16,331 8,736 Bank balances 105,256 60,402 262,573 721,449 Trade and other receivables
To manage exposure to credit risk in respect of trade and other receivables, management performs credit reviews taking into account the customer’s financial position, past experience and other factors. Sales tenders and credit terms are approved by the tender approval committee. Where considered necessary, advance payments are obtained from certain parties. Sales made to major customers are secured through letters of credit. The management has set a maximum credit period of 15 days in respect of Cotton segment’s sales to reduce the credit risk.
NOTES TO THE UNCONSOLIDATED FINANCIAL STATEMENTSFor the year ended 30 June 2014

127Unconsolidated Financial Statements 2014
All the trade debtors at the balance sheet date represent domestic parties except one export party. The maximum exposure to credit risk before any credit enhancements for trade debts at the balance sheet date
by type of customer was Rupees in ‘000 2014 2013 Steel segment 46,445 99,438 Cotton segment 43,034 97,419 89,479 196,857 The aging of trade debts at the balance sheet date is Not past due 38,472 68,146 Past due 1 - 30 days 985 55,627 Past due 30 - 180 days 35,340 63,941 Past due 180 days 17,468 22,844 92,265 210,558 Less: Impaired 2,786 13,701 89,479 196,857 One of the major customer accounts for Rs. 28.969 million of the trade debts carrying amount as at 30 June 2014
(2013: Rs. 44.352 million) that has a good track record with the Company.
Based on past experience the management believes that no impairment allowance is necessary in respect of trade debts past due as some receivables have been recovered subsequent to the year end and for other receivables there are reasonable grounds to believe that the amounts will be recovered in short course of time. Non past due amounts of Rs. 30.853 million (2013: Rs. 36.606 million) is secured through letters of credit.
Settlement risk
All investing transactions are settled / paid for upon delivery as per the advice of investment committee. The Company’s policy is to enter into financial instrument contract by following internal guidelines such as approving counterparties and approving credits.
Bank balances
The Company kept its surplus funds with banks having good credit rating. Currently the surplus funds are kept with banks having rating from AAA to AA-.
Loans and deposits
The loan provided to its wholly owned subsidiary are being converted in its ordinary shares and interest theron of Rs. 88.626 million has been received during the year. The Company has provided security deposits as per the contractual terms with counter parties as security and does not expect material loss against those deposits.
NOTES TO THE UNCONSOLIDATED FINANCIAL STATEMENTSFor the year ended 30 June 2014

128 Crescent Steel and Allied Products Limited
Investment in debt securities
Credit risk arising on debt securities is mitigated by investing principally in investment grade rated instruments. Where the investment is considered doubtful a provision is created there against. As at 30 June 2014, the Company has recognized a provision of Rs. 11.105 million (2013: Rs. 5.106 million) against its exposure to preference shares of an associated company which has been given a credit rating of ‘D’ grade.
Concentration of credit risk Concentration of credit risk arises when a number of counter parties are engaged in similar business activities
or have similar economic features that would cause their abilities to meet contractual obligation to be similarly effected by the changes in economic, political or other conditions. The Company believes that it is not exposed to major concentration of credit risk.
43.2 Liquidity risk Liquidity risk is the risk that the Company will encounter difficulty in meeting its obligation arising from financial
liabilities that are settled by delivering cash or another financial asset or that such obligation will have to be settled in a manner disadvantageous to the Company. The Company is not materially exposed to liquidity risk as substantially all obligation / commitments of the Company are short term in nature and are restricted to the extent of available liquidity. In addition, the Company has obtained running finance facilities from various commercial banks to meet the short term liquidity commitments, if any.
The following are the contractual maturities of the financial liabilities, including estimated interest payments:
Rupees in ‘000 2014 Carrying On Contractual Six Six to One to Two to amount demand cash flows months twelve two five or less months years years Financial liabilities Liabilities against assets subject to finance lease 103,029 – 119,554 28,310 24,003 41,987 25,254 Trade and other payables (refer note 9) 228,416 – 228,416 228,416 – – – Mark-up accrued 8,168 – 8,168 8,168 – – – Short term borrowings 228,366 228,366 – – – – –
567,979 228,366 356,138 264,894 24,003 41,987 25,254 Rupees in ‘000 2013 Carrying On Contractual Six Six to One to Two to amount demand cash flows months twelve two five or less months years years Financial liabilities Liabilities against assets subject to finance lease 66,566 – 76,082 16,602 21,975 23,918 13,587 Trade and other payables (refer note 9) - restated 220,533 – 220,533 220,533 – – – Mark-up accrued 9,002 – 9,002 9,002 – – – Short term borrowings 418,365 418,365 – – – – – 714,466 418,365 305,617 246,137 21,975 23,918 13,587
NOTES TO THE UNCONSOLIDATED FINANCIAL STATEMENTSFor the year ended 30 June 2014

129Unconsolidated Financial Statements 2014
43.3 Market risk
Market risk is the risk that changes in market price, such as foreign exchange rates, interest rates and equity prices will affect the Company’s income or the value of its holdings of financial instruments. The Investment Committee monitors the portfolio of its investments and adjust the portfolio in light of changing circumstances.
43.3.1 Currency risk
The Company is exposed to currency risk on import of raw materials, stores and spares, export of goods and foreign currency bank accounts denominated in US Dollars (USD), Great Britain Pounds (GBP) and Euros. The Company’s exposure to foreign currency risk for these currencies is as follows :
2014 USD Euro Total
Foreign creditors (160) – (160) Foreign currency bank account 2 – 2 Gross balance sheet exposure (158) – (158) Outstanding letters of credit 533,650 – 533,650 Net exposure 533,492 – 533,492 2013 GBP Euro Total
Foreign creditors (5,031) – (5,031) Foreign currency bank account 2 – 2 Gross balance sheet exposure (5,029) – (5,029) Outstanding letters of credit (73,000) (279,010) (352,010) Net exposure (78,029) (279,010) (357,039) The following significant exchange rate has been applied : Average rate Reporting date rate 2014 2013 2014 2013
USD to PKR 102.83 97.57 98.75 98.80 Euro to PKR 139.61 126.30 134.73 129.11 Sensitivity analysis
At the balance sheet date, if the PKR had strengthened by 10% against the USD and Euro with all other variables held constant, post-tax profit for the year would have been higher by the amount shown below, mainly as a result of net foreign exchange gain on translation of foreign currency bank account and foreign creditors.
Effect on profit or loss
2014 2013 USD 53,349 (7,803) Euro – (27,901) 53,349 (35,704)
The weakening of the PKR against USD and Euro would have had an equal but opposite impact on the post tax profits.
NOTES TO THE UNCONSOLIDATED FINANCIAL STATEMENTSFor the year ended 30 June 2014

130 Crescent Steel and Allied Products Limited
The sensitivity analysis prepared is not necessarily indicative of the effects on profit for the year and assets / liabilities of the Company.
43.3.2 Interest rate risk
At the balance sheet date, the interest rate profile of the Company’s significant interest bearing financial instruments was as follows :
2014 2013 2014 2013 Effective interest rate Carrying amount (Percentage) (Rupees in ‘000)
Financial assets Fixed rate instruments Preference shares 8.5 8.5 23,995 29,994 Variable rate instruments Long term loan 11.45-12.59 11.58-14.49 – 349,444 Financial liabilities Fixed rate instruments Liabilities against assets subject to finance lease 14.59-20.25 14.59-20.25 103,029 66,566 Variable rate instruments Short term borrowings 10.58-12.38 10.81-15.10 228,366 418,365 Fair value sensitivity analysis for fixed rate instruments
The Company does not account for any fixed rate financial assets and liabilities at fair value through profit and loss. Therefore a change in interest rates at the reporting date would not affect profit and loss account.
Cash flow sensitivity analysis for variable rate instruments
A change of 100 basis points in interest rates at the balance sheet date would have decreased / (increased) profit for the year by the amounts shown below. This analysis assumes that all other variables, in particular foreign currency rates, remain constant. The analysis is performed on the same basis for 2013.
Profit and loss 100bpRupees in ‘000 Increase Decrease As at 30 June 2014 Cash flow sensitivity - Variable rate financial liabilities (2,284) 2,284 As at 30 June 2013 Cash flow sensitivity - Variable rate financial liabilities (4,184) 4,184 The sensitivity analysis prepared is not necessarily indicative of the effects on profit for the year and assets /
liabilities of the Company.
NOTES TO THE UNCONSOLIDATED FINANCIAL STATEMENTSFor the year ended 30 June 2014

131Unconsolidated Financial Statements 2014
43.3.3 Other price risk
Other price risk is the risk that the fair value or future cash flows of a financial instrument will fluctuate because of changes in market prices (other than those arising from interest rate risk or currency risk). Other price risk arises from the Company’s investment in units of mutual funds and ordinary shares of listed companies. To manage its price risk arising from aforesaid investments, the Company diversifies its portfolio and continuously monitors developments in equity markets. In addition the Company actively monitors the key factors that affect stock price movement.
A 10% increase / decrease in redemption and share prices at year end would have decreased / increased the
Company’s gain / loss in case of held for trading investments and increase / decrease surplus on re-measurement of investments in case of ‘available for sale’ investments as follows:
Rupees in ‘000 2014 2013
Effect on profit 42,270 50,208 Effect on equity 927 17,134 Effect on investments 43,197 67,342 The sensitivity analysis prepared is not necessarily indicative of the effects on profit / equity and assets of the
Company. 43.4 Fair value of financial instruments
The carrying values of other financial assets and financial liabilities reported in balance sheet approximate their fair values. The Company measures fair values using the following fair value hierarchy that reflects the significance of the inputs used in making the measurements
- Level 1: Quoted market price (unadjusted) in an active market for an identical instrument.
- Level 2: Valuation techniques based on observable inputs, either directly (i.e. as prices) or indirectly (i.e. derived from prices).
- Level 3: Valuation techniques using significant unobservable inputs.
Investment in ordinary and preference shares of listed companies and certificates of closed end scheme is
valued using quoted prices in active market, hence, fair value of such investments fall within Level 1 in fair value
hierarchy as mentioned above. Investment in unquoted securities fall within level 3 as mentioned above.
NOTES TO THE UNCONSOLIDATED FINANCIAL STATEMENTSFor the year ended 30 June 2014
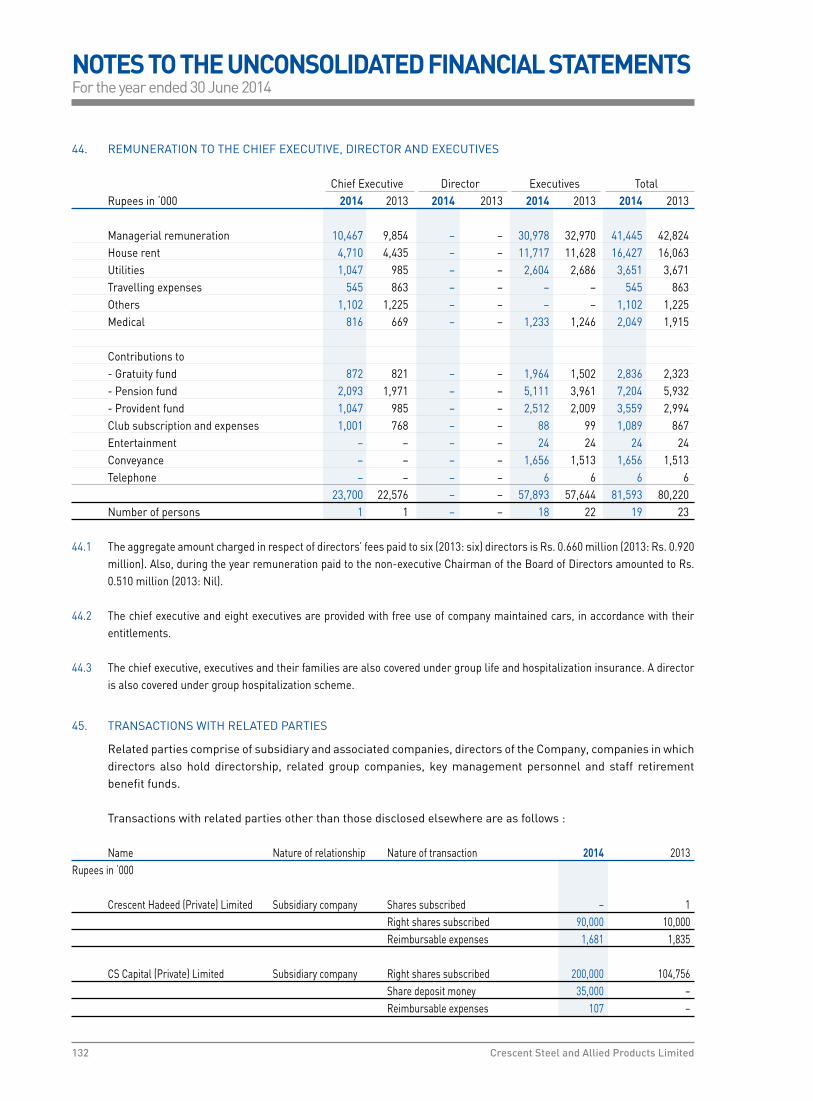
132 Crescent Steel and Allied Products Limited
44. REMUNERATION TO THE CHIEF EXECUTIVE, DIRECTOR AND EXECUTIVES Chief Executive Director Executives Total Rupees in ‘000 2014 2013 2014 2013 2014 2013 2014 2013
Managerial remuneration 10,467 9,854 – – 30,978 32,970 41,445 42,824 House rent 4,710 4,435 – – 11,717 11,628 16,427 16,063 Utilities 1,047 985 – – 2,604 2,686 3,651 3,671 Travelling expenses 545 863 – – – – 545 863 Others 1,102 1,225 – – – – 1,102 1,225 Medical 816 669 – – 1,233 1,246 2,049 1,915 Contributions to - Gratuity fund 872 821 – – 1,964 1,502 2,836 2,323 - Pension fund 2,093 1,971 – – 5,111 3,961 7,204 5,932 - Provident fund 1,047 985 – – 2,512 2,009 3,559 2,994 Club subscription and expenses 1,001 768 – – 88 99 1,089 867 Entertainment – – – – 24 24 24 24 Conveyance – – – – 1,656 1,513 1,656 1,513 Telephone – – – – 6 6 6 6 23,700 22,576 – – 57,893 57,644 81,593 80,220 Number of persons 1 1 – – 18 22 19 23
44.1 The aggregate amount charged in respect of directors’ fees paid to six (2013: six) directors is Rs. 0.660 million (2013: Rs. 0.920 million). Also, during the year remuneration paid to the non-executive Chairman of the Board of Directors amounted to Rs. 0.510 million (2013: Nil).
44.2 The chief executive and eight executives are provided with free use of company maintained cars, in accordance with their entitlements.
44.3 The chief executive, executives and their families are also covered under group life and hospitalization insurance. A director is also covered under group hospitalization scheme.
45. TRANSACTIONS WITH RELATED PARTIES
Related parties comprise of subsidiary and associated companies, directors of the Company, companies in which directors also hold directorship, related group companies, key management personnel and staff retirement benefit funds.
Transactions with related parties other than those disclosed elsewhere are as follows : Name Nature of relationship Nature of transaction 2014 2013Rupees in ‘000 Crescent Hadeed (Private) Limited Subsidiary company Shares subscribed – 1 Right shares subscribed 90,000 10,000 Reimbursable expenses 1,681 1,835 CS Capital (Private) Limited Subsidiary company Right shares subscribed 200,000 104,756 Share deposit money 35,000 – Reimbursable expenses 107 –
NOTES TO THE UNCONSOLIDATED FINANCIAL STATEMENTSFor the year ended 30 June 2014

133Unconsolidated Financial Statements 2014
Name Nature of relationship Nature of transaction 2014 2013Rupees in ‘000 Shakarganj Energy (Private) Limited Subsidiary company Long term loan provided 8,595 126,444 Sale of finished goods 1,638 – Mark-up on long term loan provided 32,193 37,623 Reimbursable expenses 301 – Right shares subscribed 169,900 – Transfer of loan to equity 358,039 – Altern Energy Limited Associated company Dividend received 60,475 – Shakarganj Mills Limited Associated company Dividend paid 8,813 4,896 Sales of finished goods 3,171 170,343 Services received 4,406 1,169 Reimbursable expenses 1,556 2,625 Purchase of land – 70,000 Commecs Educational Trust * Related party Donation given – 2,000 Crescent Jute Products Limited * Related party Purchase of assets 5,909 – Services received 137 – Reimbursable expenses 648 – CSAP Foundation* Related party Donation given 285 1,945 Muhammad Amin Muhammad Bashir Limited * Related party Dividend paid 2 1 Pakistan Centre for Philanthropy * Related party Donation given – 2,500 Annual subscription charges 180 180 Premier Insurance Company * Related party Dividend paid – 11 Insurance premium 9,839 1,643 The Crescent Textile Mills Limited * Related party Dividend paid 20,119 11,177 The Citizens’ Foundation * Related party Donation given 19,820 26,580 Crescent Cotton Products - Staff Retirement Provident Fund benefit fund Contribution made 1,831 1,650 Dividend paid 16 9 Crescent Steel and Allied Products Retirement Limited - Gratuity Fund benefit fund Contribution made 3,797 3,492 Dividend paid 3,852 1,676 Crescent Steel and Allied Products Retirement Limited - Pension Fund benefit fund Contribution made 9,623 8,740 Dividend paid 8,457 3,003
NOTES TO THE UNCONSOLIDATED FINANCIAL STATEMENTSFor the year ended 30 June 2014
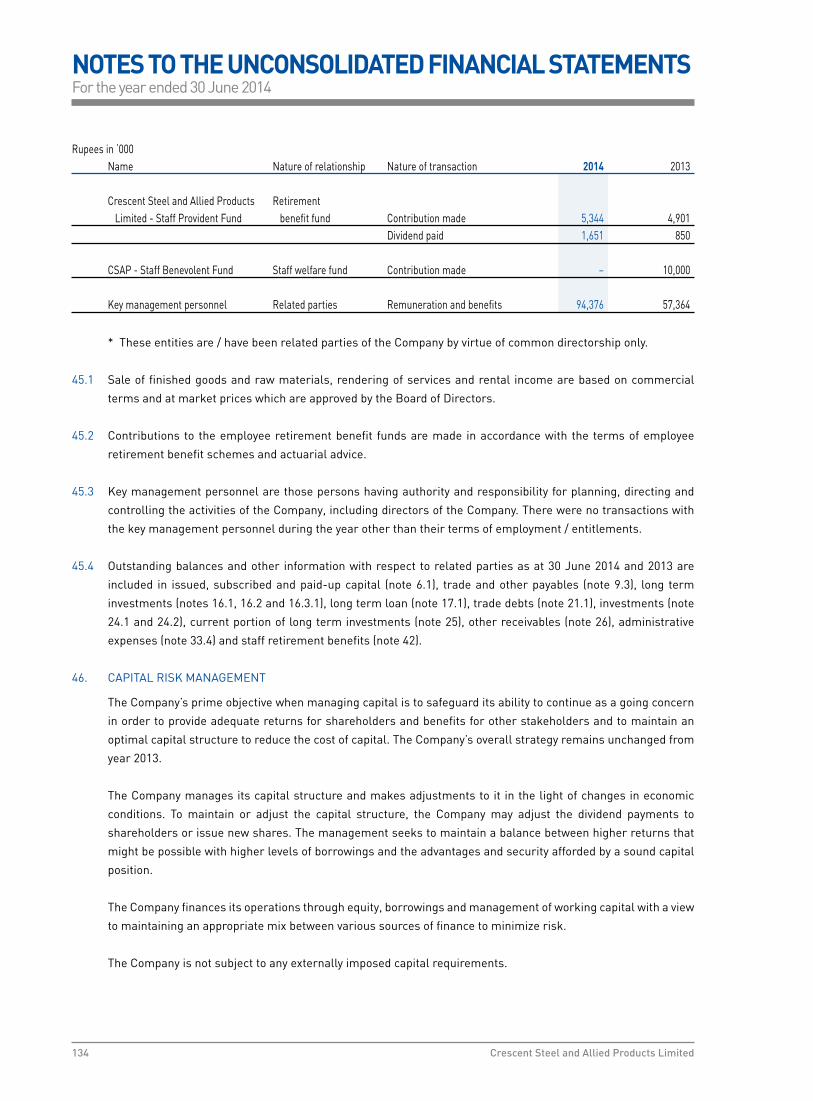
134 Crescent Steel and Allied Products Limited
Rupees in ‘000 Name Nature of relationship Nature of transaction 2014 2013 Crescent Steel and Allied Products Retirement Limited - Staff Provident Fund benefit fund Contribution made 5,344 4,901 Dividend paid 1,651 850 CSAP - Staff Benevolent Fund Staff welfare fund Contribution made – 10,000 Key management personnel Related parties Remuneration and benefits 94,376 57,364
* These entities are / have been related parties of the Company by virtue of common directorship only.
45.1 Sale of finished goods and raw materials, rendering of services and rental income are based on commercial
terms and at market prices which are approved by the Board of Directors.
45.2 Contributions to the employee retirement benefit funds are made in accordance with the terms of employee
retirement benefit schemes and actuarial advice.
45.3 Key management personnel are those persons having authority and responsibility for planning, directing and
controlling the activities of the Company, including directors of the Company. There were no transactions with
the key management personnel during the year other than their terms of employment / entitlements.
45.4 Outstanding balances and other information with respect to related parties as at 30 June 2014 and 2013 are
included in issued, subscribed and paid-up capital (note 6.1), trade and other payables (note 9.3), long term
investments (notes 16.1, 16.2 and 16.3.1), long term loan (note 17.1), trade debts (note 21.1), investments (note
24.1 and 24.2), current portion of long term investments (note 25), other receivables (note 26), administrative
expenses (note 33.4) and staff retirement benefits (note 42).
46. CAPITAL RISK MANAGEMENT
The Company’s prime objective when managing capital is to safeguard its ability to continue as a going concern
in order to provide adequate returns for shareholders and benefits for other stakeholders and to maintain an
optimal capital structure to reduce the cost of capital. The Company’s overall strategy remains unchanged from
year 2013.
The Company manages its capital structure and makes adjustments to it in the light of changes in economic
conditions. To maintain or adjust the capital structure, the Company may adjust the dividend payments to
shareholders or issue new shares. The management seeks to maintain a balance between higher returns that
might be possible with higher levels of borrowings and the advantages and security afforded by a sound capital
position.
The Company finances its operations through equity, borrowings and management of working capital with a view
to maintaining an appropriate mix between various sources of finance to minimize risk.
The Company is not subject to any externally imposed capital requirements.
NOTES TO THE UNCONSOLIDATED FINANCIAL STATEMENTSFor the year ended 30 June 2014

135Unconsolidated Financial Statements 2014
The Company monitors capital on the basis of the gearing ratio. This ratio is calculated as net debt divided by
total capital. Net debt is calculated as total debt less cash and bank balances. Total capital is calculated as equity
as shown in the balance sheet plus net debt.
46.1 Gearing ratio
The gearing ratio at end of the year is calculated as follows
Rupees in ‘000 Note 2014 2013 Total debt 46.1.1 331,395 484,931 Less: Cash and bank balances 107,246 65,220 Net debt 224,149 419,711 Total equity 46.1.2 4,007,179 3,974,076 Total capital 4,231,328 4,393,787
Gearing ratio 5% 10%
46.1.1 Total debt is defined as long term and short term borrowings (excluding derivatives), as described in notes 7 and
11 to these financial statements.
46.1.2 Total equity includes all capital and reserves of the Company that are managed as capital.
47. PLANT CAPACITY AND PRODUCTION
47.1 Steel segment
Pipe plant
The plant’s installed / rated capacity for production based on single shift is 30,000 tons (2013: 30,000 tons)
annually on the basis of notional pipe size of 30” dia x ½” thickness. The actual production achieved during the
year was 10,248 tons (2013: 12,266 tons) line pipes of varied sizes and thickness, which is equivalent to 21,676
tons (2013: 26,790 tons) if actual production is translated to the notional pipe size of 30” diameter.
Coating plant
The coating plant has a capacity of externally shot blasting and coating of line pipes with 3 layer high / medium
density polyethylene coating at a rate of 250 square meters of surface area per hour on pipe sizes ranging from
114 mm to 1524 mm outside dia and thickness ranging from 3 mm to 16 mm.
The annual capacity of the plant works out to 600,000 square meters outside surface area of line pipes based on
notional size of 14” dia on single shift working. Coating of 82,125 meters (2013: 340,472 meters) of different dia
pipes (58,651 square meters surface area) was achieved during the year (2013: 245,505 square meters surface
area).
NOTES TO THE UNCONSOLIDATED FINANCIAL STATEMENTSFor the year ended 30 June 2014

136 Crescent Steel and Allied Products Limited
47.2 Cotton segment
Spinning unit 1
The plant capacity converted to 20s count based on three shifts per day for 1,080 shifts is 6,452,874 kilograms
(2013: 6,452,874 kilograms). Actual production converted into 20s count was 5,749,028 kilograms (2013: 4,953,253
kilograms).
47.3 The capacities of the plant were utilized to the extent of orders received. The production of spinning unit was also
affected due to power and gas shutdowns.
48. GENERAL
48.1 Number of employees
The number of employees including contractual employees of the Company as at 30 June 2014 were 724 (2013:
852) and weighted average number of employees were 833 (2013: 874).
48.2. Non adjusting event after balance sheet date
The Board of Directors of the Company in their meeting held on 21 August 2014 have proposed final cash dividend
for the year ended 30 June 2014 of Rs. 1.5 per share (i.e. 15%) (2013: Re. 1.5 per share) amounting to Rs. 93.159
million (2013: Rs. 84.690 million). This is in addition to the first interim cash dividends of Re. 1 per share each
(i.e. 10% each) already distributed and recorded in these financial statements; this make a total distribution of
Rs. 2.5 per share (i.e. 25%) for the year ended 30 June 2014. The above proposed final cash dividend is subject
to the approval of the members at the Annual General Meeting to be held on 23 October 2014. These financial
statements do not include the effect of above proposals which will be accounted for in the period in which it is
approved by the members.
49. DATE OF AUTHORIZATION FOR ISSUE
These financial statements were authorized for issue in the Board of Directors meeting held on 21 August
2014.
Chief Executive Director Chief Financial Officer
NOTES TO THE UNCONSOLIDATED FINANCIAL STATEMENTSFor the year ended 30 June 2014

Crescent Steel and Allied Products Limited
Consolidated Financial StatementsFor the year ended 30 June 2014
Financial Statements of this Annual Report are printed on 100% recycled paper.
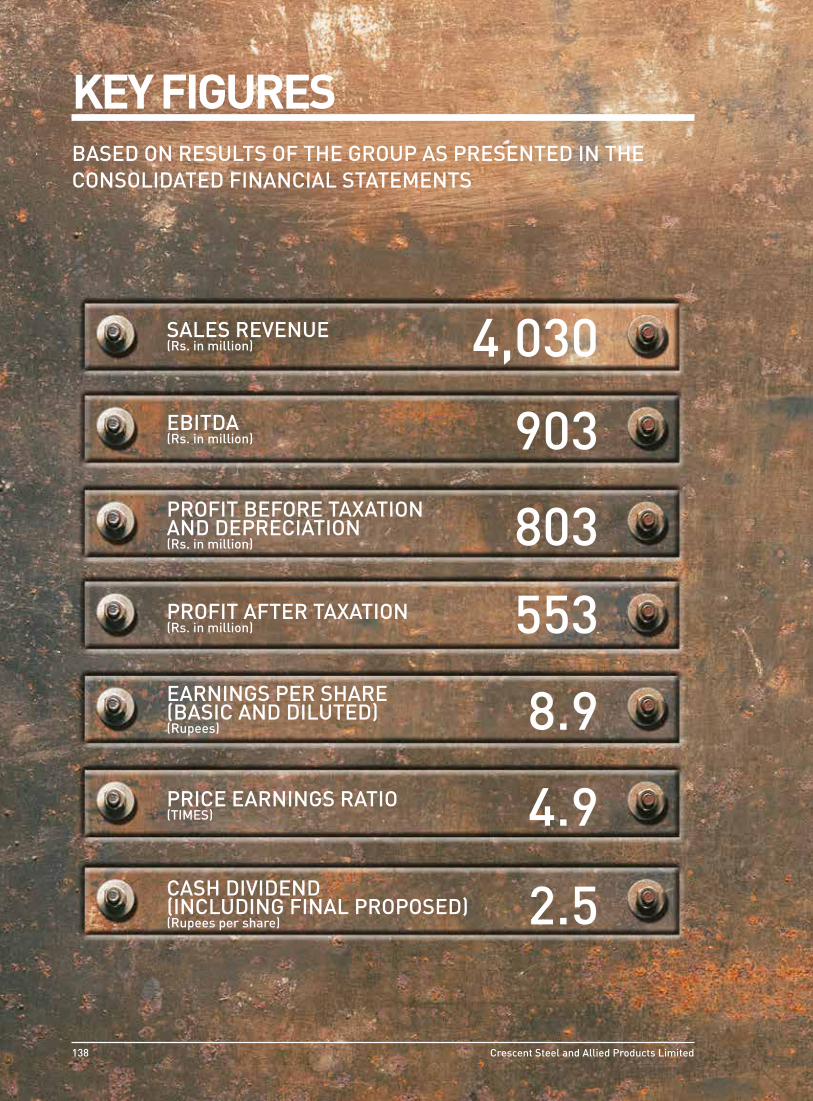
SALES REVENUE (Rs. in million)
EBITDA (Rs. in million)
PROFIT BEFORE TAXATION AND DEPRECIATION (Rs. in million)
EARNINGS PER SHARE(BASIC AND DILUTED) (Rupees)
CASH DIVIDEND (INCLUDING FINAL PROPOSED) (Rupees per share)
PROFIT AFTER TAXATION (Rs. in million)
PRICE EARNINGS RATIO (TIMES)
4,030
903
803
553
8.9
4.9
2.5
KEY FIGURESBASED ON RESULTS OF THE GROUP AS PRESENTED IN THE CONSOLIDATED FINANCIAL STATEMENTS
138 Crescent Steel and Allied Products Limited

TOTAL ASSETS (Rs. in million)
CURRENT RATIO (Ratio)
BREAK-UP VALUE PER SHARE(Rupees)
RETURN ON AVERAGE CAPITAL EMPLOYED(%)
SHAREHOLDERS’ EQUITY (Rs. in million)
CAPITAL EXPENDITURE (Rs. in million)
6,165
2.6:1
5,246
84.5
254
14.6
139Annual Report 2014

PERFORMANCE INDICATORS CONSOLIDATEDFOR THE CURRENT AND PAST SIX FINANCIAL YEARS
2014* 2013* 2012* 2011* 2010* 2009* 2008PERFORMANCE INDICATORS Restated Restated
A - Profitability Ratios
Earnings before interest, taxation, depreciation and amortization (EBITDA) (Rs. in millions) 902.5 1,316.6 703.6 1,151.0 1,022.2 279.2 954.7 Profit before taxation and deprecation (Rs. in millions) 802.3 1,251.3 582.7 995.2 889.8 74.1 801.4 Gross profit ratio (%) 5.7 13.0 12.9 18.4 22.1 21.6 21.3 Operating profit margin to sales (net) (%) 11.5 19.1 7.8 17.5 22.3 2.9 17.4 Net profit / (loss) margin to sales (net) (%) 13.7 17.8 11.9 14.5 14.4 (7.2) 9.9 EBITDA margin to sales (net) (%) 22.4 26.3 17.8 26.2 27.6 8.4 22.7 Operating leverage ratio 1.8 4.4 4.1 0.9 63.1 4.1 (0.2) Return on equity (%) 10.5 18.0 11.7 17.8 17.4 (9.4) 13.9 Return on average equity (%) 10.8 19.9 12.4 19.2 19.0 (8.7) 13.4 Return on capital employed (RoCE) (%) 14.4 22.5 12.8 22.0 21.4 2.7 17.4 Return on average capital employed (%) 14.6 25.0 12.7 23.4 22.2 2.4 18.0 Return on average assets (%) 9.2 16.3 9.4 13.1 11.9 (5.4) 8.7 B - Liquidity Ratios
Current ratio 2.6 : 1 2.5 : 1 1.8 : 1 1.5 : 1 1.2 : 1 1.2 : 1 1.4 : 1 Quick / Acid-test ratio 2 : 1 1.8 : 1 1.3 : 1 0.8 : 1 0.6 : 1 0.8 : 1 1.1 : 1 Cash to current liabilities (%) (11.8) (23.6) (23.5) (49.1) (27.0) (45.8) (52.7) Cash flows from operations to sales (%) 4.3 (1.7) 11.1 4.1 12.3 10.1 13.5 Working capital (Net current assets) 1,123.6 1,340.9 856.4 595.2 384.7 308.0 706.0 Working capital turnover (times) 3.3 4.6 5.4 9.0 10.7 6.5 4.8 C - Activity / Turnover Ratios
Debtors turnover ratio (times) 28.1 17.7 15.3 20.9 20.5 32.7 28.0 No. of days in receivables / Average collection period (days) 13 21 24 18 18 11 13 Inventory turnover ratio (times) 7.1 7.0 4.8 3.8 3.5 4.2 5.3 No. of days in inventory (days) 51 52 76 95 104 86 68 Creditors turnover ratio (times) 29.3 19.9 15.9 22.3 14.0 24.6 19.7 No. of days in creditors / Average payment period (days) 12 18 23 16 26 15 19 Property, plant and equipment turnover (times) 2.9 3.9 3.6 3.1 2.9 2.7 3.4 Total assets turnover (times) 0.7 0.9 0.8 0.9 0.8 0.8 0.9 Operating cycle (days) 52 55 77 96 96 82 63 D - Investment / Market Ratios
Basic and diluted earnings / (loss) per share (Rs.) ** 8.91 14.35 7.58 10.29 8.61 (3.85) 6.69 Price earnings ratio (times) *** 4.9 3.1 3.1 2.5 2.9 - 9.2 Dividend yield (%) *** 5.7 7.8 8.6 13.4 12.0 - 4.9 Dividend payout ratio (%) *** 28.1 28.5 24.0 30.9 31.7 - 49.4 Dividend cover ratio (times) *** 3.6 4.1 3.8 2.9 2.9 - 2.2 Cash dividend (Rs. in millions) *** 155.3 197.6 112.9 197.6 169.4 - 154.0 Cash dividend per share (Rs.) *** 2.5 3.5 2.0 3.5 3.0 - 3.0 Stock dividend / Bonus shares (Rs. in millions) *** - 56.4 - - - - 51.3 Stock dividend / Bonus shares (%) *** - 10.0 - - - - 10 Market value per share (at the end of the year) (Rs.) 43.5 45.0 23.2 26.1 25.1 18.0 61.7 - Lowest during the year (Rs.) 43.5 21.6 18.0 23.8 18.0 13.0 58.0 - Highest during the year (Rs.) 74.8 54.5 28.5 31.7 34.0 61.0 108.0 Break-up value per share (Rs.) 84.5 79.8 64.7 58.0 49.6 41.0 48.2 E - Capital Structure Ratios
Financial leverage ratio (%) 6.3 9.8 9.0 23.6 27.2 42.1 49.2 Long term debt to equity ratio (%) 1.2 0.7 0.5 3.6 - 2.2 5.6 Cost of debt 13.7 14.4 16.7 16.5 14.4 15.8 12.5 Long term debt : Equity ratio 1 : 99 1 : 99 0 : 100 3 : 97 0 : 100 2 : 98 5 : 95 Total liabilities to total assets (%) 14.9 15.6 21.1 26.6 37.1 38.1 38.2 Gearing ratio (%) 3.4 7.6 6.8 18.7 17.5 29.5 32.9 Interest coverage (times) 8.5 19.5 5.1 6.8 6.9 0.5 5.1 Notes: * The figures presented in this analysis for the financial years ended 30 June 2014, 2013, 2012, 2011, 2010 and 2009 are those based on the Group’s consolidated financial
statements. The figures presented for the financial years prior to 2009 are based on the Holding Company’s individual financial statements as published in the annual reports in those respective years.
** The basic and diluted earnings / (loss) per share for prior years have been restated to take into account the issue of bonus shares in the financial year ended 2013.
*** This includes declaration of final cash dividend and issue of bonus shares recommended by the Board of Directors subsequent to year end.
140 Crescent Steel and Allied Products Limited

Asset Management
-
5
10
15
20
25
30
35
(10)
(5)
-
5
10
15
20
2008 2009 2010 2011 2012 2013 2014
Debtors turnover (times) Inventory turnover (times)
Creditors turnover (times)Total assets turnover (times) Return on average assets (%)
Property, plant and equipment turnover (times)
Tim
es
Per
cent
age
Debt Management
-
5
10
15
20
25
30
35
40
-
5
10
15
20
2008 2009 2010 2011 2012 2013 2014
Total liabilities to total assets (%) Long term debt to equity (%)
Gearing ratio (%) Interest Coverage (times)
Per
cent
age
Tim
esDividend and Returns
-
10
20
30
40
50
-
0.5
1.0
1.5
2.0
2.5
3.0
3.5
4.0
2008 2009 2010 2011 2012 2013 2014
Dividend yield (%) Dividend payout ratio (%)
Bonus shares (%) Dividend per share (Rs.)
Rup
ees
Per
cent
age
Liquidity
-
300
600
900
1,200
1,500
2008 2009 2010 2011 2012 2013 2014
Rup
ees
in M
illio
n
Tim
es
-
0.5
1.0
1.5
2.0
2.5
3.0
Net current assets (Rs. in Millions) Current Ratio
Quick/Acid test Ratio
Per Share Result
(20)
-
20
40
60
80
100
(1)
-
1
2
3
4
5
6
7
8
9
10
2008 2009 2010 2011 2012 2013 2014
Earnings per share (Rs.) Dividend per share (Rs.)
Break-up value (Rs.)Price earnings ratio (times)
Market value (Year end) (Rs.)
Rup
ees
Tim
es
Return on capital and equity
(10)
(5)
-
5
10
15
20
25
2008 2009 2010 2011 2012 2013 2014
Return on capital employed (%) Return on average capital employed (%)
Return on equity (%) Return on average equity (%)
Per
cent
age
141Consolidated Financial Statements 2014

Rupees in million 2014 % 2013 % 2012 % 2011 % 2010 % 2009 % Restated Restated
Consolidated Balance Sheet
Property, plant and equipment 1,404 22.8 1,281 21.8 1,086 21.3 1,431 29.2 1,257 25.7 1,225 29.8 Intangible assets 39 0.6 14 0.2 2 - 13 0.3 24 0.5 1 - Investment property 73 1.2 62 1.1 36 0.7 40 0.8 45 0.9 47 1.1 Investment in equity accounted investees 2,540 41.2 2,040 34.6 1,806 35.5 1,498 30.6 1,231 25.1 1,031 25.2 Other long term investments 221 3.6 221 3.7 221 4.3 189 3.9 206 4.2 86 2.1 Long term loans and deposits 51 0.8 20 0.3 21 0.4 15 0.3 3 0.1 4 0.1 Deferred taxation - - - - 8 0.2 - - - - - - Stores, spares and loose tools 72 1.2 79 1.3 66 1.3 66 1.3 73 1.5 84 2.0 Stock-in-trade 407 6.6 662 11.3 587 11.5 841 17.1 1,027 21.0 617 15.0 Trade debts 89 1.4 197 3.4 369 7.3 145 3.0 277 5.7 84 2.0 Advances 58 0.9 32 0.5 138 2.7 30 0.6 55 1.1 40 1.0 Trade deposits and short term prepayments 7 0.1 10 0.2 6 0.1 6 0.1 6 0.1 6 0.1 Investments 758 12.3 946 16.1 523 10.3 491 10.0 463 9.5 655 16.0 Current portion of long term investments - - - - 8 0.2 17 0.3 - - 36 0.9 Mark-up accrued on term finance certificates - - - - - - 1 - 1 - 1 - Other receivables 143 2.3 135 2.3 48 0.9 62 1.3 25 0.5 161 3.9 Taxation - net 159 2.6 76 1.3 93 1.8 41 0.8 19 0.4 28 0.7 Cash and bank balances 144 2.3 80 1.4 69 1.4 19 0.4 183 3.7 4 0.1 Non-current asset held for sale - - 19 0.3 - - - - - - - - Total assets 6,165 100 5,874 100 5,087 100 4,905 100.0 4,895 100.0 4,110 100.0 Issued, subscribed and paid-up capital 621 10.1 565 9.6 565 11.1 565 11.5 565 11.5 565 13.7 Capital reserves 388 6.3 554 9.4 402 7.9 326 6.6 274 5.6 163 4.0 Revenue reserves 4,237 68.7 3,836 65.3 3,049 59.9 2,711 55.3 2,241 45.8 1,818 44.2 Shareholders’ equity 5,246 85.1 4,955 84.3 4,016 78.9 3,602 73.4 3,080 62.9 2,546 61.9 Long term loans - - - - - - 115 2.3 - - 56 1.4 Liabilities against assets subject to finance lease 62 1.0 34 0.6 20 0.4 15 0.3 - - - - Deferred income 2 - 1 - - - - - - - - - Deferred taxation 141 2.3 6 0.1 - - 50 1.0 72 1.5 100 2.4 Trade and other payables 434 7.0 415 7.1 692 13.6 378 7.8 873 17.9 374 9.1 Mark-up accrued 9 0.1 9 0.2 16 0.3 26 0.5 34 0.7 19 0.5 Short term borrowings 228 3.6 418 7.1 335 6.6 707 14.5 780 15.9 903 22.0 Current portion of deferred income 2 - 1 - - - - - - - - - Current portion of long term loan - - - - - - - - 56 1.1 112 2.7 Current portion of liabilities against assets subject to finance lease 41 0.7 32 0.5 8 0.2 12 0.2 - - - - Total equity and liabilities 6,165 100 5,871 100 5,087 100.0 4,905 100.0 4,895 100.0 4,110 100.0 Consolidated Profit and Loss Account
Sales - net 4,030 100.0 5,002 100 3,943 100 4,400 100 3,704 100.0 3,311 100.0 Cost of sales 3,800 94.3 4,351 87.0 3,434 87.1 3,590 82 2,887 77.9 2,597 78.4 Gross profit 230 5.7 651 13.0 509 12.9 810 18.4 817 22.1 714 21.6 Income from / (loss on) investments - net 441 10.9 348 7.0 68 1.7 189 4.3 223 6.0 (339) (10.2)Distribution and selling expenses 52 1.3 68 1.4 46 1.2 39 0.9 27 0.7 17 0.5 Administrative expenses 172 4.3 177 3.5 170 4.3 160 3.6 160 4.3 127 3.8 Other operating expenses 33 0.8 169 3.4 66 1.7 60 1.4 64 1.7 175 5.3 Other income 47 1.2 371 7.4 12 0.3 31 0.7 38 1.0 39 1.2 Operating profit before finance costs 461 11.4 956 19.1 307 7.7 771 17.5 827 22.4 95 3.0 Finance costs 95 2.4 63 1.3 110 2.8 144 3.3 122 3.3 204 6.2 Share of profit in equity accounted investees - net of taxation 341 8.5 269 5.4 255 6.5 207 4.7 11 0.3 4 0.1 Profit / (loss) before taxation 707 17.5 1,162 23.2 452 11.4 834 18.9 716 19.4 (105) (3.1)Taxation 154 3.8 272 5.4 (19) (0.5) 194 4.4 181 4.9 135 4.1 Profit / (loss) after taxation 553 13.7 890 17.8 471 11.9 640 14.5 535 14.5 (240) (7.2)
VERTICAL ANALYSIS CONSOLIDATEDFOR THE LAST SIX FINANCIAL YEARS
142 Crescent Steel and Allied Products Limited

Rupees in million 2014 % 2013 % 2012 % 2011 % 2010 % 2009 % Restated Restated
Consolidated Balance Sheet
Property, plant and equipment 1,404 9.6 1,281 18.0 1,086 (24.1) 1,431 13.8 1,257 2.6 1,225 (0.6)Intangible assets 39 178.6 14 600.0 2 (84.6) 13 (45.8) 24 2,300.0 1 - Investment property 73 17.7 62 72.2 36 (10.0) 40 (11.1) 45 (4.3) 47 (6.0)Investment in equity accounted investees 2,540 24.5 2,040 13.0 1,806 20.6 1,498 21.7 1,231 19.4 1,031 (19.5)Other long term investments 221 - 221 - 221 16.9 189 (8.3) 206 139.5 86 100.0 Long term loans and deposits 51 155.0 20 (4.8) 21 40.0 15 400.0 3 (25.0) 4 - Deferred taxation - - - (100.0) 8 100.0 - - - - - - Stores, spares and loose tools 72 (8.9) 79 19.7 66 - 66 (9.6) 73 (13.1) 84 9.1 Stock-in-trade 407 (38.5) 662 12.8 587 (30.2) 841 (18.1) 1,027 66.5 617 1.8 Trade debts 89 (54.8) 197 (46.6) 369 154.5 145 (47.7) 277 229.8 84 (29.4)Advances 58 81.3 32 (76.8) 138 360.0 30 (45.5) 55 37.5 40 60.0 Trade deposits and short term prepayments 7 (30.0) 10 66.7 6 - 6 - 6 - 6 200.0 Investments 758 (19.9) 946 80.9 523 6.5 491 6.0 463 (29.3) 655 (53.5)Current portion of long term investments - - - (100.0) 8 (52.9) 17 100.0 - (100.0) 36 100.0 Mark-up accrued on term finance certificates - - - - - (100.0) 1 - 1 - 1 (50.0)Other receivables 143 5.9 135 181.3 48 (22.6) 62 148.0 25 (84.5) 161 403.1 Taxation - net 159 109.2 76 (18.3) 93 126.8 41 115.8 19 (32.1) 28 100.0 Cash and bank balances 144 80.0 80 15.9 69 263.2 19 (89.6) 183 4,475.0 4 (50.0)Non-current asset held for sale - (100.0) 19 100.0 - - - - - - - - Total assets 6,165 5.0 5,874 15.5 5,087 3.7 4,905 0.2 4,895 19.1 4,110 (15.2) Issued, subscribed and paid-up capital 621 9.9 565 - 565 - 565 - 565 - 565 10.1 Capital reserves 388 (30.0) 554 37.8 402 23.3 326 19.0 274 68.1 163 (56.1)Revenue reserves 4,237 10.5 3,836 25.8 3,049 12.5 2,711 21.0 2,241 23.3 1,818 (13.8)Shareholders’ equity 5,246 5.9 4,955 23.4 4,016 11.5 3,602 16.9 3,080 21.0 2,546 (15.0)Long term loans - - - - - (100.0) 115 100.0 - (100.0) 56 (66.7)Liabilities against assets subject to finance lease 62 82.4 34 70.0 20 33.3 15 100.0 - - - - Deferred income 2 100.0 1 100.0 - - - - - - - - Deferred taxation 141 2,250.0 6 100.0 - (100.0) 50 (30.6) 72 (28.0) 100 (10.7)Trade and other payables 434 4.6 415 (40.0) 692 83.1 378 (56.7) 873 133.4 374 55.2 Mark-up accrued 9 - 9 (43.8) 16 (38.5) 26 (23.5) 34 78.9 19 (5.0)Short term borrowings 228 (45.5) 418 24.8 335 (52.6) 707 (9.4) 780 (13.6) 903 (19.3)Current portion of deferred income 2 100.0 1 100.0 - - - - - - - - Current portion of long term loan - - - - - - - (100.0) 56 (50.0) 112 - Current portion of liabilities against assets subject to finance lease 41 28.1 32 300 8 (33.3) 12 100.0 - - - - Total equity and liabilities 6,165 5.0 5,871 15.4 5,087 3.7 4,905 0.2 4,895 19.1 4,110 (15.2) Consolidated Profit and Loss Account
Sales - net 4,030 (19.4) 5,002 26.9 3,943 (10.4) 4,400 18.8 3,704 11.9 3,311 (21.2)Cost of sales 3,800 (12.7) 4,351 26.7 3,434 (4.3) 3,590 24.4 2,887 11.2 2,597 (21.4)Gross profit 230 (64.7) 651 27.9 509 (37.2) 810 (0.9) 817 14.4 714 (20.3)Income from / (loss on) investments - net 441 26.7 348 411.8 68 (64.0) 189 (15.2) 223 165.8 (339) (558.1)Distribution and selling expenses 52 (23.5) 68 47.8 46 17.9 39 44.4 27 58.8 17 13.3 Administrative expenses 172 (2.8) 177 4.1 170 6.3 160 - 160 26.0 127 (6.6)Other operating expenses 33 (80.5) 169 156.1 66 10.0 60 (6.3) 64 (63.4) 175 59.1 Other income 47 (87.3) 371 2,991.7 12 (61.3) 31 (18.4) 38 (2.6) 39 95.0 Operating profit before finance costs 461 (51.7) 956 211.4 307 (60.2) 771 (6.8) 827 770.5 95 (87.0)Finance costs 95 50.8 63 (42.7) 110 (23.6) 144 18.0 122 (40.2) 204 33.3 Share of profit in equity accounted investees - net of taxation 341 26.8 269 5.5 255 23.2 207 1,781.8 11 175.0 4 (92.2)Profit / (loss) before taxation 707 (39.1) 1,162 157.0 452 (45.8) 834 16.5 716 781.9 (105) (116.7)Taxation 154 (43.4) 272 1,531.6 (19) (109.8) 194 7.2 181 34.1 135 (36.0)Profit / (loss) after taxation 553 (37.8) 890 88.9 471 (26.4) 640 19.6 535 322.9 (240) (157.7)
HORIZONTAL ANALYSIS CONSOLIDATEDFOR THE LAST SIX FINANCIAL YEARS
143Consolidated Financial Statements 2014

KEY OPERATING AND FINANCIAL DATAFOR THE CURRENT AND PAST SIX FINANCIAL YEAR(S)
2014* 2013* 2012* 2011* 2010* 2009* 2008SUMMARIZED FINANCIAL DATA Restated Restated
A Summary of Profit and Loss Account (Rupees in millions) Sales - net 4,030.2 5,001.7 3,942.9 4,400.0 3,704.4 3,310.9 4,200.2 Cost of sales 3,799.9 4,350.8 3,434.1 3,590.1 2,887.3 2,597.2 3,303.8 Gross profit 230.3 650.9 508.8 809.9 817.1 713.7 896.4 Income from / (loss on) investments - net 441.4 348.1 67.8 188.6 222.7 (338.8) 73.6 Distribution, selling and administrative expenses 223.7 244.9 216.0 198.8 187.5 143.8 151.0 Other operating expenses 33.5 169.0 65.8 60.3 63.5 175.2 109.7 Other income 47.3 371.2 11.6 31.6 37.7 39.0 19.6 Operating profit before finance costs 461.8 956.3 306.4 771.0 826.5 94.9 728.9 Finance costs 94.9 62.9 109.5 144.0 121.9 203.6 153.0 Share of profit in equity accounted investees - net of taxation 340.5 269.5 255.3 206.9 11.2 3.7 50.8 Profit / (loss) before taxation 707.4 1,162.9 452.2 833.9 715.8 (105.0) 626.7 Taxation 154.2 272.0 (18.9) 194.1 181.0 134.7 210.9 Net income / (loss) 553.2 890.9 471.1 639.8 534.8 (239.7) 415.8 B Summary of Balance Sheet (Rupees in millions) Current assets 1,836.8 2,216.1 1,908.0 1,718.4 2,128.8 1,716.2 2,279.1 Stock-in-trade 407.2 662.4 586.7 840.6 1,026.6 616.4 606.1 Trade debts 89.5 196.9 368.9 145.1 276.9 83.9 118.7 Current liabilities 713.2 875.2 1,051.6 1,123.2 1,744.1 1,408.2 1,573.1 Trade and other payables 432.8 414.8 692.3 378.0 873.4 373.9 240.8 Property, plant and equipment 1,404.4 1,280.7 1,086.2 1,431.2 1,256.9 1,224.6 1,233.2 Total assets 6,165.2 5,872.7 5,087.2 4,905.2 4,894.8 4,109.7 4,846.7 Long term financing (excluding current maturity) 62.0 34.5 19.8 130.4 - 55.9 168.1 Deferred income (including current maturity) 4.0 2.3 - - - - - Deferred liabilities 141.5 6.2 - 50.4 71.6 99.8 111.5 Short term financing (including current maturity of long-term financing) 269.4 450.5 343.0 719.0 836.4 1,015.3 1,306.4 Reserves 4,625.1 4,391.0 3,451.2 3,036.7 2,514.6 1,981.2 2,480.7 Shareholders’ equity 5,246.2 4,955.6 4,015.8 3,601.3 3,079.2 2,545.8 2,994.0 C Summary of Cash Flow Statement (Rupees in millions) Cash and cash equivalents at the beginning of the year (206.3) (247.0) (551.1) (470.1) (644.7) (828.9) 26.3 Net cash generated / (used in) from operating activities 171.9 (85.1) 437.0 180.6 455.8 335.9 565.9 Net cash inflows / (outflows) from investing activities 283.4 77.9 254.8 (195.0) 27.9 70.4 (893.3) Net cash (outflows) / inflows from financing activities (333.1) 47.9 (387.7) (66.6) (309.1) (222.1) (527.8) Net increase / (decrease) in cash and cash equivalents 122.2 40.7 304.1 (81.0) 174.6 184.2 (855.2) Cash and cash equivalents at the end of the year (84.1) (206.3) (247.0) (551.1) (470.1) (644.7) (828.9) D Other Data (Rupees in millions) Depreciation and amortization 100.2 90.8 141.9 173.1 184.5 180.6 175.0 Capital expenditure 253.9 348.5 97.4 326.3 228.9 169.1 153.5 No. of ordinary shares (no. of shares in millions) 62.1 56.5 56.5 56.5 56.5 56.5 51.3 Payments to National Exchequer 361.4 731.4 290.4 360.3 499.2 520.4 712.3
* Note:
The figures presented in this analysis for the financial years ended 30 June 2014, 2013, 2012, 2011, 2010 and 2009 are those based on the Group’s consoli-
dated financial statements. The figures presented for the financial years prior to 2009 are based on the Holding Company’s individual financial statements
as published in the annual reports in those respective years.
144 Crescent Steel and Allied Products Limited

Earnings Before Interest, Taxation, Depreciation and Amortization (EBITDA)
(700)
(600)
(500)
(400)
(300)
(200)
(100)
-
100
200
300
400
500
600
700
800
2008 2009 2010 2011 2012 2013 2014
Steel segment Cotton segment IID segment Energy segment
Rup
ees
in M
illio
n
Management of Working Capital
-
20
40
60
80
100
120
-
2
4
6
8
10
12
2008 2009 2010 2011 2012 2013 2014
Average collection period (days) Inventory turnover (days)
Average payment days (days)Working Capital turnover (times)
Operating cycle (days)
Day
s
Tim
es
Movement in Stock Prices
-
20
40
60
80
100
120
2008 2009 2010 2011 2012 2013 2014
Increase in Price Decrease in Price
Rup
ees
Profit/(loss) before and after taxation
(400)
(200)
-
200
400
600
800
1000
1200
2008 2009 2010 2011 2012 2013 2014
Profit/(loss) before taxation Profit/(loss) after taxation
Rup
ees
in M
illio
n
Profitability and Return
(10)
(5)
-
5
10
15
20
25
2008 2009 2010 2011 2012 2013 2014
Gross profit margin to sales (%) Operating profit/(loss) margin to sales (%)
Net income/(loss) margin to sales (%)Return on average equity (%) Return on average assets (%)
Return on average capital employed (%)
Per
cent
age
Shareholders' equity and Break-up value per share
0
1000
2000
3000
4000
5000
6000
2008 2009 2010 2011 2012 2013 2014
Rup
ees
in M
illio
n
-
10
20
30
40
50
60
70
80
90
100
Rup
ees
Shareholders' equity (Rs. in millions) Break-up value per share (Rs.)
Total Assets as of 30 June 2014
Property, plant and equipment - 23%
Trade debts - 1%
Stock-in-trade - 7%
Investments including investment property - 58%
Other assets - 9%
Cash and bank balances - 2%
Total Liabilities as of 30 June 2014
Short term financing - 5%
Long term financing - 1%
Shareholders equity - 85%
Other current liabilities - 7%
Other current liabilities - 2%
145Consolidated Financial Statements 2014
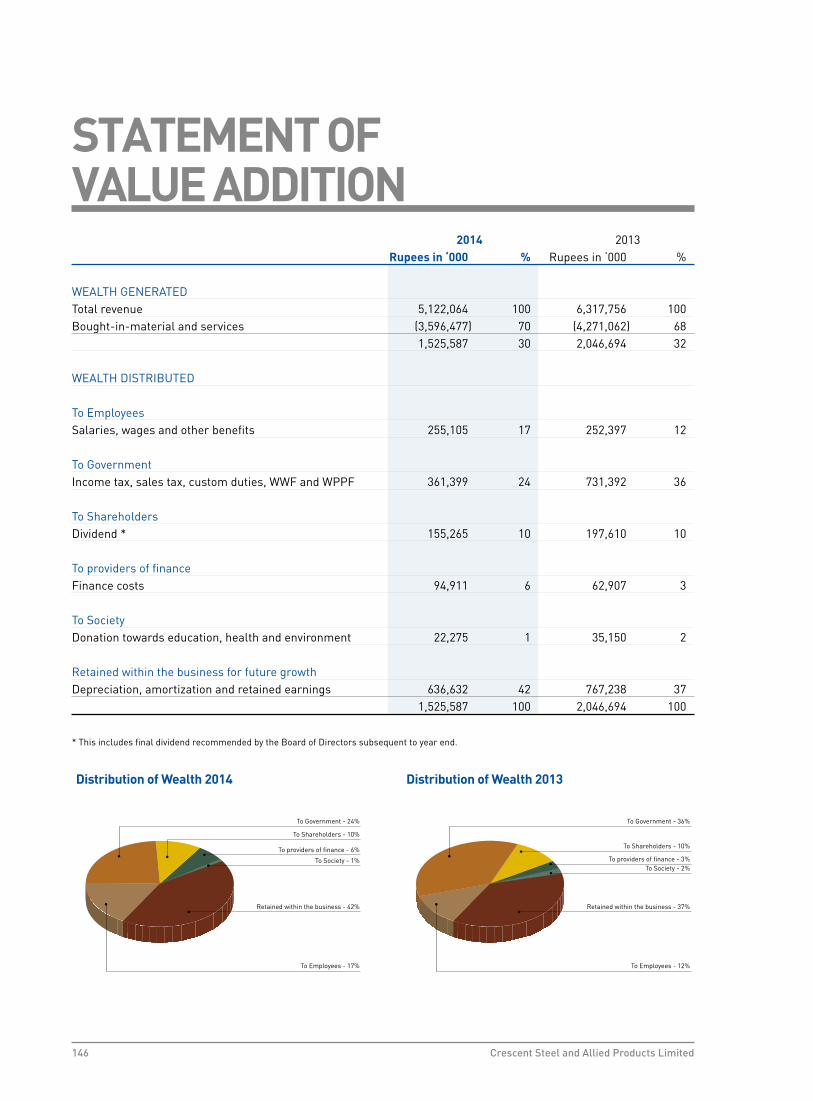
STATEMENT OF VALUE ADDITION 2014 2013 Rupees in ‘000 % Rupees in ‘000 % WEALTH GENERATED Total revenue 5,122,064 100 6,317,756 100Bought-in-material and services (3,596,477) 70 (4,271,062) 68 1,525,587 30 2,046,694 32
WEALTH DISTRIBUTED
To Employees Salaries, wages and other benefits 255,105 17 252,397 12 To Government Income tax, sales tax, custom duties, WWF and WPPF 361,399 24 731,392 36 To Shareholders Dividend * 155,265 10 197,610 10 To providers of finance Finance costs 94,911 6 62,907 3 To Society Donation towards education, health and environment 22,275 1 35,150 2
Retained within the business for future growth Depreciation, amortization and retained earnings 636,632 42 767,238 37 1,525,587 100 2,046,694 100
* This includes final dividend recommended by the Board of Directors subsequent to year end.
Distribution of Wealth 2014
To Society - 1%
Retained within the business - 42%
To Government - 24%
To providers of finance - 6%
To Employees - 17%
To Shareholders - 10%
Distribution of Wealth 2013
To Society - 2%
Retained within the business - 37%
To Government - 36%
To providers of finance - 3%
To Employees - 12%
To Shareholders - 10%
146 Crescent Steel and Allied Products Limited

COMMENTS ON CONSOLIDATEDANALYSIS SIX YEARSThe Group comprise of CSAPL and three wholly owned subsidiaries i.e. Shakarganj Energy (Private) Limited (SEL), CS Capital (Private) Limited (CSCL) and Crescent Hadeed (Private) Limited (CHL).
CONSOLIDATED PROFIT AND LOSS: The Company started presenting consolidated financial statements since 2010. The difference between the results of Separate and Consolidated financial statements mainly represents share of profits from equity accounted investments and investment income of CSCL. Share of profit has significantly increased from Rs. 11 million in 2010 to Rs. 341 million in 2014 mainly from investment in Altern Energy Limited, whereas, investment income contributed by CSCL amounted to Rs. 65 million in FY14 (2013: Rs. 50 million). SEL and CHL have not yet commenced operations, therefore the related impact in the consolidated profit and loss is insignificant.
CONSOLIDATED BALANCE SHEET:With respect to balance sheet, the gradual increase in property plant and equipment from 2010 represents capital expenditure in relation to SEL. During the year CHL also incurred capital expenditure of Rs. 82 million related to land and capital work in progress.
Also, investments in equity accounted investments have more than doubled from Rs. 1,031 million in 2009 to Rs. 2,540 million in 2014 mainly due to recognition of share of profits from Altern Energy Limited.
147Consolidated Financial Statements 2014

DIRECTORS’ REPORT CONSOLIDATEDThe Directors of Crescent Steel and Allied Products Limited (CSAPL) have pleasure in presenting their report together with the audited consolidated financial statements of the Group for the year ended 30 June 2014. The Group comprises of CSAPL and its wholly owned subsidiary companies Shakarganj Energy (Private) Limited, CS Capital (Private) Limited, Crescent Hadeed (Pvt) Limited and Crescent Continental Gas Pipelines Limited (CCGPL). CCGPL is not carrying on any business operations and accordingly no financial statements are being prepared.
The Directors’ Report giving commentary on the performance of CSAPL for the year ended 30 June 2014 has been presented separately.
GROUP RESULTSThe consolidated financial results of the Group are summarized below: 2014 2013Rupees in‘000 Restated
Profit for the year before taxation 707,603 1,162,728 Taxation (154,247) (272,039)Profit after taxation 553,356 890,689 Total other comprehensive (Loss)/ income for the year (5,565) 65,836 Unappropriated profit brought forward 1,993,754 1,206,609 Profit available for appropriation 2,541,545 2,163,134
Appropriations: - Final dividend 2012 - @10% - (56,460) - First interim dividend 2013 - @10% - (56,460) - Second interim dividend 2013 - @10% - (56,460) - Final dividend 2013 - @15% (84,690) - - First interim dividend 2014 - @10% (62,106) - (146,796) (169,380)Transfer to general reserve (800,000) -Unappropriated profit carried forward 1,594,749 1,993,754 Basic and diluted earnings per share Rs.8.91 Rs.14.34 PATTERN OF SHAREHOLDINGThe pattern of shareholding and additional information relating thereto is attached separately.
MATERIAL CHANGES AND COMMITMENTSNo material changes and commitments affecting the financial position of the Group have occurred between the end of the financial year to which this Balance Sheet relates and the date of the Directors’ Report.
CHIEF EXECUTIVE’S REVIEWThe Directors endorse the contents of the Chief Executive’s Review for the year ended 30 June 2014 which contains the state of the Group’s affairs, operational performance of CSAPL and its subsidiary companies, future prospects of profits and other requisite information. The contents of the said review shall be read along with this report and shall form an integral part of the Director’s Report in terms of section 236 of the Companies Ordinance, 1984 and the requirements of the Code of Corporate Governance under the Listing Regulations of the Stock Exchanges.
By order of the Board
Ahsan M. SaleemChief Executive Officer21 August 2014
148 Crescent Steel and Allied Products Limited

AUDITORS’ REPORT TO THE MEMBERS
We have audited the annexed consolidated financial statements comprising consolidated Balance Sheet of Crescent Steel and Allied Products Limited and its subsidiary companies (the Group) as at 30 June 2014 and the related consolidated profit and loss account, consolidated statement of comprehensive income, consolidated cash flow statement and consolidated statement of changes in equity together with the notes forming part thereof, for the year then ended. We have also expressed separate opinions on the financial statements of Crescent Steel and Allied Products Limited and its subsidiary companies namely CS Capital (Private) Limited and Crescent Hadeed (Private) Limited. The subsidiary company Shakarganj Energy (Private) Limited was audited by other firm of auditors whose report has been furnished to us and our opinion, in so far as it relates to the amounts included for such company, is based solely on the report of such other auditor. These consolidated financial statements are the responsibility of the Holding Company’s management. Our responsibility is to express an opinion on these financial statements based on our audit.
Our audit was conducted in accordance with the International Standards on Auditing and accordingly included such tests of accounting records and such other auditing procedures as we considered necessary in the circumstances.
In our opinion, the consolidated financial statements present fairly the financial position of Crescent Steel and Allied Products Limited and its subsidiary companies as at 30 June 2014 and the results of their operations for the year then ended.
Date: 21 August 2014 KPMG Taseer Hadi & Co.Karachi Chartered Accountants Muhammad Nadeem
149Consolidated Financial Statements 2014

2014 2013 2012Rupees in ‘000 Note (Restated) (Restated)
EQUITY AND LIABILITIES Share capital and reserves Authorized capital 100,000,000 ordinary shares of Rs. 10 each 1,000,000 1,000,000 1,000,000 Issued, subscribed and paid-up capital 6 621,060 564,600 564,600 Capital reserves 388,388 555,198 402,574 Revenue reserves 4,236,749 3,835,754 3,048,609 5,246,197 4,955,552 4,015,783
Non-current liabilities Liabilities against assets subject to finance lease 7 61,963 34,450 19,811 Deferred taxation 19 141,503 6,171 – Deferred income 8 2,324 1,413 – 205,790 42,034 19,811
Current liabilities Trade and other payables 9 432,818 414,826 692,342 Mark-up accrued 10 9,221 9,002 16,262 Short term borrowings 11 228,366 418,365 334,958 Current portion of deferred income 8 1,764 847 – Current portion of liabilities against assets subject to finance lease 7 41,066 32,116 8,073 713,235 875,156 1,051,635 Contingencies and commitments 12 Total equity and liabilities 6,165,222 5,872,742 5,087,229
CONSOLIDATED BALANCE SHEETAs at 30 June 2014
150 Crescent Steel and Allied Products Limited

2014 2013 2012Rupees in ‘000 Note (Restated) (Restated)
ASSETS Non-current assets Property, plant and equipment 13 1,404,441 1,280,704 1,086,169 Intangible assets 14 39,292 13,645 1,617 Investment property 15 73,316 62,408 35,632 Investment in equity accounted investees 16 2,540,064 2,040,213 1,805,860 Other long term investments 17 220,717 220,717 220,717 Long term loans and deposits 18 50,603 19,944 20,867 Deferred taxation 19 – – 8,394 4,328,433 3,637,631 3,179,256
Current assets Stores, spares and loose tools 20 71,956 78,639 65,860 Stock-in-trade 21 407,199 662,419 586,720 Trade debts 22 89,479 196,857 368,930 Advances 23 57,550 31,654 137,896 Trade deposits and short term prepayments 24 7,410 9,503 5,753 Investments 25 757,696 945,997 523,077 Current portion of long term investments – – 8,313 Mark-up accrued 26 473 – 275 Other receivables 27 142,096 135,841 48,426 Taxation - net 28 158,668 75,649 93,357 Cash and bank balances 29 144,262 79,552 69,366 1,836,789 2,216,111 1,907,973 Non-current asset held for sale – 19,000 –
Total assets 6,165,222 5,872,742 5,087,229 The annexed notes from 1 to 51 form an integral part of these consolidated financial statements.
Chief Executive Director Chief Financial Officer
151Consolidated Financial Statements 2014

2014 2013 Rupees in ‘000 Note (Restated)
Sales - net 30 4,030,170 5,001,667 Cost of sales 31 3,799,868 4,350,808 Gross profit 230,302 650,859 Income from investments 32 441,423 348,051 671,725 998,910
Distribution and selling expenses 33 52,072 68,065 Administrative expenses 34 171,662 176,786 Other operating expenses 35 33,431 169,034 257,165 413,885 414,560 585,025 Other income 36 47,312 371,158 Operating profit before finance costs 461,872 956,183 Finance costs 37 94,911 62,907 Share of profit in equity accounted investees - net of taxation (including gain on dilution of investment) 38 340,642 269,452 Profit before taxation 707,603 1,162,728 Taxation 39 154,247 272,039 Profit after taxation 553,356 890,689
(Rupees) Basic and diluted earnings per share 40 8.91 14.34 The annexed notes from 1 to 51 form an integral part of these consolidated financial statements.
Chief Executive Director Chief Financial Officer
CONSOLIDATED PROFIT AND LOSS ACCOUNTFor the year ended 30 June 2014
152 Crescent Steel and Allied Products Limited

2014 2013 Rupees in ‘000 Note (Restated)
Profit after taxation for the year 553,356 890,689 Other comprehensive income Items that may be reclassified subsequently to profit and loss Unrealized appreciation during the year on remeasurement of investments classified as ‘available for sale’ 49,345 153,595 Reclassification adjustments relating to gain realized on disposal of investments classified as ‘available for sale’ (211,393) (971) (Loss) / gain on remeasurement of staff retirement benefit plan - net of tax (5,565) 65,836 Proportionate share of other comprehensive income of equity accounted investees 51,698 – Other comprehensive income for the year (115,915) 218,460 Total comprehensive income for the year 437,441 1,109,149 The annexed notes from 1 to 51 form an integral part of these consolidated financial statements.
Chief Executive Director Chief Financial Officer
CONSOLIDATED STATEMENT OF COMPREHENSIVE INCOMEFor the year ended 30 June 2014
153Consolidated Financial Statements 2014

2014 2013 Rupees in ‘000 Note (Restated)
Cash flows from operating activities Cash generated from operations 41 490,140 408,726 Taxes paid (120,678) (279,071)Finance costs paid (94,692) (67,945)Contribution to gratuity and pension funds (12,252) (12,232)Contribution to Workers’ Profit Participation Fund (49,610) – Payment of infrastructure fee and liquidated damages (10,554) (5,890)Compensated absences paid (157) (547)Deferred income on sale and lease back 2,752 2,260 10-C bonus paid (2,360) (4,909)Long term loans and deposits - net (30,659) (125,526)Net cash generated from / (used in) operating activities 171,930 (85,134) Cash flows from investing activities Capital expenditure (253,917) (348,469)Acquisition of intangible assets (30,712) (14,457)Sale proceeds on disposal of held for sale 4,249 – Proceeds from disposal of operating fixed assets 34,355 25,368 Proceeds from disposal of operating fixed assets under sale and leaseback arrangement 69,898 62,150 Proceeds from assets subject to insurance claim – 281,531 Investments - net 333,884 11,108 Dividend income received 124,883 59,495 Interest income received 762 1,185 Net cash inflows from investing activities 283,402 77,911 Cash flows from financing activities Proceeds from long term loan / (repayments against long term loan) - net – 126,444 Payments against finance lease obligations (42,807) (25,005)Proceeds from short term loans / (repayments against short term loans) - net (132,475) 113,927 Dividends paid (157,816) (167,437)Net cash (used in) / inflows from financing activities (333,098) 47,929 Net increase in cash and cash equivalents 122,234 40,706 Cash and cash equivalents at beginning of the year (206,338) (247,044)Cash and cash equivalents at end of the year 42 (84,104) (206,338) The annexed notes from 1 to 51 form an integral part of these consolidated financial statements.
CONSOLIDATED CASH FLOW STATEMENTFor the year ended 30 June 2014
Chief Executive Director Chief Financial Officer
154 Crescent Steel and Allied Products Limited

Rupees in ‘000 Issued, Capital reserves Revenue reserves Total subscribed Share Unrealized Other* General Unappropriated and paid-up premium appreciation / reserve profit capital (diminution) on remeasurement of investments classified as ‘available for sale’
Balance as at 1 July 2012 - as previously reported 564,600 349,959 27,343 25,272 1,842,000 1,198,788 4,007,962 Change in accounting policy for reversal of defined benefit liability recognition of actuarial gains and losses (refer note 4.1.1) – – – – – 7,821 7,821 Balance as at 1 July 2012 - as restated 564,600 349,959 27,343 25,272 1,842,000 1,206,609 4,015,783
Total comprehensive income for the year ended 30 June 2013
Profit after taxation – – – – – 890,689 890,689 Other comprehensive income Total Other comprehensive income for the year – – 152,624 – – 65,836 218,460 Total comprehensive income for the year – – 152,624 – – 956,525 1,109,149 Transactions with owners Dividend: - Final @ 10% (i.e. Re. 1 per share) for the year ended 30 June 2012 – – – – – (56,460) (56,460)- First interim @ 10% (i.e. Re. 1 per share) for the year ended 30 June 2013 – – – – – (56,460) (56,460)- Second interim @ 10% (i.e. Re. 1 per share) for the year ended 30 June 2013 – – – – – (56,460) (56,460) – – – – – (169,380) (169,380)Balance as at 30 June 2013 - as restated 564,600 349,959 179,967 25,272 1,842,000 1,993,754 4,955,552 Balance as at 1 July 2013 as previously reported 564,600 349,959 179,967 25,272 1,842,000 1,919,907 4,881,705
Effect of change in accounting policy (refer note 4.1.1) – – – – – 73,847 73,847 Balance as at 1 July 2013 - restated 564,600 349,959 179,967 25,272 1,842,000 1,993,754 4,955,552 Transfer to general reserves – – – – 800,000 (800,000) –
Total comprehensive income for the year ended 30 June 2013
Profit after taxation – – – – – 553,356 553,356 Other comprehensive income Total Other comprehensive income for the year – – (162,048) 51,698 – (5,565) (115,915)Total comprehensive income for the year – – (162,048) 51,698 – 547,791 437,441
Transactions with owners Dividend: - Final @ 15% (i.e. Rs. 1.5 per share) for the year ended 30 June 2013 – – – – – (84,690) (84,690)- First interim @ 10% (i.e. Re. 1 per share) for the year ended 30 June 2014 – – – – – (62,106) (62,106) – – – – – (146,796) (146,796)Issuance of Bonus shares final 2013 @ 10% 56,460 (56,460) – – – – – Balance as at 30 June 2014 621,060 293,499 17,919 76,970 2,642,000 1,594,749 5,246,197 * This represents the Group’s share of various reserves held by equity accounted investees. The annexed notes from 1 to 51 form an integral part of these consolidated financial statements.
CONSOLIDATED STATEMENT OF CHANGES IN EQUITYFor the year ended 30 June 2014
Chief Executive Director Chief Financial Officer
155Consolidated Financial Statements 2014
1. THE GROUP AND ITS OPERATIONS
1.1 The Group consists of Crescent Steel and Allied Products Limited (‘the Holding Company’) and its wholly owned subsidiary companies namely; CS Capital (Private) Limited, Shakarganj Energy (Private) Limited, Solution de Energy (Private) Limited, Crescent Hadeed (Private) Limited and Crescent Continental Gas Pipelines Limited.The Holding Company was incorporated on 1 August 1983 as a public limited company in Pakistan under the Companies Act, 1913 (now Companies Ordinance, 1984) and is quoted on all stock exchanges of Pakistan. The registered offices of the Holding Company and its subsidiary companies are located at 10th floor, BOP Tower, 10-B, Block E-2, Main Boulevard, Gulberg-III, Lahore, whereas their principal offices are situated at 9th floor Sidco Avenue Centre 264 R.A. Lines, Karachi.
1.2 The Holding Company’s steel segment is one of the down stream industries of Pakistan Steel Mills, manufacturing
large diameter spiral arc welded steel line pipes at Nooriabad (District Dadu). The Holding Company has a coating facility capable of applying three layer high density polyethylene coating on steel line pipes. The coating plant commenced commercial production from 16 November 1992.
The Holding Company acquired a running spinning unit of 14,400 spindles (now 19,680 spindles) at Jaranwala
(District Faisalabad) on 30 June 2000 from Crescent Jute Products Limited. The cotton spinning activity is carried out by the Holding Company under the name and title of ‘Crescent Cotton Products a division of Crescent Steel and Allied Products Limited’. The Holding Company also deals in equity shares.
1.3 CS Capital (Private) Limited was incorporated on 5 November 2010 as a private limited company in Pakistan
under the Companies Ordinance,1984. The principal activity of the subsidiary company is to effectively manage investment portfolios in shares, commodities and other securities (strategic as well as short term). On 26 September 2011, the Holding Company has purchased the entire shareholding from its previous principal shareholder. Consequently, the Company becomes the wholly owned subsidiary of the Holding Company.
1.4 Shakarganj Energy (Private) Limited was incorporated on 02 April 2008 as a private limited company in Pakistan
under the Companies Ordinance, 1984. The principal activity of the subsidiary company is to build, own, operate and maintain a power plant and to generate, accumulate, distribute, sell and supply electricity / power to PEPCO / DISCOS under agreement with the Government of Pakistan or to any other consumer as permitted. The subsidiary company has commissioned a 100 TPH high pressure boiler with 15 MW back pressure turbine to operate and generate 15 MW of electricity for onward sale of 8 MW to Shakarganj Mills Limited - a related party and balance to Faisalabad Electric Supply Company Limited (FESCO) during sugar crushing season only as per the feasibility business plan.
1.5 Solution de Energy (Private) Limited was incorporated as a private limited company in Pakistan under the
provisions of the Companies Ordinance, 1984 as a result of a Joint Venture (JV) agreement between the Holding Company and a partnership concern. The principal activity of the subsidiary company is to build, own, operate and maintain 100MW solar power project (the Project) and to generate, accumulate, distribute, sell and supply electricity / power to PEPCO / DISCOS under the agreement with the Government of Pakistan or to any other consumer as permitted. As at 30 June 2014, all the shares are held by Shakarganj Energy (Private) Limited. The Company has been granted Letter of Interest (LOI) by the Punjab Power Development Board (PPDB) and currently the Company is in the phase of completing the requirements specified in LOI.
1.6 Crescent Hadeed (Private) Limited was incorporated on 15 May 2013 as a private limited company in Pakistan under the provisions of the Companies Ordinance,1984. The principal business of the subsidiary company will be to manufacture and sale of steel billets through a Steel Melting plant, to be located at Bhone, District Jhang, Punjab. The subsidiary company is currently in the process of setting up its plant / factory.
1.7 Crescent Continental Gas Pipelines Limited is not carrying on any business operations.
NOTES TO THE CONSOLIDATED FINANCIAL STATEMENTSFor the year ended 30 June 2014
156 Crescent Steel and Allied Products Limited

NOTES TO THE CONSOLIDATED FINANCIAL STATEMENTSFor the year ended 30 June 2014
2. BASIS OF PREPARATION
2.1 Consolidated financial statements
These consolidated financial statements have been prepared from the information available in the separate financial statements of the Holding Company, CS Capital (Private) Limited, Crescent Hadeed (Private) Limited and the consolidated financial statements of Shakarganj Energy (Private) Limited for the year ended 30 June 2014. Crescent Continental Gas Pipelines Limited is not carrying on any business operations and accordingly no financial statements are being prepared. Details regarding the financial information of associates used in the preparation of these consolidated financial statements are given in note 16 to these consolidated financial statements.
The accounting policies used by the subsidiary companies in preparation of their financial statements
are consistent with that of the Holding Company. The accounting policies used by the Group’s associates in preparation of their respective financial statements are also consistent with that of the Holding Company. Where policies are different, necessary adjustments are made to the financial statements of that associate to bring its accounting policies in line with those used by the Group.
2.2 Statement of compliance
These consolidated financial statements have been prepared in accordance with the approved accounting standards as applicable in Pakistan. Approved accounting standards comprise of such International Financial Reporting Standards (IFRS) issued by the International Accounting Standards Board as are notified under the Companies Ordinance, 1984, provisions of and directives issued under the Companies Ordinance, 1984. In case requirements differ, the provisions of and directives of the Companies Ordinance, 1984 shall prevail.
2.3 Basis of measurement
These consolidated financial statements have been prepared under the historical cost convention except for investments classified as held for trading and available for sale which are stated at fair value and obligations in respect of gratuity and pension schemes which are measured at present value of defined benefit obligation less fair value of the plan assets.
2.4 Functional and presentation currency
These consolidated financial statements are presented in Pakistan Rupees which is also the Group’s functional currency and has been rounded to the nearest thousand.
3. USE OF ESTIMATES AND JUDGEMENTS
The preparation of consolidated financial statements in conformity with approved accounting standards, as applicable in Pakistan, requires management to make judgements, estimates and assumptions that affect the application of accounting policies and the reported amounts of assets, liabilities, income and expenses. The estimates and associated assumptions are based on historical experience and various other factors that are believed to be reasonable under the circumstances, the results of which form the basis of making the judgements about the carrying values of assets and liabilities that are not readily apparent from other sources. Actual results may differ from these estimates.
The estimates and underlying assumptions are reviewed on an ongoing basis. Revisions to accounting estimates
are recognized in the period in which the estimates are revised if the revision affects only that period, or in the period of the revision and future periods if the revision affects both current and future periods.
Judgements made by the management in the application of approved accounting standards, as applicable in
Pakistan, that have significant effect on the consolidated financial statements and estimates with a significant risk of material adjustment in the next financial year are set forth below:
157Consolidated Financial Statements 2014

Property, plant and equipment and depreciation (refer note 5.2) Intangible assets and amortization (refer note 5.3) Investments (refer note 5.5 and 5.6) Stock-in-trade, stores, spares and loose tools (refer note 5.8 and 5.9) Staff retirement benefits (refer note 5.12) Leases (refer note 5.14) Income taxes (refer note 5.16) Impairment (refer note 5.2, 5.3, 5.5 and 5.20) 4. NEW OR AMENDMENTS TO EXISTING STANDARD / INTERPRETATION AND FORTHCOMING REQUIREMENTS
4.1 Standards, amendments or interpretations which became effective during the year
During the year, certain amendments to standards became effective, however, the amendments or interpretation did not have any material effect on the consolidated financial statements of the Group except for the revised IAS 19 ‘Employees Benefits’ detail of which are stated in note 4.1.1.
4.1.1 Employee Benefits - change in accounting policy
With effect from 01 January 2013, the revised IAS 19 ‘Employee Benefits’ became effective. The revised IAS 19 requires actuarial gains and losses to be recognized immediately in other comprehensive income. Previously, actuarial gains and losses over and above the corridor limit were amortized over the expected average remaining working lives of employees as allowed under the relevant provision of previous IAS 19. Further, any past service costs are now recognized immediately in the consolidated profit and loss as soon as the change in the benefit plans are made. Previously, only vested past service costs were recognized immediately in consolidated profit and loss account and non-vested cost were amortized to consolidated profit and loss account over the vesting period. The standard also replaces the interest cost on the defined benefit obligation and the expected return on plan assets with a net interest cost based on the net defined benefit assets or liability and the discount rate, measured at the beginning of the year. Refer note 5.12.2.2 for revised accounting policy.
These changes have been accounted for retrospectively in accordance with International Accounting Standard
- 8 “Accounting Policies, Changes in Accounting Estimates and Errors”, resulting in restatement of financial statements of prior periods. Resultantly, the cumulative balance for un-recognised actuarial losses that existed as at 1 July 2012 have been presented and disclosed as part of the statement of changes in equity, while the corresponding period adjustment through other comprehensive income is re-stated and disclosed as part of the Consolidated Statement of Comprehensive Income. The consolidated balance sheet also presents the prior year numbers as restated, due to the said change.
The effect of the change in accounting policy has been demonstrated below:
30 June 2013 1 July 2012 As Effect due As As Effect due As previously to change in restated previously to change in restatedRupees in ‘000 reported policy reported policy
Effect on balance sheet Trade and other payables 415,057 (231) 414,826 692,709 (367) 692,342 Deferred taxation (33,593) 39,764 6,171 (12,606) 4,212 (8,394) Revenue reserves 3,761,907 73,847 3,835,754 3,040,788 7,821 3,048,609 Other receivables 22,461 113,380 135,841 36,760 11,666 48,426
NOTES TO THE CONSOLIDATED FINANCIAL STATEMENTSFor the year ended 30 June 2014
158 Crescent Steel and Allied Products Limited

Rupees in ‘000 2013
Effect on profit and loss accountDecrease in profit before tax due to recognition of past service cost in prior years (190)
Effect on other comprehensive income Recognition of actuarial gain (101,388)Recognized tax charge 35,552 (65,836)
4.2 New / revised accounting standards, amendments to published accounting standards, and interpretations that are not yet effective
The following new standards, amendments to existing standards and interpretations of approved accounting standards will be effective for accounting periods beginning on or after 01 July 2014:
- IFRIC 21- Levies ‘an Interpretation on the accounting for levies imposed by governments’ (effective for annual periods beginning on or after 1 January 2014). IFRIC 21 is an interpretation of IAS 37 Provisions, Contingent Liabilities and Contingent Assets. IAS 37 sets out criteria for the recognition of a liability, one of which is the requirement for the entity to have a present obligation as a result of a past event (known as an obligating event). The Interpretation clarifies that the obligating event that gives rise to a liability to pay a levy is the activity described in the relevant legislation that triggers the payment of the levy. The interpretation is not likely to have an impact on Group’s consolidated financial statements.
- Offsetting Financial Assets and Financial Liabilities (Amendments to IAS 32) – (effective for annual periods
beginning on or after 1 January 2014). The amendments address inconsistencies in current practice when applying the offsetting criteria in IAS 32 Financial Instruments: Presentation. The amendments clarify the meaning of ‘currently has a legally enforceable right of set-off’; and that some gross settlement systems may be considered equivalent to net settlement. The amendments are not likely to have an impact on Group’s consolidated financial statements.
- Amendment to IAS 36 “Impairment of Assets” Recoverable Amount Disclosures for Non-Financial Assets
(effective for annual periods beginning on or after 1 January 2014). These narrow-scope amendments to IAS 36 Impairment of Assets address the disclosure of information about the recoverable amount of impaired assets if that amount is based on fair value less costs of disposal. The amendments are not likely to have an impact on Group’s consolidated financial statements.
- Amendments to IAS 39 “Financial Instruments: Recognition and Measurement” Continuing hedge
accounting after derivative novation (effective for annual periods beginning on or after 1 January 2014). The amendments add a limited exception to IAS 39, to provide relief from discontinuing an existing hedging relationship when a novation that was not contemplated in the original hedging documentation meets specific criteria. The amendments are not likely to have an impact on Group’s consolidated financial statements.
- Amendments to IAS 19 “Employee Benefits” Employee contributions – a practical approach (effective
for annual periods beginning on or after 1 July 2014). The practical expedient addresses an issue that arose when amendments were made in 2011 to the previous pension accounting requirements. The amendments introduce a relief that will reduce the complexity and burden of accounting for certain contributions from employees or third parties. The amendments are relevant only to defined benefit plans that involve contributions from employees or third parties meeting certain criteria. The amendments are not likely to have an impact on Group’s consolidated financial statements.
NOTES TO THE CONSOLIDATED FINANCIAL STATEMENTSFor the year ended 30 June 2014
159Consolidated Financial Statements 2014

- Amendments to IAS 38 Intangible Assets and IAS 16 Property, Plant and Equipment (effective for annual periods beginning on or after 1 January 2016) introduce severe restrictions on the use of revenue-based amortization for intangible assets and explicitly state that revenue-based methods of depreciation cannot be used for property, plant and equipment. The rebuttable presumption that the use of revenue-based amortisation methods for intangible assets is inappropriate can be overcome only when revenue and the consumption of the economic benefits of the intangible asset are ‘highly correlated’, or when the intangible asset is expressed as a measure of revenue. The amendments are not likely to have an impact on Group’s consolidated financial statements.
- Agriculture: Bearer Plants [Amendment to IAS 16 and IAS 41] (effective for annual periods beginning on
or after 1 January 2016). Bearer plants are now in the scope of IAS 16 Property, Plant and Equipment for measurement and disclosure purposes. Therefore, a company can elect to measure bearer plants at cost. However, the produce growing on bearer plants will continue to be measured at fair value less costs to sell under IAS 41 Agriculture. A bearer plant is a plant that: is used in the supply of agricultural produce; is expected to bear produce for more than one period; and has a remote likelihood of being sold as agricultural produce. Before maturity, bearer plants are accounted for in the same way as self-constructed items of property, plant and equipment during construction. The amendments are not likely to have an impact on Group’s consolidated financial statements.
- Annual Improvements 2010-2012 and 2011-2013 cycles (most amendments will apply prospectively for
annual period beginning on or after 1 July 2014). The new cycle of improvements contain amendments to the following standards:
- IFRS 2 ‘Share-based Payment’. IFRS 2 has been amended to clarify the definition of ‘vesting
condition’ by separately defining ‘performance condition’ and ‘service condition’. The amendment also clarifies both: how to distinguish between a market condition and a non-market performance condition and the basis on which a performance condition can be differentiated from a vesting condition.
- IFRS 3 ‘Business Combinations’. These amendments clarify the classification and measurement
of contingent consideration in a business combination. Further IFRS 3 has also been amended to clarify that the standard does not apply to the accounting for the formation of all types of joint arrangements including joint operations in the financial statements of the joint arrangement themselves.
- IFRS 8 ‘Operating Segments’ has been amended to explicitly require the disclosure of judgments
made by management in applying the aggregation criteria. In addition this amendment clarifies that a reconciliation of the total of the reportable segment’s assets to the entity assets is required only if this information is regularly provided to the entity’s chief operating decision maker. This change aligns the disclosure requirements with those for segment liabilities.
- Amendments to IAS 16 ‘Property, plant and equipment’ and IAS 38 ‘Intangible Assets’. The
amendments clarify the requirements of the revaluation model in IAS 16 and IAS 38, recognizing that the restatement of accumulated depreciation (amortization) is not always proportionate to the change in the gross carrying amount of the asset.
- IAS 24 ‘Related Party Disclosure’. The definition of related party is extended to include a
management entity that provides key management personnel services to the reporting entity, either directly or through a group entity.
- IAS 40 ‘Investment Property’. IAS 40 has been amended to clarify that an entity should assess
whether an acquired property is an investment property under IAS 40 and perform a separate assessment under IFRS 3 to determine whether the acquisition of the investment property constitutes a business combination.
NOTES TO THE CONSOLIDATED FINANCIAL STATEMENTSFor the year ended 30 June 2014
160 Crescent Steel and Allied Products Limited

The above amendments are not likely to have an impact on the Group’s consolidated financial statements.
5. SUMMARY OF SIGNIFICANT ACCOUNTING POLICIES
Significant accounting policies applied in the preparation of these consolidated financial statements are set forth below and have been applied consistently to all years presented except as disclosed in notes 4.1.1 and 5.12.2.2.
5.1 Basis of consolidation
Subsidiaries
The consolidated financial statements include the financial statements of the Holding Company and its subsidiary companies.
Subsidiaries are those entities in which the Holding Company directly or indirectly controls, beneficially owns
or holds more than 50 percent of its voting securities or otherwise has power to elect and appoint more than 50 percent of its directors. The financial statements of subsidiaries are included in the consolidated financial statements from the date control commences. The financial statements of the subsidiaries are consolidated on a line-by-line basis and the carrying value of investment held by the Holding Company is eliminated against the Holding Company’s share in paid up capital of the subsidiaries. The Group applies uniform accounting policies for like transactions and events in similar circumstances except where specified otherwise.
All material inter-group balances, transactions and resulting unrealized profits / losses are eliminated. Investments in associates
Entities in which the Group has significant influence directly or indirectly (through subsidiaries) but not control and which are neither subsidiaries nor joint ventures of the members of the Group are associates and are accounted for under the equity method of accounting (equity accounted investees).
These investments are initially recognized at cost. The consolidated financial statements include the associates’
share of profit or loss and movements in other comprehensive income, after adjustments, if any, to align the accounting policies with those of the Group, from the date that significant influence commences until the date it ceases. Share of post acquisition profit and loss of associates is recognized in the consolidated profit and loss account and consolidated statement of comprehensive income. Distributions received from associates reduce the carrying amount of investment. When the Group’s share of losses exceeds its interest in an equity accounted investee, the carrying amount of that investment (including any long-term interests that, in substance, form part of the Group’s net investment in the associate) is reduced to nil and the recognition of further losses is discontinued.
The carrying amount of investments in associates is reviewed at each reporting date to determine whether
there is any indication of impairment. If any such indication exists, the recoverable amount of the investments is estimated which is higher of its value in use and its fair value less costs to sell. An impairment loss is recognized if the carrying amount exceeds its recoverable amount and is charged to consolidated profit and loss account. An impairment loss is reversed if there has been a change in estimates used to determine the recoverable amount but limited to the extent of carrying amount that would have been determined if no impairment loss had been recognized. A reversal of impairment loss is recognized in the consolidated profit and loss account.
5.2 Property, plant and equipment and depreciation
Owned assets
Property, plant and equipment, except freehold land are stated at cost less accumulated depreciation and impairment losses, if any. Freehold land is stated at cost.
NOTES TO THE CONSOLIDATED FINANCIAL STATEMENTSFor the year ended 30 June 2014
161Consolidated Financial Statements 2014

Cost includes expenditure that is directly attributable to the acquisition of the asset. The cost of self-constructed assets include the cost of materials and direct labour, any other cost directly attributable to bring the assets to a working condition for their intended use, the cost of dismantling and removing the items and restoring the site on which they are located and capitalized borrowing costs, if any.
Subsequent cost
The cost of replacing part of an item of property, plant and equipment is recognized in the carrying amount of the item if it is probable that the future economic benefits embodied within that part will flow to the Group and its cost can be measured reliably. The carrying amount of the part so replaced is derecognized. The costs relating to day-to-day servicing of property, plant and equipment are recognized in profit and loss account as incurred.
Depreciation
Depreciation is charged to income on a straight line basis at the rates specified in note 13.1 to these consolidated financial statements. Depreciation on additions to property, plant and equipment is charged from the month in which an item is acquired or capitalized while no depreciation is charged for the month in which the item is disposed off or retained.
The assets’ residual values and useful lives are reviewed at each financial year end and adjusted if appropriate. Disposal
The gain or loss on disposal or retirement of an asset represented by the difference between the sale proceeds and the carrying amount of the asset is recognized as an income or expense.
Leased assets
Upon initial recognition, an asset acquired by way of finance lease is stated at an amount equal to the lower of its fair value and the present value of minimum lease payments, each determined at the inception of the lease. Subsequent to initial recognition, the asset is stated at the amount determined at initial recognition less accumulated depreciation and impairment losses, if any.
Depreciation is charged on the same basis as used for owned assets. Capital work in progress
Capital work in progress is stated at cost and consists of expenditure incurred and advances made in respect of tangible and intangible assets in the course of their construction and installation. Transfers are made to relevant assets category as and when assets are available for intended use.
Impairment
The carrying amount of property, plant and equipment is reviewed at each reporting date to determine whether there is any indication of impairment. If any such indication exists then the assets recoverable amount is estimated. The recoverable amount is the greater of its value in use and fair value less cost to sell. An impairment is recognized if the carrying amount exceeds its estimated recoverable amount.
5.3 Intangible assets
Intangible assets are stated at cost less accumulated amortization and impairment losses, if any. Subsequent expenditure
Subsequent expenditure on capitalized intangible assets is capitalized only when it increases the future economic benefits embodied in the specific assets to which it relates. All other expenditure is expensed as incurred.
NOTES TO THE CONSOLIDATED FINANCIAL STATEMENTSFor the year ended 30 June 2014
162 Crescent Steel and Allied Products Limited
Amortization
Amortization is charged to the income statement on a straight line basis over the estimated useful lives of intangible assets unless such lives are indefinite. Amortization on additions to intangible assets is charged from the month in which an item is acquired or capitalized while no amortization is charged for the month in which the item is disposed off.
Research and development expenditures
Expenditure on research activities, undertaken with the prospect of gaining new scientific or technical knowledge and understanding, is recognised in profit or loss as incurred.
Development activities involve a plan or design for the production of new or substantially improved products
and processes. Development expenditure is capitalised only if development costs can be measured reliably, the product or process is technically and commercially feasible, future economic benefits are probable, and the subsidiary company intends to and has sufficient resources to complete development and to use or sell the asset. The expenditure capitalized includes the cost of materials, direct labour, overhead costs that are directly attributable to preparing the asset for its intended use, and capitalized borrowing costs. Other development expenditure is recognized in consolidated profit or loss as incurred. Capitalised development expenditure is stated at cost less accumulated amortization and accumulated impairment loss, if any. During the period expenses incurred in respect of the project have been capitalized (Refer note 14).
Impairment
All intangible assets with an indefinite useful life are systematically tested for impairment at each reporting date. Where the carrying amount of asset exceeds its estimated recoverable amount it is written down immediately to its recoverable amount. The carrying amount of other intangible assets are reviewed at each reporting date to determine whether there is any indication of impairment. If any such indication exist than the assets recoverable amount is estimated. The recoverable amount is the higher of its value in use and fair value less cost to sell. An impairment is recognized if the carrying amount exceeds its estimated recoverable amount.
5.4 Investment property
Investment property, principally comprising of land and buildings, is held for long term rental yields / capital appreciation. The investment property of the Group comprises of land and buildings and is valued using the cost method i.e. at cost less any accumulated depreciation and impairment losses, if any.
Cost includes expenditure that is directly attributable to the acquisition of the investment property. The cost of
self-constructed investment property includes the cost of materials and direct labour, any other costs directly attributable to bringing the investment property to a working condition for their intended use and capitalized borrowing costs, if any.
Depreciation is charged to income on the straight line method so as to allocate the depreciable amount over
its estimated useful life. Depreciation on additions to investment property is charged from the month in which a property is acquired or capitalized while no depreciation is charged for the month in which the property is disposed off.
The residual values and useful lives of investment property are reviewed at each reporting date and adjusted if
appropriate.
NOTES TO THE CONSOLIDATED FINANCIAL STATEMENTSFor the year ended 30 June 2014
163Consolidated Financial Statements 2014

The Group assesses at each reporting date whether there is any indication that investment property may be impaired. If such indication exists, the carrying amounts of such assets are reviewed to assess whether they are recorded in excess of their recoverable amount. Where carrying values exceed the respective recoverable amounts, assets are written down to their recoverable amounts and the resulting impairment loss is recognized in the consolidated profit and loss account. The recoverable amount is the higher of an asset’s fair value less costs to sell and value in use. Where an impairment loss is recognized, the depreciation charge is adjusted in the future period to allocate the asset’s revised carrying amount over its estimated useful life.
The gain or loss on disposal of investment property, represented by the difference between the sale proceeds
and the carrying amount of the asset is recognized as income or expense. 5.5 Investments
Financial assets at fair value through profit or loss
A non-derivative financial asset is classified as at fair value through profit or loss if it is held for trading or is designated as such upon initial recognition. Investments are designated at fair value through profit or loss if the Group manages such investments and makes purchase and sale decisions based on their fair value. Upon initial recognition, attributable transaction costs are recognized in the consolidated profit and loss account when incurred. Investments at fair value through profit or loss are measured at fair value and changes therein are recognized in the consolidated profit and loss account.
Held to maturity investments
Held to maturity investments are non-derivative financial assets with fixed or determinable payments and fixed maturity that the Group has positive intention and ability to hold to maturity. Investments classified as held to maturity are recognized initially at fair value, plus attributable transaction costs. Subsequent to initial recognition, held to maturity financial assets are measured at amortized cost using the effective interest method, less any impairment loss, if any.
Loans and receivables
Loans and receivables are recognized initially at fair value, plus attributable transaction costs. Subsequent to initial recognition, loans and receivables are measured at amortized cost using effective interest method, less impairment losses, if any.
Available for sale investments
Other investments not covered in any of the above categories are classified as available for sale and are initially recognized at fair value plus attributable transactions costs. Subsequent to initial recognition these are measured at fair value, with any resultant gain or loss being recognized in other comprehensive income. Gains or losses on available for sale investments are recognized in other comprehensive income until the investments are sold or disposed off or until the investments are determined to be impaired, at that time cumulative gain or loss previously reported in other comprehensive income is included in current year’s consolidated profit and loss account.
Fair value of listed securities are the quoted prices on stock exchange on the date it is valued. Unquoted securities
are valued at cost. The Group follows trade date accounting for regular way purchase and sale of securities, except for sale and
purchase of securities in the future market.
NOTES TO THE CONSOLIDATED FINANCIAL STATEMENTSFor the year ended 30 June 2014
164 Crescent Steel and Allied Products Limited

Impairment
The carrying amount of all investments, other than those at fair value through profit or loss, is reviewed at each reporting date to determine whether there is any indication of impairment. A financial asset is impaired if there is objective evidence of impairment as a result of one or more events that occurred after the initial recognition of the asset and that loss event(s) had an impact on the estimated future cashflows of that asset that can be estimated reliably. In case of investment in equity security classified as available for sale, a significant or prolonged decline in its fair value below its cost is objective evidence of impairment.
An impairment loss in respect of financial assets measured at amortized cost is calculated as the difference
between its carrying amount and the present value of the estimated future cashflows discounted at the assets original effective interest rate. Losses are recognized in consolidated profit and loss account. When an event occurring after the impairment was recognized causes the amount of impairment loss to decrease, the decrease in impairment loss is reversed through consolidated profit and loss account. Impairment losses on available for sale financial assets are recognized by reclassifying the losses accumulated in reserves in equity to consolidated profit and loss account. The cumulative loss that is reclassified from equity to consolidated profit and loss account is the difference between the acquisition cost, net of any principal repayment and amortization, and the current fair value, less any impairment loss recognized previously in consolidated profit and loss account. If in subsequent period, the fair value of an impaired available for sale debt security increases and the increase can be related objectively to an event occurring after the impairment loss was recognized, then the impairment loss is reversed with the amount of reversal recognized in consolidated profit and loss account. However, any subsequent recovery in the fair value of an impaired available for sale equity security is recognized in other comprehensive income.
Derivative financial instruments
The Group enters into derivative financial instruments, which include future contracts in stock market. Derivatives are initially recorded at fair value and are remeasured to fair value on subsequent reporting dates. The fair value of a derivative is equivalent to the unrealized gain or loss from marking to market the derivative using prevailing market rates. Derivatives with positive market values (unrealized gains) are included in other receivables and derivatives with negative market values (unrealized losses) are included in other liabilities in the balance sheet. The resultant gains and losses from derivatives held for trading purposes are recognized in the profit and loss account. No derivative is designated as hedging instrument by the Group.
5.6 Investment in commodities
Investment in commodities is stated at fair value less cost to sell. Such commodities are principally acquired with the purpose of selling in near future and generating a profit from fluctuations in price.
5.7 Non-current assets held for sale
Non-current assets or disposal groups comprising of assets or liabilities that are expected to be recovered primarily through sale rather than through continuing use, are classified as held for sale. Immediately before classification as held for sale, the assets or components of a disposal group, are remeasured in accordance with Group’s accounting policies. Thereafter, these are measured at lower of their carrying amount and fair value less costs to sell.
5.8 Stores, spares and loose tools
Stores, spares and loose tools are valued at lower of weighted average cost and net realizable value, less provision for impairment, if any. Items in transit are valued at cost comprising invoice value plus other charges incurred thereon.
NOTES TO THE CONSOLIDATED FINANCIAL STATEMENTSFor the year ended 30 June 2014
165Consolidated Financial Statements 2014

Provision for obsolete and slow moving stores, spares and loose tools is determined based on management’s estimate regarding their future usability.
Net realizable value signifies the estimated selling price in the ordinary course of business less the estimated
costs necessary to be incurred to make the sale. Spare parts of capital nature which can be used only in connection with an item of property, plant and equipment
are classified as fixed assets under the ‘plant and machinery’ category and are depreciated over a time period not exceeding the useful life of the related assets.
5.9 Stock-in-trade
Stock-in-trade is stated at the lower of cost and net realizable value. Cost is arrived at on a weighted average basis. Cost of work-in-process and finished goods include cost of materials and appropriate portion of production overheads. Net realizable value is the estimated selling price in the ordinary course of business less costs of completion and selling expenses. The cost of finished goods of Steel segment is assigned by using specific identification of their individual costs. Scrap stocks are valued at their estimated net realizable value.
5.10 Trade debts and other receivables
These are initially stated at fair value and subsequently measured at amortized cost using the effective interest rate method less provisions for any uncollectible amounts. An estimate is made for doubtful receivables when collection of the amount is no longer probable. Debts considered irrecoverable are written off.
5.11 Cash and cash equivalents
Cash and cash equivalents comprise of cash balances and call deposits. Bank overdrafts that are repayable on demand and form an integral part of the Group’s cash management are included as a component of cash and cash equivalents for the purpose of consolidated cash flow statement.
5.12 Employee benefits
5.12.1 Compensated absences
The Holding Company accounts for all accumulated compensated absences when employees render services that increase their entitlement to future compensated absences.
5.12.2 Post retirement benefits
5.12.2.1 Defined contribution plan - Provident fund
The Holding Company operates a provident fund scheme for its permanent employees. Equal monthly contributions are made by the Holding Company and its employees. Obligation for contributions to the fund are recognized as an expense in the profit and loss account when they are due.
Cotton segment
Provision and collection from employees are made at the rate of 6.25% of basic pay plus Cost Of Living Allowance (COLA) of Cotton segment employees. A trust has been established and its approval has been obtained from the Commissioner of Income Tax.
All employees except Cotton segment
Contributions to the fund are made at the rate of 8.33% of basic pay plus COLA for those employees who have served the Holding Company for a period of less than five years and after completion of five years, contributions are made at the rate of 10%.
NOTES TO THE CONSOLIDATED FINANCIAL STATEMENTSFor the year ended 30 June 2014
166 Crescent Steel and Allied Products Limited

5.12.2.2 Defined benefit plans
Pension and gratuity fund schemes
The Holding Company provides gratuity benefits to all its permanent employees who have completed their minimum qualifying service as per the terms of employment. The pension scheme provides life time pension to retired employees or to their spouses as per pension fund rules.
The Holding Company’s obligation is determined through actuarial valuations carried out under the “Projected
Unit Credit Method”. Remeasurements which comprise actuarial gains and losses and the return on plan assets (excluding interest) are recognized immediately in other comprehensive income. The Holding Company determines the net interest expense (income) on the net defined benefit liability (asset) for the period by applying the discount rate used to measure the defined benefit obligation at the beginning of the annual period to the then-net defined benefit liability (asset), taking into account any changes in the net defined benefit liability (asset) during the period as a result of contribution and benefit payments. Net interest expense, current service costs and any past service costs are recognized in consolidated profit and loss account. Any assets resulting from this calculation is limited to the present value of available refunds or reductions in future contributions to the plan. The latest actuarial valuation was conducted at the reporting date by a qualified professional firm of actuaries.
5.13 Mark-up bearing borrowings
Mark-up bearing borrowings are recognized initially at fair value, less attributable transaction costs. Subsequent to initial recognition, mark-up bearing borrowings are stated at amortized cost with any difference between cost and redemption value being recognized in the consolidated profit and loss account over the period of the borrowings on an effective interest basis.
5.14 Leases
Leases are classified as finance leases whenever the terms of the lease transfer substantially all the risks and rewards of ownership to the Group. All other leases are classified as operating leases.
Assets held under finance leases along with corresponding lease liabilities are initially recognized at their fair
value at the inception of the lease or, if lower, at the present value of the minimum lease payments. Lease payments are apportioned between finance costs and reduction of the lease liability so as to achieve a constant rate of interest on the remaining balance of the liability. Finance costs are recognized in the consolidated profit and loss account, unless they are directly attributable to qualifying assets, in which case they are capitalized as more fully explained in note 5.18 below.
Payments made under operating leases (net of any incentives received from the lessor) are charged on a straight-
line basis over the period of the lease. In the context of sale and leaseback transactions, where a sale and leaseback transaction is classified as a finance
lease, any excess of the sale proceeds over the carrying values is deferred and recognized in the consolidated profit and loss account over the lease term. Any loss representing the excess of the carrying values over the sale proceeds is recognized immediately in the consolidated profit and loss account.
5.15 Trade and other payables
Trade and other amounts payable are recognized initially at fair value and subsequently carried at amortized cost.
NOTES TO THE CONSOLIDATED FINANCIAL STATEMENTSFor the year ended 30 June 2014
167Consolidated Financial Statements 2014

5.16 Taxation
Current
Provision for current taxation is based on taxable income at the current rates of taxation after taking into account tax credits and tax rebates available, if any.
Deferred
Deferred tax is provided using the balance sheet liability method, providing for temporary differences between the carrying amount of assets and liabilities for financial reporting purposes and the amounts used for taxation purposes. The amount of deferred tax provided is based on the expected manner of realization or settlement of the carrying amount of assets and liabilities, using the rates that are expected to apply to the period when the differences reverse based on tax rates that have been enacted at the reporting date.
Deferred tax liabilities are recognized for all taxable temporary differences. A deferred tax asset is recognized
only to the extent that it is probable that future taxable profits will be available against which the asset can be utilized. Deferred tax asset is reduced to the extent that it is no longer probable that the related tax benefits will be realized.
5.17 Revenue recognition
Revenue from sales is recognized when significant risks and rewards of ownership are transferred to the buyer.
Interest income and profit on bank deposits is recognized using the effective interest method. Dividend income is recognized when the right to receive the same is established i.e. the book closure date of the
investee company declaring the dividend. Gains and losses on sale of investments are accounted for when the commitment (trade date) for sale of security
is made. Unrealized gains and losses arising on revaluation of securities classified as ‘held for trading’ are recognized in
the consolidated profit and loss account in the period in which they arise. Gains and losses arising on revaluation of derivatives to the fair value are also recognized in the profit and loss account.
Unrealized gains and losses arising on revaluation of securities classified as ‘available for sale’ are recognized
in the consolidated statement of comprehensive income in the period in which they arise. Rental income (net of any incentives given to lessees) from investment property is recognized on a straight line
basis over the lease term. Miscellaneous income is recognized on receipt basis. 5.18 Borrowing costs
Borrowing costs incurred on long term finances directly attributable for the construction / acquisition of qualifying assets are capitalized up to the date the respective assets are available for intended use. All other mark-up, interest and other related charges are taken to the consolidated profit and loss account currently.
NOTES TO THE CONSOLIDATED FINANCIAL STATEMENTSFor the year ended 30 June 2014
168 Crescent Steel and Allied Products Limited
5.19 Provisions
A provision is recognized in the consolidated balance sheet when the Group has a legal or constructive obligation as a result of past events, it is probable that an outflow of economic benefits will be required to settle the obligation and a reliable estimate can be made of the amount of the obligation. Provisions are reviewed at each reporting date and adjusted to reflect the current best estimate.
5.20 Impairment
The carrying amount of the Group’s assets is reviewed at each reporting date to determine whether there is any objective evidence that an asset or group of assets may be impaired. If any such evidence exists, the asset’s or group of assets’ recoverable amount is estimated. An impairment loss is recognized whenever the carrying amount of an asset exceeds its recoverable amount. The recoverable amount is the higher of its value in use and fair value less cost to sell. Impairment losses are recognized in consolidated profit and loss account.
5.21 Foreign currency translation
Foreign currency transactions are translated into Pakistani Rupees at exchange rates prevailing on the date of transaction. Monetary assets and liabilities in foreign currencies are translated into Pakistan Rupees at the rates of exchange prevailing at the reporting date. Exchange differences, if any, are recognized in consolidated profit and loss account.
5.22 Offsetting of financial assets and financial liabilities
Financial assets and financial liabilities are set off and only the net amount is reported in the balance sheet when there is a legally enforceable right to set off the recognized amount and the Group intends to either settle on a net basis, or to realize the asset and settle the liability simultaneously.
5.23 Segment reporting
Operating segments are reported in a manner consistent with the internal reporting structure. Management monitors the operating results of its business units separately for the purpose of making decisions regarding resource allocation and performance assessment.
Segment capital expenditure is the total cost incurred during the period to acquire property, plant and equipment
and intangible assets. 5.24 Proposed dividend and transfer between reserves
Dividend distributions are recognized as a liability in the period in which dividends are approved. Transfer between reserves made subsequent to the reporting date is considered as a non-adjusting event and is recognized in the consolidated financial statements in the period in which such transfers are made.
NOTES TO THE CONSOLIDATED FINANCIAL STATEMENTSFor the year ended 30 June 2014
169Consolidated Financial Statements 2014
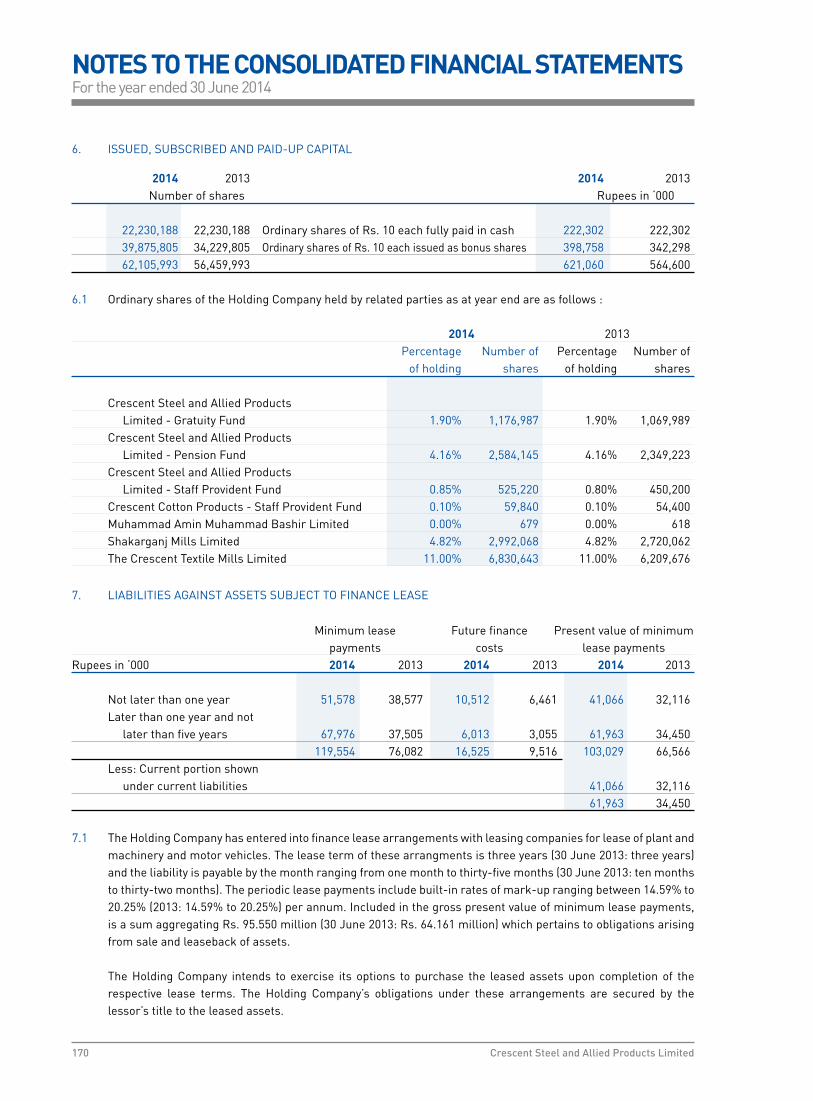
6. ISSUED, SUBSCRIBED AND PAID-UP CAPITAL
2014 2013 2014 2013 Number of shares Rupees in ‘000 22,230,188 22,230,188 Ordinary shares of Rs. 10 each fully paid in cash 222,302 222,302 39,875,805 34,229,805 Ordinary shares of Rs. 10 each issued as bonus shares 398,758 342,298 62,105,993 56,459,993 621,060 564,600 6.1 Ordinary shares of the Holding Company held by related parties as at year end are as follows : 2014 2013 Percentage Number of Percentage Number of of holding shares of holding shares
Crescent Steel and Allied Products Limited - Gratuity Fund 1.90% 1,176,987 1.90% 1,069,989 Crescent Steel and Allied Products Limited - Pension Fund 4.16% 2,584,145 4.16% 2,349,223 Crescent Steel and Allied Products Limited - Staff Provident Fund 0.85% 525,220 0.80% 450,200 Crescent Cotton Products - Staff Provident Fund 0.10% 59,840 0.10% 54,400 Muhammad Amin Muhammad Bashir Limited 0.00% 679 0.00% 618 Shakarganj Mills Limited 4.82% 2,992,068 4.82% 2,720,062 The Crescent Textile Mills Limited 11.00% 6,830,643 11.00% 6,209,676
7. LIABILITIES AGAINST ASSETS SUBJECT TO FINANCE LEASE
Minimum lease Future finance Present value of minimum payments costs lease payments Rupees in ‘000 2014 2013 2014 2013 2014 2013 Not later than one year 51,578 38,577 10,512 6,461 41,066 32,116 Later than one year and not later than five years 67,976 37,505 6,013 3,055 61,963 34,450 119,554 76,082 16,525 9,516 103,029 66,566 Less: Current portion shown under current liabilities 41,066 32,116 61,963 34,450 7.1 The Holding Company has entered into finance lease arrangements with leasing companies for lease of plant and
machinery and motor vehicles. The lease term of these arrangments is three years (30 June 2013: three years) and the liability is payable by the month ranging from one month to thirty-five months (30 June 2013: ten months to thirty-two months). The periodic lease payments include built-in rates of mark-up ranging between 14.59% to 20.25% (2013: 14.59% to 20.25%) per annum. Included in the gross present value of minimum lease payments, is a sum aggregating Rs. 95.550 million (30 June 2013: Rs. 64.161 million) which pertains to obligations arising from sale and leaseback of assets.
The Holding Company intends to exercise its options to purchase the leased assets upon completion of the respective lease terms. The Holding Company’s obligations under these arrangements are secured by the lessor’s title to the leased assets.
NOTES TO THE CONSOLIDATED FINANCIAL STATEMENTSFor the year ended 30 June 2014
170 Crescent Steel and Allied Products Limited

8. DEFERRED INCOME
The Holding Company entered into sale and lease back arrangements resulting in deferred income (representing excess of sales proceed over the carrying amount of respective assets) out of which Rs. 1.764 million (30 June 2013: Rs. 0.847 million) is classified in current liabilities; being current portion of deferred income of Rs. 4.088 million (30 June 2013: Rs. 2.260 million). The deferred income will be amortized to profit and loss account over the lease term. During the year Rs. 0.924 million (2013: Rs. 0.284 million) is amortized in consolidated profit and loss account.
2014 2013 Rupees in ‘000 Note (Restated)
9. TRADE AND OTHER PAYABLES
Trade creditors 29,837 57,642 Bills payable 15,784 – Commission payable 2,707 12,601 Customer’s security deposits 4,228 200 Accrued liabilities 9.1 71,991 81,610 Advances from customers 25,505 15,123 Provisions 9.2 89,805 93,849 Due to related parties 9.3 340 198 Payable against purchase of investments 110,197 – Payable to provident fund 1,492 87 Retention money 287 486 Sales Tax payable 89 – Withholding tax payable 4,559 50 Workers’ Profit Participation Fund 9.4 9,023 52,395 Workers’ Welfare Fund 615 18,794 Unclaimed dividend 56,853 67,873 Others 9,506 13,918
432,818 414,826
9.1 Accrued liabilities
Salaries, wages and other benefits 12,792 17,807 Accrual for 10-C bonus 1,204 2,405 Compensated absences 11,269 11,544 Others 9.1.1 46,726 49,854 71,991 81,610
9.1.1 This includes liability against Gas Infrastructre Development Cess of Rs. 3.381 million (2013: Nil).
9.2 Movement in provisions Infrastructure Sales Liquidated Total fee Tax damages Rupees in ‘000 Note 9.2.1 Note 9.2.2 Note 9.2.3 Opening balance as at 1 July 2013 56,656 3,242 33,951 93,849 Reversal of provision for the year – – (3,456) (3,456) Provision for the year 7,814 – 2,152 9,966 Payments during the year (3,955) – (6,599) (10,554) Closing balance as at 30 June 2014 60,515 3,242 26,048 89,805
NOTES TO THE CONSOLIDATED FINANCIAL STATEMENTSFor the year ended 30 June 2014
171Consolidated Financial Statements 2014
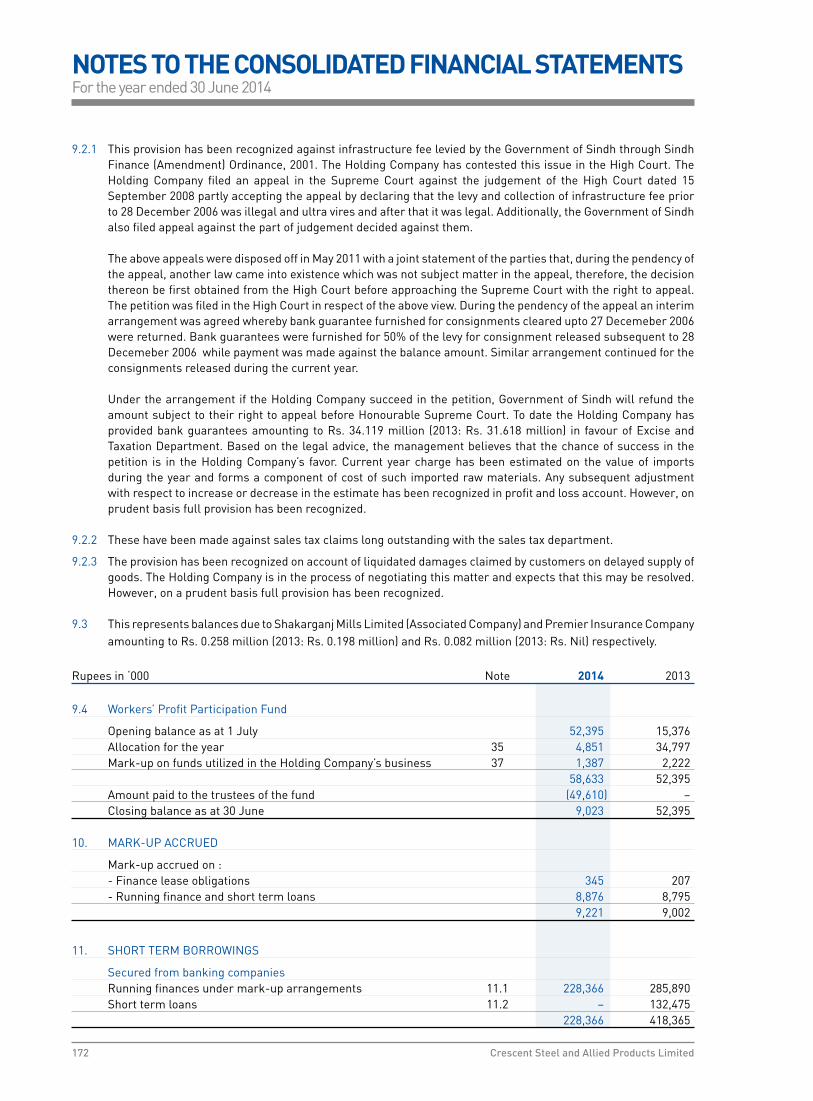
9.2.1 This provision has been recognized against infrastructure fee levied by the Government of Sindh through Sindh Finance (Amendment) Ordinance, 2001. The Holding Company has contested this issue in the High Court. The Holding Company filed an appeal in the Supreme Court against the judgement of the High Court dated 15 September 2008 partly accepting the appeal by declaring that the levy and collection of infrastructure fee prior to 28 December 2006 was illegal and ultra vires and after that it was legal. Additionally, the Government of Sindh also filed appeal against the part of judgement decided against them.
The above appeals were disposed off in May 2011 with a joint statement of the parties that, during the pendency of
the appeal, another law came into existence which was not subject matter in the appeal, therefore, the decision thereon be first obtained from the High Court before approaching the Supreme Court with the right to appeal. The petition was filed in the High Court in respect of the above view. During the pendency of the appeal an interim arrangement was agreed whereby bank guarantee furnished for consignments cleared upto 27 Decemeber 2006 were returned. Bank guarantees were furnished for 50% of the levy for consignment released subsequent to 28 Decemeber 2006 while payment was made against the balance amount. Similar arrangement continued for the consignments released during the current year.
Under the arrangement if the Holding Company succeed in the petition, Government of Sindh will refund the
amount subject to their right to appeal before Honourable Supreme Court. To date the Holding Company has provided bank guarantees amounting to Rs. 34.119 million (2013: Rs. 31.618 million) in favour of Excise and Taxation Department. Based on the legal advice, the management believes that the chance of success in the petition is in the Holding Company’s favor. Current year charge has been estimated on the value of imports during the year and forms a component of cost of such imported raw materials. Any subsequent adjustment with respect to increase or decrease in the estimate has been recognized in profit and loss account. However, on prudent basis full provision has been recognized.
9.2.2 These have been made against sales tax claims long outstanding with the sales tax department.
9.2.3 The provision has been recognized on account of liquidated damages claimed by customers on delayed supply of goods. The Holding Company is in the process of negotiating this matter and expects that this may be resolved. However, on a prudent basis full provision has been recognized.
9.3 This represents balances due to Shakarganj Mills Limited (Associated Company) and Premier Insurance Company amounting to Rs. 0.258 million (2013: Rs. 0.198 million) and Rs. 0.082 million (2013: Rs. Nil) respectively.
Rupees in ‘000 Note 2014 2013
9.4 Workers’ Profit Participation Fund
Opening balance as at 1 July 52,395 15,376 Allocation for the year 35 4,851 34,797 Mark-up on funds utilized in the Holding Company’s business 37 1,387 2,222 58,633 52,395 Amount paid to the trustees of the fund (49,610) – Closing balance as at 30 June 9,023 52,395
10. MARK-UP ACCRUED
Mark-up accrued on : - Finance lease obligations 345 207 - Running finance and short term loans 8,876 8,795 9,221 9,002
11. SHORT TERM BORROWINGS
Secured from banking companies Running finances under mark-up arrangements 11.1 228,366 285,890 Short term loans 11.2 – 132,475 228,366 418,365
NOTES TO THE CONSOLIDATED FINANCIAL STATEMENTSFor the year ended 30 June 2014
172 Crescent Steel and Allied Products Limited

11.1 Short term running finance available from various commercial banks under mark-up arrangements amounted to Rs. 600 million (2013: Rs. 500 million) out of which Rs. 250 million (2013: Rs. 250 million) is interchangeable with letters of credit. During the year, mark-up on such arrangements ranged between 10.58% to 12.38% (2013: 10.81% to 15.10%) per annum.
11.2 Short term loan financing available from various commercial banks under mark-up arrangements amounted to Rs. 1,300 million (2013: Rs. 1,100 million) out of which Rs. 400 million (2013: Rs. 300 million) is interchangeable with letters of credit. During the year, mark-up on such arrangements ranged between 11.26% to 13.20% (2013: 14.17% to 16.56%) per annum.
11.3 The facilities for opening letters of credit amounted to Rs. 1,815 million (2013: Rs. 1,400 million) out of which Rs. 250 million (2013: Rs. 250 million) and Rs. 400 million (2013: Rs. 300 million) are interchangeable with short term running finance and short term loans respectively as mentioned in notes 11.1 and 11.2 above. The facility for letters of guarantee as at 30 June 2014 amounted to Rs. 538 million (2013: Rs. 500 million). Amounts unutilized for letters of credit and guarantees as at 30 June 2014 were Rs. 1,599.693 million and Rs. 278.360 million (2013: Rs. 1,356.764 million and Rs. 191.017 million) respectively.
11.4 The above facilities are expiring on various dates and are secured by way of hypothecation of plant and machinery, stock-in-trade, trade debts and other current assets, pledge of shares and cotton / cotton yarn; and lien over import / export document.
12. CONTINGENCIES AND COMMITMENTS
12.1 The Holding Company has filed a suit in the Sindh High Court against the Federation of Pakistan and others, for levy of import license fee at the rate of 6% against import of coating plant in 1992. The Holding Company contested that as per SRO 1317(I)/94 dated 22 December 1990, the coating plant being located in rural area, is only liable to pay import license fee at the rate of 2%. The Holding Company has provided demand draft of Rs. 3.420 million (refer note 18.1) as directed by the Honourable Court. The petition was dismissed by the High Court as having been incompetently filed. The Holding Company has filed the appeal with Honourable Supreme Court and no hearing has taken place since then. No provision has been recognized in these consolidated financial statements as management considers that the case would be decided in the Holding Company’s favour.
12.2 The Finance Act, 2008 introduced an amendment to the Workers’ Welfare Fund Ordinance, 1971 (WWF Ordinance), thus rendering the Group liable to pay contribution to WWF at the rate of two percent of their accounting or taxable income, whichever is higher. In 2011, the Honourable Lahore High Court (LHC) in a Constitutional Petition relating to the amendments brought in the WWF Ordinance, 1971 through the Finance Act, 2008, has declared the said amendments as unlawful and unconstitutional. However, in 2013, a larger bench of Sindh High Court (SHC) passed an order declaring that the amendments introduced through Finance Act 2008 do not suffer from any constitutional and legal infirmity. Both the decisions of LHC and SHC are pending before Supreme Court for adjudication. The management’s tax advisor is of the view that the decision of LHC will remain applicable to the Group as the registered office of the Holding Company is situated in its jurisdiction till the decision of Supreme Court. Accordingly aggregate net of tax provision of Rs. 10.076 million has not been recorded in these consolidated financial statements.
12.3 Sindh Industrial Trade Estate (SITE) has cancelled allotment of plot A-26 and A-27 and charged non-utilization fees of Rs. 0.285 million and Rs. 0.621 million respectively. The Holding Company has challenged the cancellation and filed a suit in the Sindh High Court. The High Court has restrained SITE from taking any adverse action against the Holding Company. Therefore, management considers that the case would be decided in the Holding Company’s favour and no provision is required to be recognized.
12.4 Aggregate amount of guarantees issued by banks on behalf of the Holding Company against various contracts aggregated Rs. 258.215 million (2013: Rs. 308.893 million).
12.5 Commitments in respect of capital expenditure contracted for by the Group as at 30 June 2014 amounted to Rs. 71.649 million (2013: Rs. 17.592 million) which includes Rs. 7.462 million related to office premises located in Islamabad payable on completion of project. This also includes commitments contracted by the subsidiary companies aggregating Rs. 64.187 million (2013: Rs. 10.130 millon) in respect of civil work and capital expenditure to acquire plant and machinery.
12.6 Commitments under letters of credit as at 30 June 2014 amounted to Rs. 201.846 million (2013: Rs. 43.236 million)
NOTES TO THE CONSOLIDATED FINANCIAL STATEMENTSFor the year ended 30 June 2014
173Consolidated Financial Statements 2014

Rupe
es in
‘000
N
ote
20
14
2013
13.
PROP
ERTY
, PLA
NT
AND
EQUI
PMEN
T
Op
erat
ing
fixed
ass
ets
13.1
726
,398
68
2,34
5
Capi
tal w
ork-
in-p
rogr
ess
13.5
678
,043
5
98,3
59
1
,404
,441
1
,280
,704
13
.1
Oper
atin
g fix
ed a
sset
s
De
scrip
tion
Land
Bu
ildin
gs
Offic
e Pl
ant a
nd m
achi
nery
El
ectri
cal /
Fu
rnitu
re
Com
pute
rs
Mot
or ve
hicle
s To
tal
Fr
eeho
ld
Leas
ehol
d On
On
pr
emise
s Ow
ned
* Le
ased
of
fice
an
d
Owne
d Le
ased
in
clud
ing
fre
ehol
d
leas
ehol
d
eq
uipm
ent a
nd
fittin
gs
Ru
pees
in ‘0
00
im
prov
emen
ts
land
la
nd
in
stal
latio
n
N
et c
arry
ing
valu
e as
at 1
Jul
y 20
13
Op
enin
g ne
t boo
k va
lue
(NBV
)
217
,479
3
,970
9
8,27
7
4,1
92
29
2
22,5
19
70,
771
1
3,56
8
2,6
05
2,9
77
19,
921
2
6,03
7
682
,345
Addi
tions
/ tr
ansf
ers
3
8,55
4
-
4,5
93
-
-
91,
943
6
9,70
8
1,7
99
4,1
70
4,2
47
13,
478
9
,562
2
38,0
54
Di
spos
als
(at N
BV)
13.5
(8
,336
) -
-
-
-
(6
9,35
8)
(15,
163)
-
-
-
(4
,502
) (6
,041
) (1
03,4
00)
De
prec
iatio
n ch
arge
13
.1.1
-
(5
3)
(14,
232)
(1
,132
) (6
) (4
7,01
4)
(9,9
26)
(4,1
30)
(709
) (1
,657
) (5
,082
) (6
,660
) (9
0,60
1)
Bala
nce
as a
t 30
June
201
4 (N
BV)
2
47,6
97
3,9
17
88,
638
3
,060
2
3
198
,090
1
15,3
90
11,
237
6
,066
5
,567
2
3,81
5
22,
898
7
26,3
98
Gr
oss
carr
ying
valu
e as
at
30
June
201
4
Cost
13
.2
247
,697
5
,646
2
06,7
50
70,
027
4
0,49
3
1,2
42,8
20
125
,139
4
9,42
1
22,
144
5
5,20
4
65,
018
3
2,24
1
2,1
62,6
00
Ac
cum
ulat
ed d
epre
ciat
ion
-
(1
,729
) (1
18,1
12)
(66,
967)
(4
0,47
0)
(1,0
44,7
30)
(9,7
49)
(38,
184)
(1
6,07
8)
(49,
637)
(4
1,20
3)
(9,3
43)
(1,4
36,2
02)
N
et b
ook
valu
e
247
,697
3
,917
8
8,63
8
3,0
60
23
1
98,0
90
115
,390
1
1,23
7
6,0
66
5,5
67
23,
815
2
2,89
8
726
,398
Net
car
ryin
g va
lue
as a
t 1
July
201
2
Open
ing
net b
ook
valu
e (N
BV)
1
47,4
79
4,0
23
86,
877
5
,470
2
,641
2
29,6
68
23,
906
1
5,56
8
2,8
96
960
1
3,22
4
15,
892
5
48,6
04
Ad
ditio
ns /
tran
sfer
s
70,
000
-
2
5,15
2
-
-
93,
204
5
0,37
6
1,9
39
205
2
,801
2
6,82
0
14,
290
2
84,7
87
Di
spos
als
(at N
BV)
-
-
-
-
-
(4
7,91
4)
-
-
-
- (1
4,77
9)
-
(62,
693)
De
prec
iatio
n ch
arge
-
(53)
(1
3,75
2)
(1,2
78)
(2,6
12)
(52,
439)
(3
,511
) (3
,939
) (4
96)
(784
) (5
,344
) (4
,145
) (8
8,35
3)
Bala
nce
as a
t 30
June
201
3 (N
BV)
2
17,4
79
3,9
70
98,
277
4
,192
2
9
222
,519
7
0,77
1
13,
568
2
,605
2
,977
1
9,92
1
26,
037
6
82,3
45
Gr
oss
carr
ying
valu
e as
at
30
June
201
3
Cost
217
,479
5
,646
2
02,1
57
70,
027
4
0,49
3
1,2
21,3
36
77,
093
4
7,62
2
17,
974
5
0,99
7
59,
938
3
1,78
3
2,0
42,5
45
Ac
cum
ulat
ed d
epre
ciat
ion
-
(1
,676
) (1
03,8
80)
(65,
835)
(4
0,46
4)
(998
,817
) (6
,322
) (3
4,05
4)
(15,
369)
(4
8,02
0)
(40,
017)
(5
,746
) (1
,360
,200
)
Net
boo
k va
lue
2
17,4
79
3,9
70
98,
277
4
,192
2
9
222
,519
7
0,77
1
13,
568
2
,605
2
,977
1
9,92
1
26,
037
6
82,3
45
De
prec
iatio
n ra
te (%
per
ann
um)
-
1
5 &
10
5 &
10
10
5 -
20
10
5 -
20
10
33.3
3 20
20
* N
et b
ook
valu
e of
pla
nt a
nd m
achi
nery
(ow
ned)
incl
udes
an
aggr
egat
e am
ount
of R
s. 0
.805
mill
ion
(201
3: R
s. 0
.989
mill
ion)
repr
esen
ting
net b
ook
valu
e of
cap
italiz
ed s
pare
s.
NOTES TO THE CONSOLIDATED FINANCIAL STATEMENTSFor the year ended 30 June 2014
174 Crescent Steel and Allied Products Limited

Rupees in ‘000 Note 2014 2013 13.1.1 The depreciation charge for the year has been allocated as follows :
Cost of sales 31.1 82,280 79,254 Distribution and selling expenses 33 852 623 Administrative expenses 34 7,246 8,476 Intangible under development phase 223 –
90,601 88,353
13.2 Property, plant and equipment as at 30 June 2014 include items having an aggregate cost of Rs. 1,003.318 million (2013: Rs. 969.540 million) that have been fully depreciated and are still in use by the Holding Company.
13.3 The fair value of property, plant and equipment of the Group as at 30 June 2013 approximated to Rs. 2,402.438 million.
Rupees in ‘000 Note 2014 2013
13.4 Capital work-in-progress
Advances to suppliers 33,747 14,931 Civil work 13.4.1 & 13.4.2 138,742 105,419 Plant and machinery 502,771 475,344 Others 2,783 2,665
678,043 598,359 13.4.1 This includes advance against purchase of land and building aggregating Rs. 68.385 million (2013: Rs. 68.385
million) out of which an amount of Rs.50 million (2013: Rs. 50 million) pertain to advance against purchase of land located at Lahore. The Holding Company holds possession of the land and has applied for transfer of title in its name.
This also includes an amount of Rs. 26.4 million (2013: Rs. 26.4 million) paid by the Holding Company to Pakistan
Steel Mills Limited (PSML) against allotment of plot measuring 24,200 square yards. However third party has filed a case in Honourable High Court of Sindh for declaration and injunction against said property. The Holding Company has filed a suit in Honourable High Court of Sindh for specific performance and declaration against PSML with respect to the said property and also filed an application for vacation of the injunction operating against the property. The Honourable High Court vide its interim order has restrained PSML from creating any third party interest till the disposition of the case. The applications are pending for hearing. Management believe that it has a reasonable grounds in the case and expects a favourable outcome.
13.4.2 The Holding Company has recognized a provision for an amount of Rs. 20.619 million (2013: Rs. 20.619) against construction work at a site which has been halted since last year.
13.4.3 Capital work-in-progress includes expenditure aggregating Rs. 596.076 million (2013: Rs. 539.379 million) incurred by the subsidiary company in respect of Bagasse Fired Thermal Generation power plant at Bhone. The plant is expected to commence operations during the next year.
NOTES TO THE CONSOLIDATED FINANCIAL STATEMENTSFor the year ended 30 June 2014
175Consolidated Financial Statements 2014

13.5 The following assets were disposed off during the year: Description Cost Accumulated Book Sale Mode of Particular of buyers depreciation value proceeds disposal Rupees in ‘000 Plant and machinery 70,460 1,102 69,358 68,863 Sales & Lease Pak Gulf Leasing Company back Limited 21,662 6,498 15,164 15,164 Transfer to own Pak Gulf Leasing Company asset Limited Land 8,336 - 8,336 10,080 Negotiation Mr. Mehmood Ahmed Motor vehicles 3,787 - 3,787 3,787 Sales & Lease Orix Leasing Pakistan back Limited 1,759 1,759 - 600 Negotiation 1,900 1,900 - 1,600 Negotiation 6,763 2,145 4,618 4,557 Transfer to own Orix Leasing Pakistan asset Limited 942 279 663 562 Company scheme Mr. Hussain Baber 1,614 560 1,054 1,361 Insurance claim EFU General Insurance Others 614 194 420 431 Various Various 2014 117,837 14,437 103,400 107,005
2013 105,215 42,522 62,693 89,785
Rupees in ‘000 Note 2014 2013
14. INTANGIBLE ASSETS
Intangible assets - Under use 14.1 14,031 13,645 - Under project development 14.2 25,261 – 39,292 13,645 14.1 Intangible assets - under use Net carrying value as at 1 July Net book value as at 1 July 13,645 1,617 Additions 5,674 14,457 Amortization 14.1.1 (5,288) (2,429) Net book value as at 30 June 14.1.2 14,031 13,645 Gross carrying value as at 30 June Cost 65,909 60,232 Accumulated amortization (49,238) (43,947) Accumulated impairment (2,640) (2,640) Net book value 14,031 13,645 Amortization rate (% per annum) 33.33 33.33 14.1.1 The amortization charge for the year has been allocated to administrative expenses (Note 34). 14.1.2 Intangible assets as at 30 June 2014 include items having an aggregate cost of Rs. 43.139 million (2013: Rs.
43.099 million) that have been fully amortized and are still in use of the Holding Company.
NOTES TO THE CONSOLIDATED FINANCIAL STATEMENTSFor the year ended 30 June 2014
176 Crescent Steel and Allied Products Limited

14.2 This pertains to payments made on account of feasibility and other project related activities related to the subsidiary company -Solution de Energy (Private) Limited. The costs incurred have been capitalized as project development expenditure (intangible asset) in these financial statements in accordance with the requirements of IAS 38.
Rupees in ‘000 Note 2014 2013
15. INVESTMENT PROPERTY
Investment property - Under use 15.1 73,316 31,268 - Under project development – 31,140 73,316 62,408
15.1 Investment property under use
Description Note Leasehold Buildings on Office Total land and leasehold premises Rupees in ‘000 improvements land Net carrying value as at 1 July 2013 Opening net book value (NBV) 3,773 15,854 11,641 31,268 Additions 44,836 1,757 – 46,593 Depreciation charge 15.1.1 (633) (1,097) (2,815) (4,545) Balance as at 30 June 2014 (NBV) 15.1.2 47,976 16,514 8,826 73,316 Gross carrying value as at 30 June 2014 Cost 49,445 23,365 29,655 102,465 Accumulated depreciation (1,469) (6,851) (20,829) (29,149) Net book value 47,976 16,514 8,826 73,316 Net carrying value as at 1 July 2012 Opening net book value (NBV) 4,011 16,936 14,685 35,632 Depreciation charge (238) (1,082) (3,044) (4,364) Balance as at 30 June 2013 (NBV) 3,773 15,854 11,641 31,268 Gross carrying value as at 30 June 2013 Cost 4,609 21,608 29,655 55,872 Accumulated depreciation (836) (5,754) (18,014) (24,604) Net book value 3,773 15,854 11,641 31,268 Depreciation rate (% per annum) 1 & 10 5 10 - 20 15.1.1 Depreciation charged for the year has been allocated to administrative expenses. 15.1.2 Fair value of the investment property based on recent valuation is Rs. 216.988 million (2013: Rs. 146.125).
NOTES TO THE CONSOLIDATED FINANCIAL STATEMENTSFor the year ended 30 June 2014
177Consolidated Financial Statements 2014
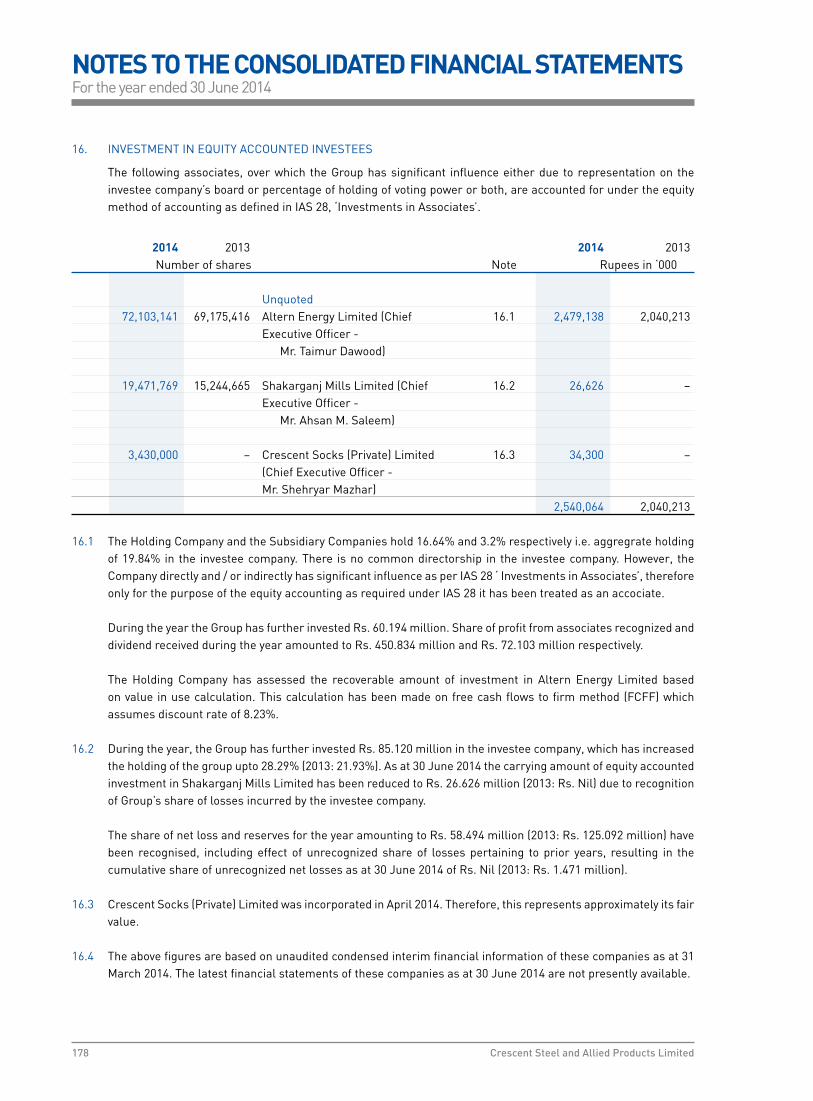
16. INVESTMENT IN EQUITY ACCOUNTED INVESTEES
The following associates, over which the Group has significant influence either due to representation on the investee company’s board or percentage of holding of voting power or both, are accounted for under the equity method of accounting as defined in IAS 28, ‘Investments in Associates’.
2014 2013 2014 2013 Number of shares Note Rupees in ‘000 Unquoted 72,103,141 69,175,416 Altern Energy Limited (Chief 16.1 2,479,138 2,040,213 Executive Officer - Mr. Taimur Dawood) 19,471,769 15,244,665 Shakarganj Mills Limited (Chief 16.2 26,626 – Executive Officer - Mr. Ahsan M. Saleem) 3,430,000 – Crescent Socks (Private) Limited 16.3 34,300 – (Chief Executive Officer - Mr. Shehryar Mazhar) 2,540,064 2,040,213
16.1 The Holding Company and the Subsidiary Companies hold 16.64% and 3.2% respectively i.e. aggregrate holding of 19.84% in the investee company. There is no common directorship in the investee company. However, the Company directly and / or indirectly has significant influence as per IAS 28 ‘ Investments in Associates’, therefore only for the purpose of the equity accounting as required under IAS 28 it has been treated as an accociate.
During the year the Group has further invested Rs. 60.194 million. Share of profit from associates recognized and
dividend received during the year amounted to Rs. 450.834 million and Rs. 72.103 million respectively.
The Holding Company has assessed the recoverable amount of investment in Altern Energy Limited based on value in use calculation. This calculation has been made on free cash flows to firm method (FCFF) which assumes discount rate of 8.23%.
16.2 During the year, the Group has further invested Rs. 85.120 million in the investee company, which has increased the holding of the group upto 28.29% (2013: 21.93%). As at 30 June 2014 the carrying amount of equity accounted investment in Shakarganj Mills Limited has been reduced to Rs. 26.626 million (2013: Rs. Nil) due to recognition of Group’s share of losses incurred by the investee company.
The share of net loss and reserves for the year amounting to Rs. 58.494 million (2013: Rs. 125.092 million) have been recognised, including effect of unrecognized share of losses pertaining to prior years, resulting in the cumulative share of unrecognized net losses as at 30 June 2014 of Rs. Nil (2013: Rs. 1.471 million).
16.3 Crescent Socks (Private) Limited was incorporated in April 2014. Therefore, this represents approximately its fair value.
16.4 The above figures are based on unaudited condensed interim financial information of these companies as at 31 March 2014. The latest financial statements of these companies as at 30 June 2014 are not presently available.
NOTES TO THE CONSOLIDATED FINANCIAL STATEMENTSFor the year ended 30 June 2014
178 Crescent Steel and Allied Products Limited

Rupees in ‘000 Note 2014 2013
16.5 Market value of investments in associates is as follows: Quoted Altern Energy Limited 1,551,660 855,008 Shakarganj Mills Limited 329,462 333,248 1,881,122 1,188,256
Percentage of holding 2014 2013
16.6 Percentage of holding of equity in associates is as follows:
Quoted Altern Energy Limited 19.84 19.04 Shakarganj Mills Limited 28.01 21.93
16.7 Summarized financial information of associated companies as at 31 March 2014 is as follows:
Total Total Revenues Profit/(loss)Rupees in ‘000 assets liabilities after tax 2014 Altern Energy Limited 16.7.1 38,455,246 17,845,678 14,961,495 2,843,004 Shakarganj Mills Limited 16.7.2 10,399,779 8,567,559 7,561,306 (265,350) 2013 Altern Energy Limited 39,799,918 21,856,204 15,234,247 2,078,811 Shakarganj Mills Limited 13,416,336 11,251,061 6,559,851 432,627
16.7.1 These figures are based on the latest available condensed interim consolidated financial information as at 31 March 2014 including its subsidiary company Rousch (Pakistan) Power Limited being managed by Power Management Company holding 59.98% shares.
16.7.2 These figures are based on the latest available condensed interim financial information of the investee company as at 31 March 2014.
Rupees in ‘000 Note 2014 2013
17. OTHER LONG TERM INVESTMENTS
Investments in related parties Available for sale 17.1 – – Other investments Available for sale 17.4 220,717 220,717 220,717 220,717
NOTES TO THE CONSOLIDATED FINANCIAL STATEMENTSFor the year ended 30 June 2014
179Consolidated Financial Statements 2014

17.1 Available for sale
2014 2013 2014 2013 Number of shares Note Rupees in ‘000
Unquoted 2,403,725 2,403,725 Crescent Bahuman Limited 17.2 24,037 24,037 1,047,000 1,047,000 Crescent Industrial Chemicals Limited 17.3 10,470 10,470 34,507 34,507 Less: Provision for impairment 34,507 34,507 – – 17.2 The chief executive of Crescent Bahuman Limited is Mr. Nasir Shafi. The break-up value of shares of the investee
company is Rs. Nil per share (2013: Rs. Nil per share), calculated on the basis of audited annual financial statements for the year ended 30 June 2013.
17.3 The chief executive of Crescent Industrial Chemicals Limited is Mr. Tariq Shafi. The investee company’s break-up
value of shares could not be ascertained as the financial statements of the investee company are not available. 17.4 Available for sale 2014 2013 2014 2013
Number of shares Note Rupees in ‘000
Unquoted 1,852,500 1,852,500 Central Depository Company of Pakistan Limited (CDC) 60,717 60,717 16,000,000 16,000,000 Shakarganj Food Products Limited 17.4.1 160,000 160,000 220,717 220,717 17.4.1 The Group has assessed the recoverable amount of investment in Shakarganj Food Products Limited based on
value in use calculation. This calculation has been made on discounted cash flow methodology which assumes gross profit margin of 13.59% - 14.70%, EBITDA of 3.98% - 5.05%, terminal growth rate of 3% and discount rate of approximately 18.95%. Based on valuation the recoverable amount exceeds the carrying amount and accordingly, no impairment is required.
Rupees in ‘000 Note 2014 2013
18. LONG TERM LOANS AND DEPOSITS
Security deposits - leasing companies 13,552 7,327 Security deposits - others 18.1 & 18.2 37,051 12,617 50,603 19,944
18.1 This includes demand drafts of Rs. 3.420 million provided to the Secretary Ministry of Commerce as explained in note no. 12.1.
18.2 This includes amortized cost of Rs. 24.434 million which pertains to long term deposit relating to Shakarganj Energy (Private) Limited (subsidiary company) of Rs. 32.486 million deposited for interconnectivity of 11KV feeder to FESCO under Power Purchase Agreement (PPA) for sale of 4-6 MW power. Under the PPA, initially this cost
NOTES TO THE CONSOLIDATED FINANCIAL STATEMENTSFor the year ended 30 June 2014
180 Crescent Steel and Allied Products Limited

was required to be borne by the subsidiary company, however, it is agreed that the cost so incurred will be paid back to the subsidiary company by FESCO in five years time through ten (10), half yearly equal instalments, without mark-up, commencing after one month from commercial operation date. For fair presentation, this interest free long term deposit has been discounted under International Accounting Standard (IAS) - 39 “Financial Instruments: Recognition and Measurement” using approximate of open market interest rate thereby stating it at amortized cost in these consolidated financial statements.
2014 2013 Rupees in ‘000 Note (Restated)
19. DEFERRED TAXATION Deferred tax credits / (debits) arising in respect of : Taxable temporary differences Accelerated tax depreciation / amortization 27,178 28,951 Finance lease obligations 12,341 10,284 Unrealized gain on held for trading investments 9,547 – Effect of change in accounting policy under IAS-19 (revised) 36,767 39,764 Share of profit from equity accounted investees 128,881 – 214,714 78,999 Deductible temporary differences Provision for slow moving stores, spares and loose tools (24,464) (21,539) Provisions for doubtful trade debts, doubtful advances and others (31,289) (35,481) Provisions for impairment of fixed assets (7,217) (7,010) Provision of Government Infrastructure Development Cess (1,183) - Provision for diminution in the value of investments (9,058) (8,798) (73,211) (72,828) 141,503 6,171 19.1 Break up of deferred tax charge / ( reversal) is as following: Profit and loss 138,330 20,987 Other comprehensive income (2,998) (35,552) 135,332 (14,565)
Rupees in ‘000 Note 2014 2013
20. STORES, SPARES AND LOOSE TOOLS Stores - steel segment 7,735 9,870 Spare parts - steel segment 55,512 50,185 Loose tools - steel segment 1,135 1,193 Stores and spares - cotton segment 53,388 56,657 117,770 117,905 Less: Provision for slow moving items 20.1 45,814 39,266 71,956 78,639 20.1 Movement in provision for slow moving items Opening balance 39,266 38,554 Provision made during the year 6,548 1,277 Reversal of provision made during the year – (565) Closing balance 45,814 39,266
NOTES TO THE CONSOLIDATED FINANCIAL STATEMENTSFor the year ended 30 June 2014
181Consolidated Financial Statements 2014
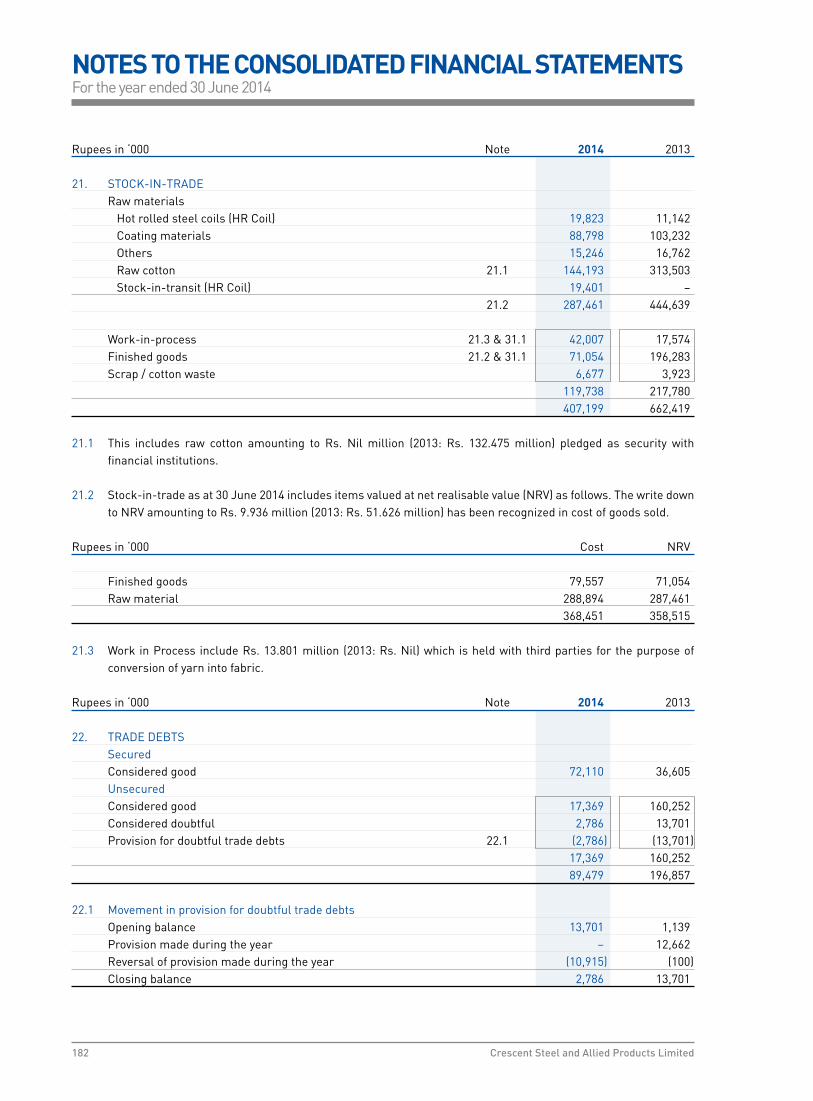
Rupees in ‘000 Note 2014 2013
21. STOCK-IN-TRADE Raw materials Hot rolled steel coils (HR Coil) 19,823 11,142 Coating materials 88,798 103,232 Others 15,246 16,762 Raw cotton 21.1 144,193 313,503 Stock-in-transit (HR Coil) 19,401 – 21.2 287,461 444,639
Work-in-process 21.3 & 31.1 42,007 17,574 Finished goods 21.2 & 31.1 71,054 196,283 Scrap / cotton waste 6,677 3,923 119,738 217,780 407,199 662,419 21.1 This includes raw cotton amounting to Rs. Nil million (2013: Rs. 132.475 million) pledged as security with
financial institutions. 21.2 Stock-in-trade as at 30 June 2014 includes items valued at net realisable value (NRV) as follows. The write down
to NRV amounting to Rs. 9.936 million (2013: Rs. 51.626 million) has been recognized in cost of goods sold. Rupees in ‘000 Cost NRV Finished goods 79,557 71,054 Raw material 288,894 287,461 368,451 358,515 21.3 Work in Process include Rs. 13.801 million (2013: Rs. Nil) which is held with third parties for the purpose of
conversion of yarn into fabric.
Rupees in ‘000 Note 2014 2013
22. TRADE DEBTS Secured Considered good 72,110 36,605 Unsecured Considered good 17,369 160,252 Considered doubtful 2,786 13,701 Provision for doubtful trade debts 22.1 (2,786) (13,701) 17,369 160,252 89,479 196,857 22.1 Movement in provision for doubtful trade debts Opening balance 13,701 1,139 Provision made during the year – 12,662 Reversal of provision made during the year (10,915) (100) Closing balance 2,786 13,701
NOTES TO THE CONSOLIDATED FINANCIAL STATEMENTSFor the year ended 30 June 2014
182 Crescent Steel and Allied Products Limited

Rupees in ‘000 Note 2014 2013
23. ADVANCES Unsecured Advances - considered good Executives 2,326 2,645 Suppliers for goods and services 26,780 29,009 Advances to others 23.1 28,444 – Advances - considered doubtful Suppliers for goods and services 47 47 Provision for doubtful advances (47) (47) – – 57,550 31,654 23.1 This represents advance made for offer of sale of Pakistan Petroleum Limited (PPL) shares through book building
process at a floor price of Rs. 205 per share. Subsequent to the year end, the advance has been received back as the said offer has been declined by the Privatization Commission of Pakistan since it was below the cut off price.
Rupees in ‘000 Note 2014 2013 24. TRADE DEPOSITS AND SHORT TERM PREPAYMENTS Deposits to leasing companies 1,434 6,082 Security deposits 1,343 1,735 Prepayments 4,633 1,686 7,410 9,503
25. INVESTMENTS Investments in related parties Available for sale 25.1 66,305 8,007 Held to maturity 25.2 23,995 29,994 90,300 38,001 Other investments Available for sale 25.3 – 258,011 Held for trading 25.4 654,693 647,899 Short term deposits 10,575 – Investment in commodity 25.5 2,128 2,086 667,396 907,996
757,696 945,997
25.1 Available for sale
The Group holds investments in ordinary shares of Rs. 10 each in the following listed investee company. 2014 2013 Name of investee company 2014 2013 Number of shares Note Rupees in ‘000
Quoted 3,235,973 452,379 The Crescent Textile Mills Limited 25.1.1 66,305 8,007 25.1.1 The Group has recognized impairment loss amounting to Rs. 4.537 million (2013: Rs. 4.537 million) against the
investment.
NOTES TO THE CONSOLIDATED FINANCIAL STATEMENTSFor the year ended 30 June 2014
183Consolidated Financial Statements 2014

25.2 This represents 2,999,396 (2013: 2,999,396) preference shares of Rs. 10 each of Shakarganj Mills Limited, a related party, issued in October 2004. These shares carry dividend rate of 8.5% per annum payable annually and were due for redemption in October 2009. The preference shares are convertible into ordinary shares of Rs. 10 each. The conversion option is exercisable at the end of every financial year of the investee company.
The Holding Company does not intend to exercise the option to convert the preference shares into ordinary shares as mentioned above. A provision of Rs. 11.105 million (2013: Rs. 5.106 million) has been recognized against the exposure as the balance amount is considered to be recovered in due course of time.
The fair value of preference shares as at 30 June 2014 amounts to Rs. 23.995 million (2013: Rs. 29.994 million).
25.3 Available for sale
The Group holds investments in ordinary shares of Rs. 10 each in the following listed investee companies 2014 2013 Name of investee company Note 2014 2013 (Number os share / certificates) Rupees in ‘000
Quoted – 9,060,000 Asian Stocks Fund Limited – 94,677 91,300 91,300 Crescent Jute Products Limited 25.3.1 – – 1,996 1,996 Innovative Investment Bank Limited – – 26,490 26,490 Jubilee Spinning and Weaving Mills Limited 25.3.2 – – – 7,944,263 Safeway Mutual Fund Limited – 163,334 – 258,011
25.3.1 The investment in Crescent Jute Products Limited is carried at break-up value, which is Rs. Nil per share (2013: Rs. Nil) [break-up value including surplus on revaluation of property, plant and equipment Rs. Nil (Rs. Nil per share based on audited financial statements for the year ended 30 June 2013)], calculated on the basis of the unaudited condensed interim financial information for the nine months ended 31 March 2014.
25.3.2 Investment in Jubilee Spinning and Weaving Mills Limited is carried at Rs. Nil per share (2013: Rs. Nil). The break-up value of shares of the investee company is Rs. Nil per share (2013: Rs. Nil) [break-up value including surplus on revaluation of property, plant and equipment and investment property Rs. 15.91 per share (2013 : Rs. 16.49 per share)], calculated on the basis of the unaudited condensed interim financial information for the nine months ended 31 March 2014.
25.3.3 Investments having an aggregate market value of Rs. 802.024 million (2013: Rs. 909.398 million) have been pledged with financial institutions as security against financing facilities (see note 11.4) out of which Rs. 570.280 million (2013: Rs. 664.659 million) relates to long term investments.
25.4 Held for trading
The Group holds investments in ordinary shares of listed companies and certificates of close end mutual funds. Details are as follows. The face value of the shares is Rs. 10 per share unless otherwise stated.
2014 2013 Name of investee company 2014 2013 (Number os share / certificates) Rupees in ‘000
41,466 – Adamjee Insurance Company Limited 1,898 – 237,859 201,859 Agriauto Industries Limited * 19,479 15,166 183,600 77,707 Al-Ghazi Tractors Limited * 24,189 15,891 – 5,000 Atlas Fund of Funds – 58 12,000 10,000 Attock Petroleum Limited 7,078 5,611 60,000 – Avanceon Limited 1,457 – 126,000 – Century Insurance Company Limited 2,068 – Balance carried forward 56,169 36,726
NOTES TO THE CONSOLIDATED FINANCIAL STATEMENTSFor the year ended 30 June 2014
184 Crescent Steel and Allied Products Limited
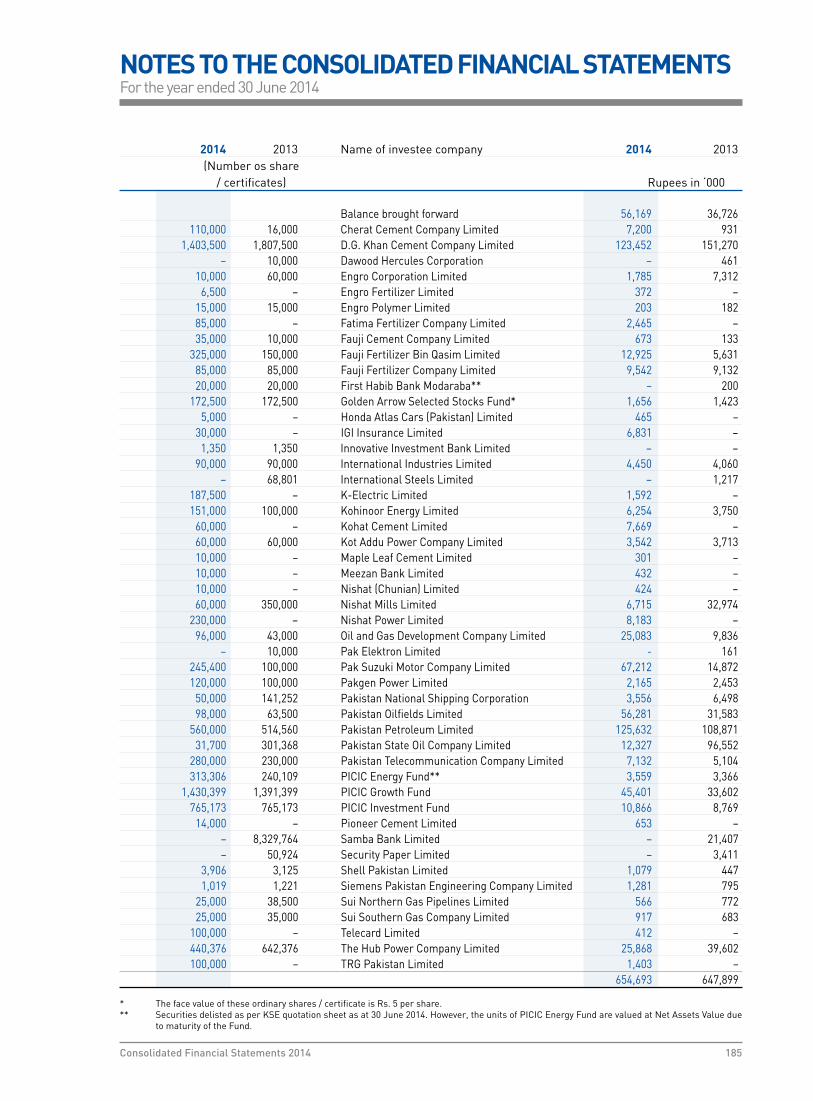
2014 2013 Name of investee company 2014 2013 (Number os share / certificates) Rupees in ‘000
Balance brought forward 56,169 36,726 110,000 16,000 Cherat Cement Company Limited 7,200 931 1,403,500 1,807,500 D.G. Khan Cement Company Limited 123,452 151,270 – 10,000 Dawood Hercules Corporation – 461 10,000 60,000 Engro Corporation Limited 1,785 7,312 6,500 – Engro Fertilizer Limited 372 – 15,000 15,000 Engro Polymer Limited 203 182 85,000 – Fatima Fertilizer Company Limited 2,465 – 35,000 10,000 Fauji Cement Company Limited 673 133 325,000 150,000 Fauji Fertilizer Bin Qasim Limited 12,925 5,631 85,000 85,000 Fauji Fertilizer Company Limited 9,542 9,132 20,000 20,000 First Habib Bank Modaraba** – 200 172,500 172,500 Golden Arrow Selected Stocks Fund* 1,656 1,423 5,000 – Honda Atlas Cars (Pakistan) Limited 465 – 30,000 – IGI Insurance Limited 6,831 – 1,350 1,350 Innovative Investment Bank Limited – – 90,000 90,000 International Industries Limited 4,450 4,060 – 68,801 International Steels Limited – 1,217 187,500 – K-Electric Limited 1,592 – 151,000 100,000 Kohinoor Energy Limited 6,254 3,750 60,000 – Kohat Cement Limited 7,669 – 60,000 60,000 Kot Addu Power Company Limited 3,542 3,713 10,000 – Maple Leaf Cement Limited 301 – 10,000 – Meezan Bank Limited 432 – 10,000 – Nishat (Chunian) Limited 424 – 60,000 350,000 Nishat Mills Limited 6,715 32,974 230,000 – Nishat Power Limited 8,183 – 96,000 43,000 Oil and Gas Development Company Limited 25,083 9,836 – 10,000 Pak Elektron Limited - 161 245,400 100,000 Pak Suzuki Motor Company Limited 67,212 14,872 120,000 100,000 Pakgen Power Limited 2,165 2,453 50,000 141,252 Pakistan National Shipping Corporation 3,556 6,498 98,000 63,500 Pakistan Oilfields Limited 56,281 31,583 560,000 514,560 Pakistan Petroleum Limited 125,632 108,871 31,700 301,368 Pakistan State Oil Company Limited 12,327 96,552 280,000 230,000 Pakistan Telecommunication Company Limited 7,132 5,104 313,306 240,109 PICIC Energy Fund** 3,559 3,366 1,430,399 1,391,399 PICIC Growth Fund 45,401 33,602 765,173 765,173 PICIC Investment Fund 10,866 8,769 14,000 – Pioneer Cement Limited 653 – – 8,329,764 Samba Bank Limited – 21,407 – 50,924 Security Paper Limited – 3,411 3,906 3,125 Shell Pakistan Limited 1,079 447 1,019 1,221 Siemens Pakistan Engineering Company Limited 1,281 795 25,000 38,500 Sui Northern Gas Pipelines Limited 566 772 25,000 35,000 Sui Southern Gas Company Limited 917 683 100,000 – Telecard Limited 412 – 440,376 642,376 The Hub Power Company Limited 25,868 39,602 100,000 – TRG Pakistan Limited 1,403 – 654,693 647,899
* The face value of these ordinary shares / certificate is Rs. 5 per share.** Securities delisted as per KSE quotation sheet as at 30 June 2014. However, the units of PICIC Energy Fund are valued at Net Assets Value due
to maturity of the Fund.
NOTES TO THE CONSOLIDATED FINANCIAL STATEMENTSFor the year ended 30 June 2014
185Consolidated Financial Statements 2014

25.5 This represents 2,857 tolas of Silver held by the Company and valued at Rs. 2.128 million (2013: Rs. 2.086 million) being its fair value. The management considers cost to sell of underlying as insignificant, hence not considered while ascertaining fair value.
25.6 The following investments are deposited as security with commercial banks:
Name of investee company 2014 2013 Altern Energy Limited 570,280 664,659 Attock Petroleum Limited 7,078 – Cherat Cement Company Limited 6,873 – Engro Corporation Limited – 1,219 Engro Polymer Limited 203 – Fauji Fertilizer Bin Qasim Limited 11,633 5,631 Fauji Fertilizer Company Limited 9,542 4,834 International Industries Limited 4,450 4,060 Kot Addu Power Company Limited 3,542 – Kohinoor Energy Limited 6,254 3,750 Meezan Bank Limited 432 – Oil and Gas Development Company Limited 19,857 4,575 Pakistan Oilfields Limited 56,281 24,869 Pakistan Petroleum Limited 22,434 82,846 Pak Suzuki Motor Company Limited 45,191 7,436 Pakistan State Oil Company Limited 2,800 63,907 Pakistan Telecommunication Company Limited 7,132 2,885 Shell Pakistan Limited 691 358 Sui Northern Gas Pipelines Limited 566 – Sui Southern Gas Company Limited 917 – The Hub Power Company Limited 25,868 38,369 802,024 909,398
26. MARK-UP ACCRUED Considered good Mark-up accrued on - Others 4 – - Term Deposit 469 – 473 –
2014 2013 Rupees in ‘000 Note (Restated)
27. OTHER RECEIVABLES Dividend receivable 935 6,393 Receivable against sale of non-current assets held for sale 4,816 – Receivable against sale of investments 800 – Receivable against rent from investment property 1,031 1,051 Claim receivable 10,059 3,786 Due from related parties 27.1 245 1,200 Sales tax refundable 7,635 19,570 Provision there against – (4,346) Reversal of provision during the year – 4,346 Written off during the year – (11,376) – (11,376) 7,635 8,194 Receivable from staff retirement benefit funds 44.1.3 116,177 113,380 Others 398 1,837 142,096 135,841
NOTES TO THE CONSOLIDATED FINANCIAL STATEMENTSFor the year ended 30 June 2014
186 Crescent Steel and Allied Products Limited

Rupees in ‘000 2014 2013
27.1 Due from related parties Crescent Jute Products Limited 118 – Shakarganj Mills Limited 127 1,200 245 1,200
28. TAXATION - NET Advance taxation 1,576,932 1,451,606 Provision for taxation (1,418,264) (1,375,957) 158,668 75,649 28.1 The Income Tax assessments of the Holding Company have been finalized up to and including tax year 2003,
except for pending appeal effect orders in respect of assessment years 2001-2002 and 2002-2003. Tax returns of subsequent tax years, except for certain tax years, are deemed to be assessed under section 120 of the Income Tax Ordinance, 2001 unless selected for an amendment / audit by the taxation authorities. Deemed assessments for certain tax years were amended by the department and currently appeals in respect of these tax years are pending before the Appellate Tribunal Inland Revenue. Additional tax liability of Rs. 109.277 million may arise against the above mentioned assessments in case decisions are made against the Holding Company.
Full provision has been made in these consolidated financial statements up to tax year 2013, including for subsidiary companies, except for short credit of taxes paid & deducted at source, and adjustments of refunds in respect of the said Assessment / Tax years. However, additional provision in respect of Holding Company has not been made in these consolidated financial statements in respect of Tax Years as mentioned above, since based on the tax consultant’s opinion the management is confident of favourable outcome of these appeals.
During the current year, order under section 161/205 of the Income Tax Ordinance, 2001 relating to monitoring
of withholding taxes has been issued for the tax year 2010 where by demand aggregating to Rs. 61.953 million has been raised, the appeal against which is pending before the Commissioner Inland Revenue (Appeals). No provision has been made in these financial statements as management is of the view that the demand is frivolous and based on tax consultant’s opinion favourable outcome is expected.
The Income Tax assessments of the Subsidiary Companies, based on tax returns, are deemed to be finalized
under section 120 of the Income Tax Ordinance, 2001 unless selected for an amendment / audit by the taxation authorities.
Rupees in ‘000 Note 2014 2013
29. CASH AND BANK BALANCES With banks in profit and loss account - local currency 29.1 53,480 9,894 - foreign currency 2 2 53,482 9,896
in current accounts 88,632 61,293 Cash in hand 2,148 8,363 144,262 79,552 29.1 These carry profit at the rate 5% to 7.25% (2013: 5% to 7.25%).
NOTES TO THE CONSOLIDATED FINANCIAL STATEMENTSFor the year ended 30 June 2014
187Consolidated Financial Statements 2014

Rupees in ‘000 2014 2013
30. SALES - NET Local sales Bare pipes (own product excluding coating revenue) 1,385,656 1,522,072 Revenue from conversion 13,645 9,839 Coating of pipes 53,434 644,859 Cotton yarn / raw cotton 2,533,891 2,537,542 Others (including pipes laboratory testing) 18,721 60,983 Scrap / waste 65,291 83,709 Sales returns (30,529) (28,607) 4,040,109 4,830,397 Export sales Raw Cotton / Cotton yarn 252,578 498,698 4,292,687 5,329,095 Sales tax (262,517) (327,428)
4,030,170 5,001,667
31. COST OF SALES Steel segment 31.1 1,037,366 1,500,309 Cotton segment 31.1 2,762,502 2,850,499 3,799,868 4,350,808
31.1 Cost of sales Steel segment Cotton Segment Total 2014 2013 2014 2013 2014 2013Rupees in ‘000 Note (Restated) (Restated) (Restated)
Raw materials consumed 845,170 1,158,021 1,891,841 2,007,209 2,737,011 3,165,230 Cost of raw cotton sold – – 122,261 321,549 122,261 321,549 Packing materials consumed – – 24,568 25,137 24,568 25,137 Outside Conversion charges – – 171,161 241,067 171,161 241,067 Stores and spares consumed 35,845 35,466 29,680 49,095 65,525 84,561 Fuel, power and electricity 26,253 43,507 192,343 153,839 218,596 197,346 Salaries, wages and other benefits 31.2 75,328 80,985 99,520 92,997 174,848 173,982 Insurance 1,780 1,552 2,962 3,770 4,742 5,322 Repairs and maintenance 7,319 3,884 2,875 19,428 10,194 23,312 Depreciation 13.1.1 23,698 18,821 58,582 60,433 82,280 79,254 Stock-in-trade written down to NRV 7,508 45,645 2,428 5,981 9,936 51,626 Other expenses 53,443 57,142 24,507 15,753 77,950 72,895 1,076,344 1,445,023 2,622,728 2,996,258 3,699,072 4,441,281 Opening stock of work-in-process 21 3,661 13,089 13,913 9,179 17,574 22,268 Closing stock of work-in-process (10,153) (3,661) (31,854) (13,913) (42,007) (17,574) (6,492) 9,428 (17,941) (4,734) (24,433) 4,694 Cost of goods manufactured 1,069,852 1,454,451 2,604,787 2,991,524 3,674,639 4,445,975 Opening stock of finished goods 21 22,580 68,438 173,703 32,678 196,283 101,116 Closing stock of finished goods (55,066) (22,580) (15,988) (173,703) (71,054) (196,283) (32,486) 45,858 157,715 (141,025) 125,229 (95,167) 1,037,366 1,500,309 2,762,502 2,850,499 3,799,868 4,350,808
NOTES TO THE CONSOLIDATED FINANCIAL STATEMENTSFor the year ended 30 June 2014
188 Crescent Steel and Allied Products Limited

31.2 Detail of salaries, wages and other benefits
Steel segment Cotton Segment Total 2014 2013 2014 2013 2014 2013Rupees in ‘000 Note (Restated) (Restated) (Restated) Salaries, wages and other benefits 72,749 74,994 97,539 90,569 170,288 165,563 Gratuity fund 31.3 (91) 796 (7) 31 (98) 827 Pension fund 31.3 344 3,013 122 753 466 3,766 Provident fund contributions 2,326 2,182 1,866 1,644 4,192 3,826 75,328 80,985 99,520 92,997 174,848 173,982
2014 2013 Pension Gratuity Pension GratuityRupees in ‘000 (Restated)
31.3 Staff retirement benefits Current service costs 4,168 1,109 4,158 1,014 Interest costs 8,592 2,014 9,285 2,118 Expected return on plan assets excluding interest income (12,294) (3,221) (9,677) (2,305) 466 (98) 3,766 827
Rupees in ‘000 Note 2014 2013
32 INCOME FROM INVESTMENTS Return on UBL’s Term Finance Certificate – 76 Dividend income 47,323 65,044 Loss on commodity 43 (692) Gain / (loss) on sale of investments - net 307,738 97,034 Unrealized gain on held for trading investments 74,090 175,809 Rent from investment property 32.1 12,229 10,780 441,423 348,051 32.1 Direct operating expenses incurred against rental income from investment property amounted to Rs. 4.577
million (2013: Rs. 3.657 million). Further, Rs. 1.293 million (2013: Rs. 1.209 million) were incurred against the non rented out area.
33. DISTRIBUTION AND SELLING EXPENSES Steel segment Cotton Segment Total 2014 2013 2014 2013 2014 2013Rupees in ‘000 Note (Restated) (Restated) (Restated) Salaries, wages and other benefits 33.1 8,026 6,785 4,334 3,934 12,360 10,719 Commission – – 23,100 27,675 23,100 27,675 Travelling, conveyance and entertainment 472 450 192 1,244 664 1,694 Depreciation 13.1.1 852 622 – 1 852 623 Insurance 156 181 20 18 176 199 Postage, telephone and telegram 202 105 214 231 416 336 Advertisement 3,039 1,242 – 135 3,039 1,377 Bid bond expenses 902 644 – – 902 644 Legal and professional charges 1,138 2,154 11 126 1,149 2,280 Others 810 947 8,604 21,571 9,414 22,518 15,597 13,130 36,475 54,935 52,072 68,065
NOTES TO THE CONSOLIDATED FINANCIAL STATEMENTSFor the year ended 30 June 2014
189Consolidated Financial Statements 2014

33.1 Detail of salaries, wages and other benefits Steel segment Cotton Segment Total 2014 2013 2014 2013 2014 2013Rupees in ‘000 Note (Restated) (Restated) (Restated) Salaries, wages and other benefits 7,711 5,841 4,319 3,929 12,030 9,770 Gratuity fund 33.2 (16) 136 – – (16) 136 Pension fund 33.2 65 559 – – 65 559 Provident fund contributions 266 249 15 5 281 254 8,026 6,785 4,334 3,934 12,360 10,719
2014 2013 Pension Gratuity Pension GratuityRupees in ‘000 (Restated)
33.2 Staff retirement benefits Current service costs 581 181 617 167 Interest costs 1,199 329 1,378 350 Return on plan assets excluding interest income (1,715) (526) (1,436) (381) 65 (16) 559 136
34. ADMINISTRATIVE EXPENSES Steel segment Cotton segment IID segment Energy segment Total 2014 2013 2014 2013 2014 2013 2014 2013 2014 2013 Rupees in ‘000 Note (Restated) (Restated) (Restated) (Restated) (Restated)
Salaries, wages and other benefits 34.1 50,914 51,653 13,254 12,160 3,722 3,914 – – 67,890 67,727 Rents, rates and taxes 2,442 2,643 3,031 624 1,081 458 326 305 6,880 4,030 Travelling, conveyance and entertainment 8,266 5,885 2,223 1,421 517 345 186 – 11,192 7,651 Fuel and power 9,153 7,831 831 1,148 475 421 – – 10,459 9,400 Postage, telephone and telegram 2,433 1,786 776 511 149 91 – – 3,358 2,388 Insurance 1,089 835 231 227 127 112 600 545 2,047 1,719 Repairs and maintenance 3,698 4,305 762 634 381 365 – – 4,841 5,304 Auditors’ remuneration 34.3 1,119 1,069 250 439 195 175 30 90 1,594 1,773 Legal, professional and corporate service charges 7,692 10,245 1,363 1,804 3,672 2,222 371 80 13,098 14,351 Advertisement 64 90 7 9 3 3 – – 74 102 Donations 34.4 11,369 26,772 10,272 7,232 634 1,146 – – 22,275 35,150 Depreciation 13.1.1 & 15.1.1 5,623 7,129 1,299 1,066 4,869 4,645 – – 11,791 12,840 Amortization of intangible assets 14.1.1 4,230 1,943 846 389 212 97 – – 5,288 2,429 Printing, stationery and office supplies 3,641 3,597 856 774 269 328 28 5 4,794 4,704 Newspapers, subscriptions and periodicals 566 530 1,001 431 43 39 – – 1,610 1,000 Others 2,302 4,308 568 1,096 1,595 796 6 18 4,471 6,218 114,601 130,621 37,570 29,965 17,944 15,157 1,547 1,043 171,662 176,786
34.1 Detail of salaries, wages and other benefits Salaries, wages and other benefits 48,443 44,517 12,735 10,764 3,528 3,358 – – 64,706 58,639 Gratuity fund 34.2 (120) 1,025 (23) 198 (10) 80 – – (153) 1,303 Pension fund 34.2 492 4,181 96 808 40 327 – – 628 5,316 Provident fund contributions 2,099 1,930 446 390 164 149 – – 2,709 2,469 50,914 51,653 13,254 12,160 3,722 3,914 – – 67,890 67,727
NOTES TO THE CONSOLIDATED FINANCIAL STATEMENTSFor the year ended 30 June 2014
190 Crescent Steel and Allied Products Limited

2014 2013 Pension Gratuity Pension GratuityRupees in ‘000 (Restated)
34.2 Staff retirement benefits Current service costs 5,618 1,732 5,870 1,598 Interest costs 11,578 3,144 13,106 3,338 Return on plan assets excluding interest income (16,568) (5,029) (13,660) (3,633) 628 (153) 5,316 1,303
Rupees in ‘000 Note 2014 2013
34.3 Auditors’ remuneration Audit fee 34.3.1 1,422 1,345 Fee for audit of funds’ financial statements and other reports 20 220 Out of pocket expenses 152 208 1,594 1,773 34.3.1 Audit fee includes services for audit of annual separate and consolidated financial statements of the Holding
Company and the individual financial statements of the subsidiary companies, limited review of unconsolidated condensed interim financial information for the six months period, review report on statement of compliance with best practices of the Code of Corporate Governance and audit of reconciliation statement of nominee shareholding of Central Depositry Company of Pakistan Limited.
34.4 Donations Donations include the following in which a director is interested : Name of director Interest Name and address of the donee Amount donated in donee 2014 2013Rupees in ‘000 Mr. Ahsan M. Saleem Director The Citizens Foundation Plot No. 20, Sector - 14, Near Brookes Chowrangi, Korangi Industrial Area, Karachi. 19,820 26,580 Director Pakistan Centre for Philanthropy 1-A, Street 14, F-8/3, Islamabad. – 2,500 Managing Commecs Educational Trust Trustee Gulistan-e-Johar Block-13, Karachi. – 2,000 Chairman CSAP Foundation 10th Floor, BOP Tower, 10-B, Block E-2, Main Boulevard, Gulberg - III, Lahore. 285 1,945
20,105 33,025 34.4.1 Donations other than those mentioned above were not made to any donee in which a director or his spouse had
any interest at any time during the year.
NOTES TO THE CONSOLIDATED FINANCIAL STATEMENTSFor the year ended 30 June 2014
191Consolidated Financial Statements 2014

Rupees in ‘000 Note 2014 2013
35. OTHER OPERATING EXPENSES Exchange loss – 19,781 Sales tax refundabale written off – 11,376 Impairment on non-current asset held-for-sale – 29,810 Loss on disposal of assets held for sale 9,935 – Impairment of capital work in progress 35.1 – 22,406 Provision for – Workers’ Welfare Fund 565 18,886 – Workers’ Profit Participation Fund 4,851 34,797 – Doubtful trade debts – 12,662 – Liquidated damages 2,152 12,794 – Slow moving stores, spares and loose tools - net 6,548 1,278 – Diminution in the value of investments 25.2 5,999 – – Government Infrastructure Development Cess 3,381 – – Dividend receivable on preference shares – 5,106 Others – 138
33,431 169,034 35.1 Comparative figure includes Rs. 20.619 million of construction work at the site which has been halted since
last year due to differences between Defence Housing Authority and the developer and is still uncertain in near future. Consequently, based on prudence principal the Holding Company has provided the above advance in full.
This further includes an impairment of Rs. 1.787 million relating to plant and machinery of Cotton division Unit
II which was no more usable due to fire incident occurred last year.
Rupees in ‘000 Note 2014 2013
36. OTHER INCOME Income from financial assets Return on deposits 1,235 834 Income from non-financial assets Gain on disposal of operating fixed assets 36.1 965 306,633 Exchange gain 16,939 - Gain on settlement of non-executed contracts - - Insurance commission 708 1,105 Liability written back 3,521 - Reversal of provision - stock-in-trade - 565 - doubtful trade debts 10,916 100 - sales tax refundabale - 4,346 - liquidated damages 3,456 8,934 Others 36.1 9,572 48,641 46,077 370,324
47,312 371,158
36.1 Comparative figures includes an amount of Rs. 310.872 million on account of gain on final settlement of insurance claim received against damages caused by fire in the Spinning Unit No. 2 of the Cotton segment of the Holding Company situated in Jaranwala on 7 January 2012.
NOTES TO THE CONSOLIDATED FINANCIAL STATEMENTSFor the year ended 30 June 2014
192 Crescent Steel and Allied Products Limited

Rupees in ‘000 2014 2013
37. FINANCE COSTS Incurred on - finance lease obligations 9,427 5,208 - running finances 38,354 36,433 - short term loans 30,719 15,126 - Workers’ Profit Participation Fund 1,387 2,222 Discount on long term deposit 8,429 – Bank charges 6,595 3,918 94,911 62,907
38. SHARE OF PROFIT IN EQUITY ACCOUNTED INVESTEES - NET OF TAXATION (INCLUDING GAIN ON DILUTION OF INVESTMENT) Altern Energy Limited Share of profit after taxation 450,834 216,067 Gain on dilution of investment – 18,285 450,834 234,352 Shakarganj Mills Limited (110,192) 35,100 340,642 269,452
2014 2013 Rupees in ‘000 (Restated) 39. TAXATION Current - for the year 18,715 300,631 - for prior years (2,798) (7,605) 15,917 293,026 Deferred - for the year 43,262 (20,987) - for prior years 95,068 – 138,330 (20,987) 154,247 272,039 39.1 Relationship between taxation expense and accounting profit Profit before taxation 707,603 1,162,728 Tax at the applicable rate of 34% (2013: 35%) 240,585 406,955 Tax effect of inadmissible expenses / losses 3,536 (88,890) Tax effect of exempt income and export sales under final tax regime (10,665) – Tax effect of income taxed at lower rates (168,296) (134,456) Tax effect of operating fixed assets subject to insurance claim – 106,735 Prior year tax effect 92,270 (101,293) Tax effect of change in effective tax rate and other adjustments (3,183) 988 154,247 272,039 40. BASIC AND DILUTED EARNINGS PER SHARE Profit after taxation 553,356 890,689
(Restated) (Number of shares)
Weighted average number of ordinary shares in issue during the year 62,105,993 62,105,993
Rupees Basic and diluted earnings per share 8.91 14.34
NOTES TO THE CONSOLIDATED FINANCIAL STATEMENTSFor the year ended 30 June 2014
193Consolidated Financial Statements 2014

2014 2013 Rupees in ‘000 Note (Restated)
41. CASH GENERATED FROM OPERATIONS Profit before taxation 707,603 1,162,728 Adjustments for non cash charges and other items Depreciation on operating fixed assets and investment property 94,924 88,353 Amortization of intangible assets 5,288 2,429 Charge for the year on staff retirement benefit funds 892 11,907 (Reversal) / charge for compensated absences (189) 2,072 Provision for 10-C bonus 1,159 2,331 Amortization of advances to staff – 5 Dividend income (47,323) (65,044) Unrealised gain on held for trading investments - net (74,090) (175,809) Gain on sale of investments (307,738) (97,034) Unrealized (gain) / loss on commodity - Silver (43) 692 Provision for stock-in-trade and stores, spares and loose tools - net 6,548 713 (Reversal of provision) / provision for doubtful trade debts (10,916) 12,562 Provision for Workers’ Welfare Fund 565 18,791 Provision for Workers’ Profit Participation Fund 4,851 34,797 Reversal of provision against sales tax refundable – (4,346) (Reversal of provision) / provision for liquidated damages (1,304) 3,860 Provision for Gas Infrastructure Development Cess 3,381 – Provision for diminution in the value of investments - net 5,999 – Return on deposits and investments (1,235) (910) Gain on disposal of operating fixed assets (965) (25,031) Gain on disposal of assets subject to insurance claim – (281,531) Deferred income (924) (71) Impairment on non-current asset held for sale - 29,810 Loss on disposal of assets held for sale 9,935 – Impairment charge relating to capital work in process – 22,406 Provision against dividend receivable on preference shares – 5,106 Finance costs 94,911 62,907 Share of profit from equity acounted investees - net of taxation (340,642) (269,452) Working capital changes 41.1 339,453 (133,515)
490,140 408,726 41.1 Working capital changes Decrease / (increase) in current assets Stores, spares and loose tools 135 (13,491) Stock-in-trade 263,034 (62,684) Trade debts 118,293 159,511 Advances (16,927) 106,241 Trade deposits and short term prepayments 2,093 (3,750) Other receivables (13,370) 22,476 353,258 208,303 (Decrease) / increase in current liabilities Trade and other payables (13,805) (341,818) 339,453 (133,515)
NOTES TO THE CONSOLIDATED FINANCIAL STATEMENTSFor the year ended 30 June 2014
194 Crescent Steel and Allied Products Limited

Rupees in ‘000 2014 2013
42. CASH AND CASH EQUIVALENTS
Running finances under mark-up arrangements 11 (228,366) (285,890) Cash and bank balances 29 144,262 79,552 (84,104) (206,338)
43. SEGMENT REPORTING
43.1 Reportable segments
The Group’s reportable segments are as follows: - Steel segment - It comprises of manufacturing and coating of steel pipes (note 1.2). - Cotton segment - It comprises of manufacturing of yarn (note 1.2). - Investment and Infrastructure Development (IID) segment - To effectively manage the investment portfolio
in shares and other securities (strategic as well as short term) and investment property (held for rentals as well as long term appreciation).
- Energy segment - It comprises of operations of the subsidiary company (note 1.4).
Information regarding the Group’s reportable segments is presented below. 43.2 Segment revenues and results
Following is an analysis of the Group’s revenue and results by reportable segment :
Steel Cotton IID Energy TotalRupees in ‘000 segment segment segment segment For the year ended 30 June 2014 Sales - net* 1,280,643 2,749,527 – – 4,030,170 Cost of sales* 1,037,366 2,762,502 – - 3,799,868 Gross profit 243,277 (12,975) – – 230,302 Income from investments – – 441,423 – 441,423 243,277 (12,975) 441,423 – 671,725 Distribution and selling expenses 15,597 36,475 – – 52,072 Administrative expenses 114,601 37,570 17,944 1,547 171,662 Other operating expenses 8,778 8,536 6,182 9,935 33,431 138,976 82,581 24,126 11,482 257,165 104,301 (95,556) 417,297 (11,482) 414,560 Other income 14,157 27,630 4,847 678 47,312 Operating profit / (loss) before finance costs 118,458 (67,926) 422,144 (10,804) 461,872 Finance costs 34,207 46,304 5,952 8,448 94,911 Share of profit in equity accounted investees - net of taxation - - 285,185 55,457 340,642 Profit / (loss) before taxation 84,251 (114,230) 701,377 36,205 707,603 Taxation 154,247 Profit after taxation 553,356 *The sales of goods to subsidiary company has been eliminated in sales and cost of sales.
NOTES TO THE CONSOLIDATED FINANCIAL STATEMENTSFor the year ended 30 June 2014
195Consolidated Financial Statements 2014

Steel Cotton IID Energy TotalRupees in ‘000 segment segment segment segment (Restated) For the year ended 30 June 2013 Sales - net 1,964,574 3,037,093 – – 5,001,667 Cost of sales 1,500,309 2,850,499 – – 4,350,808 Gross profit 464,265 186,594 – – 650,859 Income from investments – – 348,051 – 348,051 464,265 186,594 348,051 – 998,910 Distribution and selling expenses 13,130 54,935 – – 68,065 Administrative expenses 130,621 29,965 15,157 1,043 176,786 Other operating expenses 62,705 48,987 27,532 29,810 169,034 206,456 133,887 42,689 30,853 413,885 257,809 52,707 305,362 (30,853) 585,025 Other income 23,494 345,389 2,113 162 371,158 Operating profit / (loss) before finance costs 281,303 398,096 307,475 (30,691) 956,183 Finance costs 19,870 28,116 14,917 4 62,907 Share of profit in equity accounted investees - net of taxation – – 239,978 29,474 269,452 Profit / (loss) before taxation 261,433 369,980 532,536 (1,221) 1,162,728 Taxation 272,039
Profit after taxation 890,689
43.2.1 Revenue reported above represents revenue generated from external customers. There were no inter-segment sale during the year (2013: Rs. Nil).
43.2.2 Transfer prices between reportable segments are on an arm’s length basis in a manner similar to transactions
between third parties. 43.2.3 The accounting policies of the reportable segments are the same as the Group’s accounting policies described in
note 5 to these consolidated financial statements. The Steel segment allocates certain percentage of the common expenditure to the Cotton and IID segments. In addition, finance costs between Steel and Cotton segments are allocated at average mark-up rate on the basis of funds utilized. This is the measure reported to management for the purposes of resource allocation and assessment of segment performance.
43.3 Revenue from major products and services
The analysis of the Group’s revenue from external customers for major products and services is given in note 30 to these consolidated financial statements.
43.4 Information about major customers
Revenue from major customers of Steel segment represents an aggregate amount of Rs. 1,197.032 million (2013: Rs. 1,516.231 million) of total Steel segment revenue of Rs. 1,280.643 million (2013: Rs. 1,964.574 million). Further, revenue from major customers of Cotton segment represents an aggregate amount of Rs. 260.990 million (2013: Rs. 873.076 million) of total Cotton segment revenue of Rs. 2,749.527 million (2013: Rs. 3,037.093 million).
NOTES TO THE CONSOLIDATED FINANCIAL STATEMENTSFor the year ended 30 June 2014
196 Crescent Steel and Allied Products Limited

43.5 Geographical information
43.5.1 The Group’s revenue from external customers by geographical location is detailed below : Rupees in ‘000 2014 2013
Far East 252,578 498,697 Pakistan 3,777,592 4,502,970 4,030,170 5,001,667 43.5.2 All non-current assets of the Company as at 30 June 2014 and 2013 were located and operating in Pakistan. 43.6 Segment assets and liabilities
Reportable segments’ assets and liabilities are reconciled to total assets and liabilities as follows: Steel Cotton IID Energy TotalRupees in ‘000 segment segment segment segment As at 30 June 2014 Segment assets for reportable segments 1,122,218 882,112 1,208,524 607,606 3,820,460 Investment in equity accounted investees – – 2,293,501 246,563 2,540,064 Unallocated corporate assets (195,302) Total assets as per balance sheet 6,165,222 Segment liabilities for reportable segments 198,594 130,675 114,607 4,276 448,152 Unallocated corporate liabilities and deferred income 470,873 Total liabilities as per balance sheet 919,025
As at 30 June 2013 - as restated Segment assets for reportable segments 781,190 1,250,852 1,340,044 526,847 3,898,933 Investment in equity accounted investees - - 1,840,398 199,815 2,040,213 Unallocated corporate assets (66,404) Total assets as per balance sheet 5,872,742 Segment liabilities for reportable segments 148,375 210,486 3,031 2,313 364,205 Unallocated corporate liabilities and deferred income 552,985 Total liabilities as per balance sheet 917,190
43.6.1 For the purposes of monitoring segment performance and allocating resources between segments :
- all assets are allocated to reportable segments other than those directly relating to corporate and taxation assets; and
- all liabilities are allocated to reportable segments other than those directly relating to corporate and taxation.
Cash and bank balances, borrowings and related mark-up receivable therefrom and payable thereon, respectively
are not allocated to reporting segments as these are managed by the Group’s central treasury function.
NOTES TO THE CONSOLIDATED FINANCIAL STATEMENTSFor the year ended 30 June 2014
197Consolidated Financial Statements 2014
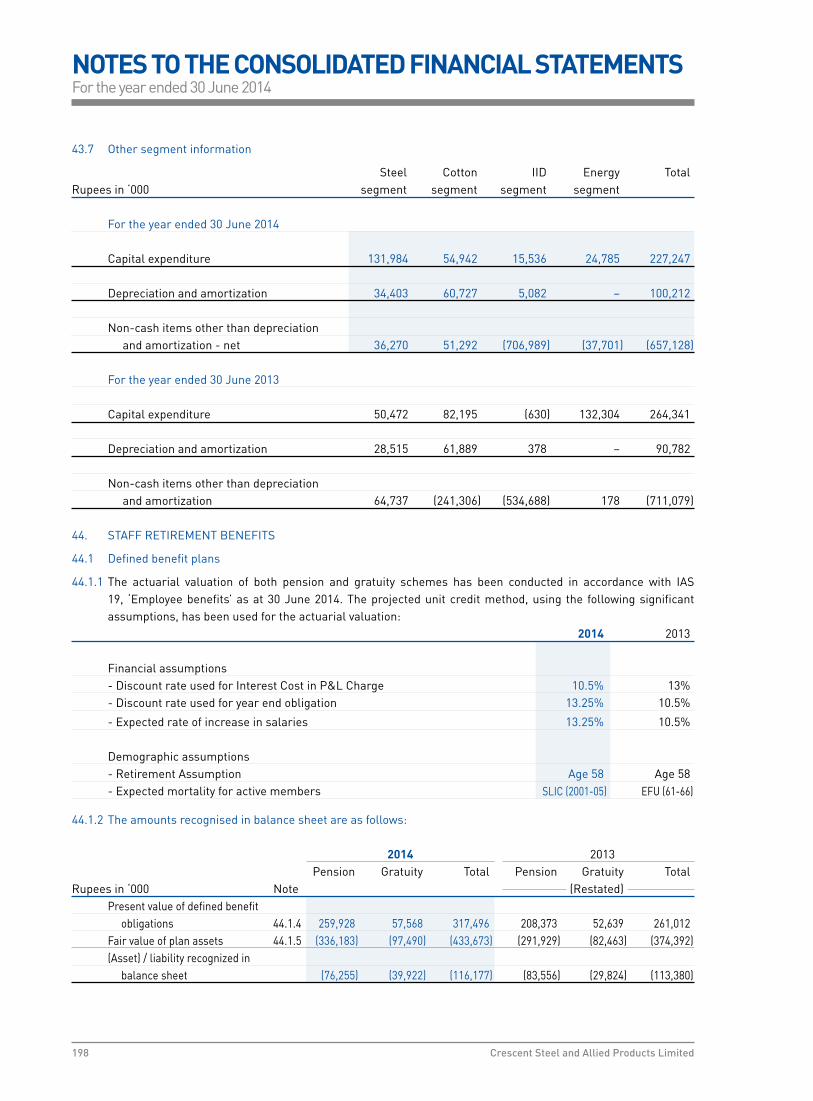
43.7 Other segment information
Steel Cotton IID Energy TotalRupees in ‘000 segment segment segment segment For the year ended 30 June 2014 Capital expenditure 131,984 54,942 15,536 24,785 227,247 Depreciation and amortization 34,403 60,727 5,082 – 100,212 Non-cash items other than depreciation and amortization - net 36,270 51,292 (706,989) (37,701) (657,128) For the year ended 30 June 2013 Capital expenditure 50,472 82,195 (630) 132,304 264,341 Depreciation and amortization 28,515 61,889 378 – 90,782 Non-cash items other than depreciation and amortization 64,737 (241,306) (534,688) 178 (711,079)
44. STAFF RETIREMENT BENEFITS
44.1 Defined benefit plans
44.1.1 The actuarial valuation of both pension and gratuity schemes has been conducted in accordance with IAS 19, ‘Employee benefits’ as at 30 June 2014. The projected unit credit method, using the following significant assumptions, has been used for the actuarial valuation:
2014 2013
Financial assumptions - Discount rate used for Interest Cost in P&L Charge 10.5% 13% - Discount rate used for year end obligation 13.25% 10.5%
- Expected rate of increase in salaries 13.25% 10.5%
Demographic assumptions - Retirement Assumption Age 58 Age 58 - Expected mortality for active members SLIC (2001-05) EFU (61-66)
44.1.2 The amounts recognised in balance sheet are as follows:
2014 2013 Pension Gratuity Total Pension Gratuity TotalRupees in ‘000 Note (Restated) Present value of defined benefit obligations 44.1.4 259,928 57,568 317,496 208,373 52,639 261,012 Fair value of plan assets 44.1.5 (336,183) (97,490) (433,673) (291,929) (82,463) (374,392) (Asset) / liability recognized in balance sheet (76,255) (39,922) (116,177) (83,556) (29,824) (113,380)
NOTES TO THE CONSOLIDATED FINANCIAL STATEMENTSFor the year ended 30 June 2014
198 Crescent Steel and Allied Products Limited

44.1.3 Movement in the net defined benefit liability / (asset)
2014 2013 Pension Gratuity Total Pension Gratuity TotalRupees in ‘000 Note (Restated)
Opening balance (83,556) (29,824) (113,380) (7,723) (3,943) (11,666) Net benefit cost / (income) charged to profit and loss 44.1.7 1,166 (269) 897 9,641 2,266 11,907 Remeasurements recognized in other comprehensive income 14,925 (6,362) 8,563 (76,734) (24,654) (101,388) Contributions by the Holding Company 44.1.5 (8,790) (3,467) (12,257) (8,740) (3,493) (12,233) Closing balance (76,255) (39,922) (116,177) (83,556) (29,824) (113,380) 44.1.4 Movement in the present value of defined benefit obligations 2014 2013 Pension Gratuity Total Pension Gratuity TotalRupees in ‘000 (Restated) Present value of defined benefit obligations - 1 July 208,373 52,639 261,012 182,831 44,661 227,492 Current service cost 10,430 3,045 13,475 10,645 2,779 13,424 Interest cost 21,497 5,527 27,024 23,768 5,806 29,574 Benefits paid during the year (6,716) – (6,716) (6,338) (939) (7,277) Benefit due but not paid (571) – (571) – – – Remeasurement (gain) / loss from changes in demographic assumptions 24,298 – 24,298 – – – Remeasurement (gain) / loss of experience adjustments 2,617 (3,643) (1,026) (2,533) 332 (2,201) Remeasurement (gain) / loss of defined benefit obligation 26,915 (3,643) 23,272 (2,533) 332 (2,201) Present value of defined benefit obligations - 30 June 259,928 57,568 317,496 208,373 52,639 261,012
44.1.5 Movement in the fair value of plan assets are as follows 2014 2013 Pension Gratuity Total Pension Gratuity TotalRupees in ‘000 (Restated) Fair value of plan assets - 1 July 291,929 82,463 374,392 190,554 48,604 239,158 Contributions by the Holding Company 8,790 3,467 12,257 8,740 3,493 12,233 Interest income on plan assets 30,761 8,841 39,602 24,772 6,319 31,091 Benefits paid during the year (6,716) – (6,716) (6,338) (939) (7,277) Benefit due but not paid (571) – (571) – – – Return on plan assets, excluding interest income 11,990 2,719 14,709 74,201 24,986 99,187 Fair value of plan assets - 30 June 336,183 97,490 433,673 291,929 82,463 374,392 44.1.6 Actual return on plan assets 42,751 11,560 54,311 98,973 31,305 130,278
NOTES TO THE CONSOLIDATED FINANCIAL STATEMENTSFor the year ended 30 June 2014
199Consolidated Financial Statements 2014
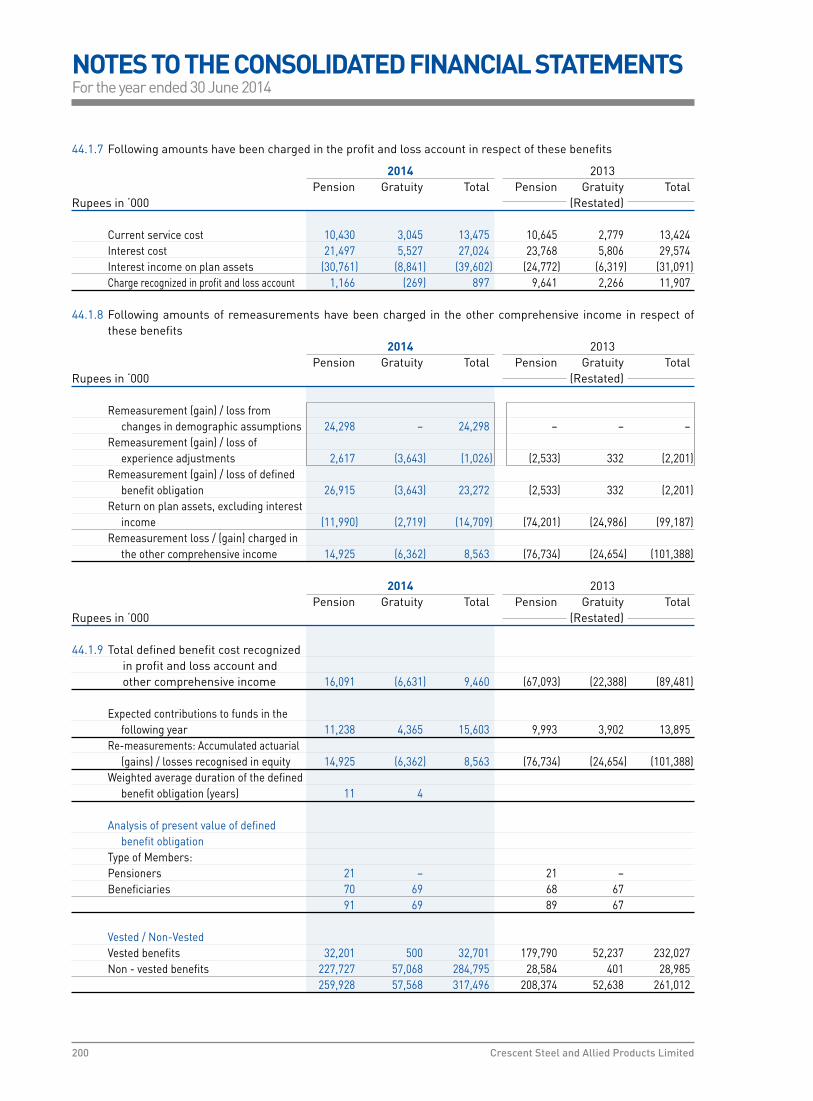
44.1.7 Following amounts have been charged in the profit and loss account in respect of these benefits
2014 2013 Pension Gratuity Total Pension Gratuity TotalRupees in ‘000 (Restated) Current service cost 10,430 3,045 13,475 10,645 2,779 13,424 Interest cost 21,497 5,527 27,024 23,768 5,806 29,574 Interest income on plan assets (30,761) (8,841) (39,602) (24,772) (6,319) (31,091) Charge recognized in profit and loss account 1,166 (269) 897 9,641 2,266 11,907 44.1.8 Following amounts of remeasurements have been charged in the other comprehensive income in respect of
these benefits 2014 2013 Pension Gratuity Total Pension Gratuity TotalRupees in ‘000 (Restated) Remeasurement (gain) / loss from changes in demographic assumptions 24,298 – 24,298 – – – Remeasurement (gain) / loss of experience adjustments 2,617 (3,643) (1,026) (2,533) 332 (2,201) Remeasurement (gain) / loss of defined benefit obligation 26,915 (3,643) 23,272 (2,533) 332 (2,201) Return on plan assets, excluding interest income (11,990) (2,719) (14,709) (74,201) (24,986) (99,187) Remeasurement loss / (gain) charged in the other comprehensive income 14,925 (6,362) 8,563 (76,734) (24,654) (101,388) 2014 2013 Pension Gratuity Total Pension Gratuity TotalRupees in ‘000 (Restated) 44.1.9 Total defined benefit cost recognized in profit and loss account and other comprehensive income 16,091 (6,631) 9,460 (67,093) (22,388) (89,481) Expected contributions to funds in the following year 11,238 4,365 15,603 9,993 3,902 13,895 Re-measurements: Accumulated actuarial (gains) / losses recognised in equity 14,925 (6,362) 8,563 (76,734) (24,654) (101,388) Weighted average duration of the defined benefit obligation (years) 11 4 Analysis of present value of defined benefit obligation Type of Members: Pensioners 21 – 21 – Beneficiaries 70 69 68 67 91 69 89 67 Vested / Non-Vested Vested benefits 32,201 500 32,701 179,790 52,237 232,027 Non - vested benefits 227,727 57,068 284,795 28,584 401 28,985 259,928 57,568 317,496 208,374 52,638 261,012
NOTES TO THE CONSOLIDATED FINANCIAL STATEMENTSFor the year ended 30 June 2014
200 Crescent Steel and Allied Products Limited

2014 2013 Pension Gratuity Total Pension Gratuity TotalRupees in ‘000 (Restated)
Disaggregation of fair value of plan assets The fair value of the plan assets at balance sheet date for each category are as follows: Cash and cash equivalents (comprising bank balances and adjusted for current liabilities) - quoted 6,669 1,288 7,957 13,669 383 14,052 Debt instruments AA+ 24,645 – 24,645 23,687 – 23,687 A+ 3,970 – 3,970 – – – AA- 233 – 233 7,812 498 8,310 AM2- 14,282 – 14,282 9,860 – 9,860 B- 100,294 27,475 127,769 55,259 14,292 69,551 143,424 27,475 170,899 96,618 14,790 111,408 Equity instruments Beverages 630 – 630 – – – Chemicals 1,873 331 2,204 1,349 317 1,666 Commercial Banks 1,458 – 1,458 454 – 454 Construction and Materials (Cement) 7,418 – 7,418 6,672 – 6,672 Electricity 29,201 8,442 37,643 30,461 8,860 39,321 Food Producer 1,091 321 1,412 1,410 415 1,825 Industrial Metals and Minning 112,436 51,211 163,647 105,691 48,139 153,830 Non Life Insurance 167 – 167 121 – 121 Oil and Gas 13,372 3,777 17,149 10,331 3,213 13,544 Personal Goods (Textile) 2,798 – 2,798 2,355 – 2,355 170,444 64,082 234,526 158,844 60,944 219,788 Mutual funds Income Fund 3,409 2,272 5,681 3,233 2,155 5,388 Equity Fund 11,014 2,371 13,385 11,053 2,486 13,539 Capital Protected Fund – – – 7,388 1,705 9,093 Money Market Fund 1,222 – 1,222 1,122 – 1,122 15,645 4,643 20,288 22,796 6,346 29,142 329,513 96,200 425,713 278,258 82,080 360,338 Sensitivity analysis Reasonably possible changes at the reporting date to one of the relevant actuarial assumptions, holding other assumptions
constant, would have affected the defined benefit obligation by the amounts shown below. Discount rate +1% 233,385 55,576 Discount rate -1% 291,929 59,807 Long term pension / salary increase +1% 266,109 59,786 Long term pension / salary decrease -1% 254,339 55,559 Long term pension increase +1% 285,342 – Long term pension decrease -1% 237,920 – The actuary of the company has assessed that present value of future refunds or reduction in future contribution is not lower
than receivable from pension and gratuity funds recorded by the Holding Company.
NOTES TO THE CONSOLIDATED FINANCIAL STATEMENTSFor the year ended 30 June 2014
201Consolidated Financial Statements 2014
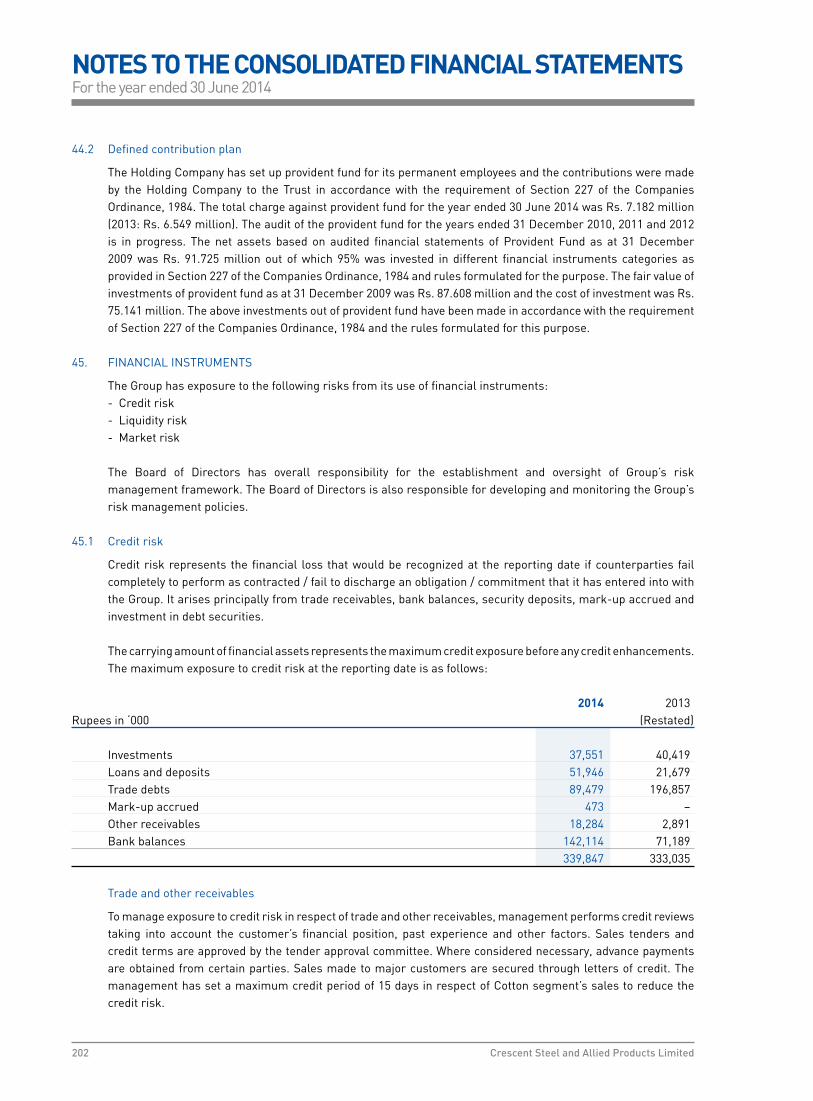
44.2 Defined contribution plan
The Holding Company has set up provident fund for its permanent employees and the contributions were made by the Holding Company to the Trust in accordance with the requirement of Section 227 of the Companies Ordinance, 1984. The total charge against provident fund for the year ended 30 June 2014 was Rs. 7.182 million (2013: Rs. 6.549 million). The audit of the provident fund for the years ended 31 December 2010, 2011 and 2012 is in progress. The net assets based on audited financial statements of Provident Fund as at 31 December 2009 was Rs. 91.725 million out of which 95% was invested in different financial instruments categories as provided in Section 227 of the Companies Ordinance, 1984 and rules formulated for the purpose. The fair value of investments of provident fund as at 31 December 2009 was Rs. 87.608 million and the cost of investment was Rs. 75.141 million. The above investments out of provident fund have been made in accordance with the requirement of Section 227 of the Companies Ordinance, 1984 and the rules formulated for this purpose.
45. FINANCIAL INSTRUMENTS
The Group has exposure to the following risks from its use of financial instruments: - Credit risk - Liquidity risk - Market risk The Board of Directors has overall responsibility for the establishment and oversight of Group’s risk
management framework. The Board of Directors is also responsible for developing and monitoring the Group’s risk management policies.
45.1 Credit risk
Credit risk represents the financial loss that would be recognized at the reporting date if counterparties fail completely to perform as contracted / fail to discharge an obligation / commitment that it has entered into with the Group. It arises principally from trade receivables, bank balances, security deposits, mark-up accrued and investment in debt securities.
The carrying amount of financial assets represents the maximum credit exposure before any credit enhancements.
The maximum exposure to credit risk at the reporting date is as follows: 2014 2013 Rupees in ‘000 (Restated) Investments 37,551 40,419 Loans and deposits 51,946 21,679 Trade debts 89,479 196,857 Mark-up accrued 473 – Other receivables 18,284 2,891 Bank balances 142,114 71,189 339,847 333,035
Trade and other receivables
To manage exposure to credit risk in respect of trade and other receivables, management performs credit reviews taking into account the customer’s financial position, past experience and other factors. Sales tenders and credit terms are approved by the tender approval committee. Where considered necessary, advance payments are obtained from certain parties. Sales made to major customers are secured through letters of credit. The management has set a maximum credit period of 15 days in respect of Cotton segment’s sales to reduce the credit risk.
NOTES TO THE CONSOLIDATED FINANCIAL STATEMENTSFor the year ended 30 June 2014
202 Crescent Steel and Allied Products Limited

All the trade debtors at the reporting date represent domestic parties except one export party. The maximum exposure to credit risk before any credit enhancements for trade debts at the reporting date by
type of customer was Rupees in ‘000 2014 2013 Steel segment 46,445 99,438 Cotton segment 43,034 97,419 89,479 196,857 The aging of trade debts at the reporting date is Not past due 38,472 68,146 Past due 1 - 30 days 985 55,627 Past due 30 - 180 days 35,340 63,941 Past due 180 days 17,468 22,844 92,265 210,558 Less: Impaired 2,786 13,701 89,479 196,857 One of the major customer accounts for Rs. 28.969 million of the trade debts carrying amount as at 30 June 2014
(2013: Rs. 44.352 million) that has a good track record with the Group.
Based on past experience the management believes that no impairment allowance is necessary in respect of trade debts past due as some receivables have been recovered subsequent to the year end and for other receivables there are reasonable grounds to believe that the amounts will be recovered in short course of time. Non past due amounts of Rs. 30.853 million (2013: Rs. 36.606 million) is secured through letters of credit.
Settlement risk
All investing transactions are settled / paid for upon delivery as per the advice of investment committee. The Group’s policy is to enter into financial instrument contract by following internal guidelines such as approving counterparties and approving credits.
Bank balances
The Group kept its surplus funds with banks having good credit rating. Currently the surplus funds are kept with banks having rating from AAA to AA-.
The credit quality of the units of mutual fund held by the Group can be assessed with reference to external credit ratings as follows:
Rating RatingRupees in ‘000 Short term Long term Agency 2014 2013
Mutual Funds PICIC Investment Fund MFR 3 star MFR 3 star JCR - VIS 3,749 3,025 PICIC Growth Fund MFR 3 star MFR 3 star JCR - VIS 4,592 2,552 PICIC Energy Fund MFR 3 star MFR 3 star JCR - VIS 3,559 3,366 Golden Arrow Selected Stocks Fund MFR 4-star MFR 5-star PACRA 1,656 1,423 13,556 10,366
NOTES TO THE CONSOLIDATED FINANCIAL STATEMENTSFor the year ended 30 June 2014
203Consolidated Financial Statements 2014

Investment in debt securities
Credit risk arising on debt securities is mitigated by investing principally in investment grade rated instruments. Where the investment is considered doubtful a provision is created there against. As at 30 June 2014, the Holding Company has recognized a provision of Rs. 11.105 million (2013: Rs. 5.106 million) against its exposure to preference shares of an associated company which has been given a credit rating of ‘D’ grade.
Concentration of credit risk Concentration of credit risk arises when a number of counter parties are engaged in similar business activities
or have similar economic features that would cause their abilities to meet contractual obligation to be similarly effected by the changes in economic, political or other conditions. The Holding Company believes that it is not exposed to major concentration of credit risk.
45.2 Liquidity risk Liquidity risk is the risk that the Group will encounter difficulty in meeting its obligation arising from financial
liabilities that are settled by delivering cash or another financial asset or that such obligation will have to be settled in a manner disadvantageous to the Group. The Group is not materially exposed to liquidity risk as substantially all obligation / commitments of the Group are short term in nature and are restricted to the extent of available liquidity. In addition, the Group has obtained running finance facilities from various commercial banks to meet the short term liquidity commitments, if any.
The following are the contractual maturities of the financial liabilities, including estimated interest payments:
Rupees in ‘000 2014 Carrying On Contractual Six Six to One to Two to amount demand cash flows months twelve two five or less months years years Financial liabilities Liabilities against assets subject to finance lease 103,029 – 119,554 28,310 24,003 41,987 25,254 Trade and other payables (refer note 9) 288,572 – 288,572 288,572 – – – Mark-up accrued 9,221 – 9,221 9,221 – – – Short term borrowings 228,366 228,366 – – – – –
629,188 228,366 417,347 326,103 24,003 41,987 25,254 Rupees in ‘000 2013 Carrying On Contractual Six Six to One to Two to amount demand cash flows months twelve two five or less months years years Financial liabilities Liabilities against assets subject to finance lease 66,566 – 76,082 16,602 21,975 23,918 13,587 Trade and other payables (refer note 9) - as restated 223,071 – 223,071 223,071 – – – Mark-up accrued 9,002 – 9,002 9,002 – – – Short term borrowings 418,365 418,365 – – – – – 717,004 418,365 308,155 248,675 21,975 23,918 13,587
NOTES TO THE CONSOLIDATED FINANCIAL STATEMENTSFor the year ended 30 June 2014
204 Crescent Steel and Allied Products Limited

45.3 Market risk
Market risk is the risk that changes in market price, such as foreign exchange rates, interest rates and equity prices will affect the Group’s income or the value of its holdings of financial instruments. The Investment Committee monitors the portfolio of its investments and adjust the portfolio in light of changing circumstances.
45.3.1 Currency risk
The Group is exposed to currency risk on import of raw materials, stores and spares, export of goods and foreign currency bank accounts denominated in US Dollars (USD), Great Britain Pounds (GBP) and Euros. The Group’s exposure to foreign currency risk for these currencies is as follows:
2014 USD Euro Total
Foreign creditors (160) – (160) Foreign currency bank account 2 – 2 Gross balance sheet exposure (158) – (158) Outstanding letters of credit 533,650 – 533,650
Net exposure 533,492 – 533,492 2013 GBP Euro Total
Foreign creditors (5,031) – (5,031) Foreign currency bank account 2 – 2 Gross balance sheet exposure (5,029) – (5,029) Outstanding letters of credit (73,000) (279,010) (352,010) Net exposure (78,029) (279,010) (357,039) The following significant exchange rate has been applied : Average rate Reporting date rate 2014 2013 2014 2013
USD to PKR 102.83 97.57 98.75 98.80 Euro to PKR 139.61 126.30 134.73 129.11 Sensitivity analysis
At the reporting date, if the PKR had strengthened by 10% against the USD and Euro with all other variables held constant, post-tax profit for the year would have been higher by the amount shown below, mainly as a result of net foreign exchange gain on translation of foreign currency bank account and foreign creditors.
Effect on profit or loss
2014 2013 USD 53,349 (7,803) Euro – (27,901) 53,349 (35,704)
The weakening of the PKR against USD and Euro would have had an equal but opposite impact on the post tax profits.
NOTES TO THE CONSOLIDATED FINANCIAL STATEMENTSFor the year ended 30 June 2014
205Consolidated Financial Statements 2014
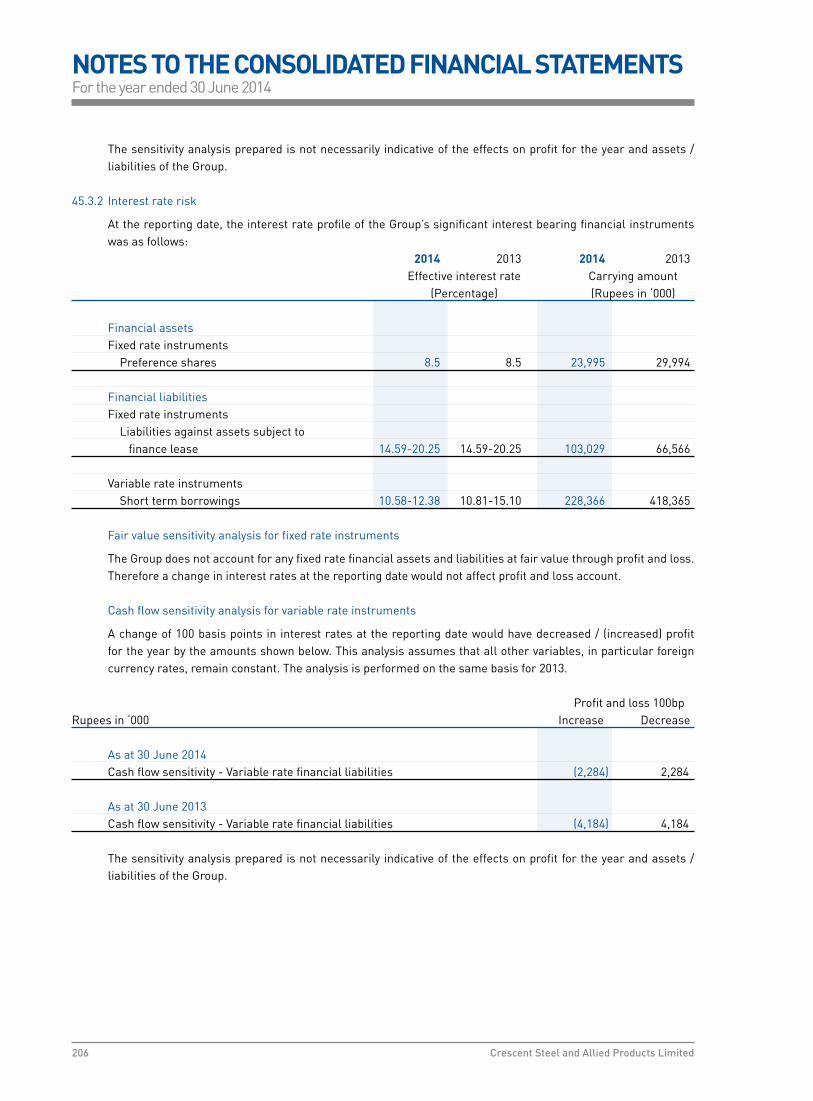
The sensitivity analysis prepared is not necessarily indicative of the effects on profit for the year and assets / liabilities of the Group.
45.3.2 Interest rate risk
At the reporting date, the interest rate profile of the Group’s significant interest bearing financial instruments was as follows:
2014 2013 2014 2013 Effective interest rate Carrying amount (Percentage) (Rupees in ‘000) Financial assets Fixed rate instruments Preference shares 8.5 8.5 23,995 29,994 Financial liabilities Fixed rate instruments Liabilities against assets subject to finance lease 14.59-20.25 14.59-20.25 103,029 66,566 Variable rate instruments Short term borrowings 10.58-12.38 10.81-15.10 228,366 418,365 Fair value sensitivity analysis for fixed rate instruments
The Group does not account for any fixed rate financial assets and liabilities at fair value through profit and loss. Therefore a change in interest rates at the reporting date would not affect profit and loss account.
Cash flow sensitivity analysis for variable rate instruments
A change of 100 basis points in interest rates at the reporting date would have decreased / (increased) profit for the year by the amounts shown below. This analysis assumes that all other variables, in particular foreign currency rates, remain constant. The analysis is performed on the same basis for 2013.
Profit and loss 100bpRupees in ‘000 Increase Decrease As at 30 June 2014 Cash flow sensitivity - Variable rate financial liabilities (2,284) 2,284 As at 30 June 2013 Cash flow sensitivity - Variable rate financial liabilities (4,184) 4,184 The sensitivity analysis prepared is not necessarily indicative of the effects on profit for the year and assets /
liabilities of the Group.
NOTES TO THE CONSOLIDATED FINANCIAL STATEMENTSFor the year ended 30 June 2014
206 Crescent Steel and Allied Products Limited
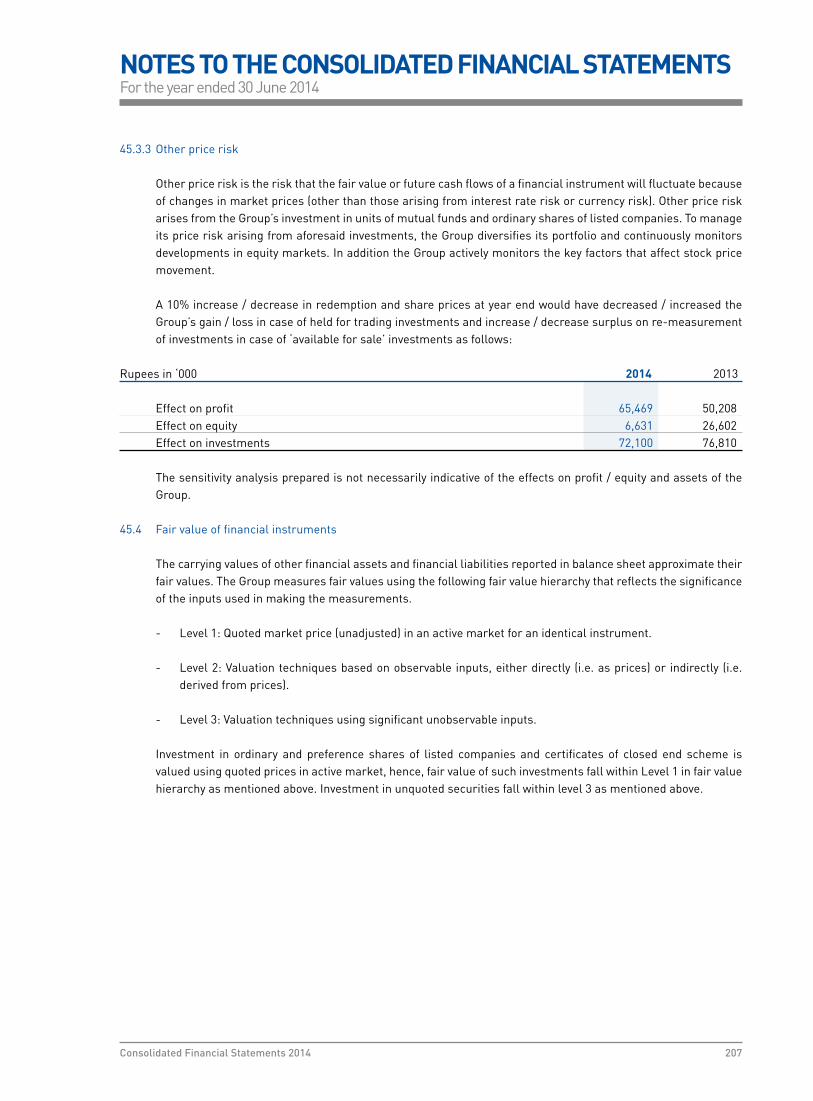
45.3.3 Other price risk Other price risk is the risk that the fair value or future cash flows of a financial instrument will fluctuate because
of changes in market prices (other than those arising from interest rate risk or currency risk). Other price risk arises from the Group’s investment in units of mutual funds and ordinary shares of listed companies. To manage its price risk arising from aforesaid investments, the Group diversifies its portfolio and continuously monitors developments in equity markets. In addition the Group actively monitors the key factors that affect stock price movement.
A 10% increase / decrease in redemption and share prices at year end would have decreased / increased the Group’s gain / loss in case of held for trading investments and increase / decrease surplus on re-measurement of investments in case of ‘available for sale’ investments as follows:
Rupees in ‘000 2014 2013
Effect on profit 65,469 50,208 Effect on equity 6,631 26,602 Effect on investments 72,100 76,810 The sensitivity analysis prepared is not necessarily indicative of the effects on profit / equity and assets of the
Group. 45.4 Fair value of financial instruments The carrying values of other financial assets and financial liabilities reported in balance sheet approximate their
fair values. The Group measures fair values using the following fair value hierarchy that reflects the significance of the inputs used in making the measurements.
- Level 1: Quoted market price (unadjusted) in an active market for an identical instrument.
- Level 2: Valuation techniques based on observable inputs, either directly (i.e. as prices) or indirectly (i.e. derived from prices).
- Level 3: Valuation techniques using significant unobservable inputs. Investment in ordinary and preference shares of listed companies and certificates of closed end scheme is
valued using quoted prices in active market, hence, fair value of such investments fall within Level 1 in fair value hierarchy as mentioned above. Investment in unquoted securities fall within level 3 as mentioned above.
NOTES TO THE CONSOLIDATED FINANCIAL STATEMENTSFor the year ended 30 June 2014
207Consolidated Financial Statements 2014
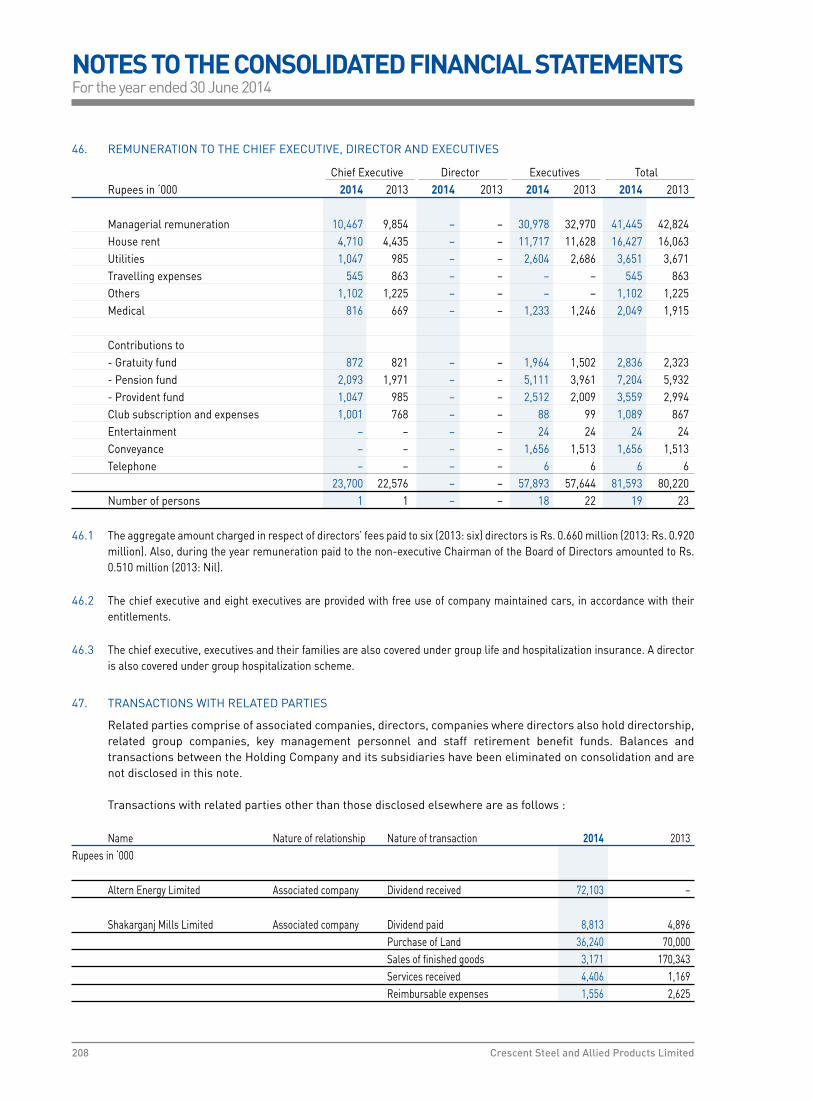
46. REMUNERATION TO THE CHIEF EXECUTIVE, DIRECTOR AND EXECUTIVES
Chief Executive Director Executives Total Rupees in ‘000 2014 2013 2014 2013 2014 2013 2014 2013
Managerial remuneration 10,467 9,854 – – 30,978 32,970 41,445 42,824 House rent 4,710 4,435 – – 11,717 11,628 16,427 16,063 Utilities 1,047 985 – – 2,604 2,686 3,651 3,671 Travelling expenses 545 863 – – – – 545 863 Others 1,102 1,225 – – – – 1,102 1,225 Medical 816 669 – – 1,233 1,246 2,049 1,915 Contributions to - Gratuity fund 872 821 – – 1,964 1,502 2,836 2,323 - Pension fund 2,093 1,971 – – 5,111 3,961 7,204 5,932 - Provident fund 1,047 985 – – 2,512 2,009 3,559 2,994 Club subscription and expenses 1,001 768 – – 88 99 1,089 867 Entertainment – – – – 24 24 24 24 Conveyance – – – – 1,656 1,513 1,656 1,513 Telephone – – – – 6 6 6 6 23,700 22,576 – – 57,893 57,644 81,593 80,220 Number of persons 1 1 – – 18 22 19 23
46.1 The aggregate amount charged in respect of directors’ fees paid to six (2013: six) directors is Rs. 0.660 million (2013: Rs. 0.920 million). Also, during the year remuneration paid to the non-executive Chairman of the Board of Directors amounted to Rs. 0.510 million (2013: Nil).
46.2 The chief executive and eight executives are provided with free use of company maintained cars, in accordance with their entitlements.
46.3 The chief executive, executives and their families are also covered under group life and hospitalization insurance. A director is also covered under group hospitalization scheme.
47. TRANSACTIONS WITH RELATED PARTIES
Related parties comprise of associated companies, directors, companies where directors also hold directorship, related group companies, key management personnel and staff retirement benefit funds. Balances and transactions between the Holding Company and its subsidiaries have been eliminated on consolidation and are not disclosed in this note.
Transactions with related parties other than those disclosed elsewhere are as follows :
Name Nature of relationship Nature of transaction 2014 2013Rupees in ‘000
Altern Energy Limited Associated company Dividend received 72,103 – Shakarganj Mills Limited Associated company Dividend paid 8,813 4,896 Purchase of Land 36,240 70,000 Sales of finished goods 3,171 170,343 Services received 4,406 1,169 Reimbursable expenses 1,556 2,625
NOTES TO THE CONSOLIDATED FINANCIAL STATEMENTSFor the year ended 30 June 2014
208 Crescent Steel and Allied Products Limited

Name Nature of relationship Nature of transaction 2014 2013Rupees in ‘000
Commecs Educational Trust * Related party Donation given – 2,000 Crescent Jute Products Limited * Related party Purchase of assets 5,909 – Services received 137 Reimbursable expenses 648 –
CSAP Foundation* Related party Donation given 285 1,945 Muhammad Amin Muhammad Bashir Limited * Related party Dividend paid 2 1 Pakistan Centre for Philanthropy * Related party Donation given – 2,500 Annual subscription charges 180 180 Premier Insurance Company * Related party Dividend paid – 11 Insurance premium 9,839 1,643 The Crescent Textile Mills Limited * Related party Dividend paid 20,119 11,177 The Citizens’ Foundation * Related party Donation given 19,820 26,580 Crescent Cotton Products - Staff Provident Fund Retirement benefit fund Contribution made 1,831 1,650 Dividend paid 16 9 Crescent Steel and Allied Products Limited - Gratuity Fund Retirement benefit fund Contribution made 3,797 3,492 Dividend paid 3,852 1,676 Crescent Steel and Allied Products Limited - Pension Fund Retirement benefit fund Contribution made 9,623 8,740 Dividend paid 8,457 3,003 Crescent Steel and Allied Products Limited - Staff Provident Fund Retirement benefit fund Contribution made 5,344 4,901 Dividend paid 1,651 850 CSAP - Staff Benevolent Fund Staff welfare fund Contribution made – 10,000 Key management personnel Related parties Remuneration and benefits 94,376 57,364 * These entities are / have been related parties of the Group by virtue of common directorship only.
NOTES TO THE CONSOLIDATED FINANCIAL STATEMENTSFor the year ended 30 June 2014
209Consolidated Financial Statements 2014

47.1 Sale of finished goods and raw materials, rendering of services and rental income are based on commercial
terms and at market prices which are approved by the Board of Directors.
47.2 Contributions to the employee retirement benefit funds are made in accordance with the terms of employee
retirement benefit schemes and actuarial advice.
47.3 Key management personnel are those persons having authority and responsibility for planning, directing and
controlling the activities of the Group, including directors of the Group. There were no transactions with the key
management personnel during the year other than their terms of employment / entitlements.
47.4 Outstanding balances and other information with respect to related parties as at 30 June 2014 and 2013 are
included in issued, subscribed and paid-up capital (note 6.1), trade and other payables (note 9.3), investment in
equity accounted investees (note 16), other long term investments (note 17.1), trade debts (note 22.1), investments
(note 25.1), other receivables (note 27.1), administrative expenses (note 34.4) and staff retirement benefits (note
44).
48. CAPITAL RISK MANAGEMENT
The Group’s prime objective when managing capital is to safeguard its ability to continue as a going concern
in order to provide adequate returns for shareholders and benefits for other stakeholders and to maintain an
optimal capital structure to reduce the cost of capital. The Group’s overall strategy remains unchanged from year
2013.
The Group manages its capital structure and makes adjustments to it in the light of changes in economic conditions.
To maintain or adjust the capital structure, the Group may adjust the dividend payments to shareholders or issue
new shares. The management seeks to maintain a balance between higher returns that might be possible with
higher levels of borrowings and the advantages and security afforded by a sound capital position.
The Group finances its operations through equity, borrowings and management of working capital with a view to
maintaining an appropriate mix between various sources of finance to minimize risk.
The Group is not subject to any externally imposed capital requirements.
The Group monitors capital on the basis of the gearing ratio. This ratio is calculated as net debt divided by total
capital. Net debt is calculated as total debt less cash and bank balances. Total capital is calculated as equity as
shown in the balance sheet plus net debt.
NOTES TO THE CONSOLIDATED FINANCIAL STATEMENTSFor the year ended 30 June 2014
210 Crescent Steel and Allied Products Limited

48.1 Gearing ratio
The gearing ratio at end of the year is calculated as follows
Rupees in ‘000 Note 2014 2013
Total debt 48.1.1 331,395 484,931 Less: Cash and bank balances 144,262 79,552 Net debt 187,133 405,379 Total equity 48.1.2 5,246,197 4,955,552 Total capital 5,433,330 5,360,931
Gearing ratio 3% 8%
48.1.1 Total debt is defined as long term and short term borrowings (excluding derivatives), as described in notes 7 and
11 to these consolidated financial statements.
48.1.2 Total equity includes all capital and reserves of the Holding Company that are managed as capital.
49. PLANT CAPACITY AND PRODUCTION
49.1 Steel segment
Pipe plant
The plant’s installed / rated capacity for production based on single shift is 30,000 tons (2013: 30,000 tons)
annually on the basis of notional pipe size of 30” dia x ½” thickness. The actual production achieved during the
year was 10,248 tons (2013: 12,266 tons) line pipes of varied sizes and thickness, which is equivalent to 21,676
tons (2013: 26,790 tons) if actual production is translated to the notional pipe size of 30” diameter.
Coating plant
The coating plant has a capacity of externally shot blasting and coating of line pipes with 3 layer high / medium
density polyethylene coating at a rate of 250 square meters of surface area per hour on pipe sizes ranging from
114 mm to 1524 mm outside dia and thickness ranging from 3 mm to 16 mm.
The annual capacity of the plant works out to 600,000 square meters outside surface area of line pipes based on
notional size of 14” dia on single shift working. Coating of 82,125 meters (2013: 340,472 meters) of different dia
pipes (58,651 square meters surface area) was achieved during the year (2013: 245,505 square meters surface
area).
NOTES TO THE CONSOLIDATED FINANCIAL STATEMENTSFor the year ended 30 June 2014
211Consolidated Financial Statements 2014

Chief Executive Director Chief Financial Officer
49.2 Cotton segment
Spinning unit 1
The plant capacity converted to 20s count based on three shifts per day for 1,080 shifts is 6,452,874 kilograms
(2013: 6,452,874 kilograms). Actual production converted into 20s count was 5,749,028 kilograms (2013: 4,953,253
kilograms).
The capacities of the plant were utilized to the extent of orders received. The production of spinning unit was also
affected due to power and gas shutdowns.
49.3 Energy segment
Power plant
The power plant is under installation phase with a maximum output capacity of 14 MWh (2013: 14 MWh).
50. GENERAL
50.1 Number of employees
The number of employees including contractual employees of the Group as at 30 June 2014 were 742 (2013: 859)
and weighted average number of employees were 846 (2013: 878).
50.2 Non adjusting event after reporting date
The Board of Directors of the Holding Company in their meeting held on 21 August 2014 have proposed final cash
dividend for the year ended 30 June 2014 of Rs. 1.5 per share (i.e. 15%) (2013: Rs. 1.5 per share) amounting to Rs.
93.159 million (2013: Rs. 84.690 million). This is in addition to the first interim cash dividends of Re. 1 per share
each (i.e. 10% each) already distributed and recorded in these consolidated financial statements; this make a
total distribution of Rs. 2.5 per share (i.e. 25%) for the year ended 30 June 2014. The above proposed final cash
dividend is subject to the approval of the members at the Annual General Meeting to be held on 23 October 2014.
These consolidated financial statements do not include the effect of above proposals which will be accounted for
in the period in which it is approved by the members.
51. DATE OF AUTHORIZATION FOR ISSUE
These consolidated financial statements were authorized for issue in the Board of Directors meeting held on 21
August 2014.
NOTES TO THE CONSOLIDATED FINANCIAL STATEMENTSFor the year ended 30 June 2014
212 Crescent Steel and Allied Products Limited

PATTERN OF SHAREHOLDINGAs at 30 June 2014
Shareholding
No. of Shareholders From To Total Shares held
444 1 100 13,991
691 101 500 233,607
534 501 1,000 432,891
879 1,001 5,000 2,238,603
258 5,001 10,000 2,035,392
103 10,001 15,000 1,289,475
66 15,001 20,000 1,182,720
47 20,001 25,000 1,064,665
26 25,001 30,000 743,813
22 30,001 35,000 715,791
17 35,001 40,000 637,952
10 40,001 45,000 429,743
23 45,001 50,000 1,120,327
12 50,001 55,000 636,186
4 55,001 60,000 235,000
3 60,001 65,000 188,000
5 65,001 70,000 341,038
5 70,001 75,000 367,128
5 75,001 80,000 386,606
2 80,001 85,000 163,202
3 85,001 90,000 261,593
2 90,001 95,000 182,500
6 95,001 100,000 592,738
2 105,001 110,000 216,962
2 115,001 120,000 235,502
1 125,001 130,000 130,000
1 135,001 140,000 136,523
1 140,001 145,000 143,458
6 145,001 150,000 887,455
1 155,001 160,000 156,572
5 160,001 165,000 821,177
1 165,001 170,000 165,072
1 170,001 175,000 171,500
2 175,001 180,000 358,000
1 195,001 200,000 200,000
2 215,001 220,000 440,000
2 225,001 230,000 456,852
1 240,001 245,000 243,601
1 245,001 250,000 247,260
2 255,001 260,000 517,240
213Annual Report 2014

PATTERN OF SHAREHOLDINGAs at 30 June 2014
Shareholding
No. of Shareholders From To Total Shares held
1 265,001 270,000 268,372
2 270,001 275,000 547,162
1 285,001 290,000 285,219
1 290,001 295,000 292,000
1 300,001 305,000 302,600
1 305,001 310,000 310,000
1 330,001 335,000 332,368
1 355,001 360,000 355,759
2 375,001 380,000 753,500
1 390,001 395,000 390,646
2 395,001 400,000 800,000
1 410,001 415,000 411,017
2 425,001 430,000 855,967
1 455,001 460,000 459,500
1 470,001 475,000 470,690
1 485,001 490,000 485,300
1 525,001 530,000 525,220
1 560,001 565,000 561,800
1 730,001 735,000 734,500
1 1,175,001 1,180,000 1,176,987
1 1,360,001 1,365,000 1,362,500
1 1,995,001 2,000,000 2,000,000
1 2,100,001 2,105,000 2,104,556
1 2,580,001 2,585,000 2,584,145
1 2,625,001 2,630,000 2,629,385
1 2,680,001 2,685,000 2,682,068
1 3,375,001 3,380,000 3,377,789
1 3,400,001 3,405,000 3,401,000
1 3,795,001 3,800,000 3,795,165
1 6,830,001 6,835,000 6,830,643
3,233 62,105,993
214 Crescent Steel and Allied Products Limited

CATEGORIES OF SHAREHOLDINGAs at 30 June 2014
Categories of Shareholder Physical CDC Total % age
1 Directors, Chief Executive Officer, Their Spouses and Minor Childern
Chief Executive Mr. Ahsan M. Saleem - 426,467 426,467 0.69 Directors Mr. Ahmad Waqar 27 - 27 0.00 Mr. Khurram Mazhar Karim - 5,293 5,293 0.01 Mr. Nasir Shafi - 37,876 37,876 0.06 Mr. Zahid Bashir - 86,088 86,088 0.14 Syed Mahmood Ehtishamullah - 13,196 13,196 0.02 Director’s Spouses and Their Minor Childern Mrs. Shahnaz A. Saleem - 520,471 520,471 0.84 27 1,089,391 1,089,418 1.75 2 Executives 12,298 45,695 57,993 0.09 3 Associated Companies, Undertakings & Related Parties Muhammad Amin Muhammad Bashir Limited 679 - 679 0.00 Shakarganj Mills Limited - 2,992,068 2,992,068 4.82 The Crescent Textile Mills Limited - 6,830,643 6,830,643 11.00 Trustee - Crescent Cotton Products P. Fund - 55,000 55,000 0.09 Trustees - Crescent Cotton Staff P. Fund - 4,840 4,840 0.01 Trustees - CSAPL Employees Gratuity Fund - 1,176,987 1,176,987 1.90 Trustees - CSAPL Employees Pension Fund - 2,584,145 2,584,145 4.16 Trustees - CSAPL Employees SP Fund - 525,220 525,220 0.85 679 14,168,903 14,169,582 22.82 4 NIT & ICP (Name Wise Detail) CDC - Trustee National Investment (Unit) Trust - 3,377,789 3,377,789 5.44 - 3,377,789 3,377,789 5.44
5 Mutual Funds (Name Wise Detail) CDC - Trustee First Capital Mutual Fund - 16,500 16,500 0.03 CDC - Trustee NAFA Stock Fund - 377,500 377,500 0.61 CDC - Trustee NIT- Equity Market Opportunity Fund - 228,762 228,762 0.37 - 622,762 622,762 1.00 6 Banks, NBFCs, DFIs, Takaful, Pension Funds 3,800,054 5,404,101 9,204,155 14.82 Modarabas 190 - 190 0.00 Insurance Companies - 2,331,056 2,331,056 3.75 Other Companies,Corporate Bodies, Trust etc. 38,203 2,686,097 2,724,300 4.39 9 General Public Local 694,807 27,833,941 28,528,748 45.94 4,546,258 57,559,735 62,105,993 100.00
Shareholders More Than 5.00% The Crescent Textile Mills Limited 6,830,643 11.00 Islamic Development Bank (Non-Resident) 3,795,165 6.11 Bilquis Saleem 3,401,000 5.48 CDC - Trustee National Investment (Unit) Trust 3,377,789 5.44
215Annual Report 2014

NOTICE OF ANNUAL GENERAL MEETING
Notice is hereby given that the 30th Annual General Meeting of shareholders of Crescent Steel and Allied Products Limited (the “Company”) will be held on Thursday, 23 October 2014 at 12:00 noon at Qasr-e-Noor, 9 E-2 Main Boulevard, Gulberg-III, Lahore to transact the following Ordinary Business:
1. To receive, consider and adopt the Reports of Directors and Auditors together with Audited Annual Separate and Consolidated Financial Statements for the year ended 30 June 2014.
2. To approve the payment of final cash dividend @ Rs.1.50 per share (15%) and also the interim cash dividend @ Re. 1.00 per share (10%) already paid, making a total of Rs. 2.50 per share (25%) for the year ended 30 June 2014.
3. To appoint Company’s auditor for the financial year ending 30 June 2015 and to fix their remuneration.
Lahore: 1 October 2014 BY ORDER OF THE BOARD Muhammad Saad Thaniana Company Secretary
Notes1. The Share Transfer Books of the Company will remain closed from 17 October 2014 to 23 October 2014 (both
days inclusive). Transfers received in order at Share Registrar Office of the Company, CorpTec Associates (Pvt) Limited, 503-E, Johar Town, Lahore by the close of business on 16 October 2014, will be treated in time for the entitlement of dividend to the transferees and to attend the meeting.
2. A member entitled to attend and vote at this meeting may appoint any other member as his/her proxy to attend and vote instead of him/her. A Proxy must be a member of the Company.
3. The instrument appointing a proxy and the power of attorney or other authority under which it is signed or a notarially attested copy of the power of attorney must be deposited at the Registered Office of the Company at least 48 hours before the time of the meeting.
4. Members who have deposited their shares into Central Depository Company of Pakistan Limited (“CDC”) will further have to follow the under mentioned guidelines as laid down by the Securities and Exchange Commission of Pakistan.
A. For Attending the Meeting
a. In case of Individuals, the account holder and/or sub-account holder and their registration details are uploaded as per the CDC Regulations, shall authenticate his/her identity by showing his/her original CNIC or, original Passport at the time of attending the Meeting.
b. In case of corporate entity, the Board’s resolution/power of attorney with specimen signature of the nominee shall be produced (unless it has been provided earlier) at the time of the Meeting.
B. For Appointing Proxies
a. In case of individuals, the account holder and/or sub-account holder and their registration details are uploaded as per the CDC Regulations, shall submit the proxy form as per above requirements.
b. The proxy form shall be witnessed by two persons, whose names, addresses and CNIC numbers shall be mentioned on the form.
216 Crescent Steel and Allied Products Limited

c. Attested copies of the CNIC or the passport of beneficial owners and the proxy shall be furnished with the proxy form.
d. The proxy shall produce his original CNIC or original passport at the time of the Meeting.
e. In case of corporate entity, the Board’s resolution/power of attorney with specimen signature shall be furnished (unless it has been provided earlier) along with proxy form to the Company.
5. Notice to Shareholders who have not provided CNIC:
The Company has made several requests through advertisements in Urdu and English newspapers having circulation throughout the country and Independent Share Registrar of the Company has also sent letters through Registered Post to the shareholders who have not yet provided valid copies of their Computerized National Identity Card (CNIC), requesting them to provide their CNIC’s. The directive of the Securities and Exchange Commission of Pakistan contained in S.R.O. 831(I)/2012 dated 5 July 2012 requires that the dividend warrants should bear the Computerized National Identity Card Numbers (CNIC) of the registered shareholders or the authorized person except in the case of minor(s) and corporate shareholders.
CNIC number of the shareholders is, therefore, mandatory for the issuance of future dividend warrants and in the absence of such information, payment of dividend may be withheld in term of SECP’s above mentioned directive. Therefore, the shareholders who have not yet provided their CNICs are once again advised to provide the attested copies of their CNICs directly to our Independent Share Registrar at the address given herein above without any further delay.
6. Mandate for E-DIVIDENDS for shareholders
In order to make process of payment of cash dividend more efficient, e-dividend mechanism has been envisaged where shareholders can get amount of dividend credited into their respective bank accounts electronically without any delay. In this way, dividends may be instantly credited to respective bank accounts and there are no chances of dividend warrants getting lost in the post, undelivered or delivered to the wrong address, etc. The Securities and Exchange Commission of Pakistan (SECP) through Notice No. 8(4) SM/CDC 2008 dated 5 April 2013 has advised all Listed Companies to adopt e-dividend mechanism due to the benefits it entails for shareholders. In view of the above, you are hereby encouraged to provide a dividend mandate in favour of e-dividend by providing dividend mandate form duly filled in and signed.
7. Deduction of Income Tax from Dividend at Revised Rates
Pursuant to the provisions of Finance Act, 2014 effective 1 July 2014, deduction of income tax from dividend payments shall be made on the basis of filers and non-filers as follows:
S.No Nature of Shareholders Rate of deduction
1 Filers of Income Tax Return 10% 2 Non- Filers of Income Tax Return 15% Income Tax will be deducted on the basis of Active Tax Payers List posted on the Federal Board of Revenue
website. Members seeking exemption from deduction of income tax or are eligible for deduction at a reduced rate are
requested to submit a valid tax certificate or necessary documentary evidence, as the case may be.
8. Placement of Financial Statements
The Company has placed the Audited Annual Separate and Consolidated Financial Statements for the year ended 30 June 2014 along with Auditors and Directors Reports thereon on its website: www.crescent.com.pk
217Annual Report 2014

AFS Available For SaleAPI American Petroleum InstituteAPTMA All Pakistan Textile Mills AssociationBoard Board of DirectorsBMR Balancing, Modernization and ReplacementBSC Balanced ScorecardBU Business UnitCCP Crescent Cotton ProductsCDC Central Depository Company of PakistanCEO Chief Executive OfficerCFO Chief Financial OfficerCIO Chief Information OfficerCOLA Cost of Living AllowanceCSAPL Crescent Steel and Allied Products LimitedCSCL CS Capital (Private) LimitedCSR Corporate Social ResponsibilityDia DiameterDRP Disaster Recovery PlanEBIT Earnings before Interest and TaxationEBITDA Earnings before Interest, Taxation Depreciation and AmortizationEDB Engineering Development Board of PakistanEIA Energy Information AdministrationEOBI Employees’ Old Age Benefit InstituteEPS Earning Per ShareE&P Exploration and ProductionERP Enterprise Resource PlanningERS Expeditious Refund SystemFBR Federal Board of RevenueFDI Foreign Direct InvestmentGoP Government of PakistanHFT Held for TradingHR & R Human Resource and RemunerationHR Coil Hot Rolled CoilHR Human ResourceHSE Health, Safety and EnvironmentHTM Held to MaturityIAS International Accounting StandardsICAP Institute of Chartered Accountants of PakistanICMAP Institute of Cost and Management Accountants of PakistanIFRIC International Financial Reporting Interpretation CommitteeIFRS International Financial Reporting StandardsIID Investment and Infrastructure DevelopmentIP Pipeline Project Iran Pakistan Pipeline ProjectISO International Organization for StandardsIT Information TechnologyKG Kilo GramKIBOR Karachi Interbank Offer RateKSE Karachi Stock ExchangeLbs PoundsLC Letter of CreditLED Light Emitting DiodeLNG Liquefied Natural GasLRQA Lloyd`s Register Quality AssuranceLSM Large Scale ManufacturingMT Management TraineeMSCI Morgan Stanley Capital InternationalNBV Net Book ValueNRV Net Realisable ValueOHSAS Occupational Health and Safety Advisory ServicesOPS Ounce Per SpindleOSH&E Occupational Safety, Health and EnvironmentPEPCO Pakistan Electric Power CompanyPICG Pakistan Institute of Corporate GovernancePNAC Pakistan National Accreditation CouncilPSDP Public Sector Development ProgrammeSECP Securities and Exchange Commission of PakistanSEL Shakarganj Energy (Private) LimitedSMEDA Small and Medium Enterprise Development AuthoritySML Shakarganj Mills LimitedSP Spiral MachineTCF The Citizens FoundationTFC Term Finance CertificateTHF The Health FoundationUSDA United States Department of AgrictultureWPPF Workers’ Profit Participation FundWWF Workers’ Welfare Fund
GLOSSARY / LIST OF ABBREVIATIONS
218 Crescent Steel and Allied Products Limited

I/We _____________________________________________________, being member(s) of Crescent Steel and Allied
Products Limited and holder of ________________ Shares as per Folio No.______CDC Participation ID # __________
and Sub Account # _________/CDC Investor Account ID #______________do hereby appoint ______________________
______________ of _____________________________________ or failing him/her _____________________________
of _____________________________ having Folio No.______CDC Participation ID # __________ and Sub Account #
_________/CDC Investor Account ID #______________as my/our proxy to attend, speak and vote for me/us and on
my/our behalf at the Annual General Meeting of Crescent Steel and Allied Products Limited scheduled to be held
on Thursday, 23 October 2014 at 12:00 noon, at Qasr-e-Noor, 9-E-2, Main Boulevard, Gulberg-III, Lahore. and at any
adjournment thereof.
At witness my/our hand this day of 2014.
1. Name
N.I.C
Address
2. Name
N.I.C
Address
Note:
1. A member entitled to attend and vote at a General Meeting is entitled to appoint a proxy.
2. The instrument appointing a Proxy, together with the Power of Attorney, if any, under which it is signed or a notarially certified copy thereof, should be deposited at our Share Registrar Office of the Company, CorpTec Associates (Pvt) Limited, 503-E, Johar Town, Lahore, not less than 48 hours before the time of holding the Meeting.
3. CDC account holders will further have to follow the under mentioned guidelines as laid down in circular# 1 dated January 26, 2000 of the Securities & Exchange Commission of Pakistan for appointing Proxies:
i) In case of individuals, the account holder or sub-account holder whose securities and their registration details are uploaded as per the Regulations, shall submit the proxy form as per the above requirement.
ii) The proxy form shall be witnessed by two persons whose names, addresses and CNIC numbers shall be mentioned on the form.
iii) Attested copies of CNIC or the passport of the beneficial owners and the proxy shall be furnished with the proxy form.
iv) The proxy shall produce his original CNIC or original passport at the time of the meeting.
v) In case of a corporate entity, the Board of Directors’ resolution/Power of attorney with specimen signatures of the proxy holder shall be submitted (unless it has been provided earlier) alongwith proxy form to the Company.
Please affix here Revenue Stamp
Rs. 5/-
Members’ Signature
FORM OF PROXY30th Annual General Meeting


ELECTRONIC TRANSMISSION OF ANNUAL REPORT AND NOTICE OF AGM
Our environmental strategy is centered around the reduction of our carbon footprint. To do this, we strive to reduce the materials that we use and to reuse and recycle as far as possible. Last year, we planted over 4,400 trees and as you all may have noticed the financial statements of our annual report were printed on recycled paper. Our policy of environmental conservation, advocacy for our planet and, reducing, reusing and recycling helped us reduce our car-bon footprint by 26 tons of carbon annually - equivalent to emissions from burning over 3,400 gallons of fuel.
This year the Securities and Exchange Commission of Pakistan is championing the cause of environmental conser-vation by encouraging Corporates to review their distribution of Annual and Periodic Accounts by allowing electronic transmission of these to shareholders subject to their consent.
We have assessed the impact of this provision - not only will this initiative help Corporates to create greater value for shareholders by reducing costs, it will also help reduce Pakistan’s carbon footprint with only a small effort. Estimates suggest that every 500 e-copies will help save 29 trees and reduce carbon emissions by 170 kg annually.Please help us by signing up for an e-copy and saving a tree.
Fill out the enclosed consent form, and send it to the below mentioned mailing/email address, and let us know you CARE!”
Share Registrar OfficeM/s CorpTec Associates (Private) Limited503-E Johar Town, [email protected]
Principal OfficeCrescent Steel and Allied Products Limited9th Floor, Sidco Avenue Centre, 264 R.A. Lines, [email protected]


CONSENT FORM FOR ELECTRONIC TRANSMISSION OF ANNUAL REPORT AND NOTICE OF AGMM/s Corptec Associates (Private) Limited503-E Johar Town, LahoreEmail: [email protected]
Subject: CONSENT FORM FOR ELECTRONIC TRANSMISSION OF ANNUAL REPORT AND NOTICE OF AGM
Dear Sirs,
I/we, being the shareholder(s) of Crescent Steel and Allied Products Limited (“Company”), do hereby consent and authorize the Company for electronic transmission of the Annual Audited Financial Statements of the Company along with Notice of Annual General Meeting via the Email provided herein below and further undertake to promptly notify the Company of any change in my Email address.
I understand that the transmission of Annual Audited Financial Statements of the Company along with Notice of Annual General Meeting via the Email shall meet the requirements as mentioned under Section 50, 158 and 233 of the Companies Ordinance, 1984.
1. Name of Shareholder(s):
2. Fathers / Husband Name:
3. CNIC:
4. NTN:
5. Participant ID / Folio No:
6. E-mail address:
7. Telephone:
8. Mailing address:
Signature: (In case of corporate shareholders,Date: the authorized signatory must sign)


