cover sheet sec form 17-a sec registration number … 17-a-2015.pdf · cover sheet for sec form...
TRANSCRIPT
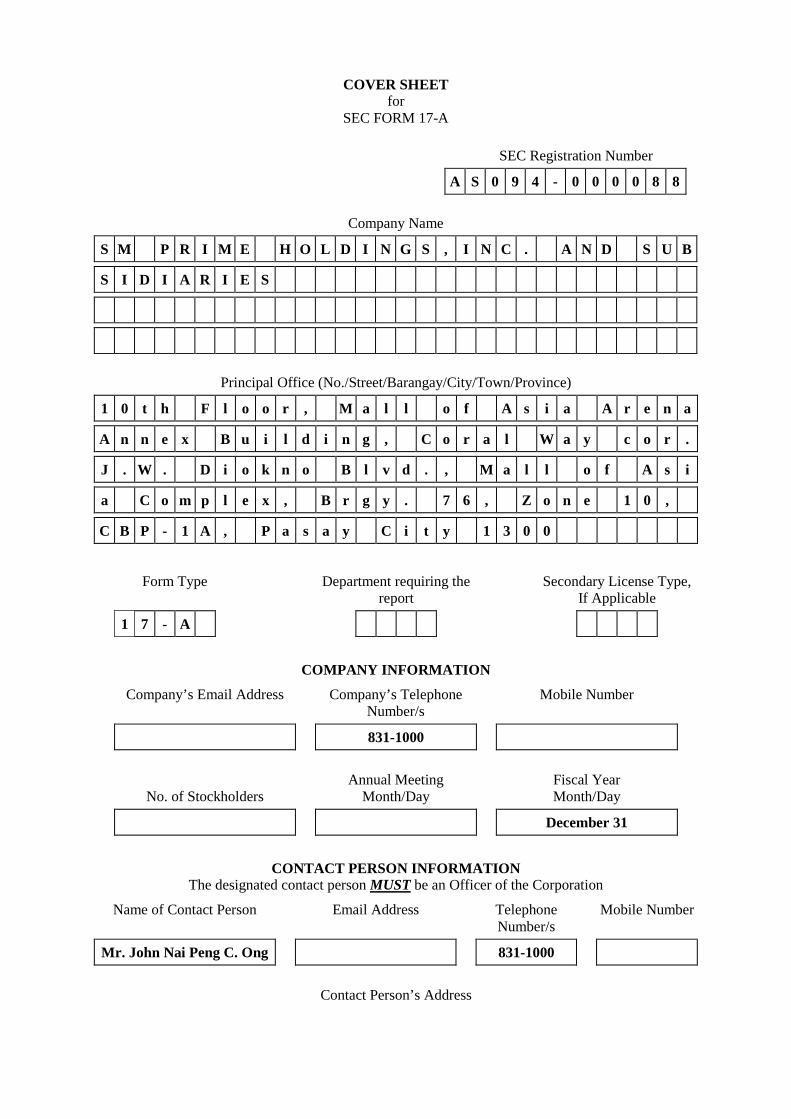
COVER SHEET for
SEC FORM 17-A
SEC Registration Number
A S 0 9 4 - 0 0 0 0 8 8
Company Name
S M P R I M E H O L D I N G S , I N C . A N D S U B
S I D I A R I E S
Principal Office (No./Street/Barangay/City/Town/Province)
1 0 t h F l o o r , M a l l o f A s i a A r e n a
A n n e x B u i l d i n g , C o r a l W a y c o r .
J . W . D i o k n o B l v d . , M a l l o f A s i
a C o m p l e x , B r g y . 7 6 , Z o n e 1 0 ,
C B P - 1 A , P a s a y C i t y 1 3 0 0
Form Type Department requiring the report
Secondary License Type, If Applicable
1 7 - A
COMPANY INFORMATION
Company’s Email Address Company’s Telephone Number/s
Mobile Number
831-1000
No. of Stockholders
Annual Meeting Month/Day
Fiscal Year Month/Day
December 31
CONTACT PERSON INFORMATION The designated contact person MUST be an Officer of the Corporation
Name of Contact Person Email Address Telephone Number/s
Mobile Number
Mr. John Nai Peng C. Ong 831-1000
Contact Person’s Address

Note: In case of death, resignation or cessation of office of the officer designated as contact
person, such incident shall be reported to the Commission within thirty (30) calendar days from the occurrence thereof with information and complete contact details of the new contact person
designated.
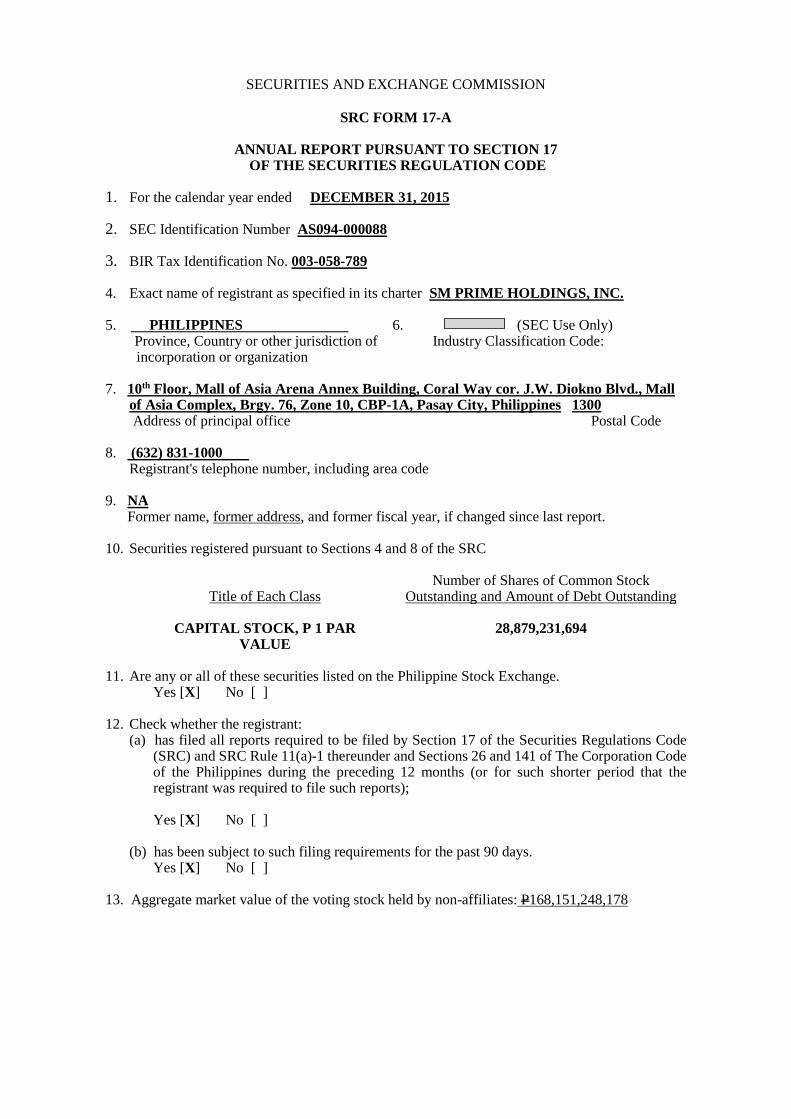
SECURITIES AND EXCHANGE COMMISSION
SRC FORM 17-A
ANNUAL REPORT PURSUANT TO SECTION 17 OF THE SECURITIES REGULATION CODE
1. For the calendar year ended DECEMBER 31, 2015 2. SEC Identification Number AS094-000088 3. BIR Tax Identification No. 003-058-789 4. Exact name of registrant as specified in its charter SM PRIME HOLDINGS, INC. 5. PHILIPPINES 6. (SEC Use Only) Province, Country or other jurisdiction of
incorporation or organization Industry Classification Code:
7. 10th Floor, Mall of Asia Arena Annex Building, Coral Way cor. J.W. Diokno Blvd., Mall
of Asia Complex, Brgy. 76, Zone 10, CBP-1A, Pasay City, Philippines 1300 Address of principal office Postal Code 8. (632) 831-1000 Registrant's telephone number, including area code 9. NA Former name, former address, and former fiscal year, if changed since last report. 10. Securities registered pursuant to Sections 4 and 8 of the SRC
Title of Each Class
Number of Shares of Common Stock Outstanding and Amount of Debt Outstanding
CAPITAL STOCK, P 1 PAR
VALUE
28,879,231,694
11. Are any or all of these securities listed on the Philippine Stock Exchange. Yes [X] No [ ] 12. Check whether the registrant: (a) has filed all reports required to be filed by Section 17 of the Securities Regulations Code
(SRC) and SRC Rule 11(a)-1 thereunder and Sections 26 and 141 of The Corporation Code of the Philippines during the preceding 12 months (or for such shorter period that the registrant was required to file such reports);
Yes [X] No [ ] (b) has been subject to such filing requirements for the past 90 days. Yes [X] No [ ] 13. Aggregate market value of the voting stock held by non-affiliates: P168,151,248,178
TABLE OF CONTENTS Page No. PART I - BUSINESS AND GENERAL INFORMATION Item 1. Business 1 Item 2. Properties 5 Item 3. Legal Proceedings 27 Item 4. Submission of Matters to a Vote of Security Holders 27 PART II - OPERATIONAL AND FINANCIAL INFORMATION Item 5. Market for Registrant’s Common Equity and Related Stockholder Matters 28 Item 6. Management’s Discussion and Analysis or Plan of Operation 30 Item 7. Financial Statements 46 Item 8. Information on Independent Accountant and Other Related Matters 46 PART III - CONTROL AND COMPENSATION INFORMATION Item 9. Directors and Executive Officers of the Registrant 47 Item 10. Executive Compensation 54 Item 11. Security Ownership of Certain Beneficial Owners and Management 55 Item 12. Certain Relationships and Related Transactions 56 PART IV – CORPORATE GOVERNANCE Item 13. Corporate Governance 56 PART V - EXHIBITS AND SCHEDULES Item 14. a. Exhibits 56 b. Reports on SRC Form 17-C (Current Report) 56 INDEX TO EXHIBITS 57 INDEX TO FINANCIAL STATEMENTS AND SUPPLEMENTARY SCHEDULES 58 ANNUAL CORPORATE GOVERNANCE REPORT 172 SIGNATURES 221

1
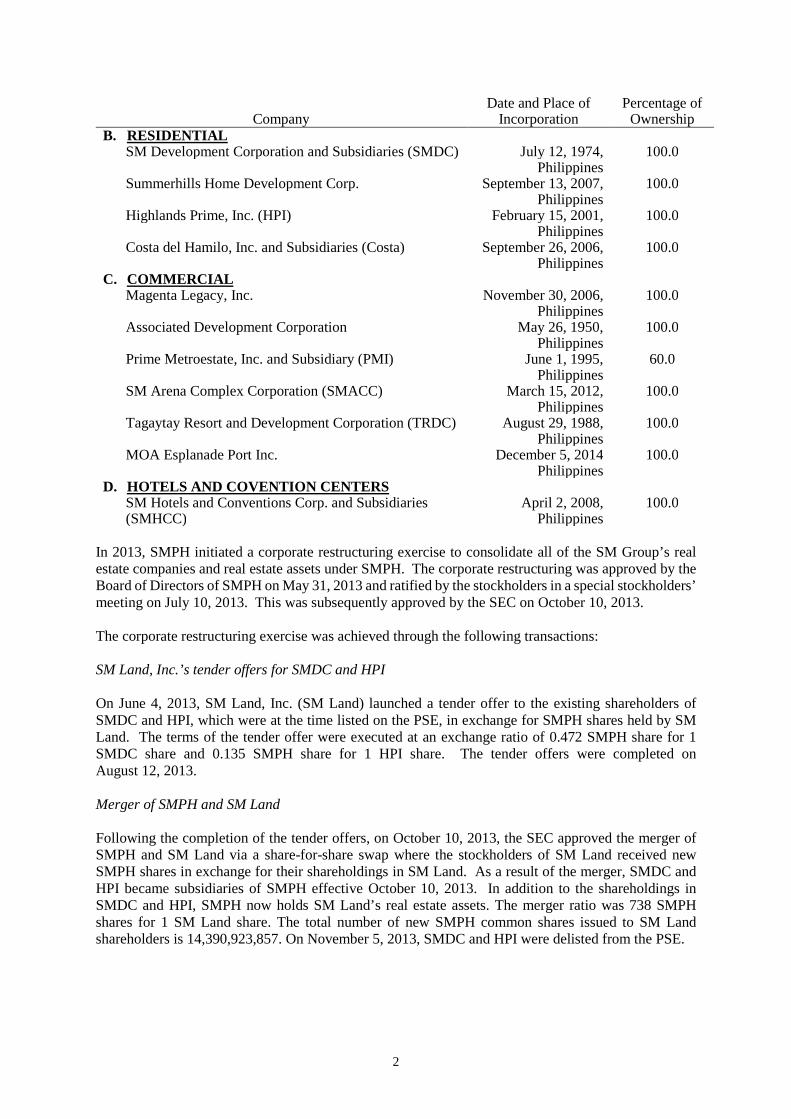
PART I - BUSINESS AND GENERAL INFORMATION ITEM 1. Business Business Development and Principal Products or Services SM Prime Holdings, Inc. (“SMPH” or “the Parent Company”) was incorporated in the Philippines and registered with the Securities and Exchange Commission (SEC) on January 6, 1994. SMPH and its subsidiaries (collectively known as “the Company” or “SM Prime”) are incorporated to acquire by purchase, exchange, assignment, gift or otherwise, and to own, use, improve, subdivide, operate, enjoy, sell, assign, transfer, exchange, lease, let, develop, mortgage, pledge, traffic, deal in and hold for investment or otherwise, including but not limited to real estate and the right to receive, collect and dispose of, any and all rentals, dividends, interest and income derived therefrom; the right to vote on any proprietary or other interest on any shares of stock, and upon any bonds, debentures, or other securities; and the right to develop, conduct, operate and maintain modernized commercial shopping centers and all the businesses appurtenant thereto, such as but not limited to the conduct, operation and maintenance of shopping center spaces for rent, amusement centers, movie or cinema theatres within the compound or premises of the shopping centers, to construct, erect, manage and administer buildings such as condominium, apartments, hotels, restaurants, stores or other structures for mixed use purposes. Its registered office and principal place of business of SMPH is 10th Floor Mall of Asia Arena Annex Building, Coral Way cor. J.W. Diokno Blvd., Mall of Asia Complex, Brgy. 76, Zone 10, CBP-1A, Pasay City 1300. SMPH’s shares of stock are publicly traded in the Philippine Stock Exchange (PSE). SM Investments Corporation (SMIC), the ultimate parent company, is a Philippine corporation which listed its common shares with the PSE in 2005. SMIC and all its subsidiaries are herein referred to as the “SM Group”. The subsidiaries of the Parent Company follow:
Company
Date and Place of Incorporation
Percentage of Ownership
A. MALLS First Asia Realty Development Corporation (FARDC) September 7, 1987,
Philippines 74.2
Premier Central, Inc. March 16, 1998, Philippines
100.0
Consolidated Prime Dev. Corp. March 25, 1998, Philippines
100.0
Premier Southern Corp. April 7, 1998, Philippines
100.0
San Lazaro Holdings Corporation March 7, 2001, Philippines
100.0
Southernpoint Properties Corp. June 10, 2008, Philippines
100.0
First Leisure Ventures Group, Inc. (FLVGI) March 28, 2007, Philippines
50.0
CHAS Realty and Development Corporation and Subsidiaries
October 17, 1997, Philippines
100.0
Affluent Capital Enterprises Limited and Subsidiaries March 20, 2006, British Virgin Islands
100.0
Mega Make Enterprises Limited and Subsidiaries July 6, 2007, British Virgin Islands
100.0
Springfield Global Enterprises Limited September 6, 2007, British Virgin Islands
100.0
Simply Prestige Limited and Subsidiaries April 23, 2013, British Virgin Islands
100.0
SM Land (China) Limited and Subsidiaries August 9, 2006, Hong Kong
100.0
2
Company
Date and Place of Incorporation
Percentage of Ownership
B. RESIDENTIAL SM Development Corporation and Subsidiaries (SMDC) July 12, 1974,
Philippines 100.0
Summerhills Home Development Corp. September 13, 2007, Philippines
100.0
Highlands Prime, Inc. (HPI) February 15, 2001, Philippines
100.0
Costa del Hamilo, Inc. and Subsidiaries (Costa) September 26, 2006, Philippines
100.0
C. COMMERCIAL Magenta Legacy, Inc. November 30, 2006,
Philippines 100.0
Associated Development Corporation May 26, 1950, Philippines
100.0
Prime Metroestate, Inc. and Subsidiary (PMI) June 1, 1995, Philippines
60.0
SM Arena Complex Corporation (SMACC) March 15, 2012, Philippines
100.0
Tagaytay Resort and Development Corporation (TRDC) August 29, 1988, Philippines
100.0
MOA Esplanade Port Inc. December 5, 2014 Philippines
100.0
D. HOTELS AND COVENTION CENTERS SM Hotels and Conventions Corp. and Subsidiaries (SMHCC)
April 2, 2008, Philippines
100.0
In 2013, SMPH initiated a corporate restructuring exercise to consolidate all of the SM Group’s real estate companies and real estate assets under SMPH. The corporate restructuring was approved by the Board of Directors of SMPH on May 31, 2013 and ratified by the stockholders in a special stockholders’ meeting on July 10, 2013. This was subsequently approved by the SEC on October 10, 2013. The corporate restructuring exercise was achieved through the following transactions: SM Land, Inc.’s tender offers for SMDC and HPI On June 4, 2013, SM Land, Inc. (SM Land) launched a tender offer to the existing shareholders of SMDC and HPI, which were at the time listed on the PSE, in exchange for SMPH shares held by SM Land. The terms of the tender offer were executed at an exchange ratio of 0.472 SMPH share for 1 SMDC share and 0.135 SMPH share for 1 HPI share. The tender offers were completed on August 12, 2013. Merger of SMPH and SM Land Following the completion of the tender offers, on October 10, 2013, the SEC approved the merger of SMPH and SM Land via a share-for-share swap where the stockholders of SM Land received new SMPH shares in exchange for their shareholdings in SM Land. As a result of the merger, SMDC and HPI became subsidiaries of SMPH effective October 10, 2013. In addition to the shareholdings in SMDC and HPI, SMPH now holds SM Land’s real estate assets. The merger ratio was 738 SMPH shares for 1 SM Land share. The total number of new SMPH common shares issued to SM Land shareholders is 14,390,923,857. On November 5, 2013, SMDC and HPI were delisted from the PSE.

3
Acquisition of Unlisted Real Estate Companies and Real Estate Assets from SMIC and the Sy Family On October 10, 2013, the SEC also approved SMPH’s acquisition of SMIC’s unlisted real estate companies, including SMHCC, SMACC, Costa, PMI and TRDC (collectively, the “Unlisted Real Estate Companies”). The SEC likewise approved SMPH’s acquisition of real property assets of SMIC (the “SMIC Real Estate Assets”) by issuing new SMPH shares to SMIC. The total acquisition price of the Unlisted Real Estate Companies and SMIC Real Estate Assets amounted to P=25.8 billion, equivalent to 1,382,841,458 SMPH common shares issued based on the 30-day volume weighted average price of SMPH’s shares of P=18.66.
The Company has four business units (or segments), namely, malls, residential, commercial and hotels and convention centers. The contribution of each of the business units as of and for the year ended 2015 are as follows:
Malls Residential Commercial
Hotels and Convention
Centers Eliminations Consolidated
Balances
Revenue: (In Thousands)
External customers P=42,705,269 P=22,931,237 P=3,434,135 P=2,440,646 P=– P=71,511,287 Inter-segment 27,503 − 71,865 5,691 (105,059) − P=42,732,772 P=22,931,237 P=3,506,000 P=2,446,337 (P=105,059) P=71,511,287
Segment results: Income before income tax P=20,380,936 P=5,688,535 P=1,703,004 P=534,543 P=6,603,821 P=34,910,839 Provision for income tax (4,863,565) (623,693) (365,641) (165,347) – (6,018,246) Net income P=15,517,371 P=5,064,842 P=1,337,363 P=369,196 P=6,603,821 P=28,892,593
Net income attributable to: Equity holders of the Parent P=14,978,854 P=5,064,842 P=1,285,379 P=369,196 P=6,603,821 P=28,302,092 Non-controlling interests 538,517 – 51,984 – – 590,501
Segment assets P=283,013,015 P=108,811,859 P=31,284,878 P=10,804,808 (P=86,121) P=433,828,439
Segment liabilities P=160,242,498 P=54,148,046 P=3,038,706 P=642,463 (P=86,121) P=217,985,592
Other information: Capital expenditures P=35,916,735 P=19,522,186 P=1,052,206 P=2,845,821 P=– P=59,336,948 Depreciation and amortization 5,781,043 296,636 549,443 339,830 – 6,966,952
Further details relating to business segment data are disclosed in Note 4 of the attached consolidated financial statements. As of December 31, 2015, the Company had a market capitalization of P=626.68 billion. For the year 2016, the Company expects to incur at least P60 billion for its capital expenditures in the Philippines and in China. Risks SM Prime follows an 8-step Risk Management Approach, which starts from the identification and prioritization of risks, to the assessment of risk interrelationship and analysis of the sources of risks, then to the development of risk management strategies and action plans, and ultimately, to the monitoring and continuous improvement of the risk management process. The Executive Committee provides oversight on the assessment of the impact of risks on the strategic and long-term goals of the Company. The business unit heads are responsible for managing operational risks by implementing internal controls within their respective units. On a quarterly basis, the Audit and Risk Management Committee is updated on status of risk management and improvement plans of the Company.

4
In 2015, SM Prime successfully completed the implementation and ISO-certification of Business Continuity Management System for its Malls Business Unit, specifically in SM Megamall and Mall of Asia Arena Annex Building. The Company plans to roll out the same system across all malls in the next two years. This further enhances the malls’ existing processes to address business continuity risks and facilitates alignment with international standards and leading practices. As part of its overall business continuity strategy, SM Prime invests in disaster-resiliency of its company assets and maintains a comprehensive property insurance program to reduce impact of damages to its properties. SM Prime prioritizes safety and security in all its properties and requires all its Business Units to have Emergency Response Procedures in place. The safety and security system implemented in its properties is audited annually by third parties. This gives the Company assurance that risks and impact related thereto are minimized, and necessary improvements in the system are identified and addressed. In terms of information security, SM Prime regularly implements systems vulnerability assessment to proactively detect and address threats and vulnerabilities. In 2015, the Company also initiated the improvement of its security incident and events management by automating the process. The consolidation of the SM Group’s property companies and real estate assets under SM Prime in 2013 provided an opportunity for sharing best practices across different business units to improve processes and controls effectiveness and efficiency. In line with this, the Company continues to implement enterprise-wide alignment of key business processes and internal controls. The Company’s governance, risk management, and control systems are subject to the independent, objective, reasonable, systematic and disciplined evaluation by its Internal Audit function. To maintain its independence, Internal Audit reports functionally to the Board of Directors, through the Audit and Risk Management Committee, and administratively to the President. As such, the appointment and removal of the Internal Auditor requires the approval of the Audit and Risk Management Committee, as provided in the committee’s Charter. The Company also engages the services of an external auditor to perform an independent audit and provide an objective assurance on the fairness and presentation of the Company’s financial statements. As required by the Revised Manual on Corporate Governance, the external auditor or the handling partner should be rotated every five (5) years or earlier, and any non-audit work should not be in conflict with the functions of the external auditor. Considering this and other relevant matters, the Audit and Risk Management Committee has the responsibility to make a well-informed recommendation regarding the appointment, re-appointment or removal of the external auditor. Competition The Parent Company and its subsidiaries compete with other companies in the industry segments in which they operate. The Company believes that each of its subsidiaries has strong competitive advantages over the other industry players. In addition, the strong synergy created by the complimenting businesses of the individual subsidiaries has further reinforced each subsidiary’s preparedness to face stiff competition in the coming years. Suppliers The Company has a broad range of suppliers, both local and foreign. Customers/Clients The Company is not dependent on a single or a few customer/client base. It has a broad base of local and foreign, and corporate and individual customers/clients. Intellectual Property SM Prime has intellectual property rights on the use of various trademark and names for each of its commercial and residential development projects. The “SM” name is owned by SMIC, and is registered

5
with the Philippine Intellectual Property Office (IPO). SM Prime owns the trademark “SM Prime” which registration is set to expire in 2020. SMDC owns the trademark “SM Development”, which registration will expire in 2021. Most of SM Prime’s projects have been issued a Certificate of Registration by the IPO. SM Prime believes that its trademark and the names of its development projects play a significant role in its effort to create brand recall and strengthen its position in the industry. Transactions With and/or Dependence on Related Parties As of December 31, 2015, the Company is 49.60% and 25.71% directly-owned by SMIC and the Sy Family, respectively. Further details relating to transactions with related parties are disclosed in Note 21 of the attached consolidated financial statements. Governmental regulations and environmental laws The Company has always been committed towards sustainable and responsible business practices in all stages of its operations, and even before periods of construction and development. The Company constructs and develops real estate properties while consciously minimizing environmental impact and preserving natural resources. Simultaneously with its daily operations, the Company meticulously measures and manages resource consumption patterns in consideration of the communities where the Company operates. These core operational sustainability efforts center on energy efficiency, water resource management, air quality and solid waste management. Furthermore, SM Prime hosts a portfolio of activities and programs to spread awareness on various socio-environmental concerns and celebrate numerous cultural celebrations around the country throughout the year. In line with these efforts, the Company operates beyond the levels of regulatory compliance, ensures that it meets all governmental, environmental, health and safety requirements and aligns shared value initiative and efficiency efforts with international standards. The Company also guarantees that all required government approvals are obtained and keeps abreast of the latest developments in regulations concerning the real estate industry. The Company incurs costs that are standard in compliance with environmental laws. Employees As of December 31, 2015, SM Prime has 1,843 regular employees and the Parent Company had 302 direct employees. Headcount approximately increases by an average rate of 7% annually. The employees are not subject to a collective bargaining agreement. SM Prime’s malls business unit is supported by 6,997 officers and employees of the management companies. The management companies manage and operate the malls, including the provision of manpower, maintenance and engineering and security and promotional activities. ITEM 2. Properties A. MALLS SM Prime operates and maintains modern commercial shopping malls and is involved in all related businesses, such as the operation and maintenance of shopping spaces for rent, amusement centers and cinema theaters within the compound of the shopping malls. Its main sources of revenues include rental income from leases in mall and food court, cinema ticket sales and amusement income from bowling and ice skating. As of December 31, 2015, the malls business unit has fifty six malls in the Philippines with 7.3 million square meters (sq. m.) of gross floor area (GFA) and six shopping malls in China with 0.9 million sq. m. of GFA.

6
In 2015, SM Prime’s mall business unit opened five malls and two expansions in the Philippines and one mall in China, namely, SM Megacenter Cabanatuan, SM San Mateo in Rizal, SM Cabanatuan, SM Center Sangandaan in Caloocan, SM Seaside City Cebu, SM City Lipa, SM City Iloilo and SM Zibo in China. The new malls and expansion added 1.0 million sq. m. to SM Prime’s total GFA. Metro Manila Malls SM City North EDSA Year opened – 1985. SM City North EDSA, the very first and currently the country’s largest shopping mall, has a GFA of 497,912 sq. m. featuring 12 cinemas including a 3D IMAX theater with a total seating capacity of 9,343, 24-computerized synthetic lane bowling center, food court, amusement centers and multi-level carpark which provides a total capacity of 4,349 vehicles, located on a 16.1 hectare site in Diliman, Quezon City. Following the opening of The Block and renovation of The Annex, The Sky Garden was unveiled in May 2009. It is a 400-meter elevated walkway shaded by a long sketch of white canopy connecting building to another, with a park-like ambiance and green architecture. The Sky Garden includes the roof garden, water features, food and retail outlets and sky dome, a 1,000-seat amphitheater for shows and special events. The anchor tenants for SM City North EDSA are The SM Store, SM Hypermarket and SM Supermarket, Ace Hardware, and Uniqlo. SM Megamall Year opened – 1991. SM Megamall is located on a 10.5 hectare property in the Ortigas business district of Metro Manila. It stands along the main EDSA thoroughfare and is near the Metro Rail Transit. SM Megamall has two main buildings, Mega A and Mega B, with the addition of Mega Atrium in 2008, Building C in 2011 and Mega Fashion Hall in January 2014. It has a total GFA of 474,225 sq. m. It features 14 cinemas including the newly opened IMAX theatre and Director’s Club with its own butler service, a fully-computerized 14-lane bowling center, an Olympic-sized ice skating rink, a mega fashion hall, event center and parking for 2,976 vehicles. The anchor tenants for SM Megamall are The SM Store, SM Supermarket, Ace Hardware, Uniqlo and Toy Kingdom. SM Mall of Asia Year opened – 2006. SM Mall of Asia is located on a 19.5 hectare property overlooking Manila Bay. The mall consists of four buildings linked by elevated walkways—Main Mall, the North Parking Building, the South Parking Building, and the Entertainment Center Building. The mall has a GFA of 406,962 sq. m. with parking buildings that has 3,984 spaces each that are available for vehicles. The Entertainment Building houses the country’s first IMAX theatre, a special Director’s Club screening room for exclusive film showings, eight state-of-the art cinemas, 24-lane bowling facility, an Olympic-sized ice skating rink, an Exploreum and fine dining restaurants and bars. In 2014, the mall opened the XD 4D cinema that is equipped with 48 pneumatic controlled seats and in-theatre effects including snow, wind, water, smell, fog and strobe lightings, leg tickler, motion seats and seat vibrators. The anchor tenants for SM Mall of Asia are The SM Store, SM Hypermarket, Forever 21 and Uniqlo. SM Aura Premier Year opened – 2013. SM Aura Premier, opened in May 2013, is a state of the art civic center at the heart of Taguig City. The mall has a GFA of 251,094 sq. m. As an integrated development, SM Aura Premier incorporates office towers, a chapel, a convention center and mini-coliseum, supported by a retail podium with an upscale look and feel. The mall also has two regular cinemas, two Director’s Clubs and an IMAX Theater with a total seating capacity of 921 and a food court. The anchor tenants for SM Aura Premier are The SM Store, SM Supermarket, Forever 21 and Uniqlo. SM City Fairview Year opened – 1997. SM City Fairview is a two-building, four-level complex with a GFA of 188,681 sq. m. located on a 20.0 hectare site in Quezon City, Metro Manila. The mall features 12 cinemas with a seating capacity of 6,533, 20-lane bowling center, food court and amusement areas. In early 2009, the mall launched its annex, adding 28,600 sq. m. of GFA to the main mall. The anchor tenants for SM City

7
Fairview are The SM Store, SM Hypermarket, SM Supermarket, Ace Builders Center and Teleperformance. SM Southmall Year opened – 1995. SM Southmall, with a GFA of 184,552 sq. m., was the first shopping mall in the southern region of Metro Manila located Alabang-Zapote Road in Las Piñas City. As major renovations completed in 2012, SM Southmall became one of the premier malls and it features nine cinemas with a seating capacity of 7,049, including an IMAX theater, an ice skating rink, bowling center, food court and a carpark with 3,068 slots. The anchor tenants for SM Southmall are The SM Store, SM Supermarket, SM Appliance Center and Ace Hardware. SM City San Lazaro Year opened – 2005. SM City San Lazaro is located at the center of a densely populated residential area with bustling commercial activities in Sta. Cruz, Manila. The four-storey mall has a GFA of 181,593 sq. m. The mall features a food court, amusement center, six cinemas with a seating capacity of 3,274, and parking for 1,256 vehicles. The anchor tenants for SM City San Lazaro are The SM Store, SM Supermarket, SM Appliance Center and Ace Hardware. SM City Marikina Year opened – 2008. SM City Marikina on Marcos Highway, Brgy. Calumpang, Marikina City has a GFA of 178,178 sq. m. Marikina is a key city for the SM Group, as its shoemakers became vital partners during its growth years in the sixties as a shoe store in Carriedo, Manila. It features a food court and eight cinemas with a 3,136 seating capacity. The anchor tenants for SM City Marikina are The SM Store, SM Supermarket and Ace Hardware. SM City Manila Year opened – 2000. SM City Manila is a five-level mall with a GFA of 167,812 sq. m. The mall is located in downtown Manila next to Manila City Hall. The mall has 12 cinemas with a seating capacity of 7,555, a food court and a carpark available for 920 vehicles. It has become a major destination for shoppers, given its strategic location and easy accessibility by the Light Railway Transit and other public transportation. The anchor tenants for SM City Manila are The SM Store, SM Supermarket, SM Appliance Center and Ace Hardware. SM City Sta. Mesa Year opened – 1990. SM City Sta. Mesa, located in Quezon City, Metro Manila, is a seven level complex with a GFA of 132,965 sq. m. featuring 10 cinemas with a seating capacity of 7,451, a food court, an amusement center, carpark with a total capacity of 1,052 vehicles. The anchor tenants for SM City Sta. Mesa are The SM Store, SM Supermarket, SM Appliance Center and Ace Hardware. SM City BF Parañaque Year opened – 2013. SM City BF Parañaque, strategically located at the main gate of Parañaque’s prime residential village, opened on November 29, 2013 which has a GFA of 125,582 sq. m. Its design and construction features three skylight domes in its main atrium to reduce the use of electricity by fully maximizing the use of sunlight, while air conditioning is automatically regulated to help ensure efficient energy consumption. The mall is the first mall to have four Director’s Club cinemas equipped with electronic recliner (lazyboy type) seats that can accommodate up to 200 moviegoers and also houses two premier cinemas with 180 seats each. It provides ample parking space for 1,420 vehicles and 179 slots for motorcycles. The anchor tenants for SM City BF Parañaque are The SM Store, SM Supermarket, Ace Hardware and Uniqlo. SM City Bicutan Year opened – 2002. SM City Bicutan is a two-building mall located along Doña Soledad Ave. corner West Service Road, Bicutan, Parañaque City. This mall has a GFA of 114,214 sq. m. It features a food court and four cinemas with a total seating capacity of 1,352. SM City Bicutan serves nearly half a

8
million residents within a 3 kilometer radius. The anchor tenants for SM City Bicutan are The SM Store, SM Supermarket, Ace Hardware and SM Appliance Center. SM City Sucat Year opened – 2001. SM City Sucat is a two-building mall located on a 10.1 hectare site along Dr. A. Santos Ave. (Sucat Road), Brgy. San Dionisio, Parañaque City. The mall has a GFA of 96,277 sq. m. featuring four cinemas with total seating capacity of 1,955, a food court and carpark with 1,475 slots. The anchor tenants for SM City Sucat are The SM Store, SM Supermarket and Ace Hardware. SM Center Valenzuela Year opened – 2005. SM Center Valenzuela has a total GFA of 70,681 sq. m., situated in Brgy. Karuhatan, Valenzuela City. The mall caters to the bustling industrial areas that surround the property. The mall features four cinemas with a 2,172 seating capacity, 12-lane bowling center, a food court and parking for 557 vehicles. It also features the Fashion Avenue, a multi-shop style center that houses a wide array of apparel, shoes and accessory picks. The anchor tenants for SM Center Valenzuela are SM Supermarket, SM Appliance Center and Ace Hardware. SM City Novaliches Year opened – 2010. SM City Novaliches, having a GFA of 60,044 sq. m., is located along Quirino Highway in Brgy. San Bartolome, Novaliches, Quezon City. Novaliches, being the largest district in the city, is growing with residential subdivisions and industrial companies. The amenities of the mall include a food court, four cinemas with 1,610 seats and parking for almost 1,206 vehicles. The anchor tenants for SM City Novaliches are The SM Store, SM Supermarket, Banco de Oro and Ace Hardware. SM Center Muntinlupa Year opened – 2007. SM Center Muntinlupa is situated in Brgy. Putatan, Muntinlupa City. The two-level mall has a GFA of 57,060 sq. m. that caters the residents of Muntinlupa City and the growing municipality of San Pedro, Laguna. The mall features a food court, four cinemas with 1,582 seating capacity and an entertainment plaza for shows and events located at the center of the mall. The anchor tenants for SM Center Muntinlupa are SM Hypermarket, SM Appliance Center and Ace Hardware. SM Center Las Piñas Year opened – 2009. SM Center Las Piñas is located along the Alabang-Zapote Road in Brgy. Talon, Pamplona, Las Piñas City that has a GFA of 39,727 sq. m. SM Center Las Piñas serves customers in the western section of the city and the nearby provinces of Laguna and Cavite. The anchor tenants for SM Center Las Piñas are SM Hypermarket, Banco de Oro and Ace Hardware. SM Center Pasig Year opened – 2006. SM Center Pasig is located in Frontera Verde, Pasig City serving residents of the neighboring upscale subdivisions and customers who regularly pass through the C5 route. Its GFA is 28,829 sq. m. including its basement parking for almost 282 vehicles. The anchor tenants for SM Center Pasig are SM Hypermarket, Ace Hardware and Watsons. Cherry Foodarama Shaw Boulevard Year opened – 2015. Cherry Foodarama Shaw Boulevard, located in Old Wack-wack Road, Mandaluyong City, reopened last October 2015and now looking refreshed and a bit more modernized while still keeping the classic Cherry feel. It has a GFA of 24,165 sq. m. with parking for 344 vehicles. The anchor tenants for Cherry Foodarama Shaw Boulevard is SM Supermarket. Malls Outside of Metro Manila SM Seaside City Cebu Year opened – 2015. SM Seaside City Cebu, located within the SM Seaside Complex at the South Road Properties (SRP) in Cebu City, is the first of its kind in urban development in the SRP. It has a GFA of 429,971 featuring a Centerstage theater, a Large Screen cinema, two Director's Club cinemas, and 4

9
regular cinemas with a combined seating capacity of 1,527, a 16-lane SM Bowling and Amusement Center, and a food court flanking an olympic-size ice skating rink and parking slot for 4,525 vehicles. In addition, the mall features a rooftop Sky Park, an iconic 21 meter by 21 meter centerpiece called the "Cube", and food and retail shops, including local, national and global brands. The anchor tenants for SM Seaside City Cebu are The SM Store, SM Supermarket, Ace Hardware and Uniqlo. SM City Cebu Year opened – 1993. SM City Cebu is a multi-level complex with a GFA of 273,804 sq. m. featuring eight cinemas, including a 3D IMAX theater with a total seating capacity of 6,318, a food court, a fully computerized 28-lane bowling center, a trade hall and a carpark with a 1,874 vehicle capacity located on a 13.8 hectare site in Cebu Port Center, Barrio Mabolo, Cebu City. The anchor tenants for SM City Cebu are The SM Store, SM Supermarket, Ace Hardware and Forever 21. SM City Dasmariñas Year opened – 2004. SM City Dasmariñas sits on a 12.4 hectare property situated along Governor’s Drive, approximately 100 meters from the Aguinaldo Highway junction in Dasmariñas, Cavite. The mall has a GFA of 201,645 sq. m. The mall features a food court and six cinemas with a seating capacity of 2,710 people. In late 2011, the mall launched its annex, adding 36,486 sq. m. of GFA to the main mall. The anchor tenants for SM City Dasmariñas are The SM Store, SM Supermarket, SM Appliance Center and Ace Hardware. SM Cabanatuan Year opened – 2015. SM City Cabanatuan is strategically located along Maharlika Highway in Cabanatuan City, which is the largest city in Nueva Ecija. It has a GFA of 154,020 featuring a food court, six cinemas with a seating capacity of 1,977 and 2,077 parking slots The four-level mall also includes two Gardens namely, the Garden Park, which provides covered shelter; and the Roof Park located at the fourth level. The anchor tenants for SM City Dasmariñas are The SM Store, SM Supermarket, Ace Hardware and SM Appliance Center. SM Lanang Premier Year opened – 2012. SM Lanang Premier is a four-level mall with a GFA of 145,174 sq. m. The mall is located at J.P. Laurel Avenue, Brgy. Lanang, Davao City. It is the largest and first premier mall development project in Mindanao. It houses the SMX Davao Convention Center. SM Lanang Premier’s amenities include six cinemas and an IMAX theater, with a combined seating capacity of 2,695, a bowling center, an Exploreum, and parking for 1,660 vehicles. It also features a Skygarden with water fountains, art installations, and landscaping. The anchor tenants for SM Lanang Premier are The SM Store, SM Supermarket, Ace Hardware and Forever 21. SM City Clark Year opened – 2006. The two-storey SM City Clark is located along M.A. Roxas Avenue and is approximately 80 kilometers north of Manila and 60-kilometers east of Subic Bay Freeport, within close proximity of the Clark Special Economic Zone in Pampanga. The mall has a GFA of 144,484 sq. m. which features seven cinemas with a seating capacity of 3,210. With its unique design resembling a coliseum, this mall offers tourists and shoppers a variety of retail, dining, and entertainment establishments. The anchor tenants for SM City Clark are The SM Store, SM Hypermarket, Ace Hardware and Forever 21. SM City Iloilo Year opened – 1999. SM City Iloilo is a 143,595 sq. m. mall constructed on a 17.5 hectare property at the juncture of the Northwest and the Northeast of the Iloilo-Jaro West Diversion Road in Manduriao, Iloilo City. Its location is a quick drive from the airport and from the center of the city. It serves the city’s residents, as well as those of the rest of Panay Island and the neighboring islands in the Visayas. SM City Iloilo has eight cinemas with a seating capacity of 4,995. The anchor tenants for SM City Iloilo are The SM Store, SM Supermarket, Ace Hardware and SM Appliance Center.
10
SM City Lipa Year opened – 2006. SM City Lipa is a two-level mall strategically located along Lipa’s Ayala Highway. It occupies 10.3 hectares of land, with 141,283 sq. m. of GFA. In late 2014, an additional 34,437 sq. m. of GFA was added due to the expansion of the main mall. Lipa City features natural attractions and is a commercial, educational and industrial destination. The mall features a food court and four cinemas with 2,393 seating capacity. The anchor tenants for SM City Lipa are The SM Store, SM Supermarket and Ace Hardware. SM City Bacolod Year opened – 2007. SM City Bacolod is a two-building mall located along Rizal Street, Reclamation Area, Bacolod City in Negros Occidental. It has a total land area of 17.0 hectare and has a GFA of 137,229 sq. m. In late 2014, an additional 61,999 sq. m. of GFA was added due to the expansion of the north wing of the main mall. The mall features a food court, amusement centers and four cinemas with 2,001 seating capacity. The anchor tenants for SM City Bacolod are The SM Store, SM Supermarket and Ace Hardware. SM City General Santos Year opened – 2012. SM City General Santos is a three level mall located at San Miguel St., cor. Santiago Blvd., Lagao District, General Santos City. The mall has a GFA of 131,818 sq. m. featuring a food court, four cinemas with a combined seating capacity of 1,526, and parking for more than 1,407 vehicles. The anchor tenants for SM City General Santos are The SM Store, SM Supermarket and Ace Hardware. SM City Pampanga Year opened – 2000. SM City Pampanga is a 131,158 sq. m. shopping mall with three annexes, straddling the municipalities of San Fernando and Mexico in Pampanga. It features six state-of-the-art cinemas with a seating capacity of 2,603, a food court and amusement centers. The mall is strategically located at the Olongapo Gapan Road to serve the city’s residents as well as those in the provinces of Bulacan, Tarlac, Bataan, Zambales and Nueva Ecija. The anchor tenants for SM City Pampanga are The SM Store, SM Supermarket, Ace Hardware and SM Appliance Center. SM City Davao Year opened – 2001. SM City Davao is located on a 13.2 hectare property along Quimpo Boulevard corner Tulip and Eco Drives, Brgy. Matina, Davao City. Its location is walking distance from some of the largest schools in Mindanao such as Ateneo de Davao, University of Mindanao, Philippine Women’s College and the Agro-Industrial Foundation College. The mall has a GFA of 126,425 sq. m. It has six cinemas which can accommodate 2,351 movie patrons. The anchor tenants for SM City Davao are The SM Store, SM Supermarket, Ace Hardware and SM Appliance Center. SM City Bacoor Year opened – 1997. SM City Bacoor is a five level complex with a GFA of 120,202 sq. m. located in General Emilio Aguinaldo Highway corner Tirona Highway, Brgy. Habay, Bacoor City, Cavite. The shopping complex features eight cinemas with a 4,381 seating capacity, and food court and amusement areas. It is the very first SM mall in the entire Luzon region (outside Metro Manila) and the very first in the Cavite province. The anchor tenants of SM City Bacoor are The SM Store, SM Supermarket, Ace Hardware and SM Appliance Center. SM City Baguio Year opened – 2003. SM City Baguio is situated along Session Road in Baguio City. Baguio City is a promising site for SM Prime to develop its presence in the northern part of Luzon. Known for its cool climate, beautiful scenery and historic culture, the city offers multifold opportunities for entrepreneurs, retailers and service oriented establishments. SM City Baguio has a GFA of 107,950 sq. m. It has four cinemas with a total seating capacity of 1,932. The anchor tenants for SM City Baguio are The SM Store, SM Supermarket and Ace Hardware.

11
SM City Consolacion Year opened – 2012. SM City Consolacion is located along the Cebu North Road, Barangay Lamac, Consolacion, Cebu. It has a GFA of 103,558 sq. m. The mall’s amenities include a food court, four cinemas with a combined seating capacity of 1,475, and parking for over 707 vehicles. The anchor tenants for SM City Consolacion are The SM Store, SM Supermarket Ace Hardware and SM Appliance Center. SM City Tarlac Year opened – 2010. SM City Tarlac is located along MacArthur Highway, San Roque, Tarlac City. It is the very first SM mall in the province of Tarlac. The four-level mall has a GFA of 101,369 sq. m. The mall features a food court, four cinemas with 1,872 seating capacity, and parking for over 1,122 vehicles. The anchor tenants for SM City Tarlac are The SM Store, SM Supermarket and Ace Hardware. SM City Taytay Year opened – 2007. SM City Taytay is a two-building mall located in Brgy. Dolores, Taytay, Rizal. The mall has a GFA of 98,928 sq. m. that features a food court, three cinemas with 1,180 seating capacity and a carpark for 985 vehicles. SM City Taytay is situated as a stopover for travelers, especially those coming from Laguna via the Marikina Infanta Road. The anchor tenants for SM City Taytay are The SM Store, SM Hypermarket and Ace Hardware. SM City Masinag Year opened – 2011. SM City Masinag is a three-floor mall located along Brgy. Mayamot, Marcos Highway, Antipolo City. It has a GFA of 96,313 sq. m. SM City Masinag’s amenities include a food court, four cinemas with a combined seating capacity of 1,144, and parking for more than 454 vehicles. The anchor tenants for SM City Masinag are The SM Store, SM Supermarket and Ace Hardware. SM City Marilao Year opened – 2003. SM City Marilao is the first SM mall in the Bulacan province with a land area of 13.0 hectare and GFA of 93,910 sq. m. It is located at MacArthur Highway, Brgy. Ibayo, Marilao, Bulacan. The four-level mall features a food court, event center and four cinemas with seating capacity of 1,188. The anchor tenants for SM City Marilao are The SM Store, SM Supermarket and Ace Hardware. SM City Baliwag Year opened – 2008. SM City Baliwag is located in Brgy. Pagala, Baliwag, Bulacan, approximately 40 kilometers from the EDSA—Balintawak interchange of the North Luzon Expressway. It has a GFA of 91,241 sq. m. In late 2014, an additional 29,979 sq. m. of GFA was added due to the expansion of the main mall. Among the facilities included are four cinemas with a combined seating capacity of 1,232, a food court and parking for over 1,047 vehicles. The anchor tenants for SM City Baliwag are The SM Store, SM Hypermarket and Ace Hardware. SM City Cagayan De Oro Year opened – 2002. SM City Cagayan De Oro sits along Mastersons Avenue corner Gran Via St., Cagayan de Oro City, Misamis Oriental. The mall has a GFA of 87,837 sq. m. It features four cinemas with a total seating capacity of 1,590 and parking for over 989 vehicles. The anchor tenants for SM City Cagayan De Oro are The SM Store, SM Supermarket and Ace Hardware. SM City Sta. Rosa Year opened – 2006. SM City Sta. Rosa is the first SM mall in the Laguna province with 86,463 sq. m. of GFA. Located on a 17.1 hectare site in Barrio Tagapo, Sta. Rosa, the two-level mall is a 10-minute drive from the Mamplasan exit. SM City Sta. Rosa includes a variety of retail establishments, four cinemas with a seating capacity of 1,854 and a food court. The anchor tenants for SM City Sta. Rosa are The SM Store, SM Supermarket and Ace Hardware.

12
SM City Batangas Year opened – 2004. SM City Batangas is situated along the National Highway, Brgy. Pallocan West, Batangas City. The mall is approximately 3.7 kilometers from the Batangas International Port. SM City Batangas has a GFA of 80,350 sq. m. It has four cinemas with a seating capacity of 1,661. The anchor tenants for SM City Batangas are The SM Store, SM Supermarket and Ace Hardware. SM City Lucena Year opened – 2003. SM City Lucena is located along Maharlika Highway corner Dalahican Road, Brgy. Ibabang Dupay, Lucena City, Quezon. It is the first SM mall in the province of Quezon. This four-level mall has a GFA of 78,655 sq. m. It features four cinemas with a total seating capacity of 1,989. The anchor tenants for SM City Lucena are The SM Store, SM Supermarket and Ace Hardware. SM City Naga Year opened – 2009. SM City Naga is located in Central Business District II of Brgy. Triangulo, Naga City. It is the first SM mall in the Bicol region and has a GFA of 75,651 sq. m. The mall offers a food court and four cinemas with a combined seating capacity of 1,346. The anchor tenants for SM City Naga are The SM Store, SM Supermarket and Ace Hardware. SM City San Mateo Year opened – 2015. SM City San Mateo is located in Gen. Luna Avenue, Brgy. Ampid 1, San Mateo, Rizal. It is the fourth SM supermall in in Rizal Province after SM City Taytay, SM City Masinag and SM Center Angono and has a GFA of 75,623 sq. m. The mall has its disaster resilient features which include expansion joints for mitigating earthquake damage and rainwater catchment basin for prevention of flood within its perimeter and surrounding community. The mall offers a food court and four cinemas with a combined seating capacity of 1,232. The anchor tenants for SM City San Mateo are The SM Store, SM Supermarket and Ace Hardware. SM City Calamba Year opened – 2010. SM City Calamba is located at National Road, Brgy. Real, Calamba City, approximately 70 meters from the intersection of Maharlika Highway and Manila South Road. The mall has a GFA of 73,632 sq. m. and features a food court and four cinemas with a combined seating capacity of 1,268. The anchor tenants for SM City Calamba are The SM Store, SM Supermarket and Ace Hardware. SM City Cauayan Year opened – 2014. SM City Cauayan, the first mall in Region 2 known as Cagayan Valley, has a GFA of 70,946 sq. m. and is located along National Highway, District II, Cauayan City, Isabela. The mall serves customers from the country’s second largest province Isabela as well as the nearby provinces of Cagayan, Nueva Vizcaya, and Quirino. SM City Cauayan includes a variety of retail establishments, six cinemas with a total seating capacity of 1,122. The anchor tenants for SM City Cauayan are The SM Store, SM Supermarket and SM Appliance Center. SM City Rosales Year opened – 2008. SM City Rosales in Brgy. Carmen, Pangasinan stands on a 12.2 hectare lot and has a GFA of 63,330 sq. m. It is the first SM mall in the province of Pangasinan. The amenities of the mall include a food court and four cinemas with capacity of 1,704 seats. The mall contains a public transport terminal and also serves as a bus stop of various inter provincial bus lines. The anchor tenants for SM City Rosales are The SM Store, SM Hypermarket and Ace Hardware. SM City Rosario Year opened – 2009. SM City Rosario is located in Brgy. Tejero in Rosario. Rosario is the site of the Cavite Economic Zone. The mall serves customers in the north and northwestern parts of Cavite and neighboring provinces as well. It has a GFA of 60,657 sq. m. and features a food court and four cinemas with a capacity of 1,560 seats. The anchor tenants for SM Rosario are The SM Store, SM Supermarket and Ace Hardware.

13
SM City San Pablo Year opened – 2010. SM City San Pablo has a GFA of 56,609 sq. m. It is located along Maharlika Highway in Brgy. San Rafael, San Pablo City in the province of Laguna. The mall features a business center, a food court and four cinemas with seating capacity of 1,212. It also has an atrium for various events. The anchor tenants for SM City San Pablo are The SM Store, SM Supermarket and Ace Hardware. SM Center Molino Year opened – 2005. SM Center Molino is located at the southern end of Molino Road, Bacoor, Cavite and has a GFA of 52,061 sq. m. SM Center Molino is the first to have the Service Lane, which comprises of different shops that offer a wide array of services situated outside the mall across the covered parking. The mall features four cinemas with 1,881 seating capacity and parking for 1,194 vehicles. The mall’s anchor tenants are the SM Hypermarket, SM Appliance Center and Ace Hardware. SM Megacenter Cabanatuan Year opened – 2015. SM Megacenter Cabanatuan is located in Gen. Tinio and Melencio Streets, Cabanatuan City, Nueva Ecija. The mall is re-branded to SM Megacenter Cabanatuan after acquisition of SM Prime from CHAS Realty and Development Corporation in 2013. It is the first SM supermall in Cabanatuan City and has a GFA of 49,688 sq. m. The mall offers a food court and four cinemas with a combined seating capacity of 1,607. The mall’s anchor tenant is The SM Store, SM Savemore and Ace Hardware. SM City Olongapo Year opened – 2012. SM City Olongapo, the very first mall in the province of Zambales, has a GFA of 44,975 sq. m. that is strategically located in Magsaysay Drive Corner Gordon Avenue in the city’s Central Business District. The mall serves customers in Zambales, Bataan, and other nearby provinces. SM City Olongapo’s major amenities consist of an al fresco dining area, which offers a view of Olongapo’s mountain landscape, three state-of-the-art digital cinemas, with a combined seating capacity of 758, and parking for over 305 vehicles. The anchor tenants for SM City Olongapo are The SM Store, SM Supermarket and SM Appliance Center. SM Center Sangandaan Year opened – 2015. SM Center Sangandaan, strategically located along the busy intersection of Samson Road and A. Mabini Street Sangandaan, is providing SM Prime access to the northern tip of Metro Manila, bringing a unique shopping experience closer to the highly dense cities of Malabon, Navotas and Caloocan City. It has a GFA of 43,626 with three levels of prime spaces which includes four cinema theaters with a total seating capacity of 832 and 524 parking slots. The anchor tenants for SM Center Sangandaan are SM Supermarket, Ace Hardware and Watsons. SM City San Fernando Year opened – 2012. SM City San Fernando is a seven-storey mall located at the Downtown Heritage District, Barangay Sto. Rosario, San Fernando, Pampanga. It has a GFA of 43,130 sq. m. and features a unique facade, a distinctive exterior design which complies with the architectural theme of a heritage area. The mall’s amenities include three cinemas with a combined seating capacity of 1,068 and parking slots for 246 vehicles. The anchor tenants for SM City San Fernando are The SM Store, SM Supermarket and Ace Hardware. SM Center Angono Year opened – 2014. SM Center Angono, located along Manila East Road and Quezon Avenue in Barangay San Isidro, Angono, Rizal, is marked as the fiftieth SM Supermall in the Philippines. It has a GFA of 41,481 sq. m. with parking slots for 190 vehicles. It serves customers in Angono and Binangonan as well as other towns in the province of Rizal such as Cardona, Teresa, Morong, Baras, Tanay, and Pililla. The anchor tenants for SM Center Angono are SM Savemore, Banco de Oro and Ace Hardware.

14
China Malls SM City Xiamen Year opened – 2001 (SM City Xiamen) & 2009 (SM Xiamen Lifestyle). SM City Xiamen in Xiamen City, Fujian Province is situated on a 10.4 hectare lot and has a GFA of 238,125 sq. m. plus an open carpark for 1,085 vehicles. The anchor tenants for SM City Xiamen are Wal-Mart, The SM Store, Watsons, H&M and Uniqlo plus several junior anchors. SM City Jinjiang Year opened – 2005. SM City Jinjiang in Jinjiang City, Fujian Province is situated on an 11.5 hectare lot and has a GFA of 167,830 sq. m. plus an open carpark for 1,700 vehicles. The anchor tenants for SM City Jinjiang are Wal-Mart, The SM Store and Watsons plus several junior anchors. SM City Chengdu Year opened – 2006. SM City Chengdu in Chengdu City, Sichuan Province is situated on a 4.7 hectare lot and has a GFA of 166,665 sq. m. The anchor tenants for SM City Chengdu are Wal-Mart, The SM Store and Wanda Cinema plus several junior anchors. SM City Zibo Year opened – 2015. SM City Zibo in Zibo City, Shandong Province is situated on a 7.2 hectare lot and has a GFA of 150,600 sq. m. plus an open carpark for 755 vehicles. The anchor tenants for SM City Zibo are The SM Store, The Spar Supermarket, Suning, Pizza Hut, Watsons, DaDi Cinema plus several junior anchors. SM City Chongqing Year opened – 2012. SM City Chongqing, located in the Yubei District, Southwest China, has a GFA of 149,429 sq. m. SM City Chongqing is a one building structure with five levels. The anchor tenants are Vanguard Supermarket, The SM Store and Wanda Cinema plus several junior anchors. SM City Suzhou Year opened – 2011. SM City Suzhou in Wuzhong District, Jiangsu Province is situated on a 4.1 hectare lot and has a GFA of 72,552 sq. m. plus a carpark for 430 vehicles. The anchor tenants for SM City Suzhou are Vanguard Hypermarket, The SM Store, and Wanda Cinema plus several junior anchors. The Company believes that the six malls will provide a platform for it to expand in the China market. It intends to continue to develop the SM malls in China through synergies with its existing mall operations and other management expertise. The Company intends to continue seeking opportunities for mall developments in second and third tier cities in China, where the mall can serve to anchor the city center. Although SM Prime is still developing its expansion plans in China, subject to the availability of suitable locations, SM Prime may initially build two new malls over the next five years in China. There are no mortgage, lien or encumbrance over any of the Company’s properties or limitations on ownership or usage over the same, except as disclosed in Note 19 of the attached consolidated financial statements. Sky Ranch Sky Ranch Tagaytay Sky Ranch Tagaytay, a nearly four-hectare property, is an entertainment venue adjacent to the Taal Vista Hotel, and was developed to complement the hotel’s strong presence as a well-known destination in the area. To maximize the site’s premium views and distinctive natural environment, a social events venue is included which is complemented by casual, family style dining establishments, as well as a mini-amusement theme park for kids and other recreational facilities such as horseback riding.

15
Sky Ranch Pampanga Sky Ranch Pampanga is the first amusement park and the newest destination for both local residents and tourists in the North Luzon. The park is embedded in a 10,000 square meter land of SM City Pampanga in the City of San Fernando. It has 23 different rides, including the Pampanga Eye which is said to be the tallest and biggest Ferris wheel in the Philippines at 65 meters tall and 50 meters in diameter. Malls under Construction For 2016, the Company’s malls business unit is set to open five new malls, located in Cavite, Bulacan, Pasig, Quezon City and Antipolo, as well as the expansions of SM City Calamba and SM City Naga. By yearend, the mall business unit will have an estimated 8.6 million square meters of GFA. Land bank for Malls Development The following table sets forth SMPH’s existing land bank owned for development of new malls as of December 31, 2015:
Location Area (sq.m.)Luzon 1,307,446Visayas/ Mindanao 362,727Metro Manila 80,292China 98,882Total 1,849,347
The Company retains ownership of all the sites on which the SM Prime malls are built, with the exception of SM City Bacoor, SM City Manila, SM Center Valenzuela, SM Center Molino, SM Center Pasig, SM City Clark, SM City Taytay, SM Center Muntinlupa, SM City Naga, SM City San Pablo, SM City Calamba, SM City Olongapo, SM City Consolacion, SM City General Santos, SM Aura Premier, SM San Mateo, SM City Xiamen, SM City Jinjiang, SM City Chengdu, SM City Suzhou, and SM City Chongqing which are held under long term leases. SM China malls have 40-60 years land use rights. In addition, the land where SM City Baguio is constructed is owned by SMIC, and the land where SM City San Lazaro is constructed is owned by San Lazaro Holdings Corporation, a 100%-owned subsidiary. Lease renewal options are subject to mutual agreement of the parties. SM Megamall is owned by FARDC, a 74% owned subsidiary and SM by the Bay is owned by FLVGI, a 50% owned subsidiary. Joint Venture with WalterMart On January 7, 2013, SMPH entered into Shareholders Agreement and Share Purchase Agreement for the acquisition of 51% ownership interest in the following companies (collectively, Waltermart):
• Winsome Development Corporation • Willin Sales, Inc. • Willimson, Inc. • Waltermart Ventures, Inc. • WM Development, Inc.
On July 12, 2013, the Deeds of Absolute Sale were executed between SMPH and shareholders of Waltermart. Waltermart is involved in shopping mall operations and currently owns 21 malls across Metro Manila and Luzon. The investments in Waltermart were accounted as joint ventures using equity method of accounting because the contractual arrangement between the parties establishes joint control.

16
Other real properties that the Company intends to acquire, relating to its planned expansion of its malls business unit, are still under review depending on factors such as demographics and accessibility to public transport. B. RESIDENTIAL (PRIMARY) SM Prime’s revenue from residential operations is derived largely from the sale of condominium units. As of December 31, 2015, residential business unit has twenty seven residential projects in the market, twenty five of which are in Metro Manila and two in Tagaytay. Completed Residential Projects Chateau Elysee Chateau Elysee is a six-cluster, six-storey residential condominium project in a 4.7 hectare lot in Parañaque City, Metro Manila. This project offers one-bedroom and two-bedroom units. Cluster one, comprising 384 units, was launched in 2003 and completed in December 2004. Construction of cluster two with 384 units was completed in May 2006. Construction of cluster three with 400 units was completed in May 2007. Construction of cluster six with 504 units was completed in December 2008. Construction of cluster five, with 560 units was completed in November 2009. Construction of Cluster four with 588 units began in April 2010 and was completed in June 2011. As at December 31, 2015, 97% of the project’s 2,820 units in total had been sold. Mezza Residences SM Prime’s first high-rise project is the Mezza Residences (“Mezza”), which is a mixed-use development project with 38-storey four-tower condominiums and commercial retail area located across from SM City Sta. Mesa, Manila. Each tower has 400 to 800 residential units comprised of one-bedroom to four-bedroom configurations, with floor areas ranging from 21 to 67 sq. m. Mezza consists of 2,332 saleable residential units and 18 commercial units for lease with SaveMore store as the anchor tenant. As at December 31, 2015, construction of Mezza towers one to four was 100% complete and SMDC had sold 93% of the units in Mezza. Berkeley Residences Berkeley Residences is a 35-storey high-rise condominium project situated just across Miriam College in Quezon City. Berkeley Residences comprises 1,276 units which were completed in June 2011, of which 99% were sold as at December 31, 2015. Sea Residences Sea Residences is a 15-storey residential and commercial condominium project comprising of six buildings with 2,899 residential units and 21 commercial units, located at the Mall of Asia (MOA) Complex Pasay City. Phase One of Sea Residences comprises 1,159 units of which 99% were sold as at December 31, 2015; construction for Phase One started in January 2009 and was completed in March 2012. Phase Two comprises 920 units, of which 99% were sold as at December 31, 2015; construction for Phase Two started in November 2009 and was completed in November 2012. Phase Three of Sea Residences comprises 820 units, of which 99% were sold as at December 31, 2015; construction for Phase Three started in March 2010 and was completed in December 2012. Princeton Residences Princeton Residences is a 38-storey high-rise condominium project located along Aurora Blvd., Quezon City which was completed in March 2013. Princeton Residences comprises 1,096 units of which 93% were sold as at December 31, 2015.
17
Sun Residences Sun Residences is a project comprising two 40-storey towers located along España Blvd., Quezon City near Welcome Rotonda. Sun Residences Tower 1 comprises 2,057 units of which 98% were sold as at December 31, 2015. Tower 2 comprises 1,982 units of which 96% were sold as at December 31, 2015. Construction of Towers 1 and 2 were completed in November 2013 and June 2014, respectively. Jazz Residences Jazz Residences is a mixed use development project comprising four 41-storey towers located at N. Garcia corner Jupiter, Makati City. Towers A, B, C and D of the project consist of 5,367 units of which 92% were sold as at December 31, 2015. Construction of Tower A started in April 2010 and was completed in December 2013 while construction of Tower C started in October 2010 and was completed in May 2014. Construction of Tower D started in July 2011 and was completed in June 2015. Construction of Tower B started in July 2011 and was completed in September 2015. Blue Residences Blue Residences is a 40-storey residential condominium situated near Ateneo De Manila University in Quezon City. Construction of Blue Residences started in October 2010 and was completed in May 2014. It comprises 1,591 units of which 87% were sold as at December 31, 2015. Grass Residences – Phase 1 Grass Residences – Phase 1 is a three tower 40-storey high-rise condominium project located behind SM City North EDSA, Manila. Tower 1 comprises 1,988 units of which 97% were sold as at December 31, 2015. Construction of Tower 1 started in March 2008 and was completed in October 2011. Tower 2 comprises 2,025 units, of which 95% were sold as at December 31, 2015. Construction of Tower 2 started in November 2010 and was completed in May 2014. Tower 3 comprises 1,990 units, of which 99% were sold as at December 31, 2015. Construction of Tower 3 started in November 2009 and was completed in December 2013. Light Residences Light Residences is a mixed use development project with three 40-storey towers located along EDSA, Mandaluyong City. It has a total of 4,227 units, of which 95% were sold as at December 31, 2015. Construction of Phase 1, which consists of the podium and Tower 1, started in May 2010 and was completed in December 2013. Construction of Phase 2 (Tower 3) started in April 2011 and was completed in December 2013. Construction of Phase 3 (Tower 2) commenced in July 2011 and was completed in January 2015. M Place @ South Triangle M Place @ South Triangle is a four 25-storey tower condominium in South Triangle, Quezon City. Tower A started construction on January 2011 and was completed in December 2013. Tower A comprises 827 units of which 90% were sold as at December 31, 2015. Tower B started construction in April 2011 and was completed in December 2013. Tower B comprises 912 units of which 71% were sold as at December 31, 2015. Tower C comprises 778 units of which 85% were sold as at December 31, 2015. Construction of Tower C began in November 2011 and was completed in 2015. Tower D comprises of 920 units of which 54% were sold as at December 31, 2015. Construction of Tower D commenced in December 2011 and was completed in January 2015. Mezza II Residences Mezza II Residences is a 38-storey residential condominium located just beside the first Mezza Residences in Quezon City. Construction of Mezza II started in August 2011 and was completed in January 2015. It comprises 1,324 units of which 74% were sold as at December 31, 2015. Shine Residences Shine Residences is a 22-storey residential condominium located in Pasig City. Construction of Shine Residences commenced in January 2013 and was completed in December 2015. It comprises 892 units, of which 72% were sold as at December 31, 2015.

18
Green Residences Green Residences is a 50-storey residential condominium situated on Taft Avenue, Manila near De La Salle University. Construction of Green Residences started in December 2011 and was completed in December 2015. Green Residences comprises 3,378 units of which 93% were sold as December 31, 2015. Shell Residences Shell Residences is a 16-storey residential and commercial condominium project and is located at the MOA Complex in Pasay City. It comprises four buildings with 3,093 residential units of which 99% were sold as at December 31, 2015. Construction of Shell Residences commenced in May 2012 and was completed in December 2015. Ongoing Residential Projects Affordable Residential Projects: Grass Residences – Phase 2 Grass Residences – Phase 2 was launched in March 2013, a two tower 43-storey high-rise condominium project located behind SM City North EDSA, Manila. Expected to be completed in 2017, Tower 4 comprises 1,961 units, of which 71% were sold as at December 31, 2015. Expected to be completed in 2019, Tower 5 comprises 1,957 units, of which 11% were sold as at December 31, 2015. Field Residences Field Residences is a residential condominium project that will ultimately consist of ten buildings located behind SM Sucat, Parañaque. Buildings 1, 2, 3, 7 and 8 of Field Residences comprise 1,974 units, of which 98% were sold as at 30 December 31, 2015. Construction of buildings 1, 2, 8, 3 and 7 were completed in April 2010, April 2011, December 2011, December 2012 and September 2013, respectively. Building 4 comprises of 602 units, of which 64% were sold as at December 31, 2015. Building 4 is expected to be completed in 2016. Wind Residences Wind Residences is a residential condominium development with five 20-storey towers located along Emilio Aguinaldo Highway, Tagaytay City. Towers 1 to 5 have a total of 3,524 units of which 83% were sold as at December 31, 2015. Towers 1 and 2 were completed in August 2013. Tower 3 was completed in December 2013. Construction of Tower 4 began in April 2013 and was completed in December 2015. Construction of Tower 5 started in October 2013 and is expected to be completed in 2016. Cool Suites @ Wind Residences Cool Suites @ Wind Residences is a residential condominium project that will consist of 6 Towers located along Emilio Aguinaldo Highway, Tagaytay City. Cool Suites @ Wind Residences is a Phase 2 Project at the 15-hectare development of Wind Residences. Building 1 was launched in December 2014 with a total of 363 units, of which 41% were sold as at December 31, 2015. Construction of Building 1 commenced in January 2015 and expected to be completed in 2016. Breeze Residences Breeze Residences is a 38-storey residential and commercial condominium project and is located along Roxas Boulevard in Pasay City. Breeze Residences comprises 2,133 units, of which 93% were sold as at December 31, 2015. Construction of Breeze Residences commenced in June 2013 and is expected to be completed in 2016. Grace Residences Grace Residences is a residential condominium development with four towers located along Levi Mariano Avenue in Taguig City. Towers 1, 2 and 3 have a total of 2,451 units, of which 93% were sold as at December 31, 2015. Tower 4 comprises 1,128 units, of which 39% were sold as at December 31,

19
2015. Construction of Tower 1 started in May 2013 and was completed in October 2015. Construction of Tower 2 and 3 commenced in October 2013 and May 2014, respectively, and are expected to be completed in 2016. Construction of Tower 4 started in April 2015 and is expected to be completed in 2018. Trees Residences Trees Residences is a residential condominium development with nineteen 7-storey towers located near Quezon City. Buildings 1, 2, 3, 5, 6 and 7 (“Phase 1 Buildings”) have a total of 2,093 units, of which 82% were sold as at December 31, 2015. Construction of the Phase 1 Buildings commenced in May 2014 and are expected to be completed in 2016. Buildings 8, 9,10,11,12,14 and 15 (“Phase 2 Buildings”) have a total of 2,492 units, of which 20% were sold as at December 31, 2015. Construction of the Phase 2 Buildings commenced in April 2015 and is expected to be completed in 2017. Shore Residences Shore Residences is a residential condominium development with four towers located at the MOA Complex in Pasay City. Shore Residences comprises 5,691 units, of which 91% were sold as at December 31, 2015. Construction of Shore Residences commenced on the second quarter of 2014 and is expected to be completed in 2018. Air Residences Air Residences is a residential condominium situated across Ayala Avenue Extension corner Yakal and Malugay Street, Barangay San Antonio, Makati City. Construction of Air Residences commenced on the last quarter of 2015 and is expected to be completed in 2020. Air Residences comprises of 3,642 units, of which 64% were sold as at December 31, 2015. Fame Residences Fame Residences is a residential condominium project that will ultimately consist of four towers in a common podium located along EDSA and Mayflower Street, Barangay Highway Hills, Mandaluyong City. Towers 1 and 2 of Fame Residences have a total of 2,552 units, of which 38% were sold as at December 31, 2015. Construction of the project commenced in November 2015. Towers 1 and 2 are expected to be completed in 2019. Shore 2 Residences Shore 2 Residences is a residential condominium development with three towers located just beside Shore Residences in Pasay City. Shore 2 Residences comprises 5,488 units of which 57% were sold as at December 31, 2015. Construction of Shore 2 Residences commenced on the last quarter of 2015 and is expected to be completed in 2019. South Residences Phase 1 South Residences Phase 1 is a residential condominium project that will ultimately consist of four towers located near SM Southmall in Las Piñas City. Construction commenced on the second half of 2015 and is expected to be completed on the first half of 2019. South Residences Phase 1 comprises 2,010 units. Socialized Residential Projects: Heneral Uno Heneral Uno is the first horizontal socialized housing project launched in 2012. The project is situated in 25 hectares property in General Trias, Cavite with 2,365 housing units. As of December 31, 2015, it is 97% sold with complete land development and 99% house completion.

20
Heneral Dos Launched in 2013 is the 2nd socialized housing project named “Heneral Dos”. It is situated in 20 hectares property in General Trias and Trece Martirez, Cavite with a total 1,510 housing units and 30 commercial lot offerings. As of December 31, 2015, it is 97% sold with 98% land development and 28% house completion. Brisas De Tanza Brisas De Tanza was launched in 2015 located in Tanza, Cavite. Project gross area is 6.5 hectares with 651 predominantly socialized housing offerings. As of December 31, 2015, it is 67% sold with on-going land development at 48%. Start of house construction will be in the 2nd Qtr of 2016. Primera Subdivision Primera Subdivision is a pioneering socialized housing development in Sto. Tomas, Batangas. It was launched in 2015 with an area of 11 hectares offering 1,019 housing units. As of December 31, 2015, it is 87% sold with on-going land development at 40%. Start of house construction will be in the 2nd Qtr. of 2016. RESIDENTIAL (LEISURE) SM Prime owns leisure and resort developments including properties located in the Tagaytay Highlands and Tagaytay Midlands golf clubs in Laguna, Tagaytay City and Batangas. In addition, SM Prime is the developer of Pico de Loro Cove, the first residential community within Hamilo Coast, a master planned coastal resort township development in Nasugbu, Batangas encompassing 13 coves and 31 kilometers of coastline. Residential Developments in Tagaytay The Horizon at Tagaytay Midlands This is a medium-density residential condominium development located inside The Tagaytay Midlands mountain resort community. The development overlooks the Tagaytay Midlands golf course, Taal Lake and Volcano in the west, Mt. Makiling in the south east and the mountain range of Batangas in the south. This has 6 buildings with 108 units of approximately 139 to 152 sq. m. each. The project was launched in 2005 and was fully completed and was 90% sold as at December 31, 2015. Pueblo Real at Tagaytay Midlands The development is adjacent to The Horizon, situated on a six hectare property and has 86 lots with an average lot size of 420 sq. m. Approximately 85% of the lots had been sold as at December 31, 2015. Woodridge Place Phase 2 This is a condominium project at Tagaytay Highlands that was introduced to the market in May 2010. This project consists of two mid-rise buildings with 177 condominium residential units with areas ranging from 41 to 241 sq. m. per unit. Approximately 57% of the units had been sold as at December 31, 2015. Sierra Lago This is a lot subdivision development located at Tagaytay Midlands that was launched in November 2010. This development has 185 lots with sizes of approximately 250 to 435 sq. m. Approximately 99% of the lots had been sold as at December 31, 2015. Aspenhills This is a leisure lot development located at Tagaytay Highlands that was launched in summer of 2012. This development is situated on 27 hectare property which offers lot sizes from 300 to 800 sq. m. The surrounding village is expected to include the Meadows Community Clubhouse, the Little Ranch

21
playground, the Sunshine Picnic Grove and Spinner’s Trail. Approximately 49% of the lots had been sold as at December 31, 2015. The Hillside The Hillside at Tagaytay Highlands is the first lots only subdivision in the Tagaytay Highlands complex which is located near the Sports Center, the Country Club and other recreational facilities. This property boasts of cool year-round climate, gentle rolling terrain, lush greenery and views of the mountainside and Laguna De Bay. On this 156 lot development, lot cuts range from 400 to 640 square meters. Three model units have been constructed to date. Approximately 99% of the lots had been sold as of December 31, 2015. The Woodlands Point The Woodlands Point at Tagaytay Highlands is a single detached log cabin condominium community located near Fairway 15 of the Tagaytay Highlands Golf Course. HPI will develop 60 single detached log cabins carrying the homey atmosphere of North American cedar log cabin living enhanced by Western red cedar accents and elegant detailing of glass and stone. Currently, 24 log cabins have been completed and 23 have been sold. The 36 log cabins will be constructed as they are sold. Woodridge Place Phase 1 Located in Tagaytay Highlands adjacent to The Woodridge. The Woodridge Place Phase 1 is a condominium development with the views of The Woodlands, Tagaytay Highlands Golf Course, Canlubang, Laguna De Bay and surrounding mountains. Its architectural theme is inspired by the mountain resorts of the Colorado Region. Composed of 7 mid-rise buildings. All buildings have been constructed and sold. Residential Developments in Pico de Loro Jacana Jacana is a residential condominium project located at Pico De Loro Cove, Nasugbu, Batangas. It is comprised of two buildings, building A with six floors and building B with seven floors. Construction of Jacana commenced in August 2007 and was completed in February 2010. Of the total 246 residential units, 96% were sold as at December 31, 2015. Construction of Jacana commenced in August 2007 and was completed in February 2010. Myna Myna is a residential condominium project located at Pico De Loro Cove, Nasugbu, Batangas. It comprises two buildings, building A with six floors and building B with seven floors. Construction of Myna commenced in May 2008 and was completed in July 2010. Of the total 246 residential units, 98% were sold as at December 31, 2015. Construction of Myna commenced in May 2008 and was completed in June 2010. Carola Carola is a residential condominium project located at Pico De Loro Cove, Nasugbu, Batangas. It comprises two buildings, building A with six floors and building B with seven floors. Construction of Carola commenced in August 2009 and was completed in August 2012. Of the total 248 residential units, 94% were sold as at December 31, 2015. Miranda Miranda is a residential condominium project located at Pico De Loro Cove, Nasugbu, Batangas. It comprises two buildings, building A with six floors and building B with seven floors. Construction of Miranda commenced in August 2009 and was completed in June 2012. Of the total of 248 residential units, 97% were sold as at December 31, 2015.
22
Pico de Loro Beach and Country Club Pico de Loro Beach and Country Club is a leisure facility located at Pico de Loro Cove. Costa del Hamilo, as developer, executed a deed of conveyance of the titles to the lots and buildings, and in return owns 4,000 shares, of which 33% were sold as at December 31, 2015. The beach club was completed and opened in 2009, while the country club was completed in June 2010. Land Bank for Residential (Primary) Development In 2016, the residential business unit will launch projects located in Quezon City, Parañaque, Las Piñas, Pasay City, Bulacan, Laguna, Pampanga and Cavite. The Company continues to invest in properties that it believes are in prime locations across the Philippines for existing and future property development projects. It is important to the Company to have access to a steady supply of land for future projects. Potential land acquisitions are evaluated against a number of criteria, including the attractiveness of the acquisition price relative to the market and the suitability or the technical feasibility of the planned development. The Company identifies land acquisitions through active search and referrals. The table below sets forth the locations of SM Prime’s residential (primary) undeveloped land inventory as of December 31, 2015:
Location Area (in sq. m.) Metro Manila 526,505 Outside Metro Manila 2,026,832 Total 2,553,337
The Company believes this land bank is sufficient to sustain development and sales. Moreover, the Company’s residential business unit continually seeks to increase its land bank in various parts of the Philippines for future residential development through direct acquisitions. Land Bank for Residential (Leisure) Development SM Prime owns 542 hectares of land located around the vicinity of Tagaytay Highlands International Golf Club in Tagaytay City, Cavite and Tagaytay Midlands Golf Club in Batangas. The table below sets forth the location and area of SM Prime’s residential (leisure) land bank as of December 31, 2015:
Location Area (in sq. m.) Batangas 4,329,339 Tagaytay 940,728 Laguna 327,764 Total 5,597,831
C. COMMERCIAL SM Prime’s commercial business unit is engaged in the development and leasing of office buildings in prime locations in Metro Manila, as well as the operations and management of such buildings and other property holdings.

23
Completed Commercial Properties Mall of Asia (MOA) Complex SM Prime’s flagship project is the MOA Complex in Pasay City, a 60-hectare master planned bayside development with the renowned SM Mall of Asia as its anchor development and main attraction, among other commercial, business, and entertainment establishments within the Complex. A major attraction in the Complex is the landmark 16,000-indoor seating SM Mall of Asia Arena, as well as its adjacent annex building, MOA Arena Annex Building, that houses additional parking spaces and office levels. The MOA complex is also the site of SM Prime’s signature business complex, the E-Com Centers, a series of modern and iconic office buildings mostly targeting technology based industries, BPO and shipping companies. Two E-Com Center Year opened – 2012. Two E-com Center is a 15-storey office and commercial building housing BPOs and technology intensive businesses, as well as location based firms such as shipping and logistics. This iconic structure located in the MOA complex in Pasay City offers 71,570 sq. m. of office and commercial space, and premium views of Manila Bay and the Makati skyline. It is designed by Miami based Arquitectonica, with FS Lim & Associates as local architect of record. Commercial spaces are located at both the ground floor and the fourth floor podium level called the Prism Plaza. Current tenants of the building include SMDC, EXL Service, Sky Logistics/Kitchen, World Energy Corporation, OOCL Philippines, XO Minerals, Microsourcing, Stream International Global Services Philippines Inc., ACS of the Philippines, Ben Line Agencies/Simba Logistics, Klaveness, SITC, IGT, Asia Pilot Capital Holdings, Ocwen Business Solutions, Altisource Business Solutions, Teletech Global, Belle Corporation, CMA CGM, Altron Logistics Inc./Enzo Express Logistics Inc./DSF Consolidated Freight Services Inc., Anscor Swire Ship Management Corporation and Esco Global. Five E-Com Center Year opened – 2015. Five E-com Center, which broke ground in the first quarter of 2012, was fully constructed as of 30 June 2015. Similar to its predecessor Two E-com Center, Five E-com Center features architectural designs of Miami based firm Arquitectonica, with FS Lim & Associates as the local architect of record. The 15-level office building covers a GFA of over 129,307 sq. m. and an estimated gross leasable area (GLA) of 82,719 sq. m. Floor plates. Similar to Two E-com Center as well, Five E-com Center also features a mixed-use component on its fourth level podium. Xerox Business Services Philippines, Inc., New Oriental Club 88 Corporation, KHI Design and Technical Services, Inc., Vestas BPC Philippines, Inc., Teletech Customer Care Management (Philippines), Inc., Telstra International Philippines, Inc., Tupperware Brands Philippines, Inc., Grieg Philippines, Inc., Klaveness Shore Services, Inc., F21 Call Center Services Corporation, Regus Business Center, Flight Raja Travels Private Limited – Philippine Branch, CTrade Asia Crowd, Inc., Xiamen Airlines, and ESCO are some of the office tenants, while BDO Unionbank, Inc., China Banking Corporation, Beyond Yoga, Starbucks/ Rustans Coffee Corporation, Jollibee Foods Corporation, Greenwich Pizza / Fresh & Famous Foods, Inc., St. Luke’s Medical Center, Inc. and Anytime Fitness Philippines are some of the retail tenants of this building. SM Makati Cyber One Year opened – 2008. SM Makati Cyber One is a 4-storey office building located along Gil Puyat Avenue with GFA of approximately 22,100 sq. m. Current tenants of the building include Perimeter E Security, ABM Global Solutions, Inc., K Force Global Solutions Inc. and Startek International Ltd. SM Makati Cyber Two Year opened – 2008. SM Makati Cyber Two is a 4-storey office building with GFA of approximately 16,700 sq. m. The development is along corners of Sen. Gil J. Puyat Avenue (Buendia)/Jupiter/Zodiac Streets, Makati City. The major tenant of the building is VXI Global Holdings B.V. (Philippines). SM Prime also owns the land SM Makati Cyber Two is built upon.
24
SM Cyber West Year opened – 2014. A new standalone office building development in the SM Cyber series, SM Cyber West is a 15-level office building development located on a highly visible and prime 2,910 sq. m. owned property at the corner of EDSA and West Avenue. The building was completed in October 2014 that covers a GFA of more or less 41,799 sq. m., with approximately 26,000 sq. m. of GLA for office space. Additionally, it is linked via bridgeways to the SM City North EDSA mall as well as nearby MRT stations. Major tenants of the building include Emerson Electric Asia Ltd. ROHQ and Concentrix Daksh Services Phils. Corp. The remaining leasable area in the ground and second levels features a SaveMore supermarket and other support retail and commercial establishments. Anza Commercial Building Year opened – 2014. The building is a 2-storey commercial center located at Makati Avenue corner Anza St., Makati City with a GFA of 2,177 sq. m. The development was completed in the third quarter of 2014. Burger King, Kenny Rogers and Bingo Boutique are the anchor tenants of the building. Future Commercial Developments Three E-Com Center Three E-com Center will be a 15-storey office building with a three level parking podium and the ground level designed to cater the commercial and retail tenants. Similar to Two E-com Center and Five E-com Center, Three E-com Center will feature architectural designs of Miami based firm Arquitectonica. The GFA is expected to be approximately 114,000 sq. m. The project started to break ground last September 2014. SM Prime again pioneers development in the bay area by being the first to offer a Gold LEED certified office building with Three E-Com Center. Four E-Com Center Four E-Com Center in Mall of Asia Complex which broke ground last January 2016 is designed to address the demand for office buildings in the country. It will have a GFA of 123,968 sq.m. and is projected to generate P700 million in gross rental revenues annually. A 16-storey building, Four E-Com has a full basement, 4 podium parking, and 11 office levels. Retail spaces are offered at the 5th floor podium and ground levels. The building’s design concept will portray crystal formations, with three adjacent towers springing from a common podium. The building will have the distinct rhombic shape as well as flat and inclined surfaces layered over grids to resemble crystals. Like the other E-Com buildings, it will also feature a landscaped deck at the 5th floor podium. Others Department Stores and Supermarkets SM Prime also owns several department store and supermarket buildings with a total GFA of approximately 289,000 sq. m. The major tenant of these buildings is the SM Retail Group. The following table sets forth certain information regarding SM Prime’s department store and supermarket buildings as of December 31, 2015: Department stores (The SM Store)
Location
GFA (sq. m.)
Occupancy (%)
SM Makati Makati City 109,667 99.00 SM Cubao Quezon City 109,253 98.00 SM Iloilo Iloilo City 26,390 97.00
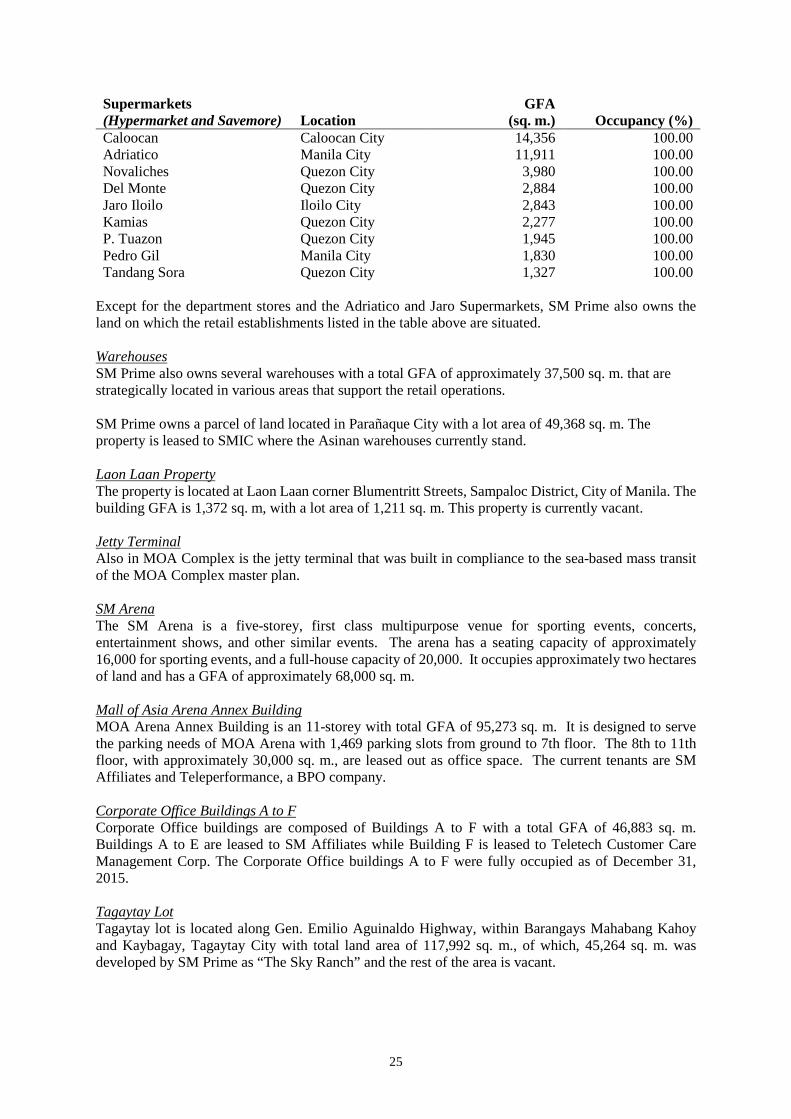
25
Supermarkets (Hypermarket and Savemore)
Location
GFA (sq. m.)
Occupancy (%)
Caloocan Caloocan City 14,356 100.00 Adriatico Manila City 11,911 100.00 Novaliches Quezon City 3,980 100.00 Del Monte Quezon City 2,884 100.00 Jaro Iloilo Iloilo City 2,843 100.00 Kamias Quezon City 2,277 100.00 P. Tuazon Quezon City 1,945 100.00 Pedro Gil Manila City 1,830 100.00 Tandang Sora Quezon City 1,327 100.00
Except for the department stores and the Adriatico and Jaro Supermarkets, SM Prime also owns the land on which the retail establishments listed in the table above are situated. Warehouses SM Prime also owns several warehouses with a total GFA of approximately 37,500 sq. m. that are strategically located in various areas that support the retail operations. SM Prime owns a parcel of land located in Parañaque City with a lot area of 49,368 sq. m. The property is leased to SMIC where the Asinan warehouses currently stand. Laon Laan Property The property is located at Laon Laan corner Blumentritt Streets, Sampaloc District, City of Manila. The building GFA is 1,372 sq. m, with a lot area of 1,211 sq. m. This property is currently vacant. Jetty Terminal Also in MOA Complex is the jetty terminal that was built in compliance to the sea-based mass transit of the MOA Complex master plan. SM Arena The SM Arena is a five-storey, first class multipurpose venue for sporting events, concerts, entertainment shows, and other similar events. The arena has a seating capacity of approximately 16,000 for sporting events, and a full-house capacity of 20,000. It occupies approximately two hectares of land and has a GFA of approximately 68,000 sq. m. Mall of Asia Arena Annex Building MOA Arena Annex Building is an 11-storey with total GFA of 95,273 sq. m. It is designed to serve the parking needs of MOA Arena with 1,469 parking slots from ground to 7th floor. The 8th to 11th floor, with approximately 30,000 sq. m., are leased out as office space. The current tenants are SM Affiliates and Teleperformance, a BPO company. Corporate Office Buildings A to F Corporate Office buildings are composed of Buildings A to F with a total GFA of 46,883 sq. m. Buildings A to E are leased to SM Affiliates while Building F is leased to Teletech Customer Care Management Corp. The Corporate Office buildings A to F were fully occupied as of December 31, 2015. Tagaytay Lot Tagaytay lot is located along Gen. Emilio Aguinaldo Highway, within Barangays Mahabang Kahoy and Kaybagay, Tagaytay City with total land area of 117,992 sq. m., of which, 45,264 sq. m. was developed by SM Prime as “The Sky Ranch” and the rest of the area is vacant.

26
Casino Building Casino Building is located along Gen. Emilio Aguinaldo Highway, within Barangays Mahabang Kahoy and Kaybagay, Tagaytay City with total GFA of 19,394 sq. m. Its only tenant is Philippine Amusement and Gaming Corp. for a 25-year lease term ending on 2033. Other Commercial Properties SM Prime acts as a landlord for the following commercial properties leased by SM Food Retail Group: Lot Location Area (sq. m.) Imelda Ave., Cainta, Rizal & Int. Imelda Ave., Rosario, Pasig City 41,000 East Service Road, Sucat, Muntinlupa City 40,000 Anabu I-B Imus, Cavite 37,000 II-A;II-B & Lot 1;Along H. Cortes Ext., Subangdaku, Mandaue City 36,000 Km. 7 McArthur Highway, Bangkal, Davao City 34,000 Quirino Highway, Talipapa, Balintawak, Quezon City 30,000 Manila Harbor Center, Tondo, Manila City 26,000 Rosario, Batangas 7,189
Land Bank for Commercial Development The table below sets forth the locations of land inventory as of December 31, 2015: Location Area (sq. m.) Luzon 431,046 Metro Manila 97,522 Visayas 360,631 Total 889,199
D. HOTELS AND CONVENTION CENTERS As of December 31, 2015, the hotels and convention centers business unit is composed of five hotels with 1,167 saleable rooms and four convention centers and two trade halls with 35,623 sq. m. of leasable space. Hotels Completed Hotel Projects Taal Vista Hotel Taal Vista Lodge, located in Tagaytay City, was acquired by the SM Group in July 1988. The Hotel re-opened in 2003 under the new name Taal Vista Hotel with the renovated Mountain Wing (128 rooms), Lobby Lounge, and Restaurant. The Lake Wing was constructed in 2008 with 133 rooms and 1,000-seater ballroom. In 2009, the hotel became fully operational with total inventory of 261 rooms. Radisson Blu Cebu SM Prime inaugurated the 396-room Radisson Blu Hotel in November 2010, strategically located beside SM City Cebu adjacent to the International Port Area. Radisson Blu is the first hotel managed by the Carlson Rezidor Hotel Group in the Asia Pacific Region to be classified under its “Blu” upscale hotel brand category. The property has been classified as a deluxe hotel category by the Department of Tourism. Its facilities include an in-house spa, fitness center, business center, 800-sq. m. swimming pool, club lounge, two ballrooms and a number of smaller meeting rooms.

27
Pico Sands Hotel Formally opened in August 2011, Pico Sands Hotel is a 154-room tropical contemporary hotel located within Pico de Loro Cove, the maiden residential community of Hamilo Coast, the premier seaside development of the SM Group in Nasugbu, Batangas. The spacious rooms are equipped with modern facilities and captivating views of lush mountains and tranquil lagoon. Park Inn by Radisson Davao Park Inn by Radisson Davao is strategically located across the SM Lanang Premier Mall and SMX Conventions Center. The 202-room hotel was formally opened in March 2013. Guests are greeted with contemporary interiors and smart design elements complementing the hotel’s service philosophy – Adding Color to Life. Facilities include: Restaurant, Bar and Grill (RBG), 4 meeting rooms, fitness center, swimming pool and bar. Park Inn Davao is the first “next generation” mid-scale Park Inn by Radisson brand to be established in the Asia Pacific region. Park Inn by Radisson Clark The 154-room Park Inn by Radisson Clark is located in Mabalacat, Pampanga, about 40 miles (60km) northwest of Metro Manila. It is conveniently located beside SM City Clark and Clark Freeport Zone. Clark Freeport Zone is a redevelopment of the former Clark Air Base, a former United States Air Force base in the Philippines. Park Inn by Radisson Clark is the leading 3-star hotel in its market with facilities that include an all-day dining restaurant with 64-seat capacity, a meeting room for 80 pax and a fitness center. Ongoing Hotel Projects Conrad Manila In March 2013, SM Prime signed with Hilton Worldwide an agreement to manage the first “Conrad” brand in the Philippines. The 347-room Conrad Manila will be located within the MOA complex with stunning views of the famed Manila Bay. The eight-storey hotel will incorporate two levels of retail and entertainment facilities on the ground floor. It will also have other hotel facilities as well as a 1,446 sq. m. ballroom and other function and meeting spaces. Conrad Manila is scheduled for completion by the second quarter of 2016. Convention Centers and Trade Halls The Company has four SMX convention centers and two trade halls. SMX convention centers are located in the MOA Complex, SM Lanang Premier, SM Aura Premier and SM City Bacolod. Trade halls are located in SM Megamall and SM City Cebu. The structure of a convention center is made up of large exhibit floors which can be divided into multiple exhibition and function halls. With its state of the art convention and exhibition facilities, it continues to host major international and local conventions and exhibitions. ITEM 3. Legal Proceedings Please refer to Note 30 of the attached 2015 consolidated financial statements. ITEM 4. Submission of Matters to a Vote of Security Holders There were no matters submitted to a vote of security holders during the fourth quarter of the calendar year covered by this report.

28
PART II - OPERATIONAL AND FINANCIAL INFORMATION ITEM 5. Market for Registrant’s Common Equity and Related Stockholder Matters CASH DIVIDEND PER SHARE - P0.21 in 2015, P0.19 in 2014 and P0.27 in 2013. 2015 2014
Stock Prices High Low High Low First Quarter P 20.60 P 16.70 P 15.52 P 14.10 Second Quarter 21.35 18.40 17.20 14.56 Third Quarter 22.50 18.10 18.38 15.08 Fourth Quarter 23.20 19.90 18.00 15.72
The Company’s shares of stock are traded in the Philippine Stock Exchange. As of December 31, 2015, the closing price of the Company’s shares of stock is P21.70/share. The number of shareholders of record as of December 31, 2015 was 2,487. Capital stock issued and outstanding as of December 31, 2015 was 28,879,231,694. The Company targets a dividend payout of 30 to 35 percent of the previous year’s net income. As of December 31, 2015, there are no restrictions that would limit the ability of the Company to pay dividends to the common stockholders, except with respect to Note 20 of the consolidated financial statements. The top 20 stockholders as of December 31, 2015 are as follows:
Name No. of Shares Held % to Total 1. SM Investments Corporation 14,325,013,606 49.60 2. PCD Nominee Corp. (Non-Filipino) 5,535,893,404 19.17 3. PCD Nominee Corp. (Filipino) 1,568,536,672 5.43 4. Hans T. Sy 685,163,512 2.37 5. Henry Sy, Jr. 680,818,440 2.36 6. Teresita T. Sy 666,708,532 2.31 7. Herbert T. Sy 666,389,522 2.31 8. Harley T. Sy 661,643,367 2.29 9. Elizabeth T. Sy 654,115,892 2.27 10. Felicidad Sy 648,515,413 2.25 11. Syntrix Holdings, Inc. 317,827,670 1.10 12. Sysmart Corporation 317,775,948 1.10 13. Henry Sy, Sr. 105,395,579 0.36 14. Belle Corporation 92,138,513 0.32 15. Sybase Equity Investments Corp. 52,365,500 0.18 16. Mountain Bliss Resort and Development Corp. 28,130,837 0.10 17. Cutad, Inc. 19,694,544 0.07 18. HSBB, Inc. 19,694,400 0.07 19. Lucky Securities, Inc. 3,000,000 0.01 20. Philippine Air Force Educational Fund, Inc. 2,140,923 0.01
As discussed in Note 19 of the consolidated financial statements, the Company registered with the Securities and Exchange Commission the P20 billion retail bonds issued on November 25, 2015. The issue consists of the five-year and three months or Series D Bonds amounting to P=17,969 million with a fixed interest rate equivalent to 4.5095% per annum due on February 25, 2021 and ten-year or Series E Bonds amounting to P=2,031 million with a fixed interest rate equivalent to 4.7990% per annum due on November 25, 2025.

29
There are no other recent sales of unregistered or exempt securities, including recent issuance of securities constituting an exemption transaction. The Company has no other registered debt securities. There are no existing or planned stock options. There are no registered securities subject to redemption or call. There are no existing or planned stock warrant offerings.
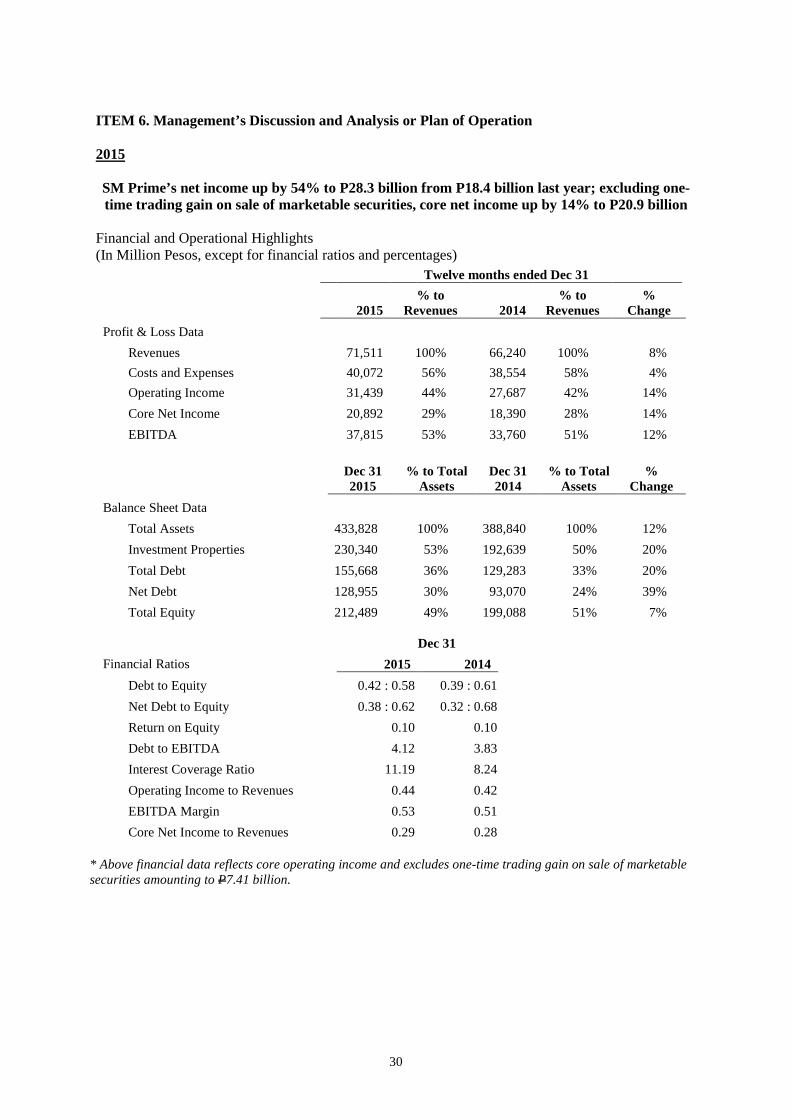
30
ITEM 6. Management’s Discussion and Analysis or Plan of Operation 2015 SM Prime’s net income up by 54% to P28.3 billion from P18.4 billion last year; excluding one-time trading gain on sale of marketable securities, core net income up by 14% to P20.9 billion
Financial and Operational Highlights (In Million Pesos, except for financial ratios and percentages)
* Above financial data reflects core operating income and excludes one-time trading gain on sale of marketable securities amounting to P7.41 billion.
Twelve months ended Dec 31
2015 % to
Revenues 2014 % to
Revenues %
Change
Profit & Loss Data
Revenues 71,511 100% 66,240 100% 8%
Costs and Expenses 40,072 56% 38,554 58% 4%
Operating Income 31,439 44% 27,687 42% 14%
Core Net Income 20,892 29% 18,390 28% 14%
EBITDA 37,815 53% 33,760 51% 12%
Dec 31 2015
% to Total Assets
Dec 31 2014
% to Total Assets
% Change
Balance Sheet Data
Total Assets 433,828 100% 388,840 100% 12%
Investment Properties 230,340 53% 192,639 50% 20%
Total Debt 155,668 36% 129,283 33% 20%
Net Debt 128,955 30% 93,070 24% 39%
Total Equity 212,489 49% 199,088 51% 7%
Dec 31
Financial Ratios 2015 2014
Debt to Equity 0.42 : 0.58 0.39 : 0.61
Net Debt to Equity 0.38 : 0.62 0.32 : 0.68
Return on Equity 0.10 0.10
Debt to EBITDA 4.12 3.83
Interest Coverage Ratio 11.19 8.24
Operating Income to Revenues 0.44 0.42
EBITDA Margin 0.53 0.51
Core Net Income to Revenues 0.29 0.28

31
Revenue SM Prime recorded consolidated revenues of P71.51 billion in the year ended 2015, an increase of 8% from P66.24 billion in the year ended 2014, primarily due to the following: Rent SM Prime recorded consolidated revenues from rent of P40.74 billion in 2015, an increase of 12% from P36.50 billion in 2014. The increase in rental revenue was primarily due to the new malls and expansions opened in 2013, 2014 and 2015, namely, SM Aura Premier, SM City BF Parañaque, Mega Fashion Hall in SM Megamall, SM City Cauayan, SM Center Angono, SM City Bacolod Expansion and SM City San Mateo, with a total gross floor area of 728,000 square meters. Out of the total rental revenues, 87% is contributed by the malls. Excluding the new malls and expansions, same-store rental growth is at 7%. Rent from commercial operations also increased due to the opening of SM Cyber West and Five E-Com Center which enjoy an average occupancy rate of 98%. Also, rentals from hotels and convention centers contributed to the increase due to improvement in average room rates and occupancy rates. Real Estate Sales SM Prime’s real estate sales registered P22.19 billion almost the same level in 2014. The flat performance was attributed to lesser revenue recognition from the completed high-residential projects that were launched in 2010 and 2011. Gross profit of the real estate group slightly improved to 46% from 45% allowing an uptick on net income margin to 22% from 21% the previous year. This allowed the group to post a net income growth of 8% to P5.06 billion from P4.69 billion in 2014. Actual construction of the high-rise condominium projects usually starts twelve months to eighteen months from the launch date and management expect that projects that were successfully sold in 2013 and 2014 should start significantly contributing to overall sales and income beginning 2016 due to the percentage of completion method. Cinema and Event Ticket Sales SM Prime cinema and event ticket sales increased by 12% to P4.80 billion in 2015 from P4.27 billion in 2014. The major blockbusters screened in 2015 were “Avengers – Age of Ultron”, “Jurassic World”, “A Second Chance”, “Fast and Furious 7” and “Star Wars: The Force Awakens”. The major blockbusters shown in 2014 were “Transformers: Age of Extinction”, “The Amazing Spiderman 2”, “Starting Over Again”, “Maleficent” and “Bride for Rent”. Other Revenues Other revenues increased by 14% to P3.79 billion in 2015 from P3.32 billion in 2014. The increase was due to the opening of Sky Ranch Pampanga, increase in hotels’ food and beverages income as well as increase in sponsorship income. Other revenues include amusement income from rides, bowling and ice skating operations, merchandise sales from snackbars and sale of food and beverages in hotels.

32
Costs and Expenses SM Prime recorded consolidated costs and expenses of P40.07 billion in 2015, an increase of 4% from P38.55 billion in 2014, as a result of the following: Costs of Real Estate Consolidated costs of real estate decreased by 2% to P12.04 billion in 2015 from P12.26 billion in 2014. The decrease is the result of improving cost efficiencies, tighter monitoring and control of construction costs. Operating Expenses SM Prime’s consolidated operating expenses increased by 7% to P28.03 billion in 2015 compared to last year’s P26.30 billion. Out of the total operating expenses, 70% is contributed by the malls where same-store mall growth in operating expenses is 3%. Contributors to the increase are administrative expenses, depreciation and amortization, business taxes and licenses and marketing and selling expenses, in line with related increase in revenues as well as the opening of new malls and expansions. Other Income (Charges) Gain on Sale of Available-for-Sale (AFS) Investments In 2015, SM Prime recorded a P7.41 billion realized gain on sale of AFS investments. Interest Expense SM Prime’s consolidated interest expense decreased by 18% to P3.38 billion in 2015 compared to P4.10 billion in 2014 due to the P20.0 billion retail bond availed in September 2014 and new bank loans availed during 2015 for working capital and capital expenditure requirements offset by capitalized interest related to the construction of investment properties. Interest and Dividend Income Interest and dividend income increased by 60% to P1.17 billion in 2015 from P0.73 billion in 2014. This account is mainly composed of dividend and interest income received from cash and cash equivalents, investments held for trading and AFS investments. The increase in interest income is due to higher average balance of cash and cash equivalents in 2015 as compared to last year. The increase in dividend income is due to higher dividends received in 2015 on AFS investments compared to last year. Equity in net earnings of associates and joint ventures SM Prime’s equity in net earnings of associates and joint ventures increased by 78% to P543 million in 2015 from P304 million in 2014 due to increase in net income of associates and joint ventures and 2015 share in net income of OCLP Holdings, Inc. not present in 2014. Provision for income tax SM Prime’s consolidated provision for income tax increased by 26% to P6.02 billion in 2015 from P4.78 billion in 2014 due to the related increase in taxable income.

33
Net income As a result of the foregoing, consolidated net income in the year ended 2015 increased by 54% to P28.30 billion from P18.39 billion in the year ended 2014. Excluding gain on sale of AFS, core net income increased by 14% to P20.89 billion. Balance Sheet Accounts Cash and cash equivalents significantly decreased by 27% from P=35.25 billion to P=25.87 billion as of December 31, 2014 and 2015, respectively, mainly due to payments for capital expenditure projects during the period net of proceeds from the retail bond issuance amounting to P=20.0 billion last November 2015. Investments held for trading decreased by 13% from P=968 million to P=843 million as of December 31, 2014 and 2015, respectively, mainly due to decrease in market prices of the listed shares and scheduled maturities of investments in bonds. Receivables increased by 2% from P=30.69 billion to P=31.35 billion as of December 31, 2014 and 2015, respectively, due to increase in construction accomplishments of sold units and from tenants due to new malls and expansions in 2015. Out of the total receivables, 72% pertains to sale of real estate and 22% from leases of shopping mall and commercial spaces. Condominium and residential units increased by 8% from P=7.58 billion to P=8.16 billion as of December 31, 2014 and 2015, respectively, mainly due to completion of condominium towers in M Place @ South Triangle, Jazz, Mezza II and Shell Residences. Prepaid expenses and other current assets increased by 22% from P=9.29 billion to P=11.30 billion as of December 31, 2014 and 2015, respectively, mainly due to deposits and advances to contractors related to residential projects and various prepayments. Investment properties increased by 20% from P=192.64 billion to P=230.34 billion as of December 31, 2014 and 2015, respectively, primarily because of ongoing new mall projects located in Cagayan de Oro, Cavite City and Bulacan in the Philippines and Tianjin in China and the ongoing expansions of SM Mall of Asia and SM Xiamen. Also, the increase is attributable to landbanking and construction costs incurred for ongoing projects of the commercial and hotel groups namely, Three E-Com Center and Conrad Manila. AFS investments decreased by 31% from P=29.67 billion to P=20.33 billion as of December 31, 2014 and 2015, respectively, mainly due to sale of AFS shares to SM Investments Corporation and lower market prices of remaining listed shares held under this portfolio. Derivative assets increased by 59% from P=1.63 billion to P=2.60 billion as of December 31, 2014 and 2015, respectively, mainly resulting from net fair value changes on a $350 million cross currency swap transaction designated as a cash flow hedge. While derivative liabilities composed of various interest rate swaps amounting to P=59 million as of December 31, 2014 matured in March, June and November 2015.
34
Deferred tax assets increased by 30% from P=650 million to P=846 million as of December 31, 2014 and 2015, respectively, mainly due to NOLCO. Deferred tax liabilities increased by 29% from P=1.93 billion to P=2.49 billion as of December 31, 2014 and 2015, respectively, mainly due to unrealized gross profit on sale of real estate for tax purposes. Investments in associates and joint ventures increased by 265% from P=6.05 billion to P=22.08 billion as of December 31, 2014 and 2015, respectively, mainly due to acquisition of an equity stake in OCLP Holdings, Inc. and increase in equity in net earnings of associates and joint ventures. Other noncurrent assets increased by 19% from P=29.71 billion to P=35.49 billion as of December 31, 2014 and 2015, respectively, mainly due to additional bonds and deposits for real estate acquisitions. Loans payable increased by 75% from P=2.67 billion to P=4.68 billion as of December 31, 2014 and 2015, respectively, due to availment of loans for general corporate purposes. Accounts payable and other current liabilities increased by 7% from P=36.38 billion to P=38.82 billion as of December 31, 2014 and 2015, respectively, mainly due to increase in payable to contractors and customers’ deposits from residential buyers. Long-term debt increased by 19% from P=126.61 billion to P=150.99 billion as of December 31, 2014 and 2015, respectively, due to issuance of bonds in November 2015 and drawdown on an existing loan facility amounting to US$90 million loan last January 2015 to fund capital expenditures and for working capital requirements. Liability for purchased land increased by 78% from P=1.17 billion to P=2.08 billion as of December 31, 2014 and 2015, respectively, due to landbanking. Similarly, other noncurrent liabilities increased by 26% from P=3.78 billion to P=4.75 billion as of December 31, 2014 and 2015, respectively, due to increase in non-trade payable. The Company’s key performance indicators are measured in terms of the following: (1) debt to equity which measures the ratio of interest bearing liabilities to equity; (2) net debt to equity which measures the ratio of interest bearing liabilities net of cash and cash equivalents and investment held for trading to equity; (3) return on equity (ROE) which measures the ratio of net income to capital provided by stockholders; (4) earnings before interest expense, income taxes, depreciation and amortization (EBITDA); (5) debt to EBITDA which measures the ratio of EBITDA to total interest-bearing liabilities; (6) interest coverage ratio which measures the ratio of EBITDA to interest expense; (7) operating income to revenues which basically measures the gross profit ratio; (8) EBITDA margin which measures the ratio of EBITDA to gross revenues and (9) net income to revenues which measures the ratio of net income to gross revenues. The following discuss in detail the key financial indicators of the Company. Interest-bearing debt to equity increased to 0.42:0.58 as of December 31, 2015 from 0.39:0.61 as of December 31, 2014 due to additional borrowings. Likewise, net interest-bearing debt to equity increased to 0.38:0.62 as of December 31, 2015 from 0.32:0.68 as of December 31, 2014 due to additional borrowings net of payments for capital expenditure projects and working capital. In terms of profitability, ROE is steady at 10% as of December 31, 2015 and 2014. Debt to EBITDA increased to 4.12:1 as of December 31, 2015 from 3.83:1 as of December 31, 2014 due to issuance of bonds in November 2015. Interest coverage ratio also increased to 11.19:1 as of December 31, 2015 from 8.24:1 as of December 31, 2014 as a result of decrease in interest expense. EBITDA margin improved to 53% as of December 31, 2015 from 51% as of December 31, 2014.

35
Consolidated operating income to revenues improved to 44% as of December 31, 2015 from 42% as of December 31, 2014. Net income to revenues likewise improved to 29% as of December 31, 2015 from 28% as of December 31, 2014. The Company has no known direct or contingent financial obligation that is material to the Company, including any default or acceleration of an obligation. There were no contingent liabilities or assets in the Company’s balance sheet. The Company has no off-balance sheet transactions, arrangements, obligations during the reporting year as of balance sheet date. There are no known trends, events, material changes, seasonal aspects or uncertainties that are expected to affect the Company’s continuing operations. For the year 2016, the Company expects to incur capital expenditures of at least P60 billion. This will be funded with internally generated funds and external borrowings. SM Prime’s malls business unit has fifty six shopping malls in the Philippines with 7.3 million square meters of gross floor area and six shopping malls in China with 0.9 million square meters of gross floor area. For 2016, SM Prime will open new five malls in the Philippines, as well as expansions of SM City Calamba and SM City Naga. By end 2016, the malls business unit will have 61 malls in the Philippines and six malls in China with an estimated combined gross floor area of 8.6 million square meters. SM Prime currently has twenty seven residential projects in the market, twenty five of which are in Metro Manila and two in Tagaytay. For 2016, SM Prime’s residential unit will launch between 11,000 to 14,000 residential condominium units in total in the cities of Quezon, Bicutan, Sucat, Las Piñas and Pasay. SM Prime is also set to launch new mixed-use developments in Bulacan, Pampanga and Cavite. SM Prime’s Commercial Properties Group has five office buildings with an estimated gross leasable area of 205,000 square meters. Currently, Three E-Com and Four E-Com Centers are under construction and scheduled for completion in 2017 and 2019, respectively. For hotels and convention centers, Conrad Manila in the Mall of Asia Complex in Pasay City is expected to open by second half of 2016.

36
2014 Financial and Operational Highlights (In Million Pesos, except for financial ratios and percentages)
Revenue SM Prime recorded consolidated revenues of P66.24 billion in the year ended 2014, an increase of 11% from P59.79 billion in the year ended 2013, primarily due to the following: Rent SM Prime recorded consolidated revenues from rent of P36.50 billion in 2014, an increase of 13% from P32.20 billion in 2013. The increase in rental revenue was primarily due to the new malls and expansions opened in 2013 and 2014, namely, SM Aura Premier, SM City BF Parañaque, Mega Fashion Hall in SM Megamall, SM City Cauayan and SM Center Angono, with a total gross floor area of 564,000 square meters. Excluding the new malls and expansions, same-store rental growth is at 7%.
Twelve months ended Dec 31
2014 % to
Revenues 2013 % to
Revenues %
Change
Profit & Loss Data
Revenues 66,240 100% 59,794 100% 11%
Costs and expenses 38,554 58% 35,659 60% 8%
Operating Income 27,687 42% 24,136 40% 15%
Net Income 18,390 28% 16,275 27% 13%
EBITDA 33,847 51% 29,927 50% 13%
Dec 31 2014
% to Total Assets
Dec 31 2013
% to Total Assets
% Change
Balance Sheet Data
Total Assets 388,840 100% 335,584 100% 16%
Investment Properties 202,181 52% 171,666 51% 18%
Total Debt 129,283 33% 106,313 32% 22%
Net Debt 93,070 24% 77,132 23% 21%
Total Stockholders' Equity 199,088 51% 163,267 49% 22%
Dec 31
Financial Ratios 2014 2013
Debt to Equity 0.39 : 0.61 0.39 : 0.61
Net Debt to Equity 0.32 : 0.68 0.32 : 0.68
Return on Equity 0.10 0.10
Debt to EBITDA 3.82 3.55
EBITDA to Interest Expense 8.26 8.12
Operating Income to Revenues 0.42 0.40
EBITDA Margin 0.51 0.50
Net Income to Revenues 0.28 0.27

37
Real Estate Sales SM Prime recorded a 7% increase in real estate sales in 2014 from P20.78 billion to P22.15 billion primarily due to increase in sales take-up and higher construction accomplishments of projects launched in 2011 up to 2013 namely, Shell, Green, Shine, Breeze, Grace, Shore, Grass Phase 2 and Trees Residences. Actual construction of projects usually starts within one year from launch date and revenues are recognized in the books based on percentage of completion. Cinema Ticket Sales SM Prime cinema ticket sales significantly increased by 14% to P4.27 billion in 2014 from P3.74 billion in 2013. The increase was due to the showing of local blockbuster movies with sales growth of 30% year-on-year and international movies as well as opening of additional digital cinemas in the new malls and expansions. The major blockbusters screened in 2014 were “Transformers: Age of Extinction,” “The Amazing Spiderman 2,” “Starting Over Again,” “Maleficent,” and “Bride for Rent.” The major blockbusters shown in 2013 were “Ironman 3,” “Man of Steel,” “It Takes a Man and a Woman,” “Thor: The Dark World,” and “My Little Bossing.” Excluding the new malls and expansions, same-store growth in cinema ticket sales is at 10%. Other Revenues Other revenues likewise increased by 8% to P3.32 billion in 2014 from P3.08 billion in 2013. The increase was mainly due to opening of new amusement rides in SM By the Bay in Mall of Asia and Sky Ranch in Tagaytay and in Pampanga, reopening of ice skating rink and bowling center in SM Megamall last January 2014, and increase in sponsorship income and merchandise sales from snackbars. This account is mainly composed of amusement income from rides, bowling and ice skating operations including the Exploreum and SM Storyland, merchandise sales from snackbars and food and beverages from hotels and convention centers. Costs and Expenses SM Prime recorded consolidated costs and expenses of P38.55 billion in the year ended 2014, an increase of 8% from P35.66 billion in the year ended 2013, as a result of the following: Costs of Real Estate Consolidated costs of real estate was P12.26 billion in 2014, representing an increase of 3% from P11.92 billion in 2013 primarily due to costs related to higher recognized real estate sales due to increase in construction accomplishments in 2014. Gross profit margin for residential improved to 45% in 2014 compared to 43% in 2013 as a result of improving cost efficiencies as well as rationalization of expenses. Operating Expenses SM Prime’s consolidated operating expenses increased by 11% to P26.30 billion in 2014 compared to last year’s P23.74 billion. Same-store mall growth in operating expenses is 5% and the balance is mainly attributable to the opening of new malls and expansions. Contributors to the increase are depreciation and amortization, administrative expenses, film rentals, and business taxes and licenses, in line with related increase in revenues as well as the opening of new malls and expansions.

38
Other Income (Charges) Interest Expense SM Prime’s consolidated interest expense increased by 11% to P4.10 billion in 2014 compared to P3.69 billion in 2013 due to new bank loans and the P20.0 billion retail bond availed in 2014 for working capital and capital expenditure requirements. Interest and Dividend Income Interest and dividend income decreased by 33% to P0.73 billion in 2014 from P1.09 billion in 2013. This account is mainly composed of dividend and interest income received from cash and cash equivalents, investments held for trading and available-for-sale investments. The decrease in interest income is due to the pretermination of short-term investments in February 2014 and lower average balance of cash and cash equivalents in 2014 as compared to last year. The decrease in dividend income is due to less dividends received on available-for-sale investments held compared to the same period last year. Other income (charges) - net Other charges – net decreased by 23% to P645 million in 2014 from P833 million in 2013. In 2013, SM Prime incurred restructuring costs amounting to P1.28 billion related to its Reorganization. Provision for income tax SM Prime’s consolidated provision for income tax increased by 20% to P4.78 billion in 2014 from P3.98 billion in 2013. The increase is due to the related increase in taxable income and expiration of income tax holiday incentives in the residential business unit. Net income As a result of the foregoing, consolidated net income for the year ended December 31, 2014 increased by 13% to P18.39 billion from P16.27 billion in the same period last year. Balance Sheet Accounts Cash and cash equivalents significantly increased by 30% from P=27.14 billion to P=35.25 billion as of December 31, 2013 and 2014, respectively. Part of this account still includes portion of the proceeds from the issuance of bonds in September 2014 amounting to P=20.00 billion, the US$210 million loan and the $400 million top-up placement in November 2014 to finance working capital and capital expenditure requirements in 2014. Investments held for trading decreased by 16% from P=1.15 billion to P=0.97 billion as of December 31, 2013 and 2014, respectively, due to scheduled maturities of investment in bonds. Receivables increased by 13% from P=27.18 billion to P=30.69 billion as of December 31, 2013 and 2014, respectively, mainly due to increase in construction accomplishments of sold units as well as new sales for the period. This account also includes rent receivables from leases of shopping mall spaces. Condominium and residential units increased by 24% from P=6.10 billion to P=7.58 billion as of December 31, 2013 and 2014, respectively, mainly due to completion of condominium towers in Blue, Grass Phase 1, Jazz and Sun.
39
Land and development increased by 22% from P=34.82 billion to P=42.46 billion as of December 31, 2013 and 2014, respectively, mainly due to land acquisitions and construction in progress related to residential projects. Prepaid expenses and other current assets increased by 13% from P=9.94 billion to P=11.27 billion as of December 31, 2013 and 2014, respectively, mainly due to deposits and advances to contractors related to residential projects. Investment properties increased by 18% from P=171.67 billion to P=202.18 billion as of December 31, 2013 and 2014, respectively primarily because of ongoing new mall projects located in Cebu City, Cabanatuan and San Mateo in the Philippines and Zibo and Tianjin in China. Also, the increase is attributable to landbanking and construction costs incurred for ongoing projects of the commercial and the hotel group namely, Five E-com and Conrad Hotel Manila. Available-for-sale investments increased by 27% from P=23.37 billion to P=29.67 billion as of December 31, 2013 and 2014, respectively, due to higher market prices of listed shares held under this portfolio. Derivative assets decreased by 8% from P=1.78 billion to P=1.63 billion as of December 31, 2013 and 2014, mainly resulting from net fair value changes on a $350 million cross currency swap transaction designated as a cash flow hedge. Likewise, derivative liabilities decreased by 63% from P=160 million to P=59 million as of December 31, 2013 and 2014, respectively, due to marked-to-market gains on interest rate swaps used to hedge interest rate exposure on loans. Deferred tax assets decreased by 6% from P=691 million to P=650 million as of December 31, 2013 and 2014, respectively, mainly due to MCIT. Deferred tax liabilities decreased by 4% from P=2.02 billion to P=1.93 billion as of December 31, 2013 and 2014, respectively, mainly due to unrealized gross profit on sale of real estate for tax purposes. Other noncurrent assets decreased by 17% from P=29.27 billion to P=24.24 billion as of December 31, 2013 and 2014, respectively, mainly due to subsequent reclassification of deposits for land to land and development. Loans payable decreased by 18% from P=3.25 billion to P=2.67 billion as of December 31, 2013 and 2014, respectively, due to subsequent payments of maturing loans. Accounts payable and other current liabilities decreased by 20% from P=45.30 billion to P=36.38 billion as of December 31, 2013 and 2014, respectively, mainly due to payment of advances. Long-term debt increased by 23% from P=103.06 billion to P=126.61 billion as of December 31, 2013 and 2014, respectively, due to issuance of bonds in September 2014 amounting to P=20.00 billion and the availment of US$210 million loan to fund capital expenditures and for working capital requirements. Tenants’ deposits increased by 29% from P=10.25 billion to P=13.25 billion as of December 31, 2013 and 2014, respectively, due to the new malls and expansions which opened in 2013 and 2014. Likewise, liability for purchased land increased by 5% from P=1.12 billion to P=1.17 billion as of December 31, 2013 and 2014, respectively, due to landbanking. The Company’s key financial indicators are measured in terms of the following: (1) debt to equity which measures the ratio of interest bearing liabilities to stockholders’ equity; (2) net debt to equity which measures the ratio of interest bearing liabilities net of cash and cash equivalents and investment securities to stockholders’ equity; (3) return on equity (ROE) which measures the ratio of net income to capital provided by stockholders; (4) earnings before interest expense, income taxes, depreciation and amortization (EBITDA); (5) debt to EBITDA which measures the ratio of EBITDA to total interest-bearing liabilities; (6) interest coverage ratio which measures the ratio of EBITDA to interest expense; (7) operating income to revenues which basically measures the gross profit ratio; (8) EBITDA margin

40
which measures the ratio of EBITDA to gross revenues and (9) net income to revenues which measures the ratio of net income to gross revenues. The following discuss in detail the key financial indicators of the Company. Interest-bearing debt to stockholders’ equity is steady at 0.39:0.61 as of December 31, 2014 and 2013. Similarly, net interest-bearing debt to stockholders’ equity was also unchanged at 0.32:0.68 as of December 31, 2014 and 2013 in spite of the increase in long-term debt in 2014, due to the $400 million top-up placement last November 2014. In terms of profitability, ROE is steady at 10% as of December 31, 2014 and 2013. Debt to EBITDA slightly increased to 3.82:1 as of December 31, 2014 from 3.55:1 as of December 31, 2013, while interest coverage ratio increased to 8.26:1 as of December 31, 2014 from 8.12:1 as of December 31, 2013 as a result of the new loans availed in 2014. EBITDA margin improved to 51% as of December 31, 2014 from 50% as of December 31, 2013. Consolidated operating income to revenues improved to 42% as of December 31, 2014 from 40% as of December 31, 2013. Net income to revenues likewise improved at 28% as of December 31, 2014 from 27% as of December 31, 2013. The Company has no known direct or contingent financial obligation that is material to the Company, including any default or acceleration of an obligation. There were no contingent liabilities or assets in the Company’s balance sheet. The Company has no off-balance sheet transactions, arrangements, obligations during the reporting year as of balance sheet date. There are no known trends, events, material changes, seasonal aspects or uncertainties that are expected to affect the company’s continuing operations. For the year 2015, the Company expects to incur capital expenditures of approximately P70 billion. This will be funded with internally generated funds and external borrowings. SM Prime’s mall business unit has fifty shopping malls in the Philippines with 6.5 million square meters of gross floor area and five shopping malls in China with 0.8 million square meters of gross floor area. For 2015, the mall business unit will open four new malls, located in Sangandaan, Cabanatuan and San Mateo in the Philippines and Zibo in China, as well as expansions of SM City Iloilo and SM City Lipa. By end 2015, the mall business unit will have 53 malls in the Philippines and six in China with an estimated combined gross floor area of 7.8 million square meters. SM Prime currently has twenty five residential projects in the market, twenty three of which are in M\ etro Manila and two in Tagaytay. For 2015, SM Prime is launching five new projects and five expansions of existing towers in Metro Manila and in Tagaytay, equivalent to about 19,000 additional units. SM Prime’s Commercial Properties Group has four office buildings with an estimated gross leasable area of 122,000 square meters and is currently constructing Three E-com Center scheduled for opening in 2016. Five E-com Center is targeted for completion by the first quarter of 2015 For hotels and convention centers, Park Inn by Radisson Clark in Pampanga and Conrad Hotel Manila in the Mall of Asia Complex in Pasay are expected to open in the last quarter of 2015.

41
2013 Financial and Operational Highlights (In Million Pesos, except for financial ratios and percentages) Twelve months ended Dec 31
2013 % to
Revenues 2012 % to
Revenues %
Change
Profit & Loss Data
Revenues 59,794 100% 57,215 100% 5%
Costs and expenses 35,659 60% 35,145 61% 1%
Operating Income 24,136 40% 22,070 39% 9%
Net Income 16,275 27% 16,203 28% 0%
EBITDA 30,116 50% 27,197 48% 11%
Dec 31 2013
% to Total Assets
Dec 31 2012
% to Total Assets
% Change
Balance Sheet Data
Total Assets 335,584 100% 284,652 100% 18%
Investment Properties 171,666 51% 147,854 52% 16%
Total Debt 106,313 32% 80,580 28% 32%
Net Debt 77,132 23% 56,121 20% 37%
Total Stockholders' Equity 163,267 49% 147,628 52% 11%
Dec 31
Financial Ratios 2013 2012
Debt to Equity 0.39 : 0.61 0.35 : 0.65
Net Debt to Equity 0.32 : 0.68 0.28 : 0.72
Return on Equity 0.10 0.12
Debt to EBITDA 3.53 2.96
EBITDA to Interest Expense 8.17 8.87
Operating Income to Revenues 0.40 0.39
EBITDA Margin 0.50 0.48
Net Income to Revenues 0.27 0.28
Debt Service Coverage Ratio 2.15 1.09 Revenue
SM Prime recorded consolidated revenues of P59.79 billion in the year ended 2013, an increase of 5% from P57.22 billion in the year ended 2012 , primarily due to the following: Rent
SM Prime recorded consolidated revenues from rent of P32.20 billion in 2013, an increase of 11% from P28.95 billion in 2012. The increase in rental revenue was primarily due to the full-year effect of new malls opened in 2012, namely, SM City Olongapo, SM City Consolacion, SM City San Fernando, SM City General Santos, SM Lanang Premier and the opening in 2013 of SM Aura Premier, with a total gross floor area of 698,000 sq. m.. Excluding the new malls and expansions, same-store rental growth is at 7%. Rent from commercial operations also increased, primarily as a result of full year recognition of Two-Ecom, which began operations in mid-2012 and is now 98% occupied.

42
Real Estate Sales
SM Prime recorded an 8% decrease in real estate sales in 2013 to P20.78 billion from P22.58 billion in 2012. The decrease in real estate sales is primarily due to lower sales take up of projects in 2013 compared to last year. This is attributable to project launches in 2010 and 2011 which were more “blockbusters” namely, Shell, Green and Jazz compared to launches in 2012 of Breeze and Grace. Sale of projects launched in 2013 were towards the last quarter already which is expected to contribute significantly to revenues starting in 2014. Three projects were launched in 2013 namely, Grass Phase 2, Shore and Trees. Cinema Ticket Sales SM Prime cinema ticket sales increased by 8% to P3.74 billion in 2013 from P3.48 billion in 2012. The increase was primarily the result of opening of additional digital cinemas at the new malls which enabled simultaneous nationwide releases and more blockbuster movies screened, both local and international. The major blockbusters shown in 2013 were “Ironman 3,” “Man of Steel,” “It Takes a Man and a Woman,” “Thor: The Dark World,” and “My Little Bossing.” Other Revenues
Other revenues likewise increased by 40% to P3.08 billion in 2013 from P2.21 billion in 2012. The increase was mainly due to opening of new amusement rides in SM by the Bay and the Sky Ranch in Tagaytay and increase in advertising income and sponsorship revenues.
Costs and Expenses
SM Prime recorded consolidated costs and expenses of P35.66 billion in the year ended 2013, an increase of 1% from P35.15 billion in the year ended 2012 , primarily due to the following: Costs of Real Estate
Consolidated costs of real estate was P11.92 billion in 2013, representing a decrease of 15% from P13.97 billion in 2012. Apart from the lower recognized real estate costs in line with the lower recognized real estate sales in 2013, the decrease also resulted from tighter cost controls during project engineering stage and stricter monitoring of project costs implemented in 2013, which resulted in improved gross margins. Gross profit margins for residential improved to 43% in 2013 compared to 38% in 2012.
Operating Expenses
SM Prime’s consolidated operating expenses increased by 12% to P23.74 billion in 2013 compared to last year’s P21.17 billion. Same-store mall growth in operating expenses is 4%. The increase is attributable to the opening of new malls and expansions, full year operations of commercial properties and launch of new residential projects.
Consolidated marketing and selling expenses increased to P2.05 billion in 2013, an increase of 16% from P1.76 billion in 2012 due to launch expenses related to new mall openings and mall events, which were partially offset by a reduction in expenses related to SM Residences showrooms and exhibits, out-of-home and media-based advertising, as part of SMDC’s overall rationalization of its cost structure.
Other contributors to the increase are business taxes and licenses, depreciation and amortization, and rent expenses, due to the opening of new malls and expansions, commercial properties and residential projects.

43
Other Income (Charges)
Interest Expense
SM Prime’s consolidated interest expense increased by 20% to P3.69 billion in 2013 compared to P3.06 billion in 2012 due to new bank loans availed during 2013 for working capital and capital expenditure requirements.
Restructuring Costs
SM Prime incurred restructuring costs amounting to P1.28 billion in 2013. This pertains to actual payments and accrual of transaction costs related to the Reorganization.
Interest and Dividend Income
Interest and dividend income increased slightly by 3% to P1.09 billion in 2013 from P1.06 billion in 2012. This account is mainly composed of dividend and interest income received from investments held for trading, available-for-sale investments and cash and cash equivalents.
Net income
As a result of the foregoing, consolidated net income is flat at P16.27 billion in 2013. Excluding restructuring costs of P1.28 billion, net income would have increased by 8% for the twelve months ended December 31, 2013.
Balance Sheet Accounts
Cash and cash equivalents significantly increased by 27% from P=21.30 billion to P=27.14 billion as of December 31, 2012 and 2013, respectively. This account includes the remaining proceeds from short-term and long-term debt drawn in 2013 which will be used for working capital and capital expenditure requirements.
Investments held for trading decreased by 14% from P=1.34 billion to P=1.15 billion as of December 31, 2012 and 2013, respectively, mainly due to pretermination of investment in corporate bonds with an original maturity of 2016. Receivables increased by 59% from P=17.15 billion to P=27.18 billion as of December 31, 2012 and 2013, respectively, mainly due to increase in sales of real estate and rental receivables. Condominium and residential units significantly increased by 105% from P=2.97 billion to P=6.10 billion as of December 31, 2012 and 2013, respectively, mainly due to transfers of costs of completed condominium towers to inventory coming from Field, Grass Phase 1, Jazz, Light, MPST, Princeton, Sun and Wind. Likewise, land and development increased by 8% from P=32.28 billion to P=34.82 billion as of December 31, 2012 and 2013, respectively, mainly due to cumulative construction costs incurred for residential developments including land banking activities. Available-for-sale investments slightly decreased by 4% from P=24.30 billion to P=23.37 billion as of December 31, 2012 and 2013, respectively, mainly due to early redemption of investment in corporate notes amounting to P=1.0 billion at par last May 2013. Investment properties increased by 16% from P=147.85 billion to P=171.67 billion as of December 31, 2012 and 2013, respectively, primarily because of ongoing new mall projects located in Cauayan City, Cebu City in the Philippines and Zibo and Tianjin in China. Expansions and renovations in SM Megamall which was recently opened last January 28, 2014, SM City Bacolod, SM City Sta. Rosa, SM City Lipa, SM City Clark and SM City Dasmariñas are also in progress. The increase is also
44
attributable to the acquisition of additional land bank and construction costs incurred for ongoing projects of the commercial and the hotel group namely, Five-Ecom, SM Cyberwest and Conrad Hotel. Derivative assets significantly increased from P=109.98 million as of December 31, 2012 to P=1,778.81 million as of December 31, 2013, mainly resulting from unrealized mark-to-market gains on a $350 million cross currency swap transaction designated as a cash flow hedge and the outstanding interest rate swaps designated as fair value hedges. On the other hand, derivative liabilities decreased by 35% from P=244.33 million as of December 31, 2012 to P=159.97 million as of December 31, 2013, due to mark-to-market gains on interest rate swaps used to hedge interest rate exposure on loans. Deferred tax assets significantly increased from P=0.49 billion to P=0.69 billion as of December 31, 2012 and 2013, respectively, mainly resulting from the SM Property group restructuring transaction. Other noncurrent assets increased by 30% from P=22.43 billion to P=29.27 billion as of December 31, 2012 and 2013, respectively, mainly due to investment in associates and deposits for acquisition of properties. This account also includes noncurrent capitalized input tax, deposits to contractors, suppliers and advances and deposits paid for leased properties. Loans payable decreased from P=8.97 billion to P=3.25 billion as of December 31, 2012 and 2013, respectively, due to subsequent payments of maturing loans. The increase in accounts payable and other current liabilities by 32% from P=34.40 billion to P=45.30 billion as of December 31, 2012 and 2013, respectively, is mainly due to payables to mall and residential contractors and suppliers related to ongoing projects and accrued operating expenses. Long-term debt increased by 44% from P=71.61 billion to P=103.06 billion as of December 31, 2012 and 2013, mainly to fund capital expenditures and for working capital requirements. The increase in tenants’ deposits by 14% from P=8.97 billion to P=10.25 billion as of December 31, 2012 and 2013, respectively, is due to the new malls and expansions which opened in 2012 and 2013. On the other hand, liability for purchased land decreased from P=4.20 billion to P=1.12 billion as of December 31, 2012 and 2013, respectively, due to subsequent payments. The Company’s key financial indicators are measured in terms of the following: (1) debt to equity which measures the ratio of interest bearing liabilities to stockholders’ equity; (2) net debt to equity which measures the ratio of interest bearing liabilities net of cash and cash equivalents and investment securities to stockholders’ equity; (3) debt service coverage ratio (DSCR) which measures the ratio of annualized operating cash flows to loans payable excluding condominium, residential units for sale and club shares and land and development, current portion of long-term debt and interest expense, excluding the portion of debt which are fully hedged by cash and cash equivalents and temporary investments; (4) return on equity (ROE) which measures the ratio of net income to capital provided by stockholders; (5) earnings before interest, income taxes, depreciation and amortization (EBITDA); (6) debt to EBITDA which measures the ratio of EBITDA to total interest-bearing liabilities; (7) EBITDA to interest expense which measures the ratio of EBITDA to interest expense; (8) operating income to revenues which basically measures the gross profit ratio; (9) EBITDA margin which measures the ratio of EBITDA to gross revenues and (10) net income to revenues which measures the ratio of net income to gross revenues. The following discuss in detail the key performance indicators of the Company. Interest-bearing debt to stockholders’ equity increased to 0.39:0.61 from 0.35:0.65 as of December 31, 2013 and 2012, respectively, while net interest-bearing debt to stockholders’ equity also increased to 0.32:0.68 from 0.28:0.72 as of December 31, 2013 and 2012, respectively, due to the additional borrowings. Debt service coverage ratio increased to 2.15:1 from 1.09:1 for the years ended December 31, 2013 and 2012, respectively, due to higher operating cash flows in 2013 compared to 2012.

45
In terms of profitability, ROE decreased to 10% from 12% for the years ended December 31, 2013 and 2012, respectively, due to restructuring costs. Excluding the one-time restructuring costs, ROE would have been 11% in the year ended 2013. EBITDA increased by 11% to P=30.12 billion in 2013 from P=27.20 billion in 2012. Debt to EBITDA increased to 3.53:1 from 2.96:1 as of December 31, 2013 and 2012, respectively, due to increase in long-term debt. While EBITDA to interest expense decreased to 8.17:1 from 8.87:1 for the years ended December 31, 2013 and 2012, respectively, due to higher interest expense in 2013. EBITDA margin improved at 50% from 48% for the years ended December 31, 2013 and 2012, respectively. Consolidated operating income to revenues remains steady at 40% and 39% for the years ended December 31, 2013 and 2012. Net income to revenues is steady at 27% and 28% for the years ended December 31, 2013 and 2012. The Company has no known direct or contingent financial obligation that is material to the Company, including any default or acceleration of an obligation. There were no contingent liabilities or assets in the Company’s balance sheet. The Company has no off-balance sheet transactions, arrangements, obligations during the reporting year as of balance sheet date. There are no known trends, events, material changes, seasonal aspects or uncertainties that are expected to affect the company’s continuing operations. For the year 2014, the Company expects to incur capital expenditures of approximately P71 billion. This will be funded with internally generated funds and external borrowings. As of December 2013, SM Prime has twenty two residential projects in the market, twenty one of which are in Metro Manila and one in Tagaytay. For this year, SM Prime is launching four new projects and four expansions of existing towers all in Metro Manila, except Wind in Tagaytay. SM Prime’s mall business unit has forty eight shopping malls in the Philippines with 6.2 million sq. m. of gross floor area and five shopping malls in China with 0.8 million sq. m. of gross floor area. For the rest of 2014, the mall business unit will open three new malls, located in Cauayan and Angono in the Philippines and Zibo in China, as well as expansion of four existing malls. By end 2014, the mall business unit will have an estimated 7.5 million sq. m. of gross floor area.

46
ITEM 7. Financial Statements Please see the attached consolidated financial statements and schedules listed in the accompanying Index to Financial Statements and Supplementary Schedules. ITEM 8. Information on Independent Accountant and Other Related Matters SGV & Co. is the external auditor for 2015. The same external auditor was recommended for re-appointment by the Audit and Risk Management Committee at the scheduled Annual Stockholders’ Meeting in 2016. Representatives of the said firm are expected to be present at the stockholders’ meeting and they will have the opportunity to make a statement if they desire to do so and are expected to be available to respond to appropriate questions. The Audit and Risk Management Committee recommends to the Board of Directors the appointment of the external auditor and the fixing of the audit fees. The Board of Directors and the stockholders approve the Committee’s recommendation. Under the Charter of the Audit and Risk Management Committee, part of the Committee's authority is to pre-approve all auditing and non-audit services, as well as to resolve any disagreements between management and the external auditors regarding financial reporting. The Committee reviews the external auditor's proposed audit scope and approach, including coordination of audit effort with internal audit. The Manual on Corporate Governance provides that the Committee shall pre-approve all audit plans, scope and frequency one month before the conduct of external audit. The Committee also evaluates the performance of the external auditor and approves the appointment or discharge of the external auditor. The Committee further reviews the independence of the external auditor and meets with the latter separately to discuss any matters that either party believes should be discussed privately. Pursuant to SRC Rule 68, Paragraph 3(b) (iv) and (ix) (Rotation of External Auditors) which states that the signing partner shall be rotated after every five (5) years of engagement with a two-year cooling off period for the re-engagement of the same signing partner, the Company engaged Mr. Ramon D. Dizon of SGV & Co. starting year 2009 and Ms. Belinda T. Beng Hui of SGV & Co. starting year 2011. The Company and its subsidiaries paid SGV & Co. P=9.0 million and P=8.0 million for external audit services for the years 2015 and 2014, respectively. In 2015, SGV & Co. did the review of the Interim Condensed Consolidated Financial Statements as at June 30, 2015 and for the six-month periods ended June 30, 2015 and 2014. In 2014, SGV & Co. did the review of the Interim Condensed Consolidated Financial Statements as at March 31, 2014 and for the three-month periods ended March 31, 2014 and 2013. There were no other significant professional services rendered by SGV & Co. during the period. Tax consultancy services are secured from entities other than the external auditor.
47
PART III- CONTROL AND COMPENSATION INFORMATION ITEM 9. Directors and Executive Officers of the Registrant DIRECTORS AND EXECUTIVE OFFICERS
Office Name Citizenship Age Chairman Emeritus Henry Sy, Sr. Filipino 91 Chairman Henry T. Sy, Jr. Filipino 62 Vice Chairman and Independent Director Jose L. Cuisia, Jr. Filipino 72 Independent Director Gregorio U. Kilayko Filipino 61 Independent Director Joselito H. Sibayan Filipino 57 Director and President Hans T. Sy Filipino 60 Director Herbert T. Sy Filipino 59 Director Jorge T. Mendiola Filipino 56 Adviser to the Board of Directors Teresita T. Sy Filipino 65 Adviser to the Board of Directors Elizabeth T. Sy Filipino 63 Corporate Secretary/Alternate Compliance
Officer Elmer B. Serrano Filipino 48
Assistant Corporate Secretary Marianne M. Guerrero Filipino 52 Executive Vice President/Corporate Information
Officer Jeffrey C. Lim Filipino 54 Chief Finance Officer/Compliance Officer John Nai Peng C. Ong Filipino 45 Vice President – Internal Audit Christopher S. Bautista Filipino 56 Head, Malls Anna Maria S. Garcia Filipino 60 Head, Residential (Primary) Jose Mari H. Banzon Filipino 55 Head, Residential (Leisure) Shirley C. Ong Filipino 54 Head, Commercial Dave L. Rafael Filipino 57 Head, Hotels and Convention Centers Ma. Luisa E. Angeles Filipino 57
Board of Directors Henry Sy, Sr. is the Chairman Emeritus of the Board of Directors of SMPH. He was the Chairman of the Board of Directors of SMPH since 1994 until April 2014. He is the founder of the SM Group and is currently, Chairman of SM Investments Corporation (SMIC) and Highlands Prime, Inc. (HPI). He is likewise Chairman Emeritus of BDO Unibank, Inc. and Honorary Chairman of China Banking Corporation. He opened the first ShoeMart store in 1958 and has been at the forefront of SM Group’s diversification into the commercial centers, retail merchandising, financial services, and real estate development and tourism businesses. Mr. Sy earned his Associate of Arts Degree in Commerce Studies at Far Eastern University and was conferred an Honorary Doctorate in Business Management by De La Salle University. Henry T. Sy, Jr. has served as Director since 1994. He is responsible for the real estate acquisitions and development activities of the SM Group which include the identification, evaluation and negotiation for potential sites as well as the input of design ideas. At present, he is Vice Chairman of SMIC, Chairman and Chief Executive Officer of SM Development Corporation (SMDC), Vice Chairman and President of HPI, Chairman of Pico de Loro Beach and Country Club Inc. and President of The National Grid Corporation of the Philippines. He graduated with a management degree from De La Salle University. Jose L. Cuisia, Jr.* has served as Vice Chairman of the Board of Directors of SMPH since 1994. In 2011, he took his official diplomatic post as Ambassador Extraordinary and Plenipotentiary to the United States of America. He was the former President and Chief Executive Officer of the Philippine American Life and General Insurance Company. Previously, he served as Governor of the Bangko Sentral ng Pilipinas from 1990 to 1993 and Administrator of the Social Security System from 1986 to

48
1990. He graduated with a Bachelor’s Degree in Commerce from De La Salle University and took his MBA at the prestigious Wharton School of the University of Pennsylvania. He was awarded the “Joseph Wharton Award for Lifetime Achievement” by the prestigious Wharton Club of Washington, DC in May 2011, and was conferred the Lifetime Contributor Award (public sector) by the Asia CEO Forum in 2015 and the Order of the Sikatuna with the rank of Grand Cross by President Benigno Aquino III in 2016. Gregorio U. Kilayko* is the former Chairman of ABN Amro’s banking operations in the Philippines. He was the founding head of ING Baring’s stockbrokerage and investment banking business in the Philippines and a Philippine Stock Exchange Governor in 1996 and 2000. He was a director of the demutualized Philippine Stock Exchange in 2003. He took his MBA at the Wharton School of the University of Pennsylvania. He was elected as an Independent Director in 2008. Joselito H. Sibayan* has spent the past 28 years of his career in investment banking. From 1987 to 1994, and after taking his Master of Business Administration (MBA) from University of California in Los Angeles, he was Head of International Fixed Income Sales at Deutsche Bank in New York and later moved to Natwest Markets to set up its International Fixed Income and Derivatives Sales/Trading operation. He then moved to London in 1995 to run Natwest Market’s International Fixed Income Sales Team. He is currently the President and CEO of Mabuhay Capital Corporation (MC2), an independent financial advisory firm. Prior to forming MC2 in 2005, he was Vice Chairman, Investment Banking - Philippines and Country Manager for Credit Suisse First Boston (CSFB). He helped establish CSFB's Manila representative office in 1998, and later oversaw the transition of the office to branch status. He was elected as an Independent Director in 2011. * Independent director – The Independent Directors of the Company are Messrs. Jose L. Cuisia, Jr.,
Gregorio U. Kilayko and Joselito H. Sibayan. The Company has complied and will comply with the Guidelines set forth by Securities Regulation Code (SRC) Rule 38, as amended, regarding the Nomination and Election of Independent Directors. The Company’s By-Laws incorporate the procedures for the nomination and election of independent director/s in accordance with the requirements of the said Rule.
Hans T. Sy has served as Director since 1994 and as President since 2004. He has held key positions in businesses related to banking, real estate development, mall operations, as well as leisure and entertainment. In the SM Group, his other current positions include Adviser to the Board of SM Investments Corporation, Chairman of China Banking Corporation, and Chairman of National University. Mr. Sy is a B.S. Mechanical Engineering Graduate of De La Salle University. Herbert T. Sy has served as Director since 1994. He is an Adviser to the Board of SMIC and is currently the Vice Chairman of Supervalue Inc., Super Shopping Market Inc. and Sanford Marketing Corporation and Director of China Banking Corporation. He also holds board positions in several companies within the SM Group. He has worked with SM Group Companies for more than 30 Years, engaged in food retailing, rubber manufacturing, car service and car accessories and banking. He is actively involved in the SM Group's Supermarket Operations, which include acquisition, evaluation and negotiation for potential sites. He holds a Bachelor’s degree in management from De La Salle University. Jorge T. Mendiola was elected as a Director in December 2012. He is currently the President of SM Retail, Inc. He started his career with The SM Store as a Special Assistant to the Senior Branch Manager in 1989 and rose to become the President in 2011. He is also the Vice Chairman for Advocacy of the Philippine Retailers Association. He received his Master in Business Management from the Asian Institute of Management and has an A.B. Economics degree from Ateneo de Manila University.

49
Teresita T. Sy has served as an Adviser to the Board since May 2008. She was a Director from 1994 up to April 2008. She has worked with the Group for over 20 years and has varied experiences in retail merchandising, mall development and banking businesses. A graduate of Assumption College, she was actively involved in ShoeMart’s development. At present, she is Chairperson of BDO Unibank, Inc. and Vice Chairperson of SMIC. She also holds board positions in several companies within the SM Group. Elizabeth T. Sy was elected as an Adviser to the Board in April 2012. She serves as a member of the Executive Committee and Trust Committee of the Board of Directors of BDO Private Bank, Inc. She is also the Chairperson and President of SM Hotels and Convention Corporation where she steers SM’s continuous growth in the tourism, leisure and hospitality industry. Ms. Sy likewise serves as Adviser to the Board of SM Investments Corporation and Co-Chairperson of Pico De Loro Beach and Country Club. She graduated with a degree in Business Administration from Maryknoll College. Members of the Board of Directors are given a standard per diem of P10,000 per Board meeting, except for the Chairman and Vice Chairman which are given P20,000 per Board meeting. Elmer B. Serrano is the Corporate Secretary of the SMPH and of SMIC since November 2014. He is Name Partner of the law firm of Martinez Vergara Gonzalez & Serrano and has been practicing law for over two decades. Atty. Serrano is currently the Corporate Information Officer of BDO Unibank, Inc. He is also the Corporate Secretary of Premium Leisure Corporation, Premium Leisure Amusement Incorporation, Crown Equities, Inc. and its subsidiaries, BDO Capital & Investment Corporation, BDO Securities Corporation, BDO Insurance Brokers, Inc., and Averon Holding Corporation. He was previously a director of OCLP Holdings, Inc. until November 2014. He is a graduate of the Ateneo Law School and holds a degree of B.S. Legal Management from the Ateneo de Manila University. Marianne M. Guerrero is the Senior Vice President and Head of the Legal Department of SMIC. She is likewise the currently appointed Assistant Corporate Secretary and Alternate Compliance Officer of SMIC. Apart from her roles in SMIC , she is also the Assistant Corporate Secretary and Alternate Corporate Information Officer of SMPH. Prior to joining the SM Group, she was Senior Vice President and Legal Head of United Overseas Bank Philippines. She took her law degree from the Ateneo School of law, and her college degree was from De La Salle University. Executive Officers Jeffrey C. Lim is the Executive Vice President of SMPH and a member of its Executive Committee, as well as the President of SMDC. He is a Director of Pico de Loro Beach and Country Club Inc. and holds various board and executive positions in other SMPH’s subsidiaries. He is a member of the Management Board of the Asia Pacific Real Estate Association. He is a Certified Public Accountant and holds a Bachelor of Science degree in Accounting from the University of the East. Prior to joining the Company in 1994, he worked for a multi-national company and SGV & Co. John Nai Peng C. Ong is the Chief Finance Officer, Compliance Officer and a member SMPH’s Executive Committee. He holds various board and executive positions in other SMPH’s subsidiaries. He is a Certified Public Accountant and holds a Bachelor of Science degree in Accounting from Ateneo de Zamboanga University. He received his Master in Management from the Asian Institute of Management. Prior to joining the Company in 2014, he was an assurance partner in SGV & Co. Christopher S. Bautista is the Vice President for Internal Audit (Chief Audit Executive). Prior to joining the Company in 1998, he was the Chief Finance Officer of a large palm oil manufacturer based in Jakarta, Indonesia and was a partner (principal) for several years of an audit and management consulting firm based also in Jakarta. He started his professional career as staff auditor of SGV & Co.

50
Anna Maria S. Garcia is the Business Unit Head for Malls as President of Shopping Center Management Corp. (SCMC) since 2006. She is the Chairman of Mercantile Stores Group Inc., Chief Executive Officer of Henfels Investments Inc., Board of Director of the Gifts and Graces Fair Trade Foundation Inc. and a member of International Council of Shopping Centers and Philippine Retailers Association of the Philippines. She graduated from University of the Philippines with a degree of BS Foreign Service. Prior to joining SCMC in 1998, she worked as Assistant Vice-President for Department Store Operations, SM Inc. Jose Mari H. Banzon is the Business Unit Head for Residential (Primary). He holds a Bachelor of Arts degree in Economics and a Bachelor of Science degree in Management of Financial Institutions from De La Salle University. Prior to joining SMDC in 2013, he was executive vice president and general manager of Federal Land, Inc. He had also worked in the corporate banking department of various financial institutions in the Philippines and Hong Kong. Shirley C. Ong is the Business Unit Head for Residential (Leisure) since 2013. She was the Senior Vice President for Operations of Highlands Prime, Inc. from 2010 to 2013. She is also the Director of the Midlands Golf and Country Club. Before joining the Company, she was First Vice President for Business Development of Filinvest Alabang, Inc from 1995 to 2009. She brings with her over 26 years of experience, 21 years of which has been in various areas of real estate from city development, office/residential, high rise development, residential village development including finance, marketing, sales and property management. She graduated cum laude with a bachelor’s degree in Arts, Major in Economics from the University of Sto. Tomas and is a candidate for Masters in Economics at the Institute of Economics Policy Research of the University of Asia & Pacific. Dave L. Rafael is the Business Unit Head for Commercial. He has a Bachelor of Arts degree from the Ateneo de Manila University and an MBA from the Colgate Darden School of Business Administration, University of Virginia. Prior to joining the Company in 2009, he was with Ayala Land for 21 years holding various positions in shopping center operations, project development, marketing and local and international sales. Ma. Luisa E. Angeles is the Business Unit Head for Hotels and Convention Centers. She is the Senior Vice President for Operations of SM Hotels and Conventions Corporation since 2014. She holds a Bachelor of Science degree in Hotel and Restaurant Administration from the University of the Philippines. She has 34 years of work expertise in the hotel management industry specifically in sales and marketing. She was with EDSA Shangri-La, Shangri-La Bangkok and Shangri-La Hotel International Management, Ltd. holding various positions for 24 years. Prior to that, she rendered 10 years of service to Hyatt Regency Manila and Hyatt Terraces Baguio. The Directors of the Company are elected at the Annual Stockholders’ Meeting to hold office until the next succeeding annual meeting and until their respective successors have been elected and qualified. The Directors possess all the qualifications and none of the disqualifications provided for in the SRC and its Implementing Rules and Regulations. Procedure for Nomination of Directors:
� A stockholder of record, including a minority stockholder, entitled to notice of and to vote at the regular or special meeting of the stockholders for the election of directors shall be qualified to be nominated a director of SMPH (Section 2, Article III, SMPH By-Laws).
� The Nomination Committee meets, pre-screens and checks the qualifications of and deliberates on all persons nominated to be elected to the Board of Directors of SMPH from the pool of candidates submitted by the nominating stockholders in accordance with the provisions of SMPH’s By-Laws and Manual of Corporate Governance. The Nomination Committee shall prepare a Final List of Candidates from those who have passed the Guidelines, Screening Policies and Parameters for the nomination of directors. Said list shall

51
contain all the information about these nominees. Only nominees qualified by the Nomination Committee and whose names appear on the Final List of Candidates shall be eligible for election as Director. No other nomination shall be entertained after the Final List of Candidates shall have been prepared. No further nomination shall be entertained or allowed on the floor during the actual annual stockholders’ meeting.
� In case of resignation, disqualification or cessation of independent directorship and only after
notice has been made with the Commission within five (5) days from such resignation, disqualification or cessation, the vacancy shall be filled by the vote of at least a majority of the remaining directors, if still constituting a quorum, upon the nomination of the Nomination Committee; otherwise, said vacancies shall be filled by stockholders in a regular or special meeting called for that purpose. An Independent Director so elected to fill a vacancy shall serve only for the unexpired term of his or her predecessor in office.
All new directors undergo an orientation program soon after date of election. This is intended to familiarize the new directors on their statutory/fiduciary roles and responsibilities in the Board and its Committees, SMPH’s strategic plans, enterprise risks, group structures, business activities, compliance programs, Code of Business Conduct and Ethics, Insider Trading Policy and Corporate Governance Manual. All directors are also encouraged to participate in continuing education programs at SMPH’s expense to promote relevance and effectiveness and to keep them abreast of the latest developments in corporate directorship and good governance. Aside from the Directors and Executive Officers enumerated above, there are no other employees expected to hold significant executive/officer position in the Company. The following are directorships held by Directors and Executive Officers in other reporting companies at least, in the last five years: Henry Sy, Sr.
Name of Corporation Position SM Investments Corporation. ........................................ Chairman China Banking Corporation. .......................................... Honorary Chairman BDO Unibank, Inc... ...................................................... Chairman Emeritus
Henry T. Sy, Jr.
Name of Corporation Position SM Investments Corporation .......................................... Vice Chairman
Jose L. Cuisia, Jr.
Name of Corporation Position PHINMA Corporation. ................................................. Regular Director Holcim Philippines, Inc..... ........................................... Regular Director Manila Water Company, Inc... ...................................... Independent Director

52
Gregorio U. Kilayko Name of Corporation Position Belle Corporation... ......................................................... Independent Director
Joselito H. Sibayan
Name of Corporation Position Apex Mining Corporation. .............................................. Independent Director
Hans T. Sy
Name of Corporation Position China Banking Corporation ............................................ Chairman SM Investments Corporation. ......................................... Adviser to the Board
Herbert T. Sy
Name of Corporation Position China Banking Corporation ........................................... Director SM Investments Corporation ......................................... Adviser to the Board
Teresita T. Sy
Name of Corporation Position BDO Unibank, Inc. ........................................................ Chairperson SM Investments Corporation. ......................................... Vice Chairperson
Elizabeth T. Sy
Name of Corporation Position SM Investments Corporation... ....................................... Adviser to the Board
The members of the Audit and Risk Management Committee are:
JOSE L. CUISIA, JR. - Chairman (Independent Director) GREGORIO U. KILAYKO - Member (Independent Director) JOSELITO H. SIBAYAN - Member (Independent Director) JORGE T. MENDIOLA - Member
The members of the Compensation Committee are: GREGORIO U. KILAYKO - Chairman (Independent Director) JOSELITO H. SIBAYAN - Member (Independent Director) HANS T. SY - Member
The members of the Nomination Committee are:
JOSELITO H. SIBAYAN - Chairman (Independent Director) JOSE L. CUISIA, JR. - Member (Independent Director) GREGORIO U. KILAYKO - Member (Independent Director)
53
The Nomination Committee with the confirmation of the Board under its Corporate Governance Manual have qualified the following for election to the Board of Directors at the 2016 Annual Stockholders’ Meeting: Henry T. Sy, Jr. - Chairman Jose L. Cuisia, Jr. - Vice-Chairman (Independent Director) Gregorio U. Kilayko - Independent Director Joselito H. Sibayan - Independent Director Hans T. Sy - Director Herbert T. Sy - Director Jorge T. Mendiola - Director Jeffrey C. Lim - Director Ms. Linda Panutat nominated to the Board for inclusion in the Final List of Candidates for Independent Directors the following stockholders: Jose L. Cuisia, Jr. Gregorio U. Kilayko Joselito H. Sibayan Ms. Linda Panutat is not related to Jose L. Cuisia, Jr., Gregorio U. Kilayko and Joselito H. Sibayan. The Company has complied with the Guidelines set forth by SRC Rule 38, as amended, regarding the Nomination and Election of Independent Director. The same provision has been incorporated in the Amended By-Laws of the Company. Those elected to the Board as independent directors shall submit to the SEC within thirty (30) days after their election, a Certification on the Qualification and Disqualifications of Independent Directors. SMPH ensures compliance with SEC memorandum Circular No. 9, Series of 2011, on the term limits for independent directors. The following will be nominated as officers at the Organizational meeting of the Board of Directors: Henry T. Sy, Jr. Chairman Jose L. Cuisia, Jr. Vice Chairman Elmer B. Serrano Corporate Secretary/Alternate Compliance Officer Marianne M. Guerrero Assistant Corporate Secretary Hans T. Sy President Jeffrey C. Lim Executive Vice President/Corporate Information Officer John Nai Peng C. Ong Chief Finance Officer/Compliance Officer Christopher S. Bautista Vice President – Internal Audit Anna Maria S. Garcia Head, Malls Jose Mari H. Banzon Head, Residential (Primary) Shirley C. Ong Head, Residential (Leisure) Dave L. Rafael Head, Commercial Ma. Luisa E. Angeles Head, Hotels and Convention Centers
Family Relationships Mr. Henry Sy, Sr. is the father of Teresita T. Sy, Elizabeth T. Sy, Henry T. Sy, Jr., Hans T. Sy, Herbert T. Sy and Harley T. Sy. All other directors and officers are not related either by consanguinity or affinity.

54
Involvement in Legal Proceedings The Company is not aware of any of the following events having occurred during the past five years up to the date of this report that are material to an evaluation of the ability or integrity of any director or any member of senior management of the Company:
(a) any bankruptcy petition filed by or against any business of which such person was a general partner or executive officer either at the time of the bankruptcy or within two years prior to that time;
(b) any conviction by final judgment, including the nature of the offense, in a criminal proceeding, domestic or foreign, or being subject to a pending criminal proceeding, domestic or foreign, excluding traffic violations and other minor offenses;
(c) being subject to any order, judgment or decree, not subsequently reversed, suspended or vacated, of any court of competent jurisdiction, domestic or foreign, permanently or temporarily enjoining, barring suspending or otherwise limiting his involvement in any type of business, securities, commodities or banking activities; and
(d) being found by a domestic or foreign court of competent jurisdiction (in a civil action), the SEC or comparable foreign body, or a domestic or foreign exchange or other organized trading market or self-regulatory organization, to have violated a securities or commodities law or regulation, and the judgment has not been reversed, suspended or vacated.
ITEM 10. Compensation of Directors and Executive Officers Aside from regular standard per diems, all directors do not receive regular annual salaries from the Company. The following are the most highly compensated executive officers:
Name and Position Hans T. Sy President Jeffrey C. Lim Executive Vice-President John Nai Peng C. Ong Chief Finance Officer Anna Maria S. Garcia Head, Malls Jose Mari H. Banzon Head, Residential (Primary)
Summary Compensation Table President & 4 Most Highly Compensated Executive Officers
Year Salary Bonus 2016 (estimate) P=105,000,000 P=18,000,000 2015 (actual) 95,000,000 16,000,000 2014 (actual) 84,000,000 14,000,000
All other officers* as a group unnamed
2016 (estimate) P=292,000,000 P=48,000,000 2015 (actual) 265,000,000 44,000,000 2014 (actual) 239,000,000 40,000,000
*Managers & up Certain officers of the Company are seconded from SMIC.
55
There are no outstanding warrants or options held by directors and officers. There are no actions to be taken with regard to election, any bonus or profit-sharing, change in pension/ retirement plan, granting of or extension of any options, warrants or rights to purchase any securities. ITEM 11. Security Ownership of Certain Beneficial Owners and Management (1) Security Ownership of Certain Record and Beneficial Owners The following are the owners of the Company common stock in excess of 5% of total outstanding shares:
Title of Securities
Name and Address of Record Owner and Relationship with
Issuer
Name of Beneficial Owner and Relationship
with Record Owner
Citizenship
Amount and Nature of Direct
Record/Beneficial Ownership (“r” or “b”)
Percent of Class
(%)
Common
SM Investments Corporation (SMIC) (Parent Company)1 One Ecom Center, Harbor Drive, Mall of Asia Complex, CBP-1A, Pasay City
SMIC 2
Filipino
14,325,013,606 (b) 49.60
-do- PCD Nominee Corp. 3 MSE Bldg., Ayala Ave., Makati City
PCD Participants4
Filipino – 5.43% Non-Filipino - 19.17%
7,104,430,076 (r)
24.60
1. The following are the individuals holding the direct beneficial ownership of SMIC: Felicidad T. Sy-3.20%, Henry T. Sy, Jr.-7.28%, Hans T. Sy-8.21%, Herbert T. Sy-8.21%, Harley T. Sy-7.29%, Teresita T. Sy-7.11% and Elizabeth T. Sy-5.82%.
2. Henry Sy, Sr. is the Chairman of SMIC and Teresita T. Sy and Henry Sy, Jr. are the Vice Chairmen of SMIC and they have the power to vote the common shares of SMIC in SMPH.
3. The PCD participants have the power to decide how their shares are to be voted. There are no other individual shareholders which own more than 5% of the Company.
4 The PCD is not related to the Company. (5) Security Ownership of Management as of December 31, 2015
There are no persons holding more than 5% of a class under a voting trust or any similar agreements as of balance sheet date.
Title of Securities
Name of Beneficial Owner of Common Stock
Citizenship Filipino
(F)
Amount and Nature of Beneficial Ownership (D) Direct (I) Indirect
Class of Securities
Voting (V)
Percent of Class
December 31, 2015 December 31, 2014 % of
Change Common Henry Sy, Sr. F 105,395,579 (I) 653,395,579 (I) (83.87) V 0.36
-do- Jose L. Cuisia, Jr. F 497,661 (D&I) 497,661 (D&I) - V 0.00 -do- Teresita T. Sy F 666,708,532 (D&I) 666,708,532 (D&I) - V 2.31 -do- Henry T. Sy, Jr. F 680,818,440 (D) 680,818,440 (D) - V 2.36 -do- Hans T. Sy F 685,163,512 (D&I) 685,163,512 (D&I) - V 2.37 -do- Herbert T. Sy F 666,389,522 (D&I) 666,389,522 (D&I) - V 2.31 -do- Elizabeth T. Sy F 654,115,892 (D&I) 654,115,892 (D&I) - V 2.27 -do- Gregorio U. Kilayko F 202,580 (D&I) 202,580 (D&I) - V 0.00 -do- Joselito H. Sibayan F 36,375 (D) 66,375 (D) (45.20) V 0.00 -do- Jorge T. Mendiola F 1,365,167 (D&I) 1,365,167 (D&I) - V 0.00 -do- Jeffrey C. Lim F 50,000 (I) 50,000 (I) - V 0.00 -do- Christopher S. Bautista F 37,500 (I) 37,500 (I) - V 0.00 -do- All directors and
executive officers as a group
F 3,460,780,760 4,008,810,760 (13.67) V 11.98
56
There are no existing or planned stock warrant offerings. There are no arrangements which may result in a change in control of the Company. There were no matters submitted to a vote of security holders during the fourth quarter of the calendar year covered by this report. ITEM 12. Certain Relationships and Related Transactions The Company, in the regular course of trade or business, enters into transactions with affiliates/ related companies principally consisting of leasing agreements, management fees and cash placements. Generally, leasing and management agreements are renewed on an annual basis and are made at normal market prices. In addition, the Company also has outstanding borrowings/ placements from/ to related banks. Outstanding balances at year-end are unsecured, noninterest-bearing and generally settled within 30 to 90 days. There have been no guarantees/collaterals provided or received for any related party receivables or payables. For the year ended December 31, 2015, the Company has not recorded any impairment of receivables relating to amounts owed by related parties. This assessment is undertaken each financial year through examining the financial position of the related party and the market in which the related party operates. There are no other transactions undertaken or to be undertaken by the Company in which any Director or Executive Officer, nominee for election as Director, or any member of their immediate family was or will be involved or had or will have a direct or indirect material interest. Please refer to Note 21 of the attached 2015 consolidated financial statements.
PART IV- CORPORATE GOVERNANCE ITEM 13. Corporate Governance Please refer to attached Annual Corporate Governance Report (ACGR).
PART V- EXHIBITS AND SCHEDULES ITEM 14. Exhibits and Reports on SEC Form 17-C (a) Exhibits - See accompanying Index to Exhibits (b) Reports on SEC Form 17-C Reports on Form 17-C (Current Report) have been filed during 2015.
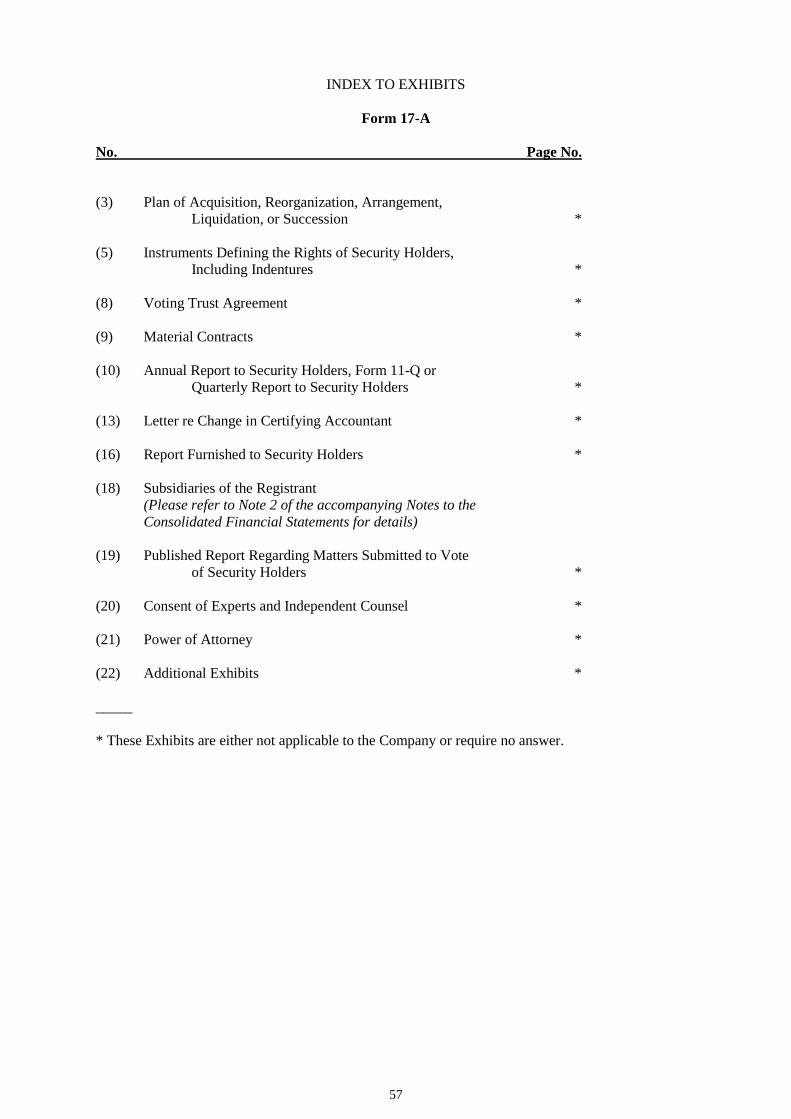
57
INDEX TO EXHIBITS
Form 17-A
No. Page No. (3) Plan of Acquisition, Reorganization, Arrangement, Liquidation, or Succession * (5) Instruments Defining the Rights of Security Holders, Including Indentures * (8) Voting Trust Agreement * (9) Material Contracts * (10) Annual Report to Security Holders, Form 11-Q or Quarterly Report to Security Holders * (13) Letter re Change in Certifying Accountant * (16) Report Furnished to Security Holders * (18) Subsidiaries of the Registrant (Please refer to Note 2 of the accompanying Notes to the
Consolidated Financial Statements for details)
(19) Published Report Regarding Matters Submitted to Vote of Security Holders * (20) Consent of Experts and Independent Counsel * (21) Power of Attorney * (22) Additional Exhibits * _____
* These Exhibits are either not applicable to the Company or require no answer.

58
SM PRIME HOLDINGS, INC.
INDEX TO FINANCIAL STATEMENTS AND SUPPLEMENTARY SCH EDULES
FORM 17-A, ITEM 7 Consolidated Financial Statements Page No. Statement of Management’s Responsibility for Financial Statements 59 Report of Independent Public Accountants 62 Consolidated Balance Sheets as of December 31, 2015 and 2014 64 Consolidated Statements of Income for the Years Ended December 31, 2015, 2014 and 2013 66 Consolidated Statements of Comprehensive Income for the Years Ended December 31, 2015, 2014 and 2013 67 Consolidated Statements of Changes in Equity for the Years Ended December 31, 2015, 2014 and 2013 68 Consolidated Statements of Cash Flows for the Years Ended December 31, 2015, 2014 and 2013 70 Notes to Consolidated Financial Statements 72 Supplementary Schedules Report of Independent Public Accountants on Supplementary Schedules 157 Annex 68 - E A. Financial Assets 158 B. Amounts Receivable from Directors, Officers, Employees, Related Parties and Principal Stockholders (Other than Related Parties) * C. Amounts Receivable from Related parties which are Eliminated During the Consolidation of Financial Statements 159 D. Intangible Assets and Other Assets * E. Long-Term Debt * F. Indebtedness to Related Parties (Long-Term Loans from
Related Companies) * G. Guarantees of Securities of Other Issuers * H. Capital Stock 160 Additional Components i) Reconciliation of Retained Earnings Available for Dividend Declaration 161 ii) List of Philippine Financial Reporting Standards effective as of
December 31, 2015 162 iii) Map of Relationships of the Companies within the Group 169 iv) Financial Ratios - Key Performance Indicators 170 v) Recently Offered Securities to the Public (Retail Bond) 171 _____ * These schedules have been omitted because they are either not required, not applicable or the information required to be presented is included in the Company’s consolidated financial statements or the notes to consolidated financial statements.

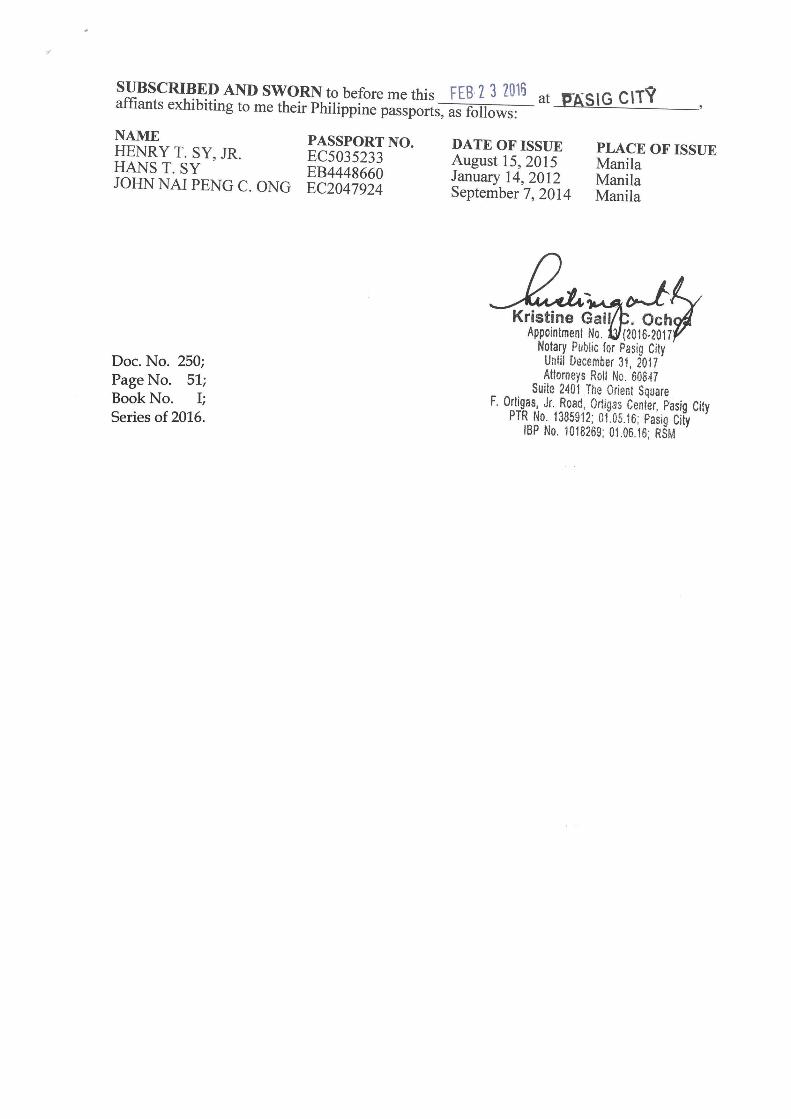

SM Prime Holdings, Inc.
and Subsidiaries
Consolidated Financial Statements
December 31, 2015 and 2014
and Years Ended December 31, 2015, 2014
and 2013
and
Independent Auditors’ Report

*SGVFS015635*
INDEPENDENT AUDITORS’ REPORT
The Stockholders and the Board of DirectorsSM Prime Holdings, Inc.
We have audited the accompanying consolidated financial statements of SM Prime Holdings, Inc. andSubsidiaries, which comprise the consolidated balance sheets as at December 31, 2015 and 2014, andthe consolidated statements of income, statements of comprehensive income, statements of changes inequity and statements of cash flows for each of the three years in the period ended December 31, 2015,and a summary of significant accounting policies and other explanatory information.
Management’s Responsibility for the Consolidated Financial Statements
Management is responsible for the preparation and fair presentation of these consolidated financialstatements in accordance with Philippine Financial Reporting Standards, and for such internal controlas management determines is necessary to enable the preparation of the consolidated financialstatements that are free from material misstatement, whether due to fraud or error.
Auditors’ Responsibility
Our responsibility is to express an opinion on these consolidated financial statements based on ouraudits. We conducted our audits in accordance with Philippine Standards on Auditing. Thosestandards require that we comply with ethical requirements and plan and perform the audit to obtainreasonable assurance about whether the consolidated financial statements are free from materialmisstatement.
An audit involves performing procedures to obtain audit evidence about the amounts and disclosuresin the consolidated financial statements. The procedures selected depend on the auditor’s judgment,including the assessment of the risks of material misstatement of the consolidated financial statements,whether due to fraud or error. In making those risk assessments, the auditor considers internal controlrelevant to the entity’s preparation and fair presentation of the consolidated financial statements inorder to design audit procedures that are appropriate in the circumstances, but not for the purpose ofexpressing an opinion on the effectiveness of the entity’s internal control. An audit also includesevaluating the appropriateness of accounting policies used and the reasonableness of accountingestimates made by management, as well as evaluating the overall presentation of the consolidatedfinancial statements.
We believe that the audit evidence we have obtained is sufficient and appropriate to provide a basis forour audit opinion.
SyCip Gorres Velayo & Co.6760 Ayala Avenue1226 Makati CityPhilippines
Tel: (632) 891 0307Fax: (632) 819 0872ey.com/ph
BOA/PRC Reg. No. 0001, December 14, 2015, valid until December 31, 2018SEC Accreditation No. 0012-FR-4 (Group A), November 10, 2015, valid until November 9, 2018
A member firm of Ernst & Young Global Limited

*SGVFS015635*
- 2 -
Opinion
In our opinion, the consolidated financial statements present fairly, in all material respects, thefinancial position of SM Prime Holdings, Inc. Corporation and Subsidiaries as at December 31, 2015and 2014, and their financial performance and their cash flows for each of the three years in the periodended December 31, 2015 in accordance with Philippine Financial Reporting Standards.
SYCIP GORRES VELAYO & CO.
Belinda T. Beng HuiPartnerCPA Certificate No. 88823SEC Accreditation No. 0923-AR-1 (Group A), March 25, 2013, valid until March 24, 2016Tax Identification No. 153-978-243BIR Accreditation No. 08-001998-78-2015, June 26, 2015, valid until June 25, 2018PTR No. 5321613, January 4, 2016, Makati City
February 22, 2016
A member firm of Ernst & Young Global Limited
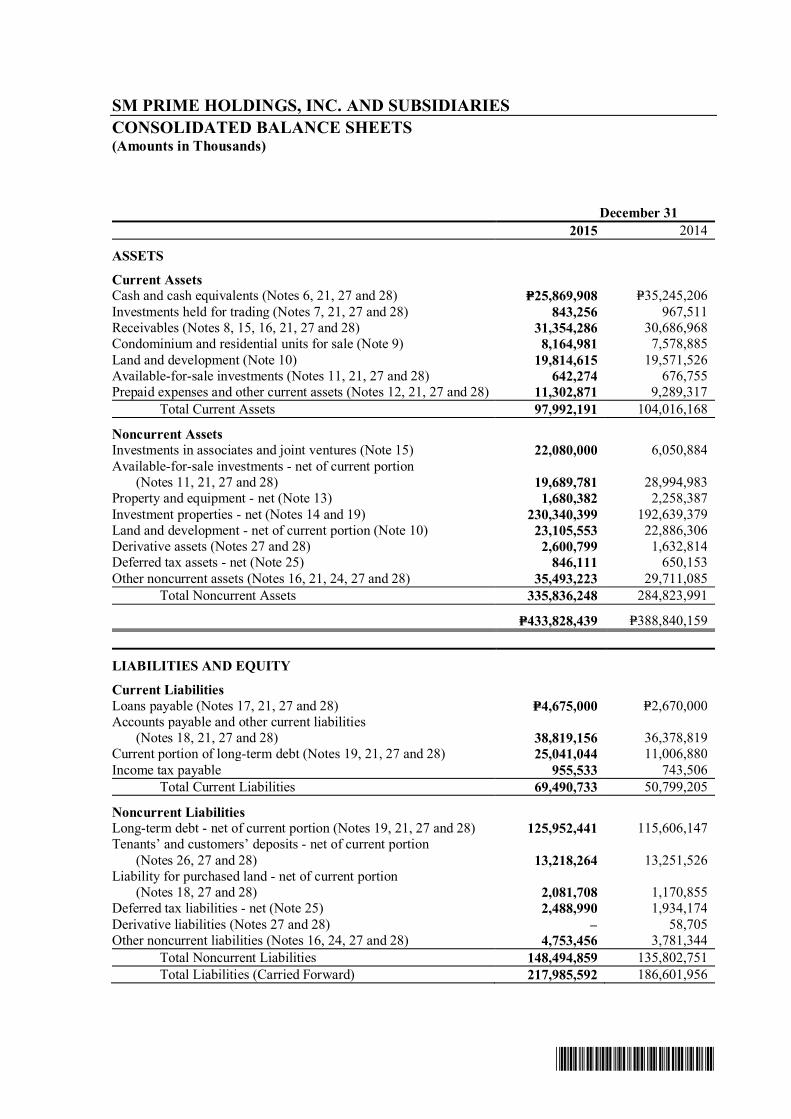
*SGVFS015635*
SM PRIME HOLDINGS, INC. AND SUBSIDIARIES
CONSOLIDATED BALANCE SHEETS(Amounts in Thousands)
December 31
2015 2014
ASSETS
Current AssetsCash and cash equivalents (Notes 6, 21, 27 and 28) P=25,869,908 P=35,245,206Investments held for trading (Notes 7, 21, 27 and 28) 843,256 967,511Receivables (Notes 8, 15, 16, 21, 27 and 28) 31,354,286 30,686,968Condominium and residential units for sale (Note 9) 8,164,981 7,578,885Land and development (Note 10) 19,814,615 19,571,526Available-for-sale investments (Notes 11, 21, 27 and 28) 642,274 676,755Prepaid expenses and other current assets (Notes 12, 21, 27 and 28) 11,302,871 9,289,317
Total Current Assets 97,992,191 104,016,168
Noncurrent AssetsInvestments in associates and joint ventures (Note 15) 22,080,000 6,050,884Available-for-sale investments - net of current portion
(Notes 11, 21, 27 and 28) 19,689,781 28,994,983Property and equipment - net (Note 13) 1,680,382 2,258,387Investment properties - net (Notes 14 and 19) 230,340,399 192,639,379Land and development - net of current portion (Note 10) 23,105,553 22,886,306Derivative assets (Notes 27 and 28) 2,600,799 1,632,814Deferred tax assets - net (Note 25) 846,111 650,153Other noncurrent assets (Notes 16, 21, 24, 27 and 28) 35,493,223 29,711,085
Total Noncurrent Assets 335,836,248 284,823,991
P=433,828,439 P=388,840,159
LIABILITIES AND EQUITY
Current Liabilities
Loans payable (Notes 17, 21, 27 and 28) P=4,675,000 P=2,670,000Accounts payable and other current liabilities
(Notes 18, 21, 27 and 28) 38,819,156 36,378,819Current portion of long-term debt (Notes 19, 21, 27 and 28) 25,041,044 11,006,880Income tax payable 955,533 743,506
Total Current Liabilities 69,490,733 50,799,205
Noncurrent LiabilitiesLong-term debt - net of current portion (Notes 19, 21, 27 and 28) 125,952,441 115,606,147Tenants’ and customers’ deposits - net of current portion
(Notes 26, 27 and 28) 13,218,264 13,251,526Liability for purchased land - net of current portion
(Notes 18, 27 and 28) 2,081,708 1,170,855Deferred tax liabilities - net (Note 25) 2,488,990 1,934,174Derivative liabilities (Notes 27 and 28) – 58,705Other noncurrent liabilities (Notes 16, 24, 27 and 28) 4,753,456 3,781,344
Total Noncurrent Liabilities 148,494,859 135,802,751
Total Liabilities (Carried Forward) 217,985,592 186,601,956

*SGVFS015635*
- 2 -
December 31
2015 2014
Total Liabilities (Brought Forward) P=217,985,592 P=186,601,956
Equity Attributable to Equity Holders of the ParentCapital stock (Notes 5, 20 and 29) 33,166,300 33,166,300Additional paid-in capital - net (Notes 5 and 20) 39,304,027 39,302,194Cumulative translation adjustment 1,005,978 840,430Net unrealized gain on available-for-sale investments (Note 11) 16,621,547 25,905,440Net fair value changes on cash flow hedges (Note 28) 428,799 249,332Remeasurement loss on defined benefit obligation (Note 24) (50,458) (141,524)Retained earnings (Note 20):
Appropriated 42,200,000 42,200,000Unappropriated 83,168,103 60,921,048
Treasury stock (Notes 20 and 29) (3,355,474) (3,355,530)
Total Equity Attributable to Equity Holders of the Parent 212,488,822 199,087,690
Non-controlling Interests (Note 20) 3,354,025 3,150,513
Total Equity 215,842,847 202,238,203
P=433,828,439 P=388,840,159
See accompanying Notes to Consolidated Financial Statements.

*SGVFS015635*
SM PRIME HOLDINGS, INC. AND SUBSIDIARIES
CONSOLIDATED STATEMENTS OF INCOME(Amounts in Thousands, Except Per Share Data)
Years Ended December 31
2015 2014 2013
REVENUE
Rent (Notes 21 and 26) P=40,742,657 P=36,497,242 P=32,195,285Sales:
Real estate 22,185,915 22,151,618 20,775,195Cinema and event ticket 4,797,510 4,268,531 3,740,030
Others (Note 21) 3,785,205 3,322,679 3,083,900
71,511,287 66,240,070 59,794,410
COSTS AND EXPENSES (Note 22) 40,072,460 38,553,561 35,658,865
INCOME FROM OPERATIONS 31,438,827 27,686,509 24,135,545
OTHER INCOME (CHARGES)
Gain on sale of available-for-sale-investments(Notes 11 and 21) 7,410,711 2,743 285,129
Interest and dividend income (Notes 7, 11, 21 and 23) 1,168,610 731,884 1,093,870Equity in net earnings of associates and joint ventures
(Note 15) 542,905 304,434 349,468Interest expense (Notes 21, 23, 27 and 28) (3,379,104) (4,099,499) (3,686,603)Others - net (Notes 7, 19, 21 and 28) (2,271,110) (951,935) (1,467,318)
3,472,012 (4,012,373) (3,425,454)
INCOME BEFORE INCOME TAX 34,910,839 23,674,136 20,710,091
PROVISION FOR (BENEFIT FROM) INCOME TAX
(Note 25)Current 5,698,086 4,697,753 4,392,114Deferred 320,160 79,894 (407,951)
6,018,246 4,777,647 3,984,163
NET INCOME P=28,892,593 P=18,896,489 P=16,725,928
Attributable to
Equity holders of the Parent (Notes 20 and 29) P=28,302,092 P=18,390,352 P=16,274,820Non-controlling interests (Note 20) 590,501 506,137 451,108
P=28,892,593 P=18,896,489 P=16,725,928
Basic/Diluted earnings per share (Note 29) P=0.982 P=0.660 P=0.586
See accompanying Notes to Consolidated Financial Statements.

*SGVFS015635*
SM PRIME HOLDINGS, INC. AND SUBSIDIARIES
CONSOLIDATED STATEMENTS OF COMPREHENSIVE INCOME(Amounts in Thousands)
Years Ended December 31
2015 2014 2013
NET INCOME P=28,892,593 P=18,896,489 P=16,725,928
OTHER COMPREHENSIVE INCOME (LOSS)
Other comprehensive income transferred to profit or loss(net of tax):Realized gain on sale of available-for-sale investments (Note 11) (7,410,711) (2,743) (285,129)
Other comprehensive income (loss) to be reclassified toprofit or loss in subsequent periods (net of tax):Unrealized gain (loss) due to changes in fair value of
available-for-sale investments (Note 11) (1,873,182) 5,949,853 462,438Net fair value changes on cash flow hedges (Note 28) 179,467 (179,817) 429,149Cumulative translation adjustment 165,548 (540,838) 774,031
(8,938,878) 5,226,455 1,380,489
Other comprehensive income (loss) not to be reclassifiedto profit or loss in subsequent periods (net of tax) -Remeasurement income (loss) on defined benefit
obligation (Note 24) 91,277 (143,144) 61,192
TOTAL COMPREHENSIVE INCOME P=20,044,992 P=23,979,800 P=18,167,609
Attributable to
Equity holders of the Parent (Notes 20 and 29) P=19,454,280 P=23,474,512 P=17,717,168Non-controlling interests (Note 20) 590,712 505,288 450,441
P=20,044,992 P=23,979,800 P=18,167,609
See accompanying Notes to Consolidated Financial Statements.

*SGVFS015635*
SM PRIME HOLDINGS, INC. AND SUBSIDIARIES
CONSOLIDATED STATEMENTS OF CHANGES IN EQUITY(Amounts in Thousands)
Equity Attributable to Equity Holders of the Parent
Capital Stock
(Notes 5,
Additional
Paid-in
Capital - Net
Cumulative
Translation
Net Unrealized
Gain on
Available-
for-Sale
Investments
Net Fair Value
Changes on
Cash Flow
Hedges
Remeasurement
Gain (Loss) on
Defined Benefit
Obligation Retained Earnings (Note 20)
Treasury
Stock
(Notes 20Non-controlling
Interests Total
20 and 29) (Notes 5 and 20) Adjustment (Note 11) (Note 28) (Note 24) Appropriated Unappropriated and 29) Total (Note 20) Equity
At January 1, 2015 P=33,166,300 P=39,302,194 P=840,430 P=25,905,440 P=249,332 (P=141,524) P=42,200,000 P=60,921,048 (P=3,355,530) P=199,087,690 P=3,150,513 P=202,238,203
Net income for the year – – – – – – – 28,302,092 – 28,302,092 590,501 28,892,593
Other comprehensive income (loss) – – 165,548 (9,283,893) 179,467 91,066 – – – (8,847,812) 211 (8,847,601)
Total comprehensive income (loss) for the year – – 165,548 (9,283,893) 179,467 91,066 – 28,302,092 – 19,454,280 590,712 20,044,992
Cash dividends (Note 20) – – – – – – – (6,064,618) – (6,064,618) – (6,064,618)
Cash dividends received by a subsidiary – – – – – – – 9,581 – 9,581 – 9,581
Cash dividends received by non-controlling interests – – – – – – – – – – (387,200) (387,200)
Acquisition of non-controlling interests (Note 20) – 1,833 – – – – – – 56 1,889 – 1,889
At December 31, 2015 P=33,166,300 P=39,304,027 P=1,005,978 P=16,621,547 P=428,799 (P=50,458) P=42,200,000 P=83,168,103 (P=3,355,474) P=212,488,822 P=3,354,025 P=215,842,847
At January 1, 2014 P=33,166,300 P=22,303,436 P=1,381,268 P=19,958,330 P=429,149 P=771 P=42,200,000 P=47,807,664 (P=3,980,378) P=163,266,540 P=2,954,985 P=166,221,525
Net income for the year – – – – – – – 18,390,352 – 18,390,352 506,137 18,896,489
Other comprehensive income (loss) – – (540,838) 5,947,110 (179,817) (142,295) – – – 5,084,160 (849) 5,083,311
Total comprehensive income (loss) for the year – – (540,838) 5,947,110 (179,817) (142,295) – 18,390,352 – 23,474,512 505,288 23,979,800
Cash dividends (Note 20) – – – – – – – (5,285,636) – (5,285,636) – (5,285,636)Cash dividends received by a subsidiary – – – – – – – 8,668 – 8,668 – 8,668Cash dividends received by non-controlling interests – – – – – – – – – – (309,760) (309,760)
Reissuance of treasury shares (Note 20) – 17,021,771 – – – – – – 623,916 17,645,687 – 17,645,687Acquisition of non-controlling interests (Note 20) – (23,013) – – – – – – 932 (22,081) – (22,081)
At December 31, 2014 P=33,166,300 P=39,302,194 P=840,430 P=25,905,440 P=249,332 (P=141,524) P=42,200,000 P=60,921,048 (P=3,355,530) P=199,087,690 P=3,150,513 P=202,238,203
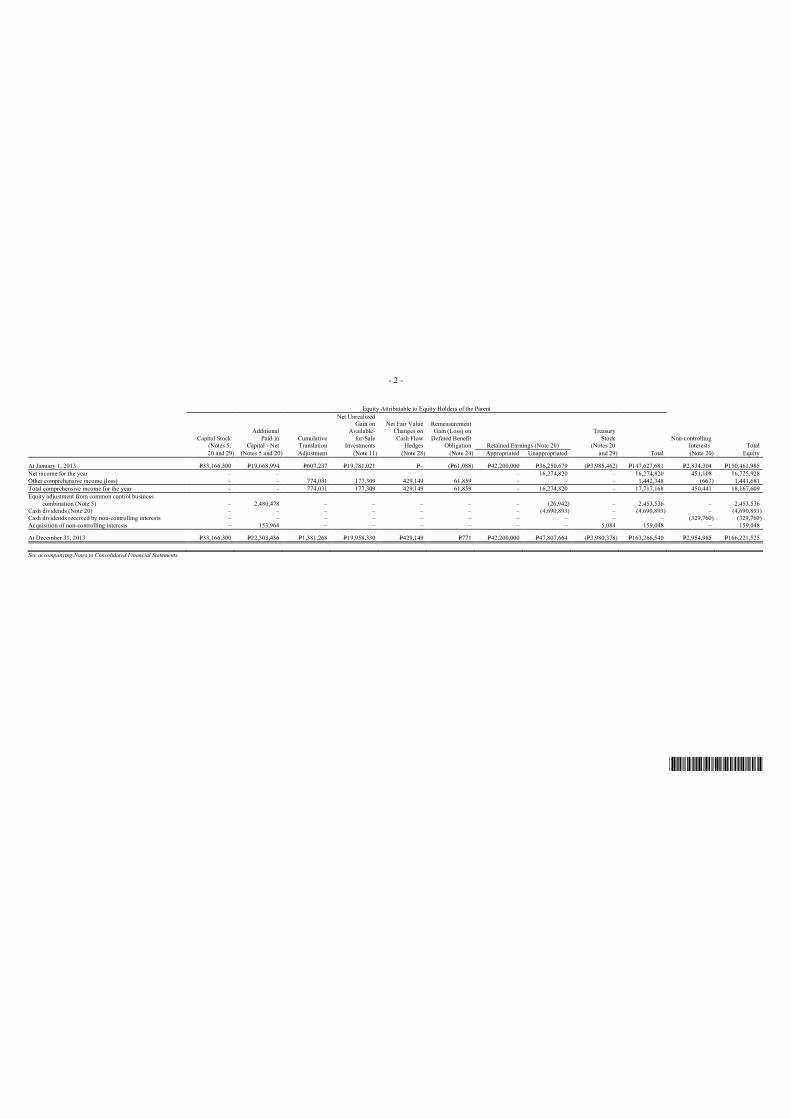
*SGVFS015635*
- 2 -
Equity Attributable to Equity Holders of the Parent
Capital Stock(Notes 5,
Additional
Paid-inCapital - Net
CumulativeTranslation
Net UnrealizedGain on
Available-
for-SaleInvestments
Net Fair Value Changes on
Cash Flow Hedges
RemeasurementGain (Loss) on
Defined Benefit Obligation Retained Earnings (Note 20)
Treasury
Stock(Notes 20
Non-controllingInterests Total
20 and 29) (Notes 5 and 20) Adjustment (Note 11) (Note 28) (Note 24) Appropriated Unappropriated and 29) Total (Note 20) Equity
At January 1, 2013 P=33,166,300 P=19,668,994 P=607,237 P=19,781,021 P=– (P=61,088) P=42,200,000 P=36,250,679 (P=3,985,462) P=147,627,681 P=2,834,304 P=150,461,985
Net income for the year – – – – – – – 16,274,820 – 16,274,820 451,108 16,725,928
Other comprehensive income (loss) – – 774,031 177,309 429,149 61,859 – – – 1,442,348 (667) 1,441,681
Total comprehensive income for the year – – 774,031 177,309 429,149 61,859 – 16,274,820 – 17,717,168 450,441 18,167,609
Equity adjustment from common control business
combination (Note 5) – 2,480,478 – – – – – (26,942) – 2,453,536 – 2,453,536Cash dividends (Note 20) – – – – – – – (4,690,893) – (4,690,893) – (4,690,893)Cash dividends received by non-controlling interests – – – – – – – – – – (329,760) (329,760)
Acquisition of non-controlling interests – 153,964 – – – – – – 5,084 159,048 – 159,048
At December 31, 2013 P=33,166,300 P=22,303,436 P=1,381,268 P=19,958,330 P=429,149 P=771 P=42,200,000 P=47,807,664 (P=3,980,378) P=163,266,540 P=2,954,985 P=166,221,525
See accompanying Notes to Consolidated Financial Statements.

*SGVFS015635*
SM PRIME HOLDINGS, INC. AND SUBSIDIARIES
CONSOLIDATED STATEMENTS OF CASH FLOWS(Amounts in Thousands)
Years Ended December 31
2015 2014 2013
CASH FLOWS FROM OPERATING ACTIVITIESIncome before income tax and non-controlling interests P=34,910,839 P=23,674,136 P=20,710,091Adjustments for:
Loss (gain) on:Sale of available-for-sale investments (Note 11) (7,410,711) (2,743) (285,129)Unrealized foreign exchange 166,435 173,510 (29,994)Mark-to-market on investments
held for trading (Note 7) 101,087 101,076 (93,996)Maturity of derivatives - net (40,691)
Disposal of investments held for trading (Note 7) 693
Fair value changes on derivatives - net (21,340) (62,717)Sale/retirement of investment properties and
property and equipment (68,579)Depreciation and amortization (Note 22) 6,966,952 6,579,781 5,980,940Interest expense (Note 23) 3,379,104 4,099,499 3,686,603Interest and dividend income (Notes 7, 11 and 23) (1,168,610) (731,884) (1,093,870)Equity in net earnings of associates and joint ventures
(Note 15) (542,905) (304,434) (349,468)Restructuring costs (Note 5) 1,276,629
Operating income before working capital changes 36,362,193 33,567,601 29,670,510Decrease (increase) in:
Receivables (695,616) (3,559,562) (8,470,424)Condominium and residential units for sale 5,439,068 2,667,246 4,196,726Land and development (6,807,357) (13,906,967) (11,109,456)Prepaid expenses and other current assets (2,012,614) (910,972) 2,722,125
Increase (decrease) in:Accounts payable and other current liabilities 3,652,508 (9,230,430) 9,456,186Tenants’ and customers’ deposits 1,486,421 3,019,113 1,192,142
Cash generated from operations 37,424,603 11,646,029 27,657,809Income tax paid (5,486,465) (4,894,650) (4,116,235)
Cash provided by operating activities 31,938,138 6,751,379 23,541,574
CASH FLOWS FROM INVESTING ACTIVITIES
Proceeds from sale of:Available-for-sale investments 7,466,528 4,258 397,977Investments held for trading 35,000 150,000 300,448Investment properties 99,991
Interest received 647,572 418,076 692,313Dividends received 552,397 333,980 354,602Additions to:
Investment properties (Note 14) (42,478,023) (35,510,709) (24,553,198)Property and equipment (Note 13) (235,913) (158,016) (440,890)Available-for-sale investments (357,071) (2,396)Investments held for trading (65,416)
Proceeds from:Pretermination of short-term investments 887,900
Early redemption of available-for-sale investments 1,000,000Investments in associates and joint venture and acquisition of
a subsidiary - net of cash acquired(Notes 5 and 15) (15,443,151) (7,352,729)
Decrease (increase) in other noncurrent assets (Note 16) (5,774,646) 4,908,379 (862,111)
Net cash used in investing activities (55,230,236) (29,388,619) (30,365,993)
(Forward)

*SGVFS015635*
- 2 -
Years Ended December 31
2015 2014 2013
CASH FLOWS FROM FINANCING ACTIVITIES
Availments of loans (Notes 17 and 19) P=45,993,435 P=48,121,250 P=76,494,060Payments of:
Long-term debt (Note 19) (11,288,366) (16,175,802) (20,812,576)Bank loans (Note 17) (11,100,000) (9,070,000) (33,210,179)Dividends (Note 20) (6,442,237) (5,586,728) (5,020,653)Interest (3,159,806) (4,183,961) (4,207,108)Restructuring costs (Note 5) (607,172)
Proceeds from:Maturity of derivatives 12,468
Reissuance of treasury shares (Note 20) 17,645,687
Net cash provided by financing activities 14,015,494 30,750,446 12,636,372
EFFECT OF EXCHANGE RATE CHANGES ON
CASH AND CASH EQUIVALENTS (98,694) (9,506) 30,187
NET INCREASE (DECREASE) IN CASH AND CASH
EQUIVALENTS (9,375,298) 8,103,700 5,842,140
CASH AND CASH EQUIVALENTS
AT BEGINNING OF YEAR 35,245,206 27,141,506 21,299,366
CASH AND CASH EQUIVALENTS
AT END OF YEAR P=25,869,908 P=35,245,206 P=27,141,506
See accompanying Notes to Consolidated Financial Statements.
*SGVFS015635*
SM PRIME HOLDINGS, INC. AND SUBSIDIARIES
NOTES TO CONSOLIDATED FINANCIAL STATEMENTS
1. Corporate Information and Corporate Restructuring
Corporate InformationSM Prime Holdings, Inc. (SMPH or the Parent Company) was incorporated in the Philippines andregistered with the Securities and Exchange Commission (SEC) on January 6, 1994. SMPH andits subsidiaries (collectively known as “the Company”) are incorporated to acquire by purchase,exchange, assignment, gift or otherwise, and to own, use, improve, subdivide, operate, enjoy, sell,assign, transfer, exchange, lease, let, develop, mortgage, pledge, traffic, deal in and hold forinvestment or otherwise, including but not limited to real estate and the right to receive, collectand dispose of, any and all rentals, dividends, interest and income derived therefrom; the right tovote on any proprietary or other interest on any shares of stock, and upon any bonds, debentures,or other securities; and the right to develop, conduct, operate and maintain modernizedcommercial shopping centers and all the businesses appurtenant thereto, such as but not limited tothe conduct, operation and maintenance of shopping center spaces for rent, amusement centers,movie or cinema theatres within the compound or premises of the shopping centers, to construct,erect, manage and administer buildings such as condominium, apartments, hotels, restaurants,stores or other structures for mixed use purposes.
SMPH’s shares of stock are publicly traded in the Philippine Stock Exchange (PSE).
As at December 31, 2015, SMPH is 49.60% and 25.71% directly-owned by SM InvestmentsCorporation (SMIC) and the Sy Family, respectively. SMIC, the ultimate parent company, is aPhilippine corporation which listed its common shares with the PSE in 2005. SMIC and all itssubsidiaries are herein referred to as the “SM Group”.
The registered office and principal place of business of the Company is at 10th Floor, Mall of AsiaArena Annex Building, Coral Way cor. J.W. Diokno Blvd., Mall of Asia Complex, Brgy. 76, Zone10, CBP-1A, Pasay City 1300.
Corporate RestructuringIn 2013, SMPH initiated a corporate restructuring exercise to consolidate all of the SM Group’sreal estate companies and real estate assets under one single listed entity which is SMPH(collectively, the “SM Property Group”). The overall objective is to bring to the equities marketthe most comprehensive and integrated Philippine property company that will engage the investorcommunity in the long-term growth potential not just of the Philippine property sector, but also ofthe consumer and tourism sectors. This will leverage on SM’s strong brand franchise, groupsynergies, dominant position in mall and residential development, extensive marketing andsupplier network, huge landbank and other resources to strongly enhance the overall value of thecompany and all its future projects, which also include township and mixed-use development,commercial and resorts development, and hotels and convention centers. The corporaterestructuring involved the following transactions:
SM Land, Inc.’s (SM Land) tender offers for SM Development Corporation (SMDC) andHighlands Prime, Inc. (HPI);
Merger of SMPH (the “Surviving entity”) and SM Land (the “Absorbed entity”); and
Acquisition of unlisted real estate companies and real estate assets from SMIC and the SyFamily.

- 2 -
*SGVFS015635*
The corporate restructuring was approved by the Board of Directors (BOD) of SMPH onMay 31, 2013 and ratified by the stockholders in a special stockholders meeting held onJuly 10, 2013. This was subsequently approved by the SEC on October 10, 2013 (see Note 5).
The accompanying consolidated financial statements were approved and authorized for issue inaccordance with a resolution by the BOD on February 22, 2016.
2. Basis of Preparation
The accompanying consolidated financial statements have been prepared on a historical cost basis,except for derivative financial instruments, investments held for trading and available-for-sale(AFS) investments which have been measured at fair value. The consolidated financial statementsare presented in Philippine peso, which is the Parent Company’s functional and presentationcurrency under Philippine Financial Reporting Standards (PFRS). All values are rounded to thenearest thousand peso, except when otherwise indicated.
Statement of ComplianceThe accompanying consolidated financial statements have been prepared in compliance withPFRS.
Basis of ConsolidationThe consolidated financial statements include the accounts of the Parent Company and thefollowing subsidiaries:
CompanyCountry of
Incorporation
Percentage ofOwnership
2015 2014
Malls
First Asia Realty Development Corporation (FARDC) Philippines 74.2 74.2Premier Central, Inc. - do - 100.0 100.0Consolidated Prime Dev. Corp. - do - 100.0 100.0Premier Southern Corp. - do - 100.0 100.0San Lazaro Holdings Corporation - do - 100.0 100.0Southernpoint Properties Corp. - do - 100.0 100.0First Leisure Ventures Group Inc. (FLVGI) - do - 50.0 50.0CHAS Realty and Development Corporation and Subsidiaries(CHAS)(b) - do - 100.0 100.0Affluent Capital Enterprises Limited and Subsidiaries British Virgin
Islands (BVI) 100.0 100.0Mega Make Enterprises Limited and Subsidiaries - do - 100.0 100.0Springfield Global Enterprises Limited - do - 100.0 100.0Simply Prestige Limited and Subsidiaries(c) - do - 100.0 100.0SM Land (China) Limited and Subsidiaries (SM Land China) Hong Kong 100.0 100.0
Residential
SMDC and Subsidiaries(a) - do - 100.0 100.0Summerhills Home Development Corp. (SHDC)(c) - do - 100.0 100.0HPI(a) - do - 100.0 100.0Costa del Hamilo, Inc. and Subsidiaries (Costa)(a) - do - 100.0 100.0
CommercialMagenta Legacy, Inc.(a) - do - 100.0 100.0Associated Development Corporation(a) - do - 100.0 100.0Prime Metro Estate, Inc. and Subsidiary (PMI)(a) - do - 60.0 60.0Tagaytay Resort and Development Corporation (TRDC)(a) - do - 100.0 100.0
(Forward)

- 3 -
*SGVFS015635*
CompanyCountry of
Incorporation
Percentage ofOwnership
2015 2014
SM Arena Complex Corporation (SMACC)(a) - do - 100.0 100.0MOA Esplanade Port Inc. (MEPI) - do - 100.0 -
Hotels and Convention Centers
SM Hotels and Conventions Corp. and Subsidiaries (SMHCC)(a) - do - 100.0 100.0a. Acquired in 2013 as part of SM Property Group corporate restructuring accounted for as common control business
combination using pooling of interest method.b. Acquired in 2013 from unrelated parties accounted for under acquisition method.c. Acquired in 2013 accounted for as common control business combination using pooling of interest method.
The consolidated financial statements also include the historical financial information of the realestate assets accounted for as “business” acquired from SMIC.
Properties Classification Location
Taal Vista Hotel Land and building TagaytayRadisson Cebu Hotel Building CebuPico Sands Hotel Building BatangasSMX Convention Center Building PasayMall of Asia Arena Building PasayMall of Asia Arena Annex Building PasayCorporate Office Building PasayCasino and Waste Water Treatment Plant Building TagaytayTagaytay land Land TagaytayEDSA West land Land Quezon CityPark Inn Davao Building Davao
FLVGI is accounted for as a subsidiary by virtue of control, as evidenced by the majoritymembers of the BOD representing the Parent Company.
The individual financial statements of the Parent Company and its subsidiaries, which wereprepared for the same reporting period using their own set of accounting policies, are adjusted tothe accounting policies of the Company when the consolidated financial statements are prepared.All intracompany balances, transactions, income and expenses, and profits and losses resultingfrom intracompany transactions and dividends are eliminated in full.
Subsidiaries are consolidated from the date of acquisition, being the date on which the Companyobtains control, and continue to be consolidated until the date that such control ceases. Control isachieved when the Company is exposed, or has rights, to variable returns from its involvementwith the investee and when the Company has the ability to affect those returns through its powerover the investee.
A change in the ownership interest of a subsidiary, without a loss of control, is accounted for as anequity transaction. If the Company loses control over a subsidiary, it:
Derecognizes the assets (including goodwill) and liabilities of the subsidiary;
Derecognizes the carrying amount of any non-controlling interest;
Derecognizes the cumulative translation differences recorded in equity;
Recognizes the fair value of the consideration received;
Recognizes the fair value of any investment retained;

- 4 -
*SGVFS015635*
Recognizes any surplus or deficit in profit or loss; and
Reclassifies the parent’s share of components previously recognized in other comprehensiveincome to profit or loss or retained earnings, as appropriate.
Non-controlling interests represent the portion of profit or loss and net assets not held by theCompany and are presented separately in the consolidated statements of income and within equitysection in the consolidated balance sheets, separately from equity attributable to equity holders ofthe parent.
Significant Accounting Judgments, Estimates and AssumptionsThe preparation of the consolidated financial statements requires management to make judgments,estimates and assumptions that affect the reported amounts of revenue, expenses, assets andliabilities, and the disclosure of contingent liabilities, at the reporting date. However, uncertaintyabout these estimates and assumptions could result in outcomes that could require a materialadjustment to the carrying amount of the affected asset or liability in the future.
JudgmentsIn the process of applying the Company’s accounting policies, management has made thefollowing judgments, apart from those involving estimations, which have the most significanteffect on the amounts recognized in the consolidated financial statements.
Revenue Recognition. The Company’s process of selecting an appropriate revenue recognitionmethod for a particular real estate sales transaction requires certain judgments based on thebuyer’s commitment on the sale. This may be ascertained through the significance of the buyer’sinitial investment and completion of development. The buyer’s commitment is evaluated based oncollections, credit standing of the buyer and location of the property. The completion ofdevelopment is determined based on engineer’s judgments and estimates on the physical portionof contract work done and the completion of development beyond the preliminary stage. Revenuefrom real estate sales amounted to P=22,186 million, P=22,152 million and P=20,775 million for theyears ended December 31, 2015, 2014 and 2013, respectively.
Property Acquisition and Business Combination. The Company acquires subsidiaries which ownreal estate properties. At the time of acquisition, the Company considers whether the acquisitionrepresents an acquisition of a business or a group of assets and liabilities. The Company accountsfor an acquisition as a business combination if it acquires an integrated set of business processes inaddition to the real estate properties.
When the acquisition of a subsidiary does not constitute a business, it is accounted for as anacquisition of a group of assets and liabilities. The purchase price is allocated to the assets andliabilities acquired based upon their relative fair values at the date of acquisition and no goodwillor deferred tax is recognized.
Classification of Property. The Company determines whether a property is classified as propertyand equipment, investment property or land and development.
Property and equipment comprises building spaces and improvements which are occupied for useby, or in the operations of, the Company.
Investment property comprises building spaces and improvements which are not occupied for useby, or in the operations of, the Company, nor for sale in the ordinary course of business, but areheld primarily to earn rental income or capital appreciation.
- 5 -
*SGVFS015635*
Land and development comprises property that is held for sale in the ordinary course of businessin which the Company develops and intends to sell on or before completion of construction.
The Company considers whether a property will be sold in the ordinary course of business or ispart of its strategic landbanking activities which will be developed for sale as condominiumresidential projects. For investment properties, the Company considers whether the propertygenerates cash flows largely independent of the other assets and is held primarily to earn rentals orcapital appreciation. Property and equipment is held for use in the supply of goods or services orfor administrative purposes.
The Company considers each property separately in making its judgment.
The aggregate carrying values of land and development, investment properties and property andequipment amounted to P=274,941 million and P=237,356 million as at December 31, 2015 and2014, respectively (see Notes 10, 13 and 14).
Operating Lease Commitments - as Lessor. The Company has entered into commercial propertyleases in its investment property portfolio. Management has determined, based on an evaluationof the terms and conditions of the arrangements, that it retains all the significant risks and rewardsof ownership of the properties and thus accounts for the contracts as operating leases. Theownership of the asset is not transferred to the lessee by the end of the lease term, the lessee has nooption to purchase the asset at a price that is expected to be sufficiently lower than the fair value atthe date the option is exercisable, and, the lease term is not for the major part of the asset’seconomic life.
Rent income amounted to P=40,743 million, P=36,497 million and P=32,195 million for the yearsended December 31, 2015, 2014 and 2013, respectively (see Note 26).
Operating Lease Commitments - as Lessee. The Company has entered into various leaseagreements as a lessee. Management has determined that all the significant risks and benefits ofownership of these properties, which the Company leases under operating lease arrangements,remain with the lessor. Accordingly, the leases were accounted for as operating leases.
Rent expense amounted to P=1,317 million, P=1,187 million and P=1,295 million for the years endedDecember 31, 2015, 2014 and 2013, respectively (see Note 22).
Impairment of AFS Investments - Significant or Prolonged Decline in Fair Value. The Companydetermines that an AFS investment is impaired when there has been a significant or prolongeddecline in the fair value below its cost. The Company determines that a decline in fair value ofgreater than 20% below cost is considered to be a significant decline and a decline for a periodlonger than 12 months is considered to be a prolonged decline. The determination of what issignificant or prolonged requires judgment. In making this judgment, the Company evaluates,among other factors, the normal volatility in price. In addition, impairment may be appropriatewhen there is evidence of deterioration in the financial health of the investee, industry and sectorperformance.
There was no impairment loss recognized on AFS investments for the years endedDecember 31, 2015, 2014 and 2013. The carrying values of AFS investments amounted toP=20,332 million and P=29,672 million as at December 31, 2015 and 2014, respectively(see Note 11).

- 6 -
*SGVFS015635*
Estimates and AssumptionsThe key estimates and assumptions that may have significant risks of causing material adjustmentsto the carrying amounts of assets and liabilities within the next financial period are discussedbelow.
Revenue and Cost Recognition. The Company’s revenue recognition policies require managementto make use of estimates and assumptions that may affect the reported amounts of revenues andcosts. The Company’s revenue from real estate and construction contracts recognized based onthe percentage of completion are measured principally on the basis of the estimated completion ofa physical proportion of the contract work.
Revenue from sale of real estate amounted to P=22,186 million, P=22,152 million andP=20,775 million for the years ended December 31, 2015, 2014 and 2013, respectively, while thecost of real estate sold amounted to P=12,039 million, P=12,257 million and P=11,921 million for theyears ended December 31, 2015, 2014 and 2013, respectively (see Note 22).
Estimation of Allowance for Impairment on Receivables. The Company maintains an allowancefor impairment loss at a level considered adequate to provide for potential uncollectiblereceivables. The level of allowance is evaluated by the Company on the basis of factors that affectthe collectibility of the accounts. These factors include, but are not limited to, the length of therelationship with the customers and counterparties, average age of accounts and collectionexperience. The Company performs a regular review of the age and status of these accounts,designed to identify accounts with objective evidence of impairment and to provide theappropriate allowance for impairment. The review is accomplished using a combination ofspecific and collective assessment. The amount and timing of recorded expenses for any periodwould differ if the Company made different judgments or utilized different methodologies. Anincrease in allowance for impairment loss would increase the recorded costs and expenses anddecrease assets.
Allowance for impairment amounted to P=966 million and P=353 million as at December 31, 2015and 2014, respectively. Receivables, including noncurrent portion of receivables from sale of realestate, amounted to P=39,317 million and P=39,029 million as at December 31, 2015 and 2014,respectively (see Notes 8 and 16).
Net Realizable Value of Condominium and Residential Units for Sale and Land and Development.The Company writes down the carrying value of condominium units held for sale and land anddevelopment when the net realizable value becomes lower than the carrying value due to changesin market prices or other causes. The net realizable value is assessed with reference to marketprice at the balance sheet date for similar completed property, less estimate cost to complete theconstruction and estimated cost to sell. The carrying value is reviewed regularly for any decline invalue.
The carrying values of condominium and residential units for sale and land and developmentamounted to P=8,165 million and P=42,920 million as at December 31, 2015, respectively, andP=7,579 million and P=42,458 million as at December 31, 2014, respectively (see Notes 9 and 10).
Impairment of AFS Investments - Calculation of Impairment Losses. The computation for theimpairment of AFS debt instruments requires an estimation of the present value of the expectedfuture cash flows and the selection of an appropriate discount rate. In the case of AFS equityinstruments, the Company expands its analysis to consider changes in the investee’s industry andsector performance, legal and regulatory framework, changes in technology and other factors thataffect the recoverability of the investments.

- 7 -
*SGVFS015635*
The carrying values of AFS investments amounted to P=20,332 million and P=29,672 million as atDecember 31, 2015 and 2014, respectively (see Note 11).
Estimated Useful Lives of Property and Equipment and Investment Properties. The useful life ofeach of the Company’s property and equipment and investment properties is estimated based onthe period over which the asset is expected to be available for use. Such estimation is based on acollective assessment of industry practice, internal technical evaluation and experience withsimilar assets. The estimated useful life of each asset is reviewed periodically and updated ifexpectations differ from previous estimates due to physical wear and tear, technical or commercialobsolescence and legal or other limitations on the use of the asset. It is possible, however, thatfuture financial performance could be materially affected by changes in the amounts and timing ofrecorded expenses brought about by changes in the factors mentioned above. A reduction in theestimated useful life of any property and equipment and investment properties would increase therecorded costs and expenses and decrease noncurrent assets.
The aggregate carrying values of property and equipment and investment properties amounted toP=232,021 million and P=194,898 million as at December 31, 2015 and 2014, respectively(see Notes 13 and 14).
Impairment of Other Nonfinancial Assets. The Company assesses at each reporting date whetherthere is an indication that an item of property and equipment and investment properties may beimpaired. Determining the value in use of the assets, which requires the determination of futurecash flows expected to be generated from the continued use and ultimate disposition of suchassets, requires the Company to make estimates and assumptions that can materially affect theconsolidated financial statements. Future events could cause the Company to conclude that theseassets are impaired. Any resulting impairment loss could have a material impact on theconsolidated financial position and performance.
The preparation of the estimated future cash flows involves judgment and estimations. While theCompany believes that its assumptions are appropriate and reasonable, significant changes in theseassumptions may materially affect the assessment of recoverable values and may lead to futureadditional impairment charges.
The aggregate carrying values of property and equipment and investment properties amounted toP=232,021 million and P=194,898 million as at December 31, 2015 and 2014, respectively(see Notes 13 and 14).
Realizability of Deferred Tax Assets. The Company’s assessment on the recognition of deferredtax assets on deductible temporary differences and carryforward benefits of excess minimumcorporate income tax (MCIT) and net operating loss carryover (NOLCO) is based on the projectedtaxable income in future periods. Based on the projection, not all deductible temporarydifferences and carryforward benefits of excess MCIT and NOLCO will be realized.Consequently, only a portion of the Company’s deferred tax assets was recognized.
Deferred tax assets - net recognized in the consolidated balance sheets amounted to P=846 millionand P=650 million as at December 31, 2015 and 2014, respectively, while the unrecognizeddeferred tax assets amounted to nil and P=101 million as at December 31, 2015 and 2014,respectively (see Note 25).
Fair Value of Financial Assets and Liabilities. The Company carries certain financial assets andliabilities at fair value, which requires extensive use of accounting judgments and estimates. Thesignificant components of fair value measurement were determined using verifiable objective
- 8 -
*SGVFS015635*
evidence (i.e., foreign exchange rates, interest rates and volatility rates). The amount of changesin fair value would differ if the Company utilized different valuation methodologies andassumptions. Any changes in the fair value of these financial assets and liabilities would directlyaffect consolidated profit or loss and consolidated other comprehensive income.
The fair value of financial assets and liabilities are discussed in Note 28.
Contingencies. The Company is currently involved in various legal and administrativeproceedings. The estimate of the probable costs for the resolution of these proceedings has beendeveloped in consultation with in-house as well as outside legal counsel handling defense in thesematters and is based upon an analysis of potential results. The Company currently does notbelieve that these proceedings will have a material adverse effect on its consolidated financialposition and performance. It is possible, however, that future consolidated financial performancecould be materially affected by changes in the estimates or in the effectiveness of strategiesrelating to these proceedings. No provisions were made in relation to these proceedings(see Note 30).
Reclassification of AccountsThe Company changed the presentation of its consolidated balance sheet as at December 31, 2014to present advances and deposits from other current assets to other noncurrent assets, and land userights from investment properties to other noncurrent assets to conform to the 2015 presentationand classification. The Company did not present a consolidated balance sheet as at the beginningof the earliest comparative period since the reclassifications do not have a material impact on theconsolidated balance sheets as at December 31, 2014 and January 1, 2014.
3. Summary of Significant Accounting and Financial Reporting Policies
Changes in Accounting PoliciesThe accounting policies adopted are consistent with those of the previous financial periods exceptfor the adoption of the following amendments and Philippine Interpretations based on theinterpretations of the International Financial Reporting Standards Interpretations Committee(IFRIC) effective beginning January 1, 2015:
PAS 19, Employee Benefits - Defined Benefit Plans: Employee Contributions (Amendments),requires an entity to consider contributions from employees or third parties when accountingfor defined benefit plans. Where the contributions are linked to service, they should beattributed to periods of service as a negative benefit. These amendments clarify that, if theamount of the contributions is independent of the number of years of service, an entity ispermitted to recognize such contributions as a reduction in the service cost in the period inwhich the service is rendered, instead of allocating the contributions to the periods of service.The adoption of these amendments did not have any impact on the Company’s consolidatedfinancial statements since the Company’s retirement plans are noncontributory.
Annual Improvements to PFRS (2010 to 2012 cycle)
The Annual Improvements to PFRSs (2010 to 2012 cycle) contain non-urgent but necessaryamendments to the following standards. Except as otherwise stated, the adoption of theseamendments did not have a significant impact on the consolidated financial statements.
PFRS 2, Share-based Payment - Definition of Vesting Condition, is applied prospectively andclarifies various issues relating to the definitions of performance and service conditions whichare vesting conditions, including:

- 9 -
*SGVFS015635*
A performance condition must contain a service condition
A performance target must be met while the counterparty is rendering service
A performance target may relate to the operations or activities of an entity, or to those ofanother entity in the same group
A performance condition may be a market or non-market condition
If the counterparty, regardless of the reason, ceases to provide service during the vestingperiod, the service condition is not satisfied.
PFRS 3, Business Combinations - Accounting for Contingent Consideration in a Business
Combination, is applied prospectively for business combinations for which the acquisitiondate is on or after July 1, 2014. It clarifies that a contingent consideration that is not classifiedas equity is subsequently measured at fair value through profit or loss whether or not it fallswithin the scope of PAS 39.
PFRS 8, Operating Segments - Aggregation of Operating Segments and Reconciliation of the
Total of the Reportable Segments’ Assets to the Entity’s Assets, are applied retrospectively andclarify that:
An entity must disclose the judgments made by management in applying the aggregationcriteria in the standard, including a brief description of operating segments that have beenaggregated and the economic characteristics (e.g., sales and gross margins) used to assesswhether the segments are ‘similar’.
The reconciliation of segment assets to total assets is only required to be disclosed if thereconciliation is reported to the chief operating decision maker, similar to the requireddisclosure for segment liabilities.
PAS 16, Property, Plant and Equipment: Revaluation Method - Proportionate Restatement of
Accumulated Depreciation, and PAS 38, Intangible Assets: Revaluation Method -
Proportionate Restatement of Accumulated Amortization, is applied retrospectively andclarifies in PAS 16 and PAS 38 that the asset may be revalued by reference to the observabledata on either the gross or the net carrying amount. In addition, the accumulated depreciationor amortization is the difference between the gross and carrying amounts of the asset.
PAS 24, Related Party Disclosures - Key Management Personnel, is applied retrospectivelyand clarifies that a management entity, which is an entity that provides key managementpersonnel services, is a related party subject to the related party disclosures. In addition, anentity that uses a management entity is required to disclose the expenses incurred formanagement services.
Annual Improvements to PFRS (2011 to 2013 cycle)
The Annual Improvements to PFRSs (2011 to 2013 cycle) contain non-urgent but necessaryamendments to the following standards. Except as otherwise stated, the adoption of theseamendments did not have a significant impact on the consolidated financial statements.
PFRS 3, Business Combinations - Scope Exceptions for Joint Arrangements, is appliedprospectively and clarifies the following regarding the scope exceptions within PFRS 3:
Joint arrangements, not just joint ventures, are outside the scope of PFRS 3.
This scope exception applies only to the accounting in the financial statements of the jointarrangement itself.

- 10 -
*SGVFS015635*
PFRS 13, Fair Value Measurement - Portfolio Exception, is applied prospectively andclarifies that the portfolio exception in PFRS 13 can be applied not only to financial assets andfinancial liabilities, but also to other contracts within the scope of PAS 39.
PAS 40, Investment Property, is applied prospectively and clarifies that PFRS 3, and not thedescription of ancillary services in PAS 40, is used to determine if the transaction is thepurchase of an asset or business combination. The description of ancillary services in PAS 40only differentiates between investment property and owner-occupied property (i.e., property,plant and equipment).
Future Changes in Accounting Policies
The standards, amendments and interpretations which have been issued but not yet effective as atDecember 31, 2015 are disclosed below. Except as otherwise indicated, the Company does notexpect the adoption of the applicable new and amended PFRS to have a significant impact on thefinancial position or performance.
Deferred
Philippine Interpretation IFRIC 15, Agreements for the Construction of Real Estate, coversaccounting for revenue and associated expenses by entities that undertake the construction ofreal estate directly or through subcontractors. The SEC and the Financial Reporting StandardsCouncil (FRSC) have deferred the effectivity of this interpretation until the final Revenuestandard is issued by the International Accounting Standards Board (IASB) and an evaluationof the requirements of the final Revenue standard against the practices of the Philippine realestate industry is completed. Adoption of the interpretation when it becomes effective mayresult to a change in revenue and cost recognition from percentage of completion method tocompleted contract method.
Future Standards Effective January 1, 2016
PAS 16, Property, Plant and Equipment, and PAS 38, Intangible Assets - Clarification of
Acceptable Methods of Depreciation and Amortization (Amendments), clarify the principle inPAS 16 and PAS 38 that revenue reflects a pattern of economic benefits that are generatedfrom operating a business (of which the asset is part) rather than the economic benefits that areconsumed through use of the asset. As a result, a revenue-based method cannot be used todepreciate property, plant and equipment and may only be used in very limited circumstancesto amortize intangible assets. The amendments are effective prospectively for annual periodsbeginning on or after January 1, 2016, with early adoption permitted. These amendments arenot expected to have any impact to the Company given that the Company is not using arevenue-based method to depreciate its noncurrent assets.
PAS 16, Property, Plant and Equipment, and PAS 41, Agriculture - Bearer Plants(Amendments), change the accounting requirements for biological assets that meet thedefinition of bearer plants. Under the amendments, biological assets that meet the definitionof bearer plants will no longer be within the scope of PAS 41. Instead, PAS 16 will apply.The amendments also require that produce that grows on bearer plants will remain in thescope of PAS 41 measured at fair value less costs to sell. For government grants related tobearer plants, PAS 20, Accounting for Government Grants and Disclosure of Government
Assistance, will apply. The amendments are retrospectively effective for annual periodsbeginning on or after January 1, 2016, with early adoption permitted. These amendments are

- 11 -
*SGVFS015635*
not expected to have any impact to the Company as the Company does not have any bearerplants.
PAS 27, Separate Financial Statements - Equity Method in Separate Financial Statements
(Amendments), will allow entities to use the equity method to account for investments insubsidiaries, joint ventures and associates in their separate financial statements. Entitiesalready applying PFRS and electing to change to the equity method in its separate financialstatements will have to apply that change retrospectively. The amendments are effective forannual periods beginning on or after January 1, 2016, with early adoption permitted. Theseamendments will not have any impact on the Company’s consolidated financial statements.
PFRS 10, Consolidated Financial Statements, PFRS 12, Disclosure of Interests in OtherEntities, and PAS 28, Investments in Associates and Joint Ventures – Investment Entities:
Applying the Consolidation Exception (Amendments), clarify that the exemption in PFRS 10from presenting consolidated financial statements applies to a parent entity that is a subsidiaryof an investment entity that measures all of its subsidiaries at fair value and that only asubsidiary of an investment entity that is not an investment entity itself and that providessupport services to the investment entity parent is consolidated. The amendments also allowan investor (that is not an investment entity and has an investment entity associate or jointventure), when applying the equity method, to retain the fair value measurement applied bythe investment entity associate or joint venture to its interests in subsidiaries. Theseamendments are effective for annual periods beginning on or after January 1, 2016. Theseamendments are not applicable to the Company since the Company is not an investment entitynor does it have investment entity associates.
PFRS 11, Joint Arrangements - Accounting for Acquisitions of Interests in Joint Operations(Amendments), require that a joint operator that is accounting for the acquisition of an interestin a joint operation, in which the activity of the joint operation constitutes a business, mustapply the relevant PFRS 3 principles for business combinations accounting. The amendmentsalso clarify that a previously held interest in a joint operation is not remeasured on theacquisition of an additional interest in the same joint operation while joint control is retained.In addition, a scope exclusion has been added to PFRS 11 to specify that the amendments donot apply when the parties sharing joint control, including the reporting entity, are undercommon control of the same ultimate controlling party.
The amendments apply to both the acquisition of the initial interest in a joint operation and theacquisition of any additional interests in the same joint operation and are prospectivelyeffective for annual periods beginning on or after January 1, 2016, with early adoptionpermitted. These amendments are not expected to have any impact on the Company’sconsolidated financial statements.
PFRS 14, Regulatory Deferral Accounts, is an optional standard that allows an entity, whoseactivities are subject to rate-regulation, to continue applying most of its existing accountingpolicies for regulatory deferral account balances upon its first-time adoption of PFRS. PFRS14 is effective for annual periods beginning on or after January 1, 2016. Since the Companyis an existing PFRS preparer, this standard would not apply.
PAS 1, Presentation of Financial Statements – Disclosure Initiative (Amendments), areintended to assist entities in applying judgment when meeting the presentation and disclosurerequirements in PFRS. They clarify the following:

- 12 -
*SGVFS015635*
That entities shall not reduce the understandability of their financial statements by eitherobscuring material information with immaterial information; or aggregating material itemsthat have different natures or functions
That specific line items in the statement of income and OCI and the statement of financialposition may be disaggregated
That entities have flexibility as to the order in which they present the notes to financialstatements
That the share of OCI of associates and joint ventures accounted for using the equitymethod must be presented in aggregate as a single line item, and classified between thoseitems that will or will not be subsequently reclassified to profit or loss.
Early application is permitted and entities do not need to disclose that fact as the amendmentsare considered to be clarifications that do not affect an entity’s accounting policies oraccounting estimates. The Compay is currently assessing the impact of these amendments onits consolidated financial statements.
Annual Improvements to PFRSs (2012-2014 cycle)The Annual Improvements to PFRSs (2012-2014 cycle) are effective for annual periods beginningon or after January 1, 2016 and are not expected to have a material impact on the Company. Theyinclude:
PFRS 5, Non-current Assets Held for Sale and Discontinued Operations - Changes in
Methods of Disposal, is applied prospectively and clarifies that changing from a disposalthrough sale to a disposal through distribution to owners and vice-versa should not beconsidered to be a new plan of disposal, rather it is a continuation of the original plan. Thereis, therefore, no interruption of the application of the requirements in PFRS 5. Theamendment also clarifies that changing the disposal method does not change the date ofclassification.
PFRS 7, Financial Instruments: Disclosures - Servicing Contracts, requires an entity toprovide disclosures for any continuing involvement in a transferred asset that is derecognizedin its entirety. The amendment clarifies that a servicing contract that includes a fee canconstitute continuing involvement in a financial asset. An entity must assess the nature of thefee and arrangement against the guidance for continuing involvement in PFRS 7 in order toassess whether the disclosures are required. The amendment is to be applied such that theassessment of which servicing contracts constitute continuing involvement will need to bedone retrospectively. However, comparative disclosures are not required to be provided forany period beginning before the annual period in which the entity first applies theamendments.
PFRS 7, Applicability of the Amendments to PFRS 7 to Condensed Interim Financial
Statements (Amendments), is applied retrospectively and clarifies that the disclosures onoffsetting of financial assets and financial liabilities are not required in the condensed interimfinancial report unless they provide a significant update to the information reported in themost recent annual report.
PAS 19, Employee Benefits - Regional Market Issue Regarding Discount Rate, is appliedprospectively and clarifies that market depth of high quality corporate bonds is assessed basedon the currency in which the obligation is denominated, rather than the country where the

- 13 -
*SGVFS015635*
obligation is located. When there is no deep market for high quality corporate bonds in thatcurrency, government bond rates must be used.
PAS 34, Interim Financial Reporting - Disclosure of Information ‘Elsewhere in the InterimFinancial Report, is applied retrospectively and clarifies that the required interim disclosuresmust either be in the interim financial statements or incorporated by cross-reference betweenthe interim financial statements and wherever they are included within the greater interimfinancial report (e.g., in the management commentary or risk report).
Effective January 1, 2018
PFRS 9, Financial Instruments, whose final version was issued in July 2014, reflects allphases of the financial instruments project and replaces PAS 39 and all previous versions ofPFRS 9. The standard introduces new requirements for classification and measurement,impairment, and hedge accounting. PFRS 9 is effective for annual periods beginning on orafter January 1, 2018, with early application permitted. Retrospective application is required,but comparative information is not compulsory. Early application of previous versions ofPFRS 9 is permitted if the date of initial application is before February 1, 2015.
The adoption of PFRS 9 (2014 version) will have an effect on the classification andmeasurement of the Group’s financial assets but will have no impact on the classification andmeasurement of the Group’s financial liabilities. The adoption of the other phases of theproject is not expected to have any significant impact on the Company’s consolidatedfinancial statements. The Company is currently assessing the impact of adopting thisstandard.
The following new standards issued by the IASB have not yet been adopted locally by the SEC andFRSC:
International Financial Reporting Standards (IFRS) 15, Revenue from Contracts withCustomers, was issued in May 2014 and establishes a new five-step model that will apply torevenue arising from contracts with customers. Under IFRS 15, revenue is recognized at anamount that reflects the consideration to which an entity expects to be entitled to in exchangefor transferring goods or services to a customer. The principles in IFRS 15 provide a morestructured approach to measuring and recognizing revenue. The new revenue standard isapplicable to all entities and will supersede all current revenue recognition requirements underIFRS. Either a full or modified retrospective application is required for annual periodsbeginning on or after January 1, 2018, with early adoption permitted.
IFRS 16, Leases, was issued in January 2016. Under the new standard, lessees will no longerclassify their leases as either operating or finance leases in accordance with IAS 17. Rather,leases will apply the single-asset model, wherein lessees will recognize the assets and therelated liabilities for most leases in their balance sheets and, subsequently, will depreciate thelease assets and recognize interest on the lease liabilities in their profit or loss. Theaccounting by lessors is substantially unchanged as the new standard carries forward theprinciples of lessor accounting under IAS 17. The accounting by lessors is substantiallyunchanged as the new standard carries forward the principles of lessor accounting underIAS 17. Lessors, however, will be required to disclose more information in their financialstatements, particularly on the risk exposure to residual value. The new standard is effectivefor annual periods beginning on or after January 1, 2019, with early adoption permitted.
- 14 -
*SGVFS015635*
The Company is currently assessing the impact of IFRS 15 and IFRS 16 and plans to adopt thenew and amended standards on their required effective dates once adopted locally.
Cash and Cash EquivalentsCash includes cash on hand and in banks. Cash equivalents are short-term, highly liquidinvestments that are readily convertible to known amounts of cash with original maturities of threemonths or less from acquisition date and are subject to an insignificant risk of change in value.
Short-term InvestmentsShort-term investments, shown under current assets, are cash placements with original maturitiesof more than three months but less than one year.
Determination of Fair ValueFair value is the price that would be received to sell an asset or paid to transfer a liability in anorderly transaction between market participants at the measurement date. The fair valuemeasurement is based on the presumption that the transaction to sell the asset or transfer theliability takes place either:
in the principal market for the asset or liability, or
in the absence of a principal market, in the most advantageous market for the asset or liability.
The principal or the most advantageous market must be accessible to the Company.
The fair value of an asset or a liability is measured using the assumptions that market participantswould use when pricing the asset or liability, assuming that market participants act in theireconomic best interest.
A fair value measurement of a nonfinancial asset takes into account a market participant’s abilityto generate economic benefits by using the asset in its highest and best use or by selling it toanother market participant that would use the asset in its highest and best use.
The Company uses valuation techniques that are appropriate in the circumstances and for whichsufficient data are available to measure fair value, maximizing the use of relevant observableinputs and minimizing the use of unobservable inputs.
Assets and liabilities for which fair value is measured or disclosed in the consolidated financialstatements are categorized within the fair value hierarchy, described as follows, based on thelowest level input that is significant to the fair value measurement as a whole:
Level 1 - Quoted (unadjusted) market prices in active markets for identical assets or liabilities;
Level 2 - Valuation techniques for which the lowest level input that is significant to the fair valuemeasurement is directly or indirectly observable; and
Level 3 - Valuation techniques for which the lowest level input that is significant to the fair valuemeasurement is unobservable.
For assets and liabilities that are recognized in the consolidated financial statements on a recurringbasis, the Company determines whether transfers have occurred between Levels in the hierarchyby re-assessing categorization (based on the lowest level input that is significant to the fair valuemeasurement as a whole) at the end of each reporting period.
- 15 -
*SGVFS015635*
The Company determines the policies and procedures for both recurring and non-recurring fairvalue measurements. For the purpose of fair value disclosures, the Company has determinedclasses of assets and liabilities on the basis of the nature, characteristics and risks of the asset orliability and the level of the fair value hierarchy.
The Company recognizes transfers into and transfers out of fair value hierarchy levels by re-assessing categorization (based on the lowest level input that is significant to the fair valuemeasurement as a whole) as at the date of the event or change in circumstances that caused thetransfer.
“Day 1” Difference. Where the transaction price in a non-active market is different from the fairvalue of other observable current market transactions in the same instrument or based on avaluation technique whose variables include only data from observable market, the Companyrecognizes the difference between the transaction price and fair value (a “Day 1” difference) in theconsolidated statements of income unless it qualifies for recognition as some other type of asset orliability. In cases where use is made of data which is not observable, the difference between thetransaction price and model value is only recognized in the consolidated statements of incomewhen the inputs become observable or when the instrument is derecognized. For each transaction,the Company determines the appropriate method of recognizing the “Day 1” difference amount.
Financial Instruments - Initial Recognition and Subsequent Measurement
Date of Recognition. The Company recognizes a financial asset or a financial liability in theconsolidated balance sheets when it becomes a party to the contractual provisions of theinstrument. In the case of a regular way purchase or sale of financial assets, recognition andderecognition, as applicable, are done using settlement date accounting. Regular way purchases orsales are purchases or sales of financial assets that require delivery of assets within the periodgenerally established by regulation or convention in the market place. Derivatives are recognizedon a trade date basis.
Initial Recognition of Financial Instruments. Financial instruments are recognized initially at fairvalue, which is the fair value of the consideration given (in case of an asset) or received (in case ofa liability). The initial measurement of financial instruments, except for those classified as fairvalue through profit or loss (FVPL), includes transaction costs.
The Company classifies its financial instruments in the following categories: financial assets andfinancial liabilities at FVPL, loans and receivables, held-to-maturity (HTM) investments, AFSinvestments and other financial liabilities. The classification depends on the purpose for which theinstruments are acquired and whether they are quoted in an active market. Managementdetermines the classification at initial recognition and, where allowed and appropriate, re-evaluates this classification at every reporting date.
Financial Assets and Liabilities at FVPL. Financial assets and liabilities at FVPL includefinancial assets and liabilities held for trading and financial assets and liabilities designated uponinitial recognition as at FVPL.
Financial assets and liabilities are classified as held for trading if they are acquired for the purposeof selling or repurchasing in the near term. Derivatives, including any separated derivatives, arealso classified under financial assets or liabilities at FVPL, unless these are designated as hedginginstruments in an effective hedge or financial guarantee contracts. Gains or losses on investmentsheld for trading are recognized in the consolidated statements of income under “Others - net”account. Interest income on investments held for trading is included in the consolidated
- 16 -
*SGVFS015635*
statements of income under the “Interest and dividend income” account. Instruments under thiscategory are classified as current assets/liabilities if these are held primarily for the purpose oftrading or expected to be realized/settled within 12 months from balance sheet date. Otherwise,these are classified as noncurrent assets/liabilities.
Financial assets and liabilities may be designated by management at initial recognition as FVPLwhen any of the following criteria is met:
the designation eliminates or significantly reduces the inconsistent treatment that wouldotherwise arise from measuring the assets and liabilities or recognizing gains or losses on adifferent basis; or
the assets and liabilities are part of a group of financial assets, financial liabilities or bothwhich are managed and their performances are evaluated on a fair value basis, in accordancewith a documented risk management or investment strategy; or
the financial instrument contains an embedded derivative, unless the embedded derivativedoes not significantly modify the cash flows or it is clear, with little or no analysis, that itwould not be separately recorded.
Classified as financial assets at FVPL are the Company’s investments held for trading andderivative assets. The aggregate carrying values of financial assets under this category amountedto P=3,444 million and P=2,600 million as at December 31, 2015 and 2014, respectively(see Note 28). Included under financial liabilities at FVPL are the Company’s derivativeliabilities. The carrying values of financial liabilities at FVPL amounted to nil and P=59 million asat December 31, 2015 and 2014, respectively (see Note 28).
Loans and Receivables. Loans and receivables are nonderivative financial assets with fixed ordeterminable payments that are not quoted in an active market. They are not entered into with theintention of immediate or short-term resale and are not designated as AFS investments or financialassets at FVPL.
After initial measurement, loans and receivables are subsequently measured at amortized costusing the effective interest method, less allowance for impairment. Amortized cost is calculatedby taking into account any discount or premium on acquisition and fees that are an integral part ofthe effective interest rate. Gains and losses are recognized in the consolidated statements ofincome when the loans and receivables are derecognized and impaired, as well as through theamortization process. Loans and receivables are included under current assets if realizability orcollectibility is within twelve months from reporting period. Otherwise, these are classified asnoncurrent assets.
Classified under this category are cash and cash equivalents, receivables (including noncurrentportion of receivables from sale of real estate), cash in escrow (included under “Prepaid expensesand other current assets” account) and time deposits (included under “Other noncurrent assets”account). Other than those loans and receivables whose carrying values are reasonableapproximation of fair values, the aggregate carrying values of financial assets under this categoryamounted to P=12,524 million and P=10,754 million as at December 31, 2015 and 2014, respectively(see Note 28).
HTM Investments. HTM investments are quoted nonderivative financial assets with fixed ordeterminable payments and fixed maturities for which the Company’s management has thepositive intention and ability to hold to maturity. Where the Company sells other than aninsignificant amount of HTM investments, the entire category would be tainted and reclassified as

- 17 -
*SGVFS015635*
AFS investments. After initial measurement, these investments are measured at amortized costusing the effective interest method, less impairment in value. Amortized cost is calculated bytaking into account any discount or premium on acquisition and fees that are an integral part of theeffective interest rate. Gains and losses are recognized in the consolidated statements of incomewhen the HTM investments are derecognized or impaired, as well as through the amortizationprocess. Assets under this category are classified as current assets if maturity is within twelvemonths from reporting period. Otherwise, these are classified as noncurrent assets.
The Company has no financial assets under this category as at December 31, 2015 and 2014.
AFS Investments. AFS investments are nonderivative financial assets that are designated underthis category or are not classified in any of the other categories. These are purchased and heldindefinitely, and may be sold in response to liquidity requirements or changes in marketconditions. Subsequent to initial recognition, AFS investments are carried at fair value in theconsolidated balance sheets. Changes in the fair value of such assets are reported as net unrealizedgain or loss on AFS investments in the consolidated statements of comprehensive income until theinvestment is derecognized or the investment is determined to be impaired. On derecognition orimpairment, the cumulative gain or loss previously reported in the consolidated statements ofcomprehensive income is transferred to the consolidated statements of income. Interest earned onholding AFS investments are recognized in the consolidated statements of income using theeffective interest method. Assets under this category are classified as current assets if expected tobe disposed of within twelve months from reporting period and as noncurrent assets if expecteddate of disposal is more than twelve months from reporting period.
Classified under this category are the investments in quoted and unquoted shares of stocks ofcertain companies. The carrying values of financial assets classified under this category amountedto P=20,332 million and P=29,672 million as at December 31, 2015 and 2014, respectively(see Note 28).
Other Financial Liabilities. This category pertains to financial liabilities that are not held fortrading or not designated as at FVPL upon the inception of the liability. These include liabilitiesarising from operations or borrowings.
Other financial liabilities are recognized initially at fair value and are subsequently carried atamortized cost, taking into account the impact of applying the effective interest method ofamortization (or accretion) for any related premium, discount and any directly attributabletransaction costs. Gains and losses on other financial liabilities are recognized in the consolidatedstatements of income when the liabilities are derecognized, as well as through the amortizationprocess. Other financial liabilities are classified as current liabilities if settlement is withintwelve months from the balance sheet date. Otherwise, these are classified as noncurrentliabilities.
Classified under this category are loans payable, accounts payable and other current liabilities,long-term debt, tenants’ and customers’ deposits, liability for purchased land and other noncurrentliabilities (except for taxes payables and other payables covered by other accounting standards).Other than those other financial liabilities whose carrying values are reasonable approximation offair values, the aggregate carrying values of financial liabilities under this category amounted toP=144,593 million and P=133,237 million as at December 31, 2015 and 2014, respectively(see Note 28).

- 18 -
*SGVFS015635*
Classification of Financial Instruments Between Liability and EquityA financial instrument is classified as liability if it provides for a contractual obligation to:
deliver cash or another financial asset to another entity;
exchange financial assets or financial liabilities with another entity under conditions that arepotentially unfavorable to the Company; or
satisfy the obligation other than by the exchange of a fixed amount of cash or another financialasset for a fixed number of own equity shares.
If the Company does not have an unconditional right to avoid delivering cash or another financialasset to settle its contractual obligation, the obligation meets the definition of a financial liability.
The components of issued financial instruments that contain both liability and equity elements areaccounted for separately, with the equity component being assigned the residual amount afterdeducting from the instrument as a whole the amount separately determined as the fair value of theliability component on the date of issue.
Debt Issue CostsDebt issue costs are presented as reduction in long-term debt and are amortized over the terms ofthe related borrowings using the effective interest method.
Derivative Financial InstrumentsThe Company uses various derivative financial instruments such as non-deliverable forwards andcross currency swaps to hedge the risks associated with foreign currency and interest ratefluctuations (see Note 28). Such derivative financial instruments are initially recognized at fairvalue on the date on which the derivative contract is entered into and are subsequently remeasuredat fair value. Derivatives are carried as assets when the fair value is positive and as liabilitieswhen the fair value is negative. The method of recognizing the resulting gain or loss depends onwhether the derivative is designated as a hedge of an identified risk and qualifies for hedgeaccounting treatment or accounted for as derivative not designated as accounting hedges.
The objective of hedge accounting is to match the impact of the hedged item and the hedginginstrument in the consolidated statements of income. To qualify for hedge accounting, thehedging relationship must comply with strict requirements such as the designation of thederivative as a hedge of an identified risk exposure, hedge documentation, probability ofoccurrence of the forecasted transaction in a cash flow hedge, assessment and measurement ofhedge effectiveness, and reliability of the measurement bases of the derivative instruments.
At the inception of a hedge relationship, the Company formally designates and documents thehedge relationship to which it wishes to apply hedge accounting and the risk managementobjective and strategy for undertaking the hedge. The documentation includes identification of thehedging instrument, the hedged item or transaction, the nature of the risk being hedged and howthe entity will assess the hedging instrument’s effectiveness in offsetting the exposure to changesin the hedged item’s fair value or cash flows attributable to the hedged risk. Such hedges areexpected to be highly effective in achieving offsetting changes in fair value or cash flows and areassessed on an on-going basis to determine that they actually have been highly effectivethroughout the financial reporting periods for which they were designated.
The Company’s derivative financial instruments are accounted for as either cash flow hedges ortransactions not designated as hedges.
- 19 -
*SGVFS015635*
Cash Flow Hedges. Cash flow hedges are hedges of the exposure to variability in cash flows thatis attributable to a particular risk associated with a recognized asset, liability or a highly probableforecast transaction and could affect the consolidated statements of income. Changes in the fairvalue of a hedging instrument that qualifies as a highly effective cash flow hedge are recognizedas “Net fair value changes on cash flow hedges” in the consolidated statements of comprehensiveincome, whereas any hedge ineffectiveness is immediately recognized in the consolidatedstatements of comprehensive income under “Others - net” account (see Note 28).
Amounts taken to equity are transferred to the consolidated statements of income when the hedgedtransaction affects profit or loss, such as when the hedged financial income or financial expense isrecognized. However, if an entity expects that all or a portion of a loss recognized in othercomprehensive income will not be recovered in one or more future periods, it shall reclassify fromequity to profit or loss as a reclassification adjustment the amount that is not expected to berecovered.
Hedge accounting is discontinued prospectively when the hedge ceases to be highly effective.When hedge accounting is discontinued, the cumulative gains or losses on the hedging instrumentthat has been reported as “Net fair value changes on cash flow hedges” is retained in the othercomprehensive income until the hedged transaction impacts the consolidated statements ofincome. When the forecasted transaction is no longer expected to occur, any net cumulative gainsor losses previously reported in the consolidated statements of comprehensive income isrecognized immediately in the consolidated statements of income.
Other Derivative Instruments Not Accounted for as Hedges. Certain freestanding derivativeinstruments that provide economic hedges under the Company’s policies either do not qualify forhedge accounting or are not designated as accounting hedges. Changes in the fair values ofderivative instruments not designated as hedges are recognized immediately under “Others - net”account in the consolidated statements of income (see Note 28). Derivatives are carried as assetswhen the fair value is positive and as liabilities when the fair value is negative.
Embedded Derivatives. An embedded derivative is a component of a hybrid instrument that alsoincludes a nonderivative host contract with the effect that some of the cash flows of the hybridinstrument vary in a way similar to a stand-alone derivative. An embedded derivative is separatedfrom the host contract and accounted for as a derivative if all of the following conditions are met:a) the economic characteristics and risks of the embedded derivative are not closely related to theeconomic characteristics and risks of the host contract; b) a separate instrument with the sameterms as the embedded derivative would meet the definition of a derivative; and c) the hybridinstrument is not recognized at FVPL.
The Company assesses whether embedded derivatives are required to be separated from the hostcontracts when the Company becomes a party to the contract. Subsequent reassessment isprohibited unless there is a change in the terms of the contract that significantly modifies the cashflows that otherwise would be required under the contract, in which case reassessment is required.The Company determines whether a modification to cash flows is significant by considering theextent to which the expected future cash flows associated with the embedded derivative, the hostcontract or both have changed and whether the change is significant relative to the previouslyexpected cash flow on the contract.
Derecognition of Financial Assets and Liabilities
Financial Assets. A financial asset (or, where applicable, a part of a financial asset or part of agroup of similar financial assets) is derecognized when:

- 20 -
*SGVFS015635*
the rights to receive cash flows from the asset have expired;
the Company retains the right to receive cash flows from the asset, but has assumed anobligation to pay them in full without material delay to a third party under a “pass-through”arrangement; or
the Company has transferred its rights to receive cash flows from the asset and either (a) hastransferred substantially all the risks and rewards of the asset, or (b) has neither transferred norretained substantially all the risks and rewards of the asset, but has transferred control of theasset.
When the Company has transferred its rights to receive cash flows from an asset and has neithertransferred nor retained substantially all the risks and rewards of the asset, nor transferred controlof the asset, the asset is recognized to the extent of the Company’s continuing involvement in theasset. Continuing involvement that takes the form of a guarantee over the transferred asset ismeasured at the lower of original carrying amount of the asset and the maximum amount ofconsideration that the Company could be required to repay.
Financial Liabilities. A financial liability is derecognized when the obligation under the liabilityis discharged or cancelled or has expired.
When an existing financial liability is replaced by another from the same lender on substantiallydifferent terms, or the terms of an existing liability are substantially modified, such an exchange ormodification is treated as a derecognition of the original liability and the recognition of a newliability, and the difference in the respective carrying amounts is recognized in the consolidatedstatements of income.
Impairment of Financial AssetsThe Company assesses at each reporting period whether a financial asset or a group of financialassets is impaired. A financial asset or a group of financial assets is deemed to be impaired, if andonly if, there is objective evidence of impairment as a result of one or more events that occurredafter the initial recognition of the asset (an incurred loss event) and that loss event has an impacton the estimated future cash flows of the financial asset or a group of financial assets that can bereliably estimated. Objective evidence of impairment may include indications that the borrower ora group of borrowers is experiencing significant financial difficulty, default or delinquency ininterest or principal payments, the probability that they will enter bankruptcy or other financialreorganization and where observable data indicate that there is measurable decrease in theestimated future cash flows, such as changes in arrears or economic conditions that correlate withdefaults.
Financial Assets Carried at Amortized Cost. The Company first assesses whether objectiveevidence of impairment exists for financial assets that are individually significant, and individuallyor collectively for financial assets that are not individually significant. If it is determined that noobjective evidence of impairment exists for an individually assessed financial asset, whethersignificant or not, the asset is included in a group of financial assets with similar credit riskcharacteristics and that group of financial assets is collectively assessed for impairment. Assetsthat are individually assessed for impairment and for which an impairment loss is or continues tobe recognized are not included in the collective impairment assessment.
If there is objective evidence that an impairment loss on loans and receivables carried at amortizedcost has been incurred, the amount of the loss is measured as the difference between the asset’scarrying amount and the present value of estimated future cash flows (excluding future credit

- 21 -
*SGVFS015635*
losses that have not been incurred) discounted at the financial asset’s original effective interestrate (i.e., the effective interest rate computed at initial recognition).
The carrying amount of the impaired asset shall be reduced through the use of an allowanceaccount. The amount of the loss shall be recognized in the consolidated statements of income.Interest income continues to be accrued on the reduced carrying amount based on the originaleffective interest rate of the asset. Loans and receivables together with the associated allowanceare written off when there is no realistic prospect of future recovery and all collateral, if any, hasbeen realized or has been transferred to the Company. If, in a subsequent period, the amount ofthe impairment loss increases or decreases because of an event occurring after the impairment wasrecognized, the previously recognized impairment loss is increased or decreased by adjusting theallowance account. If a future write-off is later recovered, the recovery is recognized in theconsolidated statements of income under “Others - net” account.
Financial Assets Carried at Cost. If there is objective evidence that an impairment loss has beenincurred in an unquoted equity instrument that is not carried at fair value because its fair valuecannot be reliably measured, or on a derivative asset that is linked to and must be settled bydelivery of such an unquoted equity instrument, the amount of the loss is measured as thedifference between the asset’s carrying amount and the present value of estimated future cashflows discounted at the current market rate of return for a similar financial asset.
AFS Investments. In the case of equity instruments classified as AFS investments, evidence ofimpairment would include a significant or prolonged decline in fair value of investments below itscost. Where there is evidence of impairment, the cumulative loss - measured as the differencebetween the acquisition cost and the current fair value, less any impairment loss on that financialasset previously recognized in the consolidated statements of income - is removed from theconsolidated statements of comprehensive income and recognized in the consolidated statementsof income. Impairment losses on equity investments are not reversed through the consolidatedstatements of income. Increases in fair value after impairment are recognized directly in theconsolidated statements of comprehensive income.
In the case of debt instruments classified as AFS investments, impairment is assessed based on thesame criteria as financial assets carried at amortized cost. Future interest income is based on thereduced carrying amount of the asset and is accrued based on the rate of interest used to discountfuture cash flows for the purpose of measuring impairment loss. Such accrual is recorded as partof “Interest and dividend income” account in the consolidated statements of income. If, insubsequent year, the fair value of a debt instrument increased and the increase can be objectivelyrelated to an event occurring after the impairment loss was recognized in the consolidatedstatements of income, the impairment loss is reversed through the consolidated statements ofincome.
Offsetting Financial InstrumentsFinancial assets and financial liabilities are offset and the net amount is reported in theconsolidated balance sheets if, and only if, there is a currently enforceable legal right to offset therecognized amounts and there is an intention to settle on a net basis, or to realize the asset andsettle the liability simultaneously. This is not generally the case with master netting agreements,and the related assets and liabilities are presented at gross in the consolidated balance sheets.
Land and Development and Condominium and Residential Units for SaleLand and development and condominium and residential units for sale are stated at the lower ofcost and net realizable value. Net realizable value is the selling price in the ordinary course ofbusiness, less costs to complete and the estimated cost to make the sale. Land and development

- 22 -
*SGVFS015635*
and condominium and residential units for sale include properties held for future development andproperties being constructed for sale in the ordinary course of business, rather than to be held forrental or capital appreciation.
Cost incurred for the development and improvement of the properties includes the following:
Land cost;
Amounts paid to contractors for construction and development; and
Borrowing costs, planning and design costs, costs of site preparation, professional fees,property transfer taxes, construction overheads and other related costs.
Prepaid Expenses and Other Current AssetsOther current assets consist of advances to suppliers and contractors, advances for projectdevelopment, input tax, creditable withholding taxes, deposits, cash in escrow, prepayments andothers. Advances to contractors are carried at cost. These represent advance payments tocontractors for the construction and development of the projects. These are recouped upon everyprogress billing payment depending on the percentage of accomplishment. Advances for projectdevelopment represent advances made for the purchase of land and is stated initially at cost.Advances for project development are subsequently measured at cost, net of any impairment.Prepaid taxes and other prepayments are carried at cost less amortized portion. These includeprepayments for taxes and licenses, rent, advertising and promotions and insurance. Depositsrepresent advances made for acquisitions of property for future development and of shares ofstocks.
Property Acquisitions and Business CombinationsWhen property is acquired, through corporate acquisitions or otherwise, management considersthe substance of the assets and activities of the acquired entity in determining whether theacquisition represents an acquisition of a business.
When such an acquisition is not judged to be an acquisition of a business, it is not treated as abusiness combination. Rather, the cost to acquire the corporate entity is allocated between theidentifiable assets and liabilities of the entity based on their relative fair values at the acquisitiondate. Accordingly, no goodwill or additional deferred tax arises. Otherwise, the acquisition isaccounted for as a business combination.
Business combinations are accounted for using the acquisition method. Applying the acquisitionmethod requires the (a) determination whether the Company will be identified as the acquirer,(b) determination of the acquisition date, (c) recognition and measurement of the identifiableassets acquired, liabilities assumed and any non-controlling interest in the acquiree and(d) recognition and measurement of goodwill or a gain from a bargain purchase.
The cost of an acquisition is measured as the aggregate of the consideration transferred, measuredat acquisition date fair value and the amount of any non-controlling interest in the acquiree. Foreach business combination, the Company measures the non-controlling interest in the acquireeeither at fair value or at the proportionate share of the acquiree’s identifiable net assets.Acquisition costs incurred are expensed and included in the costs and expenses.
When the Company acquires a business, it assesses the financial assets and liabilities assumed forappropriate classification and designation in accordance with the contractual terms, economiccircumstances and pertinent conditions as at the acquisition date. This includes the separation ofembedded derivatives in host contracts by the acquiree.

- 23 -
*SGVFS015635*
If the business combination is achieved in stages, the acquisition date fair value of the Company’spreviously held equity interest in the acquiree is remeasured to fair value at the acquisition datethrough profit or loss.
Any contingent consideration to be transferred by the Company is recognized at fair value at theacquisition date. Subsequent changes to the fair value of the contingent consideration which isdeemed to be an asset or liability is recognized in accordance with PAS 39 either in profit or lossor as change to other comprehensive income. If the contingent consideration is classified asequity, it is not remeasured until it is finally settled and final difference is recognized withinequity.
Goodwill
Initial Measurement of Goodwill or Gain on a Bargain Purchase. Goodwill is initially measuredby the Company at cost being the excess of the aggregate of the consideration transferred and theamount recognized for non-controlling interest over the net identifiable assets acquired andliabilities assumed. If this consideration is lower than the fair value of the net assets of thesubsidiary acquired, the difference is recognized in profit or loss as gain on a bargain purchase.Before recognizing a gain on a bargain purchase, the Company determines whether it has correctlyidentified all of the assets acquired and all of the liabilities assumed and recognizes any additionalassets or liabilities that are identified in that review.
Subsequent Measurement of Goodwill. Following initial recognition, goodwill is measured at costless any accumulated impairment losses.
Impairment Testing of Goodwill. For the purpose of impairment testing, goodwill acquired in abusiness combination is, from the acquisition date, allocated to each of the Company’s cash-generating units (CGU), or groups of CGUs, that are expected to benefit from the synergies of thecombination, irrespective of whether other assets or liabilities of the acquiree are assigned to thoseunits or groups of units. Each unit or group of units to which the goodwill is allocated:
represents the lowest level within the Company at which the goodwill is monitored for internalmanagement purposes; and
is not larger than an operating segment as defined in PFRS 8, Operating Segments, beforeaggregation.
Frequency of Impairment Testing. Irrespective of whether there is any indication of impairment,the Company tests goodwill acquired in a business combination for impairment annually.
Allocation of Impairment Loss. An impairment loss is recognized for a CGU if the recoverableamount of the unit or group of units is less than the carrying amount of the unit or group of units.The impairment loss is allocated to reduce the carrying amount of the assets of the unit or group ofunits first to reduce the carrying amount of goodwill allocated to the CGU or group of units andthen to the other assets of the unit or group of units pro rata on the basis of the carrying amount ofeach asset in the unit or group of units.
Measurement Period. If the initial accounting for a business combination is incomplete by the endof the reporting period in which the combination occurs, the Company reports in its consolidatedfinancial statements provisional amounts for the items for which the accounting is incomplete. Themeasurement period ends as soon as the Company receives the information it was seeking aboutfacts and circumstances that existed as of the acquisition date or learns that more information isnot obtainable. The measurement period does not exceed one year from the acquisition date.
- 24 -
*SGVFS015635*
Common Control Business CombinationsBusiness combinations involving entities or businesses under common control are businesscombinations in which all of the entities or businesses are ultimately controlled by the same partyor parties both before and after the business combination, and that control is not transitory.Business combinations under common control are accounted for similar to pooling of interestsmethod. Under the pooling of interests method:
The assets, liabilities and equity of the acquired companies for the reporting period in whichthe common control business combinations occur and for the comparative periods presented,are included in the consolidated financial statements at their carrying amounts as if theconsolidation had occurred from the beginning of the earliest period presented in the financialstatements, regardless of the actual date of the acquisition;
No adjustments are made to reflect the fair values, or recognize any new assets or liabilities atthe date of the combination. The only adjustments would be to harmonize accounting policiesbetween the combining entities;
No ‘new’ goodwill is recognized as a result of the business combination;
The excess of the cost of business combinations over the net carrying amounts of theidentifiable assets and liabilities of the acquired companies is considered as equity adjustmentfrom business combinations, included under “Additional paid-in capital - net” account in theequity section of the consolidated balance sheets; and
The consolidated statement of income in the year of acquisition reflects the results of thecombining entities for the full year, irrespective of when the combination took place.
Acquisition of Non-controlling InterestsChanges in a parent’s ownership interest in a subsidiary that do not result in a loss of control areaccounted for as equity transactions (i.e., transactions with owners in their capacity as owners). Insuch circumstances, the carrying amounts of the controlling and non-controlling interests shall beadjusted to reflect the changes in their relative interests in the subsidiary. Any difference betweenthe amount by which the non-controlling interests are adjusted and the fair value of theconsideration paid shall be recognized directly in equity and included under “Additional paid-incapital - net” account in the equity section of the consolidated balance sheets.
Property and EquipmentProperty and equipment, except land and construction in progress, is stated at cost lessaccumulated depreciation and amortization and any accumulated impairment in value. Such costincludes the cost of replacing part of the property and equipment at the time that cost is incurred, ifthe recognition criteria are met, and excludes the costs of day-to-day servicing. Land is stated atcost less any impairment in value.
The initial cost of property and equipment consists of its purchase price, including import duties,taxes and any directly attributable costs necessary in bringing the asset to its working conditionand location for its intended use. Cost also includes any related asset retirement obligation andinterest incurred during the construction period on funds borrowed to finance the construction ofthe projects. When each major inspection is performed, its cost is recognized in the carryingamount of the property and equipment as a replacement if the recognition criteria are satisfied.Expenditures incurred after the item has been put into operation, such as repairs, maintenance andoverhaul costs, are normally recognized as expense in the period such costs are incurred. Insituations where it can be clearly demonstrated that the expenditures have improved the condition

- 25 -
*SGVFS015635*
of the asset beyond the originally assessed standard of performance, the expenditures arecapitalized as additional cost of property and equipment.
Depreciation and amortization are calculated on a straight-line basis over the following estimateduseful lives of the assets:
Land improvements 5 yearsBuildings 10–25 yearsLeasehold improvements 5–10 years or term of the lease,
whichever is shorterData processing equipment 5–8 yearsTransportation equipment 5–6 yearsFurniture, fixtures and office equipment 5–10 years
The residual values, useful lives and method of depreciation and amortization of the assets arereviewed and adjusted, if appropriate, at each reporting period.
The carrying values of property and equipment are reviewed for impairment when events orchanges in circumstances indicate that the carrying value may not be recoverable.
Fully depreciated assets are retained in the accounts until they are no longer in use and no furtherdepreciation and amortization is credited or charged to current operations.
An item of property and equipment is derecognized when either it has been disposed or when it ispermanently withdrawn from use and no future economic benefits are expected from its use ordisposal. Any gains or losses arising on the retirement and disposal of an item of property andequipment are recognized in the consolidated statements of income in the period of retirement ordisposal.
Investment PropertiesInvestment properties are measured initially at cost. The cost of a purchased investment propertycomprises of its purchase price and any directly attributable costs. Subsequently, investmentproperties, except land and construction in progress, are measured at cost, less accumulateddepreciation and amortization and accumulated impairment in value, if any. The carrying amountincludes the cost of replacing part of an existing investment property at the time that cost isincurred if the recognition criteria are met, and excludes the costs of day-to-day servicing of aninvestment property. Land is stated at cost less any impairment in value.
Property under construction or development for future use as an investment property is classifiedas investment property.
Depreciation and amortization are calculated on a straight-line basis over the following estimateduseful lives of the assets:
Land improvements 5 yearsBuildings and improvements 20–40 yearsBuilding equipment, furniture and others 3–15 yearsBuilding and leasehold improvements 5 years or term of lease
whichever is shorter
The residual values, useful lives and method of depreciation and amortization of the assets arereviewed and adjusted, if appropriate, at each reporting period.
- 26 -
*SGVFS015635*
Construction in progress represents structures under construction and is stated at cost. Thisincludes cost of construction, property and equipment, and other direct costs. Cost also includesinterest on borrowed funds incurred during the construction period. Construction in progress isnot depreciated until such time that the relevant assets are completed and are ready for use.
Investment property is derecognized when either it has been disposed or when it is permanentlywithdrawn from use and no future economic benefit is expected from its disposal. Any gains orlosses on the retirement or disposal of an investment property are recognized in the consolidatedstatements of income in the period of retirement or disposal.
Transfers are made to investment property when, and only when, there is a change in use,evidenced by ending of owner-occupation or commencement of an operating lease to anotherparty. Transfers are made from investment property when, and only when, there is a change inuse, evidenced by commencement of owner-occupation or commencement of development with aview to sell.
For a transfer from investment property to owner-occupied property or inventories, the cost ofproperty for subsequent accounting is its carrying value at the date of change in use. If theproperty occupied by the Company as an owner-occupied property becomes an investmentproperty, the Company accounts for such property in accordance with the policy stated underproperty and equipment up to the date of change in use.
Investments in Shares of Stocks of Associates and Joint VenturesAn associate is an entity over which the Company has significant influence. Significant influenceis the power to participate in the financial and operating policy decisions of the investee, but is notcontrol or joint control over those policies.
A joint venture is a type of joint arrangement whereby the parties that have joint control of thearrangement have rights to the net assets of the joint venture. Joint control is the contractuallyagreed sharing of control of an arrangement, which exists only when decisions about the relevantactivities require unanimous consent of the parties sharing control.
The considerations made in determining significant influence or joint control are similar to thosenecessary to determine control over subsidiaries.
The Company’s investments in shares of stocks of associates and joint ventures are accounted forunder the equity method of accounting.
Under the equity method, investment in an associate or a joint venture is carried in theconsolidated balance sheets at cost plus post-acquisition changes in the Company’s share in thenet asset of the associate or joint venture. The consolidated statements of income reflects theshare in the result of operations of the associate or joint venture. Where there has been a changerecognized directly in the equity of the associate or joint venture, the Company recognizes itsshare in any changes and discloses this, when applicable, in the consolidated statements ofincome. Profit and losses resulting from transactions between the Company and the associate orjoint venture are eliminated to the extent of the interest in the associate or joint venture. Afterapplication of the equity method, the Company determines whether it is necessary to recognizeany additional impairment loss with respect to the Company’s net investment in the associate orjoint venture. An investment in associate or joint venture is accounted for using the equity methodfrom the date when it becomes an associate or joint venture. On acquisition of the investment, anydifference between the cost of the investment and the investor’s share in the net fair value of theassociate’s identifiable assets, liabilities and contingent liabilities is accounted for as follow:

- 27 -
*SGVFS015635*
Goodwill relating to an associate or joint venture is included in the carrying amount of theinvestment. However, amortization of that goodwill is not permitted and is therefore notincluded in the determination of the Company’s share in the associate’s or joint venture’sprofits or losses.
Any excess of the Company’s share in the net fair value of the associate’s identifiable assets,liabilities and contingent liabilities over the cost of the investment is excluded from thecarrying amount of the investment and is instead included as income in the determination ofthe investor’s share in the associate’s or joint venture’s profit or loss in the period in which theinvestment is acquired.
Also, appropriate adjustments to the Company’s share of the associate’s or joint venture’s profit orloss after acquisition are made to account for the depreciation of the depreciable assets based ontheir fair values at the acquisition date and for impairment losses recognized by the associate orjoint venture.
The Company discontinues the use of equity method from the date when it ceases to havesignificant influence or joint control over an associate or joint venture and accounts for theinvestment in accordance with PAS 39, from that date, provided the associate or joint venture doesnot become a subsidiary. Upon loss of significant influence or joint control over the associate orjoint venture, the Company measures and recognizes any remaining investment at its fair value.Any difference in the carrying amount of the associate or joint venture upon loss of significantinfluence or joint control and the fair value of the remaining investment and proceeds fromdisposal is recognized in the consolidated statements of income. When the Company’s interest inan investment in associate or joint venture is reduced to zero, additional losses are provided onlyto the extent that the Company has incurred obligations or made payments on behalf of theassociate or joint venture to satisfy obligations of the investee that the Company has guaranteed orotherwise committed. If the associate or joint venture subsequently reports profits, the Companyresumes recognizing its share of the profits if it equals the share of net losses not recognized.
The financial statements of the associates and joint ventures are prepared for the same reportingperiod as the Company. The accounting policies of the associates and joint ventures conform tothose used by the Company for like transactions and events in similar circumstances.
Other Noncurrent AssetsOther noncurrent assets consist of bonds and deposits, land use rights, receivables from sale of realestate - net of current portion, time deposits, deferred input tax and others. Other noncurrentassets are carried at cost. Land use rights are amortized over its useful life of 40 to 60 years.
Impairment of Nonfinancial AssetsThe carrying values of property and equipment, investment properties and investments in shares ofstock of associates and joint ventures are reviewed for impairment when events or changes incircumstances indicate that the carrying values may not be recoverable. If any such indicationexists, and if the carrying value exceeds the estimated recoverable amount, the assets orcash-generating units are written down to their recoverable amounts. The recoverable amount ofthe asset is the greater of fair value less costs to sell or value in use. The fair value less costs tosell is the amount obtainable from the sale of an asset in an arm’s-length transaction betweenknowledgeable, willing parties, less costs of disposal. In assessing value in use, the estimatedfuture cash flows are discounted to their present value using a pre-tax discount rate that reflectscurrent market assessments of the time value of money and the risks specific to the asset. For anasset that does not generate largely independent cash inflows, the recoverable amount isdetermined for the cash-generating unit to which the asset belongs. Impairment losses are

- 28 -
*SGVFS015635*
recognized in the consolidated statements of income in those expense categories consistent withthe function of the impaired asset.
An assessment is made at each reporting date as to whether there is any indication that previouslyrecognized impairment loss may no longer exist or may have decreased. If such indication exists,the recoverable amount is estimated. A previously recognized impairment loss is reversed only ifthere has been a change in the estimates used to determine the asset’s recoverable amount sincethe last impairment loss was recognized. If that is the case, the carrying amount of the asset isincreased to its recoverable amount. That increased amount cannot exceed the carrying amountthat would have been determined, net of depreciation and amortization, had no impairment lossbeen recognized for the asset in prior years. Such reversal is recognized in the consolidatedstatements of income. After such a reversal, the depreciation or amortization charge is adjusted infuture periods to allocate the asset’s revised carrying amount, less any residual value, on asystematic basis over its remaining useful life.
Tenants’ DepositsTenants’ deposits are measured at amortized cost. Tenants’ deposits refers to security depositsreceived from various tenants upon inception of the respective lease contracts on the Company’sinvestment properties. At the termination of the lease contracts, the deposits received by theCompany are returned to tenants, reduced by unpaid rental fees, penalties and/or deductions fromrepairs of damaged leased properties, if any. The related lease contracts usually have a term ofmore than twelve months.
Customers’ DepositsCustomers’ deposits, included under “Accounts payable and other current liabilities” account,mainly represent reservation fees and advance payments. These deposits will be recognized asrevenue in the consolidated statements of income as the related obligations to the real estatebuyers are fulfilled.
Capital Stock and Additional Paid-in CapitalCapital stock is measured at par value for all shares issued. Incremental costs incurred directlyattributable to the issuance of new shares are shown in equity as deduction from proceeds, net oftax. Proceeds and/or fair value of considerations received in excess of par value, if any, arerecognized as “Additional paid-in capital - net” account.
Retained EarningsRetained earnings represent accumulated net profits, net of dividend distributions and other capitaladjustments.
Treasury StockOwn equity instruments which are acquired (treasury shares) are deducted from equity andaccounted for at cost. No gain or loss is recognized in the consolidated statements of income onthe purchase, sale, issuance or cancellation of own equity instruments.
DividendsDividends on common shares are recognized as liability and deducted from equity when approvedby the BOD. Dividends for the year that are approved after balance sheet date are dealt with as anevent after the reporting period.
RevenueRevenue is recognized when it is probable that the economic benefits associated with thetransaction will flow to the Company and the amount of the revenue can be reliably measured.
- 29 -
*SGVFS015635*
Revenue is measured at the fair value of the consideration received or receivable, excludingdiscounts, rebates and sales taxes or duties. The Company assesses its revenue arrangementsagainst specific criteria to determine if it is acting as a principal or as an agent. The Company hasconcluded that it is acting as principal in majority of its revenue arrangements. The followingspecific recognition criteria must also be met before revenue is recognized:
Sale of Real Estate. The Company assesses whether it is probable that the economic benefits willflow to the Company when the sales prices are collectible. Collectibility of the contract price isdemonstrated by the buyer’s commitment to pay, which is supported by the buyer’s initial andcontinuous investments that motivates the buyer to honor its obligation. Collectibility is alsoassessed by considering factors such as collections, credit standing of the buyer and location of theproperty.
Revenue from sales of completed real estate projects is accounted for using the full accrualmethod. In accordance with Philippine Interpretations Committee Q&A No. 2006-01, thepercentage-of-completion method is used to recognize income from sales of projects where theCompany has material obligations under the sales contract to complete the project after theproperty is sold, the equitable interest has been transferred to the buyer, construction is beyondpreliminary stage (i.e., engineering, design work, construction contracts execution, site clearanceand preparation, excavation and the building foundation are finished), and the costs incurred or tobe incurred can be measured reliably. Under this method, revenue is recognized as the relatedobligations are fulfilled, measured principally on the basis of the estimated completion of aphysical proportion of the contract work.
Any excess of collections over the recognized receivables are included in the “Tenants’ andcustomers’ deposits” account in the consolidated balance sheets. If any of the criteria under thefull accrual or percentage-of-completion method is not met, the deposit method is applied until allthe conditions for recording a sale are met. Pending recognition of sale, cash received frombuyers are presented under the “Tenants’ and customers’ deposits” account in the consolidatedbalance sheets.
Revenue from construction contracts included in the “Revenue from real estate” account in theconsolidated statements of income is recognized using the percentage-of-completion method,measured principally on the basis of the estimated physical completion of the contract work.
Rent. Revenue is recognized on a straight-line basis over the lease term or based on the terms ofthe lease as applicable.
Sale of Cinema, Event and Amusement Tickets and Merchandise. Revenue is recognized uponreceipt of cash from the customer which coincides with the rendering of services or the delivery ofmerchandise. Revenue from sale of amusement tickets and merchandise are included in the“Revenue - Others” account in the consolidated statements of income.
Dividend. Revenue is recognized when the Company’s right as a shareholder to receive thepayment is established. These are included in the “Revenue - Others” account in the consolidatedstatements of income.
Management and Service Fees. Revenue is recognized when earned in accordance with the termsof the agreements.
Interest. Revenue is recognized as the interest accrues, taking into account the effective yield onthe asset.

- 30 -
*SGVFS015635*
Room rentals, food and beverage, and others. Revenue from room rentals is recognized on actualoccupancy, food and beverage sales when orders are served, and other operated departments whenthe services are rendered. Revenue from other operated departments include, among others,business center, laundry service, and telephone service. Revenue from food and beverage salesand other hotel revenue are included under the “Revenue - Others” account in the consolidatedstatements of income.
Management FeesManagement fees are recognized as expense in accordance with the terms of the agreements.
Cost and Expenses
Cost of Real Estate Sales. Cost of real estate sales is recognized consistent with the revenuerecognition method applied. Cost of condominium units sold before the completion of thedevelopment is determined on the basis of the acquisition cost of the land plus its full developmentcosts, which include estimated costs for future development works.
The cost of inventory recognized in the consolidated statements of income upon sale is determinedwith reference to the specific costs incurred on the property, allocated to saleable area based onrelative size and takes into account the percentage of completion used for revenue recognitionpurposes.
Expected losses on contracts are recognized immediately when it is probable that the total contractcosts will exceed total contract revenue. Changes in the estimated cost to complete thecondominium project which affects cost of real estate sold and gross profit are recognized in theyear in which changes are determined.
General, Administrative and Other Expenses. Costs and expenses are recognized as incurred.
Pension BenefitsThe Company is a participant in the SM Corporate and Management Companies EmployerRetirement Plan. The plan is a funded, noncontributory defined benefit retirement planadministered by a Board of Trustees covering all regular full-time employees. The cost ofproviding benefits under the defined benefit plan is determined using the projected unit creditmethod. This method reflects service rendered by employees to the date of valuation andincorporates assumptions concerning the employees’ projected salaries. The net defined benefitliability or asset is the aggregate of the present value of the defined benefit obligation at the end ofthe reporting period reduced by the fair value of plan assets, if any, adjusted for any effect oflimiting a net defined benefit asset to the asset ceiling. The asset ceiling is the present value ofany economic benefits available in the form of refunds from the plan or reductions in futurecontributions to the plan.
Defined benefit pension costs comprise the following:
Service cost
Net interest on the net defined benefit obligation or asset
Remeasurements of net defined benefit obligation or asset
Service cost which includes current service costs, past service costs and gains or losses on non-routine settlements are recognized as part of “Costs and expenses” under “Administrative”

- 31 -
*SGVFS015635*
account in the consolidated statements of income. Past service costs are recognized when planamendment or curtailment occurs.
Net interest on the net defined benefit obligation or asset is the change during the period in the netdefined benefit obligation or asset that arises from the passage of time which is determined byapplying the discount rate based on government bonds to the net defined benefit liability or asset.Net interest on the net defined benefit obligation or asset is recognized as part of “Costs andexpenses” under “Administrative” account in the consolidated statements of income.
Remeasurements comprising actuarial gains and losses, return on plan assets and any change inthe effect of the asset ceiling (excluding net interest on defined benefit obligation) are recognizedimmediately in other comprehensive income in the period in which they arise. Remeasurementsare not reclassified to profit or loss in subsequent periods.
Plan assets are assets that are held by a long-term employee benefit fund. Fair value of plan assetsis based on market price information. When no market price is available, the fair value of planassets is estimated by discounting expected future cash flows using a discount rate that reflectsboth the risk associated with the plan assets and the maturity or expected disposal date of thoseassets (or, if they have no maturity, the expected period until the settlement of the relatedobligations).
The Company’s right to be reimbursed of some or all of the expenditure required to settle adefined benefit obligation is recognized as a separate asset at fair value when and only whenreimbursement is virtually certain.
Foreign Currency-denominated TransactionsThe consolidated financial statements are presented in Philippine peso, which is SMPH’sfunctional and presentation currency. Transactions in foreign currencies are initially recorded inthe functional currency rate at the date of the transaction. Monetary assets and liabilitiesdenominated in foreign currencies are restated at the functional currency rate of exchange atreporting period. Nonmonetary items denominated in foreign currency are translated using theexchange rates as at the date of initial recognition. All differences are taken to the consolidatedstatements of income.
Foreign Currency TranslationThe assets and liabilities of foreign operations are translated into Philippine peso at the rate ofexchange ruling at reporting period and their respective statements of income are translated at theweighted average rates for the year. The exchange differences arising on the translation areincluded in the consolidated statements of comprehensive income and are presented within the“Cumulative translation adjustment” account in the consolidated statements of changes in equity.On disposal of a foreign entity, the deferred cumulative amount of exchange differencesrecognized in equity relating to that particular foreign operation is recognized in the profit or loss.
LeasesThe determination of whether an arrangement is, or contains, a lease is based on the substance ofthe arrangement and requires an assessment of whether the fulfillment of the arrangement isdependent on the use of a specific asset or assets and the arrangement conveys a right to use theasset.
Company as Lessee. Finance leases, which transfer to the Company substantially all the risks andbenefits incidental to ownership of the leased item, are capitalized at the inception of the lease atthe fair value of the leased property or, if lower, at the present value of the minimum lease

- 32 -
*SGVFS015635*
payments. Lease payments are apportioned between the finance charges and reduction of the leaseliability so as to achieve a constant rate of interest on the remaining balance of the liability.Finance charges are reflected in the consolidated statements of income.
Capitalized leased assets are depreciated over the shorter of the estimated useful life of the assetand the lease term, if there is no reasonable certainty that the Company will obtain ownership bythe end of the lease term.
Leases which do not transfer to the Company substantially all the risks and benefits of ownershipof the asset are classified as operating leases. Operating lease payments are recognized as expensein the consolidated statements of income on a straight-line basis over the lease term. Associatedcosts, such as maintenance and insurance, are expensed as incurred.
Company as Lessor. Leases where the Company does not transfer substantially all the risks andbenefits of ownership of the asset are classified as operating leases. Lease income from operatingleases are recognized as income on a straight-line basis over the lease term. Initial direct costsincurred in negotiating an operating lease are added to the carrying amount of the leased asset andrecognized over the lease term on the same basis as rental income. Contingent rents arerecognized as revenue in the period in which they are earned.
ProvisionsProvisions are recognized when the Company has a present obligation (legal or constructive) as aresult of a past event, it is probable that an outflow of resources embodying economic benefits willbe required to settle the obligation, and a reliable estimate can be made of the amount of theobligation. If the effect of the time value of money is material, provisions are determined bydiscounting the expected future cash flows at a pre-tax rate that reflects current marketassessments of the time value of money and, where appropriate, the risks specific to the liability.Where discounting is used, the increase in the provision due to the passage of time is recognizedas interest expense. Where the Company expects a provision to be reimbursed, the reimbursementis recognized as a separate asset but only when the receipt of the reimbursement is virtuallycertain.
Borrowing CostsBorrowing costs are capitalized if they are directly attributable to the acquisition or construction ofa qualifying asset as part of the cost of that asset. Capitalization of borrowing costs commenceswhen the activities to prepare the asset are in progress and expenditures and borrowing costs arebeing incurred. Borrowing costs are capitalized until the assets are substantially ready for theirintended use. Borrowing costs are capitalized when it is probable that they will result in futureeconomic benefits to the Company. For borrowing associated with a specific asset, the actual rateon that borrowing is used. Otherwise, a weighted average cost of borrowings is used.
Borrowing costs include exchange differences arising from foreign currency borrowings to theextent that they are regarded as an adjustment to interest cost. The Company limits exchangelosses taken as amount of borrowing costs to the extent that the total borrowing costs capitalizeddo not exceed the amount of borrowing costs that would be incurred on functional currencyequivalent borrowings. The amount of foreign exchange differences eligible for capitalization isdetermined for each period separately. Foreign exchange losses that did not meet the criteria forcapitalization in previous years are not capitalized in subsequent years. All other borrowing costsare expensed as incurred.
- 33 -
*SGVFS015635*
TaxesCurrent Tax. Current tax assets and liabilities for the current and prior periods are measured at theamount expected to be recovered from or paid to the taxation authorities. The tax rates and taxlaws used to compute the amount are those that are enacted or substantively enacted as atreporting period.
Deferred Tax. Deferred tax is provided, using the balance sheet liability method, on temporarydifferences at reporting period between the tax bases of assets and liabilities and their carryingamounts for financial reporting purposes. Deferred tax liabilities are recognized for all taxabletemporary differences, except:
where the deferred tax liability arises from the initial recognition of goodwill or of an asset orliability in a transaction that is not a business combination and, at the time of the transaction,affects neither the accounting profit nor taxable profit or loss; and
with respect to taxable temporary differences associated with investments in subsidiaries,associates and interests in joint ventures, where the timing of the reversal of the temporarydifferences can be controlled and it is probable that the temporary differences will not reversein the foreseeable future.
Deferred tax assets are recognized for all deductible temporary differences and carryforwardbenefits of excess MCIT and NOLCO, to the extent that it is probable that taxable profit will beavailable against which the deductible temporary differences and the carryforward benefits ofexcess MCIT and NOLCO can be utilized, except:
where the deferred tax asset relating to the deductible temporary difference arises from theinitial recognition of an asset or liability in a transaction that is not a business combinationand, at the time of the transaction, affects neither the accounting profit nor taxable profit orloss; and
with respect to deductible temporary differences associated with investments in subsidiaries,associates and interests in joint ventures, deferred tax assets are recognized only to the extentthat it is probable that the temporary differences will reverse in the foreseeable future andtaxable profit will be available against which the temporary differences can be utilized.
The carrying amount of deferred tax assets is reviewed at each reporting period and reduced to theextent that it is no longer probable that sufficient taxable profit will be available to allow all orpart of the deferred income tax assets to be utilized. Unrecognized deferred tax assets arereassessed at each reporting period and are recognized to the extent that it has become probablethat future taxable profit will allow the deferred tax assets to be recovered.
Deferred tax assets and liabilities are measured at the tax rates that are expected to apply to theperiod the asset is realized or the liability is settled, based on tax rates and tax laws that have beenenacted or substantively enacted at reporting period.
Income tax relating to items recognized directly in the consolidated statements of comprehensiveincome is recognized in the consolidated statements of comprehensive income and not in theconsolidated statements of income.
Deferred tax assets and deferred tax liabilities are offset, if a legally enforceable right exists tooffset current tax assets against current tax liabilities and the deferred taxes relate to the sametaxable entity and the same taxation authority.

- 34 -
*SGVFS015635*
Value Added Tax (VAT). Revenue, expenses and assets are recognized net of the amount of VAT,except:
where the tax incurred on a purchase of assets or services is not recoverable from the taxationauthority, in which case the tax is recognized as part of the cost of acquisition of the asset oras part of the expense item as applicable; and
receivables and payables that are stated with the amount of tax included.
The net amount of VAT recoverable from, or payable to, the taxation authority is included as partof “Prepaid expenses and other current assets” and “Accounts payable and other current liabilities”accounts in the consolidated balance sheets.
Business SegmentsThe Company is organized and managed separately according to the nature of business. The fouroperating business segments are mall, residential, commercial and hotels and convention centers.These operating businesses are the basis upon which the Company reports its segment informationpresented in Note 4 to the consolidated financial statements.
Basic/Diluted Earnings Per Common Share (EPS)Basic EPS is computed by dividing the net income for the period attributable to owners of theParent by the weighted-average number of issued and outstanding common shares during theperiod, with retroactive adjustment for any stock dividends declared.
For the purpose of computing diluted EPS, the net income for the period attributable to owners ofthe Parent and the weighted-average number of issued and outstanding common shares areadjusted for the effects of all dilutive potential ordinary shares, if any.
ContingenciesContingent liabilities are not recognized in the consolidated financial statements. They aredisclosed in the notes to consolidated financial statements unless the possibility of an outflow ofresources embodying economic benefits is remote. Contingent assets are not recognized in theconsolidated financial statements but are disclosed in the notes to consolidated financialstatements when an inflow of economic benefits is probable.
Events after the Reporting PeriodPost year-end events that provide additional information about the Company’s financial position atthe end of the reporting period (adjusting events) are reflected in the consolidated financialstatements. Post year-end events that are not adjusting events are disclosed in the notes to theconsolidated financial statements when material.
4. Segment Information
For management purposes, the Company is organized into business units based on their productsand services, and has four reportable operating segments as follows: mall, residential, commercialand hotels and convention centers.
Mall segment develops, conducts, operates and maintains the business of modern commercialshopping centers and all businesses related thereto such as the conduct, operation and maintenanceof shopping center spaces for rent, amusement centers, or cinema theaters within the compound ofthe shopping centers.

- 35 -
*SGVFS015635*
Residential and commercial segments are involved in the development and transformation ofmajor residential, commercial, entertainment and tourism districts through sustained capitalinvestments in buildings and infrastructure.
Hotels and convention centers segment engages in and carry on the business of hotel andconvention centers and operates and maintains any and all services and facilities incident thereto.
Management monitors the operating results of its business units separately for the purpose ofmaking decisions about resource allocation and performance assessment. Segment performance isevaluated based on operating profit or loss and is measured consistently with the operating profitor loss in the consolidated financial statements.
The amount of segment assets and liabilities and segment profit or loss are based on measurementprinciples that are similar to those used in measuring the assets and liabilities and profit or loss inthe consolidated financial statements, which is in accordance with PFRS.
Inter-segment TransactionsTransfer prices between business segments are set on an arm’s length basis similar to transactionswith nonrelated parties. Such transfers are eliminated in the consolidated financial statements.
Business Segment Data
2015
Mall Residential Commercial
Hotels and
Convention
Centers Eliminations
Consolidated
Balances
Revenue:(In Thousands)
External customers P=42,705,269 P=22,931,237 P=3,434,135 P=2,440,646 P=– P=71,511,287
Inter-segment 27,503 – 71,865 5,691 (105,059)
P=42,732,772 P=22,931,237 P=3,506,000 P=2,446,337 (P=105,059) P=71,511,287
Segment results: Income before income tax P=20,380,936 P=5,688,535 P=1,703,004 P=534,543 P=6,603,821 P=34,910,839
Provision for income tax (4,863,565) (623,693) (365,641) (165,347) – (6,018,246)
Net income P=15,517,371 P=5,064,842 P=1,337,363 P=369,196 P=6,603,821 P=28,892,593
Net income attributable to: Equity holders of the Parent P=14,978,854 P=5,064,842 P=1,285,379 P=369,196 P=6,603,821 P=28,302,092
Non-controlling interests 538,517 – 51,984 – – 590,501
Segment assets P=283,013,015 P=108,811,859 P=31,284,878 P=10,804,808 (P=86,121) P=433,828,439
Segment liabilities P=160,242,498 P=54,148,046 P=3,038,706 P=642,463 (P=86,121) P=217,985,592
Other information: Capital expenditures P=35,916,735 P=19,522,186 P=1,052,206 P=2,845,821 P=– P=59,336,948
Depreciation and amortization 5,781,043 296,636 549,443 339,830 – 6,966,952

- 36 -
*SGVFS015635*
2014
Mall Residential Commercial
Hotels andConvention
Centers EliminationsConsolidated
Balances
Revenue:(In Thousands)
External customers P=38,642,759 P=22,722,516 P=2,873,334 P=2,001,461 P=– P=66,240,070 Inter-segment 57,767 916 71,996 3,229 (133,908)
P=38,700,526 P=22,723,432 P=2,945,330 P=2,004,690 (P=133,908) P=66,240,070
Segment results: Income before income tax P=17,907,345 P=4,938,472 P=1,074,462 P=298,384 (P=544,527) P=23,674,136 Provision for income tax (4,193,180) (246,225) (273,729) (64,513) – (4,777,647)
Net income P=13,714,165 P=4,692,247 P=800,733 P=233,871 (P=544,527) P=18,896,489
Net income attributable to: Equity holders of the Parent P=13,240,587 P=4,692,247 P=768,174 P=233,871 (P=544,527) P=18,390,352 Non-controlling interests 473,578 – 32,559 – – 506,137
Segment assets P=244,909,574 P=106,187,067 P=28,617,113 P=9,391,400 (P=264,995) P=388,840,159
Segment liabilities P=127,760,583 P=55,362,092 P=3,092,728 P=651,548 (P=264,995) P=186,601,956
Other information: Capital expenditures P=32,393,612 P=22,546,987 P=2,822,857 P=1,274,294 P=– P=59,037,750 Depreciation and amortization 5,337,698 304,316 612,814 324,953 – 6,579,781
2013
Mall Residential Commercial
Hotels andConvention
Centers EliminationsConsolidated
Balances
Revenue:(In Thousands)
External customers P=34,332,874 P=20,906,585 P=2,855,564 P=1,600,045 P=99,342 P=59,794,410 Inter-segment 134,258 9,565 58,734 69,723 (272,280) –
P=34,467,132 P=20,916,150 P=2,914,298 P=1,669,768 (P=172,938) P=59,794,410
Segment results: Income (loss) before income tax P=15,773,978 P=4,599,152 P=1,058,465 (P=24,287) (P=697,217) P=20,710,091 Benefit from (provision for)
income tax (3,737,260) (367,900) (259,480) (31,241) 411,718 (3,984,163)
Net income (loss) P=12,036,718 P=4,231,252 P=798,985 (P=55,528) (P=285,499) P=16,725,928
Net income (loss) attributable to: Equity holders of the Parent P=11,630,987 P=4,231,252 P=798,985 (P=55,528) (P=330,876) P=16,274,820 Non-controlling interests 405,731 – – – 45,377 451,108
Segment assets P=204,805,990 P=97,345,097 P=28,245,291 P=7,173,803 (P=1,986,499) P=335,583,682
Segment liabilities P=114,964,693 P=50,203,798 P=3,872,643 P=1,682,990 (P=1,361,967) P=169,362,157
Other information: Capital expenditures P=25,867,627 P=12,439,263 P=5,002,947 P=146,437 P=– P=43,456,274 Depreciation and amortization 4,754,081 233,137 619,279 374,443 – 5,980,940
For the years ended December 31, 2015, 2014 and 2013, there were no revenue transactions with asingle external customer which accounted for 10% or more of the consolidated revenue fromexternal customers.
5. Business Combinations
Common Control Business CombinationsAs disclosed in Note 1, SMPH initiated a corporate restructuring exercise of the SM PropertyGroup involving series of transactions. SMPH’s management viewed the series of the corporaterestructuring transactions described below as a “single” or “linked” arrangements effected by theSy Family (the Controlling Shareholder) to re-organize its real estate businesses and assets. Thecompanies and real estate assets (accounted for as business units) involved in the restructuring areall under the common control by the Sy Family. Thus, the re-organization was considered as

- 37 -
*SGVFS015635*
common control business combinations and was accounted for using the pooling of interestmethod.
Assets, liabilities and equity of the acquired businesses are included in the consolidated financialstatements at their carrying amounts. Financial information for periods prior to the date ofbusiness combination were also restated.
SM Land’s Tender Offers for SMDC and HPI
Both SMDC and HPI are companies primarily engaged in real estate development listed in thePSE and registered with the Philippine SEC. On June 4, 2013, SM Land launched a tenderoffer to the existing shareholders of SMDC and HPI in exchange for SMPH shares held bySM Land. The terms of the tender offer were executed at an exchange ratio of 0.472 SMPHshare for 1 SMDC share and 0.135 SMPH share for 1 HPI share. The exchange ratios werearrived at based on SMPH’s one month volume-weighted average price (VWAP) ofP=18.66 per share and a six percent premium to SMDC’s one month VWAP of P=8.303 pershare. For HPI, the exchange ratios were arrived at based on SMPH’s one month VWAP ofP=18.66 per share and a fifteen percent premium to HPI’s one month VWAP of P=2.195 pershare. The tender offers were completed on August 12, 2013. The total number of SMPHcommon shares held by SM Land exchanged to complete the tender offer to shareholders ofSMDC and HPI is 1,778,427,940.
Subsequently, on November 5, 2013, SMDC and HPI were delisted from the PSE.
Merger of SMPH (the “Surviving entity”) and SM Land (the “Absorbed entity”)
Following the completion of the tender offer, on October 10, 2013, the SEC approved themerger of SMPH and SM Land via a share-for-share swap where the stockholders of SM Landreceived new SMPH shares in exchange for their shareholdings in SM Land. SMPH is thesurviving entity while SM Land is the absorbed entity. As a result of the merger, SMDC andHPI became subsidiaries of SMPH effective October 10, 2013. In addition to theshareholdings in SMDC and HPI, SMPH now holds SM Land’s real estate assets whichincludes among others, Mall of Asia Complex (MOAC), office buildings such as Two E-Comin MOAC, Cyber 1 and Cyber 2 in Makati, and certain real properties leased to SM SaveMoreand SM Department Store. The merger ratio of 738 SMPH shares for 1 SM Land share werearrived based on the net appraised values of SMPH and SM Land as at February 28, 2013 asconducted by CB Richard Ellis. The total number of new SMPH common shares issued toSM Land shareholders is 14,390,923,857.
Also included in the plan of merger, which were also approved by the SEC onOctober 10, 2013 are the following:
a) The increase in the authorized capital stock of SMPH by P=20,000 million, fromP=20,000 million consisting of 20,000 million common shares with a par value of P=1 pershare to P=40,000 million consisting of 40,000 million common shares with a par value ofP=1 per share, and the consequent amendment of Article VII of the Articles ofIncorporation (see Note 20).
b) The change in SMPH’s primary purpose from development and operation of commercialshopping centers to a mixed-use real property developer, and the consequent amendmentof Article II of the Articles of Incorporation.

- 38 -
*SGVFS015635*
The merger resulted to equity adjustment from common control business combination,included under “Additional paid-in capital” account, amounting to P=1,753 million(see Note 20).
Acquisition of Unlisted Real Estate Companies and Real Estate Assets from SMIC and the
Sy Family
On October 10, 2013, the SEC also approved SMPH’s acquisition of SMIC’s unlisted realestate companies including SMHCC, SMACC, Costa, PMI and TRDC. The SEC likewiseapproved SMPH’s acquisition of real property assets of SMIC which includes among others,SMX Convention Center in MOAC and real properties located in Tagaytay, by issuing newSMPH shares to SMIC. The unlisted real estate companies and real estate assets of SMICwere acquired based on the appraised values as at February 28, 2013 as conducted by CBRichard Ellis. Total acquisition price of the unlisted real estate companies and real propertyassets amounted to P=25.8 billion equivalent to 1,382,841,458 SMPH common shares issuedbased on SMPH 30-day VWAP of P=18.66.
The acquisition of real estate companies and real estate assets resulted to equity adjustmentfrom common control business combination, included under “Additional paid-in capital”account, amounting to P=12,067 million (see Note 20).
Other Common Control Business CombinationsIn 2013, SMPH also acquired SM Store (China) Holdings Ltd. Co. (SM Store) through its newlyincorporated subsidiary, Simply Prestige Limited, for a nominal amount. As a result of theacquisition, SM Store became a wholly-owned subsidiary of SMPH. SM Store owns and operatesall the SM Department Stores in the SM Malls in China. SM Store is owned and controlled by theSy Family. Thus, the transaction was considered a combination of businesses under commoncontrol for which pooling of interests was applied. The excess of the cost of business combinationover the paid-up capital amounting to P=110 million is included under “Additional paid-in capital -net” account (see Note 20).
Business AcquisitionsIn January 2013, the Company entered into a Binding Share Purchases Agreement for theacquisition of 100% interest in CHAS for a total purchase consideration of P=1,685 million. CHASis engaged in the business of shopping mall operations which owns Cabanatuan Megacenter inNueva Ecija. The Company acquired CHAS to expand its market share through the pre-existingmall of CHAS.
In 2013, the Company completed its acquisition of 100% interest in CHAS.
Total identifiable assets acquired amounted to P=1,834 million, which mainly consist of investmentproperties amounting to P=1,385 million and cash and other assets amounting to P=449 million.Total identifiable liabilities assumed amounted to P=149 million, which mainly consist of accountspayable and other current liabilities. The resulting identifiable net assets acquired amounted toP=1,685 million. No goodwill is recognized upon completion of the acquisition.
The fair value of acquired receivables amounting to P=37 million (included in “Receivables”)approximates their carrying value. No impairment loss was provided on these receivables.
The Company’s consolidated revenue and net income would have increased by P=80 million anddecreased by P=105 million, respectively, for the year ended December 31, 2013 had the

- 39 -
*SGVFS015635*
acquisition of CHAS took place on January 1, 2013. Total revenue and net income of CHASincluded in the consolidated financial statements for 2013 are immaterial.
Net cash outflow from the acquisition of CHAS amounted to P=2,238 million, inclusive ofadvances made to CHAS prior to the acquisition amounting to P=665 million, and net of cashacquired from CHAS amounting to P=112 million.
6. Cash and Cash Equivalents
This account consists of:
2015 2014(In Thousands)
Cash on hand and in banks (see Note 21) P=2,943,394 P=3,002,606Temporary investments (see Note 21) 22,926,514 32,242,600
P=25,869,908 P=35,245,206
Cash in banks earn interest at the respective bank deposit rates. Temporary investments are madefor varying periods of up to three months depending on the immediate cash requirements of theCompany, and earn interest at the respective temporary investment rates.
Interest income earned from cash in banks and temporary investments amounted to P=371 million,P=214 million and P=472 million for the years ended December 31, 2015, 2014 and 2013,respectively (see Note 23).
7. Investments Held for Trading
This account consists of investments in Philippine government and corporate bonds and listedcommon shares. The Philippine government and corporate bonds have yields ranging from 6.63%to 7.20% and 5.88% to 8.64% in 2015 and 2014, respectively. These Philippine peso-denominated and U.S. dollar-denominated investments have various maturities in 2017.
The movements in this account are as follows:
2015 2014(In Thousands)
At beginning of the year P=967,511 P=1,151,464Unrealized foreign exchange gain 12,525 1,706Mark-to-market loss during the year (101,087) (101,076)Disposals - net (35,693) (84,583)
At end of the year P=843,256 P=967,511
Mark-to-market loss on changes in fair value of investments held for trading are included under“Others - net” account in the consolidated statements of income.
Interest income earned from investments held for trading amounted to P=18 million, P=26 millionand P=28 million for the years ended December 31, 2015, 2014 and 2013, respectively(see Note 23).

- 40 -
*SGVFS015635*
Dividend income earned from investments held for trading amounted to P=14 million, P=13 millionand P=13 million for the years ended December 31, 2015, 2014 and 2013, respectively.
8. Receivables
This account consists of:
2015 2014(In Thousands)
Trade:Sale of real estate P=31,073,388 P=29,607,958Rent:
Third parties 4,555,888 3,878,656Related parties (see Note 21) 2,422,175 2,294,805
Others (see Note 21) 17,996 55,237Due from related parties (see Note 21) 101,069 365,874Nontrade 31,265 90,317Receivable from a co-investor (see Note 15) 270,674 269,161Accrued interest (see Note 21) 108,998 142,878Others 1,701,307 2,676,512
40,282,760 39,381,398Less allowance for impairment 965,859 352,847
39,316,901 39,028,551Less noncurrent portion of receivables from sale
of real estate (see Note 16) 7,962,615 8,341,583
P=31,354,286 P=30,686,968
The terms and conditions of the above receivables are as follows:
Trade receivables from tenants are noninterest-bearing and are normally collectible on a 30 to90 days’ term. Trade receivables from sale of real estate pertains to sold condominium andresidential units at various terms of payments.
The Company assigned receivables from sale of real estate on a without recourse basis tolocal banks amounting to P=1,895 million and P=3,751 million for the years endedDecember 31, 2015 and 2014, respectively (see Note 21).
The Company also assigned receivables from real estate on a with recourse basis to localbanks amounting to P=406 million and P=91 million for the years ended December 31, 2015 and2014, respectively. The related liability from assigned receivables, which is of equal amountwith the assigned receivables, bear interest rates ranging from 3.50% to 4.00% and 4.50% in2015 and 2014, respectively. The fair value of the assigned receivables and liability fromassigned receivables approximates its cost.
Receivables from a co-investor represents the consideration receivable by Tennant RangeCorporation (TRC), a BVI subsidiary holding company of SM Land China, in connection withthe agreement with a third party (see Note 15).
Accrued interest and other receivables are normally collected throughout the financial period.

- 41 -
*SGVFS015635*
Interest income earned from receivables totaled P=70 million, P=45 million and P=67 million for theyears ended December 31, 2015, 2014 and 2013, respectively (see Note 23).
The movements in the allowance for impairment related to receivables from sale of real estate andother receivables are as follows:
2015 2014(In Thousands)
At beginning of the year P=352,847 P=322,904Provision for impairment 613,012 29,943
At end of the year P=965,859 P=352,847
The aging analyses of receivables as at December 31 are as follows:
2015 2014(In Thousands)
Neither past due nor impaired P=30,564,617 P=30,301,899Past due but not impaired:
Less than 30 days 2,666,853 2,499,32831–90 days 2,153,625 1,888,20491–120 days 733,877 585,374Over 120 days 3,197,929 3,753,746
Impaired 965,859 352,847
P=40,282,760 P=39,381,398
Receivables, except for those that are impaired, are assessed by the Company’s management asnot impaired, good and collectible.
9. Condominium and Residential Units for Sale
This account consists of:
2015 2014(In Thousands)
Condominium units for sale P=7,780,550 P=7,177,902Residential units and subdivision lots 384,431 400,983
P=8,164,981 P=7,578,885
The movements in “Condominium units for sale” account are as follows:
2015 2014(In Thousands)
At beginning of the year P=7,177,902 P=5,788,429Transfer from land and development (see Note 10) 5,720,176 3,997,101Cost of real estate sold (see Note 22) (5,117,528) (2,607,628)
At end of the year P=7,780,550 P=7,177,902
Condominium units for sale pertains to the completed projects of SMDC, HPI and Costa. Theseare stated at cost as at December 31, 2015 and 2014.

- 42 -
*SGVFS015635*
The movements in “Residential units and subdivision lots” account are as follows:
2015 2014(In Thousands)
At beginning of the year P=400,983 P=314,224Transfer from land and development (see Note 10) 304,988 156,231Cost of real estate sold (see Note 22) (321,540) (69,472)
At end of the year P=384,431 P=400,983
Residential units and subdivision lots for sale are stated at cost as at December 31, 2015 and 2014.
10. Land and Development
This account consists of:
2015 2014(In Thousands)
Land and development P=41,053,508 P=40,856,084Land held for future development 1,866,660 1,601,748
42,920,168 42,457,832Less noncurrent portion 23,105,553 22,886,306
P=19,814,615 P=19,571,526
Land and DevelopmentThe movements in “Land and development” account are as follows:
2015 2014(In Thousands)
At beginning of the year P=40,856,084 P=33,302,111Development cost incurred 11,165,617 14,677,138Land acquisitions 1,203,487 6,883,083Capitalized borrowing cost 407,549 690,462Cost of real estate sold (see Note 22) (6,600,008) (9,579,932)Transfer to condominium and residential units
for sale (see Note 9) (6,025,164) (4,153,332)Reclassified from property and equipment
(see Note 13) 1,327 –Others 44,616 (963,446)
At end of the year P=41,053,508 P=40,856,084
Borrowing costs capitalized to land and development account amounted to P=408 million andP=690 million in 2015 and 2014, respectively. The average rates used to determine the amount ofborrowing costs eligible for capitalization range from 2.0% to 5.2% in 2015 and from 3.9% to4.9% in 2014.
SMDCLand and development include those attributable to SMDC which pertain to the on-goingresidential condominium projects. Estimated cost to complete the projects amounted toP=23,440 million and P=31,912 million as at December 31, 2015 and 2014, respectively.

- 43 -
*SGVFS015635*
CostaCosta’s land and development projects located at Hamilo Coast in Nasugbu, Batangas consistof condominium buildings and macro-infrastructure. Estimated liability pertaining to ongoingmacro-infrastructure projects amounted to P=219 million and P=290 million as atDecember 31, 2015 and 2014, respectively.
As at December 31, 2015, the development of macro-infrastructure is still ongoing.
HPIEstimated cost to complete HPI’s ongoing projects amounted to P=831 million andP=1,181 million as at December 31, 2015 and 2014, respectively.
Land Held for Future DevelopmentThis represents substantially parcels of land acquired by HPI from Belle Corporation (Belle). Themovements in “Land held for future development” are as follows:
2015 2014(In Thousands)
At beginning of the year P=1,601,748 P=1,519,073Acquisition and transferred-in costs and others 264,912 82,675
At end of year P=1,866,660 P=1,601,748
Land and development is stated at cost as at December 31, 2015 and 2014. There is no allowancefor inventory write-down as at December 31, 2015 and 2014.
11. Available-for-sale Investments
This account consists of investments in:
2015 2014(In Thousands)
Shares of stock:Listed (see Note 21) P=20,323,495 P=29,663,165Unlisted 8,560 8,573
20,332,055 29,671,738Less noncurrent portion 19,689,781 28,994,983
P=642,274 P=676,755
Listed shares of stock pertain to investments in publicly-listed companies.
Unlisted shares of stock pertain to stocks of private corporations. These are classified as AFSinvestments and are carried at cost since fair value cannot be reliably estimated due to lack ofreliable estimates of future cash flows and discount rates necessary to calculate the fair value.There is currently no market for these investments and the Company intends to hold them forthe long term.
On February 25, 2015, the Company sold a portion of its listed shares of stock to SMIC based on a5% discount to 30-day volume-weighted average price as of trade date resulting to a realized gainamounting to P=7,410 million (see Note 21). In 2014 and 2013, shares with acquisition cost ofP=2 million and P=101 million were sold resulting to a realized gain amounting to P=3 million and

- 44 -
*SGVFS015635*
P=285 million, respectively. Realized gain on sale of available-for-sale investments is shown ascomponent of “Other Income” in the consolidated statements of income.
Dividend income from investments in listed and unlisted shares of stock amounted toP=541 million, P=322 million and P=389 million for the years ended December 31, 2015, 2014 and2013, respectively.
Interest income earned from investment in corporate notes amounted to nil, nil and P=34 million forthe years ended December 31, 2015, 2014 and 2013, respectively (see Note 23).
The movements in the “Net unrealized gain on AFS investments” account are as follows:
2015 2014(In Thousands)
At beginning of the year P=25,905,440 P=19,958,330Realized gain on sale of AFS investments (7,410,711) (2,743)Unrealized gain (loss) due to changes in fair value (1,873,182) 5,949,853
At end of the year P=16,621,547 P=25,905,440
12. Prepaid Expenses and Other Current Assets
This account consists of:
2015 2014(In Thousands)
Advances and deposits P=4,829,512 P=2,991,975Input and creditable withholding taxes 3,467,461 3,203,920Prepaid taxes and other prepayments 2,108,087 1,948,049Cash in escrow (see Note 21) 437,639 667,778Supplies and inventories 402,347 323,285Advances for project development – 16,467Others 57,825 137,843
P=11,302,871 P=9,289,317
Advances pertain to downpayments made to suppliers or contractors to cover preliminaryexpenses of the contractors in construction projects. The amounts are noninterest-bearing andare recouped upon every progress billing payment depending on the percentage ofaccomplishment. This account also includes construction bonds, rental deposits and depositsfor utilities and advertisements.
Input tax represents VAT paid to suppliers that can be claimed as credit against the futureoutput VAT liabilities without prescription. Creditable withholding tax is the tax withheld bythe withholding agents from payments to the Company which can be applied against theincome tax payable.
Prepaid taxes and other prepayments consist of prepayments for insurance, real property taxes,rent, and other expenses which are normally utilized within the next financial period.

- 45 -
*SGVFS015635*
Cash in escrow pertains to the amounts deposited in the account of an escrow agent asrequired by the Housing and Land Use Regulatory Board (HLURB) in connection withSMDC’s temporary license to sell properties for specific projects prior to HLURB’s issuanceof a license to sell and certificate of registration. Under this temporary license to sell, allpayments, inclusive of down payments, reservation and monthly amortization, among others,made by buyers within the selling period shall be deposited in the escrow account.
Also included in cash in escrow are deposits made in 2015 and 2014 for payments of liabilityarising from acquisition of land.
Interest income earned from the cash in escrow amounted to P=24 million, P=7 million andP=5 million for the years ended December 31, 2015, 2014 and 2013, respectively (see Note 23).
13. Property and Equipment
The movements in this account are as follows:
Land and
Improvements
Buildings andLeasehold
Improvements
DataProcessing
Equipment
Transportation
Equipment
Furniture,Fixtures and
Equipment
Construction
in Progress Total
(In Thousands)
Cost
Balance at December 31, 2013 P=270,871 P=1,245,729 P=143,240 P=98,999 P=1,065,210 P=– P=2,824,049Additions 609 45,537 47,905 12,881 115,600 7,827 230,359
Disposals – (92,576) (6,295) (1,443) (24,529) – (124,843)Reclassifications (54,163) 1,113,654 52,641 44,272 (19,421) – 1,136,983
Balance at December 31, 2014 217,317 2,312,344 237,491 154,709 1,136,860 7,827 4,066,548Additions 207 42,180 65,308 87,199 66,112 2,755 263,761
Disposals/retirements – (3,553) (10) (3,097) (33,662) – (40,322)
Reclassifications(see Notes 10 and 14) – (727,330) (133,075) 8,725 (551,122) (10,582) (1,413,384)
Balance at December 31, 2015 P=217,524 P=1,623,641 P=169,714 P=247,536 P=618,188 P=– P=2,876,603
Accumulated Depreciation
and Amortization
Balance at December 31, 2013 P=105,932 P=542,690 P=80,077 P=53,832 P=462,625 P=– P=1,245,156Depreciation and amortization
(see Note 22) 23 211,202 67,506 13,878 184,817 – 477,426Disposals/retirements – (39,323) (3,343) (1,325) (8,509) – (52,500)
Reclassifications (105,932) 192,179 13,346 14,132 24,354 – 138,079
Balance at December 31, 2014 23 906,748 157,586 80,517 663,287 – 1,808,161Depreciation and amortization
(see Note 22) 73 128,812 33,417 25,486 83,645 – 271,433Disposals/retirements – (716) (199) (1,866) (9,693) – (12,474)
Reclassifications(see Notes 10 and 14) – (422,637) (83,659) 15,590 (380,193) – (870,899)
Balance at December 31, 2015 P=96 P=612,207 P=107,145 P=119,727 P=357,046 P=– P=1,196,221
Net Book ValueAs at December 31, 2014 P=217,294 P=1,405,596 P=79,905 P=74,192 P=473,573 P=7,827 P=2,258,387
As at December 31, 2015 217,428 1,011,434 62,569 127,809 261,142 – 1,680,382
As at December 31, 2015 and 2014, the carrying amount of fully depreciated property andequipment still in use amounted to P=155 million and P=159 million, respectively.
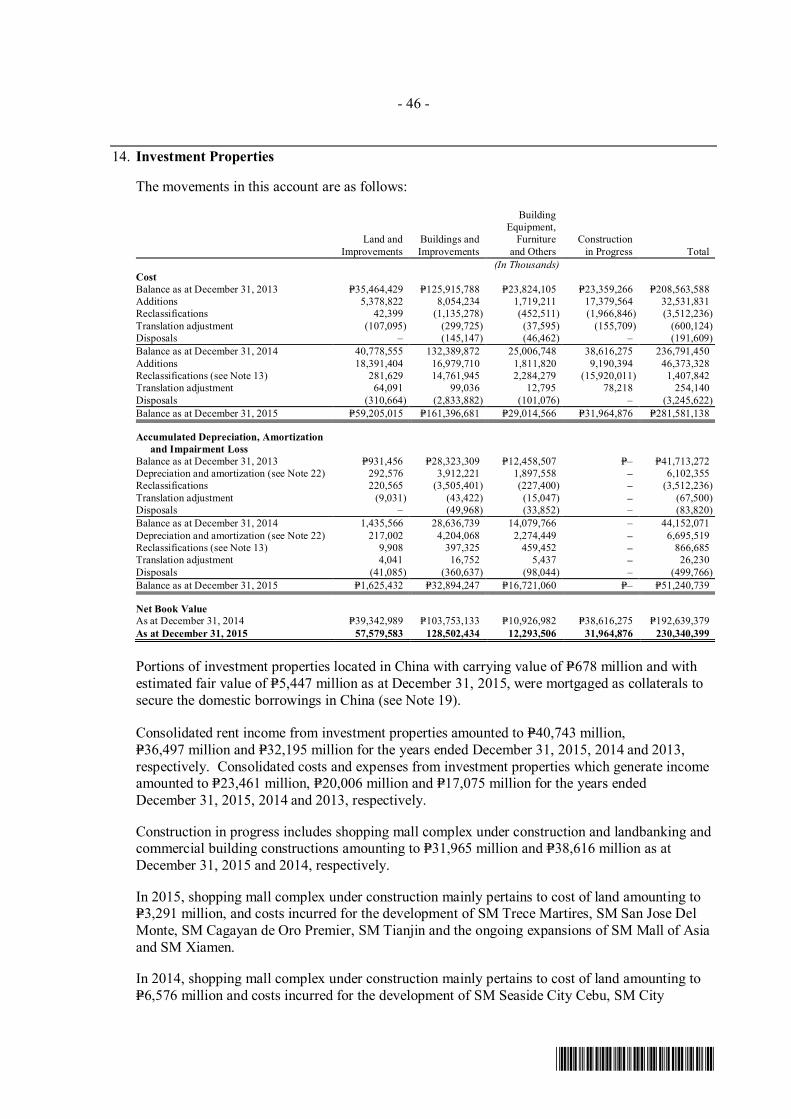
- 46 -
*SGVFS015635*
14. Investment Properties
The movements in this account are as follows:
Land and
Improvements
Buildings and
Improvements
BuildingEquipment,
Furniture
and Others
Construction
in Progress Total
(In Thousands)
Cost
Balance as at December 31, 2013 P=35,464,429 P=125,915,788 P=23,824,105 P=23,359,266 P=208,563,588Additions 5,378,822 8,054,234 1,719,211 17,379,564 32,531,831Reclassifications 42,399 (1,135,278) (452,511) (1,966,846) (3,512,236)
Translation adjustment (107,095) (299,725) (37,595) (155,709) (600,124)Disposals – (145,147) (46,462) – (191,609)
Balance as at December 31, 2014 40,778,555 132,389,872 25,006,748 38,616,275 236,791,450
Additions 18,391,404 16,979,710 1,811,820 9,190,394 46,373,328Reclassifications (see Note 13) 281,629 14,761,945 2,284,279 (15,920,011) 1,407,842Translation adjustment 64,091 99,036 12,795 78,218 254,140
Disposals (310,664) (2,833,882) (101,076) – (3,245,622)
Balance as at December 31, 2015 P=59,205,015 P=161,396,681 P=29,014,566 P=31,964,876 P=281,581,138
Accumulated Depreciation, Amortization
and Impairment Loss
Balance as at December 31, 2013 P=931,456 P=28,323,309 P=12,458,507 P=– P=41,713,272Depreciation and amortization (see Note 22) 292,576 3,912,221 1,897,558 – 6,102,355Reclassifications 220,565 (3,505,401) (227,400) – (3,512,236)
Translation adjustment (9,031) (43,422) (15,047) – (67,500)Disposals – (49,968) (33,852) – (83,820)
Balance as at December 31, 2014 1,435,566 28,636,739 14,079,766 – 44,152,071
Depreciation and amortization (see Note 22) 217,002 4,204,068 2,274,449 – 6,695,519Reclassifications (see Note 13) 9,908 397,325 459,452 – 866,685Translation adjustment 4,041 16,752 5,437 – 26,230
Disposals (41,085) (360,637) (98,044) – (499,766)
Balance as at December 31, 2015 P=1,625,432 P=32,894,247 P=16,721,060 P=– P=51,240,739
Net Book Value
As at December 31, 2014 P=39,342,989 P=103,753,133 P=10,926,982 P=38,616,275 P=192,639,379
As at December 31, 2015 57,579,583 128,502,434 12,293,506 31,964,876 230,340,399
Portions of investment properties located in China with carrying value of P=678 million and withestimated fair value of P=5,447 million as at December 31, 2015, were mortgaged as collaterals tosecure the domestic borrowings in China (see Note 19).
Consolidated rent income from investment properties amounted to P=40,743 million,P=36,497 million and P=32,195 million for the years ended December 31, 2015, 2014 and 2013,respectively. Consolidated costs and expenses from investment properties which generate incomeamounted to P=23,461 million, P=20,006 million and P=17,075 million for the years endedDecember 31, 2015, 2014 and 2013, respectively.
Construction in progress includes shopping mall complex under construction and landbanking andcommercial building constructions amounting to P=31,965 million and P=38,616 million as atDecember 31, 2015 and 2014, respectively.
In 2015, shopping mall complex under construction mainly pertains to cost of land amounting toP=3,291 million, and costs incurred for the development of SM Trece Martires, SM San Jose DelMonte, SM Cagayan de Oro Premier, SM Tianjin and the ongoing expansions of SM Mall of Asiaand SM Xiamen.
In 2014, shopping mall complex under construction mainly pertains to cost of land amounting toP=6,576 million and costs incurred for the development of SM Seaside City Cebu, SM City

- 47 -
*SGVFS015635*
Cabanatuan, SM Center San Mateo, SM Tianjin and SM Zibo and the expansions and renovationsof SM Mall of Asia, SM City Sta. Rosa, SM City Iloilo, SM City Taytay and SM City San Lazaro.
Construction contracts with various contractors related to the construction of the above-mentionedprojects amounted to P=106,136 million and P=81,977 million as at December 31, 2015 and 2014,respectively, inclusive of overhead, cost of labor and materials and all other costs necessary for theproper execution of the works. The outstanding contracts are valued at P=24,304 million andP=17,272 million as at December 31, 2015 and 2014, respectively.
Interest capitalized to the construction of investment properties amounted to P=2,039 million,P=51 million and P=77 million for the years ended December 31, 2015, 2014 and 2013, respectively.Capitalization rates used range from 2.06% to 6.07%, from 4.61% to 5.99% and from 5.83% to7.20% for the years ended December 31, 2015, 2014 and 2013, respectively. In 2015, foreignexchange loss amounting to P=642 million were also capitalized to the construction of investmentproperty.
The fair value of investment properties amounted to P=540,040 million as at February 28, 2013 asdetermined by an independent appraiser who holds a recognized and relevant professionalqualification. The valuation of investment properties was based on market values using incomeapproach. The fair value represents the amount at which the assets can be exchanged between aknowledgeable, willing seller and a knowledgeable, willing buyer in an arm’s length transaction atthe date of valuation, in accordance with International Valuation Standards as set out by theInternational Valuation Standards Committee.
Below are the significant assumptions used in the valuation:
Discount rate 10.00%Capitalization rate 7.40%Average growth rate 5.00%
Investment properties are categorized under Level 3 fair value measurement.
While the valuation of the investment properties as at December 31, 2015 is still on-going, theCompany’s management believes that there were no conditions present in 2015 and 2014 thatwould significantly reduce the fair value of the investment properties from that determined onFebruary 28, 2013.
The Company has no restriction on the realizability of its investment properties and no obligationto either purchase, construct or develop or for repairs, maintenance and enhancements.
15. Investments in Associates and Joint Ventures
Investments in AssociatesThis pertains mainly to investments in the following companies:
OCLP Holdings, Inc. (OHI)
Fei Hua Real Estate Company (FHREC)
On May 7, 2015, SMPH acquired 39.96% collective ownership interest in OHI, throughacquisition of 100% interest in six (6) holding entities, for a total consideration ofP=15,433 million, which approximates the proportionate share of SMPH in the fair values of theidentifiable net assets of OHI. OHI owns strategic residential, commercial and landbank areas inkey cities in Metro Manila.

- 48 -
*SGVFS015635*
As at December 31, 2015, OHI’s total assets, total liabilities and total equity amounted toP=23,664 million, P=19,944 million and P=3,720 million, respectively. The cost of investment in OHIamounted to P=15,433 million, which consists of its proportionate share in the net assets of OHIamounting to P=1,661 million and fair value adjustments and others totaling P=13,772 million. In2015, the share in profit and total comprehensive income amounted to P=27 million.
On April 10, 2012, SMPH, through TRC, entered into a Memorandum of Agreement withTrendlink Holdings Limited (THL), a third party, wherein Fei Hua Real Estate Company(FHREC), a company incorporated in China and 100% subsidiary of TRC, issued new shares toTHL equivalent to 50% equity interest. In addition, THL undertakes to pay for the differencebetween cash invested and the 50% equity of FHREC and the difference between the currentmarket value and cost of the investment properties of FHREC. Management assessed that SMPHlost control over FHREC by virtue of the agreement with the shareholders of THL. Consequently,FHREC became an associate of SMPH (see Note 8).
The carrying value of investment in FHREC amounted to P=1,109 million and P=749 million as atDecember 31, 2015 and 2014, respectively. This consists of the acquisition cost amounting toP=277 million and P=276 million as at December 31, 2015 and 2014, respectively, and cumulativeequity in net earnings amounting to P=832 million and P=473 million as at December 31, 2015 and2014, respectively. The share in profit and total comprehensive income amounted toP=356 million, P=183 million and P=295 million for the years ended December 31, 2015, 2014 and2013, respectively.
Investment in Joint VenturesOn January 7, 2013, SMPH entered into Shareholders Agreement and Share Purchase Agreementfor the acquisition of 51% ownership interest in the following companies (collectively,Waltermart):
Winsome Development CorporationWillin Sales, Inc.Willimson, Inc.Waltermart Ventures, Inc.WM Development, Inc.
On July 12, 2013, the Deeds of Absolute Sale were executed between SMPH and shareholders ofWaltermart. Waltermart is involved in shopping mall operations and currently owns 21 mallsacross Metro Manila and Luzon. The investments in Waltermart were accounted as joint venturesusing equity method of accounting because the contractual arrangement between the partiesestablishes joint control.
The aggregate carrying values of investments in joint ventures amounted to P=5,501 million andP=5,302 million as at December 31, 2015 and 2014, respectively. These consist of the acquisitioncosts totaling P=5,115 million and cumulative equity in net earnings totaling P=386 million andP=187 million as at December 31, 2015 and 2014, respectively. The aggregate share in profit andtotal comprehensive income amounted to P=199 million, P=122 million and P=65 million for the yearsended December 31, 2015, 2014 and 2013, respectively.
The Company has no outstanding contingent liabilities or capital commitments related to itsinvestments in associates and joint ventures as at December 31, 2015 and 2014.

- 49 -
*SGVFS015635*
16. Other Noncurrent Assets
This account consists of:
2015 2014(In Thousands)
Bonds and deposits P=9,454,397 P=6,604,419Land use rights 9,563,565 9,541,287Receivables from sale of real estate - net of current
portion (see Note 8) 7,962,615 8,341,583Time deposits (see Note 21) 4,561,849 2,412,190Deferred input tax 2,805,664 1,583,025Others (see Note 24) 1,145,133 1,228,581
P=35,493,223 P=29,711,085
Bonds and DepositsBonds and deposits consist of deposits to contractors and suppliers to be applied throughoutconstruction and advances, deposits paid for leased properties to be applied at the last term of thelease and advance payments for land acquisitions which will be applied against the purchase priceof the properties upon fulfillment by both parties of certain undertakings and conditions.
Land use rightsIncluded under “Land use rights” account are the 89,378 and 212,119 square meters of real estateproperties with a carrying value of P=361 million and P=488 million as at December 31, 2015 and2014, respectively, and a fair value of P=12,830 million and P=13,531 million as at August 2007,planned for residential development in accordance with the cooperative contracts entered into bySMPH with Grand China International Limited (Grand China) and Oriental Land DevelopmentLimited (Oriental Land) on March 15, 2007. The value of these real estate properties were notpart of the consideration amounting to P=10,827 million paid by SMPH to Grand China andOriental Land. Accordingly, the assets were recorded at their carrying values under “Othernoncurrent assets” account and a corresponding liability equivalent to the same amount, which isshown as part of “Other noncurrent liabilities” account in the consolidated balance sheets.
Time DepositsTime deposits with various maturities within one year, amounting to P=4,562 million andP=2,412 million as of December 31, 2015 and 2014, respectively, were used as collateral for use ofcredit lines obtained by the Company from related party banks. Interest income earned amountedto P=131 million, P=91 million and P=57 million for the years ended December 31, 2015, 2014 and2013, respectively (see Note 23).
17. Loans Payable
This account consists of unsecured Philippine peso-denominated loans obtained from local banksamounting to P=4,675 million and P=2,670 million as at December 31, 2015 and 2014, respectively,with due dates of less than one year. These loans bear interest rates ranging from 2.00% to 4.15%in 2015 and 2014.
Interest expense incurred from loans payable amounted to P=261 million, P=106 million andP=275 million for the years ended December 31, 2015, 2014 and 2013, respectively (see Note 23).

- 50 -
*SGVFS015635*
18. Accounts Payable and Other Current Liabilities
This account consists of:
2015 2014(In Thousands)
Trade:Third parties P=17,485,188 P=15,398,110Related parties (see Note 21) 61,283 30,281
Accrued operating expenses:Third parties 9,647,340 6,991,653Related parties (see Note 21) 692,897 677,047
Tenants’ and customers’ deposits 17,641,578 15,771,187Liability for purchased land 5,602,380 4,774,116Deferred output VAT 1,289,236 1,107,056Accrued interest (see Note 21) 767,172 591,056Payable to government agencies 630,989 616,300Nontrade 321,988 1,018,539Due to related parties (see Note 21) 88,869 147,432Others 864,100 3,678,423
55,093,020 50,801,200Less noncurrent portion 16,273,864 14,422,381
P=38,819,156 P=36,378,819
The terms and conditions of the above liabilities follow:
Trade payables primarily consist of liabilities to suppliers and contractors, which arenoninterest-bearing and are normally settled within a 30-day term.
The terms and conditions relating to due to related parties are further discussed in Note 21.
Accrued operating expenses pertain to accrued selling, general and administrative expenseswhich are normally settled throughout the financial period. Accrued operating expenses -third parties consist of:
2015 2014(In Thousands)
Utilities P=3,870,702 P=3,762,036Marketing and advertising 650,491 424,155Payable to contractors and others 5,126,147 2,805,462
P=9,647,340 P=6,991,653
Customers’ deposits mainly represent excess of collections from buyers over the relatedrevenue recognized based on the percentage of completion method. This also includesnonrefundable reservation fees by prospective buyers which are to be applied against thereceivable upon recognition of revenue. Tenants’ deposits refers to security deposits receivedfrom various tenants upon inception of the respective lease contracts on the Company’sinvestment properties. At the termination of the lease contracts, the deposits received by theCompany are returned to tenants, reduced by unpaid rental fees, penalties and/or deductionsfrom repairs of damaged leased properties, if any.

- 51 -
*SGVFS015635*
Deferred output VAT represents output VAT on unpaid portion of recognized receivable fromsale of real estate. This amount is reported as output VAT upon collection of the receivables.
Liability for purchased land, payable to government agencies, accrued interest and otherpayables are normally settled throughout the financial period.
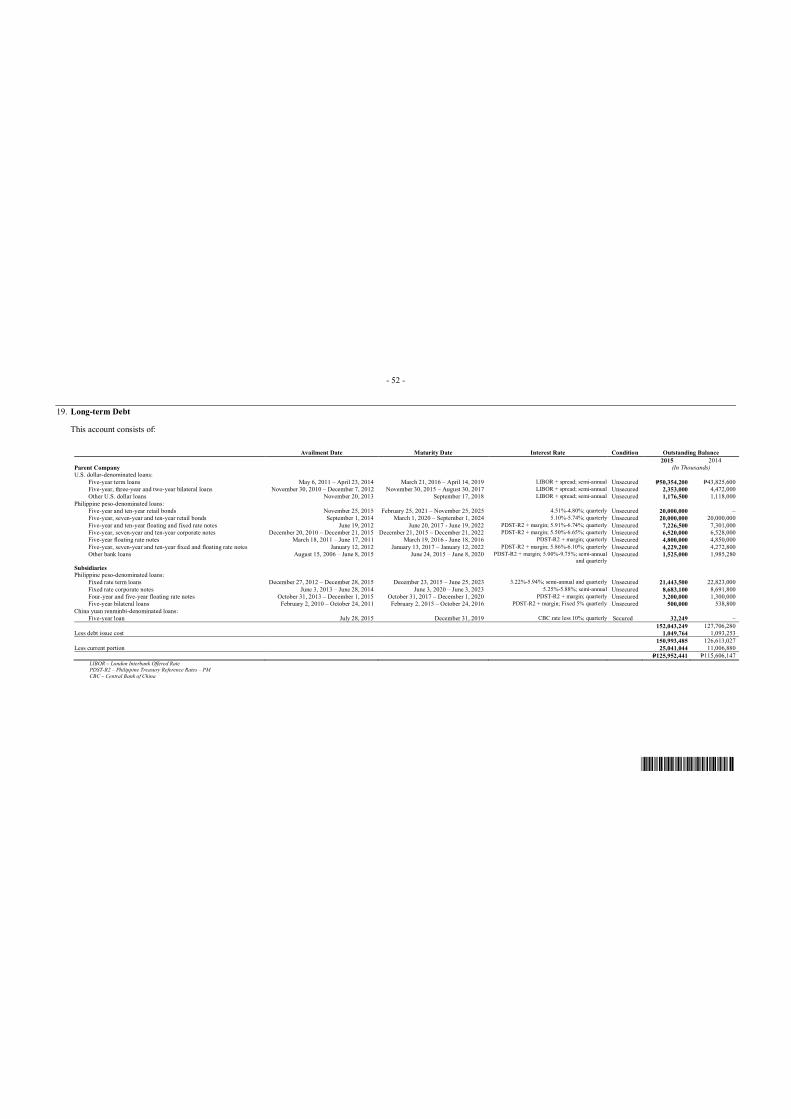
- 52 -
*SGVFS015635*
19. Long-term Debt
This account consists of:
Availment Date Maturity Date Interest Rate Condition Outstanding Balance
2015 2014
Parent Company (In Thousands)
U.S. dollar-denominated loans:
Five-year term loans May 6, 2011 – April 23, 2014 March 21, 2016 – April 14, 2019 LIBOR + spread; semi-annual Unsecured P=50,354,200 P=43,825,600Five-year, three-year and two-year bilateral loans November 30, 2010 – December 7, 2012 November 30, 2015 – August 30, 2017 LIBOR + spread; semi-annual Unsecured 2,353,000 4,472,000Other U.S. dollar loans November 20, 2013 September 17, 2018 LIBOR + spread; semi-annual Unsecured 1,176,500 1,118,000
Philippine peso-denominated loans:Five-year and ten-year retail bonds November 25, 2015 February 25, 2021 – November 25, 2025 4.51%-4.80%; quarterly Unsecured 20,000,000 –Five-year, seven-year and ten-year retail bonds September 1, 2014 March 1, 2020 – September 1, 2024 5.10%-5.74%; quarterly Unsecured 20,000,000 20,000,000
Five-year and ten-year floating and fixed rate notes June 19, 2012 June 20, 2017 - June 19, 2022 PDST-R2 + margin; 5.91%-6.74%; quarterly Unsecured 7,226,500 7,301,000Five-year, seven-year and ten-year corporate notes December 20, 2010 – December 21, 2015 December 21, 2015 – December 21, 2022 PDST-R2 + margin; 5.50%-6.65%; quarterly Unsecured 6,520,000 6,528,000Five-year floating rate notes March 18, 2011 – June 17, 2011 March 19, 2016 - June 18, 2016 PDST-R2 + margin; quarterly Unsecured 4,800,000 4,850,000
Five-year, seven-year and ten-year fixed and floating rate notes January 12, 2012 January 13, 2017 – January 12, 2022 PDST-R2 + margin; 5.86%-6.10%; quarterly Unsecured 4,229,200 4,272,800Other bank loans August 15, 2006 – June 8, 2015 June 24, 2015 – June 8, 2020 PDST-R2 + margin; 5.00%-9.75%; semi-annual
and quarterlyUnsecured 1,525,000 1,985,280
Subsidiaries
Philippine peso-denominated loans:Fixed rate term loans December 27, 2012 – December 28, 2015 December 23, 2015 – June 25, 2023 3.22%-5.94%; semi-annual and quarterly Unsecured 21,443,500 22,823,000
Fixed rate corporate notes June 3, 2013 – June 28, 2014 June 3, 2020 – June 3, 2023 5.25%-5.88%; semi-annual Unsecured 8,683,100 8,691,800Four-year and five-year floating rate notes October 31, 2013 – December 1, 2015 October 31, 2017 – December 1, 2020 PDST-R2 + margin; quarterly Unsecured 3,200,000 1,300,000Five-year bilateral loans February 2, 2010 – October 24, 2011 February 2, 2015 – October 24, 2016 PDST-R2 + margin; Fixed 5% quarterly Unsecured 500,000 538,800
China yuan renminbi-denominated loans:Five-year loan July 28, 2015 December 31, 2019 CBC rate less 10%; quarterly Secured 32,249 –
152,043,249 127,706,280Less debt issue cost 1,049,764 1,093,253
150,993,485 126,613,027
Less current portion 25,041,044 11,006,880
P=125,952,441 P=115,606,147
LIBOR – London Interbank Offered RatePDST-R2 – Philippine Treasury Reference Rates – PM
CBC – Central Bank of China

- 53 -
*SGVFS015635*
Parent Company
U.S. Dollar-denominated Five-Year Term LoansThis includes the following:
A US$300 million syndicated loan obtained on various dates in 2013. The loans bear aninterest rate based on London Inter-Bank Offered Rate (LIBOR) plus spread, with a bulletmaturity on March 25, 2018. A portion of the loan amounting to US$150 million is hedgedagainst interest rate and foreign exchange risks using cross currency swap contracts(see Notes 27 and 28).
A US$200 million syndicated loan obtained on January 29, 2013. The loan bears an interestrate based on LIBOR plus spread, with a bullet maturity on January 29, 2018. This loan ishedged against interest rate and foreign exchange risks using cross currency swap contracts(see Notes 27 and 28).
Philippine Peso-denominated Five-Year and Ten-Year Retail Bonds
This represents a P=20 billion fixed rate bonds issued on November 25, 2015. The issueconsists of the five-year and three months or Series D Bonds amounting to P=17,969 millionwith a fixed interest rate equivalent to 4.5095% per annum due on February 25, 2021 andten-year or Series E Bonds amounting to P=2,031 million with a fixed interest rate equivalent to4.7990% per annum due on November 25, 2025.
Philippine Peso-denominated Five-Year, Seven-Year and Ten-Year Retail Bonds
This represents a P=20 billion fixed rate bonds issued on September 1, 2014. The issue consistsof the five-year and six months or Series A Bonds amounting to P=15,036 million with a fixedinterest rate equivalent to 5.1000% per annum due on March 1, 2020, seven-year or Series BBonds amounting to P=2,362 million with a fixed interest rate equivalent to 5.2006% perannum due on September 1, 2021, and ten-year or Series C Bonds amounting toP=2,602 million with a fixed interest rate equivalent to 5.7417% per annum due onSeptember 1, 2024.
Subsidiaries
China Yuan Renminbi-denominated Five-Year Loans
This represents a ¥5 million, out of ¥400 million loan facility obtained on July 28, 2015 tofinance the construction of shopping malls. The loan is payable in quarterly installments untilDecember 2019. The loan has a floating rate with a quarterly re-pricing at prevailing ratedictated by People’s Bank of China. The loan carries an interest rate of 5.00% and is securedby a portion of investment properties in China (see Note 14).
The loan agreements of the Company provide certain restrictions and requirements principallywith respect to maintenance of required financial ratios (i.e., current ratio of not less than1.00:1.00, debt to equity ratio of not more than 0.70:0.30 to 0.75:0.25 and interest coverage ratioof not less than 2.50:1.00) and material change in ownership or control. As at December 31, 2015and 2014, the Company is in compliance with the terms of its loan covenants.
The re-pricing frequencies of floating rate loans of the Company range from three to six months.

- 54 -
*SGVFS015635*
Interest expense incurred from long-term debt amounted to P=3,038 million, P=3,824 million andP=3,218 million for the years ended December 31, 2015, 2014 and 2013, respectively (seeNote 23).
Debt Issue CostThe movements in unamortized debt issue cost of the Company follow:
2015 2014(In Thousands)
Balance at beginning of the year P=1,093,253 P=957,093Additions 290,082 450,804Amortization (333,571) (314,644)
Balance at end of the year P=1,049,764 P=1,093,253
Amortization of debt issuance costs is recognized in the consolidated statements of income under“Others - net” account.
Repayment ScheduleThe repayments of long-term debt are scheduled as follows:
Gross Loan Debt Issue Cost Net(In Thousands)
2016 P=25,041,044* (P=338,600) P=24,702,4442017 9,089,344 (303,051) 8,786,2932018 29,601,144 (191,778) 29,409,3662019 22,150,017 (112,082) 22,037,9352020 23,866,060 (60,061) 23,805,9992021 21,999,780 (22,304) 21,977,4762022 11,243,260 (9,604) 11,233,6562023 4,419,860 (6,327) 4,413,5332024 2,601,700 (4,014) 2,597,6862025 2,031,040 (1,943) 2,029,097
P=152,043,249 (P=1,049,764) P=150,993,485* Including U.S. Dollar-denominated Five-Year Term Loans amounting to US$270 million which was refinanced in January 2016.
20. Equity
Capital StockOn May 31, 2013, the BOD approved the increase in the authorized capital stock of the Companyby P=20,000 million, from P=20,000 million consisting of 20,000 million common shares with a parvalue of P=1 per share to P=40,000 million consisting of 40,000 million common shares with a parvalue of P=1 per share, and the consequent amendment of Article VII of the Articles ofIncorporation. On October 10, 2013, the SEC approved the Company’s application for increase inits authorized capital stock.
As at December 31, 2015 and 2014, the Company has an authorized capital stock of40,000 million with a par value of P=1 a share, of which 33,166 million shares were issued.
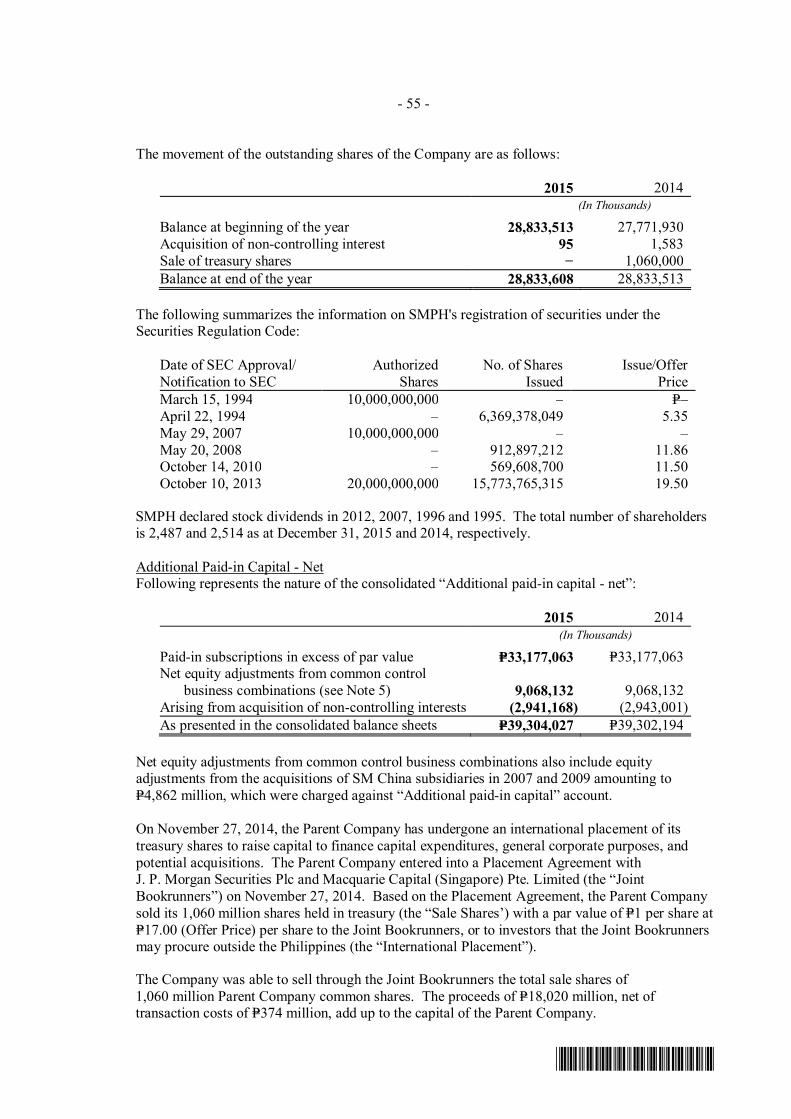
- 55 -
*SGVFS015635*
The movement of the outstanding shares of the Company are as follows:
2015 2014(In Thousands)
Balance at beginning of the year 28,833,513 27,771,930Acquisition of non-controlling interest 95 1,583Sale of treasury shares 1,060,000
Balance at end of the year 28,833,608 28,833,513
The following summarizes the information on SMPH's registration of securities under theSecurities Regulation Code:
Date of SEC Approval/Notification to SEC
AuthorizedShares
No. of SharesIssued
Issue/OfferPrice
March 15, 1994 10,000,000,000 – P=–April 22, 1994 – 6,369,378,049 5.35May 29, 2007 10,000,000,000 – –May 20, 2008 – 912,897,212 11.86October 14, 2010 – 569,608,700 11.50October 10, 2013 20,000,000,000 15,773,765,315 19.50
SMPH declared stock dividends in 2012, 2007, 1996 and 1995. The total number of shareholdersis 2,487 and 2,514 as at December 31, 2015 and 2014, respectively.
Additional Paid-in Capital - NetFollowing represents the nature of the consolidated “Additional paid-in capital - net”:
2015 2014(In Thousands)
Paid-in subscriptions in excess of par value P=33,177,063 P=33,177,063Net equity adjustments from common control
business combinations (see Note 5) 9,068,132 9,068,132Arising from acquisition of non-controlling interests (2,941,168) (2,943,001)
As presented in the consolidated balance sheets P=39,304,027 P=39,302,194
Net equity adjustments from common control business combinations also include equityadjustments from the acquisitions of SM China subsidiaries in 2007 and 2009 amounting toP=4,862 million, which were charged against “Additional paid-in capital” account.
On November 27, 2014, the Parent Company has undergone an international placement of itstreasury shares to raise capital to finance capital expenditures, general corporate purposes, andpotential acquisitions. The Parent Company entered into a Placement Agreement withJ. P. Morgan Securities Plc and Macquarie Capital (Singapore) Pte. Limited (the “JointBookrunners”) on November 27, 2014. Based on the Placement Agreement, the Parent Companysold its 1,060 million shares held in treasury (the “Sale Shares’) with a par value of P=1 per share atP=17.00 (Offer Price) per share to the Joint Bookrunners, or to investors that the Joint Bookrunnersmay procure outside the Philippines (the “International Placement”).
The Company was able to sell through the Joint Bookrunners the total sale shares of1,060 million Parent Company common shares. The proceeds of P=18,020 million, net oftransaction costs of P=374 million, add up to the capital of the Parent Company.

- 56 -
*SGVFS015635*
Retained EarningsIn 2015, the BOD approved the declaration of cash dividend of P=0.21 per share or P=6,065 millionto stockholders of record as of May 14, 2015, P=10 million of which was received by SMDC. Thiswas paid on June 9, 2015. In 2014, the BOD approved the declaration of cash dividend ofP=0.19 per share or P=5,286 million to stockholders of record as of May 15, 2014, P=9 million ofwhich was received by SMDC. In 2013, the BOD approved the declaration of cash dividend ofP=0.27 per share or P=4,691 million.
As at December 31, 2015 and 2014, the amount of retained earnings appropriated for thecontinuous corporate and mall expansions amounted to P=42,200 million.
For the year 2016, the Company expects to incur capital expenditures of at least P=60 billion.
The retained earnings account is restricted for the payment of dividends to the extent ofP=49,834 million and P=40,453 million as at December 31, 2015 and 2014, respectively,representing the cost of shares held in treasury (P=3,355 million and P=3,356 million as atDecember 31, 2015 and 2014, respectively) and accumulated equity in net earnings of SMPHsubsidiaries, associates and joint ventures totaling P=46,479 million and P=37,097 million as atDecember 31, 2015 and 2014, respectively. The accumulated equity in net earnings ofsubsidiaries is not available for dividend distribution until such time that the Parent Companyreceives the dividends from its subsidiaries, associates and joint ventures.
Treasury StockAs at December 31, 2015 and 2014, this includes reacquired capital stock and shares held by asubsidiary stated at acquisition cost of P=3,355 million and P=3,356 million, respectively. Themovement of the treasury stock of the Company are as follows:
2015 2014(In Thousands)
Balance at beginning of year 4,332,787 5,394,370Acquisition of non-controlling interest (95) (1,583)Sale of treasury shares (1,060,000)
Balance at end of year 4,332,692 4,332,787
21. Related Party Transactions
Parties are considered to be related if one party has the ability, directly and indirectly, to controlthe other party or exercise significant influence over the other party in making financial andoperating decisions. Parties are also considered to be related if they are subject to commoncontrol. Related parties may be individuals or corporate entities.
Terms and Conditions of Transactions with Related PartiesThere have been no guarantees/collaterals provided or received for any related party receivables orpayables. For the years ended December 31, 2015 and 2014, the Company has not recorded anyimpairment of receivables relating to amounts owed by related parties. This assessment isundertaken each financial period through examining the financial position of the related party andthe market in which the related party operates. Settlement of the outstanding balances normallyoccur in cash.
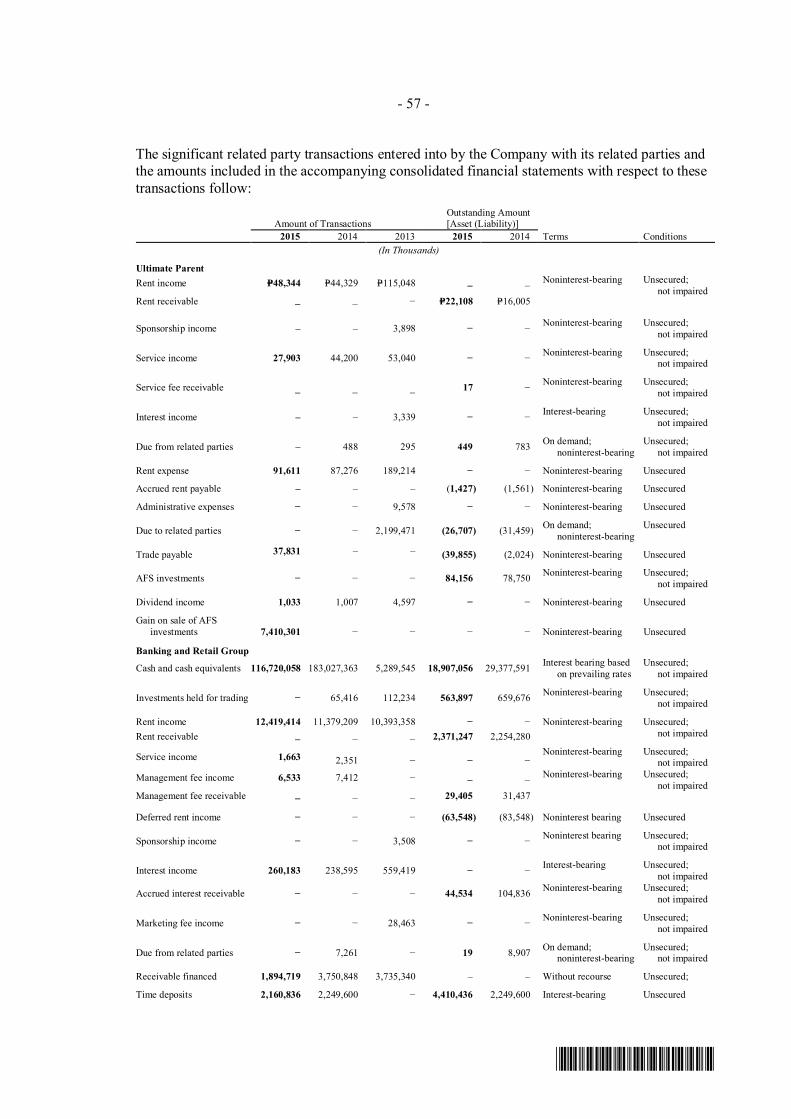
- 57 -
*SGVFS015635*
The significant related party transactions entered into by the Company with its related parties andthe amounts included in the accompanying consolidated financial statements with respect to these
transactions follow:
Amount of TransactionsOutstanding Amount[Asset (Liability)]
2015 2014 2013 2015 2014 Terms Conditions
(In Thousands)
Ultimate Parent
Rent income P=48,344 P=44,329 P=115,048
Noninterest-bearing Unsecured;not impaired
Rent receivable
P=22,108 P=16,005
Sponsorship income – – 3,898 Noninterest-bearing Unsecured;
not impaired
Service income 27,903 44,200 53,040 Noninterest-bearing Unsecured;
not impaired
Service fee receivable
17 Noninterest-bearing Unsecured;
not impaired
Interest income – – 3,339 Interest-bearing Unsecured;
not impaired
Due from related parties – 488 295 449 783On demand;
noninterest-bearingUnsecured;
not impaired
Rent expense 91,611 87,276 189,214 Noninterest-bearing Unsecured
Accrued rent payable – – – (1,427) (1,561) Noninterest-bearing Unsecured
Administrative expenses 9,578 Noninterest-bearing Unsecured
Due to related parties 2,199,471 (26,707) (31,459)On demand;
noninterest-bearingUnsecured
Trade payable 37,831 – – (39,855) (2,024) Noninterest-bearing Unsecured
AFS investments 84,156 78,750Noninterest-bearing Unsecured;
not impaired
Dividend income 1,033 1,007 4,597 Noninterest-bearing Unsecured
Gain on sale of AFSinvestments 7,410,301 Noninterest-bearing Unsecured
Banking and Retail Group
Cash and cash equivalents 116,720,058 183,027,363 5,289,545 18,907,056 29,377,591Interest bearing based
on prevailing ratesUnsecured;
not impaired
Investments held for trading 65,416 112,234 563,897 659,676Noninterest-bearing Unsecured;
not impaired
Rent income 12,419,414 11,379,209 10,393,358 Noninterest-bearing Unsecured;not impairedRent receivable
2,371,247 2,254,280
Service income 1,663 2,351
Noninterest-bearing Unsecured;not impaired
Management fee income 6,533 7,412
Noninterest-bearing Unsecured;not impaired
Management fee receivable
29,405 31,437
Deferred rent income (63,548) (83,548) Noninterest bearing Unsecured
Sponsorship income 3,508 Noninterest bearing Unsecured;
not impaired
Interest income 260,183 238,595 559,419 Interest-bearing Unsecured;
not impaired
Accrued interest receivable 44,534 104,836Noninterest-bearing Unsecured;
not impaired
Marketing fee income 28,463 Noninterest-bearing Unsecured;
not impaired
Due from related parties 7,261 19 8,907On demand;
noninterest-bearingUnsecured;
not impaired
Receivable financed 1,894,719 3,750,848 3,735,340 – – Without recourse
Interest-bearing
Unsecured;
UnsecuredTime deposits 2,160,836 2,249,600 4,410,436 2,249,600

- 58 -
*SGVFS015635*
Amount of TransactionsOutstanding Amount[Asset (Liability)]
2015 2014 2013 2015 2014 Terms Conditions
(In Thousands)
Loans payable and long-term debt P= P=6,915,000 P=15,006,500 (P=961,624) (P=1,230,000) Interest-bearing
Combinationof securedand unsecured
Interest expense 101,856 658,400 363,738
Interest-bearing; fixedand floating interestrates
Combinationof securedand unsecured
Accrued interest payable (638) (5,668) Noninterest-bearing Unsecured
Rent expense 1,523 288 Noninterest-bearing Unsecured
Trade payable 4,621 (5,886) (1,265) Noninterest-bearing Unsecured
Due to related parties 2,592 793 (3,385) (793) Noninterest-bearing Unsecured
Management fee expense 3,452 2,135 Noninterest-bearing Unsecured
Accrued management fee (876) (519) Noninterest-bearing Unsecured
AFS investments 52,886 – 10,968,613 11,843,233Noninterest-bearing Unsecured;
not impaired
Cash in escrow 230,139 763,869 437,639 667,778Interest bearing based
on prevailing ratesUnsecured;
not impaired
Dividend income 248,407 241,712 240,037 Noninterest-bearing Unsecured
Other Related Parties
Rent income 50,472 – – – – Noninterest-bearing Unsecured;not impaired
Rent receivable – – – 28,820 24,520
Service income 4,702 – 25,315 Noninterest-bearing Unsecured;
not impaired
Due from related parties – – 367,510 100,601 356,184On demand;
noninterest-bearingUnsecured;
not impaired
Management fee income – 10,912 4,723 Noninterest-bearing Unsecured;not impaired
Management fee receivable – – – 7,993 11,017
Trade receivable - others – – 11,716 – – Noninterest-bearing Unsecured
Rent expense 4,962 3,927 –
Due to related parties – 56,138 (104,500) (58,777) (115,180) Noninterest-bearing Unsecured
Accrued expenses – – 352,434 (573,192) (573,192) Noninterest-bearing Unsecured
Management fee expense 1,057,603 1,110,626 963,126 Noninterest-bearing Unsecured
Accrued management fee – – – (117,402) (101,775) Noninterest-bearing Unsecured
Administrative expenses 971 Noninterest-bearing Unsecured
Advances for projectdevelopment
518,122 Noninterest-bearing Unsecured;
not impaired
Trade payable (15,542) (26,992) Noninterest-bearing Unsecured
AFS investments 2,140,461 3,602,136Noninterest-bearing Unsecured;
not impaired
Sponsorship income 7,406 Noninterest-bearing Unsecured
Interest income 21,972 Noninterest-bearing Unsecured
Dividend income 202,277 14,769 Noninterest-bearing Unsecured
Gain on disposal of land 33,314 Noninterest-bearing Unsecured
Affiliate refers to an entity that is neither a parent, subsidiary, nor an associate, with stockholderscommon to the SM Group or under common control.

- 59 -
*SGVFS015635*
Below are the nature of the Company’s transactions with the related parties:
RentThe Company has existing lease agreements for office and commercial spaces with relatedcompanies (SM Retail and Banking Groups and other affiliates).
Management FeesThe Company pays management fees to Shopping Center Management Corporation and SMLifestyle Entertainment, Inc. (affiliates) for the management of the office and mall premises.
Service FeesThe Company provides manpower and other services to affiliates.
Dividend IncomeThe Company’s investment in AFS equity instruments of certain affiliates earn income upon thedeclaration of dividends by the investees.
Cash Placements and LoansThe Company has certain bank accounts and cash placements that are maintained with BDOUnibank, Inc. (BDO) and China Banking Corporation (China Bank) (Bank Affiliates). Suchaccounts earn interest based on prevailing market interest rates (see Notes 6, 7 and 11).
The Company also availed of bank loans and long-term debt from BDO and China Bank and paysinterest based on prevailing market interest rates (see Notes 17 and 19).
OthersThe Company, in the normal course of business, has outstanding receivables from and payables torelated companies as at reporting period which are unsecured and normally settled in cash.
Compensation of Key Management PersonnelThe aggregate compensation and benefits related to key management personnel for theyears ended December 31, 2015, 2014 and 2013 consist of short-term employee benefitsamounting to P=363 million, P=340 million and P=260 million, respectively, and post-employmentbenefits (pension benefits) amounting to P=61 million, P=27 million and P=27 million, respectively.
22. Costs and Expenses
This account consists of:
2015 2014 2013
(In Thousands)Cost of real estate sold (see Notes 9 and 10) P=12,039,076 P=12,257,032 P=11,920,739Administrative (see Notes 21 and 24) 7,184,191 6,707,326 5,858,726Depreciation and amortization
(see Notes 13 and 14) 6,966,952 6,579,781 5,980,940Marketing and selling 3,668,214 3,400,983 3,232,536Business taxes and licenses 3,465,807 3,125,697 2,748,088Film rentals 2,597,433 2,308,946 2,041,830Rent (see Notes 21 and 26) 1,317,443 1,186,622 1,294,925Management fees (see Note 21) 1,279,292 1,145,319 1,050,548Insurance 393,738 418,581 353,019Others 1,160,314 1,423,274 1,177,514
P=40,072,460 P=38,553,561 P=35,658,865

- 60 -
*SGVFS015635*
Others include bank charges, donations, dues and subscriptions, services fees and transportationand travel.
23. Interest Income and Interest Expense
The details of the sources of interest income and interest expense follow:
2015 2014 2013
(In Thousands)Interest income on:
Cash and cash equivalents (see Note 6) P=370,670 P=213,641 P=471,901Time deposits (see Note 16) 130,961 90,548 56,879Investments held for trading (see Note 7) 17,998 25,791 28,310Short-term investments 15,527 29,274Available-for-sale investments
(see Note 11) 34,038Others (see Notes 8 and 12) 94,064 51,947 71,911
P=613,693 P=397,454 P=692,313
Interest expense on:Long-term debt (see Note 19) P=3,038,426 P=3,824,165 P=3,218,400Loans payable (see Note 17) 260,769 105,742 274,534Others 79,909 169,592 193,669
P=3,379,104 P=4,099,499 P=3,686,603
24. Pension Benefits
The Company has funded defined benefit pension plans covering all regular and permanentemployees. The benefits are based on employees’ projected salaries and number of years ofservice. The latest actuarial valuation report is as at December 31, 2015.
The following tables summarize the components of the pension plan as at December 31:
Net Pension Cost (included under “Costs and expenses” account under “Administrative”)
2015 2014 2013(In Thousands)
Current service cost P=106,465 P=72,808 P=51,692Net interest cost (income) 804 (5,967) (2,010)Curtailment – (302) –
P=107,269 P=66,539 P=49,682
Net Pension Asset (included under “Other noncurrent assets” account)
2015 2014(In Thousands)
Fair value of plan assets P=329,279 P=272,771Defined benefit obligation (224,365) (215,462)Effect of asset ceiling limit (10,613) (5,469)
Net pension asset P=94,301 P=51,840

- 61 -
*SGVFS015635*
Net Pension Liability (included under “Other noncurrent liabilities” account)
2015 2014(In Thousands)
Defined benefit obligation P=385,207 P=381,892Fair value of plan assets (311,972) (273,355)
Net pension liability P=73,235 P=108,537
The changes in the present value of the defined benefit obligation are as follows:
2015 2014(In Thousands)
Balance at beginning of the year P=597,354 P=361,747Current service cost 106,465 72,808Interest cost 28,058 22,696Actuarial loss (gain):
Changes in financial assumptions (115,093) 124,435Changes in demographic assumptions (31,645) (16,190)Experience adjustments 20,015 46,852
Benefits paid from assets (10,698) (4,579)Transfer to (from) the plan (430) 556Others 15,546 (10,971)
Balance at end of the year P=609,572 P=597,354
The above present value of defined benefit obligation are broken down as follows:
2015 2014(In Thousands)
Related to pension asset P=224,365 P=215,462Related to pension liability 385,207 381,892
P=609,572 P=597,354
The changes in the fair value of plan assets are as follows:
2015 2014(In Thousands)
Balance at beginning of year P=546,126 P=424,822Contributions 107,082 87,015Interest income 27,530 29,143Remeasurement gain (loss) (28,359) 9,169Benefits paid (10,698) (4,579)Transfer to (from) the plan and others (430) 556
Balance at end of year P=641,251 P=546,126

- 62 -
*SGVFS015635*
The changes in the fair value of plan assets are broken down as follows:
2015 2014(In Thousands)
Related to pension asset P=329,279 P=272,771Related to pension liability 311,972 273,355
P=641,251 P=546,126
The changes in the effect of asset ceiling limit are as follows:
2015 2014(In Thousands)
Asset ceiling limit at beginning of year P=5,469 P=7,773Remeasurement loss (gain) 4,868 (2,784)Interest cost 276 480
P=10,613 P=5,469
The carrying amounts and fair values of the plan assets as at December 31, 2015 and 2014 are asfollows:
2015 2014
Carrying
Amount
Fair
Value
CarryingAmount
FairValue
(In Thousands)
Cash and cash equivalents P=97,143 P=97,143 P=30,262 P=30,262Investments in:
Common trust funds 210,439 210,439 213,852 213,852Government securities 166,833 166,833 157,839 157,839Debt and other securities 142,172 142,172 123,278 123,278Equity securities 20,557 20,557 17,208 17,208
Other financial assets 4,107 4,107 3,687 3,687
P=641,251 P=641,251 P=546,126 P=546,126
Cash and cash equivalents includes regular savings and time deposits;
Investments in debt and other securities consist of short-term and long-term corporate loans,notes and bonds which bear interest ranging from 4.37% to 6.80% and have maturities rangingfrom 2019 to 2025;
Investments in common trust funds pertain to unit investment trust fund;
Investments in equity securities consist of listed and unlisted equity securities;
Investments in government securities consist of retail treasury bonds which bear interestranging from 2.13% to 8.75% and have maturities ranging from 2016 to 2032; and
Other financial assets include accrued interest income on cash deposits and debt securitiesheld by the Retirement Plan.
Debt and other securities, equity securities and government securities have quoted prices in activemarket. The remaining plan assets do not have quoted market prices in active market.
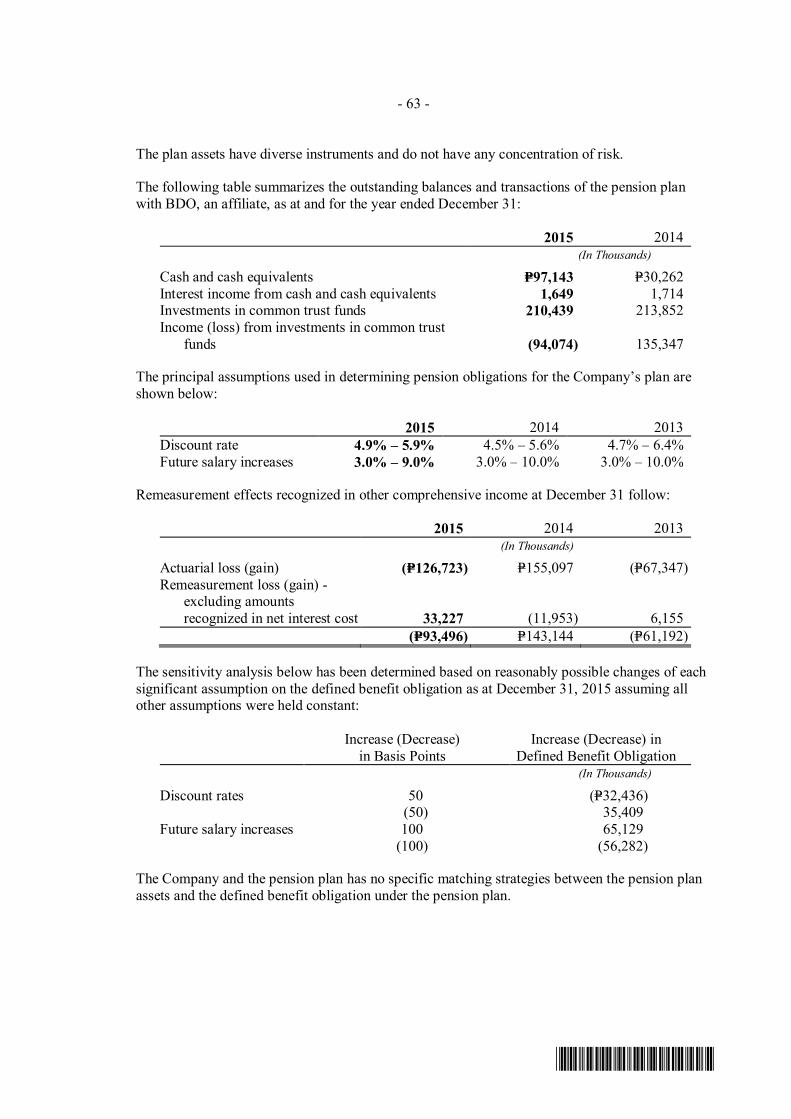
- 63 -
*SGVFS015635*
The plan assets have diverse instruments and do not have any concentration of risk.
The following table summarizes the outstanding balances and transactions of the pension planwith BDO, an affiliate, as at and for the year ended December 31:
2015 2014(In Thousands)
Cash and cash equivalents P=97,143 P=30,262Interest income from cash and cash equivalents 1,649 1,714Investments in common trust funds 210,439 213,852Income (loss) from investments in common trust
funds (94,074) 135,347
The principal assumptions used in determining pension obligations for the Company’s plan areshown below:
2015 2014 2013
Discount rate 4.9% – 5.9% 4.5% – 5.6% 4.7% – 6.4%Future salary increases 3.0% – 9.0% 3.0% – 10.0% 3.0% – 10.0%
Remeasurement effects recognized in other comprehensive income at December 31 follow:
2015 2014 2013(In Thousands)
Actuarial loss (gain) (P=126,723) P=155,097 (P=67,347)Remeasurement loss (gain) -
excluding amountsrecognized in net interest cost 33,227 (11,953) 6,155
(P=93,496) P=143,144 (P=61,192)
The sensitivity analysis below has been determined based on reasonably possible changes of eachsignificant assumption on the defined benefit obligation as at December 31, 2015 assuming allother assumptions were held constant:
Increase (Decrease)in Basis Points
Increase (Decrease) inDefined Benefit Obligation
(In Thousands)
Discount rates 50 (P=32,436)(50) 35,409
Future salary increases 100 65,129(100) (56,282)
The Company and the pension plan has no specific matching strategies between the pension planassets and the defined benefit obligation under the pension plan.
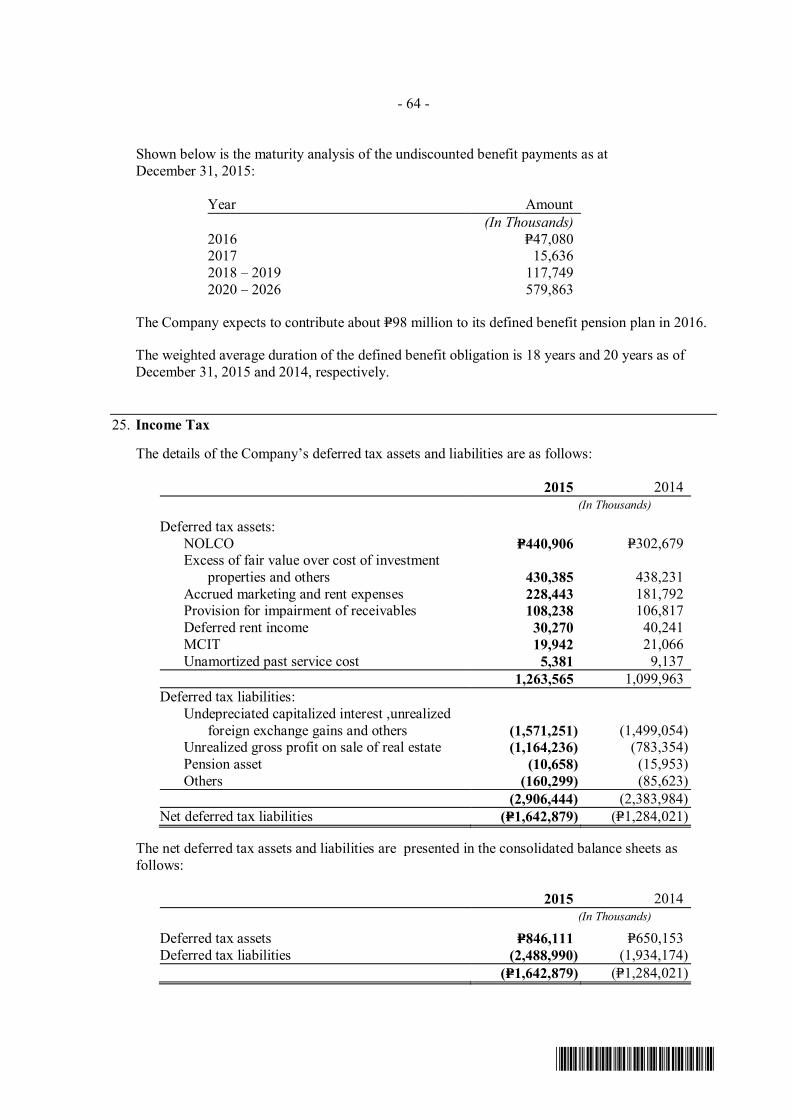
- 64 -
*SGVFS015635*
Shown below is the maturity analysis of the undiscounted benefit payments as atDecember 31, 2015:
Year Amount
(In Thousands)
2016 P=47,0802017 15,6362018 – 2019 117,7492020 – 2026 579,863
The Company expects to contribute about P=98 million to its defined benefit pension plan in 2016.
The weighted average duration of the defined benefit obligation is 18 years and 20 years as ofDecember 31, 2015 and 2014, respectively.
25. Income Tax
The details of the Company’s deferred tax assets and liabilities are as follows:
2015 2014(In Thousands)
Deferred tax assets:NOLCO P=440,906 P=302,679Excess of fair value over cost of investment
properties and others 430,385 438,231Accrued marketing and rent expenses 228,443 181,792Provision for impairment of receivables 108,238 106,817Deferred rent income 30,270 40,241MCIT 19,942 21,066Unamortized past service cost 5,381 9,137
1,263,565 1,099,963
Deferred tax liabilities:Undepreciated capitalized interest ,unrealized
foreign exchange gains and others (1,571,251) (1,499,054)Unrealized gross profit on sale of real estate (1,164,236) (783,354)Pension asset (10,658) (15,953)Others (160,299) (85,623)
(2,906,444) (2,383,984)
Net deferred tax liabilities (P=1,642,879) (P=1,284,021)
The net deferred tax assets and liabilities are presented in the consolidated balance sheets asfollows:
2015 2014(In Thousands)
Deferred tax assets P=846,111 P=650,153Deferred tax liabilities (2,488,990) (1,934,174)
(P=1,642,879) (P=1,284,021)

- 65 -
*SGVFS015635*
As at December 31, 2015 and 2014, unrecognized deferred tax assets amounted to nil andP=101 million, respectively, bulk of which pertains to NOLCO of the hotels and convention centerssegment.
The reconciliation between the statutory tax rates and the effective tax rates on income beforeincome tax as shown in the consolidated statements of income follows:
2015 2014 2013
Statutory tax rate 30.0% 30.0% 30.0%Income tax effects of:
Equity in net earningsof associates and jointventures (0.5) (0.4) (0.1)
Availment of income tax holiday (3.2) (3.2) (4.0)Interest income subjected to
final tax and dividendincome exempt fromincome tax (0.6) (0.9) (1.5)
Nondeductible expenses (8.5) (5.3) (5.2)
Effective tax rates 17.2% 20.2% 19.2%
26. Lease Agreements
Company as LessorThe Company’s lease agreements with its mall tenants are generally granted for a term of oneyear, with the exception of some of the larger tenants operating nationally, which are grantedinitial lease terms of five years, renewable on an annual basis thereafter. Upon inception of thelease agreement, tenants are required to pay certain amounts of deposits. Tenants likewise payeither a fixed monthly rent, which is calculated by reference to a fixed sum per square meter ofarea leased, or pay rent on a percentage rental basis, which comprises of a basic monthly amountand a percentage of gross sales or a minimum set amount, whichever is higher.
Also, the Company’s lease agreements with its commercial property tenants are generally grantedfor a term of one year, with the exception of some tenants, which are granted initial lease terms of2 to 20 years, renewable on an annual basis thereafter. Upon inception of the lease agreement,tenants are required to pay certain amounts of deposits. Tenants pay either a fixed monthly rent ora percentage of sales, depending on the terms of the lease agreements, whichever is higher.
The Company’s future minimum rent receivables for the noncancellable portions of the operatingcommercial property leases follow:
2015 2014(In Millions)
Within one year P=1,643 P=1,224After one year but not more than five years 5,272 4,180After more than five years 3,929 637
P=10,844 P=6,041
Consolidated rent income amounted to P=40,743 million, P=36,497 million and P=32,195 million forthe years ended December 31, 2015, 2014 and 2013, respectively.
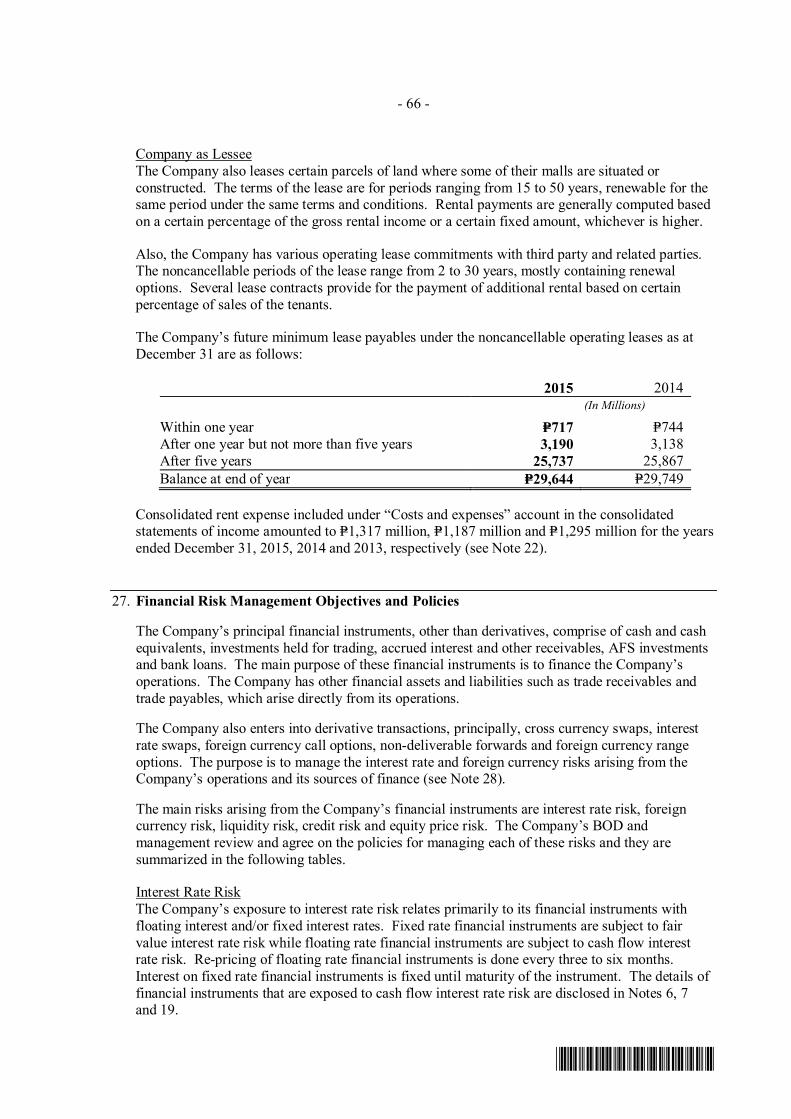
- 66 -
*SGVFS015635*
Company as LesseeThe Company also leases certain parcels of land where some of their malls are situated orconstructed. The terms of the lease are for periods ranging from 15 to 50 years, renewable for thesame period under the same terms and conditions. Rental payments are generally computed basedon a certain percentage of the gross rental income or a certain fixed amount, whichever is higher.
Also, the Company has various operating lease commitments with third party and related parties.The noncancellable periods of the lease range from 2 to 30 years, mostly containing renewaloptions. Several lease contracts provide for the payment of additional rental based on certainpercentage of sales of the tenants.
The Company’s future minimum lease payables under the noncancellable operating leases as atDecember 31 are as follows:
2015 2014(In Millions)
Within one year P=717 P=744After one year but not more than five years 3,190 3,138After five years 25,737 25,867
Balance at end of year P=29,644 P=29,749
Consolidated rent expense included under “Costs and expenses” account in the consolidatedstatements of income amounted to P=1,317 million, P=1,187 million and P=1,295 million for the yearsended December 31, 2015, 2014 and 2013, respectively (see Note 22).
27. Financial Risk Management Objectives and Policies
The Company’s principal financial instruments, other than derivatives, comprise of cash and cashequivalents, investments held for trading, accrued interest and other receivables, AFS investmentsand bank loans. The main purpose of these financial instruments is to finance the Company’soperations. The Company has other financial assets and liabilities such as trade receivables andtrade payables, which arise directly from its operations.
The Company also enters into derivative transactions, principally, cross currency swaps, interestrate swaps, foreign currency call options, non-deliverable forwards and foreign currency rangeoptions. The purpose is to manage the interest rate and foreign currency risks arising from theCompany’s operations and its sources of finance (see Note 28).
The main risks arising from the Company’s financial instruments are interest rate risk, foreigncurrency risk, liquidity risk, credit risk and equity price risk. The Company’s BOD andmanagement review and agree on the policies for managing each of these risks and they aresummarized in the following tables.
Interest Rate RiskThe Company’s exposure to interest rate risk relates primarily to its financial instruments withfloating interest and/or fixed interest rates. Fixed rate financial instruments are subject to fairvalue interest rate risk while floating rate financial instruments are subject to cash flow interestrate risk. Re-pricing of floating rate financial instruments is done every three to six months.Interest on fixed rate financial instruments is fixed until maturity of the instrument. The details offinancial instruments that are exposed to cash flow interest rate risk are disclosed in Notes 6, 7and 19.

- 67 -
*SGVFS015635*
The Company’s policy is to manage its interest cost using a mix of fixed and floating rate debts.To manage this mix in a cost-efficient manner, it enters into interest rate swaps, in which theCompany agrees to exchange, at specified intervals, the difference between fixed and floating rateinterest amounts calculated by reference to an agreed-upon notional principal amount. Theseswaps are designated to economically hedge underlying debt obligations. As atDecember 31, 2015 and 2014, after taking into account the effect of interest rate swaps,approximately 63% and 67%, respectively, of its long-term borrowings excluding China yuanrenminbi-denominated loans, are at a fixed rate of interest (see Note 28).

- 68 -
*SGVFS015635*
Interest Rate RiskThe following tables set out the carrying amount, by maturity, of the Company’s long-term financial liabilities that are exposed to interest rate risk as at December 31, 2015 and 2014:
2015
Interest Rate 1-<2 Years 2-<3 Years 3-<4 Years 4-<5 Years =>5 Years Total
Unamortized
Debt Issuance
Costs Carrying Value
Fixed Rate
Philippine peso-denominated corporate notes 5.25%-6.65% P=16,700 P=16,700 P=16,700 P=16,700 P=9,376,300 P=9,443,100 (P=43,602) P=9,399,498
Philippine peso-denominated fixed rate notes 4.32%-6.74% P=5,463,600 P=1,985,100 P=4,559,900 P=6,662,200 P=9,070,400 27,741,200 (91,316) 27,649,884
Philippine peso-denominated fixed rate retail bonds 4.51%-5.20% P=– P=– P=– P=– P=40,000,000 40,000,000 (309,400) 39,690,600
Other bank loans 4.25%-9.75% P=1,200,000 P=412,500 P=– P=235,000 P=325,000 2,172,500 (3,349) 2,169,151
Floating Rate
U.S. dollar-denominated five-year term loans LIBOR + spread $270,000 $– $500,000 $300,000 $– 50,354,200 (523,656) 49,830,544
U.S. dollar-denominated bilateral loans LIBOR + spread $– $50,000 $– $– $– 2,353,000 (24,215) 2,328,785
Other U.S. dollar loans LIBOR + spread $– $– $25,000 $– $– 1,176,500 (14,029) 1,162,471
Philippine peso-denominated corporate notes PDST-R2+margin% P=100,000 P=100,000 P=100,000 P=100,000 P=5,360,000 5,760,000 (1,711) 5,758,289
Philippine peso-denominated floating rate notes PDST-R2+margin% P=5,046,500 P=4,214,000 P=210,000 P=1,010,000 P=2,030,000 12,510,500 (38,007) 12,472,493
Philippine peso-denominated five-year bilateral loans PDST-R2+margin% P=500,000 P=– P=– P=– P=– 500,000 (479) 499,521
China yuan renminbi-denominated five-year loan CBC rate less 10% P=8,044 P=8,044 P=8,044 P=8,117 P=– 32,249 – 32,249
P=152,043,249 (P=1,049,764) P=150,993,485
PDST-R2 – Philippine Treasury Reference Rates – PM
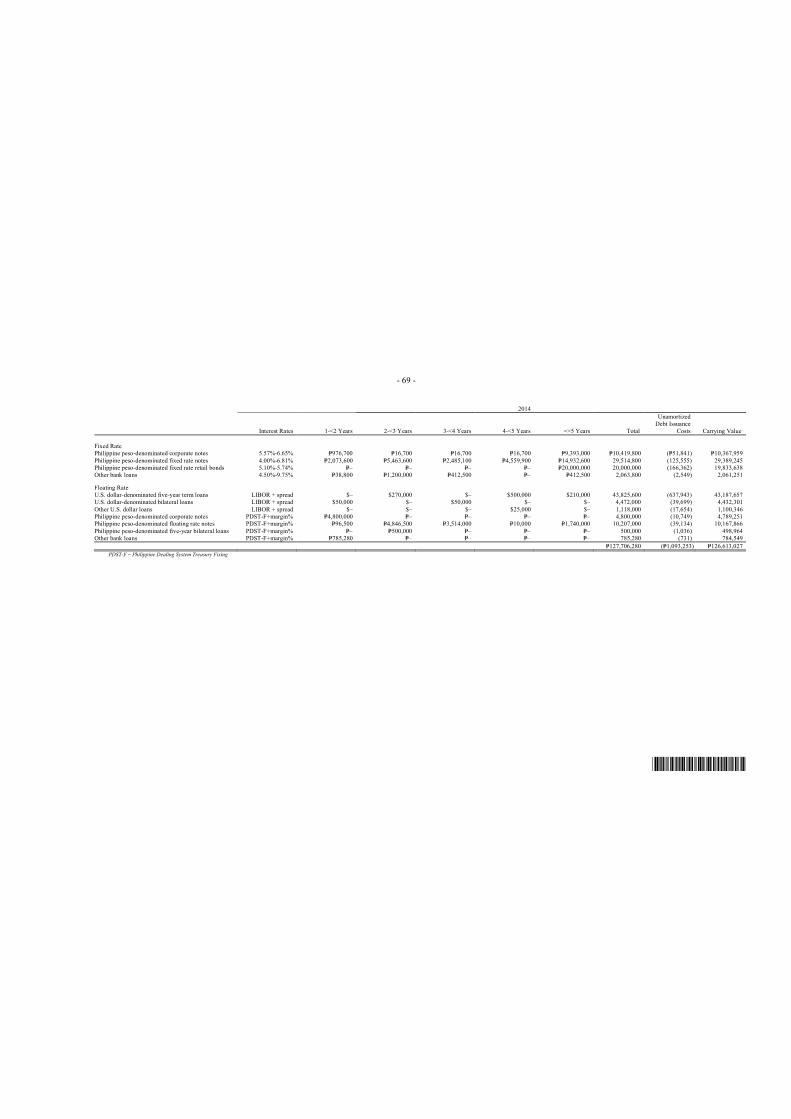
- 69 -
*SGVFS015635*
2014
Interest Rates 1-<2 Years 2-<3 Years 3-<4 Years 4-<5 Years =>5 Years Total
Unamortized Debt Issuance
Costs Carrying Value
Fixed RatePhilippine peso-denominated corporate notes 5.57%-6.65% P=976,700 P=16,700 P=16,700 P=16,700 P=9,393,000 P=10,419,800 (P=51,841) P=10,367,959
Philippine peso-denominated fixed rate notes 4.00%-6.81% P=2,073,600 P=5,463,600 P=2,485,100 P=4,559,900 P=14,932,600 29,514,800 (125,555) 29,389,245Philippine peso-denominated fixed rate retail bonds 5.10%-5.74% P=– P=– P=– P=– P=20,000,000 20,000,000 (166,362) 19,833,638Other bank loans 4.50%-9.75% P=38,800 P=1,200,000 P=412,500 P=– P=412,500 2,063,800 (2,549) 2,061,251
Floating RateU.S. dollar-denominated five-year term loans LIBOR + spread $– $270,000 $– $500,000 $210,000 43,825,600 (637,943) 43,187,657U.S. dollar-denominated bilateral loans LIBOR + spread $50,000 $– $50,000 $– $– 4,472,000 (39,699) 4,432,301
Other U.S. dollar loans LIBOR + spread $– $– $– $25,000 $– 1,118,000 (17,654) 1,100,346Philippine peso-denominated corporate notes PDST-F+margin% P=4,800,000 P=– P=– P=– P=– 4,800,000 (10,749) 4,789,251Philippine peso-denominated floating rate notes PDST-F+margin% P=96,500 P=4,846,500 P=3,514,000 P=10,000 P=1,740,000 10,207,000 (39,134) 10,167,866
Philippine peso-denominated five-year bilateral loans PDST-F+margin% P=– P=500,000 P=– P=– P=– 500,000 (1,036) 498,964Other bank loans PDST-F+margin% P=785,280 P=– P=– P=– P=– 785,280 (731) 784,549
P=127,706,280 (P=1,093,253) P=126,613,027
PDST-F – Philippine Dealing System Treasury Fixing

- 70 -
*SGVFS015635*
Interest Rate Risk Sensitivity Analysis. The following table demonstrates the sensitivity to areasonably possible change in interest rates, with all other variables held constant of theCompany’s income before income tax.
Increase (Decrease) in Basis Points
Effect on IncomeBefore Income Tax
(In Thousands)
2015 100 (P=123,780)
50 (61,890)
(100) 123,780
(50) 61,890
2014 100 (P=77,004)50 (38,502)
(100) 77,004(50) 38,502
Fixed rate debts, although subject to fair value interest rate risk, are not included in the sensitivityanalysis as these are carried at amortized costs. The assumed movement in basis points forinterest rate sensitivity analysis is based on currently observable market environment, showing asignificantly higher volatility as in prior years.
Foreign Currency RiskForeign currency risk is the risk that the fair value or future cash flows of a financial instrumentwill fluctuate because of changes in foreign exchange rates.
The Company’s exposure to foreign currency risk arises mainly from its debt issuances which aredenominated in U.S. dollars and subsequently remitted to China to fund its capital expenditurerequirements. To manage its foreign currency risk, the Company enters into foreign currencyswap contracts, cross-currency swaps, foreign currency call options, non-deliverable forwards andforeign currency range options aimed at reducing and/or managing the adverse impact of changesin foreign exchange rates on financial performance and cash flow.
The Company’s foreign currency-denominated monetary assets amounted to US$796 million(P=37,457 million) as at December 31, 2015 and US$759 million (P=33,948 million) as atDecember 31, 2014. The Company’s foreign currency-denominated monetary liabilitiesamounted to US$802 million (P=37,745 million), US$764 million (¥4,961 million) and¥4.45 million as at December 31, 2015, and US$762 million (P=34,082 million) andUS$711 million (¥4,415 million) as at December 31, 2014.
In translating the foreign currency-denominated monetary assets and liabilities to peso amounts,the exchange rates used were ¥6.4937 to US$1.00 and ¥6.2055 to US$1.00, the China YuanRenminbi to U.S. dollar exchange rate and P=47.06 to US$1.00 and P=44.72 to US$1.00, thePhilippine peso to U.S. dollar exchange rate as at December 31, 2015 and 2014, respectively.
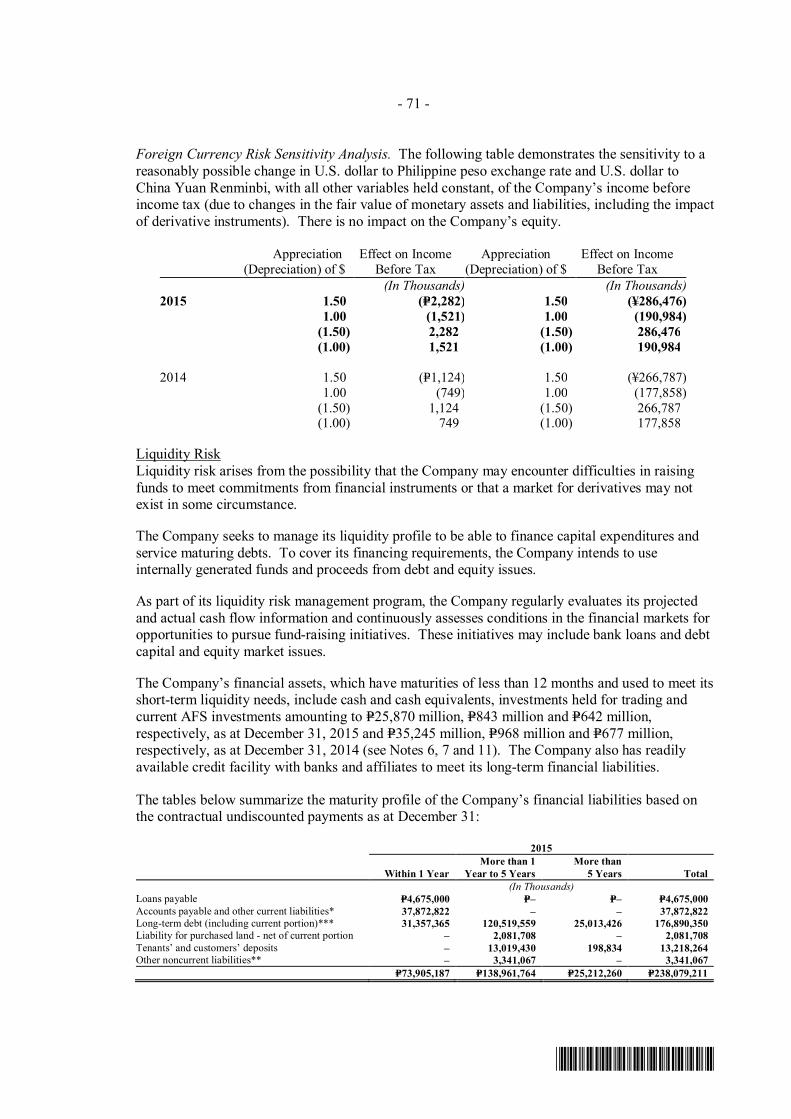
- 71 -
*SGVFS015635*
Foreign Currency Risk Sensitivity Analysis. The following table demonstrates the sensitivity to areasonably possible change in U.S. dollar to Philippine peso exchange rate and U.S. dollar toChina Yuan Renminbi, with all other variables held constant, of the Company’s income beforeincome tax (due to changes in the fair value of monetary assets and liabilities, including the impactof derivative instruments). There is no impact on the Company’s equity.
Appreciation(Depreciation) of $
Effect on IncomeBefore Tax
Appreciation(Depreciation) of $
Effect on IncomeBefore Tax
(In Thousands) (In Thousands)
2015 1.50 (P=2,282) 1.50 (¥286,476)
1.00 (1,521) 1.00 (190,984)
(1.50) 2,282 (1.50) 286,476
(1.00) 1,521 (1.00) 190,984
2014 1.50 (P=1,124) 1.50 (¥266,787)1.00 (749) 1.00 (177,858)
(1.50) 1,124 (1.50) 266,787(1.00) 749 (1.00) 177,858
Liquidity RiskLiquidity risk arises from the possibility that the Company may encounter difficulties in raisingfunds to meet commitments from financial instruments or that a market for derivatives may notexist in some circumstance.
The Company seeks to manage its liquidity profile to be able to finance capital expenditures andservice maturing debts. To cover its financing requirements, the Company intends to useinternally generated funds and proceeds from debt and equity issues.
As part of its liquidity risk management program, the Company regularly evaluates its projectedand actual cash flow information and continuously assesses conditions in the financial markets foropportunities to pursue fund-raising initiatives. These initiatives may include bank loans and debtcapital and equity market issues.
The Company’s financial assets, which have maturities of less than 12 months and used to meet itsshort-term liquidity needs, include cash and cash equivalents, investments held for trading andcurrent AFS investments amounting to P=25,870 million, P=843 million and P=642 million,respectively, as at December 31, 2015 and P=35,245 million, P=968 million and P=677 million,respectively, as at December 31, 2014 (see Notes 6, 7 and 11). The Company also has readilyavailable credit facility with banks and affiliates to meet its long-term financial liabilities.
The tables below summarize the maturity profile of the Company’s financial liabilities based onthe contractual undiscounted payments as at December 31:
2015
Within 1 Year
More than 1
Year to 5 Years
More than
5 Years Total
(In Thousands)
Loans payable P=4,675,000 P=– P=– P=4,675,000
Accounts payable and other current liabilities* 37,872,822 – – 37,872,822
Long-term debt (including current portion)*** 31,357,365 120,519,559 25,013,426 176,890,350
Liability for purchased land - net of current portion – 2,081,708 – 2,081,708
Tenants’ and customers’ deposits – 13,019,430 198,834 13,218,264
Other noncurrent liabilities** – 3,341,067 – 3,341,067
P=73,905,187 P=138,961,764 P=25,212,260 P=238,079,211

- 72 -
*SGVFS015635*
2014
Within 1 YearMore than 1 Year
to 5 YearsMore than
5 Years Total
(In Thousands)
Loans payable P=2,670,000 P=– P=– P=2,670,000Accounts payable and other current liabilities* 34,231,558 – – 34,231,558Long-term debt (including current portion) 15,261,124 88,712,795 45,231,699 149,205,618
Derivative liabilities – 58,705 – 58,705Liability for purchased land - net of current portion – 1,170,855 – 1,170,855Tenants’ and customers’ deposits – 13,082,936 168,590 13,251,526
Other noncurrent liabilities** – 3,208,432 – 3,208,432
P=52,162,682 P=106,233,723 P=45,400,289 P=203,796,694
** Excluding nonfinancial liabilities amounting to P=946 million and P=2,147 million as at December 31, 2015 and 2014, respectively.
** Excluding nonfinancial liabilities amounting to P=1,412 million and P=573 million as at December 31, 2015 and 2014, respectively.
***Long-term debt amounting to US$270 million was refinanced in January 2016.
Credit RiskThe Company trades only with recognized, creditworthy related and third parties. It is theCompany’s policy that all customers who wish to trade on credit terms are subject to creditverification procedures. In addition, receivable balances are monitored on a regular basis whichaims to reduce the Company’s exposure to bad debts at a minimum level. Given the Company’sdiverse base of customers, it is not exposed to large concentrations of credit risk.
With respect to credit risk arising from the other financial assets of the Company, which compriseof cash and cash equivalents, short-term investments, investments held for trading, AFSinvestments and certain derivative instruments, the Company’s exposure to credit risk arises fromdefault of the counterparty, with a maximum exposure equal to the carrying amounts of theseinstruments. The fair values of these instruments are disclosed in Note 28.
Since the Company trades only with recognized related and third parties, generally there is norequirement for collateral except for “Receivable from sale of real estate” which has minimalcredit risk and is effectively collateralized by respective unit sold since title to the real estateproperties are not transferred to the buyers until full payment is made. The fair value of therespective units sold is sufficient to cover the credit risk arising from the “Receivable from sale ofreal estate.” The Company has no other significant terms and conditions associated with the use ofcollateral.
As at December 31, 2015 and 2014, the financial assets, except for certain receivables, aregenerally viewed by management as good and collectible considering the credit history of thecounterparties (see Note 8). Past due or impaired financial assets are very minimal in relation tothe Company’s consolidated total financial assets.
Credit Quality of Financial Assets. The credit quality of financial assets is managed by theCompany using high quality and standard quality as internal credit ratings.
High Quality. Pertains to counterparty who is not expected by the Company to default in settlingits obligations, thus credit risk exposure is minimal. This normally includes large prime financialinstitutions, companies and government agencies.
Standard Quality. Other financial assets not belonging to high quality financial assets areincluded in this category.

- 73 -
*SGVFS015635*
As at December 31, 2015 and 2014, the credit quality of the Company’s financial assets is asfollows:
2015
Neither Past Due nor Impaired Past Due
High Standard but not
Quality Quality Impaired Total
(In Thousands)
Loans and ReceivablesCash and cash equivalents* P=25,784,727 P= P= P=25,784,727Receivables** 16,776,566 5,821,771 8,752,284 31,350,621
Cash in escrow (included under “Prepaidexpenses and other current assets”) 437,639 437,639
Real estate receivable - noncurrent (includedunder “Other noncurrent assets”) 7,962,615 – – 7,962,615
Time deposits (included under “Othernoncurrent assets”) 4,561,849 – – 4,561,849
Financial Assets at FVPL
Investments held for trading - Bonds and shares 843,256 – – 843,256Derivative assets 2,600,799 – – 2,600,799
AFS Investments
Shares of stocks 20,323,495 8,560 – 20,332,055
P=79,290,946 P=5,830,331 P=8,752,284 P=93,873,561
** Excluding cash on hand amounting to P=85 million
** Excluding nonfinancial assets amounting to P=4 million
2014
Neither Past Due nor Impaired Past Due
High Standard but notQuality Quality Impaired Total
(In Thousands)
Loans and ReceivablesCash and cash equivalents* P=35,148,896 P= P= P=35,148,896Receivables** 15,352,165 6,604,078 8,726,652 30,682,895Cash in escrow (included under “Prepaid
expenses and other current assets”) 667,778 667,778Real estate receivable - noncurrent (included
under “Other noncurrent assets”) 8,341,583 – – 8,341,583
Time deposits (included under “Othernoncurrent assets”) 2,412,190 – – 2,412,190
Financial Assets at FVPLInvestments held for trading - Bonds and shares 967,511 – – 967,511Derivative assets 1,632,814 – – 1,632,814
AFS Investments
Shares of stocks 29,663,165 8,573 – 29,671,738
P=94,186,102 P=6,612,651 P=8,726,652 P=109,525,405
** Excluding cash on hand amounting to P=96 million
** Excluding nonfinancial assets amounting to P=4 million

- 74 -
*SGVFS015635*
Equity Price RiskThe Company’s exposure to equity price pertains to its investments in quoted equity shares whichare classified as AFS investments in the consolidated balance sheets. Equity price risk arises fromthe changes in the levels of equity indices and the value of individual stocks traded in the stockexchange.
As a policy, management monitors the equity securities in its investment portfolio based onmarket expectations. Material equity investments within the portfolio are managed on anindividual basis and all buy and sell decisions are approved by management.
The effect on equity after income tax (as a result of change in fair value of AFS investments as atDecember 31, 2015 and 2014) due to a possible change in equity indices, based on historical trendof PSE index, with all other variables held constant is as follows:
2015
Change in Equity Price
Effect on Equity
After Income Tax
(In Millions)
AFS investments +4% P=472
-4% (472)
2014
Change in Equity PriceEffect on Equity
After Income Tax
(In Millions)
AFS investments +9% P=2,815-9% (2,815)
Capital ManagementCapital includes equity attributable to the owners of the Parent.
The primary objective of the Company’s capital management is to ensure that it maintains a strongcredit rating and healthy capital ratios in order to support its business and maximize shareholdervalue.
The Company manages its capital structure and makes adjustments to it, in the light of changes ineconomic conditions. To maintain or adjust the capital structure, the Company may adjust thedividend payment to shareholders, pay-off existing debts, return capital to shareholders or issuenew shares.
The Company monitors capital using gearing ratio, which is interest-bearing debt divided by totalcapital plus interest-bearing debt and net interest-bearing debt divided by total capital plus netinterest-bearing debt. Interest-bearing debt includes all short-term and long-term debt while netinterest-bearing debt includes all short-term and long-term debt net of cash and cash equivalentsand investments held for trading.
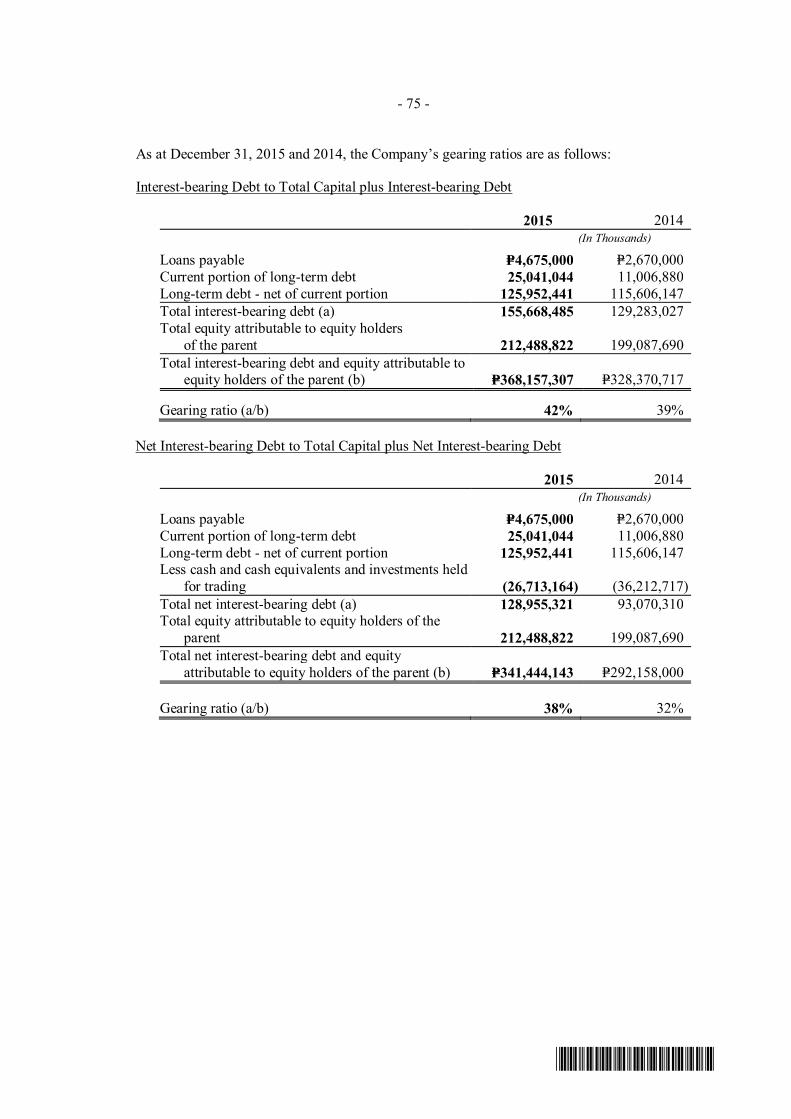
- 75 -
*SGVFS015635*
As at December 31, 2015 and 2014, the Company’s gearing ratios are as follows:
Interest-bearing Debt to Total Capital plus Interest-bearing Debt
2015 2014(In Thousands)
Loans payable P=4,675,000 P=2,670,000Current portion of long-term debt 25,041,044 11,006,880Long-term debt - net of current portion 125,952,441 115,606,147
Total interest-bearing debt (a) 155,668,485 129,283,027Total equity attributable to equity holders
of the parent 212,488,822 199,087,690
Total interest-bearing debt and equity attributable toequity holders of the parent (b) P=368,157,307 P=328,370,717
Gearing ratio (a/b) 42% 39%
Net Interest-bearing Debt to Total Capital plus Net Interest-bearing Debt
2015 2014(In Thousands)
Loans payable P=4,675,000 P=2,670,000Current portion of long-term debt 25,041,044 11,006,880Long-term debt - net of current portion 125,952,441 115,606,147Less cash and cash equivalents and investments held
for trading (26,713,164) (36,212,717)
Total net interest-bearing debt (a) 128,955,321 93,070,310Total equity attributable to equity holders of the
parent 212,488,822 199,087,690
Total net interest-bearing debt and equityattributable to equity holders of the parent (b) P=341,444,143 P=292,158,000
Gearing ratio (a/b) 38% 32%

- 76 -
*SGVFS015635*
28. Financial Instruments
Fair ValuesThe following table sets forth the carrying values and estimated fair values of financial assets andliabilities, by category and by class, other than those whose carrying values are reasonableapproximations of fair values as at December 31:
2015 2014
Carrying Value Fair Value Carrying Value Fair Value
(In Thousands)
Financial AssetsFinancial assets at FVPL: Investments held for trading P=843,256 P=843,256 P=967,511 P=967,511 Derivative assets 2,600,799 2,600,799 1,632,814 1,632,814
3,444,055 3,444,055 2,600,325 2,600,325Loans and receivables: Noncurrent portion of receivable
from sale of real estate 7,962,615 7,833,491 8,341,583 8,255,073 Time deposits (included under “Other
noncurrent assets”) 4,561,849 4,528,341 2,412,190 2,387,174AFS investments - Shares of stocks 20,332,055 20,332,055 29,671,738 29,671,738
P=36,300,574 P=36,137,942 P=43,025,836 P=42,914,310
Financial Liabilities
Financial liabilities at FVPL -
Derivative liabilities P=– P=– P=58,705 P=58,705
Other financial liabilities: Liability for purchased land - net
of current portion 2,081,708 2,066,418 1,170,855 1,158,712 Long-term debt - net of current portion 125,952,441 133,874,562 115,606,147 118,510,996Tenants’ and customers’ deposits 13,218,264 13,121,180 13,251,526 12,972,502Other noncurrent liabilities* 3,341,067 3,319,530 3,208,432 3,171,783
144,593,480 152,381,690 133,236,960 135,813,993
P=144,593,480 P=152,381,690 P=133,295,665 P=135,872,698
*Excluding nonfinancial liabilities amounting to P=1,412 million and P=573 million as at December 31, 2015 and 2014, respectively.
The following methods and assumptions were used to estimate the fair value of each class offinancial instrument for which it is practicable to estimate such value:
Investments Held for Trading. The fair values are based on the quoted market prices of theinstruments.
Derivative Instruments. The fair values are based on quotes obtained from counterparties.
Noncurrent Portion of Receivable from Sale of Real Estate. The estimated fair value of thenoncurrent portion of receivables from real estate buyers is based on the discounted value of futurecash flows using the prevailing interest rates on sales of the Company’s accounts receivable.Average discount rates used is 4.1% and 5.2% as at December 31, 2015 and 2014, respectively.
AFS Investments. The fair value of investments that are actively traded in organized financialmarkets is determined by reference to quoted market bid prices at the close of business.

- 77 -
*SGVFS015635*
Long-term Debt. Fair value is based on the following:
Debt Type Fair Value Assumptions
Fixed Rate Loans Estimated fair value is based on the discounted value of futurecash flows using the applicable rates for similar types of loans.Discount rates used range from 2.18% to 5.59% and from 3.54%to 5.32% as at December 31, 2015 and 2014, respectively.
Variable Rate Loans For variable rate loans that re-price every three months, thecarrying value approximates the fair value because of recent andregular repricing based on current market rates. For variable rateloans that re-price every six months, the fair value is determinedby discounting the principal amount plus the next interestpayment amount using the prevailing market rate for the periodup to the next repricing date. Discount rates used was 1.95% to2.37% and 1.70% to 1.97% as at December 31, 2015 and 2014,respectively.
Tenants’ and Customers’ Deposits, Liability for Purchased Land and Other Noncurrent
Liabilities. The estimated fair value is based on the discounted value of future cash flows usingthe applicable rates. The discount rates used range from 4.03% to 4.17% and 2.69% to 5.22% asat December 31, 2015 and 2014, respectively.
The Company assessed that the carrying values of cash and cash equivalents, receivables, cash inescrow, bank loans and accounts payable and other current liabilities approximate their fair valuesdue to the short-term nature and maturities of these financial instruments. For AFS investmentsrelated to unlisted equity securities, these are carried at cost less allowance for impairment losssince there are no quoted prices and due to the unpredictable nature of future cash flows and lackof suitable methods for arriving at reliable fair values.
There were no financial instruments subject to an enforceable master netting arrangement thatwere not set-off in the consolidated balance sheets.
Fair Value HierarchyThe Company uses the following hierarchy for determining and disclosing the fair value offinancial instruments by valuation technique:
Level 1: Quoted prices in active markets for identical assets or liabilities, except for relatedembedded derivatives which are either classified as Level 2 or 3;
Level 2: Those measured using inputs other than quoted prices included in Level 1 that areobservable for the asset or liability, either directly (as prices) or indirectly (derived fromprices); and,
Level 3: Those with inputs for the asset or liability that are not based on observable market data(unobservable inputs).

- 78 -
*SGVFS015635*
The following tables show the fair value hierarchy of Company’s financial instruments as atDecember 31:
2015
Level 1 Level 2 Level 3
(In Thousands)
Financial Assets
Financial assets at FVPL:Investments held for trading:
Bonds P=279,359 P=– P=–
Shares 563,897 – –
Derivative assets – 2,600,799 –
843,256 2,600,799 –
Loans and receivables:Noncurrent portion of receivable from
sale of real estate – – 7,833,491
Time deposits (included under “Othernoncurrent assets”) – 4,528,341 –
AFS investments -Shares of stocks 20,323,495 – 8,561
P=21,166,751 P=7,129,140 P=7,842,052
Financial Liabilities
Financial liabilities at FVPL -Derivative liabilities P=– P=– P=–
Other financial liabilities:Liability for purchased land - net of
current portion – – 2,066,418
Long-term debt - net of current portion – – 133,874,562
Tenants’ and customers’ deposits – – 13,121,180
Other noncurrent liabilities* – – 3,319,530
– – 152,381,690
P=– P=– P=152,381,690
*Excluding nonfinancial liabilities amounting to P=1,412 million as at December 31, 2015.
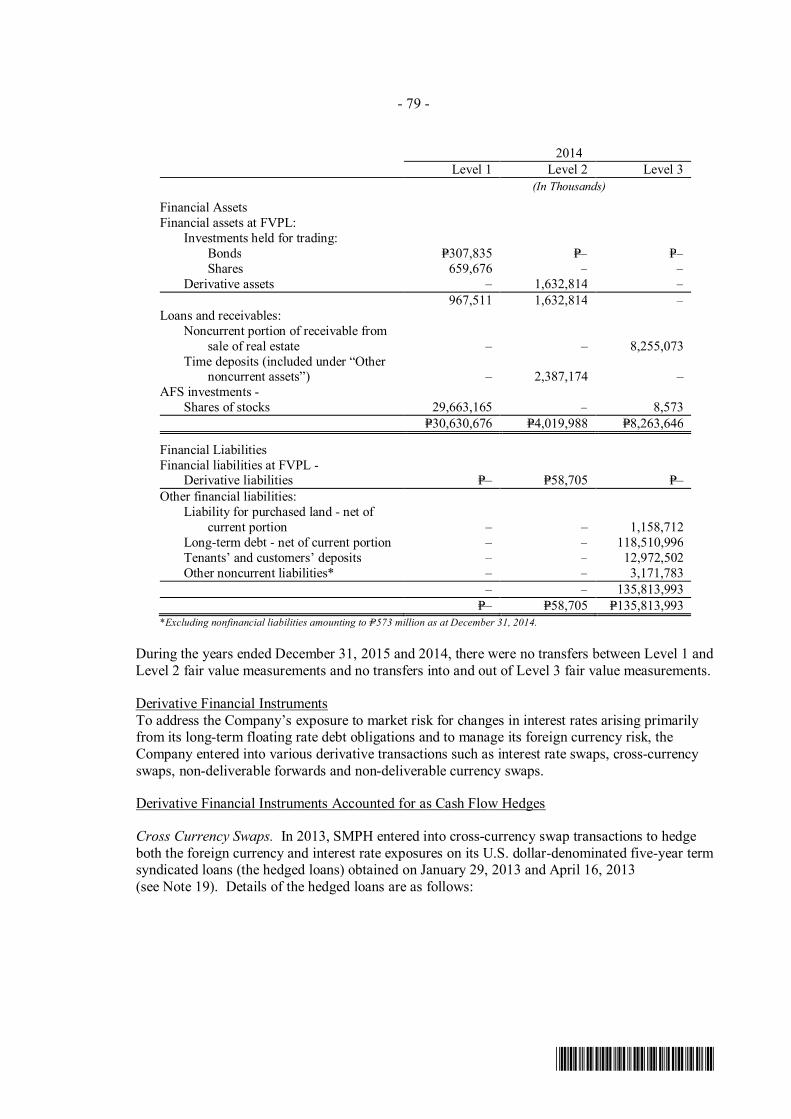
- 79 -
*SGVFS015635*
2014
Level 1 Level 2 Level 3
(In Thousands)
Financial AssetsFinancial assets at FVPL:
Investments held for trading:Bonds P=307,835 P=– P=–Shares 659,676 – –
Derivative assets – 1,632,814 –
967,511 1,632,814 –Loans and receivables:
Noncurrent portion of receivable fromsale of real estate – – 8,255,073
Time deposits (included under “Othernoncurrent assets”) – 2,387,174 –
AFS investments -Shares of stocks 29,663,165 – 8,573
P=30,630,676 P=4,019,988 P=8,263,646
Financial LiabilitiesFinancial liabilities at FVPL -
Derivative liabilities P=– P=58,705 P=–
Other financial liabilities:Liability for purchased land - net of
current portion – – 1,158,712Long-term debt - net of current portion – – 118,510,996Tenants’ and customers’ deposits – – 12,972,502Other noncurrent liabilities* – – 3,171,783
– – 135,813,993
P=– P=58,705 P=135,813,993
*Excluding nonfinancial liabilities amounting to P=573 million as at December 31, 2014.
During the years ended December 31, 2015 and 2014, there were no transfers between Level 1 andLevel 2 fair value measurements and no transfers into and out of Level 3 fair value measurements.
Derivative Financial InstrumentsTo address the Company’s exposure to market risk for changes in interest rates arising primarilyfrom its long-term floating rate debt obligations and to manage its foreign currency risk, theCompany entered into various derivative transactions such as interest rate swaps, cross-currencyswaps, non-deliverable forwards and non-deliverable currency swaps.
Derivative Financial Instruments Accounted for as Cash Flow Hedges
Cross Currency Swaps. In 2013, SMPH entered into cross-currency swap transactions to hedgeboth the foreign currency and interest rate exposures on its U.S. dollar-denominated five-year termsyndicated loans (the hedged loans) obtained on January 29, 2013 and April 16, 2013(see Note 19). Details of the hedged loans are as follows:
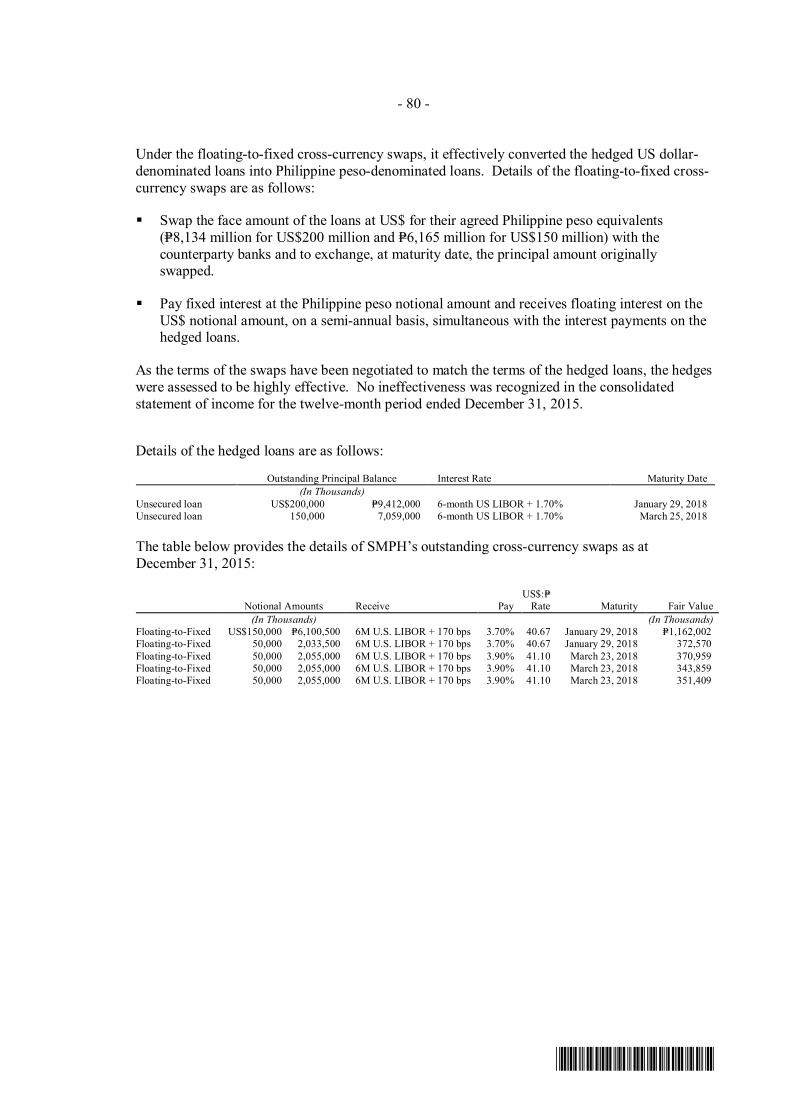
- 80 -
*SGVFS015635*
Under the floating-to-fixed cross-currency swaps, it effectively converted the hedged US dollar-denominated loans into Philippine peso-denominated loans. Details of the floating-to-fixed cross-currency swaps are as follows:
Swap the face amount of the loans at US$ for their agreed Philippine peso equivalents(P=8,134 million for US$200 million and P=6,165 million for US$150 million) with thecounterparty banks and to exchange, at maturity date, the principal amount originallyswapped.
Pay fixed interest at the Philippine peso notional amount and receives floating interest on theUS$ notional amount, on a semi-annual basis, simultaneous with the interest payments on thehedged loans.
As the terms of the swaps have been negotiated to match the terms of the hedged loans, the hedgeswere assessed to be highly effective. No ineffectiveness was recognized in the consolidatedstatement of income for the twelve-month period ended December 31, 2015.
Details of the hedged loans are as follows:
Outstanding Principal Balance Interest Rate Maturity Date
(In Thousands)
Unsecured loan US$200,000 P=9,412,000 6-month US LIBOR + 1.70% January 29, 2018Unsecured loan 150,000 7,059,000 6-month US LIBOR + 1.70% March 25, 2018
The table below provides the details of SMPH’s outstanding cross-currency swaps as atDecember 31, 2015:
Notional Amounts Receive PayUS$:P=
Rate Maturity Fair Value
(In Thousands) (In Thousands)
Floating-to-Fixed US$150,000 P=6,100,500 6M U.S. LIBOR + 170 bps 3.70% 40.67 January 29, 2018 P=1,162,002Floating-to-Fixed 50,000 2,033,500 6M U.S. LIBOR + 170 bps 3.70% 40.67 January 29, 2018 372,570
Floating-to-Fixed 50,000 2,055,000 6M U.S. LIBOR + 170 bps 3.90% 41.10 March 23, 2018 370,959Floating-to-Fixed 50,000 2,055,000 6M U.S. LIBOR + 170 bps 3.90% 41.10 March 23, 2018 343,859Floating-to-Fixed 50,000 2,055,000 6M U.S. LIBOR + 170 bps 3.90% 41.10 March 23, 2018 351,409

- 81 -
*SGVFS015635*
Hedge Effectiveness ResultsAs the terms of the swaps have been negotiated to match the terms of the hedged loan, the hedges were assessed to be highly effective. The fair value ofthe outstanding cross-currency swaps amounting to P=2,601 million gain and P=1,602 million gain as at December 31, 2015 and 2014, respectively, wastaken to equity under other comprehensive income. No ineffectiveness was recognized in the consolidated statement of income for the year endedDecember 31, 2015 and 2014. Foreign currency translation loss arising from the hedged loan amounting to P=819 million in 2015, P=114 million in 2014and P=1,239 million in 2013 was recognized in the consolidated statement of income. Foreign exchange gain equivalent to the same amounts wererecycled from equity to the consolidated statement of income during the same year.
Other Derivative Instruments Not Designated as HedgesThe table below shows information on the Company’s interest rate swaps presented by maturity profile.
Year Interest Outstanding Notional Amount Aggregate Fair ValueObtained Maturity Payment <1 Year >1-<2 Years >2-<5 Years Receive Pay 2015 2014
(In Thousands) (In Thousands)Floating-to-Fixed2013 June 2015 Quarterly P=174,720 – – 3MPDST-R2 3.65% P=– (P=941)2013 June 2015 Quarterly P=174,720 – – 3MPDST-R2 4.95% – (941)2011 March 21, 2015 Semi-annual $145,000 – – 6 months LIBOR+margin% 2.91%–3.28% – (37,535)2010 November 30, 2015 Semi-annual $30,000 – – 6 months LIBOR+margin% 3.18% – (19,288)
Fixed-to-Floating2010 June 2015 Quarterly P=785,280 – – 5.44% 3MPDST-R2 P=– P=16,7282010 June 2015 Quarterly P=785,280 – – 7.36% 3MPDST-R2 – 13,754

- 82 -
*SGVFS015635*
Interest Rate Swaps. In 2013, SMPH entered into two floating to fixed Philippine peso interestrate swap agreements with a notional amount of P=175 million each to offset the cash flows of thetwo fixed to floating Philippine peso interest rate swaps entered in 2010 to reflect SMPH’s partialprepayment of the underlying Philippine peso loan (see Note 19). Fair value changes from thematured swap recognized in the consolidated statements of income amounted to P=2 million gain in2015.
In 2011, SMPH entered into floating to fixed US$ interest rate swap agreements with aggregatenotional amount of US$145 million. Under the agreements, SMPH effectively converts thefloating rate U.S. dollar-denominated term loan into fixed rate loan with semi-annual paymentintervals up to March 21, 2015 (see Note 19). Fair value changes from the matured swaprecognized in the consolidated statements of income amounted to P=38 million gain in 2015.
SMPH also entered into US$ interest rate swap agreement with notional amount of US$20 millionin 2011. Under the agreement, SMPH effectively converts the floating rate U.S. dollar-denominated five-year bilateral unsecured loan into fixed rate loan with semi-annual paymentintervals up to November 30, 2014 (see Note 19). Fair value changes from the matured swaprecognized in the consolidated statements of income amounted to P=10 million loss in 2014.
In 2010, the SMPH entered into the following interest rate swap agreements:
A US$ interest rate swap agreement with nominal amount of US$30 million. Under theagreement, SMPH effectively converts the floating rate U.S. dollar-denominated five-yearbilateral unsecured loan into fixed rate loan with semi-annual payment intervals up toNovember 30, 2015 (see Note 19). Fair value changes from the matured swap recognized inthe consolidated statements of income amounted to P=19 million gain in 2015.
Two Philippine peso interest rate swap agreements with notional amount of P=1,000 millioneach. The consolidated net cash flows of the two swaps effectively converts the Philippinepeso-denominated five-year inverse floating rate notes into floating rate notes with quarterlypayment intervals up to June 2015 (see Note 19). Fair value changes from the matured swaprecognized in the consolidated statements of income amounted to P=31 million loss in 2015.
In 2009, SMPH entered into US$ interest rate swap agreements with an aggregate notional amountof US$25 million. Under these agreements, SMPH effectively converts the floating rate USdollar-denominated five-year bilateral loan into fixed rate loan with semi-annual payment intervalsup to November 2013. Fair value changes from the matured swap recognized in theconsolidated statements of income amounted to P=10 million gain in 2013.
Non-deliverable Currency Forwards and Swaps. In 2015 and 2014, SMPH entered into sellP= and buy US$ currency forward contracts. It also entered into sell US$ and buy P= currencyforward and swap contracts with the same aggregate notional amount. Net fair value changesfrom the settled currency forward and swap contracts recognized in the consolidated statements ofincome amounted to P=14 million gain, P=14 million gain and P=32 million gain in 2015, 2014 and2013, respectively.
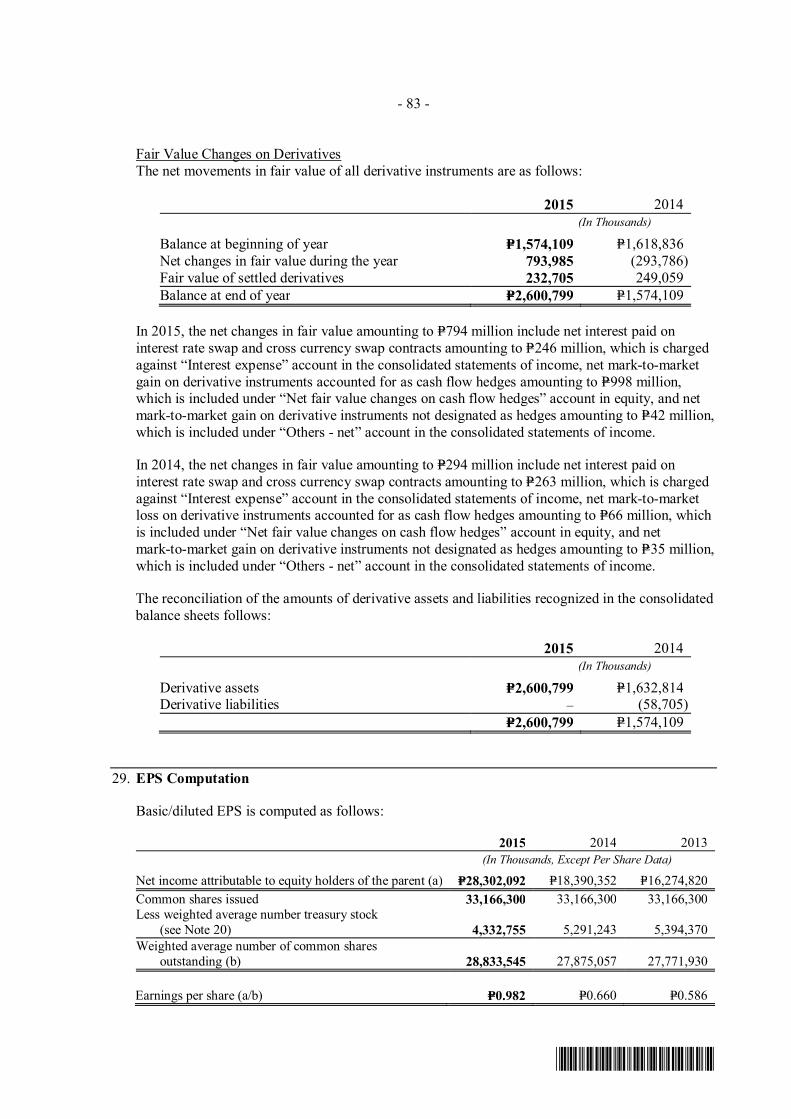
- 83 -
*SGVFS015635*
Fair Value Changes on DerivativesThe net movements in fair value of all derivative instruments are as follows:
2015 2014(In Thousands)
Balance at beginning of year P=1,574,109 P=1,618,836Net changes in fair value during the year 793,985 (293,786)Fair value of settled derivatives 232,705 249,059
Balance at end of year P=2,600,799 P=1,574,109
In 2015, the net changes in fair value amounting to P=794 million include net interest paid oninterest rate swap and cross currency swap contracts amounting to P=246 million, which is chargedagainst “Interest expense” account in the consolidated statements of income, net mark-to-marketgain on derivative instruments accounted for as cash flow hedges amounting to P=998 million,which is included under “Net fair value changes on cash flow hedges” account in equity, and netmark-to-market gain on derivative instruments not designated as hedges amounting to P=42 million,which is included under “Others - net” account in the consolidated statements of income.
In 2014, the net changes in fair value amounting to P=294 million include net interest paid oninterest rate swap and cross currency swap contracts amounting to P=263 million, which is chargedagainst “Interest expense” account in the consolidated statements of income, net mark-to-marketloss on derivative instruments accounted for as cash flow hedges amounting to P=66 million, whichis included under “Net fair value changes on cash flow hedges” account in equity, and netmark-to-market gain on derivative instruments not designated as hedges amounting to P=35 million,which is included under “Others - net” account in the consolidated statements of income.
The reconciliation of the amounts of derivative assets and liabilities recognized in the consolidatedbalance sheets follows:
2015 2014(In Thousands)
Derivative assets P=2,600,799 P=1,632,814Derivative liabilities – (58,705)
P=2,600,799 P=1,574,109
29. EPS Computation
Basic/diluted EPS is computed as follows:
2015 2014 2013
(In Thousands, Except Per Share Data)
Net income attributable to equity holders of the parent (a) P=28,302,092 P=18,390,352 P=16,274,820
Common shares issued 33,166,300 33,166,300 33,166,300Less weighted average number treasury stock (see Note 20) 4,332,755 5,291,243 5,394,370
Weighted average number of common sharesoutstanding (b) 28,833,545 27,875,057 27,771,930
Earnings per share (a/b) P=0.982 P=0.660 P=0.586

- 84 -
*SGVFS015635*
30. Other Matters
Bases Conversion and Development Authority (BCDA) CaseIn 2012, the Company filed Petition for Certiorari with prayer for issuance of a TemporaryRestraining Order (TRO) against BCDA and Arnel Paciano Casanova (Casanova), President andCEO of BCDA.
On November 26, 2012, the Company filed with Supreme Court a Very Urgent Manifestation withMotion to Resolve the Company’s Application for TRO and Preliminary Injuction related to thetermination by the BCDA of the Competitive Challenge on the submitted unsolicited proposal forprivatization and development of a 33.13 hectares Bonifacio South Property located in FortBonifacio, Taguig City.
On December 20, 2012, the Company filed with the Supreme Court Urgent Manifestation withReiterative Motion to Resolve Application for TRO and Preliminary Injunction.
On January 9, 2013, the Supreme Court approved the Company’s application and issued a TROwherein BCDA or any of their representatives and or agents are enjoined from proceeding with thebidding process subject of said “Invitation to Bid”, enforcing the Supplemental Notice No. 5 andin any way disposing of the subject lot which acts tend to render the Court’s resolution of thepetition ineffectual, until further orders from Supreme Court.
On January 14, 2013, the Company’s counsel received the Motion for Reconsideration filed by theBCDA with the Supreme Court. The Company’s counsel filed its Comment/Opposition to theMotion for Reconsideration on February 11, 2013.
On February 21, 2013, the Company’s counsel received copies of the Comment-in-Interventionand Motion for Leave to file Comment-in-Intervention and to admit attached Comment-in-Intervention filed by the Department of National Defense and Armed Forces of the Philippines(DND-AFP). This remains pending as at February 22, 2016.
On March 20, 2013, the Supreme Court issued a resolution denying BCDA’s urgent motion todissolve TRO and noting the Company’s Comment/Opposition to the Motion for Reconsideration.The TRO is made permanent in a Decision dated August 13, 2014.
On April 30, 2013, the Company filed its Opposition to the Comment-in-Intervention filed by theDND-AFP.
On May 14, 2013, BCDA and Casanova also filed a Motion for Leave to Refer the Case to the EnBanc. The Company filed an Opposition to this Motion. The Supreme Court issued a resolutiondenying the Motion. BCDA filed a Motion for Reconsideration. The Company filed its Oppositionand this remains pending as at February 22, 2016.
On June 5, 2013, BCDA and Casanova filed a Motion to Inhibit the Honorable PresidingChairman. The Company filed an Opposition to this Motion. On July 31, 2013, the SupremeCourt issued a resolution denying the BCDA and Casanova’s Motion.
On August 13, 2014, the Supreme Court promulgated its Decision granting the Petition andordered BCDA and Casanova to conduct and complete the Competitive Challenge, among others.
On September 26, 2014, BCDA and Casanova filed a Motion for Reconsideration of theAugust 13, 2014 Decision with a Motion to Resolve BCDA and Casanova’s Unresolved Motions.

- 85 -
*SGVFS015635*
On March 18, 2015, the Supreme Court issued a resolution denying BCDA and Casanova’sMotion for Reconsideration dated September 26, 2014 and Motion to Resolve BCDA andCasanova’s Unresolved Motions. In the same resolution, the Supreme Court ordered the issuanceof an Entry of Judgment. Accordingly, an Entry of Judgment was issued and the Decision datedAugust 13, 2014 became final and executory on March 18, 2015.
On April 28, 2015, BCDA and Casanova filed a Second Motion for Reconsideration. OnJune 2, 2015, the Company filed an Opposition to this Motion. On September 7, 2015, theSupreme Court denied the Second Motion for Reconsideration. On November 30, 2015, BCDAand Casanova filed a Third Motion for Reconsideration and this remains pending as atFebruary 22, 2016.
*SGVFS015635*
INDEPENDENT AUDITORS’ REPORT
ON SUPPLEMENTARY SCHEDULES
The Stockholders and the Board of Directors
SM Prime Holdings, Inc.
10th Floor, Mall of Asia Arena Annex Building,Coral Way cor. J.W. Diokno Blvd.,
Mall of Asia Complex,
Brgy. 76, Zone 10, CBP-1A, Pasay City 1300
We have audited in accordance with Philippine Standards on Auditing, the consolidated financial
statements of SM Prime Holdings, Inc. and Subsidiaries as at December 31, 2015 and 2014 and foreach of the three years in the period ended December 31, 2015, included in this Form 17-A, and have
issued our report thereon dated February 22, 2016. Our audits were made for the purpose of forming
an opinion on the basic financial statements taken as a whole. The schedules listed in the Index to theConsolidated Financial Statements and Supplementary Schedules are the responsibility of the
Company’s management. These schedules are presented for purposes of complying with Securities
Regulation Code Rule 68, As Amended (2011), and are not part of the basic financial statements.
These schedules have been subjected to the auditing procedures applied in the audit of the basicfinancial statements and, in our opinion, fairly state, in all material respects, the information required
to be set forth therein in relation to the basic financial statements taken as a whole.
SYCIP GORRES VELAYO & CO.
Belinda T. Beng HuiPartner
CPA Certificate No. 88823
SEC Accreditation No. 0923-AR-1 (Group A), March 25, 2013, valid until March 24, 2016
Tax Identification No. 153-978-243
BIR Accreditation No. 08-001998-78-2015, June 26, 2015, valid until June 25, 2018
PTR No. 5321613, January 4, 2016, Makati City
February 22, 2016
SyCip Gorres Velayo & Co.6760 Ayala Avenue1226 Makati CityPhilippines
Tel: (632) 891 0307Fax: (632) 819 0872ey.com/ph
BOA/PRC Reg. No. 0001, December 14, 2015, valid until December 31, 2018SEC Accreditation No. 0012-FR-4 (Group A), November 10, 2015, valid until November 9, 2018
A member firm of Ernst & Young Global Limited
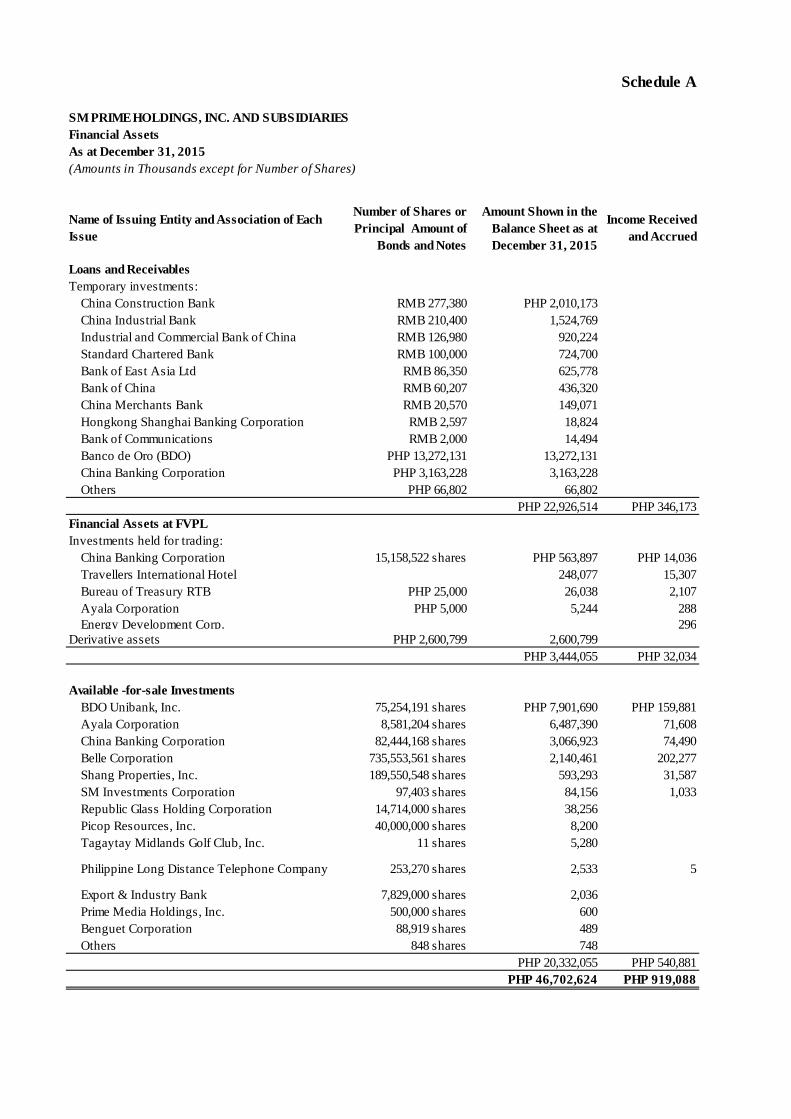
Schedule A
SM PRIME HOLDINGS, INC. AND SUBSIDIARIESFinancial AssetsAs at December 31, 2015(Amounts in Thousands except for Number of Shares)
Name of Issuing Entity and Association of Each Issue
Number of Shares or Principal Amount of
Bonds and Notes
Amount Shown in the Balance Sheet as at December 31, 2015
Income Received and Accrued
Loans and ReceivablesTemporary investments:
China Construction Bank RMB 277,380 PHP 2,010,173 China Industrial Bank RMB 210,400 1,524,769Industrial and Commercial Bank of China RMB 126,980 920,224Standard Chartered Bank RMB 100,000 724,700Bank of East Asia Ltd RMB 86,350 625,778Bank of China RMB 60,207 436,320China Merchants Bank RMB 20,570 149,071Hongkong Shanghai Banking Corporation RMB 2,597 18,824Bank of Communications RMB 2,000 14,494Banco de Oro (BDO) PHP 13,272,131 13,272,131China Banking Corporation PHP 3,163,228 3,163,228Others PHP 66,802 66,802
PHP 22,926,514 PHP 346,173 Financial Assets at FVPLInvestments held for trading:
China Banking Corporation 15,158,522 shares PHP 563,897 PHP 14,036 Travellers International Hotel 248,077 15,307Bureau of Treasury RTB PHP 25,000 26,038 2,107Ayala Corporation PHP 5,000 5,244 288Energy Development Corp. 296
Derivative assets PHP 2,600,799 2,600,799PHP 3,444,055 PHP 32,034
Available -for-sale InvestmentsBDO Unibank, Inc. 75,254,191 shares PHP 7,901,690 PHP 159,881 Ayala Corporation 8,581,204 shares 6,487,390 71,608China Banking Corporation 82,444,168 shares 3,066,923 74,490Belle Corporation 735,553,561 shares 2,140,461 202,277Shang Properties, Inc. 189,550,548 shares 593,293 31,587SM Investments Corporation 97,403 shares 84,156 1,033Republic Glass Holding Corporation 14,714,000 shares 38,256Picop Resources, Inc. 40,000,000 shares 8,200Tagaytay Midlands Golf Club, Inc. 11 shares 5,280
Philippine Long Distance Telephone Company 253,270 shares 2,533 5
Export & Industry Bank 7,829,000 shares 2,036Prime Media Holdings, Inc. 500,000 shares 600Benguet Corporation 88,919 shares 489Others 848 shares 748
PHP 20,332,055 PHP 540,881PHP 46,702,624 PHP 919,088

Sch
edul
e C
SM
PR
IME
HO
LDIN
GS
, IN
C. A
ND
SU
BS
IDA
RIE
S
Am
ount
s R
ecei
vabl
e fr
om R
elat
ed P
artie
s w
hich
are
elimin
ated
dur
ing
the
Con
solid
atio
n of
Fin
anci
al S
tatem
ents
A
s at
Dec
embe
r 31
, 201
5 (A
mo
un
ts in
Th
ou
san
ds
exc
ep
t fo
r N
um
be
r o
f S
ha
res)
N
ame
and
Des
igna
tion
of D
ebto
r
Bal
ance
at
Beg
inni
ng o
f P
erio
dA
dditi
ons
A
mou
nts
Col
lect
ed
Am
ount
s
W
ritte
n O
ffC
urre
ntN
ot C
urre
nt
Bal
ance
at
End
of
Per
iod
SM
Chi
na C
om
pa
nies
P=
33
,489
,23
0 P=
4
,120
,85
0P=
- P=
- P=
- P=
37
,61
0,0
80
P=3
7,6
10
,08
0
Co
sta
del
Ha
milo
, In
c. a
nd S
ub
sid
iary
8
50
,73
34
2,9
94(1
6,3
84
) -
-8
77
,34
38
77
,34
3
Co
nso
lidat
ed P
rim
e D
ev.
Co
rp.
98
4,8
00
1,1
43
(59
3,9
68)
- -
39
1,9
75
39
1,9
75
Pre
mie
r C
ent
ral,
Inc.
-
28
6,2
17
- -
-2
86
,21
72
86
,21
7
Ass
oci
ate
d D
eve
lop
men
t C
orp
ora
tion
20
0,0
00
--
--
20
0,0
00
20
0,0
00
SM
Are
na C
om
ple
x C
orp
ora
tion
-1
18
,10
2-
- -
11
8,1
02
11
8,1
02
Su
mm
erhi
lls H
om
e D
eve
lop
men
t Co
rp.
-1
53
,40
6(4
1,9
00
) -
-1
11
,50
61
11
,50
6
CH
AS
Rea
lty a
nd D
eve
lop
me
nt C
orp
ora
tion
and
S
ubsi
dia
ries
3
3,0
926
8,8
61-
- -
10
1,9
53
10
1,9
53
Pre
mie
r S
out
hern
Co
rp.
38
6,2
99
2,0
19
(33
5,9
37)
- -
52
,381
52
,381
SM
De
velo
pm
ent
Co
rpo
ratio
n an
d S
ubsi
dia
rie
s 1
0,1
951
2,7
64-
-
-2
2,9
592
2,9
59
SM
Ho
tels
and
Co
nve
ntio
ns C
orp
. an
d S
ubsi
dia
ries
5
6,4
851
02
,884
(15
6,9
23)
- -
2,4
46
2,4
46
Mag
enta
Le
gacy
, In
c.
2,1
44
--
- -
2,1
44
2,1
44
Tag
ayt
ay
Re
sort
and
Dev
elo
pm
ent C
orp
ora
tion
25
1,2
55
- -
-1
,28
01
,28
0
Fir
st L
eisu
re V
entu
res
Gro
up,
Inc.
7
16
23
6-
- -
95
29
52
Pri
me
Me
tro
esta
te,
Inc.
6
12
1,3
00,
052
(1,3
00,0
17
) -
-6
47
64
7
Hig
hlan
ds
Pri
me,
Inc
. 4
21
8
-
- -
22
22
22
MO
A E
spla
nad
e P
ort
Inc
. -
20
0-
--
20
02
00
San
Laz
aro
Ho
ldin
gs
Co
rpo
ratio
n 1
--
-
-1
1
So
uthe
rnp
oin
t Pro
pe
rtie
s C
orp
. 7
41
,36
6(1
,440
) -
--
-
P=
36
,014
,41
0P=6,2
12,
567
(P=2
,446
,56
9)
P=-
P=-
P=39
,780
,40
8P=
39
,780
,40
8

Sch
edul
e H
SM
PR
IME
HO
LDIN
GS
, IN
C. A
ND
SU
BS
IDA
RIE
S
Cap
ital S
tock
A
s at
Dec
embe
r 31
, 201
5 (S
ha
res
in T
ho
usa
nd
)
Titl
e of
Issu
e
Num
ber
of
Sha
res
Aut
horiz
ed
Num
ber
of S
hare
s Is
sued
as
Sho
wn
Und
er
Rel
ated
Bal
ance
S
heet
Cap
tion
Num
ber
of S
hare
s O
utst
andi
ng a
s S
how
n U
nder
R
elat
ed B
alan
ce
She
et C
aptio
n
Num
ber
of S
hare
sH
eld
by R
elat
edP
artie
s
Dire
ctor
s,
Offi
cers
an
d E
mpl
oyee
s O
ther
s
Com
mon
40
,000
,000
33
,166
,300
28
,879
,232
17
,669
,545
3,
460,
743
7,74
8,94
4
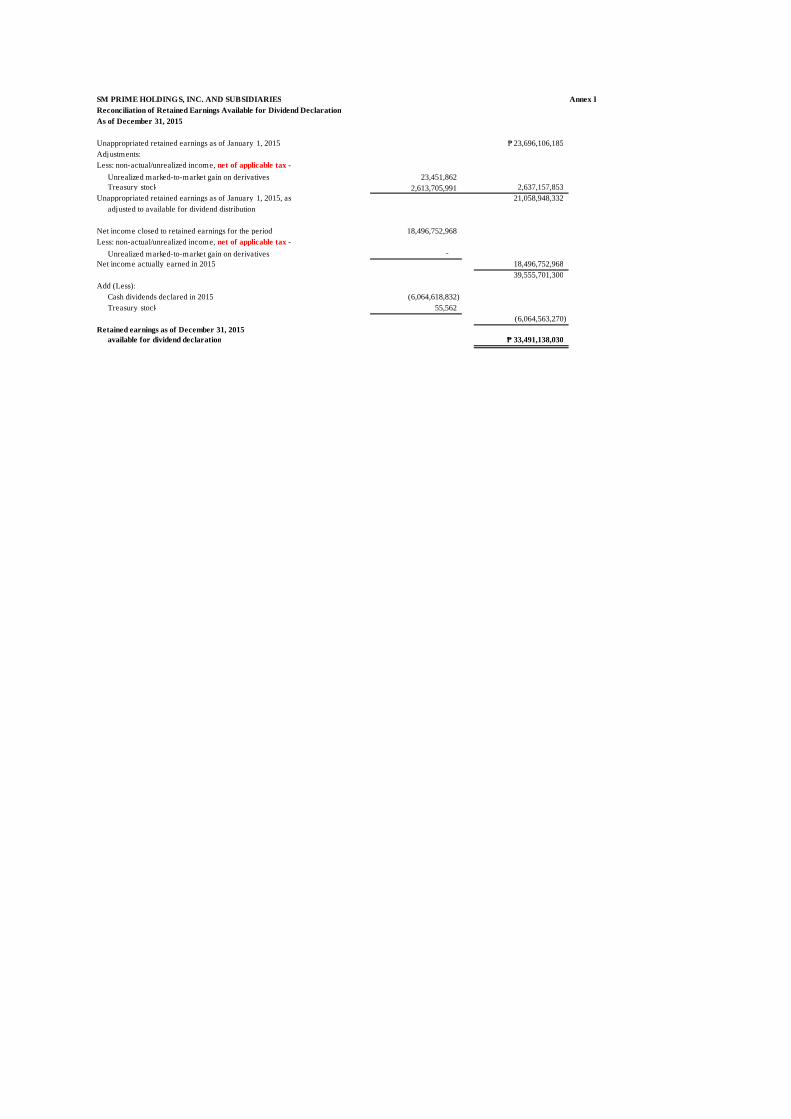
SM PRIME HOLDINGS, INC. AND SUBSIDIARIES Annex IReconciliation of Retained Earnings Available for Dividend DeclarationAs of December 31, 2015
Unappropriated retained earnings as of January 1, 2015 ₱ 23,696,106,185Adjustments:Less: non-actual/unrealized income, net of applicable tax -
Unrealized marked-to-market gain on derivatives 23,451,862 Treasury stock 2,613,705,991 2,637,157,853
Unappropriated retained earnings as of January 1, 2015, as 21,058,948,332 adjusted to available for dividend distribution
Net income closed to retained earnings for the period 18,496,752,968 Less: non-actual/unrealized income, net of applicable tax -
Unrealized marked-to-market gain on derivatives - Net income actually earned in 2015 18,496,752,968
39,555,701,300 Add (Less):
Cash dividends declared in 2015 (6,064,618,832) Treasury stock 55,562
(6,064,563,270) Retained earnings as of December 31, 2015
available for dividend declaration ₱ 33,491,138,030

Annex II
SM PRIME HOLDINGS, INC. AND SUBSIDIARIES List of Philippine Financial Reporting Standards (PFRSs) and
Interpretations Effective as at December 31, 2015
PHILIPPINE FINANCIAL REPORTING STANDARDS AND INTERPRETATIONS Effective as at December 31, 2015
Adopted Not
Adopted Not
Applicable
Framework for the Preparation and Presentation of Financial Statements Conceptual Framework Phase A: Objectives and qualitative characteristics
PFRSs Practice Statement Management Commentary
Philippine Financial Reporting Standards
PFRS 1 (Revised)
First-time Adoption of Philippine Financial Reporting Standards
Amendments to PFRS 1 and PAS 27: Cost of an Investment in a Subsidiary, Jointly Controlled Entity or Associate
Amendments to PFRS 1: Additional Exemptions for First-time Adopters
Amendment to PFRS 1: Limited Exemption from Comparative PFRS 7 Disclosures for First-time Adopters
Amendments to PFRS 1: Severe Hyperinflation and Removal of Fixed Date for First-time Adopters
Amendments to PFRS 1: Government Loans
Amendments to PFRS 1: Borrowing Costs
Amendment to PFRS 1: Meaning of Effective PFRSs
PFRS 2 Share-based Payment
Amendments to PFRS 2: Vesting Conditions and Cancellations
Amendments to PFRS 2: Group Cash-settled Share-based Payment Transactions
Amendment to PFRS 2: Definition of Vesting Condition
PFRS 3 (Revised)
Business Combinations
Amendment to PFRS 3: Accounting for Contingent Consideration in a Business Combination
Amendment to PFRS 3: Scope Exceptions for Joint Arrangements
PFRS 4 Insurance Contracts
Amendments to PAS 39 and PFRS 4: Financial Guarantee Contracts
PFRS 5 Non-current Assets Held for Sale and Discontinued Operations
Amendments to PFRS 5: Changes in Methods of Disposals*
Not Early Adopted
PFRS 6 Exploration for and Evaluation of Mineral Resources

PHILIPPINE FINANCIAL REPORTING STANDARDS AND INTERPRETATIONS Effective as at December 31, 2015
Adopted Not
Adopted Not
Applicable
PFRS 7
Financial Instruments: Disclosures
Amendments to PAS 39 and PFRS 7: Reclassification of Financial Assets
Amendments to PAS 39 and PFRS 7: Reclassification of Financial Assets - Effective Date and Transition
Amendments to PFRS 7: Improving Disclosures about Financial Instruments
Amendments to PFRS 7: Disclosures – Transfers of Financial Assets
Amendments to PFRS 7: Disclosures – Offsetting Financial Assets and Financial Liabilities
Amendments to PFRS 7: Mandatory Effective Date of PFRS 9 and Transition Disclosures
Amendments to PFRS 7: Disclosures – Servicing Contracts*
Not Early Adopted
Amendments to PFRS 7: Applicability of the Amendments to PFRS 7 to Condensed Interim Financial Statements*
Not Early Adopted
PFRS 8 Operating Segments
Amendments to PFRS 8: Aggregation of Operating Segments and Reconciliation of the Total of the Reportable Segments’ Assets to the Entity’s Assets
PFRS 9 Financial Instruments * Not Early Adopted
Amendments to PFRS 9: Mandatory Effective Date of PFRS 9 and Transition Disclosures*
Not Early Adopted
Amendments to PFRS 9: Hedge accounting and amendments to PFRS 9, PFRS 7 and PAS 39 (2013 version)*
Not Early Adopted
Amendments to PFRS 9 (2014 version)* Not Early Adopted
PFRS 10 Consolidated Financial Statements
Amendments to PFRS 10, PFRS 12 and PAS 27: Investment Entities
Amendments to PFRS 10 and PAS 28: Sale or Contribution of Assets between an Investor and its Associate or Joint Venture*
Not Early Adopted
Amendments to PFRS 10 and PAS 28: Applying the Consolidation Exception*
Not Early Adopted
PFRS 11 Joint Arrangements
Amendments to PFRS 11: Accounting for Acquisitions of Interests in Joint Operations*
Not Early Adopted
PFRS 12 Disclosure of Interests in Other Entities
Amendments to PFRS 10, PFRS 12 and PAS 27: Investment Entities
PFRS 13 Fair Value Measurement

PHILIPPINE FINANCIAL REPORTING STANDARDS AND INTERPRETATIONS Effective as at December 31, 2015
Adopted Not
Adopted Not
Applicable
Amendment to PFRS 13: Short-term Receivables and Payables
Amendment to PFRS 13: Portfolio Exception
PFRS 14 Regulatory Deferral Accounts* Not Early Adopted
Philippine Accounting Standards
PAS 1 (Revised)
Presentation of Financial Statements
Amendment to PAS 1: Capital Disclosures
Amendments to PAS 32 and PAS 1: Puttable Financial Instruments and Obligations Arising on Liquidation
Amendments to PAS 1: Presentation of Items of Other Comprehensive Income
Amendments to PAS 1: Clarification of the Requirements for Comparative Information
Amendments to PAS 1: Disclosure Initiative* Not Early Adopted
PAS 2 Inventories
PAS 7 Statement of Cash Flows
PAS 8 Accounting Policies, Changes in Accounting Estimates and Errors
PAS 10 Events after the Reporting Period
PAS 11 Construction Contracts
PAS 12 Income Taxes
Amendment to PAS 12: Deferred Tax: Recovery of Underlying Assets
PAS 16
Property, Plant and Equipment
Amendments to PAS 16: Classification of Servicing Equipment
Amendment to PAS 16 and PAS 38: Revaluation Method – Proportionate Restatement of Accumulated Depreciation / Amortization
Amendment to PAS 16 and PAS 38: Clarification of Acceptable Methods of Depreciation and Amortization*
Not Early Adopted
Amendment to PAS 16 and PAS 41: Bearer Plants* Not Early Adopted
PAS 17 Leases
PAS 18 Revenue
PAS 19 Employee Benefits
Amendments to PAS 19: Actuarial Gains and Losses, Group Plans and Disclosures
PAS 19 (Amended)
Employee Benefits
Amendments to PAS 19: Defined Benefit Plans: Employee Contribution
Amendments to PAS 19: Regional Market Issue Regarding Discount Rate*
Not Early Adopted
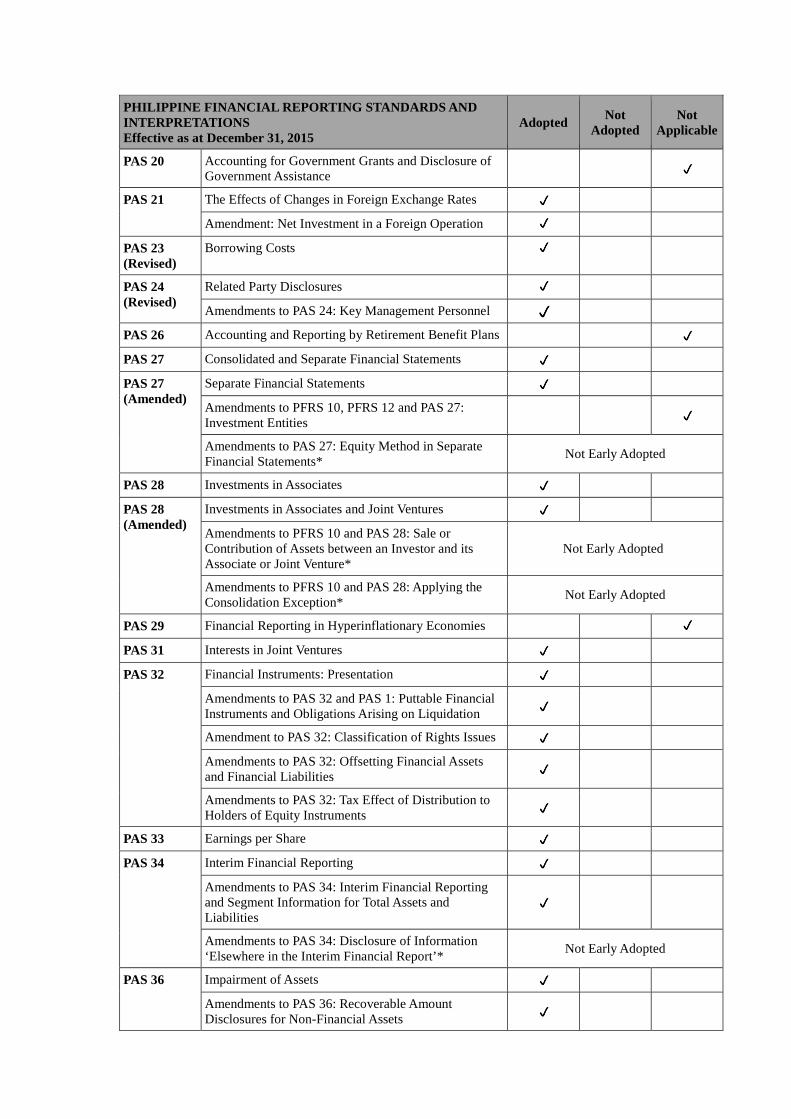
PHILIPPINE FINANCIAL REPORTING STANDARDS AND INTERPRETATIONS Effective as at December 31, 2015
Adopted Not
Adopted Not
Applicable
PAS 20 Accounting for Government Grants and Disclosure of Government Assistance
PAS 21 The Effects of Changes in Foreign Exchange Rates
Amendment: Net Investment in a Foreign Operation
PAS 23 (Revised)
Borrowing Costs
PAS 24 (Revised)
Related Party Disclosures
Amendments to PAS 24: Key Management Personnel
PAS 26 Accounting and Reporting by Retirement Benefit Plans
PAS 27 Consolidated and Separate Financial Statements
PAS 27 (Amended)
Separate Financial Statements
Amendments to PFRS 10, PFRS 12 and PAS 27: Investment Entities
Amendments to PAS 27: Equity Method in Separate Financial Statements*
Not Early Adopted
PAS 28 Investments in Associates
PAS 28 (Amended)
Investments in Associates and Joint Ventures
Amendments to PFRS 10 and PAS 28: Sale or Contribution of Assets between an Investor and its Associate or Joint Venture*
Not Early Adopted
Amendments to PFRS 10 and PAS 28: Applying the Consolidation Exception*
Not Early Adopted
PAS 29 Financial Reporting in Hyperinflationary Economies
PAS 31 Interests in Joint Ventures
PAS 32 Financial Instruments: Presentation
Amendments to PAS 32 and PAS 1: Puttable Financial Instruments and Obligations Arising on Liquidation
Amendment to PAS 32: Classification of Rights Issues
Amendments to PAS 32: Offsetting Financial Assets and Financial Liabilities
Amendments to PAS 32: Tax Effect of Distribution to Holders of Equity Instruments
PAS 33 Earnings per Share
PAS 34 Interim Financial Reporting
Amendments to PAS 34: Interim Financial Reporting and Segment Information for Total Assets and Liabilities
Amendments to PAS 34: Disclosure of Information ‘Elsewhere in the Interim Financial Report’*
Not Early Adopted
PAS 36 Impairment of Assets
Amendments to PAS 36: Recoverable Amount Disclosures for Non-Financial Assets

PHILIPPINE FINANCIAL REPORTING STANDARDS AND INTERPRETATIONS Effective as at December 31, 2015
Adopted Not
Adopted Not
Applicable
PAS 37 Provisions, Contingent Liabilities and Contingent Assets
PAS 38 Intangible Assets
Amendments to PAS 16 and PAS 38: Revaluation Method – Proportionate Restatement of Accumulated Depreciation / Amortization
Amendment to PAS 16 and PAS 38: Clarification of Acceptable Methods of Depreciation and Amortization*
Not Early Adopted
PAS 39
Financial Instruments: Recognition and Measurement
Amendments to PAS 39: Transition and Initial Recognition of Financial Assets and Financial Liabilities
Amendments to PAS 39: Cash Flow Hedge Accounting of Forecast Intragroup Transactions
Amendments to PAS 39: The Fair Value Option
Amendments to PAS 39 and PFRS 4: Financial Guarantee Contracts
Amendments to PAS 39 and PFRS 7: Reclassification of Financial Assets
Amendments to PAS 39 and PFRS 7: Reclassification of Financial Assets – Effective Date and Transition
Amendments to Philippine Interpretation IFRIC-9 and PAS 39: Embedded Derivatives
Amendment to PAS 39: Eligible Hedged Items
Amendments to PAS 39: Novation of Derivatives and Continuation of Hedge Accounting
PAS 40 Investment Property
Amendments to PAS 40: Clarifying the Interrelationship between PFRS 3 and PAS 40 when Classifying Property as Investment Property or Owner-Occupied Property
PAS 41 Agriculture
Amendment to PAS 16 and PAS 41: Bearer Plants* Not Early Adopted
Philippine Interpretations
IFRIC 1 Changes in Existing Decommissioning, Restoration and Similar Liabilities
IFRIC 2 Members’ Share in Co-operative Entities and Similar Instruments
IFRIC 4 Determining Whether an Arrangement Contains a Lease
IFRIC 5 Rights to Interests arising from Decommissioning, Restoration and Environmental Rehabilitation Funds
IFRIC 6 Liabilities arising from Participating in a Specific Market – Waste Electrical and Electronic Equipment

PHILIPPINE FINANCIAL REPORTING STANDARDS AND INTERPRETATIONS Effective as at December 31, 2015
Adopted Not
Adopted Not
Applicable
IFRIC 7 Applying the Restatement Approach under PAS 29 Financial Reporting in Hyperinflationary Economies
IFRIC 8 Scope of PFRS 2
IFRIC 9 Reassessment of Embedded Derivatives
Amendments to Philippine Interpretation IFRIC-9 and PAS 39: Embedded Derivatives
IFRIC 10 Interim Financial Reporting and Impairment
IFRIC 11 PFRS 2 – Group and Treasury Share Transactions
IFRIC 12 Service Concession Arrangements
IFRIC 13 Customer Loyalty Programmes
IFRIC 14 The Limit on a Defined Benefit Asset, Minimum Funding Requirements and their Interaction
Amendments to Philippine Interpretations IFRIC-14, Prepayments of a Minimum Funding Requirement
IFRIC 15 Agreements for the Construction of Real Estate* Not Early Adopted
IFRIC 16 Hedges of a Net Investment in a Foreign Operation
IFRIC 17 Distributions of Non-cash Assets to Owners
IFRIC 18 Transfers of Assets from Customers
IFRIC 19 Extinguishing Financial Liabilities with Equity Instruments
IFRIC 20 Stripping Costs in the Production Phase of a Surface Mine
IFRIC 21 Levies
SIC-7 Introduction of the Euro
SIC-10 Government Assistance – No Specific Relation to Operating Activities
SIC-12 Consolidation – Special Purpose Entities
Amendment to SIC-12: Scope of SIC 12
SIC-13 Jointly Controlled Entities – Non-Monetary Contributions by Venturers
SIC-15 Operating Leases – Incentives
SIC-25 Income Taxes – Changes in the Tax Status of an Entity or its Shareholders
SIC-27 Evaluating the Substance of Transactions Involving the Legal Form of a Lease
SIC-29 Service Concession Arrangements: Disclosures
SIC-31 Revenue – Barter Transactions Involving Advertising Services
SIC-32 Intangible Assets – Web Site Costs
* Standards and interpretations which will become effective subsequent to December 31, 2015.

Note: Standards and interpretations tagged as “Not Applicable” are those standards and interpretations which were adopted but the entity has no significant covered transaction as at and for the year ended December 31, 2015.


Annex IV
SM PRIME HOLDINGS, INC. AND SUBSIDIARIES Financial Ratios – Key Performance Indicators As of December 31, 2015 and 2014
Dec 31 2015
Dec 31 2014
i. Current ratio Total current assets Total current liabilities 1.41 2.05
ii. Debt-to-equity ratio Total interest-bearing liabilities Total equity attributable to equity holders of the parent + Total interest-bearing liabilities
0.42 : 0.58
0.39 : 0.61
Net debt-to-equity ratio Total interest-bearing liabilities less cash and cash equivalents
and investment securities Total equity attributable to equity holders of the parent + Total interest-bearing liabilities less cash and cash equivalents and investment securities
0.38 : 0.62
0.32:0.68
iii. Asset to equity ratio Total assets Total equity attributable to equity holders of the parent
2.04
1.95
iv. Earnings before interest, income taxes, depreciation and amortization (EBITDA) to interest expense
EBITDA Interest expense 11.19 8.24
Debt to EBITDA Total interest-bearing liabilities EBITDA 4.12 3.83
v. Return on equity
Net income attributable to equity holders of the parent Total average equity attributable to equity holders of the parent 0.10* 0.10
Return on investment properties Net income attributable to equity holders of the parent
Total average investment properties (excluding construction in progress) 0.12* 0.12
* Above financial data reflects core operating income and excludes one-time trading gain on sale of marketable securities amounting to P7.41 billion.

Annex V
SM PRIME HOLDINGS, INC. AND SUBSIDIARIES Retail Bond As of December 31, 2015 (1) Gross and Net Proceeds as Disclosed in the Final Prospectus
P15.0B Issue Size
P5.0 B Over-Subscription
Option
Total Proceeds (inclusive of Over-
Subscription) Gross Proceeds P=15,000,000,000 P=5,000,000,000 P=20,000,000,000 Estimated Expenses 143,650,625 42,500,000 186,150,625 Net Proceeds P=14,856,349,375 P=4,957,500,000 P=19,813,849,375 (2) Actual Gross and Net Proceeds Gross Proceeds P=20,000,000,000 Actual Expenses 211,443,803 Net Proceeds P=19,788,556,197 (3) Each Expenditure Item where the Proceeds were Used The net proceeds was used to finance capital expenditures of the following:
Projects Amounts in million SM City Cabanatuan P=2,324 SM City Seaside Cebu 1,946 SM Cagayan de Oro 2 and Tower 1,439 SM Mall of Asia – Expansion 779 SM Trece Martires Cavite 431 SM Center Sangandaan 407 SM San Jose Del Monte 253 SM Puerto Princesa 7 TOTAL P=7,586
(4) As of December 31, 2015, P=7,586 million was used in financing capital expenditures for
the construction and expansion of malls.
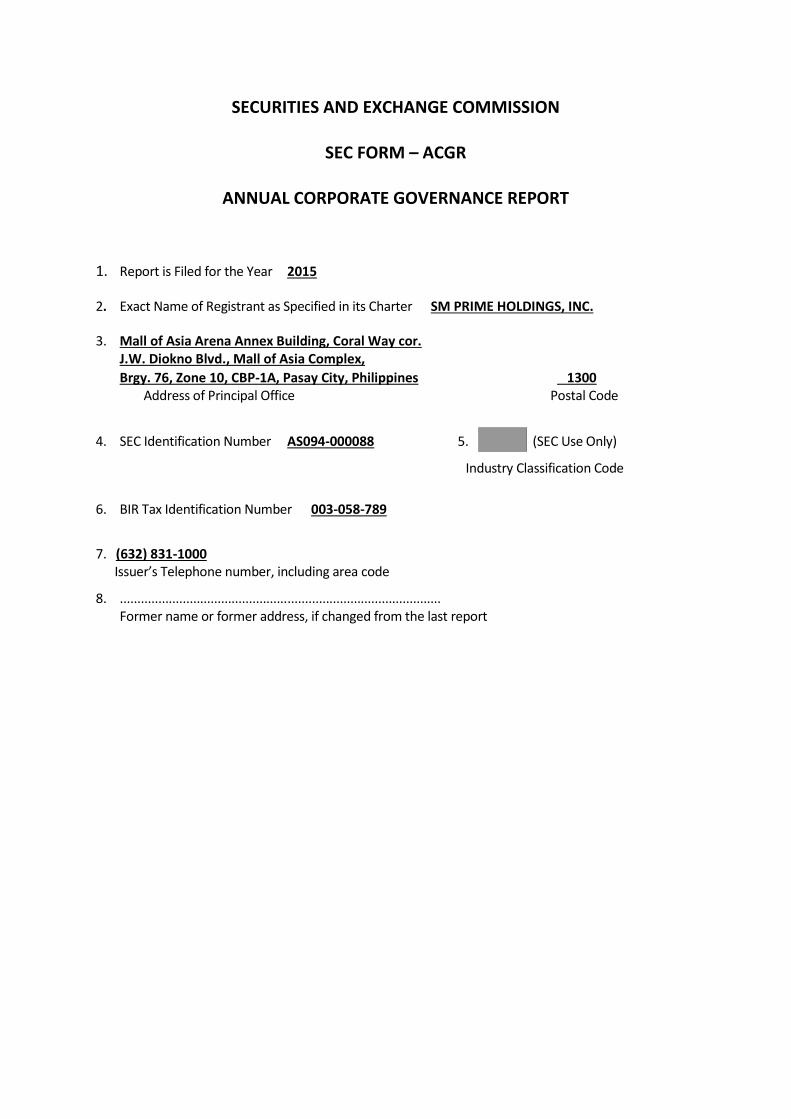
SECURITIES AND EXCHANGE COMMISSION
SEC FORM – ACGR
ANNUAL CORPORATE GOVERNANCE REPORT
1. Report is Filed for the Year 2015
2. Exact Name of Registrant as Specified in its Charter SM PRIME HOLDINGS, INC.
3. Mall of Asia Arena Annex Building, Coral Way cor.
J.W. Diokno Blvd., Mall of Asia Complex,
Brgy. 76, Zone 10, CBP-1A, Pasay City, Philippines 1300
Address of Principal Office Postal Code
4. SEC Identification Number AS094-000088 5. (SEC Use Only)
Industry Classification Code
6. BIR Tax Identification Number 003-058-789
7. (632) 831-1000
Issuer’s Telephone number, including area code
8. ............................................................................................
Former name or former address, if changed from the last report

Table of Contents
A. BOARD MATTERS ........................................................................................................................... 1
1) Board of Directors ...................................................................................................................... 1
(a) Composition of the Board (updated) (b) Corporate Governance Policy (c) Review of Vision and Mission (d) Directorship in Other Companies (updated) (e) Shareholding in the Company (updated)
2) Chairman and CEO .................................................................................................................... 5
3) Succession Plan ......................................................................................................................... 6
4) Other Executive, Non-Executive and Independent Directors ................................................... 6
5) Changes in the Board of Directors ............................................................................................. 8
(a) Resignation/Death/Removal (b) Selection/Appointment, Re-election, Disqualification, Removal, Reinstatement and
Suspension (c) Voting Results of the Last Annual General Meeting (updated)
6) Orientation and Education Program (updated) ........................................................................ 12
B. CODE OF BUSINESS CONDUCT & ETHICS ............................................................................... 14
1) Policies ..................................................................................................................................... 14
2) Code of Ethics .......................................................................................................................... 15
3) Compliance with Code of Ethics. ............................................................................................. 15
4) Related Party Transactions ...................................................................................................... 15
5) Family, Commercial and Contractual Relations ....................................................................... 16
6) Alternative Dispute Resolution ................................................................................................. 16
C. BOARD MEETINGS & ATTENDANCE .......................................................................................... 17
1) Schedule of Board of Directors’ Meetings................................................................................ 17
2) Attendance of Directors (updated) .......................................................................................... 17
3) Separate meeting for Non-Executive Directors ....................................................................... 17
4) Minimum Quorum ..................................................................................................................... 17
5) Access to Information ............................................................................................................... 17
6) External Advice ........................................................................................................................ 19
7) Change/s in Existing Policies (updated) .................................................................................. 19
D. REMUNERATION MATTERS ........................................................................................................ 19
1) Remuneration Process............................................................................................................. 19
2) Remuneration Policy and Structure for Executive and Non-Executive Directors (updated) .... 20
3) Aggregate Remuneration (updated) ........................................................................................ 20
4) Stock Rights, Options and Warrants ........................................................................................ 21
5) Remuneration of Management (updated) ................................................................................ 21
E. BOARD COMMITTEES .................................................................................................................. 22
1) Number of Members, Functions and Responsibilities (updated) ............................................. 22
2) Committee Members (updated) ............................................................................................... 23
3) Changes in Committee Members (updated) ............................................................................ 25
4) Work Done and Issues Addressed (updated) .......................................................................... 25
5) Committee Program ................................................................................................................. 26
F. RISK MANAGEMENT SYSTEM ..................................................................................................... 27
1) Risk Management (updated) ................................................................................................... 27

2) Risk Policy ................................................................................................................................ 27
3) Control System Set Up (updated) ............................................................................................ 29
G. INTERNAL AUDIT AND CONTROL ............................................................................................... 30
1) Internal Control System (updated) ........................................................................................... 30
2) Internal Audit (updated)............................................................................................................ 31
H. ROLE OF STAKEHOLDERS .......................................................................................................... 33
1) Company Policies (updated) .................................................................................................... 33
2) Corporate Responsibility Report (updated).............................................................................. 34
3) Performance-Enhancing Mechanisms for Employee Participation (updated) ......................... 34
4) Procedures for Handling Employee Complaints. ..................................................................... 36
I. DISCLOSURE AND TRANSPARENCY ......................................................................................... 36
1) Ownership Structure (updated) ................................................................................................ 36
2) Annual Report .......................................................................................................................... 36
3) External Auditor’s Fee (updated) ............................................................................................. 37
4) Medium of Communication ...................................................................................................... 37
5) Date of Release of Audited Financial Report (updated) ........................................................... 37
6) Company Website .................................................................................................................... 37
7) Disclosure of RPT (updated) .................................................................................................... 37
J. RIGHTS OF STOCKHOLDERS ..................................................................................................... 39
1) Right to Participate Effectively in and Vote in Annual/Special Stockholders’ Meetings .......... 39
(a) Quorum (b) System Used to Approve Corporate Acts (c) Stockholders' Rights (updated) (d) Stockholders' Participation (updated) (e) Modifications (f) Stockholders' Attendance (updated) (g) Proxy Voting Policies (h) Sending of Notices (i) Definitive Information Statements and Management Report (updated) (j) Notice of Annual/Special Stockholders' Meeting
2) Treatment of Minority Stockholders ......................................................................................... 43
K. INVESTORS RELATIONS PROGRAM .......................................................................................... 43
1) External and Internal Communications Policies ...................................................................... 43
2) Investor Relations Program ..................................................................................................... 43
3) Rules and Procedures Governing the Acquisition of Corporate Control .................................. 44
L. CORPORATE SOCIAL RESPONSIBILITY INITIATIVES .............................................................. 44
M. BOARD, DIRECTOR, COMMITTEE AND CEO APPRAISAL ........................................................ 45
N. INTERNAL BREACHES AND SANCTIONS .................................................................................. 46

1
A. BOARD MATTERS
1) Board of Directors
Number of Directors per Articles of Incorporation 8
Actual number of Directors for the year 8
(a) Composition of the Board
Complete the table with information on the Board of Directors:
Director’s Name
Type [Executive
(ED), Non-
Executive (NED)
or Independent
Director (ID)]
If
nominee,
identify
the
principal
Nominator in the last
election (if ID, state the
relationship with the
nominator)
Date
first
elected
Date last elected
(if ID, state the
number of years
served as ID)1
Elected
when
(Annual/
Special
Meeting)
No. of
years
served
as
director
Henry Sy, Sr. NED
None
Corazon I. Morando 1994 April 14, 2015 Annual 21
Henry T. Sy, Jr. NED Corazon I. Morando 1994 April 14, 2015 Annual 21
Jose L. Cuisia, Jr. ID Linda Panutat (no relation)
1994 April 14, 2015
(4) Annual 21
Gregorio U. Kilayko ID Linda Panutat (no relation)
2008 April 14, 2015
(4) Annual 7
Joselito H. Sibayan ID Linda Panutat (no relation)
2011 April 14, 2015
(4) Annual 4
Hans T. Sy ED Corazon I. Morando 1994 April 14, 2015 Annual 21
Herbert T. Sy NED Corazon I. Morando 1994 April 14, 2015 Annual 21
Jorge T. Mendiola NED Corazon I. Morando 2012 April 14, 2015 Special 3
(b) Provide a brief summary of the corporate governance policy that the board of directors has adopted. Please emphasize
the policy/ies relative to the treatment of all shareholders, respect for the rights of minority shareholders and of other
stakeholders, disclosure duties, and board responsibilities.
Treatment of All Shareholders and Respect for the Rights of Minority Shareholders The Company’s corporate governance framework and policies are embodied in its Revised Manual on Corporate Governance, which sets out the compliance system and plan of compliance. The Manual mandates that it shall be the duty of the directors to promote shareholder rights, remove impediments to the exercise of shareholder rights and allow possibilities to seek redress for violation of their rights. It also asserts the rights of all shareholders, including holders of minority interests, as follows:
a. Voting right b. Power of inspection c. Right to information d. Right to dividend e. Appraisal right
In addition to the above rights, the Manual provides that minority shareholders shall be given the right to:
a. Propose the holding of a meeting and the items in the agenda of the meeting, provided the items are for legitimate business purposes, and in accordance with law, jurisprudence and best practice; and
b. Have access to any and all information relating to matters for which the Management is accountable, and to those relating to matters for which the Management shall include such information.
Moreover, the Company’s Code of Ethics provides the following to protect the rights of shareholders:
a. Adoption of corporate governance practices, strategies and plans with the end in view of increasing shareholder value.
b. Maintenance of complete and accurate records of all financial and business transactions in accordance with laws and regulations governing financial reporting and generally accepted accounting principles to provide the basis for the report it discloses to its shareholders regarding the Company’s results of operations and financial position.
c. Ensuring an independent audit of its financial statements by external auditors.
1 Reckoned from the election immediately following January 2, 2012.

2
Rights of Other Stakeholders Complementing the Manual are a number of related policies, which deal with the rights of other stakeholders, such as the following:
Policy Stakeholder Description
Code of Ethics Employees, Customers, Business Partners, Creditors, the Community
The Code of Ethics stresses integrity in the relationships and dealings with business partners, the Company’s duties regarding employee welfare, the protection of company information assets, and promotion of corporate social responsibility. It further provides guidelines on the expected manner by which directors, officers, and employees should perform their duties and responsibilities and while dealing with creditors, customers, contractors, suppliers, regulators, and the public.
Conflict of Interest Policy
Employees, Business Partners
The Conflict of Interest Policy prohibits all directors and employees from engaging in transactions that result in conflicts of interest, and mandates them to promptly disclose actual or perceived conflicts of interest, such as acceptance of gifts and loans from the Company or its suppliers. Conflicted directors are required to inhibit themselves from participating in board meetings and are specifically identified in the Company’s Definitive Information Statement submitted to the SEC.
Guidelines on Acceptance of Gifts
Employees, Business Partners
The Guidelines on Acceptance of Gifts governs the solicitation and acceptance of gifts by directors, officers, and employees from any business partner to avoid conflict of interest scenarios.
Policy on Accountability, Integrity and Vigilance (PAIV)
Employees PAIV tackles procedures for raising concerns and issues through the filing of an incident report by any director, officer, or employee on suspected or actual violations of the Code of Ethics, the Company’s Code of Conduct or any applicable law or regulation. The policy further states the responsibility of Management for conducting investigations and reporting findings.
Supplier Selection Policy
Suppliers The Supplier Selection Policy requires adherence to the principles of healthy competition, equal opportunity and fair treatment of business partners. As such, selection of suppliers follows an open, competitive and non-discriminatory process. SM Prime implements a vendor enrolment process that screens qualifications of vendors/suppliers the Company will deal with. Such qualifications include legality of entity or business, adequacy of financial strength, compliance with SM Prime policies such as conflict of interest disclosure requirements and ethical standards, and support to SM Prime’s environmental missions, health and safety culture.
Policy on Protection of Creditor’s Rights
Creditors The Policy on Protection of Creditors’ Rights requires that the Company respect agreements with creditors, manage loans according to lending objectives, ensure timely repayment of loans and interests, thoroughly honor loan conditions as agreed, and competently operate the business to assure creditors about the Company’s healthy financial standing and loan repayment capabilities.
Insider Trading Policy
Investors, the Government
The Insider Trading Policy restricts the disclosure of privileged information and participation in trading activities by directors, officers, and employees within a defined period before and after the disclosure of quarterly and annual financial results and any other material information.
Related Party Transactions Policy
Investors, the Government
The Related Party Transactions Policy reiterates the Company’s commitment to transparency by practicing full disclosure of the details, nature, extent, and all other material information on transactions with related parties in the Company’s financial statements and in the quarterly and annual reports to the SEC and PSE.

3
Disclosure Duties In accordance with the Code of Ethics, the Company is committed to providing its stockholders and the public, timely and accurate information about the Company and its business. Accordingly, SM Prime regularly updates its website and practices full and prompt disclosure of all material information. The website has a separate Corporate Governance section that features, among others, the Manual on Corporate Governance, Code of Ethics and other relevant policies, programs and important information. SM Prime also publishes a separate Sustainability Report, which highlights its policies and programs on corporate social responsibility and environmental sustainability, among others. Likewise, the Company conducts regular briefings and meetings with investors, analysts and the press to keep them updated on the Company’s various projects, as well as its financial and operational results. The presentation materials used in these briefings, as well as the Company’s SEC and PSE reports and annual reports, may be viewed and downloaded from its website. Board Responsibilities The duties and responsibilities of the Board of Directors are laid down in the Revised Manual on Corporate Governance. Generally, the Board is responsible for overseeing the activities of Management in the implementation of strategies to achieve the vision and mission of the Company. These duties and responsibilities are discussed in detail in subsequent sections of this report.
(c) How often does the Board review and approve the vision and mission?
The Board undertakes the review and approval of the Company’s vision and mission at least once a year or more frequently if necessary.
(d) Directorship in Other Companies
(i) Directorship in the Company’s Group2
Identify, as and if applicable, the members of the company’s Board of Directors who hold the office of director in
other companies within its Group:
Director’s Name Corporate Name of the
Group Company
Type of Directorship
(Executive, Non-Executive,
Independent). Indicate if
director is also the
Chairman.
Henry Sy, Sr. SM Investments Corporation Highlands Prime, Inc. BDO Unibank, Inc. China Banking Corporation
NED (Chairman) NED (Chairman) NED (Chairman Emeritus) NED (Honorary Chairman)
Henry T. Sy, Jr. SM Investments Corporation SM Development Corp. Highlands Prime, Inc. Pico de Loro Beach and Country Club
NED (Vice Chairman) ED (Chairman) ED (Vice Chairman) NED (Chairman)
Hans T. Sy China Banking Corporation National University
NED (Chairman) NED (Chairman)
Herbert T. Sy Supervalue Inc. Super Shopping Market Inc. Sanford Marketing Corporation China Banking Corporation
NED (Vice Chairman) NED (Vice Chairman) NED (Vice Chairman) NED
Gregorio U. Kilayko Belle Corporation Independent
2 The Group is composed of the parent, subsidiaries, associates and joint ventures of the company.

4
(ii) Directorship in Other Listed Companies
Identify, as and if applicable, the members of the company’s Board of Directors who are also directors of publicly-
listed companies outside of its Group:
Director’s Name Name of Listed Company
Type of Directorship
(Executive, Non-Executive,
Independent). Indicate if
director is also the Chairman.
Jose L. Cuisia, Jr. PHINMA Corporation Holcim Philippines, Inc. Manila Water Company, Inc.
NED NED Independent
Joselito H. Sibayan Apex Mining Corporation Independent
(iii) Relationship within the Company and its Group
Provide details, as and if applicable, of any relation among the members of the Board of Directors, which links them
to significant shareholders in the company and/or in its group:
Director’s Name Name of the
Significant Shareholder Description of the relationship
Henry Sy, Sr. (Chairman Emeritus) Henry T. Sy, Jr. (Chairman) Hans T. Sy (Executive Director) Herbert T. Sy (Non-Executive Director)
SM Investments Corporation (SMIC)
Henry T. Sy, Jr., Hans T. Sy and Herbert T. Sy are sons of Henry Sy, Sr. All hold direct beneficial ownership of SMIC. Henry Sy, Sr. is the Chairman and Henry Sy, Jr. is the Vice Chairman of SMIC and they have the power to vote the common shares of SMIC in SMPH.
(iv) Has the company set a limit on the number of board seats in other companies (publicly listed, ordinary and
companies with secondary license) that an individual director or CEO may hold simultaneously? In particular, is the
limit of five board seats in other publicly listed companies imposed and observed? If yes, briefly describe other
guidelines:
In accordance with the Revised Manual on Corporate Governance, non-executive and independent directors may hold a maximum of five (5) board seats in publicly-listed companies simultaneously. The Chief Executive Officer and other executive directors shall submit themselves to a maximum limit of two (2) board seats in corporate Boards of other publicly-listed companies outside the SM Group. In any case, the capacity of directors to service with diligence shall not be compromised.
(e) Shareholding in the Company
Complete the following table on the members of the company’s Board of Directors who directly and indirectly own shares
in the company:
Name of Director Number of Direct shares Number of
Indirect shares % of Capital Stock
Henry Sy, Sr. - 105,395,579 0.36
Jose L. Cuisia, Jr. 408,533 89,128 0
Henry T. Sy, Jr. 680,818,440 - 2.36
Hans T. Sy 661,002,569 24,160,943 2.37
Herbert T. Sy 661,472,045 4,917,477 2.31
Gregorio U. Kilayko 12,500 190,080 0
Joselito H. Sibayan 36,375 - 0
Jorge T. Mendiola 1,000 1,364,167 0

5
X
Name of Director Number of Direct shares Number of
Indirect shares % of Capital Stock
TOTAL 2,003,751,462 136,117,374 7.40
2) Chairman and CEO
(a) Do different persons assume the role of Chairman of the Board of Directors and CEO? If no, describe the checks and
balances laid down to ensure that the Board gets the benefit of independent views.
Yes No (v)
Identify the Chair and CEO:
Chairman of the Board Mr. Henry T. Sy, Jr.
CEO/President Mr. Hans T. Sy
(b) Roles, Accountabilities and Deliverables
Define and clarify the roles, accountabilities and deliverables of the Chairman and CEO.
Chairman Chief Executive Officer
Role The Chairman acts as the presiding officer of the Board of Directors.
The Chief Executive Officer is the President of the Company, who oversees its operations.
Accountabilities
(Art. IV Sec. 2 of By-Laws, as amended on April 23, 2007 and Revised Manual on Corporate Governance) The Chairman of the Board of Directors shall have the following powers and duties:
a. To preside at all meetings of stockholders and directors, and ensure that such meetings are held in accordance with the Corporation’s By-Laws;
b. To supervise the preparation of the agenda of the meeting in coordination with the Corporate Secretary, taking into consideration the advice and suggestions of the Board and Management;
c. To sign all certificates, contracts, and other instruments on behalf of the Corporation, except as otherwise provided by law;
d. To have general supervision and administration of the affairs of the Corporation;
e. To initiate and develop corporate objectives and policies and formulate long range projects, plans, and programs for the approval of the Board of Directors;
f. To carry out the resolutions of the Board of Directors and to represent the corporation at all functions and proceedings;
(Art. IV Sec. 4 of By-Laws, as amended on April 23, 2007 and Revised Manual on Corporate Governance) The President shall have the following powers and duties: a. To ensure that the administrative and
operational policies of the Corporation are carried out under the direction and control of the Chairman of the Board and Chief Executive Officer;
b. To have general supervision of the business, affairs, and property of the Corporation, and over its employees and officers;
c. To recommend to the Chairman of the Board and the Board of Directors specific projects for the attainment of corporate objectives and policies;
d. To sign or cause the signatures of Certificates of Stock;
e. To see that all orders and resolutions of the Board are carried into effect;
f. To submit to the Board as soon as possible after the close of each fiscal year, and to the stockholders at the annual meeting, a complete report of the operations of the Corporation for the preceding year, and the state of its affairs;
g. To report to the Board from time to time all matters within its knowledge which the interest of the Corporation may require to be brought to their notice;
h. To exercise such powers and duties and perform such duties commonly incident to and vested in the President of a

6
Chairman Chief Executive Officer
g. To maintain qualitative and timely lines of communication and information between the Board and Management; and
h. To perform such other duties as are incident to his office or are entrusted to him by the Board of Directors.
Corporation and which the Board or Chairman of the Board may, from time to time assign to him.
The President may assign the exercise or performance of any of the foregoing powers, duties and functions to any other officer(s), subject always to his supervision and control.
Deliverables
a. With the support from all the directors in the Board, we will continue to strive to enhance shareholder value.
b. We will continue to strengthen the
SM brand and build the business on the back of very positive economic outlook of the country.
c. Study and pursue further
improvement in corporate governance structures and practices following the guidelines in the ASEAN CG scorecard.
a. Ensure that the goals and objectives of the Group which were agreed upon during the Annual Strategic Planning are met.
b. Stress further on our core values of
innovation, hard work, efficient cost management, integrity across all business units.
c. Update and align our Corporate
Governance Manual towards best practice.
d. Implementation of matters approved by
the Board of Directors and shareholders.
3) Explain how the board of directors plan for the succession of the CEO/Managing Director/President and the top key
management positions?
The Company follows an established framework in succession planning, which involves the linking of strategic goals and workforce requirements, the analysis of continuity issues and gaps in the long-term, the identification of talent pools, and the development, implementation and monitoring of succession strategies based on the considerations identified. The Board, through the Nomination Committee, is responsible for assessing the leadership needs of the company to ensure the selection of qualified leaders that are diverse and a good fit for the organization’s mission and goals, and have the necessary skills for the organization. In evaluating candidates, a high level of competency, experience and stature are used as standards. Furthermore, the maturity of character and ability to effectively assimilate into the SM culture are critical.
4) Other Executive, Non-Executive and Independent Directors
Does the company have a policy of ensuring diversity of experience and background of directors in the board? Please explain.
Yes. The Company’s Revised Manual on Corporate Governance states that the Board shall install a process of selection to ensure a mix of competent directors and officers. Said mix considers diversity in gender, field expertise and career background. Accordingly, the Company’s Board is composed of directors who have significant experience in the real estate, retail and financial industry sectors. In addition, the Company has since endeavored to have at least one female independent director in its Board.
Does it ensure that at least one non-executive director has an experience in the sector or industry the company belongs to?
Please explain.
Yes. Under the Company’s Corporate Governance Manual, in addition to the qualifications for membership in the Board required in relevant laws, the Board may provide for additional qualifications, which may include practical understanding of the company’s business, membership in good standing in relevant industry, business or professional organizations, and previous business experience. In this regard, the Company’s Chairman, who is a non-executive director, for instance, has significant experience in the real estate acquisitions and development activities of the SM Group, which include the identification, evaluation and negotiation for potential sites, as well as the input of design ideas.

7
Define and clarify the roles, accountabilities and deliverables of the Executive, Non-Executive and Independent Directors:
Executive Non-Executive Independent Director
Role
The Executive Director’s general role is to ensure that aside from his responsibilities as a director, the day-to-day management of the company is sound and in line with the Company’s objectives. He is also expected to serve as the medium between the Board and Management.
The Non-Executive Director is expected to perform all the duties and responsibilities of a director, as provided in the Revised Manual on Corporate Governance, and bring in new ideas during Board meetings.
The primary role of the Independent Director involves the exercise of independent judgment to provide balance and ensure impartial discussions during Board meetings.
Accountabilities
Under the Revised Manual on Corporate Governance, it is the Board of Directors’ general responsibility to:
· Install a process of selection to ensure a mix of competent directors and officers;
· Determine and regularly review the Corporation’s purpose, vision and mission; · In coordination with Management, determine and oversee the implementation of
strategies to carry out the Corporation’s objectives; · Institute a plan of succession for key Management positions in the Corporation;
· Ensure that the Corporation complies with all relevant laws, regulations and codes of best business practices;
· Formulate a clear policy of accurate, timely and effective communications with the Corporation’s stakeholders in the community in which it operates or are directly affected by its operations;
· Adopt a system of internal checks and balances;
· Identify key risk areas and key performance indicators and monitor these factors with due diligence;
· Keep Board authority within the powers of the institution as prescribed in the Articles of Incorporation, By-Laws and in existing laws, rules and regulations;
· Formulate and implement policies to ensure the integrity of related party transactions between and among the Corporation and its related companies, business associates, major stockholders, officers, directors and their spouses, children, dependent siblings and parents, and of interlocking director relationships; and
· Establish and maintain an alternative dispute resolution system to settle conflicts between the Corporation and its stockholders or other third parties, including regulatory authorities; and
· Properly discharge the above functions, among others, by meeting regularly, and ensuring that all such meetings are duly minuted.
The Revised Manual on Corporate Governance also provides that a director shall also:
· Conduct fair business transactions with the Corporation and to ensure that personal interest does not bias Board decisions;
· Devote time and attention necessary to properly discharge his duties and responsibilities;
· Act judiciously;
· Exercise independent judgment;
· Have a working knowledge of the statutory and regulatory requirements affecting the Corporation, including the contents of its Articles of Incorporation and By-Laws, the requirements of the Commission, and where applicable, the requirements of other regulatory agencies;
· Observe confidentiality;
· Ensure the continuing soundness, effectiveness and adequacy of the Corporation’s control environment; and
· Attend, before assumption of office and annually thereafter, a seminar on corporate governance conducted by a duly recognized private or government institute.
Deliverables
· Further strengthen and streamline the support infrastructure of the organization to be more
· Take lead in the review of the performance of Board Committees vis-à-vis their respective
· Oversee the updating of the Corporate Governance Manual.

8
Executive Non-Executive Independent Director
efficient and responsive to the needs of our growing business.
· Promote the corporate governance and compliance culture in the Company.
· Institutionalize the risk management and corporate social responsibility programs across the Group.
charters, and introduce refinements.
· Pursue continuing education programs for directors.
· Meet once a year, without the Executive Directors and Senior Management.
· Meet the Auditor and External Auditors.
· Pursue continuing education programs for directors.
Provide the company’s definition of "independence" and describe the company’s compliance to the definition.
The Company has adopted the definition of independence from Section 38 of the Philippine Securities Regulation Code. To ensure that the term “independence” fittingly applies, the Company tailored the SRC definition to define independence as “independence from Management, substantial shareholdings and material relations, whether it be business or otherwise, which could reasonably be perceived to impede the performance of independent judgment”. The Company adopts this definition as a requisite and one of the qualifications for its independent directors. It anchors its definition of “independence” on the commitment to a principles-based and responsible decision-making that respects and promotes the rights of shareholders, especially of the minority shareholders. Furthermore, compliance towards this commitment is assessed through the Annual Board Evaluation Process where INDEPENDENCE is a standard performance norm.
Does the company have a term limit of five consecutive years for independent directors? If after two years, the company wishes
to bring back an independent director who had served for five years, does it limit the term for no more than four additional years?
Please explain.
The Company complies with the provisions of the SEC Memorandum Circular No. 9, Series of 2011, which states that independent directors shall can serve as such for five (5) consecutive years, followed by a cooling off period of two (2) years, and then another five (5) years thereafter.
5) Changes in the Board of Directors (Executive, Non-Executive and Independent Directors)
(a) Resignation/Death/Removal
None.
(b) Selection/Appointment, Re-election, Disqualification, Removal, Reinstatement and Suspension
Describe the procedures for the selection/appointment, re-election, disqualification, removal, reinstatement and
suspension of the members of the Board of Directors. Provide details of the processes adopted (including the frequency
of election) and the criteria employed in each procedure:
Procedure Process Adopted Criteria
a. Selection/Appointment
(i) Executive
Directors
The Revised Manual on Corporate Governance requires the conduct of the following process/procedures in the nomination and election of directors:
· The Corporate Secretary shall set a reasonable period for the submission of nominations of candidates for election to the Board of Directors. All nominations for directors submitted in writing to the Corporate Secretary within such
Per the Company’s Revised Manual on Corporate Governance each director shall possess all of the following qualifications:
· Ownership of at least one (1) share of stock of the Corporation;
· At least twenty-one (21) years of age;
· At least a college graduate or have sufficient experience in managing the business to substitute for such formal
(ii) Non-
Executive
Directors
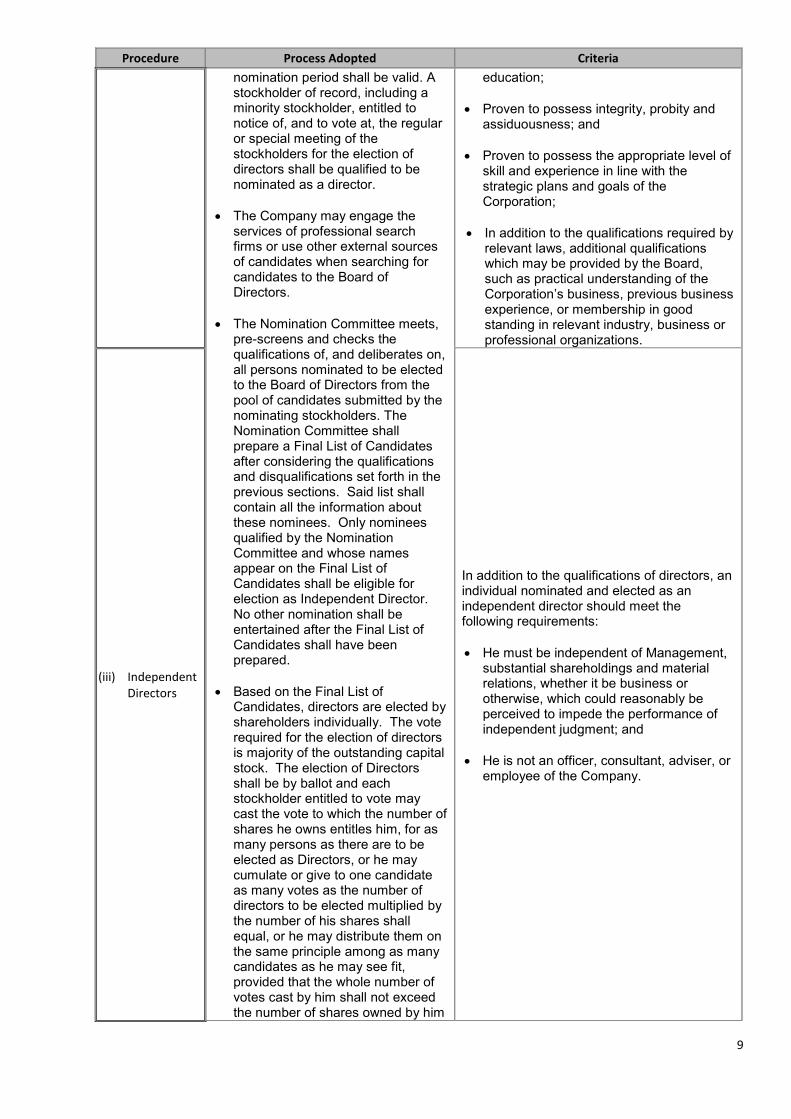
9
Procedure Process Adopted Criteria
nomination period shall be valid. A stockholder of record, including a minority stockholder, entitled to notice of, and to vote at, the regular or special meeting of the stockholders for the election of directors shall be qualified to be nominated as a director.
· The Company may engage the services of professional search firms or use other external sources of candidates when searching for candidates to the Board of Directors.
· The Nomination Committee meets, pre-screens and checks the qualifications of, and deliberates on, all persons nominated to be elected to the Board of Directors from the pool of candidates submitted by the nominating stockholders. The Nomination Committee shall prepare a Final List of Candidates after considering the qualifications and disqualifications set forth in the previous sections. Said list shall contain all the information about these nominees. Only nominees qualified by the Nomination Committee and whose names appear on the Final List of Candidates shall be eligible for election as Independent Director. No other nomination shall be entertained after the Final List of Candidates shall have been prepared.
· Based on the Final List of Candidates, directors are elected by shareholders individually. The vote required for the election of directors is majority of the outstanding capital stock. The election of Directors shall be by ballot and each stockholder entitled to vote may cast the vote to which the number of shares he owns entitles him, for as many persons as there are to be elected as Directors, or he may cumulate or give to one candidate as many votes as the number of directors to be elected multiplied by the number of his shares shall equal, or he may distribute them on the same principle among as many candidates as he may see fit, provided that the whole number of votes cast by him shall not exceed the number of shares owned by him
education;
· Proven to possess integrity, probity and assiduousness; and
· Proven to possess the appropriate level of skill and experience in line with the strategic plans and goals of the Corporation;
· In addition to the qualifications required by relevant laws, additional qualifications which may be provided by the Board, such as practical understanding of the Corporation’s business, previous business experience, or membership in good standing in relevant industry, business or professional organizations.
(iii) Independent
Directors
In addition to the qualifications of directors, an individual nominated and elected as an independent director should meet the following requirements:
· He must be independent of Management, substantial shareholdings and material relations, whether it be business or otherwise, which could reasonably be perceived to impede the performance of independent judgment; and
· He is not an officer, consultant, adviser, or employee of the Company.

10
Procedure Process Adopted Criteria
multiplied by the whole number of Directors to be elected.
· To preserve the integrity of the election process, the Corporation shall employ the services of an external party to validate the voting results.
b. Re-appointment
(i) Executive
Directors
The Company applies the same process and criteria used in the selection/appointment of Executive Directors, Non-Executive Directors and Independent Directors, respectively, for their re-appointment.
(ii) Non-
Executive
Directors
(iii) Independent
Directors
c. Permanent Disqualification
(i) Executive
Directors
The Nomination Committee assesses and evaluates all members of the Board of Directors based on the disqualification criteria set out in the Company’s Revised Manual on Corporate Governance and other relevant laws.
The grounds for permanent disqualification are as follows: a) Any person finally convicted judicially of
an offense involving moral turpitude or fraudulent act or transgressions;
b) Any person finally found by the Securities Exchange Commission (the “Commission) or a court or other administrative body to have willfully violated, or willfully aided, abetted, counseled, induced or procured the violation of, any provision of the Securities Regulation Code, the Corporation Code, or any other law administered by the Commission or Bangko Sentral ng Pilipinas, or any rule, regulation or order of the Commission or Bangko Sentral ng Pilipinas;
c) Any person judicially declared to be insolvent;
d) Any person finally found guilty by a foreign court or equivalent financial regulatory authority of acts, violations or misconduct similar to any of the acts, violates or misconduct listed in the foregoing paragraphs; and
e) Conviction by final judgment of an offense punishable by imprisonment for a period exceeding six (6) years, or a violation of the Corporation Code, committed within five (5) years prior to the date of his election or appointment.
f) No person shall qualify or be eligible for nomination or election to the Board if he is engaged in any business which competes with or is antagonistic to that of the Corporation. Without limiting the generality of the foregoing, a person shall be deemed to be so engaged:
(ii) Non-
Executive
Directors
(iii) Independent
Directors

11
Procedure Process Adopted Criteria
i. If he is the owner (either of record or as
beneficial owner) of 5% or more of any outstanding class of share of, any corporation (other than one in which the Corporation owns at least 20% of the capital stock) which is engaged in a business directly competitive to that of the Corporation or any of its subsidiaries or affiliates;
ii. If he is an officer, manager, or
controlling person of, or the owner or any member of his immediate family is the owner (either of record or as beneficial owner) of 5% or more of any outstanding class of shares of any corporation (other than one in which the Corporation owns at least 20% of the capital stock) which is an adverse party in any suit, action or proceeding (of whatever nature, whether civil, criminal, administrative, or judicial) by or against the Corporation, which has been actually filed or threatened, imminent or probably, to be filed;
iii. If he is determined by the Board, in the
exercise of its judgment in good faith, to be the nominee, officer, trustee, adviser, or legal counsel, of any individual set forth in (i) or (ii) hereof.
d. Temporary Disqualification
(i) Executive
Directors
The Nomination Committee assesses and evaluates all members of the Board of Directors based on the disqualification criteria set out in the Revised Manual on Corporate Governance. A temporary disqualified director shall, within sixty (60) business days from such disqualification, take the appropriate action to remedy or correct the disqualification. If he fails or refuses to do so for unjustified reasons, the disqualification shall become permanent.
The grounds for temporary disqualification are as follows: a) Refusal to fully disclose the extent of his
business interest as required under the Securities Regulation Code and its implementing rules and regulations. This disqualification shall be in effect as long as his refusal persists;
b) Absence or non-participation for whatever reason/s for more than 50% of all meetings, both regular and special, of the Board during his incumbency, or any twelve (12) month period during his incumbency, unless the absence is due to illness, death in the immediate family, or serious accident. This disqualification applies for purposes of the succeeding election;
c) Dismissal/termination from directorship in another listed corporation for cause. This disqualification shall be in effect until he has cleared himself of any involvement in the alleged irregularity; and
d) Conviction that has not yet become final
(ii) Non-
Executive
Directors
(iii) Independent
Directors

12
Procedure Process Adopted Criteria
referred to in the grounds for disqualification of directors.
e. Removal
(i) Executive
Directors
The Company applies the same process and criteria used in the permanent disqualification of Executive Directors, Non-Executive Directors and Independent Directors, respectively, for their removal.
(ii) Non-
Executive
Directors
(iii) Independent
Directors
f. Re-instatement
(i) Executive
Directors
The Company applies the same process and criteria used in the selection/appointment of Executive Directors, Non-Executive Directors and Independent Directors, respectively, for their re-instatement.
(ii) Non-
Executive
Directors
(iii) Independent
Directors
g. Suspension
(i) Executive
Directors
The Company applies the same process and criteria used in the temporary disqualification of Executive Directors, Non-Executive Directors and Independent Directors, respectively, for their suspension.
(ii) Non-
Executive
Directors
(iii) Independent
Directors
Voting Result of the last Annual General Meeting
Nominee Number of
shares abstained Number of shares not voting in favor
Number of shares voting in favor
Henry Sy, Sr. 160,780,607 862,400 23,448,997,970
Henry T. Sy, Jr. 771,796,489 6,600 22,838,837,888
Hans T. Sy 129,983,064 6,600 23,480,651,313
Herbert T. Sy 782,853,839 6,600 22,827,780,538
Jorge T. Mendiola 775,137,789 6,600 22,835,496,588
Jose L. Cuisia, Jr. 111,762,418 21,838,277 23,477,040,282
Gregorio U. Kilayko 9,575,150 6,600 23,601,059,227
Joselito H. Sibayan 9,575,150 6,600 23,601,059,227
Total 2,751,464,506 22,740,277 186,110,923,033
6) Orientation and Education Program
(a) Disclose details of the company’s orientation program for new directors, if any.
Under the Company’s Revised Corporate Governance Manual, “each elected director shall, before assumption of office and annually thereafter, be required to attend a seminar on corporate governance conducted by a duly recognized private or government institute.” The Manual also mandates the conduct of an orientation program for new directors, which focuses on the contributions that a director is expected to make, the roles and responsibilities of the Board and its committees, an overview of the Company’s business, including its history, growth, direction, business units, core values of its founder, Mr. Henry Sy, Sr., and its Corporate Governance Framework, as well as other matters that will assist them in discharging their duties.
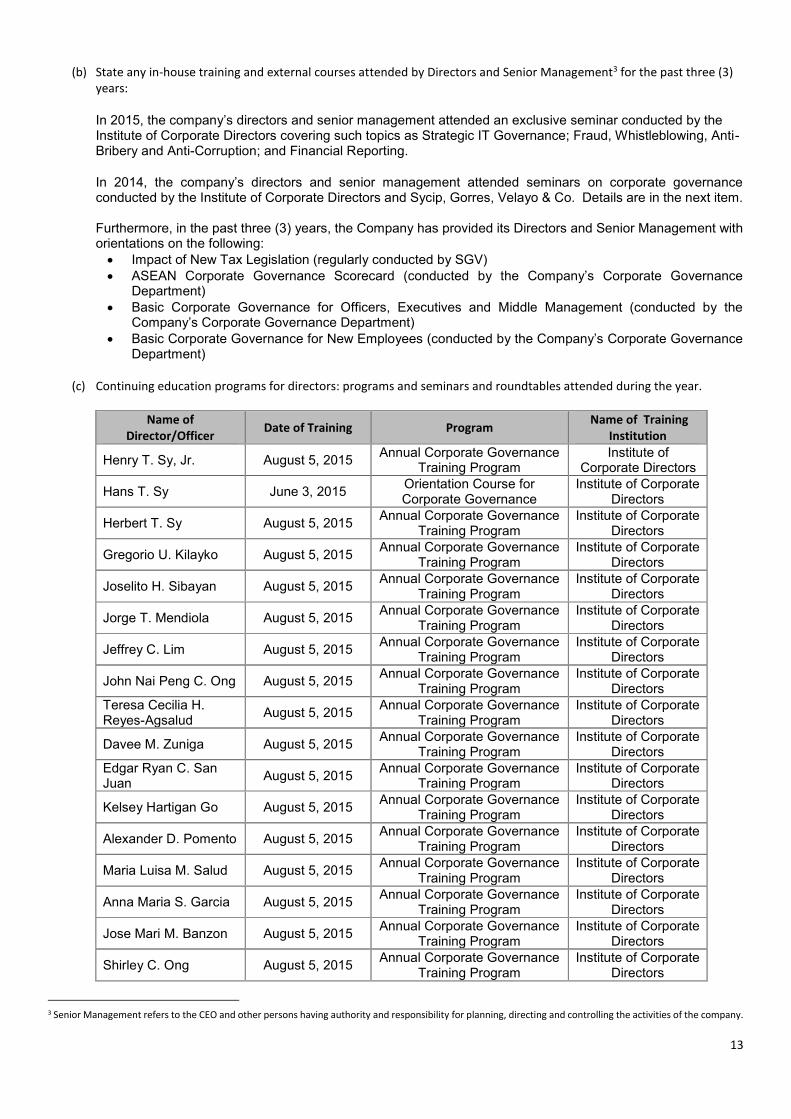
13
(b) State any in-house training and external courses attended by Directors and Senior Management3 for the past three (3)
years:
In 2015, the company’s directors and senior management attended an exclusive seminar conducted by the Institute of Corporate Directors covering such topics as Strategic IT Governance; Fraud, Whistleblowing, Anti-Bribery and Anti-Corruption; and Financial Reporting.
In 2014, the company’s directors and senior management attended seminars on corporate governance conducted by the Institute of Corporate Directors and Sycip, Gorres, Velayo & Co. Details are in the next item. Furthermore, in the past three (3) years, the Company has provided its Directors and Senior Management with orientations on the following:
· Impact of New Tax Legislation (regularly conducted by SGV)
· ASEAN Corporate Governance Scorecard (conducted by the Company’s Corporate Governance Department)
· Basic Corporate Governance for Officers, Executives and Middle Management (conducted by the Company’s Corporate Governance Department)
· Basic Corporate Governance for New Employees (conducted by the Company’s Corporate Governance Department)
(c) Continuing education programs for directors: programs and seminars and roundtables attended during the year.
Name of
Director/Officer Date of Training Program
Name of Training
Institution
Henry T. Sy, Jr. August 5, 2015 Annual Corporate Governance
Training Program Institute of
Corporate Directors
Hans T. Sy June 3, 2015 Orientation Course for Corporate Governance
Institute of Corporate Directors
Herbert T. Sy August 5, 2015 Annual Corporate Governance
Training Program Institute of Corporate
Directors
Gregorio U. Kilayko August 5, 2015 Annual Corporate Governance
Training Program Institute of Corporate
Directors
Joselito H. Sibayan August 5, 2015 Annual Corporate Governance
Training Program Institute of Corporate
Directors
Jorge T. Mendiola August 5, 2015 Annual Corporate Governance
Training Program Institute of Corporate
Directors
Jeffrey C. Lim August 5, 2015 Annual Corporate Governance
Training Program Institute of Corporate
Directors
John Nai Peng C. Ong August 5, 2015 Annual Corporate Governance
Training Program Institute of Corporate
Directors
Teresa Cecilia H. Reyes-Agsalud
August 5, 2015 Annual Corporate Governance
Training Program Institute of Corporate
Directors
Davee M. Zuniga August 5, 2015 Annual Corporate Governance
Training Program Institute of Corporate
Directors
Edgar Ryan C. San Juan
August 5, 2015 Annual Corporate Governance
Training Program Institute of Corporate
Directors
Kelsey Hartigan Go August 5, 2015 Annual Corporate Governance
Training Program Institute of Corporate
Directors
Alexander D. Pomento August 5, 2015 Annual Corporate Governance
Training Program Institute of Corporate
Directors
Maria Luisa M. Salud August 5, 2015 Annual Corporate Governance
Training Program Institute of Corporate
Directors
Anna Maria S. Garcia August 5, 2015 Annual Corporate Governance
Training Program Institute of Corporate
Directors
Jose Mari M. Banzon August 5, 2015 Annual Corporate Governance
Training Program Institute of Corporate
Directors
Shirley C. Ong August 5, 2015 Annual Corporate Governance
Training Program Institute of Corporate
Directors
3 Senior Management refers to the CEO and other persons having authority and responsibility for planning, directing and controlling the activities of the company.

14
Name of
Director/Officer Date of Training Program
Name of Training
Institution
Dave L. Rafael August 5, 2015 Annual Corporate Governance
Training Program Institute of Corporate
Directors
Ma. Luisa E. Angeles August 5, 2015 Annual Corporate Governance
Training Program Institute of Corporate
Directors
Christopher S. Bautista
August 5, 2015 Annual Corporate Governance
Training Program Institute of Corporate
Directors
B. CODE OF BUSINESS CONDUCT & ETHICS
1) Discuss briefly the company’s policies on the following business conduct or ethics affecting directors, senior management and
employees:
Business Conduct &
Ethics Directors Senior Management Employees
1) Conflict of Interest
All directors and employees are prohibited from engaging in transactions that result in conflicts of interest and are mandated to promptly disclose actual or perceived conflicts of interest, such as acceptance of gifts and loans from the Company or its suppliers. Conflicted directors are required to inhibit themselves from participating in board meetings and are specifically identified in the Company’s Definitive Information Statement submitted to the SEC.
2) Conduct of Business
and Fair Dealings
As mandated by the Code of Ethics, whether in selection of the countries and markets where the Company operates, hiring and promotion of employees, selection of suppliers and contractors, the company decides on the basis of merit and value to shareholders and does not discriminate on the basis of race, ethnicity, religion, or gender. All board members, officers, and employees are prohibited from practicing any form of discrimination or harassment in the workplace. This obligation to refrain from such behavior extends to contractors, vendors, suppliers, or visitors, to the extent that their conduct affects the work environment.
3) Receipt of gifts from
third parties
SMPH prohibits the solicitation or acceptance of gifts in any form from any business partner. However, a director, officer or employee may accept corporate giveaways, tokens or promotional items, provided that the gift is voluntarily given and is of nominal value.
4) Compliance with
Laws & Regulations
The Code of Ethics mandates that SMPH business dealings shall be compliant with all applicable laws in the countries, districts, and communities in which its companies operate.
5) Respect for Trade
Secrets/Use of Non-
public Information
Employees and officers are expected to safeguard Company information relating to SMPH. Financial reports, strategies, and plans shall not be disclosed unless authorized by the Company or required by law. Information regarding individuals working for the Company shall also be treated as private information and shall not be divulged to other parties except when required by legal processes or with the consent of the employee.
6) Use of Company
Funds, Assets and
Information
7) Employment &
Labor Laws &
Policies
Under the Company’s Code of Ethics, all employees are selected, engaged and compensated based on qualification, merit and performance and are treated fairly and accorded respect and dignity. The Company adheres to all labor laws and policies and fosters its employee welfare program.
8) Disciplinary action
Directors, officers and employees of the Company commit to comply with both the letter and spirit of the Code of Ethics to preserve the goodwill and reputation of the Company. The Human Resources Departments is responsible for monitoring compliance with the Code of Ethics. Appropriate disciplinary actions against violators are instituted by Management.
9) Whistle Blower
The Company’s whistleblowing policy, referred to as the Policy on Accountability, Integrity and Vigilance (PAIV), was adopted to create an environment where concerns and issues, made in good faith, may be raised freely within the organization. Under the policy, any of the Company’s directors, officers or employees may accomplish an Incident Report on

15
Business Conduct &
Ethics Directors Senior Management Employees
10) Conflict Resolution
suspected or actual violations of the Code of Ethics, the Company’s Code of Conduct or any other applicable law or regulation. Upon receipt of an incident report, Management conducts an investigation on its merit, subject to due process and applicable penalties and sanctions thereafter. A compilation of concluded reports is periodically presented to the Audit and Risk Management Committee.
2) Has the code of ethics or conduct been disseminated to all directors, senior management and employees?
On a continuing basis, the Code of Ethics is cascaded through the Human Resources Department’s New Hires Orientation Program. The program gives employees an overview of the Company’s Corporate Governance Framework, policies, and various components. It also covers the importance of ethics in the business, informs employees of their rights and obligations, as well as the principles and best practices in the promotion of good work ethics. In addition, copies of the Code of Ethics and Code of Conduct are also made available to all employees via an internal portal for easy access and reference.
3) Discuss how the company implements and monitors compliance with the code of ethics or conduct.
The Company has established the Policy on Accountability, Integrity and Vigilance, which provides for the process and safeguards of elevating concerns to Management on suspected and actual violations of the Code of Ethics, other Company policies, or prevalent laws and regulations. Under the policy, any director, officer or employee of SM Prime may accomplish an Incident Report on suspected or actual violations of the Code of Ethics or any other applicable law or regulation. Upon receipt of the Incident Report, Management is tasked to conduct an investigation on its merit, subject to due process, and institute applicable penalties and sanctions thereafter. A compilation of concluded investigations is reported to the Audit and Risk Management Committee.
4) Related Party Transactions
(a) Policies and Procedures
Describe the company’s policies and procedures for the review, approval or ratification, monitoring and recording of
related party transactions between and among the company and its parent, joint ventures, subsidiaries, associates,
affiliates, substantial stockholders, officers and directors, including their spouses, children and dependent siblings and
parents and of interlocking director relationships of members of the Board.
Related Party Transactions Policies and Procedures
(1) Parent Company Full disclosure of the details, nature, extent, and all other material information on transactions with related parties shall be observed in the Company’s financial statements, and in its quarterly and annual reports to the SEC and the Philippine Stock Exchange (PSE).
SMPH Management shall present the details of all transactions entered into by the Company with related parties to the Audit and Risk Management Committee for review. In addition, material transactions shall be reviewed and approved by all the independent directors. This is to ensure that the Company conducts all related-party transactions on an arms' length basis.
(2) Joint Ventures
(3) Subsidiaries
(4) Entities Under Common Control
(5) Substantial Stockholders
(6) Officers including
spouse/children/siblings/parents
(7) Directors including
spouse/children/siblings/parents
(8) Interlocking director relationship
of Board of Directors
(b) Conflict of Interest
a. Directors/Officers and 5% or more Shareholders
Identify any actual or probable conflict of interest to which directors/officers/5% or more shareholders may be
involved.
There are no actual or perceived conflicts of interest which involve directors, officers, or shareholders holding 5% or more of outstanding common shares.
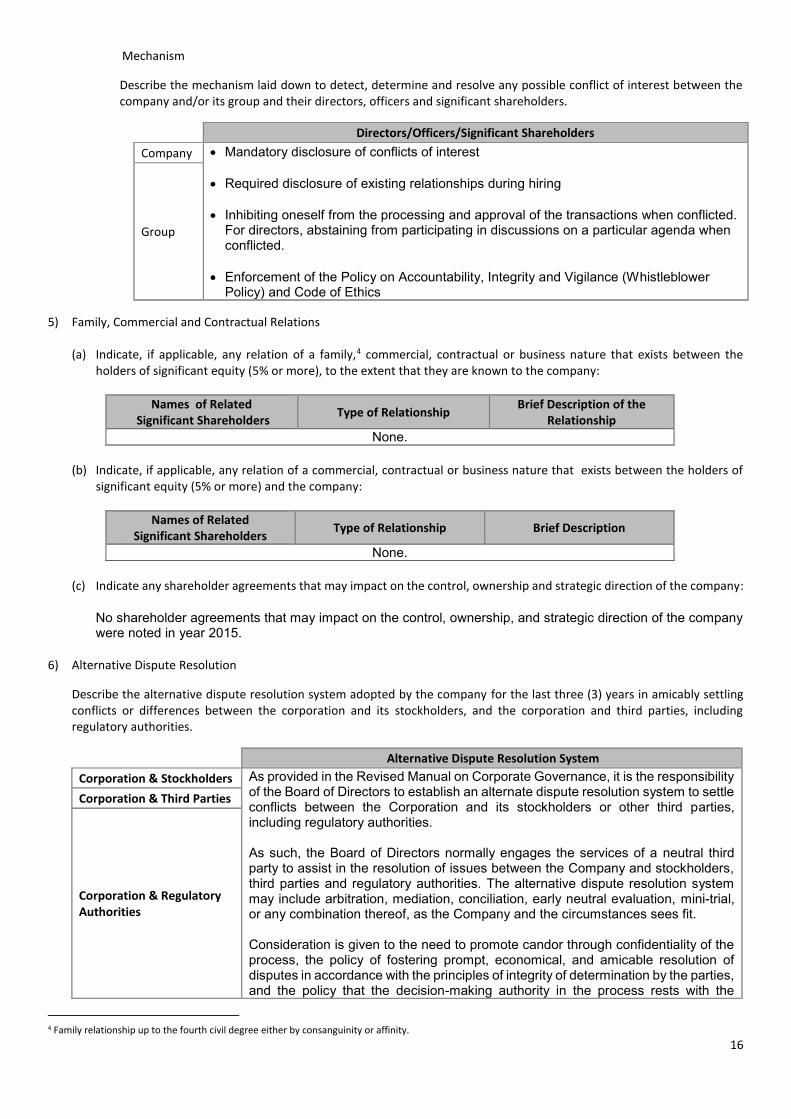
16
Mechanism
Describe the mechanism laid down to detect, determine and resolve any possible conflict of interest between the
company and/or its group and their directors, officers and significant shareholders.
Directors/Officers/Significant Shareholders
Company · Mandatory disclosure of conflicts of interest
· Required disclosure of existing relationships during hiring
· Inhibiting oneself from the processing and approval of the transactions when conflicted. For directors, abstaining from participating in discussions on a particular agenda when conflicted.
· Enforcement of the Policy on Accountability, Integrity and Vigilance (Whistleblower Policy) and Code of Ethics
Group
5) Family, Commercial and Contractual Relations
(a) Indicate, if applicable, any relation of a family,4 commercial, contractual or business nature that exists between the
holders of significant equity (5% or more), to the extent that they are known to the company:
Names of Related
Significant Shareholders Type of Relationship
Brief Description of the
Relationship
None.
(b) Indicate, if applicable, any relation of a commercial, contractual or business nature that exists between the holders of
significant equity (5% or more) and the company:
Names of Related
Significant Shareholders Type of Relationship Brief Description
None.
(c) Indicate any shareholder agreements that may impact on the control, ownership and strategic direction of the company:
No shareholder agreements that may impact on the control, ownership, and strategic direction of the company were noted in year 2015.
6) Alternative Dispute Resolution
Describe the alternative dispute resolution system adopted by the company for the last three (3) years in amicably settling
conflicts or differences between the corporation and its stockholders, and the corporation and third parties, including
regulatory authorities.
Alternative Dispute Resolution System
Corporation & Stockholders As provided in the Revised Manual on Corporate Governance, it is the responsibility of the Board of Directors to establish an alternate dispute resolution system to settle conflicts between the Corporation and its stockholders or other third parties, including regulatory authorities. As such, the Board of Directors normally engages the services of a neutral third party to assist in the resolution of issues between the Company and stockholders, third parties and regulatory authorities. The alternative dispute resolution system may include arbitration, mediation, conciliation, early neutral evaluation, mini-trial, or any combination thereof, as the Company and the circumstances sees fit. Consideration is given to the need to promote candor through confidentiality of the process, the policy of fostering prompt, economical, and amicable resolution of disputes in accordance with the principles of integrity of determination by the parties, and the policy that the decision-making authority in the process rests with the
Corporation & Third Parties
Corporation & Regulatory
Authorities
4 Family relationship up to the fourth civil degree either by consanguinity or affinity.

17
Alternative Dispute Resolution System
parties. There were no conflicts between the corporation and its stockholders, the corporation and third parties, and the corporation and regulatory authorities, for the last three years.
C. BOARD MEETINGS & ATTENDANCE
1) Are Board of Directors’ meetings scheduled before or at the beginning of the year?
Yes, regular meetings of the Board of Directors are held at least once every quarter of the year on such dates and at such times and places as the Chairman of the Board, or in his absence, the President, shall designate or upon the request of a majority of the directors.
2) Attendance of Directors
Board Name Date of Election No. of Meetings
Held during the year
No. of Meetings
Attended %
Chairman Emeritus Henry Sy Sr. 14 April 2015 6 6 100
Chairman Henry T. Sy, Jr. 14 April 2015 6 6 100
Independent Jose L. Cuisia Jr. 14 April 2015 6 6 100
Independent Gregorio U. Kilayko 14 April 2015 6 6 100
Independent Joselito H. Sibayan 14 April 2015 6 6 100
Member Hans T. Sy 14 April 2015 6 6 100
Member Herbert T. Sy 14 April 2015 6 6 100
Member Jorge T. Mendiola 14 April 2015 6 6 100
3) Do non-executive directors have a separate meeting during the year without the presence of any executive? If yes, how many
times?
Yes. Non-executive directors meet at least once annually, without the presence of executive directors.
4) Is the minimum quorum requirement for Board decisions set at two-thirds of board members? Please explain.
The Company’s By-Laws state that at least a majority of number of directors specified in the Articles of Incorporation shall constitute a quorum for the transaction of business at any meeting, and the act of the directors at any meeting where there is a quorum shall be valid as a corporate act, except for the election of officers.
5) Access to Information
(a) How many days in advance are board papers5 for board of directors meetings provided to the board?
Board papers and other relevant information are provided to the Board at least seven (7) calendar days before regular/special board meetings.
(b) Do board members have independent access to Management and the Corporate Secretary?
Yes. Under the Company’s Manual on Corporate Governance, to enable the Board to properly fulfill their duties and responsibilities, management should provide directors with complete and timely information about the matter in the agenda of the meetings. Directors should be given independent access to Management and the Corporate Secretary, as well as to independent professional advice.
(c) State the policy of the role of the company secretary. Does such role include assisting the Chairman in preparing the
board agenda, facilitating training of directors, keeping directors updated regarding any relevant statutory and regulatory
changes, etc.?
5 Board papers consist of complete and adequate information about the matters to be taken in the board meeting. Information includes the background or explanation on matters brought before the Board, disclosures, budgets, forecasts and internal financial documents.
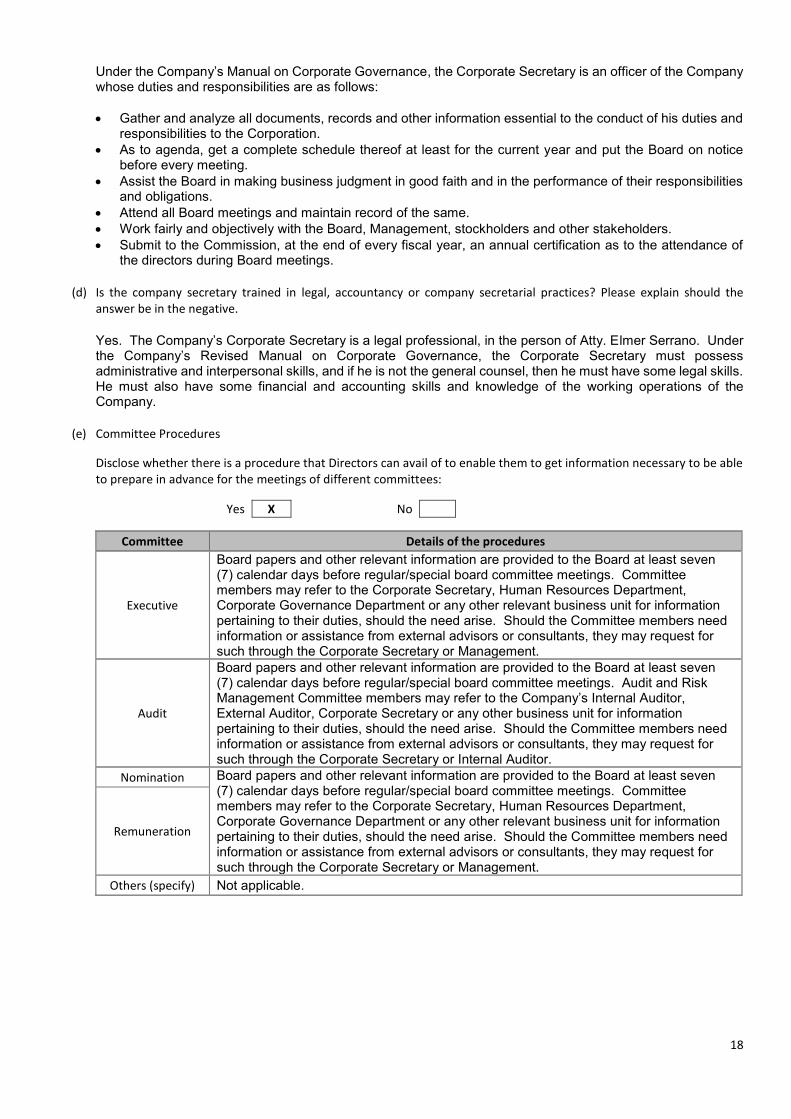
18
Under the Company’s Manual on Corporate Governance, the Corporate Secretary is an officer of the Company whose duties and responsibilities are as follows:
· Gather and analyze all documents, records and other information essential to the conduct of his duties and responsibilities to the Corporation.
· As to agenda, get a complete schedule thereof at least for the current year and put the Board on notice before every meeting.
· Assist the Board in making business judgment in good faith and in the performance of their responsibilities and obligations.
· Attend all Board meetings and maintain record of the same.
· Work fairly and objectively with the Board, Management, stockholders and other stakeholders.
· Submit to the Commission, at the end of every fiscal year, an annual certification as to the attendance of the directors during Board meetings.
(d) Is the company secretary trained in legal, accountancy or company secretarial practices? Please explain should the
answer be in the negative.
Yes. The Company’s Corporate Secretary is a legal professional, in the person of Atty. Elmer Serrano. Under the Company’s Revised Manual on Corporate Governance, the Corporate Secretary must possess administrative and interpersonal skills, and if he is not the general counsel, then he must have some legal skills. He must also have some financial and accounting skills and knowledge of the working operations of the Company.
(e) Committee Procedures
Disclose whether there is a procedure that Directors can avail of to enable them to get information necessary to be able
to prepare in advance for the meetings of different committees:
Yes X No
Committee Details of the procedures
Executive
Board papers and other relevant information are provided to the Board at least seven (7) calendar days before regular/special board committee meetings. Committee members may refer to the Corporate Secretary, Human Resources Department, Corporate Governance Department or any other relevant business unit for information pertaining to their duties, should the need arise. Should the Committee members need information or assistance from external advisors or consultants, they may request for such through the Corporate Secretary or Management.
Audit
Board papers and other relevant information are provided to the Board at least seven (7) calendar days before regular/special board committee meetings. Audit and Risk Management Committee members may refer to the Company’s Internal Auditor, External Auditor, Corporate Secretary or any other business unit for information pertaining to their duties, should the need arise. Should the Committee members need information or assistance from external advisors or consultants, they may request for such through the Corporate Secretary or Internal Auditor.
Nomination Board papers and other relevant information are provided to the Board at least seven (7) calendar days before regular/special board committee meetings. Committee members may refer to the Corporate Secretary, Human Resources Department, Corporate Governance Department or any other relevant business unit for information pertaining to their duties, should the need arise. Should the Committee members need information or assistance from external advisors or consultants, they may request for such through the Corporate Secretary or Management.
Remuneration
Others (specify) Not applicable.

19
6) External Advice
Indicate whether or not a procedure exists whereby directors can receive external advice and, if so, provide details:
Procedures Details
The Board of Directors and each Board Committee may engage the services of consultants to assist them in the performance of their duties and responsibility. For instance, the Audit and Risk Management Committee Charter provides that the Committee may hire a consultant for a more independent assessment of the Company’s risk management infrastructure and a review of the practices of the different business units. Moreover, during the conduct of the Annual Board Evaluation, directors are asked to identify areas for improvement, such as training/continuing education programs or any other forms of assistance that they may need in the performance of their duties. The evaluation forms also include items on support services given to the Board, such as the quality and timeliness of information provided to them, the frequency and conduct of regular, special or committee meetings and their accessibility to Management, the Corporate Secretary and Board Advisors. The Board then reviews and evaluates the results of the evaluation, discussing possible changes that will enhance the performance of the individual directors, the support services given and the Board as a collective body. Requests for Board advisors are studied.
7) Change/s in existing policies
Indicate, if applicable, any change/s introduced by the Board of Directors (during its most recent term) on existing policies
that may have an effect on the business of the company and the reason/s for the change:
Existing Policies Changes Reason
Manual on Corporate
Governance
· Added requirement to observe diversity in the composition of the Board of Directors
· Added additional qualification for directorship in line the strategic goals of the Company
· Added maximum number of allowable board seats that may be held simultaneously by executive and non-executive directors.
· Added procedures for the nomination of directors
To align with leading corporate governance practices
Code of Ethics
· Added reporting requirements for insider trading for directors and key executives of the Company
· Updated/added policies on related party transactions, customer welfare, employee welfare, corporate social responsibility and environmental sustainability
D. REMUNERATION MATTERS
1) Remuneration Process
Disclose the process used for determining the remuneration of the CEO and the four (4) most highly compensated
management officers:
Process CEO Top 4 Highest Paid Management Officers
(1) Fixed remuneration Performance-based Performance-based
(2) Variable remuneration Not applicable Not applicable
(3) Per diem allowance Php 10,000 per Board meeting or Board Committee meeting attended
Not applicable
(4) Bonus Performance-based Performance-based
(5) Stock Options and other financial instruments
Not applicable Not applicable
(6) Others (specify) Not applicable Not applicable
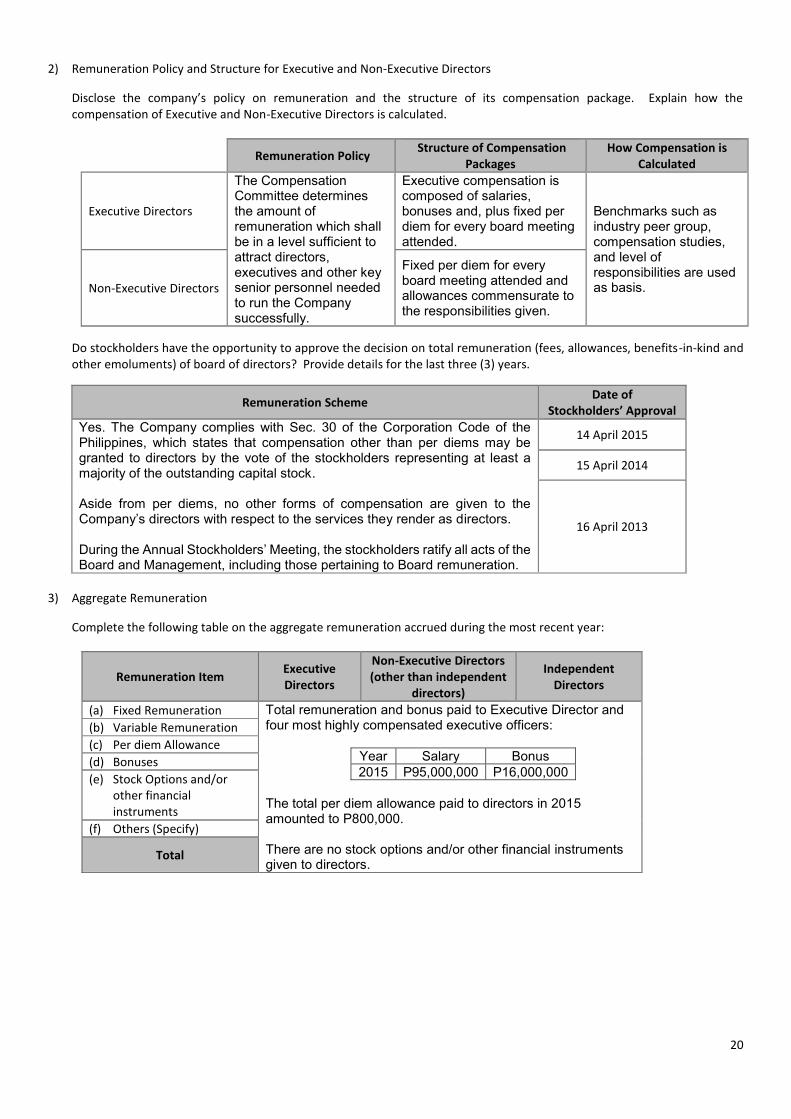
20
2) Remuneration Policy and Structure for Executive and Non-Executive Directors
Disclose the company’s policy on remuneration and the structure of its compensation package. Explain how the
compensation of Executive and Non-Executive Directors is calculated.
Remuneration Policy
Structure of Compensation
Packages
How Compensation is
Calculated
Executive Directors
The Compensation Committee determines the amount of remuneration which shall be in a level sufficient to attract directors, executives and other key senior personnel needed to run the Company successfully.
Executive compensation is composed of salaries, bonuses and, plus fixed per diem for every board meeting attended.
Benchmarks such as industry peer group, compensation studies, and level of responsibilities are used as basis. Non-Executive Directors
Fixed per diem for every board meeting attended and allowances commensurate to the responsibilities given.
Do stockholders have the opportunity to approve the decision on total remuneration (fees, allowances, benefits-in-kind and
other emoluments) of board of directors? Provide details for the last three (3) years.
Remuneration Scheme Date of
Stockholders’ Approval
Yes. The Company complies with Sec. 30 of the Corporation Code of the Philippines, which states that compensation other than per diems may be granted to directors by the vote of the stockholders representing at least a majority of the outstanding capital stock. Aside from per diems, no other forms of compensation are given to the Company’s directors with respect to the services they render as directors. During the Annual Stockholders’ Meeting, the stockholders ratify all acts of the Board and Management, including those pertaining to Board remuneration.
14 April 2015
15 April 2014
16 April 2013
3) Aggregate Remuneration
Complete the following table on the aggregate remuneration accrued during the most recent year:
Remuneration Item Executive
Directors
Non-Executive Directors
(other than independent
directors)
Independent
Directors
(a) Fixed Remuneration Total remuneration and bonus paid to Executive Director and four most highly compensated executive officers:
Year Salary Bonus
2015 P95,000,000 P16,000,000
The total per diem allowance paid to directors in 2015 amounted to P800,000. There are no stock options and/or other financial instruments given to directors.
(b) Variable Remuneration
(c) Per diem Allowance
(d) Bonuses
(e) Stock Options and/or
other financial
instruments
(f) Others (Specify)
Total
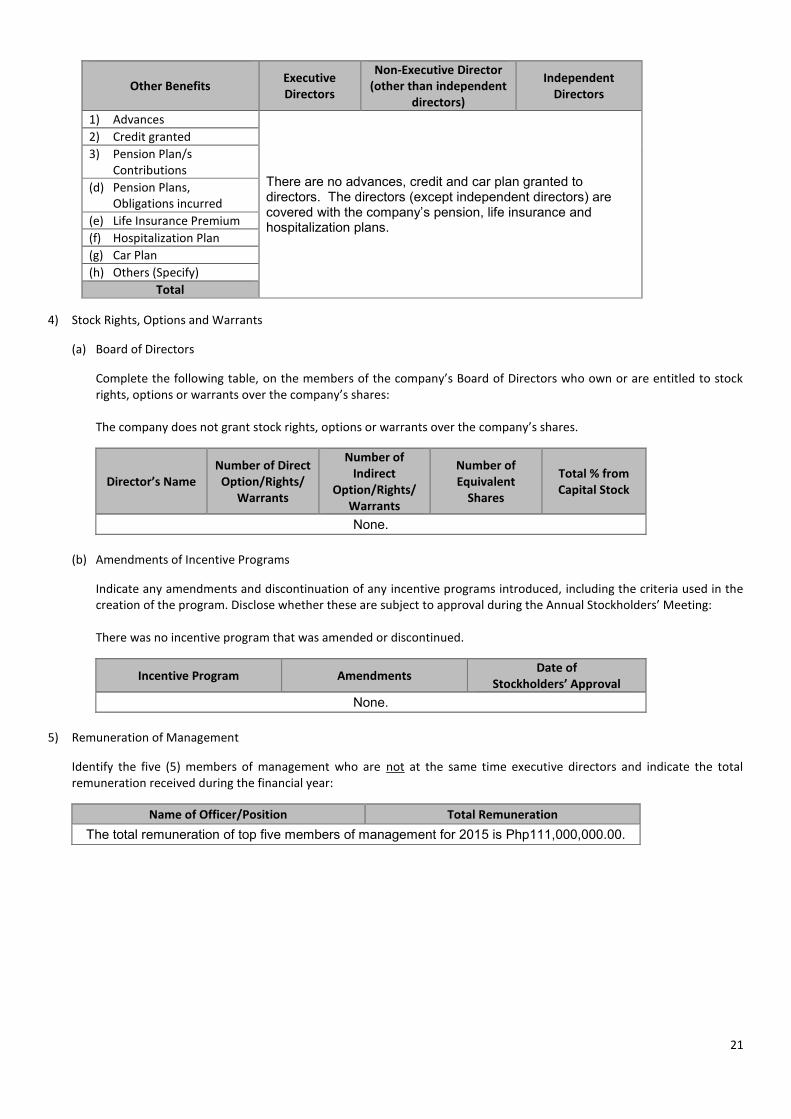
21
Other Benefits
Executive
Directors
Non-Executive Director
(other than independent
directors)
Independent
Directors
1) Advances
There are no advances, credit and car plan granted to directors. The directors (except independent directors) are covered with the company’s pension, life insurance and hospitalization plans.
2) Credit granted
3) Pension Plan/s
Contributions
(d) Pension Plans,
Obligations incurred
(e) Life Insurance Premium
(f) Hospitalization Plan
(g) Car Plan
(h) Others (Specify)
Total
4) Stock Rights, Options and Warrants
(a) Board of Directors
Complete the following table, on the members of the company’s Board of Directors who own or are entitled to stock
rights, options or warrants over the company’s shares:
The company does not grant stock rights, options or warrants over the company’s shares.
Director’s Name
Number of Direct
Option/Rights/
Warrants
Number of
Indirect
Option/Rights/
Warrants
Number of
Equivalent
Shares
Total % from
Capital Stock
None.
(b) Amendments of Incentive Programs
Indicate any amendments and discontinuation of any incentive programs introduced, including the criteria used in the
creation of the program. Disclose whether these are subject to approval during the Annual Stockholders’ Meeting:
There was no incentive program that was amended or discontinued.
Incentive Program Amendments Date of
Stockholders’ Approval
None.
5) Remuneration of Management
Identify the five (5) members of management who are not at the same time executive directors and indicate the total
remuneration received during the financial year:
Name of Officer/Position Total Remuneration
The total remuneration of top five members of management for 2015 is Php111,000,000.00.

22
E. BOARD COMMITTEES
1) Number of Members, Functions and Responsibilities
Provide details on the number of members of each committee, its functions, key responsibilities and the power/authority
delegated to it by the Board:
Committee
No. of Members
Committee
Charter Functions
Key
Responsibilities Power
Executive
Director
(ED)
Non-
executive
Director
(NED)
Independent
Director
(ID)
Executive 36 36 0 Yes
· Assists the Board in overseeing the implementation of strategies;
· Reviews major issues facing the organization;
· Monitors the operating activities of each business group;
· Defines and monitors the Company’s performance improvement goals;
· Defines group-wide policies and actions and overseeing their implementation;
· Fosters the sharing of information in all areas of the business group.
Audit and Risk Management
0 1 3 Yes
· Checks all financial reports against its compliance with both the internal financial management handbook and pertinent accounting standards, including regulatory requirements.
· Performs oversight financial statement functions, specifically in areas of managing credit, market, liquidity, operational, legal and other risks of the Corporation, and crisis management.
· Pre-approves all audit plans, scope and frequency one (1) month before the conduct of external audit.
· Performs direct interface functions with the internal and external auditors.
· Elevates to international standards, the accounting and auditing processes, practices and methodologies.
· Develops a transparent financial management system that will ensure the integrity of internal control activities throughout the Corporation through a step-by-step procedures and policies handbook that will be used by the entire organization.
Nomination 0 0 3 Yes
· Pre-screens and shortlists all candidates nominated to become a member of the Board as well as those nominated to positions that require Board approval under the Corporation’s By-Laws.
· In consultation with the appropriate executive or management committee/s, redefines the role, duties and responsibilities of the CEO by integrating the dynamic requirements of the business as a going concern and future expansionary prospects within the realm of good corporate governance at all times.
· Determines the number of directorships which a member of the Board may hold, in accordance
6 Includes non-directors.
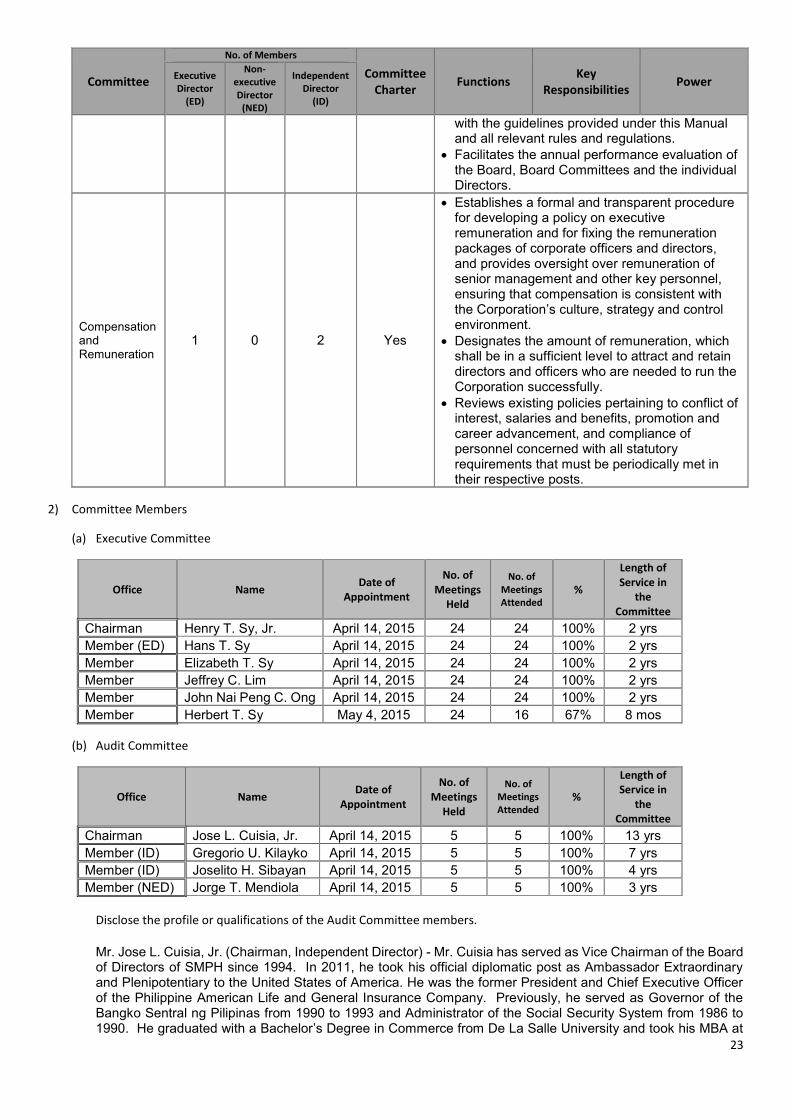
23
Committee
No. of Members
Committee
Charter Functions
Key
Responsibilities Power
Executive
Director
(ED)
Non-
executive
Director
(NED)
Independent
Director
(ID)
with the guidelines provided under this Manual and all relevant rules and regulations.
· Facilitates the annual performance evaluation of the Board, Board Committees and the individual Directors.
Compensation and Remuneration
1 0 2 Yes
· Establishes a formal and transparent procedure for developing a policy on executive remuneration and for fixing the remuneration packages of corporate officers and directors, and provides oversight over remuneration of senior management and other key personnel, ensuring that compensation is consistent with the Corporation’s culture, strategy and control environment.
· Designates the amount of remuneration, which shall be in a sufficient level to attract and retain directors and officers who are needed to run the Corporation successfully.
· Reviews existing policies pertaining to conflict of interest, salaries and benefits, promotion and career advancement, and compliance of personnel concerned with all statutory requirements that must be periodically met in their respective posts.
2) Committee Members
(a) Executive Committee
Office Name Date of
Appointment
No. of
Meetings
Held
No. of
Meetings
Attended
%
Length of
Service in
the
Committee
Chairman Henry T. Sy, Jr. April 14, 2015 24 24 100% 2 yrs
Member (ED) Hans T. Sy April 14, 2015 24 24 100% 2 yrs
Member Elizabeth T. Sy April 14, 2015 24 24 100% 2 yrs
Member Jeffrey C. Lim April 14, 2015 24 24 100% 2 yrs
Member John Nai Peng C. Ong April 14, 2015 24 24 100% 2 yrs
Member Herbert T. Sy May 4, 2015 24 16 67% 8 mos
(b) Audit Committee
Office Name Date of
Appointment
No. of
Meetings
Held
No. of
Meetings
Attended
%
Length of
Service in
the
Committee
Chairman Jose L. Cuisia, Jr. April 14, 2015 5 5 100% 13 yrs
Member (ID) Gregorio U. Kilayko April 14, 2015 5 5 100% 7 yrs
Member (ID) Joselito H. Sibayan April 14, 2015 5 5 100% 4 yrs
Member (NED) Jorge T. Mendiola April 14, 2015 5 5 100% 3 yrs
Disclose the profile or qualifications of the Audit Committee members.
Mr. Jose L. Cuisia, Jr. (Chairman, Independent Director) - Mr. Cuisia has served as Vice Chairman of the Board of Directors of SMPH since 1994. In 2011, he took his official diplomatic post as Ambassador Extraordinary and Plenipotentiary to the United States of America. He was the former President and Chief Executive Officer of the Philippine American Life and General Insurance Company. Previously, he served as Governor of the Bangko Sentral ng Pilipinas from 1990 to 1993 and Administrator of the Social Security System from 1986 to 1990. He graduated with a Bachelor’s Degree in Commerce from De La Salle University and took his MBA at

24
the prestigious Wharton School of the University of Pennsylvania. He was awarded the “Joseph Wharton Award for Lifetime Achievement” by the prestigious Wharton Club of Washington, DC in May 2011, and was conferred the Lifetime Contributor Award (public sector) by the Asia CEO Forum in 2015 and the Order of the Sikatuna with the rank of Grand Cross by President Benigno Aquino III in 2016. Mr. Gregorio U. Kilayko (Member, Independent Director) - Mr. Kilayko is the former Chairman of ABN Amro’s banking operations in the Philippines. He was the founding head of ING Baring’s stockbrokerage and investment banking business in the Philippines and a Philippine Stock Exchange Governor in 1996 and 2000. He was a director of the demutualized Philippine Stock Exchange in 2003. He took his MBA at the Wharton School of the University of Pennsylvania. He was elected as an Independent Director in 2008. Mr. Joselito H. Sibayan (Member, Independent Director) - Mr. Sibayan has spent the past 28 years of his career in investment banking. From 1987 to 1994, and after taking his Master of Business Administration (MBA) from University of California in Los Angeles, he was Head of International Fixed Income Sales at Deutsche Bank in New York and later moved to Natwest Markets to set up its International Fixed Income and Derivatives Sales/Trading operation. He then moved to London in 1995 to run Natwest Market’s International Fixed Income Sales Team. He is currently the President and CEO of Mabuhay Capital Corporation (MC2), an independent financial advisory firm. Prior to forming MC2 in 2005, he was Vice Chairman, Investment Banking - Philippines and Country Manager for Credit Suisse First Boston (CSFB). He helped establish CSFB's Manila representative office in 1998, and later oversaw the transition of the office to branch status. He was elected as an Independent Director in 2011. Mr. Jorge T. Mendiola (Member, Non-Executive Director) – Mr. Mendiola was elected as a Director in December 2012. He is currently the President of SM Retail, Inc. He started his career with The SM Store as a Special Assistant to the Senior Branch Manager in 1989 and rose to become the President in 2011. He is also the Vice Chairman for Advocacy of the Philippine Retailers Association. He received his Master in Business Management from the Asian Institute of Management and has an A.B. Economics degree from Ateneo de Manila University.
Describe the Audit Committee’s responsibility relative to the external auditor.
The Audit and Risk Management Committee recommends to the Board of Directors the appointment, re-appointment or removal of the external auditor and the fixing of the audit fees. The Board and the stockholders approve the Audit and Risk Management Committee’s recommendation. Under the Charter of the Audit and Risk Management Committee, part of the Committee's authority is to pre-approve all auditing and non-audit services, as well as to resolve any disagreements between management and the external auditors regarding financial reporting. The Committee reviews the external auditor's proposed audit scope and approach, including coordination of audit effort with internal audit. The Revised Manual on Corporate Governance provides that the Committee shall pre-approve all audit plans, scope and frequency one month before the conduct of external audit. The Committee also evaluates the performance of external auditors. The Committee also reviews the independence of the external auditors and meets with the latter separately to discuss any matters that either party believes should be discussed privately.
(c) Nomination Committee
Office Name Date of
Appointment
No. of
Meetings
Held
No. of
Meetings
Attended
%
Length of
Service in
the
Committee
Chairman (ID) Joselito H. Sibayan April 14, 2015 2 2 100 2 yrs.
Member (ID) Jose L. Cuisia, Jr. April 14, 2015 2 2 100 13 yrs
Member (ID) Gregorio U. Kilayko April 14, 2015 2 2 100 13 yrs

25
(d) Compensation Committee
Office Name Date of
Appointment
No. of
Meetings
Held
No. of
Meetings
Attended
%
Length of
Service in
the
Committee
Chairman (ID) Gregorio U. Kilayko April 14, 2015 2 2 100 7 yrs
Member (ED) Hans T. Sy April 14, 2015 2 2 100 13 yrs
Member (ID) Joselito H. Sibayan April 14, 2015 2 2 100 4 yrs
(e) Others (Specify)
Provide the same information on all other committees constituted by the Board of Directors:
None. Not applicable.
3) Changes in Committee Members
Indicate any changes in committee membership that occurred during the year and the reason for the changes:
Name of Committee Name Reason
Executive Herbert T. Sy Transfer from Nomination Committee
Audit and Risk Management Jose T. Sio Committee restructuring
Audit and Risk Management Serafin U. Salvador Committee restructuring
Audit and Risk Management Corazon I. Morando Committee restructuring
4) Work Done and Issues Addressed
Describe the work done by each committee and the significant issues addressed during the year.
Name of
Committee Work Done Issues Addressed
Executive · Reviewed the operating performance and financial results of each business unit within SM Prime.
· Reviewed and approved business development plans, land acquisitions and project development strategies.
· Reviewed the group’s budget. · Reviewed the roadmap of each business unit within SM
Prime vis-à-vis corporate strategies.
Implementation of the strategic and long-term goals of the Company
Audit and Risk
Management
· Reviewed and approved the following with regard to the Independent Auditor and the Internal Auditor: - Their respective audit plans, scope, risk-based
methods and timetables;
- The results of their examinations and Management’s action plans to address pending audit issues; and
- Their assessment of internal controls, including controls over financial reporting;
· Reviewed the report of SGV & Co. on significant accounting issues, changes in accounting principles and relevant pending tax legislations, which could impact SM Prime;
· Reviewed and approved the results of all audit services provided by SGV & Co. and related audit fees;
· Reviewed and ensured that the Company’s related party transactions were conducted at arm’s length basis;
· Reviewed the internal control system of the Company based on the assessments completed and reported by internal and external auditors and found that the system is adequate and effective;
· Discussed the results of the enterprise-wide risk assessment and Management’s action plans to address
Reported audit findings, identified significant risks and related party transactions
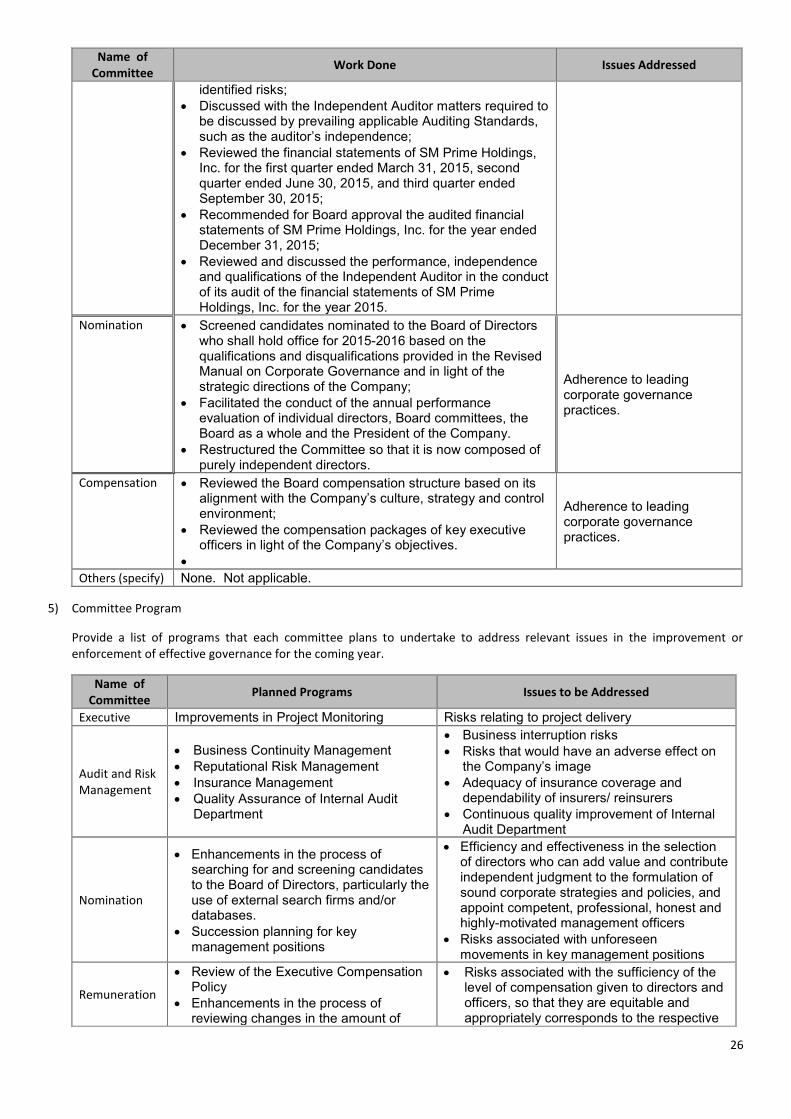
26
Name of
Committee Work Done Issues Addressed
identified risks;
· Discussed with the Independent Auditor matters required to be discussed by prevailing applicable Auditing Standards, such as the auditor’s independence;
· Reviewed the financial statements of SM Prime Holdings, Inc. for the first quarter ended March 31, 2015, second quarter ended June 30, 2015, and third quarter ended September 30, 2015;
· Recommended for Board approval the audited financial statements of SM Prime Holdings, Inc. for the year ended December 31, 2015;
· Reviewed and discussed the performance, independence and qualifications of the Independent Auditor in the conduct of its audit of the financial statements of SM Prime Holdings, Inc. for the year 2015.
Nomination · Screened candidates nominated to the Board of Directors who shall hold office for 2015-2016 based on the qualifications and disqualifications provided in the Revised Manual on Corporate Governance and in light of the strategic directions of the Company;
· Facilitated the conduct of the annual performance evaluation of individual directors, Board committees, the Board as a whole and the President of the Company.
· Restructured the Committee so that it is now composed of purely independent directors.
Adherence to leading corporate governance practices.
Compensation · Reviewed the Board compensation structure based on its alignment with the Company’s culture, strategy and control environment;
· Reviewed the compensation packages of key executive officers in light of the Company’s objectives.
·
Adherence to leading corporate governance practices.
Others (specify) None. Not applicable.
5) Committee Program
Provide a list of programs that each committee plans to undertake to address relevant issues in the improvement or
enforcement of effective governance for the coming year.
Name of
Committee Planned Programs Issues to be Addressed
Executive Improvements in Project Monitoring Risks relating to project delivery
Audit and Risk
Management
· Business Continuity Management
· Reputational Risk Management
· Insurance Management
· Quality Assurance of Internal Audit Department
· Business interruption risks
· Risks that would have an adverse effect on the Company’s image
· Adequacy of insurance coverage and dependability of insurers/ reinsurers
· Continuous quality improvement of Internal Audit Department
Nomination
· Enhancements in the process of searching for and screening candidates to the Board of Directors, particularly the use of external search firms and/or databases.
· Succession planning for key management positions
· Efficiency and effectiveness in the selection of directors who can add value and contribute independent judgment to the formulation of sound corporate strategies and policies, and appoint competent, professional, honest and highly-motivated management officers
· Risks associated with unforeseen movements in key management positions
Remuneration
· Review of the Executive Compensation Policy
· Enhancements in the process of reviewing changes in the amount of
· Risks associated with the sufficiency of the level of compensation given to directors and officers, so that they are equitable and appropriately corresponds to the respective

27
Name of
Committee Planned Programs Issues to be Addressed
compensation of directors and officers, particularly the effect of such changes with respect to the results of performance evaluations
assigned duties and responsibilities, current business environment and performance results of the Company
Others
(specify) None. Not applicable.
F. RISK MANAGEMENT SYSTEM
1) Disclose the following:
(a) Overall risk management philosophy of the company;
SMPHI is committed to protect and preserve its ability to achieve its vision and mission by ensuring that its assets, both tangible and intangible, are protected against damage and loss. As such, it has implemented a program of risk management through the identification, analysis and control of risks, which can most impact on the Company’s ability to pursue its approved strategy. SMPHI recognizes that risk taking is a necessary part of conducting business. In the context of realizing SMPHI’s strategic growth objectives, failure is an accepted part of risk taking, as long as risks have been properly assessed and managed.
(b) A statement that the directors have reviewed the effectiveness of the risk management system and commenting on the
adequacy thereof;
The Board of Directors, through the Audit and Risk Management Committee, reviewed the Company’s risk management system and found the same to be effective and adequate.
(c) Period covered by the review;
Year 2015
(d) How often the risk management system is reviewed and the directors’ criteria for assessing its effectiveness; and
The risk management system is reviewed on an annual basis. Effectiveness of the system is evaluated based on number of risks identified, risks mitigated and risks monitored.
(e) Where no review was conducted during the year, an explanation why not.
Not applicable.
2) Risk Policy
(a) Company
Give a general description of the company’s risk management policy, setting out and assessing the risk/s covered by the
system (ranked according to priority), along with the objective behind the policy for each kind of risk:
SM Prime is covered by SM Group’s Risk Management Policy set out in the next section.
Risk Exposure Risk Management Policy Objective
Safety and Security Risk
SM Prime shall prioritize safety and security in all its properties.
To protect the health, safety and welfare of its employees and the people it serves.
Property Damage and Business Disruption Risks
SM Prime shall ensure the disaster resiliency of its assets.
To protect its property, assets and other resources.
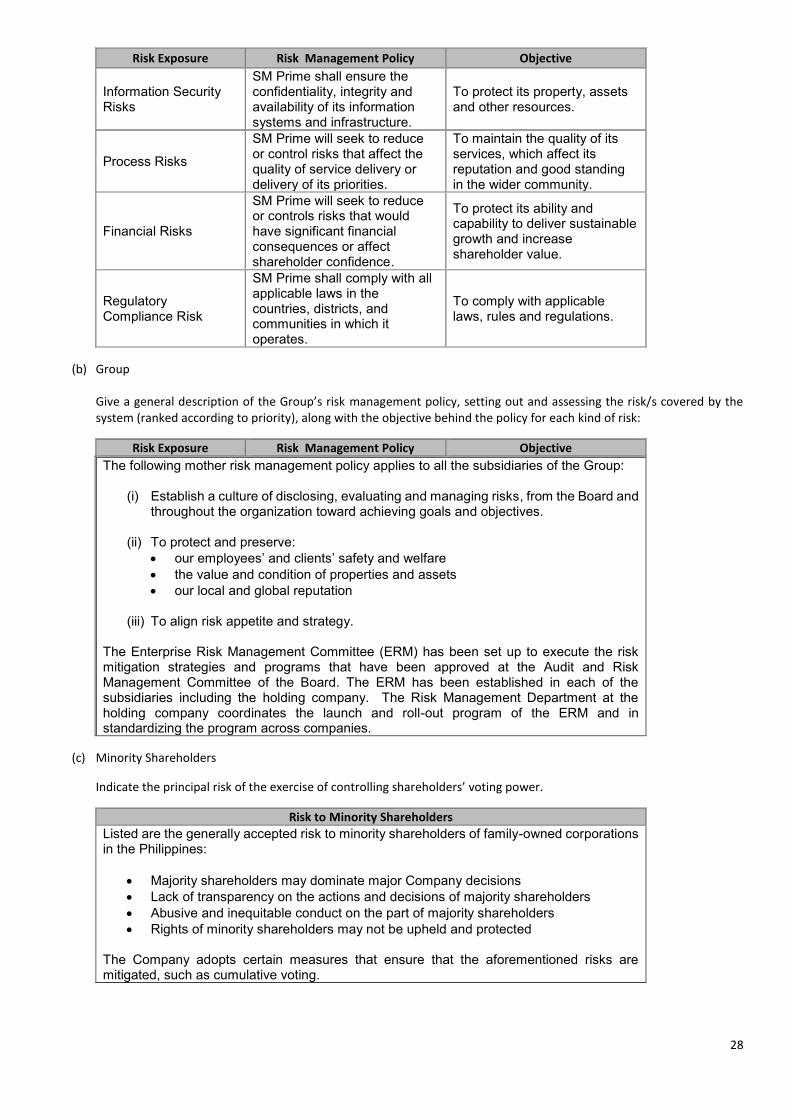
28
Risk Exposure Risk Management Policy Objective
Information Security Risks
SM Prime shall ensure the confidentiality, integrity and availability of its information systems and infrastructure.
To protect its property, assets and other resources.
Process Risks
SM Prime will seek to reduce or control risks that affect the quality of service delivery or delivery of its priorities.
To maintain the quality of its services, which affect its reputation and good standing in the wider community.
Financial Risks
SM Prime will seek to reduce or controls risks that would have significant financial consequences or affect shareholder confidence.
To protect its ability and capability to deliver sustainable growth and increase shareholder value.
Regulatory Compliance Risk
SM Prime shall comply with all applicable laws in the countries, districts, and communities in which it operates.
To comply with applicable laws, rules and regulations.
(b) Group
Give a general description of the Group’s risk management policy, setting out and assessing the risk/s covered by the
system (ranked according to priority), along with the objective behind the policy for each kind of risk:
Risk Exposure Risk Management Policy Objective
The following mother risk management policy applies to all the subsidiaries of the Group:
(i) Establish a culture of disclosing, evaluating and managing risks, from the Board and throughout the organization toward achieving goals and objectives.
(ii) To protect and preserve:
· our employees’ and clients’ safety and welfare
· the value and condition of properties and assets
· our local and global reputation
(iii) To align risk appetite and strategy.
The Enterprise Risk Management Committee (ERM) has been set up to execute the risk mitigation strategies and programs that have been approved at the Audit and Risk Management Committee of the Board. The ERM has been established in each of the subsidiaries including the holding company. The Risk Management Department at the holding company coordinates the launch and roll-out program of the ERM and in standardizing the program across companies.
(c) Minority Shareholders
Indicate the principal risk of the exercise of controlling shareholders’ voting power.
Risk to Minority Shareholders
Listed are the generally accepted risk to minority shareholders of family-owned corporations in the Philippines:
· Majority shareholders may dominate major Company decisions
· Lack of transparency on the actions and decisions of majority shareholders
· Abusive and inequitable conduct on the part of majority shareholders
· Rights of minority shareholders may not be upheld and protected The Company adopts certain measures that ensure that the aforementioned risks are mitigated, such as cumulative voting.

29
3) Control System Set Up
(a) Company
Briefly describe the control systems set up to assess, manage and control the main issue/s faced by the company:
Risk Exposure Risk Assessment
(Monitoring and Measurement Process) Risk Management and Control
(Structures, Procedures, Actions Taken)
Safety and Security Annual audit by third parties (one for safety and another for security)
The Customer Relations Service Department is responsible for maintaining the safety and security of all SM Malls through implementation of access control system. Department personnel are also trained to respond to safety and security incidents.
Property Damage and Business Disruption
Annual review of insurance claims, business impact assessment
Business Continuity Management System, disaster-resilient buildings, data back-up procedures, implementation of redundancy/reserves for critical resources
Information Security
Vulnerability assessment and penetration testing, incident monitoring
The Information Security Department monitors compliance with Information Security Policy and incidents of information security breaches.
Process Risks Business process reviews
The Business Process Management Department reviews existing processes and initiates the creation of tools that enhance efficiency.
Financial Risks
Regular monitoring of interest and forex rates, financial ratios and aging of accounts receivables.
Interest rate risks: Use of both fixed and floating rate debts; interest rate swaps; NDFs, refinancing or prepayment of high-interest loans Foreign currency risk: Cross-currency swaps; foreign currency call options Credit Risk: Tenant Screening, AR Management (collection agency) Capital Management Risk: Maintain approved debt to equity ratio.
Regulatory Compliance Risk
Compliance monitoring and reporting
Operations Planning and Control is responsible for monitoring compliance with mall permits and licenses, and environmental regulations.
(b) Group
Briefly describe the control systems set up to assess, manage and control the main issue/s faced by the company:
Risk Exposure Risk Assessment
(Monitoring and Measurement Process) Risk Management and Control
(Structures, Procedures, Actions Taken)
The holding company provides down-line policy support and coordination to the subsidiaries and affiliates with regard to Corporate Governance, Risk Management, Finance, Internal Audit, Investor Relations, Human Resources, Compliance, Legal matters in the previous item.
(c) Committee
Identify the committee or any other body of corporate governance in charge of laying down and supervising these control
mechanisms, and give details of its functions:
Committee/Unit Control Mechanism Details of its Functions
Audit and Risk Management Committee
The following functionally reports to the ARMC:
· Chief Audit Executive
· Chief Risk Officer
· Compliance Officer
The Committee directly interfaces with the internal and external auditors in the conduct of their duties and responsibilities. Its mandate includes the review of the Company’s financial reports and subsequent recommendation to the Board for approval. The

30
Committee/Unit Control Mechanism Details of its Functions
· Head of Corporate Governance and Risk Management
Committee also reviews the Company’s internal control systems, its audit plans, auditing processes, related party transactions, and assesses the effectiveness of the Company’s risk management system in the mitigation of financial and non-financial risks.
Executive Committee
Has all the power and authority of the Board in the governance, management and direction of the business and affairs of the Company.
The Committee provides oversight in the assessment of impact of risks on the strategic and long-term goals of the Company.
Management Committee
Has overall management control over departments and instrumentalities of the Company.
The Committee ensures the achievement of goals and strategies set by the Board.
PAIV Committee
A management committee that handles whistleblower cases.
Upon receipt of an Incident Report, the Committee conducts an investigation on its merit, subject to due process and applicable penalties and sanctions thereafter. A compilation of concluded reports is periodically presented to the Audit and Risk Management Committee.
Enterprise Risk Management Committee
Composed of all the Risk Owners (Department Heads) and chaired by the Chief Risk Officer.
Updates the Risk Registers and monitors execution of action plans to mitigate exposures.
G. INTERNAL AUDIT AND CONTROL
1) Internal Control System
Disclose the following information pertaining to the internal control system of the company:
(a) Explain how the internal control system is defined for the company;
The internal control system of the company is defined as the set of processes implemented by the Board of Directors, Management and all employees to provide reasonable assurance that the company’s objectives will be achieved.
(b) A statement that the directors have reviewed the effectiveness of the internal control system and whether they consider
them effective and adequate;
The Board of Directors, through the Audit and Risk Management Committee, has reviewed the internal control system of the Company based upon the assessments completed and reported by the internal and external auditors. The Board found the internal control system to be effective.
(c) Period covered by the review;
Year 2015
(d) How often internal controls are reviewed and the directors’ criteria for assessing the effectiveness of the internal control
system; and
Internal controls are reviewed on annual basis for high risk processes of key business units based on the Internal Audit Plan submitted by the Chief Audit Executive to senior management and the Board for review and approval. The Board, through the Audit and Risk Management Committee, relies upon the assurances provided by the Internal Audit Department, through the latter’s conduct of audit engagements to evaluate, among other things, the following:
· Reliability and integrity of information and the means used to identify, measure, classify, and report such information;
· Design of established systems to ensure compliance with policies, plans, procedures, laws, and

31
regulations which could have a significant impact on the organization;
· The means of safeguarding assets, and as appropriate, verifying the existence of such assets;
· Effectiveness and efficiency with which resources are employed; and
· Operations or programs to ascertain whether results are consistent with established objectives and goals and whether the operations or programs are being carried out as planned.
(e) Where no review was conducted during the year, an explanation why not.
Not applicable, reviews of priority high risk areas were carried out in 2015.
2) Internal Audit
(a) Role, Scope and Internal Audit Function
Give a general description of the role, scope of internal audit work and other details of the internal audit function.
Role Scope
Indicate whether
In-house or
Outsource
Internal Audit
Function
Name of Chief
Internal
Auditor/Auditing
Firm
Reporting process
Independent Reviewer
Internal Controls, Risk Management, Governance
In-house Davee M. Zuniga
Quarterly reporting of significant observations to the Audit and Risk Management Committee
(b) Do the appointment and/or removal of the Internal Auditor or the accounting /auditing firm or corporation to which the
internal audit function is outsourced require the approval of the audit committee?
Yes, as stated in the Internal Audit Charter.
(c) Discuss the internal auditor’s reporting relationship with the audit committee. Does the internal auditor have direct and
unfettered access to the board of directors and the audit committee and to all records, properties and personnel?
The Chief Audit Executive, representative of the Internal Audit Department, reports functionally to the Board through the Audit and Risk Management Committee. The Internal Audit Charter provides the Internal Audit Department direct and unfettered access to the board and audit committee and to all records, properties and personnel.
(d) Resignation, Re-assignment and Reasons
Disclose any resignation/s or re-assignment of the internal audit staff (including those employed by the third-party
auditing firm) and the reason/s for them.
Name of Audit Staff Reason
Jan Lynoel Limpin Another job
Ryan Chua Another job
Michelle Eugenio Migrate abroad
Elizelle Christein Sebastian Another job
Pat Erick Buna Another job
Fred Luigi Magnayon Compensation
John Israel Tipsay Abroad
Yuri Nillo Better career opportunity
Deborah Riguerra Better career opportunity
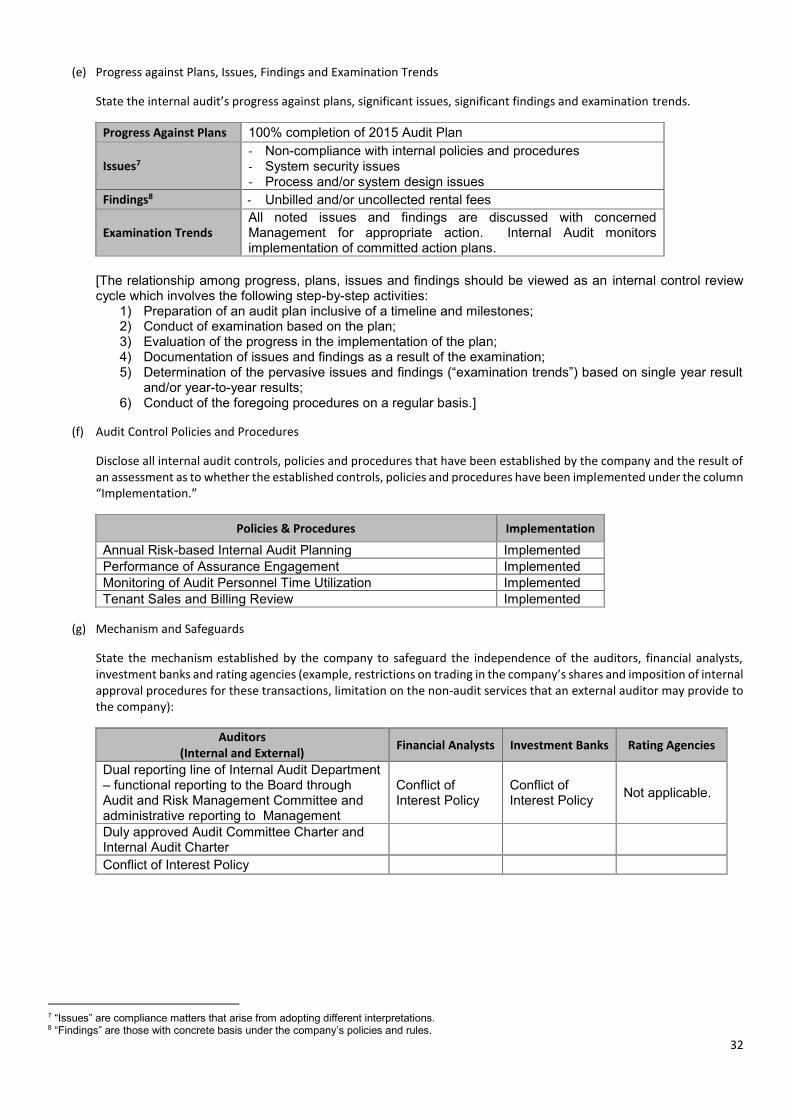
32
(e) Progress against Plans, Issues, Findings and Examination Trends
State the internal audit’s progress against plans, significant issues, significant findings and examination trends.
Progress Against Plans 100% completion of 2015 Audit Plan
Issues7
- Non-compliance with internal policies and procedures - System security issues - Process and/or system design issues
Findings8 - Unbilled and/or uncollected rental fees
Examination Trends
All noted issues and findings are discussed with concerned Management for appropriate action. Internal Audit monitors implementation of committed action plans.
[The relationship among progress, plans, issues and findings should be viewed as an internal control review cycle which involves the following step-by-step activities:
1) Preparation of an audit plan inclusive of a timeline and milestones; 2) Conduct of examination based on the plan; 3) Evaluation of the progress in the implementation of the plan; 4) Documentation of issues and findings as a result of the examination; 5) Determination of the pervasive issues and findings (“examination trends”) based on single year result
and/or year-to-year results; 6) Conduct of the foregoing procedures on a regular basis.]
(f) Audit Control Policies and Procedures
Disclose all internal audit controls, policies and procedures that have been established by the company and the result of
an assessment as to whether the established controls, policies and procedures have been implemented under the column
“Implementation.”
Policies & Procedures Implementation
Annual Risk-based Internal Audit Planning Implemented
Performance of Assurance Engagement Implemented
Monitoring of Audit Personnel Time Utilization Implemented
Tenant Sales and Billing Review Implemented
(g) Mechanism and Safeguards
State the mechanism established by the company to safeguard the independence of the auditors, financial analysts,
investment banks and rating agencies (example, restrictions on trading in the company’s shares and imposition of internal
approval procedures for these transactions, limitation on the non-audit services that an external auditor may provide to
the company):
Auditors
(Internal and External) Financial Analysts Investment Banks Rating Agencies
Dual reporting line of Internal Audit Department – functional reporting to the Board through Audit and Risk Management Committee and administrative reporting to Management
Conflict of Interest Policy
Conflict of Interest Policy
Not applicable.
Duly approved Audit Committee Charter and Internal Audit Charter
Conflict of Interest Policy
7 “Issues” are compliance matters that arise from adopting different interpretations. 8 “Findings” are those with concrete basis under the company’s policies and rules.

33
(h) State the officers (preferably the Chairman and the CEO) who will have to attest to the company’s full compliance with
the SEC Code of Corporate Governance. Such confirmation must state that all directors, officers and employees of the
company have been given proper instruction on their respective duties as mandated by the Code and that internal
mechanisms are in place to ensure that compliance.
SM Prime fully complies with the provisions of the Revised Code of Corporate Governance issued by the Securities and Exchange Commission, as attested by Mr. Henry T. Sy, Jr., Chairman of the Board of Directors, and Mr. Hans T. Sy, President.
H. ROLE OF STAKEHOLDERS
1) Disclose the company’s policy and activities relative to the following:
Policy Activities
Customers' welfare
Code of Ethics: SMPH recognizes that the core of its business is its customers, and values customer satisfaction and loyalty. Thus, all directors, officers and employees shall be guided by fairness, professionalism, courtesy and respect when dealing with customers, and shall endeavor to provide excellent and diligent service at all times. No false or misleading information shall be provided to customers. Likewise, SMPH is committed to protect the safety and security of its customers. Accordingly, the Company shall undertake to keep its premises well-secured, and continuously implement ways to eliminate hazards that would pose threats to the safety of its customers.
The Company engages in various activities which focus on the different segments of its customer-base – youth, women and breastfeeding mothers, the elderly, Overseas Filipino Workers and their families, and persons with disability.
Supplier/contractor
selection practice
Code of Ethics: The Company adheres to the principles of healthy competition, equal opportunity and fair treatment of business partners. As such, selection of suppliers follows an open, competitive and non-discriminatory process. SM Prime implements a vendor enrolment process that screens qualifications of vendors/suppliers the Company will deal with. Such qualifications include legality of entity or business, adequacy of financial strength, compliance with SM Prime policies such as conflict of interest disclosure requirements and ethical standards, and support to SM Prime’s environmental missions, health and safety culture.
Securing proposal from at least three (3) reputable contractors/service providers and selecting best offer consistent with identified business solution.
Environmentally
friendly value-
chain
Code of Ethics: SMPH shall endeavor to adhere to sustainable practices that ensure the protection of the environment, and shall seek to deliver maximum growth with minimal and responsible consumption of natural resources.
- Construction and renovation of malls with core focus on efficiency and sustainable design.
- Audit of resource consumption pattern and pursuing highest attainable levels of resource efficiency.
- Solid waste management.
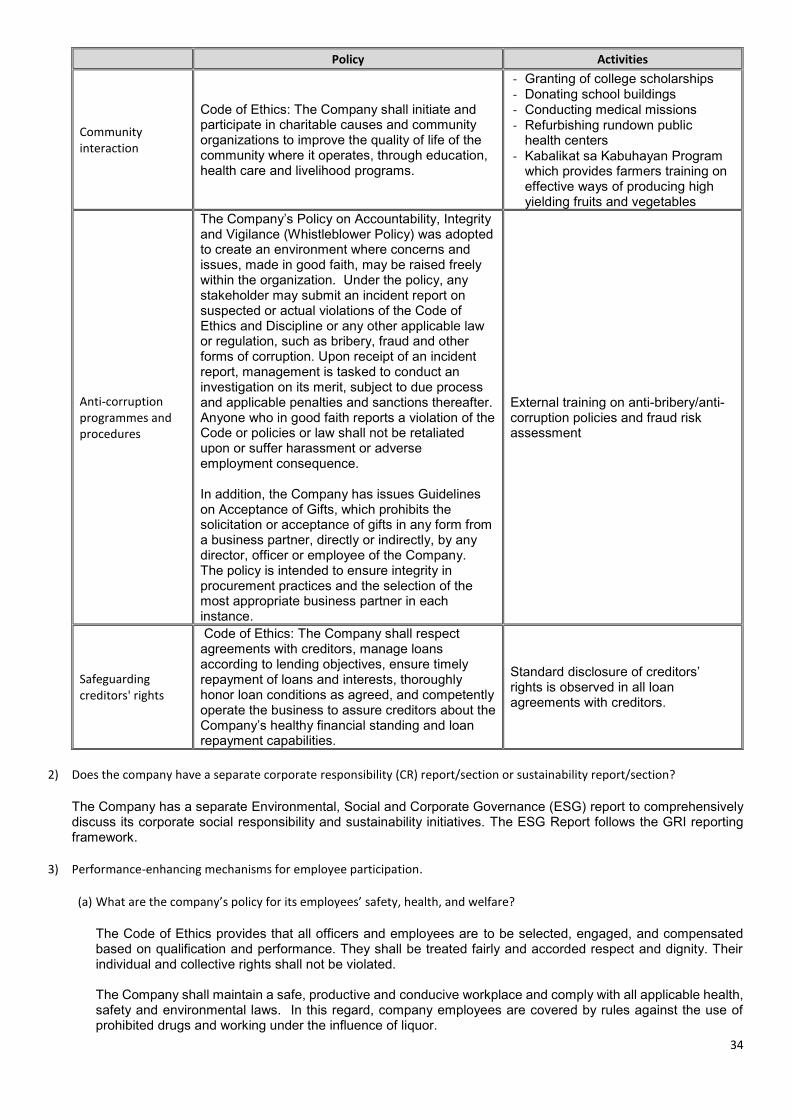
34
Policy Activities
Community
interaction
Code of Ethics: The Company shall initiate and participate in charitable causes and community organizations to improve the quality of life of the community where it operates, through education, health care and livelihood programs.
- Granting of college scholarships - Donating school buildings - Conducting medical missions - Refurbishing rundown public
health centers
- Kabalikat sa Kabuhayan Program which provides farmers training on effective ways of producing high yielding fruits and vegetables
Anti-corruption
programmes and
procedures
The Company’s Policy on Accountability, Integrity and Vigilance (Whistleblower Policy) was adopted to create an environment where concerns and issues, made in good faith, may be raised freely within the organization. Under the policy, any stakeholder may submit an incident report on suspected or actual violations of the Code of Ethics and Discipline or any other applicable law or regulation, such as bribery, fraud and other forms of corruption. Upon receipt of an incident report, management is tasked to conduct an investigation on its merit, subject to due process and applicable penalties and sanctions thereafter. Anyone who in good faith reports a violation of the Code or policies or law shall not be retaliated upon or suffer harassment or adverse employment consequence. In addition, the Company has issues Guidelines on Acceptance of Gifts, which prohibits the solicitation or acceptance of gifts in any form from a business partner, directly or indirectly, by any director, officer or employee of the Company. The policy is intended to ensure integrity in procurement practices and the selection of the most appropriate business partner in each instance.
External training on anti-bribery/anti-corruption policies and fraud risk assessment
Safeguarding
creditors' rights
Code of Ethics: The Company shall respect agreements with creditors, manage loans according to lending objectives, ensure timely repayment of loans and interests, thoroughly honor loan conditions as agreed, and competently operate the business to assure creditors about the Company’s healthy financial standing and loan repayment capabilities.
Standard disclosure of creditors’ rights is observed in all loan agreements with creditors.
2) Does the company have a separate corporate responsibility (CR) report/section or sustainability report/section?
The Company has a separate Environmental, Social and Corporate Governance (ESG) report to comprehensively discuss its corporate social responsibility and sustainability initiatives. The ESG Report follows the GRI reporting framework.
3) Performance-enhancing mechanisms for employee participation.
(a) What are the company’s policy for its employees’ safety, health, and welfare?
The Code of Ethics provides that all officers and employees are to be selected, engaged, and compensated based on qualification and performance. They shall be treated fairly and accorded respect and dignity. Their individual and collective rights shall not be violated. The Company shall maintain a safe, productive and conducive workplace and comply with all applicable health, safety and environmental laws. In this regard, company employees are covered by rules against the use of prohibited drugs and working under the influence of liquor.

35
Opportunities for career advancement shall be provided based on clear performance and qualifications criteria, which shall include both financial and non-financial measures. The Company shall also provide learning and development opportunities for professional growth.
(b) Show data relating to health, safety and welfare of its employees.
Various seminars and wellness programs were also initiated by the Human Resources Department in 2015 for regular employees, such as sports programs, tax clinics and talks on stress management. The Company encourages good health and wellness through its various sports and fitness programs. Employees may use the courts and fitness facilities in the workplace and are encouraged to participate in HRD supported aerobic and dance activities. The Company also conducts orientations and learning sessions on health related matters, such as breast and cervical cancer awareness and detection; influenza and hepatitis B prevention and drug abuse awareness, to name a few. Furthermore, the Company facilitates the distribution and administration of essential vaccines, has a fully functioning clinic and has recently employed the services of a 24 hour roving ambulance service. The Company has also adopted holiday themed activities, to foster camaraderie and provide balance in a fast paced work atmosphere.
(c) State the company’s training and development programmes for its employees. Show the data.
The Company focuses on working with the heads of different departments to identify and develop strategies/approaches that will build a workforce capable of accomplishing the Company’s strategic goals. The Company offers various training solutions to upgrade technical skills, integrate new processes, enhance customer service, advance management and leadership and develop basic skills. The Company has Curriculum-Based Training Program with customized trainings for the various levels in the organization. The courses are designed to develop or enhance competencies:
· Basic Training Program – A curriculum for Rank and File employees designed to develop basic professional skills to enhance productivity.
· Supervisory Development Program – A curriculum for Officer and Supervisor levels designed to develop administrative, leadership, and decision-making skills. The focus is on supervising direct reports and managing specific work responsibilities.
· Managerial Development Program – A curriculum for Department-level Managers designed to develop operations level management and implementation skills. The focus is on the management of specific workgroup.
· Senior Managerial Development Program – A curriculum for Senior-level Managers designed to develop strategic management and implementation skills at the strategic business unit level.
· Executive Development Program – A curriculum for executives designed to develop strategic –level management, implementation and control of multiple strategic business units or entire enterprise.
External workshops/seminars related to the job functions, which are conducted by accredited training organizations in the Philippines, are also offered to employees on a need basis. Functional Skills Training ensures staff are able to perform tasks effectively and efficiently, while also opening new avenues to innovation and improved ways of working. In addition to these course offerings, the Company also sends employees to national and international conferences, which can enlarge their vision and understanding of their field by gaining access to numerous panels where scholars and industry leaders share best practices. There are also mandatory training programs where all SM employees and selected groups of employees are required by law to complete specific training requirements: Employee Conduct, Human Resource Management, Safety, Risk Management and Information Security. Finally, an integral part of the company’s Training and Development Program is the E-learning, which is used in conjunction with face-to-face learning. E-classes allows learners to participate and complete coursework in accordance with their daily commitments.

36
(d) State the company’s reward/compensation policy that accounts for the performance of the company beyond short-term
financial measures
In line with the Code of Ethics, employee compensation and rewards are determined based on the individual performance of the employee and overall Company performance. In line with this, The Company offers Long Term Incentive Plan designed to improve retention of employees and enhance their performance by providing rewards that are tied to the Company’s long-term goals.
4) What are the company’s procedures for handling complaints by employees concerning illegal (including corruption) and
unethical behaviour? Explain how employees are protected from retaliation.
Upon receipt of complaint in the form of an Incident Report from an employee, Management conducts an investigation on its merit, subject to due process. Once proven, appropriate penalties and sanctions may be imposed thereafter. Further, policy provides that anyone who in good faith reports an incident shall not be retaliated upon or suffer harassment or adverse employment consequence.
I. DISCLOSURE AND TRANSPARENCY
1) Ownership Structure
(e) Holding 5% shareholding or more
Shareholder Number of Shares Percent Beneficial Owner
SM Investments Corporation (SMIC)
14,325,013,606 49.60% Felicidad T. Sy - 3.20% Henry T. Sy, Jr. - 7.28%, Hans T. Sy - 8.21%, Herbert T. Sy - 8.21%, Harley T. Sy - 7.29%, Teresita T. Sy - 7.11% Elizabeth T. Sy - 5.82%
PCD Nominee Corp. 7,104,430,076 24.60% No individual shareholders owning 5% or more.
Name of Senior
Management Number of Direct shares
Number of
Indirect shares / Through
(name of record owner)
% of
Capital
Stock
Hans T. Sy 661,002,569 24,160,943 2.37
Jeffrey C. Lim - 50,000 0.00
Christopher S. Bautista - 37,500 0.00
TOTAL 661,002,569 24,248,443 2.37
2) Does the Annual Report disclose the following:
Key risks √
Corporate objectives √
Financial performance indicators √
Non-financial performance indicators √
Dividend policy √
Details of whistle-blowing policy √
Biographical details (at least age, qualifications, date of first appointment, relevant
experience, and any other directorships of listed companies) of
directors/commissioners
√
Training and/or continuing education programme attended by each
director/commissioner √
Number of board of directors/commissioners meetings held during the year √
Attendance details of each director/commissioner in respect of meetings held √

37
Details of remuneration of the CEO and each member of the board of
directors/commissioners √
Should the Annual Report not disclose any of the above, please indicate the reason for the non-disclosure.
Not applicable.
3) External Auditor’s fee
Name of auditor Audit Fee Non-audit Fee
Sycip, Gorres, Velayo & Co. Php 9,000,000 Nil
4) Medium of Communication
List down the mode/s of communication that the company is using for disseminating information.
· Website
· Briefings
· Press Releases
· Annual Reports
5) Date of release of audited financial report:
March 19, 2015 attached to 2014 Definitive Information Statement (SEC 20-IS)
6) Company Website
Does the company have a website disclosing up-to-date information about the following?
Business operations √
Financial statements/reports (current and prior years) √
Materials provided in briefings to analysts and media √
Shareholding structure √
Group corporate structure √
Downloadable annual report √
Notice of AGM and/or EGM √
Company's constitution (company's by-laws, memorandum and articles of association) √
Should any of the foregoing information be not disclosed, please indicate the reason thereto.
None. Not applicable.
7) Disclosure of RPT
RPT Relationship Nature Value (in Thousands)
SM Investments Corporation
Parent · The Company have existing lease agreements for office and commercial spaces with its parent.
· The Company provides manpower and other services.
· The Company’s investment in AFS equity instruments of certain affiliates earn income upon the declaration of dividends.
· The Company, in the normal course of business, has outstanding receivables from and payables to related companies as at reporting period which are
Rent Income P 48,344 Rent Expense P 91,611 Service Income P 27,903 Dividend Income P 1,033 Gain on Sale of AFS P 7,410,301 Trade Payable P 37,831

38
RPT Relationship Nature Value (in Thousands)
unsecured and normally settled in cash.
SM Retail Group and SM Banking Group
Affiliates · The Company have existing lease agreements for office and commercial spaces with related companies (SM Retail and Banking Groups and other affiliates).
· The Company has certain bank accounts and cash placements that are maintained with BDO and China Bank (Bank Associates). Such accounts earn interest based on prevailing market interest rates.
· The Company also availed of bank loans and long-term debt from BDO and China Bank and pays interest based on prevailing market interest rates.
· The Company’s investment in AFS equity instruments of certain affiliates earn income upon the declaration of dividends by the investees.
· The Company provides manpower and other services to affiliates.
· The Company, in the normal course of business, has outstanding receivables from and payables to related companies as at reporting period which are unsecured and normally settled in cash.
Rent Income P 12,419,414 Rent Expense P 1,523 Cash and Cash Equivalents P116,720,058 Time Deposits P 2,160,836 Investments Held for Trading P 563,897 Interest Income P 260,183 Cash in Escrow P 230,139 Receivable Financed P 1,894,719 Interest Expense P 101,856 Dividend Income P 248,407 Service Income P 1,663 Management Fee Income P 6,533 Management Fee Expense P 3,452 Due to Related Parties P 2,592 Trade Payable P 4,621
Shopping Center Management Corporation, SM Lifestyle Entertainment, Inc. and Family Entertainment Center
Affiliates · The Company pays management fees to Shopping Center Management Corporation, SM Lifestyle Entertainment, Inc. and Family Entertainment Center, Inc. (affiliates) for the management of the office and mall premises.
· The Company have existing lease agreements for office and commercial spaces with related companies.
· The Company provides manpower and other services to affiliates
· The Company’s investment in AFS equity instruments of certain affiliates earn income upon the declaration of dividends.
Management Fee Expense P 1,057,603 Service Income P 4,702 Rent Income P 50,472 Rent Expense P 4,962 Dividend Income P 202,277
Key Management Personnel
Key Management Personnel
· This consists of short-term employee benefits and post-employment (pension) benefits
Short Term Employee Benefits P 363,000 Post-Employment Benefits P 61,000
When RPTs are involved, what processes are in place to address them in the manner that will safeguard the interest of the
company and in particular of its minority shareholders and other stakeholders?
The Company, in the regular course of trade or business, enters into transactions with affiliates/ related companies principally consisting of leasing agreements, management fees and cash placements. Generally, leasing and management agreements are renewed on an annual basis and are made at normal market prices. In addition, the Company also has outstanding borrowings/ placements from/ to related banks. Transactions with related parties are made at terms equivalent to those that prevail in arm’s length transactions. Outstanding balances at year-end are unsecured, noninterest-bearing and generally settled within 30 to 90 days. There have been no guarantees/collaterals provided or received for any related party receivables or payables. For the year ended December 31, 2015, the Company has not recorded any impairment of receivables relating to amounts owed by related parties. This assessment is undertaken each financial year through examining the financial position of the related party and the market in which the related party operates. There are no other transactions undertaken or to be undertaken by the Company in which any former/current Director or Executive Officer, nominee for election as Director, or any member of their immediate family was or will be involved or had or will have a direct or indirect material interest.

39
J. RIGHTS OF STOCKHOLDERS
1) Right to participate effectively in and vote in Annual/Special Stockholders’ Meetings
(a) Quorum
Give details on the quorum required to convene the Annual/Special Stockholders’ Meeting as set forth in its By-laws.
Quorum Required Stockholders representing majority of the outstanding capital stock
(b) System Used to Approve Corporate Acts
Explain the system used to approve corporate acts.
System Used Vote of stockholders
Description The Company complies with pertinent sections in the Corporation Code of the Philippines as regards the minimum voting requirement for the approval of corporate acts.
(c) Stockholders’ Rights
List any Stockholders’ Rights concerning Annual/Special Stockholders’ Meeting that differ from those laid down in the
Corporation Code.
Stockholders’ Rights under
The Corporation Code
Stockholders’ Rights not in
The Corporation Code
None. Not applicable.
Dividends
Declaration Date Record Date Payment Date
14 April 2015 4 May 2015 9 June 2015
(d) Stockholders’ Participation
1. State, if any, the measures adopted to promote stockholder participation in the Annual/Special Stockholders’ Meeting,
including the procedure on how stockholders and other parties interested may communicate directly with the Chairman
of the Board, individual directors or board committees. Include in the discussion the steps the Board has taken to solicit
and understand the views of the stockholders as well as procedures for putting forward proposals at stockholders’
meetings.
Measures Adopted Communication Procedure
Notice of the Annual Stockholders’ Meeting is given to all stockholders at least 21 business days before the meeting to provide stockholders with enough time to examine the information. The Notice enclosed essential and adequate facts on all items on the agenda for consideration and approval of the stockholders. As provided for in the Company’s Manual on Corporate Governance, minority stockholders have the right to propose items in the agenda of the meeting, provided the items are for legitimate business purposes.
· Notice of the Annual Stockholders’ Meeting
· Information Statement
To facilitate representation from stockholders who cannot attend the meeting, they are encouraged to fill out, date, sign and send a proxy. For corporate stockholders, the proxies should be accompanied by a Secretary’s Certificate on the appointment of the corporation’s authorized signatory.
· Notice of the Annual Stockholders’ Meeting
· Proxy Forms
· Information Statement
To ensure that all stockholders’ concerns are properly addressed, the Chairman of the Board, Board Directors, the President, Board Committee Chairmen and Members, Senior Management, Corporate Secretary and the Independent Auditors are always present during the Annual Stockholders’ Meeting. The meeting agenda provides an opportunity for stockholders to freely express their views and raise their concerns at the meeting.
· Notice of the Annual Stockholders’ Meeting
· Information Statement

40
2. State the company policy of asking shareholders to actively participate in corporate decisions regarding:
a. Amendments to the company's constitution
b. Authorization of additional shares
c. Transfer of all or substantially all assets, which in effect results in the sale of the company
Corporate acts such as amendments to the Company’s constitution, authorization of additional shares, and the transfer of all or substantially all assets, which in effect results in the sale of the Company, are approved by the vote of stockholders owning at least two-thirds of the capital stock issued and outstanding of the Company. The agenda enclosed in the Notice of Annual Stockholders’ Meeting would include such corporate acts for the consideration and approval of the stockholders.
3. Does the company observe a minimum of 21 business days for giving out of notices to the AGM where items to be
resolved by shareholders are taken up?
a. Date of sending out notices: 4 March 2015
b. Date of the Annual/Special Stockholders’ Meeting: 14 April 2015
4. State, if any, questions and answers during the Annual/Special Stockholders’ Meeting.
· A stockholder raised a question as to the total amount of audit fees of the Corporation. Mr. Jeffrey Lim, Executive Vice President, responded that the total audit fees for the previous year amounted to Php 8 Million.
· A stockholder raised the possibility that the real estate boom will eventually come to an end. She thus asked the Board if it had planned for the eventual slowdown in the real estate business considering what she perceived as heavy leverage of the Company.
Mr. Jeffrey Lim, Executive Vice President, related that a majority of the Corporation’s revenues are still principally derived from leasing, mainly the shopping malls, and that this recurring income is historically insulated from any slowdown in real estate sales. He also noted that the net debt-to-equity ratio of the Corporation is 32% as of 2014 which is still not considered “heavy” and is well below the industry norm and the net debt-to-equity ratio of the Corporation’s peers. He thus explained that the Corporation is in a good position to withstand any slowdown in the real estate business. Mr. Henry Sy, Jr., Chairman of the Board, added that most of the projects are pre-sold before any building is done, thus, assuring that the Corporation is further protected from any such slowdown and will still thrive even during worst of times.
5. Result of Annual/Special Stockholders’ Meeting’s Resolutions
Resolution Approving Dissenting Abstaining
Approval of the 2014 Minutes of the Annual Stockholders’ Meeting
99.99% 0% 0.006%
Approval of the 2014 Annual Report 99.97% 0% 0.034%
General Ratification of the Acts of Management and the Board of Directors
99.97% 0.00051% 0.034%
Appointment of External Auditors 99.99% 0% 0.0059%
6. Date of publishing of the result of the votes taken during the most recent AGM for all resolutions:
14 April 2015 (same day of meeting)
(e) Modifications
State, if any, the modifications made in the Annual/Special Stockholders’ Meeting regulations during the most recent
year and the reason for such modification:
Modifications Reason for Modification
None. Not applicable.

41
(f) Stockholders’ Attendance
(i) Details of Attendance in the Annual/Special Stockholders’ Meeting Held:
Type of
Meeting
Names of Board members
/ Officers present
Date of
Meeting
Voting
Procedure
(by poll,
show of
hands, etc.)
% of SH
Attending
in Person
% of
SH in
Proxy
Total % of SH
attendance
Annual
Henry Sy, Sr. Henry T. Sy, Jr. Jose L. Cuisia, Jr. Gregorio U. Kilayko Joselito H. Sibayan Hans T. Sy Herbert T. Sy Jorge T. Mendiola
4/14/15 By Poll 10% 71.7% 81.76%
Special Not applicable (NAP)* NAP NAP NAP NAP NAP
* Holding of special meeting(s) of the Board of Directors was deemed unnecessary in 2014.
(ii) Does the company appoint an independent party (inspectors) to count and/or validate the votes at the ASM/SSMs?
Yes. The Company’s External Auditor serves as the independent party that counts/validates votes during the ASM.
(iii) Do the company’s common shares carry one vote for one share? If not, disclose and give reasons for any divergence
to this standard. Where the company has more than one class of shares, describe the voting rights attached to each
class of shares.
Yes. Per the Company’s By-Laws, common shares carry one vote for one share.
(g) Proxy Voting Policies
State the policies followed by the company regarding proxy voting in the Annual/Special Stockholders’ Meeting.
Company’s Policies
Execution and acceptance of proxies
Per the Company’s By-Laws, at every meeting of the stockholders, each stockholder shall be entitled to vote in person or by proxy. Stockholders may vote the share or shares standing in his name on the stock transfer books of the Corporation.
Notary Notarization of proxies is not required.
Submission of Proxy Proxies must be filed with the Corporate Secretary at least 72 hours before the stockholders’ meeting.
Several Proxies Stockholders may vote the share or shares standing in his name on the stock transfer books of the Corporation.
Validity of Proxy
In compliance with the Corporation Code, unless otherwise provided in the proxy, said proxy shall only be valid for the meeting for which it is intended. No proxy shall be valid or effective for a period longer than five (5) years.
Proxies executed abroad
Per the Company’s By-Laws, at every meeting of the stockholders, each stockholder shall be entitled to vote in person or by proxy. Stockholders may vote the share or shares standing in his name on the stock transfer books of the Corporation, regardless if they are abroad.
Invalidated Proxy Two inspectors may be appointed by the Board of Directors before or at each meeting of the stockholders of the corporation at which an election of directors shall take place. The inspectors shall receive and take charge of all proxies and ballots and shall decide all questions touching upon the qualifications of voters, the validity of proxies and the acceptance and rejection of votes.
Validation of Proxy
Violation of Proxy
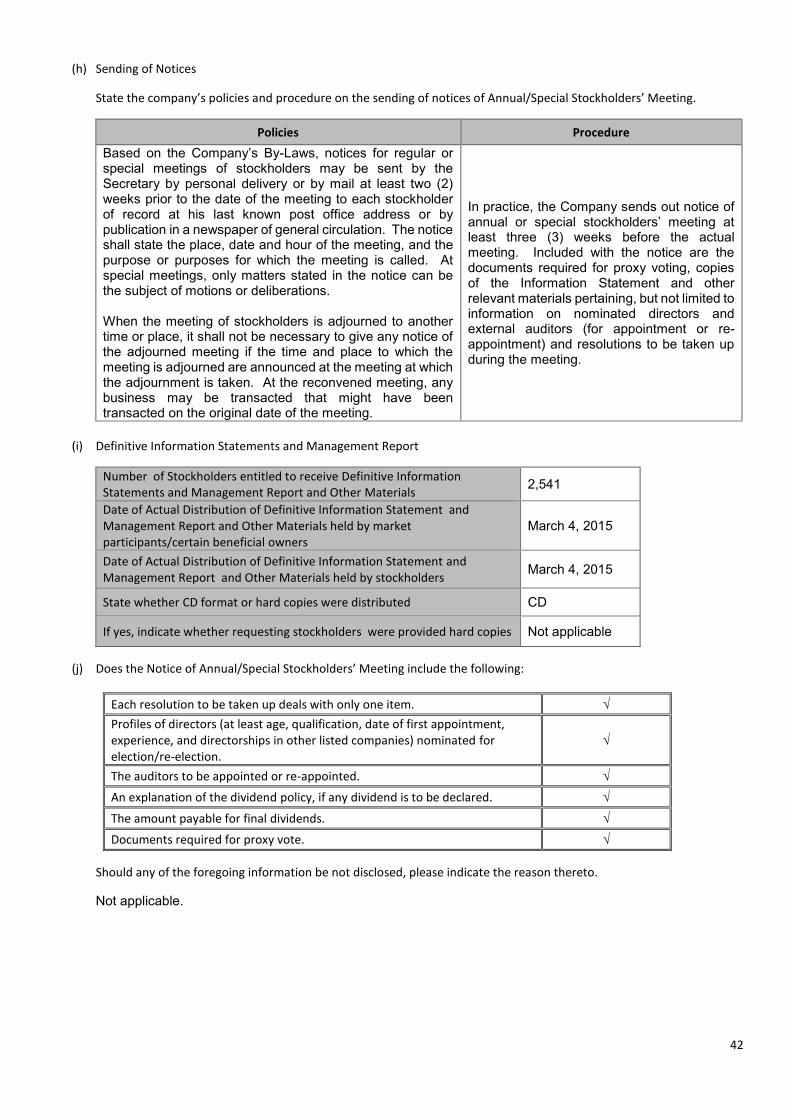
42
(h) Sending of Notices
State the company’s policies and procedure on the sending of notices of Annual/Special Stockholders’ Meeting.
Policies Procedure
Based on the Company’s By-Laws, notices for regular or special meetings of stockholders may be sent by the Secretary by personal delivery or by mail at least two (2) weeks prior to the date of the meeting to each stockholder of record at his last known post office address or by publication in a newspaper of general circulation. The notice shall state the place, date and hour of the meeting, and the purpose or purposes for which the meeting is called. At special meetings, only matters stated in the notice can be the subject of motions or deliberations. When the meeting of stockholders is adjourned to another time or place, it shall not be necessary to give any notice of the adjourned meeting if the time and place to which the meeting is adjourned are announced at the meeting at which the adjournment is taken. At the reconvened meeting, any business may be transacted that might have been transacted on the original date of the meeting.
In practice, the Company sends out notice of annual or special stockholders’ meeting at least three (3) weeks before the actual meeting. Included with the notice are the documents required for proxy voting, copies of the Information Statement and other relevant materials pertaining, but not limited to information on nominated directors and external auditors (for appointment or re-appointment) and resolutions to be taken up during the meeting.
(i) Definitive Information Statements and Management Report
Number of Stockholders entitled to receive Definitive Information
Statements and Management Report and Other Materials 2,541
Date of Actual Distribution of Definitive Information Statement and
Management Report and Other Materials held by market
participants/certain beneficial owners
March 4, 2015
Date of Actual Distribution of Definitive Information Statement and
Management Report and Other Materials held by stockholders March 4, 2015
State whether CD format or hard copies were distributed CD
If yes, indicate whether requesting stockholders were provided hard copies Not applicable
(j) Does the Notice of Annual/Special Stockholders’ Meeting include the following:
Each resolution to be taken up deals with only one item. √
Profiles of directors (at least age, qualification, date of first appointment,
experience, and directorships in other listed companies) nominated for
election/re-election.
√
The auditors to be appointed or re-appointed. √
An explanation of the dividend policy, if any dividend is to be declared. √
The amount payable for final dividends. √
Documents required for proxy vote. √
Should any of the foregoing information be not disclosed, please indicate the reason thereto.
Not applicable.

43
2) Treatment of Minority Stockholders
(a) State the company’s policies with respect to the treatment of minority stockholders.
Policies Implementation
Manual on Corporate Governance
The Company’s Manual on Corporate Governance provides for the rights of its minority stockholders. Rights include, but are not limited to the following:
· Voting Rights
· Appraisal Right
· Inspection Right
· Right to Information
· Right to Dividends
Code of Ethics
The Company’s Code of Ethics provide for the following:
· The SM Group is committed to strengthen its corporate governance practices with the end in view of increasing shareholder value over time.
· The Company shall maintains accurate and complete records of all financial and business transactions in accordance with laws and regulations governing financial reporting and generally accepted accounting principles. These provide the basis for the report it discloses to the public and its shareholders regarding the Company’s results of operations and financial position. The Company also ensures that an independent audit of its financial statements is conducted by external auditors.
· Whether in selection of the countries and markets where the Company operates, hiring and promotion of employees, selection of suppliers and contractors – the company decides on the basis of merit and value to shareholders.
· All business decisions and actions must be based on the best interests of the Company and the value to shareholders, and should not be motivated by personal considerations or relationships which may interfere with the exercise of independent judgment.
(b) Do minority stockholders have a right to nominate candidates for board of directors?
Yes. Under the Company’s By-Laws and Corporate Governance Manual, all stockholders have the right to nominate candidates to the Board.
K. INVESTORS RELATIONS PROGRAM
1) Discuss the company’s external and internal communications policies and how frequently they are reviewed. Disclose who
reviews and approves major company announcements. Identify the committee with this responsibility, if it has been assigned
to a committee.
For financial results, the disclosure is quarterly. All results have to be presented to the Chief Information Officer, the Audit and Risk Management Committee and the Board for approval prior to distribution to the public. Material disclosures relating to capital expenditures, fund raisings, project launches, etc. are disclosed upon approval of the Management Committee of the concerned business unit and the Chief Information Officer.
2) Describe the company’s investor relations program including its communications strategy to promote effective
communication with its stockholders, other stakeholders and the public in general. Disclose the contact details (e.g.
telephone, fax and email) of the officer responsible for investor relations.
SM Prime is committed to providing its stakeholders and the public timely and accurate information pertaining to its business operations. SM Prime consistently enhances its disclosures and regularly updates its website to provide greater transparency. It also conducts regular briefing with investors and the media. Briefing materials are made available in its website.

44
Further, the Company maintains a separate Corporate Governance section in its website, which is used to disclose to the public all of SM Prime’s efforts to further develop its corporate governance culture. The section features information about corporate governance policies, programs, and other relevant activities. Also, SM Prime actively participates in non-deal roadshows/conferences hosted by various brokers to meet with existing and prospective investors.
Details
(1) Objectives · Assist investors in making investment decisions with regard to shares of SM and its listed subsidiaries.
· Guide analysts in formulating their forecasts and recommendations with regard to the valuation and prospects of SM and its listed subsidiaries.
· Provide the regulators, the media and the general public with the most current information about SM Investments and all of its core businesses which will have a material impact on the company’s overall growth and profitability.
· Ensure that material disclosures are immediately disseminated without prejudice to any one group
(2) Principles · Transparency and accountability to all existing and potential investors
· Fairness and level playing field for all stakeholders
(3) Modes of
Communications
· Direct: One-on-one meetings, roadshows, investor conferences, teleconference and video conference
· Web based: Website, email services Analyst and media briefings, press conferences, TV/radio guestings
· Social media: Twitter
· Print: PSE/SEC filings, annual reports, powerpoint presentations, press releases, speeches
(4) Investors
Relations Officer Teresa Cecilia R. Agsalud
3) What are the company’s rules and procedures governing the acquisition of corporate control in the capital markets, and
extraordinary transactions such as mergers, and sales of substantial portions of corporate assets?
Due diligence, benchmarking, market dynamics, long-term sustainability of the business, synergies with the whole group, cost implications, core competency, board approval, regulatory approvals. All these are done for both acquisition and sale of assets.
Name of the independent party the board of directors of the company appointed to evaluate the fairness of the transaction
price.
The names of the independent parties vary and will depend on the type of transactions. SM deals with a host of investment banks, external auditors, third party appraisers, legal and tax consultants.
L. CORPORATE SOCIAL RESPONSIBILITY INITIATIVES
Discuss any initiative undertaken or proposed to be undertaken by the company.
Initiative Beneficiary
SM Cares for Children and Youth Development SM builds all-access malls with tiny feet in mind, and upgrades existing ones to include the latest in child-proof technology.
Children
SM Cares for Persons with Disabilities SM Supermalls has championed the issues of Persons with Disabilities (PWDs) longing to be heard, by giving them a venue to host their events and spread their cause, and a second home where they can feel welcome and secure.
Persons with disability

45
Initiative Beneficiary
SM Cares for Overseas Filipino Workers: Global Pinoy Program SM Global Pinoy Program honors modern heroes by serving them and helpings improve their lives by bringing them closer to home.
OFWs and their families
SM Cares for Women and Breastfeeding Mothers SM Supermalls promotes breastfeeding in the malls as well as in the workplace for nursing mothers. It also hosts various exhibits, forums and discussions on parenting issues.
Filipino women
SM Cares for Senior Citizens SM goes beyond offering senior citizens courtesy lanes. The Company designs programs that encourage the elderly to be more active, engaged and social.
Senior Citizens
SM Cares for the Environment and Sustainability The program focuses on energy efficiency, solid waste management, air quality and water recycling.
Community
SM Special Project for the Underprivileged More than 3,000 employees of retail giant SM Supermalls brought cheers through various charity events throughout the Christmas season for the underprivileged sectors of society.
Underprivileged sectors of society
SM Cares Housing Program SM turned over calamity-resistant houses in areas affected by Typhoon Yolanda.
Victims of Typhoon Yolanda
M. BOARD, DIRECTOR, COMMITTEE AND CEO APPRAISAL
Disclose the process followed and criteria used in assessing the annual performance of the board and its committees,
individual director, and the CEO/President.
Process Criteria
Board of Directors
Under the guidance of the Nomination Committee, the Board conducts an annual performance self-evaluation. The performance evaluation is based on the duties and responsibilities of the Board of Directors, Board Committees, individual directors and President as provided for by the Manual on Corporate Governance and By-Laws. Directors are asked to rate the performance of the Board, the Board Committees, themselves as directors and the President, as the embodiment of Management. Directors are also asked to identify areas for improvement, such as training/continuing education programs or any other forms of assistance that they may need in the performance of their duties. The evaluation forms also include items on support services given to the Board, such as the quality and timeliness of information provided to them,
· Diversity of competencies
· Adequate knowledge of different risks
· Industrial background
· Academic qualifications
· Work in general
· Decision making
· Discussions on short & long term developments
· Discussions on business strategies and plans
· Discussions on risks and regulations
· Promotion of good governance principles
· Promotion of continuing education
· Board committee performance
Board Committees
Individual Directors
· Independence
· Participation
· Expertise
CEO/President
· Effective leadership
· Integrity
· Diligence
· Adherence to Corporate governance

46
the frequency and conduct of regular, special or committee meetings and their accessibility to Management, the Corporate Secretary and Board Advisors. The Board then reviews and evaluates the results of the evaluation, discussing possible changes that will enhance the performance of the individual directors, the support services given and the Board as a collective body.
N. INTERNAL BREACHES AND SANCTIONS
Discuss the internal policies on sanctions imposed for any violation or breach of the corporate governance manual involving
directors, officers, management and employees
Violations Sanctions
Any violation of a provision found in the Manual on Corporate Governance.
a) In case of first violation, the subject person shall be reprimanded. b) Suspension from the office shall be imposed in case of a second violation. The
duration of the suspension shall depend on the gravity of the violation. This shall not be applicable to directors.
c) For third violation, the maximum penalty of removal from office shall be imposed.
With regards to directors, the provision of Section 28 of the Corporation Code shall be observed.
