cover sheet - philippine national bank
TRANSCRIPT

COVER SHEET
A S 0 9 6 - 0 0 5 5 5 5
S.E.C. Registration Number
P H I L I P P I N E N A T I O N A L B A N K
Company’s Full Name)
9 t h F l o o r P N B F i n a n c i a l C e n t e r
M a c a p a g a l B L v d . , P a
s a y C i t y
(Business Address: No. Street City/Town/ Province)
MARLYN M. PABRUA 891-60-40
Contact Person Company Telephone Number
6 3 0 17 - Q
Month Day FORM TYPE Month Day Fiscal Year Annual Meeting
Secondary License Type, If Applicable
Dept. Requiring this Doc. Amended Articles Number/Section Total amount of Borrowings
Total No. of Stockholders Domestic Foreign -----------------------------------------------------------------------------------------------------------------------------------------------------------
To be accomplished by SEC Personnel concerned
File Number LCU
Document I.D. Cashier
S T A M P S
Remarks = pls. use black ink for scanning purposes

1
SEC Number AS096-005555 File Number
PHILIPPINE NATIONAL BANK
AND SUBSIDIARIES (Company’s Full Name)
PNB Financial Center, Pres. Diosdado P. Macapagal Boulevard, Pasay City
(Company’s Address)
(632) 891-6040 to 70 (Telephone Number)
(Calendar Year Ended)
SEC FORM 17-Q REPORT Form Type
(Amendment Designation (if applicable)
JUNE 30, 2013 Period Ended Date
LISTED (Secondary License Type and File Number)

2
SECURITIES AND EXCHANGE COMMISSION
SEC FORM 17-Q
QUARTERLY REPORT PURSUANT TO SECTION 17 OF THE SECURITIES REGULATION CODE AND SRC RULE 17(2)(b) THEREUNDER
1. For the quarter ended June 30, 2013
2. Commission Identification No. ASO96-005555
3. BIR Tax Identification No. 000-188-209-000
4. Exact name of issuer as specified in its charter: Philippine National Bank
5. Philippines . 6. (SEC Use Only) Province, Country or other jurisdiction of
incorporation or organization Industry Classification Code:
7. PNB Financial Center, Pres. Diosdado P. Macapagal Blvd, Pasay City 1300 Address of principal office Postal Code
8. (632)/891-60-40 up to 70 / (632)526-3131 to 70 Issuer’s telephone number, including area code
9. not applicable . Former name, former address, and former fiscal year, if changed since last report
10. Securities registered pursuant to Sections 8 and 12 of the Code or Sections 4 and 8 of the
RSA Title of Each Class Number of Shares of Common Stock Outstanding
and Amount of Debt Outstanding Common Shares 1,086,208,4161/ 11. Are any or all of these securities listed on a Stock Exchange: Yes [ √ ] No [ ]
If yes, state the name of such stock exchange and the classes of securities listed therein:
Philippine Stock Exchange Common Stocks 12. Indicate by check mark whether the registrant:
(a) has filed all reports required to be filed by Section 17 of the Code and SRC Rule 17 thereunder or Section 11 of the RSA and RSA Rule 11 (a) – 1 thereunder, and Sections 26 and 141 of the Corporation Code of the Philippines during the preceding twelve (12) months (or for such shorter period that the registrant was required to file such reports):
Yes [ √ ] No [ ] (b) has been subject to such filing requirements for the past ninety (90) days. Yes [ √ ] No [ ]
1 A total of 423,962,500 common shares were issued to the stockholders of Allied Banking Corporation (ABC) relative to the merger of PNB with ABC effective February 9, 2013. Said shares are for registration with the Securities and Exchange Commission (SEC) and to be listed to the Philippine Stock Exchange, Inc. (PSE).

3
PART I - FINANCIAL INFORMATION ITEM 1. FINANCIAL STATEMENTS
The accompanying consolidated financial statements of Philippine National Bank (PNB) and its Subsidiaries (the PNB Group) which comprise the consolidated statements of financial position as of June 30, 2013 and December 31, 2012 and the consolidated statements of income, statements of comprehensive income, statements of changes in equity and statements of cash flows for the six months ended June 30, 2013 and June 30, 2012 have been prepared in compliance with Philippine Financial Reporting Standards (PFRS). The December 31, 2012 consolidated statements of financial position and the consolidated statements of income, statements of comprehensive income, statements of changes in equity and statements of cash flows for the six months ended June 30, 2012 are based on the balances of PNB prior to the merger of PNB with Allied Banking Corporation (ABC) effective February 9, 2013. The same accounting policies and methods have been followed in the preparation of the accompanying financial statements, consistent with the 2012 Audited Financial Statements except for the new, amendments and improvements to PFRS which became effective as of January 1, 2013.
ITEM 2. MANAGEMENT’S DISCUSSION AND ANALYSIS OF FINANCIAL CONDITION AND
RESULTS OF OPERATIONS
A. Financial Condition
The Group’s consolidated assets expanded to P563.4 billion as of June 30, 2013, P233.2 billion or 70.6% higher compared to P330.2 billion total assets reported by the Bank as of December 31, 2012. The significant increase was mainly attributed to the merger of the Philippine National Bank (PNB) and Allied Banking Corporation (ABC) which become effective on February 9, 2013. Changes (more than 5%) in assets were registered in the following accounts:
• Cash and Due from Banks of the merged Bank totalled P144.6 billion, 208.9% or
P97.8 billion, higher compared to the December 31, 2012 level of P46.8 billion. The increase came from Deposits with the BSP which grew by P82.3 billion while the increases in Cash and Other Cash Items and Due from Banks accounts of P2.8 billion and P12.7 billion respectively, pertains mainly to ABC accounts which were brought in to the merged Bank.
• Interbank loans Receivable is at P6.6 billion for June 2013 or a decline of 42.7% compared to the December 2012 level of P11.5 billion due mainly to lower interbank lending transactions to various banks in June.
• Securities Held Under Agreements to Resell stood at P20.1 billion or P1.8 billion higher compared to the December 2012 of P18.3 billion due mainly to higher lending transactions of the Bank with the BSP.
4
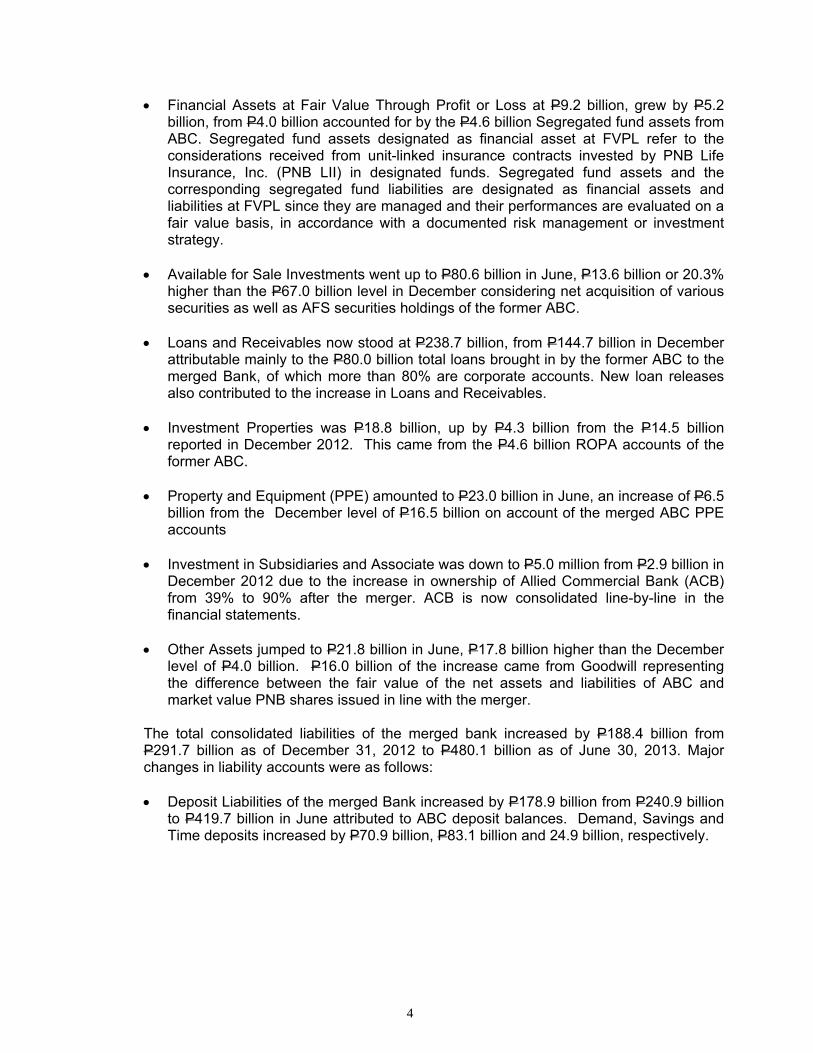
• Financial Assets at Fair Value Through Profit or Loss at P9.2 billion, grew by P5.2 billion, from P4.0 billion accounted for by the P4.6 billion Segregated fund assets from ABC. Segregated fund assets designated as financial asset at FVPL refer to the considerations received from unit-linked insurance contracts invested by PNB Life Insurance, Inc. (PNB LII) in designated funds. Segregated fund assets and the corresponding segregated fund liabilities are designated as financial assets and liabilities at FVPL since they are managed and their performances are evaluated on a fair value basis, in accordance with a documented risk management or investment strategy.
• Available for Sale Investments went up to P80.6 billion in June, P13.6 billion or 20.3%
higher than the P67.0 billion level in December considering net acquisition of various securities as well as AFS securities holdings of the former ABC.
• Loans and Receivables now stood at P238.7 billion, from P144.7 billion in December attributable mainly to the P80.0 billion total loans brought in by the former ABC to the merged Bank, of which more than 80% are corporate accounts. New loan releases also contributed to the increase in Loans and Receivables.
• Investment Properties was P18.8 billion, up by P4.3 billion from the P14.5 billion reported in December 2012. This came from the P4.6 billion ROPA accounts of the former ABC.
• Property and Equipment (PPE) amounted to P23.0 billion in June, an increase of P6.5 billion from the December level of P16.5 billion on account of the merged ABC PPE accounts
• Investment in Subsidiaries and Associate was down to P5.0 million from P2.9 billion in
December 2012 due to the increase in ownership of Allied Commercial Bank (ACB) from 39% to 90% after the merger. ACB is now consolidated line-by-line in the financial statements.
• Other Assets jumped to P21.8 billion in June, P17.8 billion higher than the December
level of P4.0 billion. P16.0 billion of the increase came from Goodwill representing the difference between the fair value of the net assets and liabilities of ABC and market value PNB shares issued in line with the merger.
The total consolidated liabilities of the merged bank increased by P188.4 billion from P291.7 billion as of December 31, 2012 to P480.1 billion as of June 30, 2013. Major changes in liability accounts were as follows:
• Deposit Liabilities of the merged Bank increased by P178.9 billion from P240.9 billion
to P419.7 billion in June attributed to ABC deposit balances. Demand, Savings and Time deposits increased by P70.9 billion, P83.1 billion and 24.9 billion, respectively.
5
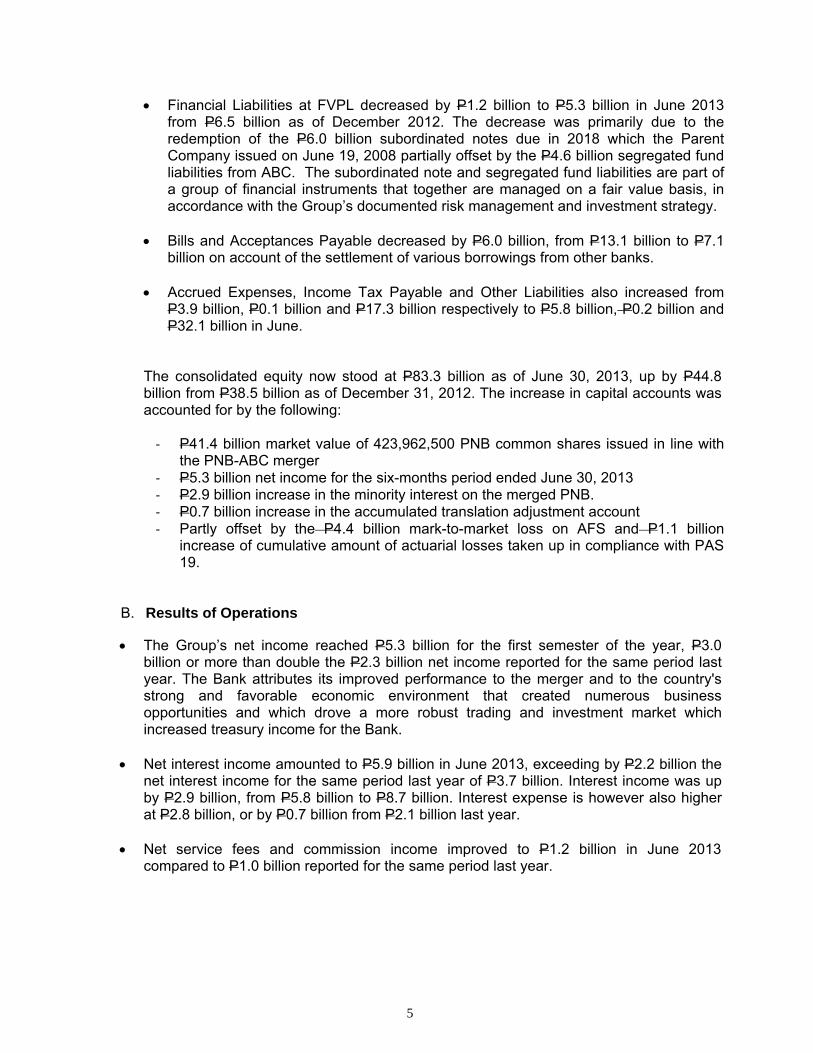
• Financial Liabilities at FVPL decreased by P1.2 billion to P5.3 billion in June 2013 from P6.5 billion as of December 2012. The decrease was primarily due to the redemption of the P6.0 billion subordinated notes due in 2018 which the Parent Company issued on June 19, 2008 partially offset by the P4.6 billion segregated fund liabilities from ABC. The subordinated note and segregated fund liabilities are part of a group of financial instruments that together are managed on a fair value basis, in accordance with the Group’s documented risk management and investment strategy.
• Bills and Acceptances Payable decreased by P6.0 billion, from P13.1 billion to P7.1 billion on account of the settlement of various borrowings from other banks.
• Accrued Expenses, Income Tax Payable and Other Liabilities also increased from P3.9 billion, P0.1 billion and P17.3 billion respectively to P5.8 billion, P0.2 billion and P32.1 billion in June.
The consolidated equity now stood at P83.3 billion as of June 30, 2013, up by P44.8 billion from P38.5 billion as of December 31, 2012. The increase in capital accounts was accounted for by the following:
‐ P41.4 billion market value of 423,962,500 PNB common shares issued in line with
the PNB-ABC merger ‐ P5.3 billion net income for the six-months period ended June 30, 2013 ‐ P2.9 billion increase in the minority interest on the merged PNB. ‐ P0.7 billion increase in the accumulated translation adjustment account ‐ Partly offset by the P4.4 billion mark-to-market loss on AFS and P1.1 billion
increase of cumulative amount of actuarial losses taken up in compliance with PAS 19.
B. Results of Operations
• The Group’s net income reached P5.3 billion for the first semester of the year, P3.0 billion or more than double the P2.3 billion net income reported for the same period last year. The Bank attributes its improved performance to the merger and to the country's strong and favorable economic environment that created numerous business opportunities and which drove a more robust trading and investment market which increased treasury income for the Bank.
• Net interest income amounted to P5.9 billion in June 2013, exceeding by P2.2 billion the net interest income for the same period last year of P3.7 billion. Interest income was up by P2.9 billion, from P5.8 billion to P8.7 billion. Interest expense is however also higher at P2.8 billion, or by P0.7 billion from P2.1 billion last year.
• Net service fees and commission income improved to P1.2 billion in June 2013 compared to P1.0 billion reported for the same period last year.

6
• Fee-based and other income increased by P4.2 billion to P8.3 billion for the semester
ended June 30, 2013, from P4.1 billion for the same period last year. The increase came from gains on Trading and investment securities which was higher by P3.1 billion, from P2.6 billion to P5.7 billion mainly attributed to trading gains on investment securities.
• Administrative and other operating expenses totalled P8.7 billion, P2.8 billion more than last year's P5.9 billion. Increases were registered in Compensation and Fringe benefits by P1.0 billion, Taxes and licenses by P0.3 billion and Other Miscellaneous expenses by P1.0 billion. Provision for impairment and credit losses, Occupancy and equipment-related costs and Depreciation and amortization also increased by P0.1 billion, P0.2 billion and P0.2 billion, respectively.
• Provision for income tax was at P1.4 billion and P0.4 billion for the semesters ended June 30, 2013 and 2012, respectively with the increase primarily due to higher taxable revenues during the current period.
C. Key Performance Indicators
• Capital Adequacy
The PNB Group’s consolidated risk-based capital adequacy ratios (CAR) computed based on BSP guidelines were 21.6% and 18.12% as of June 30, 2013 and December 31, 2012, respectively, consistently exceeding the regulatory 10% CAR.
• Asset Quality
The PNB Group’s non-performing loans (gross of allowance) increased to P10.7 billion as of June 30, 2013 compared to P6.5 billion as of December 31, 2012, with the increase mainly attributed to ABC balances. NPL ratio of the merged bank (based on new BSP guidelines) is 1.15% (net of valuation reserves) and 4.42% (at gross).
• Profitability Six Months Ended 6/30/13 6/30/12 (as restated) Return on equity 1/ 12.8% 12.7% Return on assets 2/ 1.9% 1.5% Net interest margin 3/ 2.5% 3.0%
1/ Annualized net income divided by average total equity for the period indicated 2/ Annualized net income divided by average total assets for the period indicated 3/ Annualized net interest income divided by average interest-earning assets for the period indicated.
• Liquidity
The ratio of liquid assets to total assets is higher at 46.4% as of June 30, 2013 compared to 44.7% as of December 31, 2012, respectively. The PNB Group is in compliance with liquidity floor on government deposits and legal reserve requirements for deposit liabilities.

7
• Cost Efficiency
The ratio of total operating expenses (excluding provision for impairment, credit and other losses) to total operating income improved to 52.6% for the six months ended June 30, 2013 compared to 62.5% for the same period last year.
• Other financial soundness indicators is shown in Annex A
D. Known trends, demands, commitments, events or uncertainties
There are no known demands, commitments, events or uncertainties that will have a material impact on the Bank’s liquidity within the next twelve (12) months.
E. Events that will trigger direct or contingent financial obligation
In the normal course of business, the PNB Group makes various commitments and incurs certain contingent liabilities that are not presented in the financial statements including several suits and claims which remain unsettled. No specific disclosures on such unsettled assets and claims are made because such disclosures would prejudice the Group’s position with the other parties with whom it is in dispute. Such exemption from disclosures is allowed under PAS 37, Provisions, Contingent Liabilities and Contingent Assets. The PNB Group and its legal counsel believe that any losses arising from these contingencies which are not specifically provided for will not have a material adverse effect on the financial statements.
F. Material off-balance sheet transactions, arrangements or obligations
The summary of various commitments and contingent accounts as of June 30, 2013 and December 31, 2012 at their equivalent peso contractual amounts is presented in Note 9 of the Selected Notes to Consolidated Financial Statements on page 31 of this report.
G. Capital Expenditures
The Bank has commitments for capital expenditures. The Bank plans to purchase the hardware and software requirements needed for the implementation of information technology priority projects. Expected sources of funds for the projects will come from sale of acquired assets and funds generated from the Bank’s operations.
H. Significant Elements of Income or Loss
Significant elements of the consolidated net income of the PNB Group for the six months ended June 30, 2013 and 2012 came from its continuing operations.
I. Seasonal Aspects There are no seasonal aspects that had a material effect on the PNB Group’s financial condition and results of operations.

8
J. Other Bank Activities
• Products and Services launched by the Bank:
Home Flexi Loan Promo - is designed to finance asset acquisition and other personal-related expenditures borrowed against qualified/acceptable residential real estate properties. The proceeds of the loan may be used to address the following:
- Improvement of an existing residential home - Acquisition of furniture and fixtures and/or - home appliances - Equity payment for a residential property - Financing of travel & tour expenses - Acquisition of club shares - Other personal-related expenditures
D' Great Dollar Catch Promo - The promo is open to: (a) all new and existing US Dollar Checking Account/Savings Account (CASA) depositors, (individual, joint, corporate or government); and (b) all new Top Dollar placements with a term of 2 years and up. The promo period is from June 1, 2013 to September 30, 2013. PNB 2nd Hand Car Loan Program - PNB partnered with Auto Camp, one of the premiere used-car showrooms in Manila, for PNB’s 2nd Hand Car Loan promo. An intimate launch event was held at the Auto Camp showroom last February 15, 2013 for dealers and selected guests who were given a glimpse of the exciting freebies that came with the promo. Ms. Joy Dela Cruz, Auto Camp Owner together with Mr. Gilbert Wilwayco, President of Auto Camp Dealers sealed their partnership with PNB First Senior Vice President and Head of Consumer Finance Group, Elfren Antonio S. Sarte during the launch. Clients who applied and were approved for a 2nd Hand Car Loan from February 18 to April 16, 2013 received free Chattel Mortgage registration and a free Petron Gift Card worth P10,000.00. PNB’s partnership with Auto Camp is the first joint venture between both parties. Through this program, the PNB 2nd Hand Car Loan becomes the better choice for those wanting to purchase used cars. As an added service to clients, a satellite office located at JMT building, Ortigas branch was established. The office accepts and pre-processes loan applications and facilitates signing and approval of loan documents. Amazingly Cool Rates Promo (Home Loan) - For a minimum home loan amount of Php 500,000 applied within the promo period (May 7, 2013 to July 31, 2013) and subsequently approved, booked and released within ninety days after the end of the promo period, clients can enjoy these low rates.
- 5.25% (1-year fixed rate) - 6.75% (3-year fixed rate) - 7.25% (5-year fixed rate) - Low rates for other Tenors

9
• Other Activities
PNB closes LTNCD offering in record time Philippine National Bank (PNB) successfully raised PHP5 billion through a public offering of Long Term Negotiable Certificates of Time Deposits (LTNCDs). PNB was able to raise its intended volume in the morning of July 25, 2013, the same day it announced the start of the offer period. The public offering was one of the fastest offerings to achieve its target in the Philippine capital market. With an oversubscribed book early in its offering, the 5.5 year deposit was priced at 3.00%, the lowest ever coupon for an LTNCD instrument. The public offer period was supposed to run for three days, from July 25-29, but was closed the same morning as its launch due to strong demand. “We are overwhelmed by the confidence and support of our investors in PNB. This fundraising exercise will allow us to support our asset growth, and make us even more competitive in the banking industry.” PNB President and CEO Omar Mier said in a statement. HSBC Philippines President and CEO Wick Veloso, commented “Raising PHP5 billion just a few hours into its first offering day, and pricing the LTNCD at the lower end of pricing guidance is a testament to PNB’s franchise. We congratulate them on this remarkable achievement.” PNB merged with Allied Banking Corporation earlier this year, making PNB the fourth largest privately-owned bank in the Philippines, in terms of total assets. HSBC acted as sole lead arranger and bookrunner for the transaction. BSP Awards PNB as Top Commercial Bank in Generating Remittances from Overseas Filipinos For the second year in a row, the Bangko Sentral ng Pilipinas (BSP) awarded Philippine National Bank (PNB) as the Top Commercial Bank in Generating Remittances from Overseas Filipinos. The award was given last July 16, 2013 during the 2013 BSP Stakeholder’s Awards held at the Assembly Hall of BSP Complex in Manila. PNB also received a certificate of appreciation as one of the Hall of Fame Awardees, having been recognized as the Best Commercial Bank Respondent on Overseas Filipino Remittances for four straight years. PNB President Omar T. Mier and First Senior Vice President Benjamin S. Oliva received the award from BSP Governor and Chairman of the Monetary Board Amando M. Tetangco and Monetary Board Member Armando L. Santos. Having the largest overseas footprint among Philippine banks, PNB has built a very strong franchise in the remittance business to cater to the needs of Global Filipinos. Last January, PNB-Remittance Center Incorporated (PNB-RCI) in the U.S. launched the “Phone-in Remittance” service which allowed customers to send remittances using their phone 24/7. This service is available in 22 U.S. states covered by 32 PNB-RCI overseas branches.

10
PART II – OTHER INFORMATION
ITEM 1. Any information not previously reported in a report on SEC Form 17-C
There is nothing to report under this item. ITEM 2. Aging of Loans Receivables
The schedule of aging of loans receivables as required by Philippine Stock Exchange (PSE) in its Circular letter No. 2164-99 dated August 23, 2001 is shown on page 42 of this report.

11
PHILIPPINE NATIONAL BANK AND SUBSIDIARIESCONSOLIDATED STATEMENTS OF FINANCIAL POSITION(In Thousands)
31-Dec-12(As restated) 2/
ASSETSCash and Other Cash Items 8,371,272 5,599,088 Due from Bangko Sentral ng Pilipinas 119,468,596 37,175,399 Due from Other Banks 16,787,725 4,042,769 Interbank Loans Receivable 6,589,399 11,498,756 Securities Held Under Agreements to Resell 20,120,000 18,300,000 Financial Assets at Fair Value Through Profit or Loss 9,217,345 4,023,065 Available-for-Sale Investments 80,600,620 66,997,479 Loans and Receivables 238,679,416 144,707,509 Property and Equipment
At cost 1,486,361 937,075 At appraised value 21,479,550 15,566,650
Investments in an Associate 5,061 2,905,294 Investment Properties 18,792,971 14,478,348 Deferred Tax Assets 1,047,398 1,780,682 Goodwill 16,017,500 - Other Assets 4,709,698 2,178,637 TOTAL ASSETS 563,372,912 330,190,751
LIABILITIES AND EQUITYLIABILITIESDeposit Liabilities
Demand 99,058,423 28,152,296 Savings 275,858,739 192,793,260 Time 44,801,526 19,908,821
419,718,688 240,854,377 Financial Liabilities at Fair Value Through Profit or Loss 5,314,955 6,479,821 Bills and Acceptances Payable 7,047,186 13,076,901 Accrued Taxes, Interest and Other Expenses 5,787,139 3,914,290 Subordinated Debt 9,946,090 9,938,816 Income Tax Payable 166,682 149,050 Other Liabilities 32,083,956 17,285,251 TOTAL LIABILITIES 480,064,696 291,698,506 EQUITY ATTRIBUTABLE TO EQUITY HOLDERS OF THE PARENT COMPANYCapital Stock 43,448,337 26,489,837 Capital Paid in Excess of Par Value 26,499,909 2,037,272 Surplus Reserves 715,637 569,887 Surplus 12,383,172 7,266,067 Revaluation Increment on Land and Buildings 2,816,962 2,816,962 Accumulated Translation Adjustment (262,815) (992,620)Net Unrealized Gain (Loss) on Available-for-Sale Investments (3,363,998) 1,037,252 Cumulative amount of actuarial losses (OCI) (1,920,407) (781,900)Parent Company Shares Held by a Subsidiary
80,316,797 38,438,017 NON-CONTROLLING INTERESTS 2,991,419 54,228 TOTAL EQUITY 83,308,216 38,492,245 TOTAL LIABILITIES AND EQUITY 563,372,912 330,190,751
1/ Unaudited - - 2/ Audited (refer to Note 12 of Selected Notes to Consolidated Financial Statements)
6/30/2013 1/
- (4,740)

12
PHILIPPINE NATIONAL BANK AND SUBSIDIARIESCONSOLIDATED STATEMENTS OF INCOME 1/
(In Thousands, Except Earnings Per Share)
2013 2012 2013 2012INTEREST INCOME ONLoans and receivables 6,259,130 3,855,101 3,344,998 1,910,846Trading and investment securities 1,801,801 1,634,435 873,923 831,923Deposits with banks and others 614,375 317,930 364,307 124,278Interbank loans receivable 9,911 6,807 2,947 3,380
8,685,217 5,814,273 4,586,175 2,870,427INTEREST EXPENSE ONDeposit liabilities 2,048,941 1,505,793 989,973 712,657Bills payable and other borrowings 728,684 600,299 310,897 312,645
2,777,625 2,106,092 1,300,870 1,025,302NET INTEREST INCOME 5,907,592 3,708,181 3,285,305 1,845,125Service fees and commission income 1,534,536 1,027,096 772,094 506,045Service fees and commission expense 335,492 91,646 182,969 37,091NET SERVICE FEES AND COMMISSION INCOME 1,199,044 935,450 589,125 468,954OTHER INCOMETrading and investment securities gains - net 5,707,237 2,553,949 2,435,132 804,120Foreign exchange gains – net 760,750 831,784 719,935 417,202Net gain on sale or exchange of assets 354,522 291,585 187,296 45,653Miscellaneous 1,429,123 378,583 544,885 142,666TOTAL OPERATING INCOME 15,358,268 8,699,532 7,761,678 3,723,720
OPERATING EXPENSESCompensation and fringe benefits 2,915,799 1,899,506 1,573,518 972,378Taxes and licenses 885,241 618,196 437,341 269,437Provision for impairment, credit and other losses 609,606 510,470 429,558 151,493Occupancy and equipment-related costs 637,324 471,334 363,230 240,733Depreciation and amortization 577,360 371,917 280,825 160,694Miscellaneous 3,061,600 2,077,178 1,507,359 705,464TOTAL OPERATING EXPENSES 8,686,930 5,948,601 4,591,831 2,500,199INCOME BEFORE INCOME TAX 6,671,338 2,750,931 3,169,847 1,223,521PROVISION FOR INCOME TAX 1,371,818 410,143 709,926 172,059NET INCOME 5,299,520 2,340,788 2,459,921 1,051,462ATTRIBUTABLE TO:Equity Holders of the Parent Company 5,262,855 2,336,152 2,435,435 1,048,955Non-controlling Interests 36,665 4,636 24,486 2,507
5,299,520 2,340,788 2,459,921 1,051,462Basic/Diluted Earnings Per Share Attributable to Equity Holders of the Parent Company 4.85 3.53 2.24 1.57
1/ Unaudited - -
For the Six Months Ended June 30, For the Quarter Ended June 30,
13
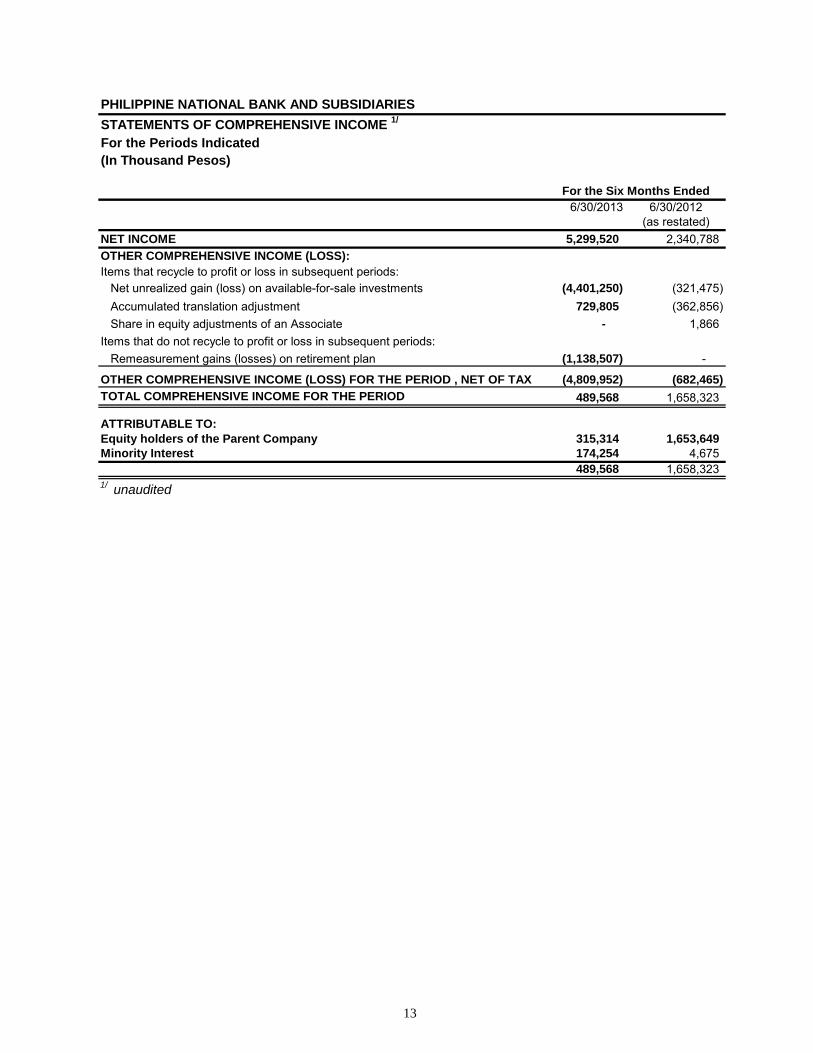
PHILIPPINE NATIONAL BANK AND SUBSIDIARIESSTATEMENTS OF COMPREHENSIVE INCOME 1/
For the Periods Indicated(In Thousand Pesos)
6/30/2013 6/30/2012(as restated)
NET INCOME 5,299,520 2,340,788 OTHER COMPREHENSIVE INCOME (LOSS):Items that recycle to profit or loss in subsequent periods:
Net unrealized gain (loss) on available-for-sale investments (4,401,250) (321,475) Accumulated translation adjustment 729,805 (362,856) Share in equity adjustments of an Associate - 1,866
Items that do not recycle to profit or loss in subsequent periods:Remeasurement gains (losses) on retirement plan (1,138,507) -
OTHER COMPREHENSIVE INCOME (LOSS) FOR THE PERIOD , NET OF TAX (4,809,952) (682,465) TOTAL COMPREHENSIVE INCOME FOR THE PERIOD 489,568 1,658,323
ATTRIBUTABLE TO:Equity holders of the Parent Company 315,314 1,653,649 Minority Interest 174,254 4,675
489,568 1,658,323 1/ unaudited
For the Six Months Ended

Philippine National BankStatement of Changes in Equity
(In Thousands)
Common Stock
Preferred Stock
Capital Paid in Excess of Fair Value
Surplus Reserves
Surplus (Deficit)
Revaluation Incement on Land and Buildings
Accumulated Translation Adjustment
Net Unrealized Gain/(Loss) on AFS
Share in Equity
Adjustment of Associate
Parent Company Shares Held
by a Subsidiary
Cumulative amount of actuarial losses Total
Non‐controlling interest Total Equity
Balance at January 1, 2013, as previously reported 26,489,837 ‐ 2,037,272 569,887 6,888,348 2,816,962 (992,620) 1,037,252 ‐ (4,740) ‐ 38,842,198 904,693 39,746,891 Effect of retroactive application of PAS 19 (Revised) ‐ ‐ ‐ ‐ 331,500 ‐ ‐ ‐ ‐ ‐ (781,900) (450,400) 22 (450,378) Effect of retroactive application of PFRS 10 ‐ ‐ ‐ ‐ 46,219 ‐ ‐ ‐ ‐ ‐ ‐ 46,219 (850,487) (804,268)
Balance at January 1, 2013, as restated 26,489,837 ‐ 2,037,272 569,887 7,266,067 2,816,962 (992,620) 1,037,252 ‐ (4,740) (781,900) 38,438,017 54,228 38,492,245 Total comprehensive income (loss) for the period ‐ ‐ ‐ ‐ 5,262,855 ‐ 729,805 (4,401,250) ‐ 4,740 (1,138,507) 457,643 174,254 631,897 Issuance of capital stocks 16,958,500 ‐ 24,462,637 ‐ ‐ ‐ ‐ ‐ ‐ ‐ ‐ 41,421,137 ‐ 41,421,137 Declaration of dividends ‐ ‐ ‐ ‐ ‐ ‐ ‐ ‐ ‐ ‐ ‐ ‐ ‐ ‐ Acquisition of subsidiaries ‐ ‐ ‐ ‐ ‐ ‐ ‐ ‐ ‐ ‐ ‐ ‐ 2,762,937 2,762,937 Transfer to surplus reserves ‐ ‐ ‐ 145,750 (145,750) ‐ ‐ ‐ ‐ ‐ ‐ ‐ ‐ ‐ Balance at June 30, 2013 43,448,337 ‐ 26,499,909 715,637 12,383,172 2,816,962 (262,815) (3,363,998) ‐ ‐ (1,920,407) 80,316,797 2,991,419 83,308,216
Balance at January 1, 2012, as previously reported 26,489,837 ‐ 2,037,272 560,216 2,246,213 2,816,962 (451,708) 742,343 6,795 (4,740) ‐ 34,443,190 531,247 34,974,437 Effect of retroactive application of PAS 19 (Revised) ‐ ‐ ‐ ‐ 320,965 ‐ ‐ ‐ ‐ ‐ (1,004,057) (683,092) (39) (683,131) Effect of deconsolidation ‐ ‐ ‐ ‐ ‐ ‐ ‐ ‐ ‐ ‐ ‐ ‐ (484,361) (484,361)
Balance at January 1, 2012, as restated 26,489,837 ‐ 2,037,272 560,216 2,567,178 2,816,962 (451,708) 742,343 6,795 (4,740) (1,004,057) 33,760,098 46,847 33,806,945 Total comprehensive income (loss) for the period ‐ ‐ ‐ ‐ 2,336,152 ‐ (362,856) (321,475) 1,866 ‐ 56,677 1,710,364 4,675 1,715,039 Declaration of dividends ‐ ‐ ‐ ‐ ‐ ‐ ‐ ‐ ‐ ‐ ‐ ‐ ‐ ‐ Transfer to surplus reserves ‐ ‐ ‐ 9,671 (9,671) ‐ ‐ ‐ ‐ ‐ ‐ ‐ ‐ ‐ Others ‐ ‐ ‐ ‐ ‐ ‐ ‐ ‐ ‐ ‐ ‐ ‐ ‐ ‐ Balance at June 30, 2012 26,489,837 ‐ 2,037,272 569,887 4,893,659 2,816,962 (814,564) 420,868 8,661 (4,740) (947,380) 35,470,462 51,522 35,521,984

PHILIPPINE NATIONAL BANK AND SUBSIDIARIESCONSOLIDATED STATEMENTS OF CASH FLOWS(In Thousands)
2012(As restated -
Note 2)CASH FLOWS FROM OPERATING ACTIVITIESIncome before income tax 6,671,338 2,750,931 Adjustments for:
Realized trading gain on available-for-sale investments (AFS) (5,467,297) (2,096,167) Depreciation and amortization 577,360 371,917 Gain (loss) on mark-to-market of derivatives 388,305 (6,490)Provision for impairment, credit and other losses 609,606 510,470 Net gain (loss) on sale or exchange of assets 354,522 291,585 Gain from step-up acquisition (140,958) - Amortization of premium (discount) on AFS investments 543,654 371,390 Gain on mark-to-market of financial liability designated at fair value through profit or loss (FVPL) (203,244) (170,172)Amortization of software costs 86,207 74,858 Amortization of transaction costs 13,328 9,820 Share in net income of an associate (9,958) (28,728)Dividend income (1,608) (5,418)Changes in operating assets and liabilities:
Decrease (increase) in amounts of:Financial assets at FVPL 1,414,908 1,219,097 Loans and receivables (2,845,558) (5,925,178)Other assets (96,443) (739,205)
Increase (decrease) in amounts of:Deposit liabilities 37,669,482 (14,368,695)Accrued taxes, interest and other expenses 122,747 1,460,535 Other liabilities (19,180) 662,362
Net cash generated from (used in) operations 39,667,211 (15,617,086)Income taxes paid (1,281,847) (401,812)Dividends received 1,608 5,418 Net cash provided by (used in) operating activities 38,386,972 (16,013,480)CASH FLOWS FROM INVESTING ACTIVITIESProceeds from sale of:
AFS investments 129,588,423 87,237,094 Investment properties 623,375 823,795 Property and equipment 86,139 51,423
Acquisitions of:AFS investments (124,117,939) (92,819,371)Property and equipment (222,180) (232,487)Software cost (58,918) (42,058)Cash acquired from merger 64,444,869 -
Net cash provided by (used in) investing activities 70,343,768 (4,981,603)CASH FLOWS FROM FINANCING ACTIVITIESSettlement of bills and acceptances payable (42,228,762) (31,155,961)Proceeds from bills and acceptances payable 32,719,002 29,571,378 Redemption of subordinated debt (4,500,000) - Issuance of subordinated debt - 3,500,000 Net cash provided by (used in) financing activities (14,009,760) 1,915,417 NET INCREASE (DECREASE) IN CASH ANDCASH EQUIVALENTSCASH AND CASH EQUIVALENTS ATBEGINNING OF PERIODCash and other cash items 5,599,088 5,404,110 Due from BSP 37,175,399 38,152,795 Due from other banks 4,042,769 6,423,981 Interbank loans receivable 11,498,756 17,097,648 Securities held under agreements to resell 18,300,000 18,300,000
76,616,012 85,378,534 CASH AND CASH EQUIVALENTS AT END OF PERIODCash and other cash items 8,371,272 4,152,256 Due from BSP 119,468,596 35,684,685 Due from other banks 16,787,725 4,394,782 Interbank loans receivable 6,589,399 13,067,145 Securities held under agreements to resell 20,120,000 9,000,000
171,336,992 66,298,868 OPERATIONAL CASH FLOWS FROM INTEREST ANDDIVIDENDSInterest paid 1,963,545 2,866,274 Interest received 7,293,716 5,277,958 Dividends received 1,608 5,418
Six Months Period Ended June 30
2013
94,720,980 (19,079,666)

16
PHILIPPINE NATIONAL BANK AND SUBSIDIARIES . SELECTED NOTES TO CONSOLIDATED FINANCIAL STATEMENTS 1) Accounting Policies and Methods
The accompanying consolidated financial statements of Philippine National Bank (PNB) and its Subsidiaries (the PNB Group) which comprise the consolidated statements of financial position as of June 30, 2013 and December 31, 2012 and the consolidated statements of income, statements of comprehensive income, statements of changes in equity and statements of cash flows for the six months ended June 30, 2013 and June 30, 2012 have been prepared in compliance with Philippine Financial Reporting Standards (PFRS). The December 31, 2012 consolidated statements of financial position and the consolidated statements of income, statements of comprehensive income, statements of changes in equity and statements of cash flows for the six months ended June 30, 2012 are based on the balances of PNB prior to the merger of PNB with Allied Banking Corporation (ABC) effective February 9, 2013. The same accounting policies and methods have been followed in the preparation of the accompanying financial statements, consistent with the 2012 Audited Financial Statements except for the new, amendments and improvements to PFRS which became effective as of January 1, 2013.
2) Merger with Allied Banking Corporation
• The respective shareholders of the PNB (the Parent Company) and Allied Banking
Corporation (ABC), representing at least two-thirds of the outstanding capital stock of both banks, approved the amended terms of the Plan of Merger of the two banks on March 6, 2012. The original plan of the merger which was effected via a share-for-share exchange was approved by the affirmative vote of ABC and the Parent Company’s respective shareholders, representing at least two-thirds of the outstanding capital stock of both banks, on June 24, 2008. Under the approved amended terms, the Parent Company will be the surviving entity. It will issue to ABC shareholders 130 Parent Company shares for every ABC common share and 22.763 Parent Company shares for every ABC preferred share. Merger and business combination are terms used interchangeably within the accompanying consolidated financial statements and have the same meaning.
On March 26, 2012, the Parent Company submitted to the BSP and PDIC applications for consent to the merger. On April 12, 2012, the application for the merger was filed with the Philippine SEC. The PDIC, the Monetary Board of the BSP and the Philippine SEC gave consent and approved the merger on July 25, 2012, August 2, 2012 and January 17, 2013, respectively. In addition, with respect to ABC’s overseas subsidiaries, the Parent Company has also filed notices in relation to the merger with various relevant foreign regulatory agencies; and as of February 9, 2013 had received all necessary approvals and complied with conditions to effectuate the merger.

17
On February 9, 2013, the Parent Company concluded its planned merger with ABC as approved and confirmed by the Board of Directors of the Parent Company and of ABC on January 22 and 23, 2013, respectively. The purchase consideration as of February 9, 2013, the acquisition date, amounted to P=41.5 billion which represents 423,962,500 common shares at the fair value of P=97.90 per share in exchange for the 100.00% voting interest in ABC at the share swap ratio of 130 PNB common shares for one ABC share and 22.763 PNB common shares for one ABC preferred share. The fair value of the shares is the published price of the shares of the Parent Company as of February 9, 2013. There are no contingent considerations arrangements as part of the merger. The Parent Company, the Acquirer, has elected to measure the non-controlling interests in ABC, the Acquiree, at their proportionate share in ABC’s net identifiable assets and liabilities. As at July 18, 2013, the Parent Company, is still in the process of finalizing the fair values of ABC’s net identifiable assets and liabilities and the total acquisition/transaction related costs. The merger of the Parent Company and ABC will enable the two banks to advance their long-term strategic business interests as they capitalized on their individual strengths and markets.
• On February 9, 2013, the Board of Directors approved the amendment of Article VII of the bank’s Amended Articles of Incorporation increasing the authorized capital stock by 500 Million common shares subject to Stockholders approval on May 28, 2013 Stockholders Meeting. The authorized capital stock of the Bank shall be Seventy Billion and Forty Pesos (P70,000,000,040.00) divided into One Billion Seven Hundred Fifty Million and One (1,750,000,001) Common Shares with a par value of Forty Pesos (P40.00) per share.
• The Board of Directors of PNB approved on February 9, 2013 the termination of the
Fund Management Agreement (FMA) between ABC and PNB Trust Department and the remittance to PNB of the net assets of the fund in view of the share swap of the ABC preferred shares to PNB common shares upon merger of the ABC and PNB on February 9, 2013.
• On September 21, 2012, the PNB Board approved and confirmed the change in the Core Banking System from Flexcube to Systematics. Prior to the February 9, 2013 merger, Fidelity International Resource Management, Inc. (“FIS”) (the vendor) conducted various strategic planning sessions to address the Systematics upgrade and migration plan.
The official kickoff meeting to commence the core banking upgrade and migration project was held on April 24, 2013. The project is divided into two phases: Phase 1 covers upgrade implementation of Systematics the former Allied Bank; Phase 2 pertains to the PNB Flexcube core banking system migration to Systematics.
Full migration to Systematics is expected to take place in two years.

18
3) Financial Risk Management
Compared with December 31, 2012, there have been no changes in the financial risk exposures that materially affect the financial statements of the Group as of June 30, 2013. The Group has exposures to the following risks from its use of financial instruments: (a) credit; (b) liquidity; and (c) market risks. The overall responsibility for the oversight of the Bank’s risk management process rests with the Board of Directors (BOD). The risk management processes of the subsidiaries are the separate responsibilities of their respective BOD. Previously, there were two (2) Board-level Committees on the oversight of the risk management processes namely, the Risk Oversight Committee for Operational Risk and Other Basel II Risks (formerly Risk Management Committee) and the Risk Oversight Executive Committee for Credit and Market risks. This has now been merged as the Risk Oversight Committee (ROC) effective February 2013. The Bank’s ALCO, chaired by the Bank’s President is the senior review and decision-making body for the management of all related market risks, interest rate risk and liquidity risk. The risk management function is embedded in all levels of the organization. The Risk Management Group is primarily responsible for the risk management functions to ensure that a robust organization is maintained. The Risk Management Group is independent from the business lines and is organized in 4 divisions: Credit Risk & BASEL Implementation Division, Market & ALM Division, Operations & Information Technology Security Division and Business Intelligence & Data Warehouse Division. Each division maintains basic policies for risk management applicable to the organization. These policies clearly define the kinds of risks to be managed, set forth the organizational structure and provide appropriate training necessary. The policies also provide for audits to measure the effectiveness and suitability of the risk management structure. In line with these basic policies, the group continues to implement the following risk management tools and reporting requirements to strengthen and enhance the sophistication of our risk management system and address the volatile risk environment. • Risk Management Assessment Review Sheet (RMARS) • Risk-based compliance testing commensurate with risk levels identified and regular
monitoring of the resolutions or regulatory findings of US Fed, MAS, FSA, etc. • Risk & Control Self Assessment (RCSA) • Loss Event Report (LER) • Business Continuity Management (BCM) • Daily Value-at-Risk Report (VAR) • Monthly Liquidity Gap (MCO) • Monthly repricing gap and Earnings at Risk (EAR) • Annual review of Product Manuals • Health Check Review, a periodic review of internal controls and compliance with the
Bank policies and procedures • Daily monitoring of account balances of overseas branches and subsidiaries with
Head Office (NOSTRO/VOSTRO) • Monthly review of temporary accounts • Credit Risk Dashboard • Internal Risk Rating • Stress Testing

19
• Monitoring of credit limits • Annual Loss Rate In the subsequent sections, each major risks are discussed accordingly as this applies to the process for the board approved enterprise risk management framework. Market Risk Price Risk in the Trading Portfolio The Bank’s trading positions are sensitive to changes in the market prices and rates. PNB is subject to trading market risk in its position taking activities for the fixed income, foreign exchange and equities markets. To calculate the risks in the trading portfolio, the Bank employs the Value at Risk (VAR) methodology with 99% confidence level and one holding period (equities and FX VAR) to ten day holding period for fixed income VAR. VAR limits have been established annually and exposures against the VAR limits are monitored on a daily basis. The VAR figures are back tested against actual (interest rates) and hypothetical profit and loss (FX and Equities) to validate the robustness of the VAR model. The Bank also employs the stop loss monitoring tool to monitor the exposure in the price risks. Stop loss limits are set up to prevent actual losses resulting from mark to market. To complement the VAR measure, the Bank performs stress testing and scenario analysis wherein the trading portfolios are valued under several market scenarios. Structural Market Risk Structural interest rate risk arises from mismatches in the interest profile of the Bank’s assets and liabilities. To monitor the structural interest rate risk, the Bank uses a re-pricing gap report wherein the repricing characteristics of its balance sheet positions are analyzed to come up with a repricing gap per tenor bucket. The total repricing gap covering the one-year period is multiplied by assumed change in interest rates based on observed volatility at 99% confidence level to obtain an approximation of the change in net interest earnings. Limits have been set on the tolerable level of earnings at risk. Compliance to the limit is monitored regularly.
Liquidity and Funding Risk Liquidity risk is generally defined as the current and prospective risk to earnings or capital arising from the Parent Company’s inability to meet its obligations when they fall due. Liquidity obligations arise from withdrawals of deposits, extension of credit, working capital requirements and repayment of other obligation. The Bank seeks to manage its liquidity through active management of liabilities, regular analysis of the availability of liquid asset portfolio as well as regular testing of availability of money market lines and repurchase facilities aimed to address any unexpected liquidity situations. The tools used for monitoring liquidity include gap analysis of maturities of relevant assets and liabilities reflected in the maximum cumulative outflow (MCO) report, as well as an analysis of sufficiency of liquid assets over deposit liabilities and regular monitoring of concentration risks in deposits by tracking accounts with large balances. The MCO focuses on a 12-month period wherein the 12-month cumulative outflow is compared to the acceptable MCO limit set by the Bank.

20
Credit Risk Credit Risk is defined as the potential risk that a bank borrower will fail to meet its obligations in accordance with agreed terms thus subjecting the Bank to financial loss. Sources of credit risk are: defaulting borrowers, counterparties, issuer, or guarantors. It arises any time bank funds are extended, committed, invested, or otherwise exposed through actual or implied contractual agreements, whether reflected on or off balance sheet. Credit Policies and Procedures All credit risk policies issued by the regulatory bodies (BSP, SEC, PDIC, BIR, etc.) automatically form part of the Bank’s board-approved risk policies. These risk policies reflect the Bank’s lending profile and focus on: (a) the risk tolerance and/or risk appetite: (b) the required return on asset that the Bank expects to achieve (c) the adequacy of capital for credit risk Credit Risk Functional Organization The credit risk functional organization of the Bank conforms to BSP regulations. This ensures that the risk management function should be independent of the business line. In order to maintain a system of “check and balance”, the Bank observes three primary functions involved in the credit risk management process: namely: (a) risk-taking personnel (b) risk management function; and (c) the compliance function. The risk-taking personnel are governed by a code of conduct for account officers and related stakeholders set to ensure maintenance of the integrity of the Bank’s credit risk management culture. Approving authorities are clearly defined in the board-approved Manual of Signing Authority (MSA). Credit Limit Structure The Bank adopts a credit limit structure (regulatory and internal limits) as quantitative measure of the risk tolerance duly approved by the Board. Breaches in limits are monitored via the monthly credit dashboard. Stringent Credit Evaluation Repayment capacity of prospective borrowers are evaluated using an effective internal risk rating model for corporate and MSME accounts and appropriate credit scoring program for consumers loans. These models are validated to determine its predictive ability. Reporting System Effective Management Information System (MIS) are in place and, at a minimum, has the capacity to capture accurate credit risk exposure/position of the Bank real time. A monthly credit dashboard is used as the reporting tool for appropriate and timely risk management process.

21
Remedial Management System Work-out system for managing problem credits are in place. Among others, these are renewals, extension of payment, restructuring, take-out of loans by other banks; and regular review of the sufficiency of valuation reserves. Event-driven stress testing Techniques are conducted to determine the payment capacity of affected borrowers’ accounts. A Rapid Portfolio Review program is in place to quickly identify possible problem credits on account of evolving events both domestic and global. Results of the stress testing shows minimum impact and have no material effect to Bank’s NPL ratio and CAR. Operational Risk People Risk In most reference books and articles, it is mentioned that the most dynamic of all sources of operational risk factors is people risk. Internal controls are often blamed for operational breakdowns, whereas the true cause of many operational losses can be traced to people failures. Every CEO has argued that people are the most important resource, yet the difficulty in measuring and modeling people risks has often led management to shy away from the problem when it comes to evaluating this aspect of operational risk. In PNB operational losses may be attributed to human error which can be brought about by inadequate training and management. This issue is being addressed through formal (continuously conducting trainings) or informal (monthly meetings and discussing issues at hand) means. These trainings also address the issue of relying on key performers instead of cross training each team member. Further, there is the risk of “non-fit” personnel being “forced” to occupy positions that they are not qualified for. Annual evaluation and the implementation of balanced scorecards are used to ensure that ill-fitted personnel are either re-trained, re-tooled and re-skilled to equip them better. Process Risk As in any organization, process risk can arise at any stage of the value chain. At PNB, we have sets of policies and procedures disseminated throughout the Bank in the form of circulars and manuals (i.e. Policy Manual, Operations Manual, Product Manual & Manual on Signing Authority) that defines the process. To monitor compliance with the processes, the Internal Audit Group as well as the various officers tasked with the review function do compliance checking. Formulation of new processes and review of existing processes is handled by the Systems & Methods Division of the Bank with the participation of the concerned offices to ensure that internal control measures are in place. This passes through the Operations Committee represented by heads of various sectors for approval. Information Technology Risk
The growing dependence of financial institutions on IT systems is a key source of operational risk. Data corruption problems, whether accidental or deliberate, have been sources of embarrassing and costly operational mistakes. The Bank’s Information

22
Technology Group has introduced risk mitigation measures, which include but is not limited to ensuring the existence of run sheets. These run sheets provide guidance as to the operational requirements of specific systems.
Losses may also result from a simple change in program, which end up being incorrectly tested prior to cut-over to production. The process for system cut-over, from development to testing to production, is always subject for review. Each review reduces the probability of errors being introduced into the production version. Further, the sector’s strict compliance to the system roll-out life cycle can very well cut these losses.
In addition, more often, only IT people (who are sometimes far removed from the banking business) have a full understanding of the technology/technical aspects behind many new banking systems. Those in the business may not have a thorough understanding of how IT can enable their processes, make them more efficient. This then may contribute to systems not being utilized properly, albeit wrongly or inadequately utilized. To close this gap, meetings are conducted continuously.
The bank has institutionalized and implemented the IT Governance Committee which is composed of members of the senior management team, who discuss the monthly ITG Dashboard prior to it being presented to the Risk Oversight Committee. Among the topics commonly discussed are as follows:
• Bank’s IT Strategic Plan • Incident Reporting • Business Continuity Management • Major IT Projects • Enterprise Project Management
Further, the bank has formalized the Project Implementation Process for defined systems implementation to include among others the creation of a Project Steering Committee to oversee the project’s progress and to ensure that the project’s objectives are achieved.
Business Intelligence This division manages the design and implementation of enterprise data warehouse as the single source of truth for reporting, analytics and implementation of various decision support systems. It ensures the enterprise wide data quality management process; formulates Statistical and Database Management policies and procedures; assists other Divisions/Units of the Risk Management Group (RMG) in managing the group’s database(s), statistical model development & calibration, and database analysis. Further, the benefits of the Enterprise Data Warehouse Global Banking Data Model (EDW-GDM) is now evident as a single source of information for the other business groups particularly, Retail Banking Group, Institutional Banking Group and Corporate Credit Group. The EDW-GDM continuously provides dashboards for business managers’ decision support. The EDW-GDM for Treasury Group is currently being developed. It is the intent that the complete model for the Enterprise Data Warehouse will provide a whole picture of the bank’s balance sheet with drill down to the individual transactions.

23
4) Financial Instruments All financial instruments are initially recognized at fair value. Except for financial instruments at FVPL, the initial measurement of financial instruments includes transaction costs. The Group classifies its financial assets in the following categories: financial assets at FVPL, HTM investments, AFS investments, and loans and receivables. The classification depends on the purpose for which the investments were acquired and whether they are quoted in an active market. Management determines the classification of its investments at initial recognition and, where allowed and appropriate, re-evaluates such designation at every reporting date. Financial liabilities are classified into financial liabilities at FVPL and other financial liabilities at amortized cost. As of June 30, 2013 and December 31, 2012, the Group has no HTM investments.
5) Fair Value Measurement The Group has assets and liabilities that are measured at fair value on a recurring and non-recurring basis in the consolidated statement of financial position after initial recognition. Recurring fair value measurements are those that another PFRS requires or permits to be recognized in the consolidated statement of financial position at the end of each reporting period. These include financial assets and liabilities at FVPL, AFS investments and investment properties. Non-recurring fair value measurements are those that another PFRS requires or permits to be recognized in the consolidated statement of financial position in particular circumstances. These include land and buildings measured at revalued amount. The Group uses the following hierarchy for determining and disclosing the fair value of assets and liabilities by valuation technique. These levels are based in the inputs that are used to determine the fair value and can be summarized in: Level 1: quoted prices (unadjusted) in active markets for identical assets or liabilities that the entity can access at the measurement date Level 2: inputs other than quoted prices included within Level 1 that are observable for the asset or liability, either directly or indirectly Level 3: inputs are unobservable inputs for the asset or liability

24
The Group held the following assets and liabilities measured at recurring and non-recurring fair value measurements and their corresponding level in fair value hierarchy:
June 30, 2013 Level 1 Level 2 Level 3 Total
Recurring Fair Value Measurements Financial Assets Financial assets at FVPL:
Held-for-trading P=4,621,081 P=314 P=– P=4,621,395 Designated at FVPL 2,108,218 2,487,732 4,595,950
P=6,729,299 P=314 P=2,487,732 P=9,217,345 AFS investments: P=80,600,620 P=– P=– P=80,600,620 P=80,600,620 P=– P=– P=80,600,620 Financial Liabilities Financial liabilities at FVPL: Designated at FVPL P= 2,103,100 P=– P=2,487,732 P=4,590,832 Derivative liabilities 723,823 300 – 724,123 P=2,826,923 P=300 P=2,487,732 P=5,314,955 Non-Financial Assets Investment property*
Land P=– P=23,867,325 P=– P=23,867,325 Buildings and improvements – 3,693,447 – 3,693,447
P=– P=27,560,772 P=– P=27,560,772 Non-Recurring Fair Value Measurements Property and equipment
Land P=– P=14,549,782 P=– P=14,549,782 Buildings – 6,929,768 – 6,929,768
P=– P=21,479,550 P=– P=21,479,550 P=– P=49,040,322 P=– P=49,040,322*Based on the fair values from appraisal reports different from carrying amount which are at cost.
December 31, 2012 Level 1 Level 2 Level 3 Total
Recurring Fair Value Measurements Financial Assets Financial assets at FVPL:
Held-for-trading P=2,379,852 P=395,457 P=– P=2,775,309 Designated at FVPL – 1,247,756 – 1,247,756
P=2,379,852 P=1,643,213 P=– P=4,023,065 AFS investments: P=65,057,234 P=1,940,245 P=– P=66,997,479 P=65,057,234 P=1,940,245 P=– P=66,997,479 Financial Liabilities Financial liabilities at FVPL: Designated at FVPL P=– P=– P=6,196,070 P=6,196,070 Derivative liabilities – 283,751 – 283,751 P=– P=283,751 P=6,196,070 P=6,479,821 The following table presents a comparison of the carrying amounts and fair values of assets and liabilities except those where carrying values approximate or equals their fair values (amounts in thousands):

25
June 30, 2013 December 31, 2012
Carrying
Value Fair Market
Value Carrying
Value Fair Market
Value Financial Assets Loans and Receivables Receivables from customers: P= 221,314,057 P= 225,048,840 P=126,461,612 P=128,324,420 Unquoted debt securities 11,347,718 12,546,271 3,859,268 5,131,586Financial Liabilities Financial liabilities at amortized cost Deposit liabilities: Time 44,801,526 44,954,680 19,908,821 20,134,885 Subordinated debt 9,946,090 10,968,660 9,938,816 10,956,745
The above assets and liabilities are measured at Level 2. The methods and assumptions used by the Group in estimating the fair value of the assets and liabilities are: Cash equivalents - Carrying amounts approximate fair values due to the relatively short-term maturity of these investments. Debt securities - Fair values are generally based upon quoted market prices. If the market prices are not readily available, fair values are obtained from independent parties offering pricing services, estimated using adjusted quoted market prices of comparable investments or using the discounted cash flow methodology. Equity securities - fair values of quoted equity securities are based on quoted market prices. While fair values of unquoted equity securities are the same as the carrying value since the fair value could not be reliably determined due to the unpredictable nature of future cash flows and the lack of suitable methods of arriving at a reliable fair value. Segregated fund assets and liabilities under financial assets and liabilities designated at FVPL - The fair values of equity and debt securities under level 1 of the fair value hierarchy are determined by reference to quoted market bid prices, at the close of business reporting date, or the last reporting date. The fair values of equity-linked notes under level 3 of the fair value hierarchy are determined by running simulations on the underlying indices to project the possible payouts of the instruments. Instruments included in Level 3 include the subordinated debt and segregated fund assets and liabilities for which there is currently no active market. In applying the discounted cash flow analysis to determine the fair value of the subordinated debt and segregated fund assets and liabilities designated at FVPL, the Group used discount rates ranging from 1.25% to 1.32% and from 1.38% to 3.63% as of June 30, 2013 and December 31, 2012, respectively. Derivative instruments - Fair values are estimated based on quoted market prices or acceptable valuation models. Loans and receivables - For loans with fixed interest rates, fair values are estimated by discounted cash flow methodology, using the Group’s current market lending rates for similar types of loans. For loans with floating interest rates, with repricing frequencies on a quarterly basis, the Group assumes that the carrying amount approximates fair value. Where the repricing frequency is beyond three months, the fair value of floating

26
rate loans is determined using the discounted cash flow methodologies. Other receivables do not have readily available quoted market prices. These are reported at cost and are not significant in relation to the Group’s total loan and receivable portfolio. The discount rate used in estimating the fair value of loans and receivables ranges from 0.25% to 9.25% and from 0.30% to 9.25% as of June 30, 2013 and December 31, 2012 for peso-denominated receivables, respectively, and 3.25% both as of June 30, 2013 and December 31, 2012, for foreign currency-denominated receivables. Liabilities - Except for time deposit liabilities and subordinated debt, the carrying values approximate fair values due to either the presence of a demand feature or the relatively short-term maturities of these liabilities. Time deposit liabilities and subordinated debt including those designated at FVPL - Fair value is determined using the discounted cash flow methodology. The discount rate used in estimating the fair values of the subordinated debt and time deposits ranges from 0.23% to 4.70% and from 1.38% to 3.63% as of June 30, 2013 and December 31, 2012, respectively. As of June 30, 2013 and December 31, 2012, there were no transfers between Level 1 and Level 2 fair value measurements, and no transfers into and out of level 3 fair value measurements. The following table shows a reconciliation of the beginning and closing amount of Level 3 financial assets and liabilities which are recorded at fair value of the Group:
June 30,2013
(Six Months)
December 31,2012
(One Year) Financial assets Balance at beginning of period P=– P=– Add acquisition arising from business combination 2,755,232 – Add total gain/(losses) recorded in profit or loss (267,500) – Balance at end of period P=2,487,732 – Financial liabilities Balance at beginning of period P=6,196,070 6,479,170 Redemption (6,196,070) – Add acquisition arising from business combination 2,755,232 – Less total gain recorded in profit and loss (267,500) (283,100)Balance at end of period P=2,487,732 P=6,196,070
The same methods and assumptions have been followed by the PNB Group in estimating the fair value of the financial instruments consistent with the 2012 Audited Financial Statement. These are: Cash equivalents - Carrying amounts approximate fair values due to the relatively short-term maturity of these investments. Debt securities - Fair values are generally based upon quoted market prices. If the market prices are not readily available, fair values are obtained from independent parties offering pricing services, estimated using adjusted quoted market prices of
27
comparable investments or using the discounted cash flow methodology. Equity securities - fair values of quoted equity securities are based on quoted market prices. While fair values of unquoted equity securities are the same as the carrying value since the fair value could not be reliably determined due to the unpredictable nature of future cash flows and the lack of suitable methods of arriving at a reliable fair value. Loans and receivables - For loans with fixed interest rates, fair values are estimated by discounted cash flow methodology, using the Group’s current market lending rates for similar types of loans. For loans with floating interest rates, with repricing frequencies on a quarterly basis, the PNB Group assumes that the carrying amount approximates fair value. Where the repricing frequency is beyond three months, the fair value of floating rate loans is determined using the discounted cash flow methodologies. Liabilities - Except for subordinated notes, the carrying values approximate fair values due to either the presence of a demand feature or the relatively short-term maturities of these liabilities. Derivative instruments - Fair values are estimated based on quoted market prices or acceptable valuation models. Subordinated debt including designated at FVPL - Fair value is determined using the discounted cash flow methodology.
6) Issuance of Subordinated Notes
A. Issuance of Tranche 2 P=3.5 Billion Subordinated Notes
The Parent Company issued on May 9, 2012 Tranche 2 of its Unsecured Subordinated Notes worth P3.5 billion, eligible as Tier 2 Capital, due in 2022 and callable in 2017. This comprises the second tranche of the P10 billion worth of Unsecured Subordinated Notes which the Bank is authorized to issue pursuant to the Monetary Board approval. The initial tranche of the Notes in the aggregate principal amount of P6.5 billion was issued on June 15, 2011.
The Tranche 2 Notes will bear a fixed interest at the rate of 5.875% per annum and shall be payable quarterly in arrears until Maturity Date. Proceeds of the issuance will be used to finance asset growth and further enhance the Bank's capital base.
B. Issuance of 6.75% P=6.5 Billion Subordinated Notes
On May 15, 2011, the Parent Company’s BOD approved the issuance of unsecured subordinated notes of P=6.5 billion that qualify as Lower Tier 2 capital.
The Parent Company issued P=6.5 billion, 6.75% subordinated notes (the 2011 Notes) due in 2021, pursuant to the authority granted by the BSP to the Bank on May 27, 2011. EIR on this note is 6.94%.
28
Among the significant terms and conditions of the issuance of such 2011 Notes are:
a. Issue price at 100.00% of the principal amount;
b. The 2011 Notes bear interest at the rate of 6.75% per annum from and including June 15, 2011 to but excluding June 15, 2021. Interest will be payable quarterly in arrears on the 15th of September, December, March and June of each year, commencing on June 15, 2011. Unless the 2011 Notes are previously redeemed, at their principal amount on maturity date or June 15, 2021. The stepped-up interest will be payable quarterly in arrears on 15th of September, December, March and June of each year, commencing on September 15, 2011;
c. The 2011 Notes constitute direct, unconditional, unsecured and subordinated obligations of the Parent Company and at all times rank pari passu without preference among themselves and at least equally with all other present and future unsecured and subordinated obligations of the Parent Company;
d. The Parent Company may redeem the 2011 Notes in whole but not in part at a redemption price equal to 100.00% of the principal amount together with accrued and unpaid interest on the day following the last day of the fifteenth (15th) interest period from issue date, subject to the prior consent of the BSP and the compliance by the Bank with the prevailing requirements for the granting by the BSP of its consent thereof. The 2011 Notes may not be redeemed at the option of the noteholders; and
e. Each noteholder, by accepting the 2011 Notes, irrevocably agrees and acknowledges that it may not exercise or claim any right of set-off in respect of any amount owed by the Parent Company arising under or in connection with the 2011 Notes.
C. Redemption of Subordinated Note • On March 6, 2013, the Parent Company exercised its call option and redeemed the
P4.50 billion, 7.13% Subordinated Notes due on 2018 issued by ABC. • On June 20, 2013, the Parent Company exercised its Call Option on its P=6.0 billion
8.50% Unsecured Subordinated Notes due on June 18, 2018 amounting to P=5.82 billion (Series A) and P=0.18 billion (Series B) in accordance with the terms and conditions of the Unsecured Subordinated Notes issued on June 19, 2008. The notes were redeemed at face value and no gain or loss was recognized on the date of settlement.
7) Issuance of Long-term Negotiable Certificates of Time Deposits (LTNCDs) A. Issuance of 5.18% P=3.10 Billion LTNCD
On November 18, 2011, the Parent Company issued P=3.10 billion worth of LTNCDs which will mature on February 17, 2017.

29
Among the significant terms and conditions of the LTNCDs are: a. Issue price at 100.00% of the face value of each LTNCD. b. The LTNCDs bear interest at the rate of 5.18% per annum from and including the
issue date, up to and excluding the call option date or the maturity date. Interest will be payable quarterly in arrears on the 17th of February, May, August and November of each year, commencing on February 17, 2012.
c. The Parent Company may redeem the LTNCDs in whole but not in part at a
redemption price equal to 100.00% of the principal amount together with accrued and unpaid interest before maturity date on any interest payment date. The LTNCDs may not be redeemed at the option of the holders.
d. The LTNCDs will constitute direct, unconditional, unsecured and unsubordinated
obligations of the Parent Company. The LTNCDs will at all times rank pari passu and without any preference among themselves, and at least pari passu with all other direct, unconditional, unsecured and unsubordinated obligations of the Parent Company, except for any obligation enjoying a statutory preference or priority established under Philippine laws.
e. Each Holder, by accepting the LTNCDs, irrevocably agrees and acknowledges that:
(a) it may not exercise or claim any right of set-off in respect of any amount owed to it by the Parent Company arising under or in connection with the LTNCDs; and (b) it shall, to the fullest extent permitted by applicable law, waive and be deemed to have waived all such rights of set-off.
B. Issuance of 6.50% P=3.25 Billion LTNCD
On March 25, 2009, the Parent Company issued P=3.25 billion worth of LTNCDs which will mature on March 31, 2014. Among the significant terms and conditions of the LTNCDs are: a. Issue price at 100% of the face value of each LTNCD. b. The LTNCDs bear interest at the rate of 6.50% per annum from and including the
issue date, up to and excluding the early redemption date or the maturity date. Interest will be payable quarterly in arrears on the 19th of March, June, September and December of each year, commencing on March 19, 2009.
c. The Parent Company may redeem the LTNCDs in whole but not in part at a
redemption price equal to 100% of the principal amount together with accrued and unpaid interest before maturity date on any interest payment date. The LTNCDs may not be redeemed at the option of the holders.
d. The LTNCDs will constitute direct, unconditional, unsecured and unsubordinated
obligations of the Bank. The LTNCDs will at all times rank pari passu and without any preference among themselves, and at least pari passu with all other direct, unconditional, unsecured and unsubordinated Peso-denominated obligations of the

30
Parent Company, present and future, other than obligations mandatorily preferred by law.
e. Each Holder, by accepting a LTNCDs, irrevocably agrees and acknowledges that: (a)
it may not exercise or claim any right of set-off in respect of any amount owed to it by the Parent Company arising under or in connection with the LTNCDs; and (b) it shall, to the fullest extent permitted by applicable law, waive and be deemed to have waived all such rights of set-off.
C. Issuance of 7.00% P=3.50 Billion LTNCD On October 22, 2009, ABC issued P3.5 billion Long Term Negotiable Certificate of Time Deposit with an interest rate of 7.00% per annum which shall be payable quarterly, commencing on January 23, 2010 and is included under time deposit. The LTNCD is insured with PDIC and will mature on October 23, 2014.
8) Segment Information
Business Segments The Group’s operating businesses are determined and managed separately according to the nature of services provided and the different markets served with each segment representing a strategic business unit. The Group’s business segments follow: Retail Banking - principally handling individual customer’s deposits, and providing consumer type loans, credit card facilities and fund transfer facilities; Corporate Banking - principally handling loans and other credit facilities and deposit accounts for corporate and institutional customers; and Treasury - principally providing money market, trading and treasury services, as well as the management of the Group’s funding operations by use of T-bills, government securities and placements and acceptances with other banks, through treasury and wholesale banking. Other Segments - include but not limited to insurance, leasing, remittances and other support services. Other operations of the Group comprise of the operations and financial control groups. Transactions between segments are conducted at estimated market rates on an arm’s length basis. Interest is credited to or charged against business segments based on a pool rate which approximates the marginal cost of funds. For management purposes, business segment report is done on a quarterly basis. Business segment information provided to the board of directors, chief operating decision maker (CODM) is based on the Regulatory Accounting Principles (RAP) submitted to the BSP in compliance with the reportorial requirements under the Financial Reporting Package (FRP) for banks, which differ from PFRS. Significant differences arose from the manner of provisioning for impairment and credit losses and measurement of investment properties. The report submitted to CODM represents only

31
the results of operation for each of the reportable segment. Segment assets are those operating assets that are employed by a segment in its operating activities and that either directly attributable to the segment or can be allocated to the segment on a reasonable basis. Segment liabilities are those operating liabilities that result from the operating activities of a segment and that either are directly attributable to the segment or can be allocated to the segment on a reasonable basis. The Group has no significant customer which contributes 10.00% or more of the consolidated revenue. Business segment information of the PNB Group follows:
Retail BankingCorporate Banking Treasury Others
Adjustments and Eliminations* Total
RevenuesInterest income 1,145,437 5,178,489 2,130,456 259,128 (28,293) 8,685,217 Interest expense 1,558,284 362,193 897,223 7,464 (47,539) 2,777,625 Net interest margin (412,847) 4,816,297 1,233,233 251,664 19,246 5,907,592 Other income 160,435 814,224 6,555,377 2,018,504 232,653 9,781,193 Other expenses 1,711,743 1,651,528 199,521 2,603,656 174,239 6,340,687 Segment result (1,964,155) 3,978,992 7,589,089 (333,487) 77,660 9,348,098
Inter‐segment imputed income/(imputed cost) 2,246,112 (1,200,265) (1,045,846) ‐ ‐ ‐ Imputed cost ‐ ‐ ‐ ‐ ‐ Segment result to third party 281,957 2,778,727 6,543,242 (333,487) 77,660 9,348,098
Unallocated expenses 2,681,735Net income before share in net income of an associate and income tax 6,666,363
Share in net income of an associate 4,975Net income before income tax 6,671,338Income tax 1,371,818Net income 5,299,520Non‐controlling interest 36,665
Net income for the year attributable to equity holders of the Parent Company 5,262,855Other InformationSegment assets 259,459,270 182,926,327 283,800,722 81,888,365 (247,902,150) 560,172,533 Unallocated assets 3,200,379 Total assets 563,372,912
Segment liabilities 1,026,144,096 (57,097,644) (262,338,528) (28,861,031) (238,902,619) 438,944,273 Unallocated liabilities 41,120,423 Total liabilities 480,064,696 Other Segment InformationCapital expenditures 198,517 19,111 723 3,829 – 222,181 Unallocated capital expenditures ‐ Total capital expenditures 222,181 Depreciation and amortization 89,954 106,863 3,550 187,444 4,667 392,477 Unallocated depreciation and amortization 184,883 Total depreciation and amortization 577,360 Provision for (reversal of) impairment and credit los 110,202 273,722 (275) 204,310 21,647 609,606
* The eliminations and adjustments column represent the RA P to PFRS adjustments
30‐Jun‐13

32
Geographical Segments
Although the PNB Group’s businesses are managed on a worldwide basis, the PNB Group operates in five principal geographical areas of the world. The Philippines is the home country of the Parent Company, which is also the main operating company. The PNB Group offers a wide range of financial services and most of the remittance services are managed and conducted in Asia, Canada, USA and United Kingdom.
The distribution of the PNB Group’s gross revenue by geographical market follows:
Six Months Ended 6/30/2013 6/30/2012 (In Thousand Pesos) Philippines P 17,573,229 P 10,140,324 Canada and the United States 259,466 306,077 Asia (excluding Philippines) 564,383 382,937 United Kingdom 65,804 63,604 Other European Countries 8,503 4,328 P 18,471,385 P 10,897,270
Retail Banking Corporate Banking Treasury OthersAdjustments and Eliminations* Total
Interest income 601,260 3,384,686 1,538,252 96,730 193,345 5,814,273 Interest expense 1,057,659 228,628 847,097 964 (28,256) 2,106,092 Net interest margin (456,399) 3,156,058 691,155 95,766 221,601 3,708,181 Other income 441,401 611,311 3,009,441 1,013,639 (21,523) 5,054,269 Other expenses 1,300,549 416,092 742,912 838,965 (275,313) 3,023,205
Segment result (1,315,547) 3,351,277 2,957,684 270,440 475,391 5,739,245 Inter‐segmentImputed income 2,140,486 – – – – 2,140,486 Imputed cost – (1,032,090) (1,108,396) – – (2,140,486)Segment result to third party 824,939 2,319,187 1,849,288 270,440 475,391 5,739,245 Unallocated expenses 3,017,042 Net income before share in net income of an associate and income tax 2,722,203 Share in net income of an associate 28,728 Net income before income tax 2,750,931 Income tax 410,143 Net income 2,340,788 Non‐controlling interest 4,636 Net income for the year attributable to equity holders of the Parent Company 2,336,152
Other Segment InformationCapital expenditures 335,818 3,312 3,078 117,134 – 459,341
Depreciation and amortization 74,256 74,979 3,107 37,400 ‐ 189,742
Unallocated depreciation and amortization 182,175 Total depreciation and amortization 371,917 Provision for (reversal of) impairment, credit and other losses (52,418) 19,454 638,571 2,155 (97,292) 510,470
*The eliminations and adjustments column mainly represent the RAP to PFRS adjustments.
Retail Banking Corporate Banking Treasury OthersAdjustments and Eliminations* Total
Segment assets 50,745,189 95,365,478 147,433,116 38,395,849 ‐4,754,067 327,185,565Unallocated assets 3,005,186Total assets 330,190,751Segment liabilities 205,217,147 32,452,570 40,985,859 16,570,501 ‐6,489,036 288,737,041Unallocated liabilities 2,961,465Total liabilities 291,698,506
*The eliminations and adjustments column mainly represent the RAP to PFRS adjustments.
Six Months Ended June 30, 2012 (As restated)
As of December 31, 2012 (As restated)

33
9) Commitments and Contingent Liabilities The following is a summary of various commitments and contingent accounts as of June 30, 2013 and December 31, 2012 at their equivalent peso contractual amounts: 6/30/13 12/31/12
(In Thousand Pesos)
Trust department accounts P 109,856,771 P 55,976,479 Deficiency claims receivable 11,794,819 6,309,340 Credit card lines 10,708,863 - Outstanding guarantees issued 1,282,163 628,422 Inward bills for collection 500,999 140,548 Outward bills for collection 463,225 105,029 Unused commercial letters of credit 59,559 36,096 Confirmed export letters of credit 81,312 78,126 Items held as collateral - 244 Other contingent accounts 539,874 41,317
10) Material Contingencies
In the normal course of business, the PNB Group makes various commitments and incurs certain contingent liabilities that are not presented in the financial statements including several suits and claims which remain unsettled. No specific disclosures on such unsettled assets and claims are made because any such specific disclosures would prejudice the PNB Group’s position with the other parties with whom it is in dispute. Such exemption from disclosures is allowed under PAS 37, Provisions, Contingent Liabilities and Contingent Assets. The PNB Group and its legal counsel believe that any losses arising from these contingencies which are not specifically provided for will not have a material adverse effect on the financial statements.
11) Earnings Per Share
The earnings per share of the PNB Group, attributable to equity holders of the Parent Company, are calculated as follows: Six Months Ended
6/30/2013 6/30/2012 (as restated)
a. Net Income attributable to equity holders of the Parent Company (in thousand pesos) 5,262,855 2,336,152 Less income attributable to convertible Preferred stocks classified as equity (in thousand pesos)
-
-
b. Net income attributable to common shareholders 5,262,855 2,336,152 c. Weighted average number of common shares for basic earnings per share (in thousands) 1,086,208 662,246 d. Effect of dilution: Convertible preferred shares - - e. Adjusted weighted average number of Common shares of diluted income per share (in thousands)
1,086,208 662,246
f. Basic income per share (b/c) P 4.85 P 3.53 g. Diluted income per share (a/e) 4.85 3.53

34
12) Transition to New and Amended Philippine Financial Reporting Standards and Interpretations effective starting January 1, 2013
The accounting policies adopted are consistent with those of the previous financial year except for the following new, amendments and improvements to PFRS which became effective as of January 1, 2013. Except as otherwise indicated, these changes in the accounting policies did not have any significant impact on the financial position or performance of the Group: New and Revised Standards and Interpretations • PFRS 11, Joint Arrangements
The Parent Company and Eton Properties Philippines, Inc. (EPPI) signed two Joint Venture Agreement (JVA) for the development of two properties under ‘Real estate under joint venture (JV) agreement’ by the Parent Company with book values of P=1.2 billion. These two projects are among the Parent Company’s strategies in reducing its non-performing assets. The Parent Company contributed the aforementioned properties into the JV as approved by BSP. EPPI, on the other hand, contributed its resources and technical expertise for the completion of the said JV. The Parent Company is prohibited to contribute funds for the development of the JV. Hence, there are no receivables from each party with respect to the JV. Income from the sale of the properties under the JV will be shared by the Parent Company and EPPI in accordance with the terms of the JVA. This JVA does not fall as joint venture arrangement under PFRS 11.
• PAS 27, Separate Financial Statements (as revised in 2011) • PAS 28, Investments in Associates and Joint Ventures (as revised in 2011) Improvements to PFRSs (2009-2011 cycle) • PFRS 1, First-time Adoption of PFRS - Borrowing Costs • PAS 1, Presentation of Financial Statements - Clarification of the requirements for
comparative information • PAS 16, Property, Plant and Equipment - Classification of servicing equipment • PAS 32, Financial Instruments: Presentation - Tax effect of distribution to holders of
equity instruments • PAS 34, Interim Financial Reporting - Interim financial reporting and segment
information for total assets and liabilities PFRS 7, Financial instruments: Disclosures - Offsetting Financial Assets and Financial Liabilities The Group disclosed the requirements of the amendments regarding the information about rights of set-off and related arrangements (such as collateral agreements). The new disclosures are required for all recognized financial instruments that are set off in accordance with PAS 32. These disclosures also apply to recognized financial instruments that are subject to an enforceable master netting arrangement or ‘similar agreement’, irrespective of whether they are set-off in accordance with PAS 32.

35
The amendments to PFRS 7 effective January 1, 2013 require the Group to disclose information about rights of offset and related arrangements (such as collateral posting requirements) for financial instruments under an enforceable master netting agreements or similar arrangements.
Required disclosures which the Group retrospectively applied are detailed below:
Financial assets
June 30, 2013
[a] [b] [c] [d] [e]
Financial assets recognized at
end of reporting period by type
Gross carrying amounts (before
offsetting)
Gross amountsoffset in
accordance withthe offsetting
criteria
Net amount presented in
statements of financial position
[a-b]
Effect of remaining rights of set-off (including rights to set
off financial collateral) that do not meet PAS 32 offsetting
criteria
Net exposure[c-d]
Financial instruments
Fair value of financial collateral
Derivative assets P=20,000,155 P=19,574,108 P=426,047 P=– P=– P=426,047 Securities held under agreements to resell 20,120,000 – 20,120,000 – 20,273,741 – Total P=40,120,155 P=19,574,108 P=20,546,047 P=– P=20,273,741 P=426,047
December 31, 2012
[a] [b] [c] [d] [e]
Financial assets recognized at
end of reporting period by type
Gross carrying amounts (before
offsetting)
Gross amountsoffset in
accordance with
the offsetting criteria
Net amount presented in statements of
financial position
[a-b]
Effect of remaining rights of set-off (including rights to set
off financial collateral) that do not meet PAS 32 offsetting
criteria
Net exposure [c-d]
Financial instruments
Fair value of financial collateral
Derivative assets P=13,918,337 P=13,526,872 P=391,465 P=295,260 P=– P=96,205 Securities held under agreements to resell 18,300,000 – 18,300,000 – 18,874,894 – Total P=32,218,337 P=13,526,872 P=18,691,465 P=295,260 P=18,874,894 P=96,205
Financial liabilities
June 30, 2013 [a] [b] [c] [d] [e]
Financial assets recognized at
end of reporting period by type
Gross carrying amounts (before
offsetting)
Gross amounts offset in
accordance with
the offsettingcriteria
Net amount presented in
statements of financial position
[a-b]
Effect of remaining rights of set-off (including rights to set
off financial collateral) that do not meet PAS 32 offsetting
criteria
Net exposure [c-d]
Financial instruments
Fair value of financial collateral
Derivative liabilities P=28,998,463 P=28,274,340 P=724,123 P=– P=– P=724,123 Securities sold under agreements to repurchase** – – – – – – Bills payable 201,125 – 201,125 – 2,524,774 – Total P=36,425,422 P=28,274,340 P=925,248 P=– P=2,524,774 P=724,123

36
December 31, 2012 [a] [b] [c] [d] [e]
Financial assets recognized at
end of reporting period by type
Gross carrying amounts (before
offsetting)
Gross amountsoffset in
accordance with
the offsetting criteria
Net amount presented in statements of
financial position
[a-b]
Effect of remaining rights of set-off (including rights to set
off financial collateral) that do not meet PAS 32 offsetting
criteria
Net exposure[c-d]
Financial instruments
Fair value of financial collateral
Derivative liabilities P=12,162,897 P=11,879,146 P=283,751 P=– P=– P=283,751Securities sold under agreements to repurchase** 2,971,471 – 2,971,471 21,141 3,509,709 –Bills payable 2,948,934 – 2,948,934 – 4,756,800 –Total P=18,083,302 P=11,879,146 P=6,204,156 P=21,141 P=8,266,509 P=283,751
** Included in bills and acceptances payable in the statements of financial position
The amounts disclosed in column (d) include those rights to set-off amounts that are only enforceable and exercisable in the event of default, insolvency or bankruptcy. This includes amounts related to financial collateral both received and pledged, whether cash or non-cash collateral, excluding the extent of over-collateralization.
PFRS 10, Consolidated Financial Statements PFRS 10 replaces the portion of PAS 27, Consolidated and Separate Financial Statements that addresses the accounting for consolidated financial statements. It also includes the issues raised in SIC-12, Consolidation - Special Purpose Entities. PFRS 10 establishes a single control model that applies to all entities including special purpose entities. The changes introduced by PFRS 10 requires management to exercise significant judgment to determine which entities are controlled, and therefore, are required to be consolidated by a parent, compared with the requirements in PAS 27. Deconsolidation of Investment in SPV - Opal Portfolio Investments (SPV-AMC), Inc. (OPII) Before the effectivity of PFRS 10, OPII is consolidated by PNB based on the provisions of SIC 12. Under SIC 12, control over an SPE may exist even in cases where an entity owns little or none of the SPE’s equity, such as when an entity retains majority of the residual risks related to the SPE in order to obtain benefits from its activities. Beginning January 1, 2013, the Group adopted PFRS 10 which supersedes SIC 12. PFRS 10 establishes control as the basis for determining which entities are consolidated in the consolidated financial statements. Based on management’s assessment, the Parent Company should no longer consolidate OPII since it has no control over OPII. PAS 1, Presentation of Financial Statements - Presentation of Items of Other Comprehensive Income or OCI (Amendments) The Group applied amendments to PAS 1 and changed the grouping of items presented in OCI either: a) items that can be reclassified (or “recycled”) to profit or loss at a future point in time (for example, upon derecognition or settlement). This includes ‘Accumulated Translation Adjustment’, ‘Net Unrealized Gain (Loss) on Available-for-Sale Investments’ and ‘Share in Equity Adjustments of an Associate’; or b) items that will never be recycled to profit or loss. This includes ‘Remeasurement Losses on Retirement Plan’.
37
The amendments affect presentation only and have no impact on the Group’s financial position or performance. PFRS 12, Disclosure of Interests with Other Entities PFRS 12 includes all of the disclosures that were previously in PAS 27 related to consolidated financial statements, as well as all of the disclosures that were previously included in PAS 31 and PAS 28. These disclosures relate to an entity’s interests in subsidiaries, joint arrangements, associates and structured entities. The Group has no significant interests in joint arrangements, associates and structured entities that require disclosures. None of the majority owned subsidiaries are held by non-controlling interests that are considered material to the Group and which will require additional disclosures by PFRS 12. Refer to ‘Basis of Consolidation’ for disclosures related to subsidiaries. PFRS 13, Fair Value Measurement PFRS 13 establishes a single source of guidance under PFRSs for all fair value measurements. PFRS 13 does not change when an entity is required to use fair value, but rather provides guidance on how to measure fair value under PFRS when fair value is required or permitted. This standard has no significant impact in the fair value measurement of financial assets and liabilities at FVPL, AFS investments, land and buildings. Refer to Note 5 for the disclosures required by the standard. PAS 19, Employee Benefits (Revised) Amendments to PAS 19 range from fundamental changes such as removing the corridor mechanism and the concept of expected returns on plan assets to simple clarifications and rewording. The revised standard also requires new disclosures such as, among others, a sensitivity analysis for each significant actuarial assumption, information on asset-liability matching strategies, duration of the defined benefit obligation, and disaggregation of plan assets by nature and risk. The adoption of PAS 19 (Revised) which required retrospective application, resulted in the restatement of previously reported retirement obligation/asset of the Group. The adjustment amounts were determined by the Group with the assistance of an external actuary. The Parent Company and certain subsidiaries had chosen to close ‘Surplus’ the net effect of all transition adjustments as at January 1, 2011 (the transition date) upon retrospective application of PAS 19 (Revised). The Group will retain the remeasurements recognized in other comprehensive income and will not transfer these to other items in equity.

38
The effects of retroactive application of PAS 19 (Revised) and PFRS 10 are detailed below:
December 31, 2012
As previously
reported
Effect of Retroactive
application of PAS 19R
Effect of Retroactive
application of PFRS 10 As restated
Statements of financial position Assets Other assets-net P=2,994,425 P=429 (P=816,217) P=2,178,637Liabilities Other liabilities 16,846,393 450,807 (11,949) 17,285,251Equity Remeasurement losses on retirement plan − (781,900) − (781,900) Surplus 6,888 ,348 331,500 46,219 7,266,067Non-controlling interests 904,693 22 (850,487) 54,228
January 1, 2012
As previously
reported
Effect of retroactive
application of PAS 19R
Effect of retroactive
application of PFRS 10 As restated
Statements of financial position Assets Other assets-net P=3,897,388 (P=1,217) (P=514,002) P=3,382,169Liabilities Other liabilities 14,015,965 681,915 (29,641) 14,668,239Equity
Remeasurement losses on retirement plan − (1,004,057) − (1,004,057) Surplus 2,246,213 320,965 − 2,567,178
Non-controlling interests 531,247 (39) (484,361) 46,847 Other income, other expenses, provision for income tax and income attributable to non-controlling interests decreased by P=989.4 million, P=623.3 million and P=46.2 million, and P=366.1 million for the year ended December 31, 2012.
13) Adoption of PFRS 9 (Financial Instruments Recognition and Measurement) PFRS 9, Financial Instruments The Securities and Exchange Commission (“SEC”) has approved its adoption as part of its rules and regulations on May 6, 2010. PFRS 9, as issued in 2010, reflects the first phase of the work on the replacement of PAS 39 and applies to classification and measurement of financial assets and financial liabilities as defined in PAS 39. The standard is effective for annual periods beginning on or after January 1, 2013. In subsequent phases, hedge accounting and derecognition will be addressed. The covered entities have been given the option to adopt the standard earlier than the said dates. Hence, an entity may elect to apply for annual periods beginning before January 1, 2013. If an entity however, opts to early adopt PFRS 9, it shall apply the requirements of this standard in its entirety.
39
On May 24, 2012, the Securities and Exchange Commission adopted as part of its rules and regulations on financial reporting the Amendments to PFRS 9 and PFRS 7: Mandatory Effective Date of PFRS 9 and Transition Disclosures, which involve the following revisions for the original PFRS 9:
a) Change of the original 01 January 2013 mandatory effective date of PFRS 9 to 01 January 2015;
b) Modification of the relief from restating prior periods; and c) Additional required disclosures and Measurement to PFRS 9.
In view of the amendments in the mandatory adoption date for PFRS 9, the Bank is still assessing the financial impact of early adoption of the PFRS 9 for its financial reporting. In compliance with SEC Memorandum Circular No. 3 Series 2012, the Bank discloses the following information: 1. The Bank is still evaluating the effect of the early adoption of PFRS 9 and the impact on its financials; hence the interim financial statements do not reflect the impact of the said standard. 2. In case of early adoption of PFRS 9, the following accounts may be affected:
a. Loans and Receivables b. Investment Securities c. Financial Liabilities Designated at FVPL d. Retained Earnings e. Undivided Profits
14) Other Matters • On February 7, 2013, the BSP has accepted the Parent Company's proposal to
make an early payment to settle the Maybank’s P=3.0 billion obligation to the BSP as disclosed in Note 32 of the 2012 AFS of PNB. Government securities held under the escrow fund were transferred to the Parent Company and the real estate collaterals pledged to BSP were also released.
• In 2004, the Parent Company sold the outstanding loans receivable of P5.3 billion from National Steel Corporation (NSC) to SPV companies under the provisions of RA No. 9182. In consideration for such sale, the Parent Company received zero-coupon notes and cash totaling P4.2 billion. In accordance with the BSP Memorandum dated February 16, 2004, Accounting Guidelines on the Sale of Nonperforming Assets to Special Purpose Vehicles, the P1.6 billion allowance for impairment losses previously provided for the NSC loans receivable was released by the Parent Company to cover additional allowance for credit and impairment losses required for other existing NPAs and other risk assets of the Parent Company. With the release of such allowance, the loss on the sale of the NSC loans receivable to the SPV amounting to P1.1 billion representing the difference between the carrying value of the receivables and consideration received was deferred by the Parent Company, recognized as deferred charges under ‘Other Assets’, and amortized over 10 years as allowed under the regulations issued by the BSP for banks and financial institutions availing of the provisions of RA No. 9182.

40
Unquoted debt instruments include the zero-coupon notes received by the Parent Company on October 15, 2004, as discussed above, at the principal amount of P803.5 million (Tranche A Note) payable in five (5) years and at the principal amount of P3.4 billion (Tranche B Note) payable in eight (8) years in exchange for the outstanding loans receivable from NSC of P5.3 billion. The notes are secured by a first ranking mortgage and security interest over the NSC Plant Assets. As of December 31, 2011 and 2010, these notes had a carrying value of P186 million and P356 million, respectively. On October 10, 2008, simultaneous to the denial of their application in the Philippine courts for injunctive relief, the SPV companies filed a Notice of Arbitration with the Singapore International Arbitration Centre (“SIAC”). Mainly, the SPV companies claimed damages and a suspension of payments on the ground that the consortium of banks (the banks) and the Liquidator breached a duty to settle pre-closing real estate taxes (taxes due as of October 14, 2004) due on the NSC Plant Assets and to deliver to them titles to NSC’s Plant Assets free from all liens and encumbrances. However, the banks and the Liquidator dispute the assertions that pre-closing taxes were in arrears, invoking an installment agreement executed between the Liquidator and the City of Iligan. As part of the agreement to sell the plant assets to the SPV companies, the Liquidator assumed responsibility of settling and paying the Plant Assets’ pre-closing real estate taxes, while the SPV companies assumed the responsibility of updating the post-closing taxes (taxes due after October 14, 2004). Consequently, all pre-closing real estate taxes due on the plant assets have been paid in accelerated basis on December 18, 2008. On October 13, 2008, after the commencement of the arbitration but before the arbitral panel was constituted, the SPV companies filed, as a preservatory measure, a petition for injunctive relief against the NSC Liquidator, NSC Secured Creditors, and NSC Stockholders so that the arbitration proceedings under SIAC will not be rendered moot. On October 14, 2008, the Singapore High Court granted the petition and restrained the NSC Liquidator, the NSC Secured Creditors and the NSC Shareholders, jointly and severally, substantially from declaring the SPV companies in default and declaring all installments due until the arbitration proceeding at the SIAC is settled. Thereafter, upon application by the Parent Company for a variation of the injunction and an order of the Singapore High court, the SPV companies remitted P750 million cash in place of the Standby Letter of Credit which they undertook to provide under the Asset Purchase Agreement, subject to the condition that the amount shall not be subject to any set-off pending an award from the arbitration proceedings. On January 26, 2009, the Parent Company applied for an Order to compel the SPV companies to issue another Standby Letter of Credit of P1.0 billion which they likewise undertook to provide under the Asset Purchase Agreement, but this application was denied on March 5, 2009 by the Singapore High Court. The denial of the second variation (the P1.0 billion Standby Letter of Credit) was elevated to the Court of Appeals of Singapore but the same was also denied on September 11, 2009, without prejudice, however, to resort to the same reliefs before the Arbitration Panel.

41
In April 2010, the Arbitral Panel was constituted. The Parent Company filed therein an application to discharge or vary the injunction. On July 7, 2010, the Arbitration Panel issued a ruling denying the Parent Company’s application for a discharge of the injunction issued by the Singapore High Court. On the application to vary the injunction order, no ruling was made by the Arbitration Panel. Consequently, the main issues for alleged breach of the Asset Purchase Agreement, damages and suspension of payments were heard before the Arbitration Panel. The last hearings were held from October 17 to 21, 2011. As disclosed to the Philippine Stock Exchange, the Singapore International Arbitration Centre (SIAC) issued on May 09, 2012, a Partial Award regarding the arbitration proceedings between Global Steel Philippines (SPV-AMC), Inc and Global Ispat Holdings (SPV-AMC), Inc. [Claimants], and Danilo L. Concepcion and Others [Respondents]. Such award was rendered in favor of Claimants, including such reliefs as payment by Respondents of a certain sum of money that may be subject to set-off against receivables from Claimants. PNB, one of the Respondents who holds forty-one percent (41%) interest on the receivables from the NSC, has already set aside adequate reserve provision for the possible liability on the case as well as on the note. Meanwhile, on July 09, 2012, the consortium of banks filed with the Singapore High Court a Petition to Set Aside the Partial Award rendered by the Arbitration Panel, which Petition is pending to date.
15) Other Disclosures
• The PNB Group has nothing to disclose on the following:
- Seasonality or cyclicality of interim operations - Change in estimates - Dividends paid - Material subsequent events - Changes in the composition of the enterprise

42
Current accounts (by maturity)
Up to 12 months 81,698,204
over 1 year to 3 years 22,700,338
over 3 years to 5 years 27,882,483
over 5 years 80,770,023
Past due and items in litigations 8,664,292
Loans Receivables (gross) 221,715,340
Less:
Unearned and Other deferred income (1,117,189)
Allowance for credit losses (5,562,944)
Loans Receivables (net) 215,035,207
* includes loans and discounts, bills purchased, customers' liability under acceptances, letters of credits and trust receipts, lease contract receivable and credit card accounts.
PHILIPPINE NATIONAL BANK AND SUBSIDIARIES
SCHEDULE OF AGING OF LOANS RECEIVABLES*(PSE Requirement per Circular No. 2164-99)
As of June 30, 2013(In Thousand Pesos)