cover sheet for proposal to the national science...
TRANSCRIPT

COVER SHEET FOR PROPOSAL TO THE NATIONAL SCIENCE FOUNDATIONFOR NSF USE ONLY
NSF PROPOSAL NUMBER
DATE RECEIVED NUMBER OF COPIES DIVISION ASSIGNED FUND CODE DUNS# (Data Universal Numbering System) FILE LOCATION
FOR CONSIDERATION BY NSF ORGANIZATION UNIT(S) (Indicate the most specific unit known, i.e. program, division, etc.)
PROGRAM ANNOUNCEMENT/SOLICITATION NO./CLOSING DATE/if not in response to a program announcement/solicitation enter NSF 04-23
EMPLOYER IDENTIFICATION NUMBER (EIN) ORTAXPAYER IDENTIFICATION NUMBER (TIN)
SHOW PREVIOUS AWARD NO. IF THIS ISA RENEWALAN ACCOMPLISHMENT-BASED RENEWAL
IS THIS PROPOSAL BEING SUBMITTED TO ANOTHER FEDERALAGENCY? YES NO IF YES, LIST ACRONYM(S)
NAME OF ORGANIZATION TO WHICH AWARD SHOULD BE MADE ADDRESS OF AWARDEE ORGANIZATION, INCLUDING 9 DIGIT ZIP CODE
AWARDEE ORGANIZATION CODE (IF KNOWN)
IS AWARDEE ORGANIZATION (Check All That Apply) SMALL BUSINESS MINORITY BUSINESS IF THIS IS A PRELIMINARY PROPOSAL(See GPG II.C For Definitions) FOR-PROFIT ORGANIZATION WOMAN-OWNED BUSINESS THEN CHECK HERE
NAME OF PERFORMING ORGANIZATION, IF DIFFERENT FROM ABOVE ADDRESS OF PERFORMING ORGANIZATION, IF DIFFERENT, INCLUDING 9 DIGIT ZIP CODE
PERFORMING ORGANIZATION CODE (IF KNOWN)
TITLE OF PROPOSED PROJECT
REQUESTED AMOUNT
$
PROPOSED DURATION (1-60 MONTHS)
months
REQUESTED STARTING DATE SHOW RELATED PRELIMINARY PROPOSAL NO.IF APPLICABLE
CHECK APPROPRIATE BOX(ES) IF THIS PROPOSAL INCLUDES ANY OF THE ITEMS LISTED BELOWBEGINNING INVESTIGATOR (GPG I.A)
DISCLOSURE OF LOBBYING ACTIVITIES (GPG II.C)
PROPRIETARY & PRIVILEGED INFORMATION (GPG I.B, II.C.1.d)
HISTORIC PLACES (GPG II.C.2.j)
SMALL GRANT FOR EXPLOR. RESEARCH (SGER) (GPG II.D.1)
VERTEBRATE ANIMALS (GPG II.D.5) IACUC App. Date
HUMAN SUBJECTS (GPG II.D.6)Exemption Subsection or IRB App. Date
INTERNATIONAL COOPERATIVE ACTIVITIES: COUNTRY/COUNTRIES INVOLVED
(GPG II.C.2.j)
HIGH RESOLUTION GRAPHICS/OTHER GRAPHICS WHERE EXACT COLORREPRESENTATION IS REQUIRED FOR PROPER INTERPRETATION (GPG I.G.1)
PI/PD DEPARTMENT PI/PD POSTAL ADDRESS
PI/PD FAX NUMBER
NAMES (TYPED) High Degree Yr of Degree Telephone Number Electronic Mail Address
PI/PD NAME
CO-PI/PD
CO-PI/PD
CO-PI/PD
CO-PI/PD
Page 1 of 2
DEB - ECOSYSTEM SCIENCE CLUSTER
PD 05-7381
9982105956006145
University of California-Santa Barbara
0013201000
University of California-Santa BarbaraOffice of ResearchSanta Barbara, CA. 931062050
LTER: Land/Ocean Interactions and the Dynamics of Kelp Forest Communities
4,920,000 72 11/15/06
Marine Science Institute
805-893-8062Santa Barbara, CA 93106United States
Daniel C Reed Ph.D 1989 805-893-8363 [email protected]
Steven D Gaines PhD 1982 805-893-3764 [email protected]
Sally J Holbrook PH.D. 1975 805-893-3956 [email protected]
John M Melack PhD 1976 805-893-3879 [email protected]
David A Siegel Ph.D. 1988 805-893-4547 [email protected]
094878394
PROJECT SUMMARY Intellectual Merit: The Santa Barbara Coastal LTER (SBC LTER) is an interdisciplinary research and education program established in April, 2000 to investigate the relative importance of land and ocean processes in structuring ecosystems at the land-sea margin. Our principal study area is the Santa Barbara Channel and the coastal watersheds that drain into it, and our focal ecosystem is giant kelp forests, which occur on shallow rocky reefs at the interface of the land-sea margin throughout our study area and other temperate coasts throughout the world. The major focus of the work proposed here is developing a predictive understanding of the structural and functional responses of giant kelp forest ecosystems to environmental forcing from the land and the sea. The amount of nutrients and organic matter delivered to the kelp forest from land and the surrounding ocean varies in response to short- and long-term changes in climate, ocean conditions and land use. Variation in the supply of these commodities interacts with physical disturbance to influence the abundance and species composition of the forest inhabitants and the ecological services that they provide. The overarching question of our proposed research is:
How do abiotic drivers acting over different spatial and temporal scales interact to influence kelp forest structure and function?
To address this question we will focus our research around three general themes: (1) The influence of abiotic press and pulse drivers on rates of delivery of N and C to giant kelp forests, (2) The direct and interactive effects of key press and pulse drivers on kelp forest community structure and function through the modification of nutrient supply and wave disturbance, and (3) The indirect effects of pulse and press drivers on kelp forest community structure and function and the feedbacks between structure and function. Our research will take advantage of a variety of approaches that include: (1) Coordinated long-term measurements of key abiotic drivers and ecological response variables, (2) Manipulative field experiments designed to isolate the causal mechanisms underlying the patterns observed in long-term measurements, (3) Measurement-intensive process studies aimed at obtaining a mechanistic understanding of processes that cannot be isolated using manipulative experiments, and (4) Integrated synthesis using modeling and analyses that allow for predictions beyond the spatial and temporal scope of SBC data, and that help guide the direction of future research. These efforts will be facilitated by SBC LTER’s information management system which focuses on data organization integrity and preservation as well as provision of web-based access to a variety of different users. Broader Impacts: Education and training are tightly integrated into all aspects of our research. We have successfully developed a multifaceted, interdisciplinary approach to education and outreach that highlights and integrates the research interests of SBC LTER investigators, students, and the general public. Our programs include active links with K-12 students and teachers, graduate and undergraduate student training, direct public outreach, and productive interactions with the media, local NGOs and agencies. Our outreach and education programs will continue to expand during the next six years as our collaborations mature and attract additional support from participants and agencies. We are committed to sharing our research findings with resource managers, decision makers, stakeholders, and the general public who are interested in applying our findings to policy issues concerning natural resources, coastal management, and land use.

TABLE OF CONTENTSFor font size and page formatting specifications, see GPG section II.C.
Total No. of Page No.*Pages (Optional)*
Cover Sheet for Proposal to the National Science Foundation
Project Summary (not to exceed 1 page)
Table of Contents
Project Description (Including Results from Prior
NSF Support) (not to exceed 15 pages) (Exceed only if allowed by aspecific program announcement/solicitation or if approved inadvance by the appropriate NSF Assistant Director or designee)
References Cited
Biographical Sketches (Not to exceed 2 pages each)
Budget (Plus up to 3 pages of budget justification)
Current and Pending Support
Facilities, Equipment and Other Resources
Special Information/Supplementary Documentation
Appendix (List below. )
(Include only if allowed by a specific program announcement/solicitation or if approved in advance by the appropriate NSFAssistant Director or designee)
Appendix Items:
*Proposers may select any numbering mechanism for the proposal. The entire proposal however, must be paginated.Complete both columns only if the proposal is numbered consecutively.
1
1
49
6
31
9
13
2
0

SECTION 1 - RESULTS FROM PRIOR SUPPORT Land/Ocean Interactions and the Dynamics of Kelp Forest Ecosystems Study Grant No. OCE–9982105, Funding (2000-2006) = $4,200,000 (Excluding supplements) The Santa Barbara Coastal LTER (SBC LTER) is an interdisciplinary research and education program established in April of 2000 to investigate the relative importance of land and ocean processes in structuring ecosystems at the land-sea margin. The focal ecosystem of SBC LTER is giant kelp forests, a highly diverse and productive marine ecosystem that occurs on shallow rocky reefs at the interface of the land-sea margin along temperate coasts throughout the world. Our principal study area is the Santa Barbara Channel and the coastal watersheds that drain into it. Over the past 5 ½ years more than 230 individuals from eight different universities have participated in our program including: 29 senior investigators, 7 postdoctoral investigators, 35 graduate students, 108 undergraduates, 38 technicians/programmers and 14 teachers and community volunteers. A total of 129 publications, including 7 theses/dissertations, have resulted from SBC LTER research since 2000 (Table 1-1 Supplemental Documents). RESEARCH The primary focus of our research during our first funding cycle was on the importance of bottom-up processes and allochthonous inputs to giant kelp forests. Using integrative measurements, experiments, and modeling we have sought to identify and quantify sources of subsidies and disturbance that most affect the structure, dynamics, and function of giant kelp forest ecosystems and the process on land and in the sea that influence them. Our research efforts have examined questions and hypotheses relating to transport and processing of organic and inorganic materials, patterns and control of primary production, disturbance and population dynamics of key species, and species interactions, trophic structure and food web dynamics which address all five core areas of research shared by the 26 sites in the LTER network. Our research efforts have been concentrated in three general habitats: kelp forests, coastal ocean, and watersheds. Below we summarize our major research accomplishments and results in these three habitats and the citations for this work are listed in Table 1-1. More complete information on our research findings can be found in our 2006 annual report available at http://sbcdata.lternet.edu/external/Documents/Annual-Reports/SBC_LTER_annual_report_2006.pdf. Kelp forests- Our analyses of kelp abundance using historical data from the last four decades found that canopy biomass varied interannually at dominant periods of 4-5 y, 11-13 y and ~20 y, and at spatial scales ranging from local (~30 km) to mesoscale (~100-150 km) and regional (~330 km) (B. Kinlan in prep). Temporal dynamics were strongly related to basin-scale climate fluctuations (El Niño-Southern Oscillation, Pacific Decadal Oscillation) and spatial patterns were correlated with coastline geomorphology. Digital canopy maps revealed that changes in biomass were associated with shifts in the spatial structure of the kelp habitat. Our analyses of rates of patch extinction and colonization in giant kelp throughout southern California confirmed that at a regional scale, occupancy of the giant kelp habitat mosaic is extremely dynamic (Reed et al. in press). During the 34-year study period, the estimated fraction of patches occupied in southern California approached 100% in some months, but dipped to ~0% after the major El Nino event of 1982 to 1984. No surface canopy was detected in the aerial biomass surveys for much of the time during this event. Results from our annual subtidal community surveys of 9 mainland and 11 island sites confirm that the kelp forest ecosystems of the Santa Barbara Channel are dynamic in both space and time. Site specific differences in the timing and intensity of sea urchin grazing, exposure to wave disturbance and sand accretion caused the abundance of giant kelp to vary asynchronously over time and independently in space. Understory algae and sessile
1-1

invertebrates also displayed substantial variation among sites and years. This latter pattern is not surprising given the large fluctuations seen in giant kelp, which is known to influence other components of the kelp forest community. Net primary production (NPP) by giant kelp was high, averaging 3 to 8 g dry mass m-2d-1 (= 0.9 to 2.3 g C m-2d-1) at our three study sites during the period July 2002 – June 2005. That the relatively high NPP resulted from a moderately low standing crop (mean = 195 to 560 g dry mass m-2) suggests that a high mean growth rate coupled with high turnover is responsible for the high mean NPP. Indeed, kelp growth and loss averaged nearly 2% of the dry mass per day. Abrupt declines in NPP coincided with abrupt declines in standing crop, which coincided with large wave events, highlighting the importance of wave disturbance in this coastal ecosystem. Our measurements of water column constituents within and just outside the kelp forest at Mohawk Reef showed that nutrient uptake by kelp and grazing on oceanic phytoplankton by benthic suspension feeders within the forest can be quite high. Integrated flow measurements showed a reduction of current speeds within the forest that was dependent on the density of kelp individuals, a visible downstream wake characterized by slower flows, a zone of marked flow acceleration along the offshore boundary of the forest, and strong effects of water depth on velocity (Gaylord et al. in review). These features have implications for understanding the degree to which nearshore flows pass through kelp forests as opposed to being diverted around them. This in turn bears on the capacity of kelp forest ecosystems to influence a variety of nearshore waterborne commodities, including nitrate, dissolved and particulate carbon, phytoplankton, and zooplankton, each of which may be produced or consumed by members of the kelp forest community. Carbon and nitrogen in the kelp forest come from a variety of terrestrial and marine sources including phytoplankton, macroalgal detritus, and terrestrially-derived POM. Our time series data from stable isotopic analyses show distinct carbon signatures in kelp and in water samples of stream, reef and ocean POM with the greatest separation in values occurring between winter and early spring (Page et al. in prep). δ13C values of reef POM decreased during storm events and were highest during phytoplankton “bloom” events. Isotopic analyses of reef consumers from different trophic levels indicated the importance of phytoplankton and local benthic production to the reef food web. Kelp forests export large amounts of drift macrophytes (>500 kg m-1 y-1) to intertidal sandy beach food webs in the SBC LTER. Our comparative surveys and manipulative field experiments have shown that species richness and abundance of infaunal invertebrates and shorebirds respond significantly to these large subsidies of kelp detritus (Dugan et al. 2003). Our ongoing research on the cycling of nutrients derived from drift kelp and other macroalgae on sandy beaches of the SBC LTER discovered that concentrations of dissolved inorganic nitrogen in intertidal porewater were significantly correlated with the standing crop of kelp wrack and can be very high (>10,000 µM). The stranding and processing of kelp detritus thus may represent a potential source of remineralized nitrogen to nearshore waters in general, and kelp forests in particular. Coastal ocean-We have identified three oceanographic processes that transport nutrients to inner shelf ecosystems in the Santa Barbara Channel: 1) coastal upwelling; 2) cross-shelf transport associated with reversal of alongshore currents in late fall; 3) diurnal internal waves (McPhee-Shaw et al. in review). Low-frequency pulses of cold water and high nutrients due to spring upwelling and alongshore current reversals in the late fall deliver most of the nitrate to the reefs. Changing wind stress may cause baroclinic motions and cross-shelf transport associated with these events in spring and fall. In summer, nitrate is delivered to reef depths primarily by diurnal internal waves. We are working to better quantify the various nutrient delivery mechanisms. Using high frequency (HF) radar we discovered that small coastal eddies frequently occur along the mainland coast of the Santa Barbara Channel (Bassin et al. 2005). The ~10 km diameter eddies may be important for supplying nutrients and biogenic particles to kelp forests of the
1-2

Southern California Bight. The eddies typically last up to 6 days. Time series of water properties indicate that these eddies can transport cooler and higher nitrate waters to the inner shelf where kelp forests occur. Satellite ocean-color and sea-surface temperature (SST) imagery used to assess the occurrence, extent and duration of surface sediment plumes from discharged stormwater and phytoplankton blooms in the Santa Barbara Channel determined that phytoplankton blooms occur in the western channel where productivity is influenced by inflow and vertical Ekman pumping of cold, high-nutrient waters (Otero and Siegel 2004, Warrick et al. 2004) Peaks in phytoplankton primary productivity coincided with the coldest sea water temperatures and highest nutrient conditions observed for that year, demonstrating the importance of spring upwelling on channel-wide primary productivity. Monthly mean annual cycles of SST, chlorophyll (Chl) and the water-leaving radiance at 555nm (LwN(555) an index for sediment-affected waters) showed plumes associated with runoff in winter, while blooms that occurred in the late spring–early summer were associated with cool SST and upwelling favorable winds. Despite its proximity to the coast and the relatively high phytoplankton productivity (> 2 g C m-2 d-1), DOC concentrations in the SBC were less than or equal to DOC concentrations in a subtropical oligotrophic gyre. We found that DOC concentrations decrease during upwelling as a result of entraining low DOC water from depth. DOC concentrations remained low even as primary production and chlorophyll levels increased due to upwelled inorganic nutrients. Results from incubations indicated that the release of DOC and large-scale accumulation of DOC from the plankton community appear to be related to the physiological state of the phytoplankton bloom. Blooms of pennate diatoms, Pseudo-nitzschia spp., that synthesize the neurotoxin, domoic acid (DA), have become frequent in recent years in the Southern California Bight resulting in high mortality of marine vertebrates. SBC research has revealed a relationship between bloom toxicity and the mesoscale circulation of the basin in which a zone of elevated cellular domoic acid coincided with the location of a small eddy in the western basin (Anderson et al. in review). The presence and apparent westward movement of the eddy in the Santa Barbara Channel indicates that coherent circulation features may help predict the fate and effects of harmful algal blooms in coastal systems. The relationship between the circulation state of the Santa Barbara Channel and the transport of dissolved and particulate materials was examined on a series of 15 UNOLS cruises and through the deployment of moorings on the inner shelf (see Table 2-2 and http://sbc.lternet.edu/research for ship sampling and mooring locations). The cruises sampled the primary circulation states of the channel and other processes such as a major toxic phytoplankton bloom in 2003 and a major winter storm. Underway ADCP data, combined with physical and bio-optical data from a towed undulating vehicle and water samples from 31 stations across the basin on each cruise provide an extensive data set for evaluating circulation and material transport. These data are in the final stage of being incorporated into our database. They will be analyzed as part of our renewal proposal. Watersheds- Stream samples collected from at 34 sites within 15 watersheds over 5 years showed that land use greatly affected nutrient export from coastal watersheds (Leydecker et al. in review). Descending order of concentration and flux of nitrate and dissolved organic nitrogen (DON) usually followed descending intensity of land use. Differences in phosphate concentrations were observed between intensive agriculture and urban or less intensive agricultural usage, and between urban and undeveloped catchments. However, other factors also played a role because there was no clear relationship between intensity of use and phosphate concentrations or export. We developed a hydrological model that generated runoff from rainfall to extend our measurements of stream discharge and nutrients to all coastal watersheds entering the Santa Barbara Channel within our primary 790 km2 study area (Beighley et al. 2003, 2005). Most of the annual fluxes (as determined from regression models involving land use and storm-
1-3

specific and cumulative water year discharge for 74 coastal watersheds) occurred during a single large storm in each year. For example, in WY 2003, 46, 28 and 40% of the respective nitrate, phosphate and DON fluxes were exported during the largest event. To examine nutrients in the 580 km2 Ventura River watershed at the eastern end of the Santa Barbara Channel, synoptic, monthly sampling at 15 locations was done for four years (Leydecker 2004). During winter stormflow, nitrate concentrations in the lower, urbanized portion of the catchment decreased by dilution from surface runoff, while phosphate concentrations increased throughout the basin coincident with sediment mobilization. To refine our catchment analyses we examined nutrient loading at the landscape-unit scale in three watersheds using high frequency sampling of discharge from specific land use types over a three years (Robinson et al. 2002, 2005). We found differences in the nutrient fluxes and volume weighted mean concentrations among the landscape units: the two intensive agricultural land uses (greenhouse and nursery) were higher than the two urban classes (commercial and residential), which in turn were higher than upper chaparral portions. The importance of DON concentrations in streams diminished from the chaparral areas to the urban and agricultural regions where nitrate loading and export superseded DON. Using an urban growth model to forecast land uses 50 years into the future, and estimates of nutrient export for six land uses (Robinson 2006), we found that the forecasted reduction in agricultural land use and expansion of urban development leads to a decrease in nitrate export and an increase in phosphate export. The large variation in the concentration of nutrients in runoff during storms required the sampling and modeling of nutrient export at a time step significantly less than one day (Melack and Leydecker 2005). For example, nitrate, soluble reactive phosphate (SRP) and particulate organic nitrogen (PON) varied with the hydrograph, albeit in different patterns: SRP varied in phase with outflow, nitrate exhibited the opposite pattern, and PON concentrations, along with other particulates, reached a maximum on the rising limb of the first storm pulse, implying different mechanisms and/or sources for the various species. Drying/rewetting processes stimulate nitrifiers and cause release of DOC from recalcitrant soil organic matter (Fierer et al. 2003, Miller et al. 2005). The high rainfall in WY2005 (220% of the long-term average) provided an opportunity to determine if depletion of nutrient stock occurred after extensive rainfall. Sites with large upland areas showed signs of nitrate depletion, while in the coastal plains with extensive agriculture, concentrations increased with consecutive storms. Following a wildfire in 2004, nitrate concentrations in storm runoff from burned catchments increased by as much as seven times and phosphate concentrations increased by four to five times compared to unburned conditions during the subsequent rainy season. CROSS-SITE AND NETWORK ACTIVITIES Although SBC is one of the newer LTER sites we nonetheless have been involved in numerous Network-level and cross-site activities including symposia/workshops, cross-site research and outreach and Network-level planning. We have been active in hosting, organizing, and or participating in cross-site synthetic symposia and conferences. In 2002 we organized a symposium on human effects on ecosystems at the land/ocean margin for the annual meetings of Western Society of Naturalists that featured speakers from all over the continental US and Hawaii. We are hosting and organizing the 7th International Temperate Reef Symposium which will be held at UCSB in June 2006. We hosted the LTER coordinating committee meeting in spring 2004. Investigators Siegel, Holbrook, and Whitmer gave presentations at the LTER/NSF mini symposia held at NSF in 2004 and 2005. SBC investigators and students have given presentations at the LTER Aquatic Science Conference on Cross-site Research in 2000, the LTER fall science symposia in 2004 and 2005, the LTER All Scientists Meetings in 2000 and 2003, and the LTER Graduate Student Collaborative Research Symposium in 2005. Melack was a co-principal investigator of an LTER cross-site comparison grant to investigate dissolved organic N in streams, and graduate student Andy Rassweiler has been an active
1-4
collaborator in an LTER working group investigating patterns of species richness in space and time. Rassweiler is co-authoring a chapter in the soon to be released LTER synthesis volume on primary production. Melack, Washburn, Siegel and MacIntyre are collaborating with investigators from the LTER Network Office and the National Center for Super-computer Applications on an NSF Cyberinfrastructure for Environmental Observatories proposal that stresses cross-disciplinary involvement in the development of cyberinfrastructure. Whitmer is a co-PI on the Network’s first cross-site Schoolyard LTER effort that brings four LTER sites together to assess environmental literacy in K-12 students. She is also a Co-PI on the LTER Network’s Planning Grant and has the primary responsibility of integrating education and outreach into that process. Reed, Melack and Cardinale serve on the LTER Conference Committee and are actively involved in the LTER Planning Grant effort. SBC’s information manager Margaret O’Brien is a member of LTER network’s EML Best Practices working group and the Unit Dictionary working group. INFORMATION MANAGEMENT SBC LTER strives to meet the ever emerging and constantly changing challenges of organizing and preserving short- and long-term data sets in a format that facilitates their accessibility and analysis. SBC has adopted Metacat and EML as a primary information storage tool, rather than as just an exchange format. Our EML documents are contributed to NCEAS/LNO by replication or harvesting, depending on the compatibility of the participating Metacat installations. A list of LTER datasets and their documented online use are provided in Table 1-2 (Supplementary documents). A more complete description of how we manage our data is provided in Section 4 – Information Management. SBC LTER data sets and accompanying metadata can be found online at http://sbc.lternet.edu/data/index.html. DEVELOPMENT OF HUMAN RESOURCES, EDUCATION AND OUTREACH Education and training are tightly integrated into all aspects of our research. Our education program includes Schoolyard (K-12), undergraduate, graduate and post doctoral elements. A major goal of our Schoolyard program is to instill a strong appreciation for stewardship of coastal land and marine habitats. Much of our focus has been on the development of a digital resource for teachers that focuses on watersheds and their connection to the marine environment that is based on SBC LTER research. A subsequent project expanded upon this digital resource by developing a 7-part watershed lesson plan set for middle school grades. The lessons are standards-based and focus on several aspects of watersheds, including understanding human impacts and connections to coastal systems. The digital resource is now available to educators on DVD and via downloadable pdf files on our website (http://sbc.lternet.edu/education/index.html) along with these lesson plans. Over 100 undergraduate students have participated in SBC LTER research in a variety of capacities including REU, research interns/assistants, and sponsored research projects and senior theses. Our graduate students and postdocs have benefited from a joint training program with four other research groups at UCSB that emphasizes interdisciplinary research in the response of coastal ecosystems to human and naturally induced changes in the environment. To date 35 graduate students and 7 postdocs have participated in SBC LTER research. Outreach has been an ever-expanding activity for SBC LTER. We are committed to sharing our research findings with organizations, agencies, managers, and the general public who are interested in applying our findings to policy and decision-making on issues concerning natural resources, coastal management, and land use. Details of our accomplishments in this area can be found in our 2006 annual report ( http://sbcdata.lternet.edu/external/Documents/Annual-Reports/SBC_LTER_annual_report_2006.pdf).
1-5

SECTION 2 - PROPOSED RESEARCH INTRODUCTION The overarching mission of the Santa Barbara Coastal Long Term Ecological Research (SBC LTER) program is to understand the linkages among ecosystems at the land-ocean margin through interdisciplinary research, education and outreach. Our focus is on developing a predictive understanding of the structural and functional responses of giant kelp forest ecosystems to environmental forcing from the land and the sea. Giant kelp forests occur on shallow rocky reefs that fringe temperate coastlines throughout the world (Wormersley 1954) and are extremely important to the ecology and economy of the regions in which they occur (Foster and Schiel 1985, Leet et al. 1992). Our principal study site is the semi-arid Santa Barbara coastal region, which includes steep watersheds, small estuaries, sandy beaches, and the neritic and pelagic waters of the Santa Barbara Channel and the habitats encompassed within it (e.g., giant kelp forests, deep ocean basins, pelagic waters and offshore islands). Identifying the linkages among these diverse ecosystems and quantifying their ecological importance require a highly integrated approach among distinct fields of research. As such, more than 200 investigators, students and staff have contributed to this synthetic effort since the SBC LTER was established in 2000 (http://sbc.lternet.edu/index.html). The exchange of materials between two or more ecosystems is increasingly recognized as an important determinant of many ecological patterns and processes (Valiela et al. 2001, Loreau et al. 2003, Knight et al. 2005). The movement of organic and inorganic materials across the boundaries of discrete ecosystems is ubiquitous and has been shown to profoundly influence population dynamics, community structure, food web complexity, and primary and secondary production (reviewed in Polis et al. 1997). Nowhere are such linkages more evident than in the coastal zone where nearshore marine ecosystems are intimately connected to the land and the sea. Understanding the extent to which land and ocean systems are connected and the nature by which they are linked is important because disturbances and environmental forcing occurring in one system can influence the ecological structure and function of the other. Much of what we know about land-ocean interactions in coastal ecosystems comes from studies done in estuaries and protected embayments, (Smith et al. 2003, Cooper and Brush 1991, Larrson et al. 1985). However, terrestrial influences on coastal ecosystems may extend well beyond these interface habitats into the open ocean where the nature of land/sea interactions is qualitatively different (Lohrenz et al. 1997, Rabalais et al. 2002). In particular, terrestrial influences interact with a much broader range of ocean processes in habitats on the outer coast. For example, surface and internal waves, longshore currents, and basin-wide patterns of circulation can have a large influence on the structure and function of nearshore habitats such as giant kelp forests (Foster and Schiel 1985, North 1994, Mann 2000). The scales of these ocean processes tend to be large, and the nature of their interactions with terrestrial inputs from watersheds is only beginning to be understood. Our ability to predict how coastal ecosystems will respond to environmental change requires a recognition that the drivers of change (e.g., climate, disease, human actions) typically act over different temporal and spatial time scales. This inevitably results in a complex set of interactions among the biotic responses that these forcings elicit. The LTER Network has long been interested in environmental drivers that span a range of temporal and spatial scales and the ongoing planning effort to establish integrated and collaborative multi-site research initiatives has recently formalized this interest into a pulse/press framework in which abiotic drivers act in a chronic long-term (i.e., “press”) or periodic short-term (i.e., “pulse”) fashion to influence biotic structure and ecosystem function (http://intranet.lternet.edu/planning/index.php/Main_Page). A better understanding of how ecosystems respond to the interaction of multiple drivers operating
2-1
over different temporal and spatial scales will lead to more accurate model descriptions, thus enhancing the accuracy of forecasts of ecosystem responses to environmental change. CONCEPTUAL FRAMEWORK A major research objective of SBC LTER has been to develop a predictive understanding of the importance of land and ocean processes in determining the structure and function of giant kelp (Macrocystis pyrifera) forest ecosystems. The amount of nutrients and organic matter delivered to the kelp forest from land and the surrounding ocean varies in response to short- and long-term changes in climate, ocean conditions and land use as well the in situ processing of these subsides. Variation in the supply of these commodities interacts with physical disturbance to influence the abundance and species composition of the forest inhabitants and the ecological services that they provide. The overarching question motivating our proposed research is:
How do abiotic drivers interact to influence kelp forest structure and function? To address this question we will focus our research around three general themes (Figure 2-1): (1) The influence of abiotic press and pulse drivers on rates of delivery of N and C to giant kelp forests, (2) The direct and interactive effects of key press and pulse drivers on kelp forest community structure and function through the modification of nutrient supply and wave disturbance, and (3) The indirect effects of pulse and press drivers on kelp forest community structure and function and the feedbacks between structure and function. Short-term (hours to weeks) abiotic drivers that affect the delivery of nutrients and organic matter to kelp forests (e.g., upwelling, runoff) are embedded within a climatic regime (i.e., press driver) that fluctuates over much longer time scales (years, decades or more). The rate at which nutrients and organic matter are delivered to the kelp forest will depend not only on the direct effects of the pulse and press drivers, but also on the interactions among them (Theme 1, Figure 2-1). Abiotic drivers not only influence supply rates of N and C to kelp forests, but also the frequency and intensity of physical disturbance. Because the return interval of some of the key press drivers occurs on decadal and longer time scales, long-term research is needed to evaluate the ecological consequences of the direct and interactive effects of pulse and press drivers on the structure and function of giant kelp forests (Theme 2, Figure 2-1). Like most natural systems, the structure and function of a giant kelp forest are inextricably linked (Loreau et al. 2001, Duffy et al. 2003, Worm and Duffy 2003). Thus, abiotic pulse and press drivers that directly affect the abundance and species composition of a kelp forest community will indirectly influence the system’s capacity to fix carbon and take up nutrients used to support the complex kelp forest food web (Theme 3, Figure 2-1). Similarly, the amount and form of organic matter produced by the forest and made available to kelp forest consumers will in turn influence the abundance and species composition of organisms inhabiting the forest. Positive and negative feedbacks between kelp forest structure and function may arise from these indirect effects. Site characteristics - SBC LTER is ideally suited to explore issues of connectivity between terrestrial and marine ecosystems and the actions and interactions of pulse and press drivers on kelp forest structure and function. Our site is bounded by the Transverse Ranges of central and southern California to the north, the Channel Islands to the south, Pt. Conception to the west, and the Santa Clara River to the east (Figure 2-2). The catchments draining into the Santa Barbara Channel offer a rich diversity of watersheds that are characterized by a wide variety of land covers and uses (Figure 2-3). Giant kelp forms expansive forests on shallow rocky reefs, which dominate the nearshore in this region (Foster and Schiel 1985). Because of their close proximity to shore, kelp forests
2-2

are influenced by physical and biological processes that occur on the land as well as in the open ocean. Streams and rivers transport nutrients, dissolved and particulate organic matter (DOM and POM), sediments, and pollutants from coastal watersheds to kelp forests, while ocean currents, internal waves, and other oceanographic processes supply nutrients, DOM, POM, larvae and plankton from adjacent offshore waters (Figure 2-4). In return, kelp forests export large amounts of DOM and POM to inshore intertidal habitats, as well as to offshore deep-water habitats (ZoBell 1971, Newell et al. 1980, Harrold et al. 1998, Dugan et al. 2003). The transport of nitrate into the euphotic zone and disturbance from storm-generated waves are arguably the two most important factors regulating the standing crop and production of macroalgae (including giant kelp) in the coastal waters of southern California (Jackson 1977, Haines and Wheeler 1978, Eppley et al. 1979, Wheeler and North 1980, Dayton et al. 1992, Edwards 2004), and our research themes emphasize these two aspects. Short-term (i.e., pulse) and long-term (i.e., press) changes in climate, oceanography and land use that directly or indirectly alter the disturbance regime and/or the supply of nutrients can have a profound influence on the structure of kelp forest communities and on the flow of materials to and from them (Schmitt and Holbrook 1990, Holbrook and Schmitt 1996, Tegner et al. 1997, Holbrook et al. 1997, Dayton and Tegner 1989, Dayton et al. 1999, Brooks et al. 2002). Pulse drivers - The Santa Barbara region has a Mediterranean climate characterized by relatively calm, dry conditions in summer and autumn, prevailing winds in the spring, and episodic rain storms in the winter. This environmental setting creates strong seasonality in bottom-up forcing (via variation in the supply of nitrogen) and top-down control (via physical disturbance from storm generated waves). A number of “pulse” drivers operating on seasonal time scales influence these bottom-up and top-down forces. The largest ocean signal for nitrogen is derived from wind-driven upwelling, which supplies cool, nutrient-rich water to kelp forests primarily during spring (McPhee-Shaw et al. in review). Precipitation in the region is generally confined to late fall and winter when concentrations of ocean-derived nitrogen tend to be low. During this time of year, streams and rivers are capable of delivering substantial amounts of dissolved and particulate nitrogen and carbon to shallow coastal waters, particularly in areas adjacent to catchments where agriculture and/or urban development are the predominant land uses (Figure 2-5). Large swells generated by winter storms are a major form of disturbance and cause substantial mortality in kelp and other benthic organisms (Dayton and Tegner 1984, Ebeling et al. 1985, Seymour et al. 1989). Internal waves, and other less understood oceanographic processes supply nitrogen to otherwise depleted surface waters in summer and fall, and are thought to be important in enabling giant kelp to persist and grow year round in most years (Zimmerman and Kremer 1984, Lerczak et al. 2001, Bassin et al. 2005, McPhee-Shaw et al. in review). Press drivers - Aside from the seasonal cycle, the El Niño Southern Oscillation (ENSO) is the dominant climatic signal over most of the Pacific Ocean. The two phases of ENSO are generally termed El Niño (the warm phase) and La Niña (the cool phase). The relative contributions of land- and ocean-derived nitrogen and carbon to kelp forests in southern California are likely to vary between El Niño and La Niña years. During El Niño years, warm oceanic conditions depress the thermocline, greatly reducing concentration of nitrate in upwelled water and in water transported inshore by internal waves. This decrease in nitrogen has been implicated in reduced kelp growth and productivity (Gerard 1984, Zimmerman and Robertson 1985, Dean and Jacobsen 1986). The reduction in ocean-derived nitrogen fluxes to kelp forests during El Niño years may be compensated in part by an increased flux of nitrogen from land to nearshore shallow reefs due to elevated stream runoff caused by above average precipitation (mean precipitation during El Niño years = 100.1 mm vs. overall mean of 65.1 mm, Figure 2-6a). The situation reverses in cool La Niña years when ocean-derived nitrogen fluxes to the kelp forest tend to be high and the flux of nitrogen from land is low due to below
2-3

average rainfall (mean precipitation during non El Niño years = 52.2 mm). Differences in precipitation between El Niño and non El Niño years arise from changes in the intensity and frequency of winter storms, whose associated swells have profound effects on the structure and function of giant kelp forests (Tegner and Dayton 1987, Edwards 2004). It is important to note that no two ENSO events are alike, differing in intensity, timing, duration, and ecological response (Wolter and Timlin 1998). As a consequence, the absolute and relative contributions of different routes of nitrogen and carbon delivery to kelp forests during El Niño and La Niña years almost certainly vary among ENSO events. Climatic cycles with return frequencies of decades may contribute to this variability in the intensity of and subsequent responses to ENSO events. Most notable in this regard is the Pacific Decadal Oscillation (PDO), a recently described phenomenon of alternating cold, nutrient-rich and warm, nutrient-poor regimes in the Pacific Basin lasting 20 to 30 years with abrupt transitions between regimes (Mantua et al. 1997). The PDO can have strong influences on Pacific ecosystems. For example, the shift to a warm, nutrient-poor regime during 1976-2000 was accompanied by abrupt declines in all trophic levels in the Southern California Bight, including dramatic declines in the abundances of reef invertebrates, benthic algae and fish, as well as a northward shift in the distribution of many southern species (Holbrook and Schmitt 1996, Holbrook et al. 1997, McGowan et al. 1998, Brooks et al. 2002). The major regime shift from cold to warm waters in 1976 is evident in the sea surface temperature (SST) record for the Santa Barbara Channel (Figure 2-6b; mean SST for the cold (1955-1975) and warm (1976-2000) regimes was 15.5 oC and 16.2 oC, respectively). Interestingly, the PDO may also influence the nitrogen and carbon flux from the land to the kelp forest because the mean precipitation for the cold regime was considerably less than that for the warm regime (Figure 2-6a; 58.4 vs. 70.4 mm for the cold and warm periods, respectively). The shift to a warm regime during 1976–2000 coincided with some of the most severe El Niños on record (Wolter and Timlin 1998). The extent to which the PDO or other press drivers (e.g., global climate change, land use change) interact with ENSO and other shorter term pulse drivers (e.g., runoff, upwelling, internal waves, and wave disturbance) to influence the structure and function of giant kelp forests is presently unknown. APPROACH Much of our effort during our first funding cycle centered on establishing sampling programs to generate long-term data sets that could address questions and hypotheses relating to the core areas of LTER research. This work included: (1) quantifying the daily, seasonal and yearly flux of terrestrial runoff and its dissolved and particulate constituents for varying types of land cover and land use, (2) identifying and measuring the transport of different sources of ocean–derived nitrogen to shallow coastal reefs, (3) assessing the relative importance of land and ocean-derived carbon and nitrogen in kelp forest food webs using carbon and nitrogen stable isotopes, (4) documenting patterns and investigating controls of primary production in giant kelp and offshore phytoplankton, (5) investigating species interactions and long-term population dynamics in over 100 kelp forest taxa, and (6) examining patch dynamics, connectivity and metapopulation structure of kelp forests in the Southern California Bight. Having gained considerable insight into many of these issues, we have reached a stage where we can reduce our sampling effort in a number of these areas and use the savings in research capital to pursue a mechanistic understanding using long-term experiments, focused process-oriented studies, and synthetic modeling. Certain abiotic drivers of kelp forest ecosystems are easily manipulated (e.g., physical disturbance that removes kelp), while others are difficult or practically impossible to
2-4

manipulate on a meaningful scale (e.g., sea surface temperature, water column productivity, elevated runoff, land use change). Because of this, our research will take advantage of a variety of approaches that include: (1) Coordinated long-term measurements of key abiotic drivers and ecological response variables, (2) Manipulative field experiments designed to isolate the causal mechanisms underlying the patterns observed in long-term measurements, (3) Measurement-intensive process studies aimed at obtaining a mechanistic understanding of processes that cannot be isolated using manipulative experiments, and (4) Integrated synthesis using modeling and analyses that allow for predictions beyond the spatial and temporal scope of SBC data, and that help guide the direction of future research. Collectively, these elements provide a powerful basis for building a greater understanding of the direct and indirect effects of pulse and press drivers on kelp forest ecosystems, which is essential for predicting how giant kelp forests will respond to ongoing changes in the environment. 1. Coordinated long-term measurements. The purpose of our long-term measurements is to unveil spatial and temporal patterns in the structure and function of giant kelp forests in the Santa Barbara Channel and in the physical and chemical forcing variables that influence them. Because kelp forests occur at the land-ocean margin, we collect long-term measurements on land, in the offshore ocean, and in the shallow coastal zone where kelp forests occur. The information obtained from our measurements is not only critical for addressing long-term phenomena at the site level, but it also allows for cross-site comparisons that are essential for achieving the LTER Network’s goal of “understanding a diverse array of ecosystems at multiple spatial and temporal scales”. The extensive spatial sampling of streams and the coastal ocean conducted during SBC’s first six years provides previously unknown information on patterns and rates of biogeochemical inputs to kelp forests from the adjoining land and ocean environments and the physical processes that drive them (see Section 1- Prior Results). Following the recommendations of the panel of experts assembled for our three-year review we propose to reduce the spatial extent of our stream and ocean sampling and focus more on the linkages among land, ocean and reef environments. The long-term measurements that we propose to continue collecting are listed in Table 2-1. Sampling protocols for collecting these measurements can be found at http://sbcdata.lternet.edu/catalog/index.jsp. 2. Manipulative field experiments. Studies done during our first six years of funding have provided us with new knowledge of the most prominent forcing variables of kelp forest structure and function and the major pulse and press drivers that influence them. We are now well positioned to design short- and long-term manipulative field experiments aimed at quantifying the direct and indirect effects of these drivers on the most relevant structural and functional components of the kelp forest. In the next six years, we will initiate a long-term experiment designed to mimic the effects of wave disturbance and nutrient loading on kelp forest structure and function. Short-term experiments and measurement-intensive process studies (see below) will be nested within the longer-term experiment to examine specific features of the response of various structural and functional attributes of giant kelp forests. 3. Measurement-intensive process studies. The use of manipulative field experiments is not practical and/or appropriate for unraveling the details of many terrestrial and marine processes and the causes of the patterns that they produce. In lieu of experiments we have successfully used intensive coordinated sampling to examine the mechanistic underpinnings of a wide variety of terrestrial and oceanographic processes that impinge on giant kelp forests (e.g., the effects of land use on the rates and fluxes of nutrient export, the transport of nutrients to kelp forests via internal waves and cyclonic eddies, the importance of land and ocean derived carbon and nitrogen in kelp forest food webs). We will continue to use intensive coordinated sampling in relatively short (i.e., 1 -3 years
2-5

as appropriate) focused campaigns as a research tool for exploring patterns, mechanisms and consequences of a variety of terrestrial and oceanographic processes. 4. Synthetic Analyses and Modeling. We conduct both modeling and statistical analyses to provide an integrated synthesis of the SBC LTER observations which will allow for predictions beyond the spatial and temporal scales of SBC data and be used to help guide the directions of future research. We will investigate and model the SBC system on multiple levels of biological organization ranging from sub-organismal (e.g., models of kelp photosynthesis) to ecosystems (e.g., connectivity of kelp forests to land and the coastal ocean via material transport). The use of models allows us to make informed predictions of physical and biological processes that extend beyond the spatial and temporal scope of our data, and they help guide us in identifying the most productive areas for pursuing future research. RESEARCH QUESTIONS A list of the research themes and questions that we will address and how they fit into our conceptual framework is provided in Figure 2-1. Our rationale and approach for addressing each of these questions are given below. THEME 1: The influence of abiotic press and pulse drivers on rates of delivery of N and C to giant kelp forests. QUESTION 1a. How are the rates of delivery of N and organic C to giant kelp forests from terrestrial and oceanic environments altered by press and pulse drivers? Rationale - Rates of delivery of N and C to kelp forest ecosystems can be conceptualized as the result of transport via a set of spatially nested mechanisms with different frequencies and timing of occurrence. As described below, the concentrations of inorganic and organic N and organic C in the waters surrounding kelp forests depend on oceanic processes, exchanges with nearshore benthic communities, processes that deliver porewater from intertidal beaches, and inputs from land associated with stream flows. The extent to which these different routes of supply modify the concentration of N and C around the kelp forest to a biologically significant extent depends on their intensity, duration, frequency, and timing (Figure 2-7). Hence, our studies will include measurements that capture the inherent spatial and temporal variability of the processes that deliver N and C to the kelp forest represented by the press and pulse drivers contained in our conceptual framework (Figure 2-1). Our previous observations (McPhee-Shaw et al. in review) show that various oceanic processes operate at different times of the year to deliver N to kelp forests. Upwelling during spring exposes kelp forests to high nitrate concentrations, while diurnal internal waves expose kelp forests to intermittent nutrient pulses in summer and fall when ambient nutrient levels are generally low (Figure 2-7). These processes are especially sensitive to climate conditions such as El Niño. Other potentially important transport process, such as large-scale equator-ward flow reversals, cross-shore transport by coastal eddies (Bassin et al. 2005), and possible modulation of cross-shore transport by coastal-trapped waves (Pringle and Riser 2003) are not well understood. Another potentially important source of N and C to kelp forest food webs is kelp itself. Kelp forests produce and export large quantities of drift algae, much of which is deposited in the intertidal zone of sandy beaches (ZoBell 1971, Hayes 1974, Hobday 2000). The processing of wrack by invertebrate detritivores and its decomposition and subsequent nitrogen mineralization by bacteria can lead to high concentrations of dissolved nitrogen in intertidal porewater (Figure 2-8). We expect to find similarly elevated concentrations of DOC and POC in intertidal porewater of beaches with wrack. Porewater and its constituents are released gradually with tidal flux and episodically
2-6

during beach erosion associated with winter waves. An understanding of the accumulation, processing by animals, and decomposition and mineralization of kelp wrack, and the timing and magnitude of the release of intertidal porewater is needed to evaluate the significance of this potential nitrogen and organic carbon source to coastal waters and kelp forests. Similar exchanges of regenerated nutrients and dissolved organic matter undoubtedly occur between the benthic communities and the waters within and surrounding giant kelp forests, but have yet to be explored. Freshwater discharge during winter storms can be another significant source of nutrients and organic carbon originating inshore of kelp forests (Leydecker et al. in review). Pulse and press drivers that influence patterns of rainfall and land use can greatly influence the timing and amount of N and organic carbon delivered to the ocean by runoff. The extent to which some of these drivers interact with surf zone and inner shelf circulation processes to influence the delivery of N and organic C from runoff and beach seepage to kelp forests is not well known. Approach – The assessment of the magnitudes and variability (spatial and temporal) of the processes that deliver N and organic C to the kelp forest requires integrated measurements of: (1) oceanic processes that connect offshore waters to the inner shelf where kelp forests occur, (2) benthic recycling within and around kelp forests, (3) processing and transport of beach materials from the surf zone to kelp forests, and (4) watershed processes and inner shelf circulation that connect runoff from rivers and streams to giant kelp forests. Below we describe our proposed research of these topics. (1) Oceanic and cross shelf processes- Transport processes connecting offshore waters to the mid-shelf and inner shelf will be examined using a combination of observations collected previously during 15 UNOLS cruises and with ongoing observations (Table 2-1). Both efforts will be supplemented by observations from other programs (see next paragraph). A broad suite of measurements was obtained during the UNOLS cruises to define circulation, water masses and spatial distributions of N and C (Table 2-2). Current velocity field during each cruise will be defined using temperature, salinity, and ship-board (ADCP) current data along with high frequency radar observations of surface currents. Cruise observations will be linked to kelp forests via analyses of inner shelf flow as characterized by times series data (2000 – 2005) of horizontal currents (ADCP), temperature, and bio-optics (fluorescence and optical backscatter) obtained from moored sensors and small boat surveys. These analyses will benefit from and extend previous regional studies (e.g., Winant et al. 2003, Dever 2004, Harms and Winant 1998). Cross shelf processes determine whether the materials carried to the shelf by offshore currents reach the kelp forest. To better resolve temporal and spatial variability in the connectivity between kelp forests and offshore waters, we will examine biological and chemical gradients across the shelf on transects from the kelp forests to 3 km into the Santa Barbara Channel. We will stratify our sampling in time to capture seasonal and episodic conditions. Samples for POC, PON, DOC, DON, Chl a, bacteria biomass and inorganic nutrients will be collected from three depths within the euphotic zone and from 2 depths within the seasonal thermocline. To assess whether the gradient in inorganic and organic matter affects biological activity, we will measure primary production via the 14C bicarbonate incubations and bacterial production via 3H-Leucine incubation (Smith and Azam 1992) at stations just seaward of the surf zone, near the kelp forest and offshore. Due to the importance of internal waves for nutrient supply after spring upwelling (see Question 3, Figure 2-22), we will deploy arrays of self-contained temperature loggers and an ADCP along the nutrient transect line in a T formation similar to Pineda (1999). This configuration will allow us to detect not only internal waves but also the bores due to non-linearity in the internal wave field that induce horizontal transport. High frequency sampling will enable us to detect wave breaking and diapycnal mixing (e.g., MacIntyre et al. 2006).
2-7
No UNOLS cruises are planned during the next six-year funding cycle, but remote sensing approaches will be used to supplement ongoing monitoring and future process studies. The circulation state of the Santa Barbara Channel will continue to be examined with a combination of HF radar and satellite remote sensing data. Remotely forced and large-scale processes, such as El Niño effects will be observed using infrastructure of the Southern California Coastal Ocean Observing system (SCCOOS), Partnership for Interdisciplinary Studies of Coastal Oceans (PISCO), the California Current Ecosystem LTER (CCE-LTER), National Data Buoy Center (NDBC) observations, California Cooperative Oceanic Fisheries Investigations (CalCOFI), among other sources. Retrospective analyses from these programs will inform ongoing analyses of data from the cruises and moorings. (2) Exchanges with nearshore benthic communities - Regeneration of nutrients and DOC from nearshore hard and soft bottom benthic communities will be determined by measuring concentrations in a sequence of samples collected from opaque benthic chambers deployed in the same manner as our chambers for assaying NPP (see Question 2 below). (3) Beach processes - Annual variation in intertidal sand levels averages from 1 to 2 m for SBC beaches (Hubbard and Dugan 2003). When this sand is removed by waves or flushed during tidal cycles, nutrient-rich porewaters can be released into nearshore waters. To evaluate sources of and dynamics of export of nutrients accumulated in intertidal porewater we will measure the input and standing crop of kelp wrack, invertebrate consumer and bacterial abundances, sand and water table depths, and the nutrient concentrations and stable C and N isotopic signatures of POM in porewater at beaches representing a range of wrack inputs. We will measure consumer and bacterial activity in situ and in microcosms to determine processing and remineralization rates for kelp wrack. Potential flux from intertidal beach sands into nearshore waters will be calculated using nutrient concentrations, processing rates, porosity and hydraulic conductivity measurements in combination with measurements of water table levels. We will estimate the supply of NO3 from the beach in late summer when offshore supply of NO3 is low and decomposition of kelp wrack on the beach is most rapid and again in winter when wave action removes sand from the beach with its high concentrations of NO3 in porewaters. During each of these periods, water samples for NO3 will be obtained from auto analyzers moored within and outside the forest over a period of weeks to determine if changes in concentration occur. Physical measurements will include deployment of an ADCP and accompanying thermistor mooring at the inner edge of the kelp forest and one in the waters outside. These moorings, along with those already in place (Table 2-1), will allow us to observe coherent motions across the bed. In addition, we will do continuous point releases of rhodamine at a site between the surf zone and the forest and sample for the tracer along a grid in small boats using fluorometers and real time GPS connected to pocket PCs. These measurements will allow us to calculate flux of dissolved materials into the forest from the beach. (4) Watershed processes – To quantify the flux of dissolved and particulate N and C from coastal catchments to the nearshore waters of the Santa Barbara Channel requires a combination of hydrological and hydrochemical measurements and modeling. Ongoing measurements are essential because the complex interactions and spatial and temporal variations among climatic, hydrological, biogeochemical and ecological conditions have been only partially captured by our studies to date and are not sufficiently understood to fully model. Our modeling permits regional extrapolation of our measurements, and will become increasingly mechanistic as our understanding of our catchments improves. We have developed a rainfall-runoff model (Beighley et al. 2003, 2005) that depends on measured landscape characteristics and rainfall inputs. Our landscape data include digital
2-8

elevations, soils and land cover obtained from satellite imagery, high-resolution aerial photography and ground surveys. We obtain rainfall from networks of tipping-bucket gauges operated by the SBC-LTER and local government agencies (Table 2-1). In addition, we maintain stage gauges on 18 streams (Table 2-1) to validate our runoff model and to extend it to different landscape conditions, such as burned lands or modified land use, and different climatic conditions, such as el Niños or prolonged droughts (Figure 2-9). Intensive sampling of many storm events (Figure 2-10) at multiple sites representing a range of landscapes (Figure 2-11; Melack and Leydecker 2005, Robinson 2006) and spanning low to high rainfall years during the last six years provides the basis for development and validation of our nutrient concentration and export regression models (Leydecker et al. in review, Robinson et al. 2005). Using these relations in combination with our runoff model permits calculation of inputs from all the coastal streams (Figure 2-12). Further examination of our long-term data and related experimental work (Fierer and Schimel 2002) will permit incorporation of particulate fluxes and more mechanistic understanding of interactions among landscape characteristics, climatic conditions and nitrogen dynamics into our export models. Higher plants and algae in streams and riparian zones can influence nutrient fluxes during low flow periods, and our prior and ongoing studies will permit their incorporation into our modeling. We will continue to collect event-based samples from a subset of streams and sample rain on an event basis and dry deposition with passive ion-exchange-resin collectors. These samples will be analyzed as detailed in Table 2-1 and occasionally for DOC, silica and stable isotopes of C and N. Sites sampled will include streams draining representative landscapes to provide a long-term record as climate and land use change, and several sites that are recovering from a wildfire. To extend our understanding of hydrochemical conditions and fluxes to the Santa Clara River, a large catchment on the eastern edge of the Santa Barbara Channel, we will partner with the Friends of the Santa Clara River, who have funding from the State Water Resources Control Board, to obtain samples from a transect of 8 stations distributed along the river. We will investigate circulation processes connecting stream and river outflows to kelp forests with tracer studies. This will be done following the approach of Fong and Stacey (2003) using real time rhodamine sampling systems we have developed. In addition, we have an ongoing collaboration with Nekton Instruments, a research firm which has developed a Mini-Ranger micro-underwater vehicle with CTD and is now further developing the instrument package for environmental sampling by inclusion of additional sensors for plume tracing. We anticipate beta testing their instrument to further elucidate the pathway of buoyant inflows from winter storms and flux into the kelp forest. Our event sampling of streams in winter and discharge measurements as described above will provide nutrient and organic C loading into the nearshore; these plume studies will allow us to quantify supply of N and C from streams to the kelp forest.
QUESTION 1b. What are the sources and fate of dissolved and particulate organic matter in the nearshore zone? Rationale - The shelf in the Santa Barbara Basin is only a few kilometers wide in many areas and this increases the potential for oceanic influences on the nearshore zone. However, our data suggest significant temporal variability in cross-shelf transport that causes reef ecosystems to be relatively isolated from offshore influences some times while being strongly influenced by offshore waters at other times. Studies conducted in at Mohawk Reef illustrate seasonal differences in gradients of organic and inorganic nutrients between the kelp forests and the waters offshore (Figure 2-13). During periods of reduced connectivity between land, nearshore and offshore habitats, the accumulation of DOM and POM observed within the nearshore zone can have important implications
2-9
for nutrient cycling. For example, if there is a high flux of relatively bioavailable DOM, rich in N and P, then the remineralization of the DOM may be rapid and result in a local resupply of inorganic nutrients to the kelp forest ecosystem. Thus, characterizing the source of POM and DOM, their stoichiometry and their bioavailability are important in assessing their fate and impact on kelp forest food webs. Approach - We have used stable isotopes to help identify sources of production used by reef consumers under different conditions of freshwater runoff, ocean climate and giant kelp standing crop. These data are promising in showing separation in the isotope values of the most likely sources of DOM (i.e., kelp, and terrestrial and marine POM; Figure 2-14). To further identify the source of the most bioavailable fraction of DOM, we propose to measure the δ13C and δ15N signature of bacterioplankton, the end users of labile DOM. Stable isotope analysis has been used successfully to identify sources of DOM to estuaries and estuarine bacteria (Coffin and Cifuentes 1999, Raymond and Bayer 2001, Bauer 2002) and could be a powerful tool to quantify the contribution of nearshore benthic production, and kelp forests, in particular, to the nearshore DOM pool. To assess the bioavailable fraction of DOM in the nearshore zone, we propose to conduct remineralization assays similar to those described in Carlson and Ducklow (1996). Changes in bacterial biomass and DOC concentration will be measured directly from samples collected at regular intervals throughout the seawater culture experiment. These data will provide an estimate for both the magnitude of bioavailable DOC and the bacterial growth efficiency (BGE). These remineralization experiments will be conducted seasonally along the inshore to offshore gradients of inorganic nutrients, POM and DOM. Total carbon flux through bacterioplankton or bacterial carbon demand (BCD) is a function of bacterial production (BP) and BGE and is calculated as: BCD = BP / BGE (BGE= BP/ ∆DOC. To assess how the DOM source affects the flux of DOC through the microbial food web, it is essential to determine how BGE changes depending on DOM source. Using empirically derived estimates of BGE together with measurements of in situ bacterial production we can estimate BCD along the nutrient gradients. Estimates of BCD will provide insight into how DOM remineralization rates vary in space and time.
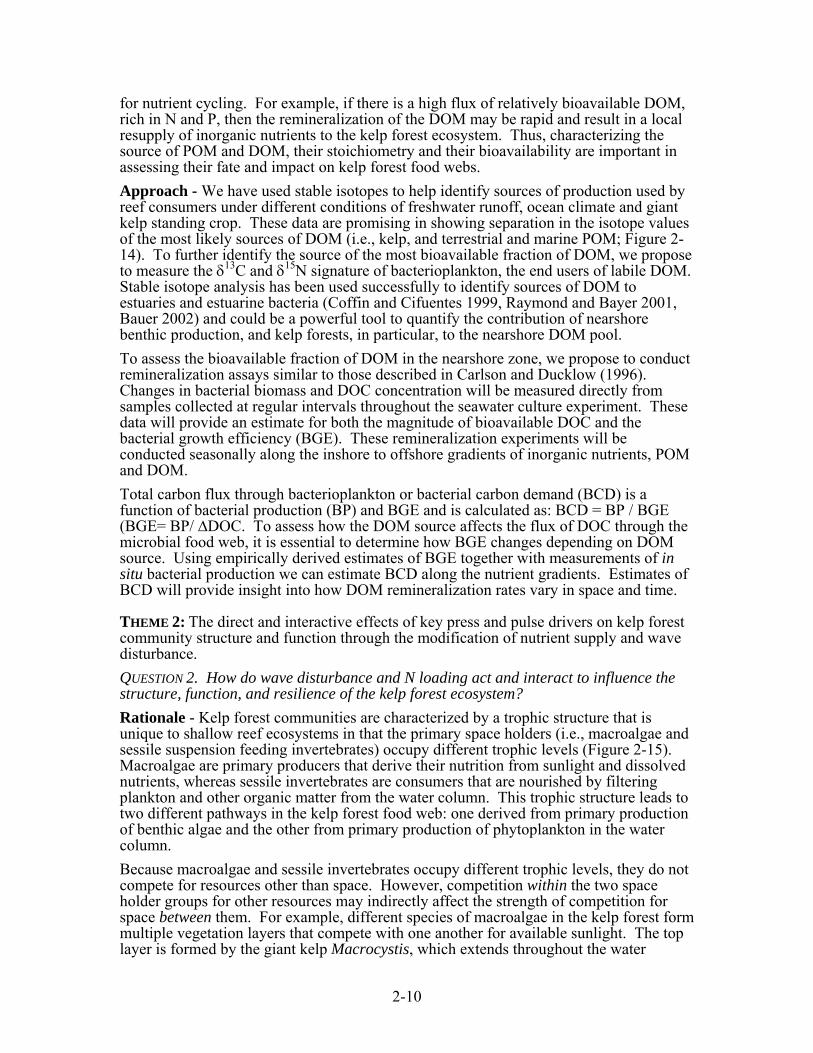
THEME 2: The direct and interactive effects of key press and pulse drivers on kelp forest community structure and function through the modification of nutrient supply and wave disturbance. QUESTION 2. How do wave disturbance and N loading act and interact to influence the structure, function, and resilience of the kelp forest ecosystem? Rationale - Kelp forest communities are characterized by a trophic structure that is unique to shallow reef ecosystems in that the primary space holders (i.e., macroalgae and sessile suspension feeding invertebrates) occupy different trophic levels (Figure 2-15). Macroalgae are primary producers that derive their nutrition from sunlight and dissolved nutrients, whereas sessile invertebrates are consumers that are nourished by filtering plankton and other organic matter from the water column. This trophic structure leads to two different pathways in the kelp forest food web: one derived from primary production of benthic algae and the other from primary production of phytoplankton in the water column. Because macroalgae and sessile invertebrates occupy different trophic levels, they do not compete for resources other than space. However, competition within the two space holder groups for other resources may indirectly affect the strength of competition for space between them. For example, different species of macroalgae in the kelp forest form multiple vegetation layers that compete with one another for available sunlight. The top layer is formed by the giant kelp Macrocystis, which extends throughout the water
2-10

column and forms a dense overlying canopy at the surface. Although giant kelp occupies relatively little space on the bottom (typically < 10 %), it can monopolize available sunlight and reduce the amount reaching the bottom by more than 90% (Pearse and Hines 1979, Reed and Foster 1984). The large reduction in light caused by the surface canopy suppresses the abundance of benthic macroalgae under the canopy (Reed and Foster 1984, Dayton et al. 1984, Edwards 1998, Clark et al. 2004), which can have indirect positive effects on the abundance of sessile invertebrates (Reed et al. 2006b) as well as indirect negative effects on mobile invertebrates such as small crustaceans that live and feed on understory macroalgae (Schmitt and Holbrook 1990). Competition among the different vegetation layers for light (and hence its indirect effects on sessile invertebrates) is very much influenced by storm-induced wave disturbance because an alga’s probability of being removed by waves tends to be positively related to its stature in the water column (and hence its ability to compete for light). Unlike giant kelp, which is dislodged by waves quite easily, many low lying species of understory are able to resist removal from all but the largest of swells (Dayton and Tegner 1984, Ebeling et al. 1985, Seymour et al. 1989). Moderate wave events that remove only the kelp canopy may tip the scale of space competition in favor of understory algae, which flourish in the high light environment created by the loss of the kelp canopy (Cowen et al. 1982, Foster 1982). Similar types of interactions between sessile invertebrates and macroalgae may result from changes in environmental drivers that alter the availability of other resources. For example, increases in nitrogen loading that arise from altered land use or shifts in oceanographic climate may stimulate the growth of macroalgae and allow them to displace slower growing sessile invertebrates, especially in areas of abundant light and low grazing pressure. Such shifts in biotic structure have the potential to alter the amount and form of primary production by the forest community and the degree to which it is used by consumers in the kelp forest (Fig. 2-14) and adjoining habitats (Dugan et al. 2003). The degree to which these and other functions of the kelp forest ecosystem are altered by the actions and interactions of wave disturbance and ambient levels of nitrogen have not been well studied. Data collected from nine sites over the last 20+ years show that changes in the relative abundance of algae and invertebrates may be sudden and dramatic. For example, densities of the filter feeding sea cucumber Pachythyone rubra increased from less than 1 m-2 to more than 1000 m-2 in just two years at our study sites off Santa Cruz Island (Figure 2-16). These dense populations have persisted for more than a decade, and macroalgae have been reduced to one third of its initial density over that period. Such shifts in community state from one space holder group to another might be the result of changes in the ambient resource environment (as determined by the interaction of pulse and press drivers) that favor one space holder group over another. Alternatively, the state of the community may be determined by scramble competition whose outcome depends primarily on the composition of species that colonize following disturbance when space is first made available. Testing these alternative hypotheses to determine why the structure of the kelp forest community changes in response to a fluctuating environment and whether or not the community is likely to return to a previous state when conditions moderate is of critical importance. Better understanding of the mechanisms that cause changes in community state leads to an enhanced ability to forecast how systems will respond to multiple interacting drivers. But we have yet to explore the extent to which abiotic pulse and press drivers interact to influence nutrient supply and/or the frequency and intensity of wave disturbance and alter the outcome of competition between macroalgae and sessile invertebrates. Understanding such phenomena requires that observations and experiments be done over a period of time that is long enough to capture different press regimes.
2-11

Approach – We will set up and maintain a long-term experiment designed to examine the individual and combined effects of wave disturbance and nitrogen loading on the structure, function and resilience of the benthic community. The design of the experiment is shown in Figure 2-17. It consists of manipulating densities of giant kelp, the benthic assemblage of algae and invertebrates, and ambient nutrient conditions in a hierarchical design in which small plots (1 m2) of a 2 x 2 factorial involving the state of benthic development (benthos removed and benthos unmanipulated) and nutrient loading (enriched N and ambient N) are nested within larger plots (40 m x 40 m) of three different kelp removal treatments. The description and rationale for the different treatments is as follows: Description and rationale of experimental treatments – The three levels of kelp removal will be: (1) a press removal in which giant kelp is removed each year during the winter, (2) a pulse removal in which giant kelp is removed in the winter of the first year only, and (3) a control in which removal of giant kelp occurs only via natural processes (Figure 2-17). The benthos removal treatment involves clearing the bottom of all macroalgae and sessile invertebrates at the beginning of the experiment. Removals of kelp and the benthos are designed to simulate different levels of wave disturbance. The condition in which all benthic biota are removed (i.e., kelp removal and benthos removal) represents a severe wave disturbance whereas the condition where only kelp is removed (kelp removal and benthos control) is intended to mimic a less severe wave event. The benthos removal treatment within the kelp control is not intended to simulate a natural condition as wave disturbance that scours the bottom will inevitably remove kelp as well. Rather, this treatment is included to aid in isolating indirect effects of kelp on the competitive interactions between macroalgae and sessile invertebrates. The press removal of kelp will be used to evaluate the response of the benthic community during periods of persistent kelp loss, which we have occasionally observed at sites in southern California (Reed et al. 2006a). Press removal of the benthos is not a component of the experimental design because the response of the benthic community is what we are interested in measuring. The inclusion of the kelp pulse removal treatment allows us to examine resilience of the benthic community under different simulated levels of wave disturbance (high = benthos removed; low = benthos control) in different nutrient environments. We cannot experimentally recreate all of the types of environmental variation that characterize the various abiotic press drivers (ENSO, PDO, etc.). However, we can simulate press conditions of elevated nitrogen such as those that might arise during the cool phases of ENSO and the PDO or from anthropogenic eutrophication for a subset of the kelp forest community. Elevating nutrients throughout the water column over prolonged periods of time in an open coastal system like the Santa Barbara Channel poses enormous logistical challenges. However, enriching nitrogen on a scale that is meaningful to the benthic community is tractable (reviewed in Worm et al. 2000) and is the intent of our experimental nitrogen enrichment. Focusing on the benthic community in this experiment is justifiable because we know little about its responses to variation in nitrogen supply compared to giant kelp which has been much better studied in this context (reviewed in North 1994). Nitrogen enrichment will be accomplished via the application of coated time release fertilizer, which has been used successfully to elevate nutrient concentrations for a wide range of ambient nutrient and flow conditions (Worm et al. 2000). Because the outcome of the experiment is likely to vary with the ambient environmental conditions under which it is done, we will repeat the experiment under different press environments (e.g., different phases of ENSO or PDO). We anticipate that this experiment will be done over a period of many years to capture this environmental variation. Response variables - Structural changes in the benthic community that develop in response to our experimental manipulations will be evaluated in the 1 m2 plots (n= 5 plots
2-12

for each of the four combinations of benthic development and nutrient loading) that are nested within the larger 40 m x 40 m kelp plots (n= 3 plots for each of the three kelp treatments). This will be done by monitoring the abundance and species composition of macroalgae and sessile invertebrates using techniques similar to those employed in our long-term monitoring of giant kelp forests (see http://sbcdata.lternet.edu/catalog/index.jsp for sampling protocol). Additionally, we will monitor the densities of mobile invertebrates and fishes in larger 40 m x 2 m areas within the kelp plots to obtain information on the abundance and species composition of consumers that prey on the benthos and the extent to which their abundances are affected by the kelp manipulations. Collectively, these data will be used to calculate abundance, species richness, and evenness of each trophic and/or functional group, as well as community state (i.e., rank abundance curves of dominant space holders) for the various experimental treatments (Figure 2-17). Sampling will be done twice per year in winter and summer, which tend to be the periods of maximum and minimum benthic development. To supplement interpretation of our experimental results time series analyses (e.g., multivariate autoregressive models) of observational data obtained from our long-term monitoring sites (Table 2-1) will be used to test for interactions among drivers (e.g., wave disturbance, N-loading) on the same structural attributes of the kelp forest community The ecosystem functions that we will focus on in the experiment are (1) net primary production (NPP) by the benthic community, and (2) food chain support to epibenthic fishes that feed in the forest (Figure 2-17). We will measure NPP by the benthic community in the 1m2 plots used to examine the individual and interactive effects of wave disturbance and nitrogen loading on benthic community structure. NPP will be estimated from changes in dissolved oxygen in 20 minute in situ incubations in clear acrylic chambers placed over the bottom in the experimental plots. This is a sufficient time to observe a change in the concentration of O2 with minimal depletion of the dissolved nutrients within the chamber (Carpenter 1985). Dissolved oxygen will be measured with an O2 sensor connected to a data logger. Chambers will be stirred with compressed air-driven magnetic stir bars and a surge-driven paddle (Carpenter 1985). The stir bars maintain continuous flow past the O2 probe, while the paddle promotes natural oscillatory movement of the understory algal assemblage. NPP in units of moles carbon per unit time will be estimated as net O2 production divided by the photosynthetic quotient (∆O2/ ∆[CO2]), which is 1.4 for nitrate assimilation. We will examine food chain support to epibenthic reef fishes by focusing on small crustaceans (primarily amphipods and copepods), which are the primary diet of a wide variety of epibenthic reef fishes (Quast 1971, Coyer 1979, Laur and Ebeling 1983, Holbrook and Schmitt 1986). The major crustacean prey species typically associate with different algal taxa, which they use for food and shelter (Schmitt and Holbrook 1990, Holbrook and Schmitt 1992). Results from our previous research indicate that alterations in the abundance and species composition of the understory algal assemblage (such as those resulting from shading by the giant kelp canopy or changes in nutrient availability) may have strong indirect effects on populations of reef fishes by altering the abundance of their preferred prey (Holbrook et al. 1990, Schmitt and Holbrook 1990). Growth and reproduction in many reef fishes is tightly linked to the availability of their prey (Forrester 1990, Holbrook and Schmitt 1992, Anderson and Sabado 1995, Booth 2004). We found that the abundance of low lying algal turf was inversely related to the abundance of larger foliose understory algae, which in turn was inversely related to the density of giant kelp. The potential indirect effects of kelp on reef fishes may be positive or negative depending on whether a species forages in foliose algae or low lying turf. To experimentally test whether the species composition, densities, and standing crop of crustacean prey available to predatory fishes are influenced by the presence of giant kelp and/or nutrient addition, we will remove and collect the benthic assemblage within a 400 cm2 quadrat within each of the different experimental treatments during our winter and
2-13

summer sampling periods. We will avoid removing the benthic assemblage from the same 400 cm2 area in subsequent sampling periods. Prior to removing the benthos, we will estimate the percent cover of conspicuous space holding taxa using point contact methods and digital photography. On return to the laboratory, prey items will be separated from algae and other non-prey material. Algae will be identified and quantified in terms of weight (dry, AFDW) and invertebrate prey will be identified, counted, and weighed. We will test whether differences in prey availability among the experimental treatments influence the foraging behavior and feeding rate of microcarnivorous reef fishes by recording fish feeding activity in the experimental plots.
THEME 3: The indirect effects of pulse and press drivers on kelp forest community structure and function and the feedbacks between structure and function. QUESTION 3a. How does the negative effect of giant kelp on understory algae and phytoplankton interact with wave disturbance and N loading to affect the magnitude and interannual variability of NPP of the kelp forest ecosystem? Rationale – During our first funding cycle we initiated field studies to examine spatial and temporal patterns of variation in kelp forest NPP and the factors that control them. We focused our efforts on the giant kelp Macrocystis pyrifera, which is the most abundant (in terms of biomass) alga in the forest and is one of the most productive organisms on earth (Mann 2000). Our findings to date indicate that NPP of giant kelp alone is at least 3 to 12 times greater than that of the above ground NPP of other ecosystems within the LTER network (Figure 2-18). It is worth noting that our approximation of kelp NPP is almost certainly an underestimate because our allometric approach to measuring NPP does not account for any carbon fixed and released as dissolved organic matter (DOM). Although the production of DOM in Macrocystis is thought to be low (Fankboner and de Burgh 1977), the loss of DOM is likely to be substantial (Khailov and Burlakova 1969, Hatcher et al. 1977, Johnston et al. 1977, Newell et al. 1980, Newell and Lucas 1981). Ultimately we wish to compare NPP of the kelp forest ecosystem to that of other ecosystems. This comparison requires that we obtain more accurate estimates of kelp NPP by accounting for the excretion of DOM and that we account for NPP by the other key autotrophs in the system, namely understory algae and phytoplankton. At present there are no reported estimates of NPP of understory algae and phytoplankton in giant kelp forests. Although our data on Macrocystis span only three years, they suggest that NPP of giant kelp exhibits much greater interannual variability than that of other biomes (Figure 2-18). The high variability that we observed in giant kelp NPP appeared to result more from variation in wave disturbance than from variation in nutrient availability (Figure 2-19). The relative importance of these two factors in influencing NPP by giant kelp undoubtedly varies among years depending on the press environment. If our observed patterns of high and variable NPP by Macrocystis were to hold over the long-term for the entire kelp forest ecosystem, then giant kelp forests will challenge the general pattern found by Knapp and Smith (2001) that biomes with intermediate levels of NPP show the greatest interannual variability in NPP. However, we do not yet know the extent to which the NPP of the entire kelp forest ecosystem tracks NPP of Macrocystis. Primary production of understory algae in systems lacking surface canopy kelps rivals that of Macrocystis (Mann 2000), so production in the understory may substantially modify the overall pattern. Because primary production by both understory macroalgae and phytoplankton is likely inhibited by giant kelp’s superior ability to compete for light, the NPP of these groups may be inversely related to NPP of Macrocystis. This raises the distinct possibility that competition among the major groups of primary producers may serve to dampen temporal variability in NPP by the kelp forest ecosystem as a whole.
2-14

The extent to which this occurs will depend on the strength of competition among the various groups of primary producers and the relative magnitudes of their NPP. Approach – We will conduct a two-year seasonal study of simultaneous measures of NPP by Macrocystis, understory algae and phytoplankton. This work will be done in conjunction with the long-term experiment proposed in Question 2 and our ongoing measurements of Macrocystis NPP. We will continue to measure kelp NPP each month in kelp control plots while monthly measurements of NPP by phytoplankton and understory algae will be made in both kelp control and kelp press removal plots to examine the effect of shading by the kelp canopy on NPP by these groups. We will measure NPP for both the plankton community and understory algal assemblages through changes in dissolved oxygen. NPP by understory algae will be measured in acrylic chambers as described for Question 2 above. The oxygen electrodes used to measure NPP by understory algae are not sufficiently sensitive to measure phytoplankton NPP. We therefore propose to use high precision micro-Winkler titrations to assess changes in oxygen within incubated samples. Water samples will be collected using Niskin bottles from 3 depths in the kelp forest. Quadruplicate samples will be incubated at each sampling depth for 24 h and then preserved with Winkler reagents and titrated using a high precision autotitrator following the methods of Dickson et al. (2001). NPP will be calculated as described above for understory algae. The size of giant kelp precludes the use of the oxygen method. Instead we will refine our existing allometric method for this species, which accounts for monthly changes in biomass through the growth of new and existing fronds and the loss of old fronds and entire plants (see http://sbcdata.lternet.edu/external/Reef/Protocols/Kelp_NPP/SBC-LTER_Kelp_NPP_Protocol.pdf for complete description of the sampling methodology). Of the parameters estimated the loss terms are the most challenging. Our current method accounts for the physical loss of fronds and plants, but does not account for the loss of carbon excreted as DOM by the kelp. We will measure the in situ excretion of DOC by kelp in two ways. First we will enclose portions of kelp fronds in polyethylene bags and sample DOC concentrations within the bag over short time intervals. DOC excretion will be expressed as mass of C excreted per mass of kelp per unit time. We will do this for different aged fronds and for different portions of a frond (in both the water column and surface canopy) each month during the two-year study. Simultaneous measures of the biomass density of different aged and portions of kelp fronds will enable us to estimate the mean DOC loss per unit area of kelp forest, which will be incorporated into our estimates of NPP by giant kelp. Second, we will directly measure both DOC concentration and bacterial production rates in the kelp canopy where the majority of kelp biomass resides. Bacterial production measurements together with empirically derived growth efficiency estimates (see Question 1b above) will be used to estimate bacterial carbon demand (BCD). Measurements of DOC stocks, BCD and kelp standing crop will allow us to estimate gross DOC production within the kelp canopy where the majority of kelp biomass resides.
QUESTION 3b. How does the forest interact with its flow environment to modify the delivery of N and C and influence the species composition and performance of kelp forest biota? Rationale - The species composition and performance (i.e., growth and reproduction) of organisms within kelp forests are determined in part by large-scale flows around the forest, small-scale flows within the forest, and the moderating effect of the forest on these flows. The supply of flow-delivered substances to the kelp forest depends upon the amount of the water that flows into the forest, the extent of penetration in the horizontal and vertical, and the interaction of flow with the biota and the sea floor. In addition, the influence of the nutrients regenerated within the kelp forests depends on flows within the
2-15

forests. With supplemental funding from the University of California Marine Council, we (along with colleagues from Stanford University) found during the spring 2005 that ~90% of impinging eastward flows, and ~60% of impinging westward flows, passed through the leading edge of the kelp forest at Mohawk Reef with ~50% of the impinging fluid reaching the center of the forest (Gaylord et al. in review). In contrast only ~ 25% of impinging flow penetrated to the center of the forest in the summer of 2005 when the density and size of the forest was substantially greater (Figure 2-20). We also found that the kelp forest reduced the influence of internal waves, which did not fully penetrate into the forest during spring or summer (Figure 2-21). Strong effects of depth and the sea floor on flow were superimposed upon those by the forest as shallower locations in the forest experienced slower flows than deeper locations, and lower portions in the water column experienced slower flows than upper portions. The concentrations of dissolved and particulate N and C within the forest are further altered by forest producers and consumers. In an earlier study in May 2002, we observed a substantial decrease in nitrogen in the upper water column inside the Mohawk kelp forest (relative to outside), and a similar decrease in chlorophyll a and POC near the seafloor (Figure 2-22). These trends indicate pronounced uptake of nutrients close to the water's surface where most of the kelp biomass is located, and intense, previously undocumented grazing on phytoplankton and other organic particles near the bottom. A concomitantly large increase in phaeophytin (a byproduct of grazing on chlorophyll) near the seafloor further supports this latter concept, while a near-bottom increase in silicate suggests substantial benthic regeneration of silica. Collectively, these findings have important implications for the structure and function of kelp forests because they suggest that the horizontal and vertical position that an organism occupies in the forest has a profound influence on the resource environment in which it lives. The extent to which the resource environment within the forest is determined by the physical effects of the forest on flow that alters the flux of waterborne N and C vs. the biological modification by forest producers and consumers that alters the concentration of N and C remains unknown. Approach – We will continue to examine the extent to which the forest interacts with alongshore flows and internal waves to influence the delivery of N and C to the forest. We will measure alongshore flows, and concentrations of nitrate, chlorophyll and suspended particulate matter at locations inside and outside the kelp forest at Mohawk Reef using an array of moored sensors (ADCP, in situ nitrate analyzer fluorometer, and optical back scatter, Table 2-1). Thermistor chains used to detect internal waves also will be deployed at these two locations as well as at three additional locations within the forest. The placement of the arrays in the forest will be integrated with the array described in Question 1 in order to quantify the extent of penetration of internal tides and bores into the kelp forest. Time-integrated water samples collected at multiple depths at the outside, near the edge, and at various locations in the interior of the forest will be done periodically to examine the vertical and horizontal distributions of particulate and dissolved C and N. We will coordinate these measurements with the process studies in Question 1 to determine the changes in water column chemistry associated with inflows from buoyant plumes, internal tides, and beach erosion and will coordinate with the productivity measurements in Question 3a to determine when allochthonous and autochthonous supply is supporting growth. Monthly sampling of kelp frond density will be done by divers using our established protocols (http://sbcdata.lternet.edu/external/Reef/Protocols/Kelp_NPP/SBC-LTER_Kelp_NPP_Protocol.pdf). Data on the area and boundaries of the forest will be obtained monthly using SPOT high spatial resolution (10 & 20 m) multispectral satellite imagery. UCSB was recently designated as a SPOT imagery research center, giving UCSB students and researchers nearly unlimited, nearly free access to SPOT imagery and the ability to acquire new scenes (details at http://www.spot.ucsb.edu). Recently we
2-16
developed a robust method for delineating kelp-covered pixels by using a near-infrared to green band ratio in multispectral SPOT imagery (Figure 2-23). We are in the process of creating a GIS database of kelp canopy cover from SPOT and are expecting to acquire complete coverage of the Santa Barbara Channel and the northern Channel Islands once a month. We will examine spatial patterns of abundance of understory algae and sessile filter feeding invertebrates within the kelp forest and evaluate the extent to which their distributions can be explained by the physical and chemical variables that we measure. We will test the hypothesis that the growth of giant kelp and a sessile filter feeding invertebrate that lives on it are influenced by the size and density of the forest and their position within it. Elongation rates and chemical composition of tagged kelp fronds will be measured at the edge and interior of the forest over 10 day intervals throughout the year. Data on tissue nitrate and carbohydrate storage compounds of tagged fronds coupled with measurements of currents, seawater nitrate and light will be used to determine the factors limiting kelp growth. Kelp uptake of NO3 will be quantified using a model by Stevens et al. (2001) that takes kelp growth, flow speed, the frequency of surface waves, and concentrations of inorganic nitrogen into account. Results will be extended to the scale of the forest based on the results of our earlier forest-wide measurements, which allow us to estimate the penetration of alongshore flows into the kelp forest, our thermistor arrays which allow us to estimate penetration of internal waves, and our regressions between temperature and concentration of NO3 (McPhee-Shaw et al. in review). From this we will also estimate the reduction in NO3 within the forest attributable to uptake by giant kelp. Influence of forest structure on the supply of food to an invertebrate filter feeder will be determined by quantifying spatial differences in the abundance, feeding rate and growth of Membranipora tuberculata, an abundant epiphytic phytoplanktivorus bryozoan that is distributed throughout the water column on the blades of Macrocystis. Divers will determine the vertical and horizontal distribution and abundance of Membranipora in the Mohawk kelp forest. Feeding rates at different vertical and horizontal positions in the forest will be determined from chlorophyll analyses of Membranipora colonies of known area using techniques that we have developed (K. Arkema unpublished data). Growth will be measured by increases in colony size measured from digital photographs. Forest-wide consumption rates of phytoplankton by Membranipora will be estimated from data on Membranipora abundance, gut chlorophyll, gut clearance times, and phytoplankton chlorophyll concentrations. REGIONALIZATION & CROSS-SITE ACTIVITIES New tools provide us with the means of diagnosing the role of disturbance on kelp beds on large spatial scales. Using SPOT satellite imagery and our long-term records of kelp abundance obtained in collaboration with ISP Alginates from aerial surveys (sbcdata.lternet.edu/catalog/index.jsp), we will diagnose the role of disturbance in kelp ecosystems throughout southern California and beyond. These tools allow changes in kelp canopy cover to be monitored over large spatial scales and with SPOT imagery on fine temporal scales allowing our models of kelp metapopulation dynamics (Reed et al. 2006a) to be extended and refined. We will continue to examine changes in the distribution and abundance of kelp forests in relation to a variety of dynamic oceanographic processes using a number of observational tools. Nutrient supply will be diagnosed via satellite images of sea surface temperature (McPhee-Shaw et al. in review), surface waves via swell wave modeling (cdip.ucsd.edu), sediment influxes via ocean color imagery (Otero and Siegel 2004) and phytoplankton abundance via remotely sensed chlorophyll distributions (Otero and Siegel 2004). The use of these tools led to our finding that the temporal dynamics of kelp forests in California and Baja Mexico were
2-17

strongly related to basin-scale climate fluctuations (ENSO and PDO) and spatial patterns were correlated with coastline geomorphology (Figure 2-24, and B. Kinlan unpublished data). We will continue investigating these patterns to elucidate the causes of regional kelp forest population dynamics. Our growing collaboration with the Santa Barbara and Ventura Counties Coastal Processes Study involves multiple agencies and universities and is providing information on nearshore bathymetry and the identity, magnitude and pathways of nearshore sediment transport as well as beach erosion. The high resolution multibeam and sidescan bathymetric mapping of the shoreline, surf zone and inner shelf and grain size distribution on the inner shelf collected by the cooperative study will be used to validate a sediment transport model and cross-shore fluxes of sediments. Information on nearshore currents from our moorings and HF radar arrays, and intertidal profile and sediment dynamics from our sandy beach studies will be integrated into this cooperative effort. We have been exploring generality in patterns and processes in reef ecosystems through our collaborations with researchers from Moorea Coral Reef LTER. The tropical reefs examined by the Moorea LTER and the temperate reefs examined by the SBC LTER are both characterized by key foundation species (coral and kelp, respectively) that provide food and habitat for diverse assemblages of plants and animals, and serve as major sources of primary production. These foundation species are subject to a range of natural and anthropogenic disturbances that can affect their abundance as well as impact the larger reef community. Another important theme being investigated at both LTER sites regards the role of internal waves in supplying nutrients to shallow reef systems. There is increasing evidence that internal waves might have significant effects on nutrient supply to reefs, particularly in times and places where ambient nutrient levels are low. SBC and MCR researchers will continue to work collaboratively on studies such as these that investigate similarities and differences in the structure and function of these two systems. We hope to develop similar collaborations with the newly established California Current Ecosystem LTER (CCE) whose biome extends throughout the Southern California Bight and includes the SBC LTER oceanic domain. SYNTHESIS As is true of any complex system, giant kelp forests pose challenges to synthetic understanding. Reef systems are both physically and biologically complex, and they are influenced by fluxes of matter and disturbance from both land and the open ocean. Figure 2-1 represents our conceptual model of the large-scale forcings and interactions that drive kelp ecosystem dynamics. We have attempted to simplify and organize this inherent complexity into three tractable research themes that we believe are central to developing a comprehensive understanding of how kelp forest ecosystems work (Figure 2-1). During the first 6 years of our work we emphasized Theme 1 (the role of key abiotic drivers in modifying the exchange of N and C between the kelp forest and terrestrial and oceanic environment), particularly with respect to regional scale oceanographic forcing and terrestrial responses to storms and loading into the coastal zone. We have made considerable progress on this theme after just one funding cycle (see Section 1 - Prior Results). Our data increasingly suggest that the impacts of short-term, small-scale drivers (i.e., pulse events like storms and upwelling) are constrained by larger scale, historical events (i.e., press drivers like climate change) that bound the range of system behavior. Theme 2 seeks to quantify the interactions among drivers that operate on fundamentally different temporal and spatial scales. During our first funding cycle, we have gathered considerable data on pulse drivers. The next funding cycle should extend our time series of data sufficiently to allow us to begin to examine press drivers that operate on decadal
2-18

periods. We will soon have characterized enough pulse events that we can begin to use time series analyses, such as first-order multivariate autoregressive (MAR) models, to examine how kelp forest communities respond to C and N loading and changes in kelp density. For example, MAR can be used to assess how community stability is altered by a perturbation, and can reveal how stability depends on the interactions and compensatory responses of resident species (Ives et al. 2003). Furthermore, over the next 6 years we are likely to see a transition in one or more major press drivers (e.g., ENSO). Thus, we will be positioned to compare how responses to pulse perturbation change as a function of these larger press forcings. The structure of kelp communities is not just a response to, but it also is a control of the fluxes of energy and matter that are central to kelp ecosystem functioning. Given this, Theme 3 of our work seeks to identify crucial feedbacks between kelp ecosystem structure and function, and quantify the resulting indirect effects of abiotic drivers. We will be gathering the data needed to characterize many of these direct and indirect pathways, and will take advantage of newly emerging statistical tools such as structural equation modeling (SEM) to test our hypotheses using long-term monitoring data (e.g., Shipley 2000). For example, one potentially important feedback occurs between N loading, kelp ecosystem production, and benthic community diversity. N loading directly affects both kelp production and benthic community diversity, but indirectly affects community diversity through changes in kelp production. To characterize these pathways, we have already proposed to initiate a long-term experiment. We will complement this experiment by using our monitoring data to construct an SEM that quantifies the direct and indirect effects of N-loading on community diversity. SEM and related approaches are powerful but data intensive tools. We now have the data required to formally test causal hypotheses regarding feedbacks and evaluate which best explain the covariance structure in our data. The ultimate goal of our program is to understand the kelp forest ecosystem well enough to accurately predict how it will respond to environmental change. Complete synthesis requires merging the effects of large scale climatic and oceanic drivers and their influence on regional scale processes with societal/economic changes to predict how reef processes respond over periods ranging from weeks to decades. Multiple modeling approaches are required to achieve this goal. The suite of quantitative models we have been developing during our first LTER funding cycle and new ones we propose to develop are described below and are illustrated in Figure 2-25. The first four of these models are operational, and we are in a position to begin to link them together to see if they accurately predict how climate change affects the delivery of C and N to and from the kelp forest ecosystem. The final two are in their infancy, and we plan to develop these substantially over the next funding cycle so that they can be used to predict how delivery of N and C alters attributes of communities within the kelp beds themselves. 1. Physiological model of kelp production – We are developing a bio-optical model that uses three independent variables to make quantitative predictions about the dynamics of kelp productivity. The independent variables are (1) the light field within the kelp canopy, (2) vertical distribution of biomass within the forest, and (3) light-nitrogen-productivity relationships for kelp. The output of the model is: (i) temporal patterns of kelp forest productivity, (ii) the relative roles of production by phytoplankton vs. macrophytes in this system, and (iii) the role of varying nutrient inputs in regulating overall system productivity. Preliminary versions of this model exist (Zimmerman 2003) and improvements will be made during this funding cycle. 2. Watershed-runoff model – We have developed a GIS-based watershed model that uses discharge and rainfall data to simulate rainfall-runoff and routing processes from both undisturbed and urban land (Beighley et al. 2003, 2005). This model simulates runoff from three sources: surface, shallow soils, and groundwater and is used to predict nutrient
2-19

inputs into the coastal ocean (Leydecker et al. in review). We are extending this modeling to include particulates and expanding it regionally into the Santa Clara and Ventura river basins. We will couple it with Land Use-Land Cover Change models described below. 3. Land Use-Land Cover Change model – Application of the SLEUTH land use and land cover change model (Clarke and Gaydos 1998, Goldstein et al. 2003) to the South Coast region has now been completed. We are presently linking its predictions of land use change to stream transport models of nitrogen and phosphate loading to the coastal ocean (Robinson 2006). To further analyze land cover and land use change in the region, new and historical air photos at a variety of scales have been reregistered and manually interpreted. These data will allow us to add a new component to SLEUTH - a dynamic model that uses Markov chains to predict transition probabilities in changes of land use. 4. Nearshore ocean physical transport model – A series of dynamical models have been developed to model ocean material transport in the nearshore waters. We will use existing mean flow advective - eddy diffusive (Gaylord and Gaines 2000) and/or Markov chain particle dispersion models (Siegel et al. 2003) to assess how terrestrial inputs are mixed in the nearshore ocean and affect kelp forests. We also plan to implement time-dependent, 3-D circulation models for SBC sites (Mitarai et al. 2006, Siegel et al. in review). The dynamic models will enable us to model the detailed processes by which nutrient and sediment exports from freshwater streams mix with ocean waters and are ultimately transported to kelp forests. 5. Metapopulation model for giant kelp – Analyses of time series of kelp biomass and cover and the dynamics of kelp spore dispersal (Reed et al. 2006a) provide estimates of the key parameters required to implement a metapopulation model of kelp spatiotemporal dynamics for the Southern California Bight. We will implement this model over the next proposal cycle and validate its performance using analyses of SPOT imagery and data from aerial observations (http://sbcdata.lternet.edu/catalog/index.jsp). 6. Kelp forest food web model – One of our ultimate goals is to understand how climate change affects kelp forest community structure. Towards this goal, we will build simple food web models that complement and guide interpretation of our experiments and monitoring of biota. We will start by using existing food web models that incorporate spatial subsidies into discrete time Lotka-Volterra expressions for species dynamics (Polis et al. 1997, Loreau et al. 2003). These models will be modified to include 3 trophic levels (primary producers and two classes of consumers), with each level characterized by 1 to 3 components representing the major functional groups (kelp, phytoplankton, understory algae, sessile filter feeders, top-level predators, detritivores, etc.). Models will be further modified to incorporate subsidies from land and ocean sources that vary asynchronously with differing magnitudes. They will be parameterized using available SBC-LTER data so that sensitivity analyses of the numerical simulations can be used to identify parameters that exert the greatest influence over community structure. Further development and integration of the above components are crucial steps towards our attempt to develop a synthetic model of the SBC-LTER ecosystem (Figure 2-25). We anticipate making significant progress towards our goal of developing an integrated model by the end of our next funding cycle. Moving towards this goal will lead to improved understanding of the important inter-system links in kelp forest ecosystems and changes that are mediated by key press and pulse drivers.
2-20

Table 2-1. Long-term core monitoring at SBC LTER. Additional measurements will be made in anticipation of and in response to episodic events (e.g., ENSO, fire, etc.). Ongoing monitoring Habitat Spatial extent Sampling frequency Variables measured Land 8 sites Event-based and
weekly to biweekly • Stream chemistry (nitrate, ammonium, phosphate, total
dissolved nitrogen, total particulate nitrogen, total dissolved phosphorus, total particulate phosphorus, particulate organic carbon, C13, N15, total suspended sediments, conductivity)
18 sites Continuous • Stream discharge 12 sites Continuous • Precipitation Reef Southern
California Bight 4 x per year • Aerial surveys of giant kelp canopies
Santa Barbara Channel
Monthly • SPOT imagery of giant kelp canopy dynamics
11 sites Annual in summer • Population dynamics of > 100 species of kelp forest algae, invertebrates, and fish
11 sites Every few minutes • Bottom temperature 11 island sites 3 x per year in fall • Fish abundance 11 island sites Annual in fall • Percent cover of benthic algae and sessile invertebrates 11 island sites Annual in fall • Biomass of understory algae and prey of epibenthic fishes 3 sites Monthly • Net primary production and stoichiometry of giant kelp 1 site Monthly • Dissolved and particulate nutrients (C, N, P, Si) 1 site Every few minutes • Concentrations of suspended particles & chlorophyll a 1 site Every few minutes • Current speed and direction throughout water column 1 site Every few minutes • Conductivity Offshore Channel wide Daily • Sea surface temperature, chl a, sediments using remote
sensing
Table 2-2. Primary data and samples collected during 15 UNOLS cruises of the Santa Barbara Channel during 2000 to 2005. Values shown are depths of collection. Sampling depths are for both the station grid and the Plumes and Blooms line unless otherwise noted. See http://sbcdata.lternet.edu/catalog/metacat?action=read&qformat=sbclter&docid=knb-lter-sbc.1006 for a complete list of variables measured on each cruise.
Towed Vehicle surveys
Station Grid (25 stations) Plumes and Blooms line (7 stations)*
Sensor Data Conductivity Surface to 150m Surface to 10m above bottom Temperature Surface to 150m Surface to 10m above bottom Pressure Surface to 150m Surface to 10m above bottom Dissolved Oxygen Surface to 150m Surface to 10m above bottom Chlorophyll Fluorescence Surface to 150m Surface to 10m above bottom Light attenuation Surface to 150m Surface to 10m above bottom ADCP currents Surface to 150m Upper 100-300 m PAR Surface to 10m above bottom Water Samples POC surface 7 depths (1-75 m) PON surface 7 depths (1-75 m) Phytoplankton chlorophyll surface 7 depths (1-75 m) Inorganic nutrients surface 7 depths (1-75m) 14C primary production 5 m only (Grid)
7 depths (1-75m) Plumes and Blooms line Phytoplankton Pigments (HPLC-21 pigments)
5 m only
N and C isotopes Surface or 5m
2-21

Abiotic drivers
kelp forest community “structure”
kelp forest ecosystem functioning
Giant kelp forestspecies diversity
trophiccomplexity
Communitystate
1° production
Food chain support
Theme 3: Indirect effects of drivers & biological feedbacks
Theme 2: Direct and interactive effects of
key drivers
Long-term “press” drivers
ENSO, PDO, global warming, land use
Short-term “pulse” drivers
runoff, upwelling, internal waves, coastal eddies, large
swells, etc
Theme 1: Influence of drivers on supply
rates of C & N
Elementcycling
Figure 2-1. Conceptual framework of the proposed research. Specific research questions and hypotheses are organized under one of three central themes. The solid black arrows represent the influx of physical disturbance and chemical subsidies as influenced by abiotic press and pulse drivers. The ecological consequences of interactions between press and pulse drivers (dashed arrow) are manifested over a time period that is greater than the six year funding cycle, which necessitates the need for long-term research.
THEME 1: The influence of abiotic press and pulse drivers on rates of delivery of N and C to giant kelp forests • QUESTION 1a. How are the rates of delivery of N and organic C to giant kelp forests from terrestrial
and oceanic environments altered by press and pulse drivers? • QUESTION 1b. What are the sources and fate of dissolved and particulate organic matter in the
nearshore zone? THEME 2: The direct and interactive effects of key press and pulse drivers on kelp forest community structure and function through the modification of nutrient supply and wave disturbance • QUESTION 2. How do wave disturbance and N loading act and interact to influence the structure,
function, and resilience of the kelp forest ecosystem? THEME 3: The indirect effects of pulse and press drivers on kelp forest community structure and function and the feedbacks between structure and function • QUESTION 3a. How does the negative effects of giant kelp on understory algae and phytoplankton
interact with wave disturbance and N loading to affect the magnitude and interannual variability of NPP of the kelp forest ecosystem?
• QUESTION 3b. How does the forest interact with its flow environment to modify the delivery of N and C and influence the species composition and performance of kelp forest biota?
2-22

Figure 2-2. Regional map of SBC LTER. The site boundaries extend from Pt. Conception in the west to the Santa Clara River in the east, from the top of the Santa Ynez Mountains in the north out to the Channel Islands.
~ Santa Barbara Channel ~
Los Angeles, CA
Figure 2-3. Map depicting various land uses within the Santa Barbara Coastal Long Term Ecological Research site. Study watersheds are outlined in black.
2-23
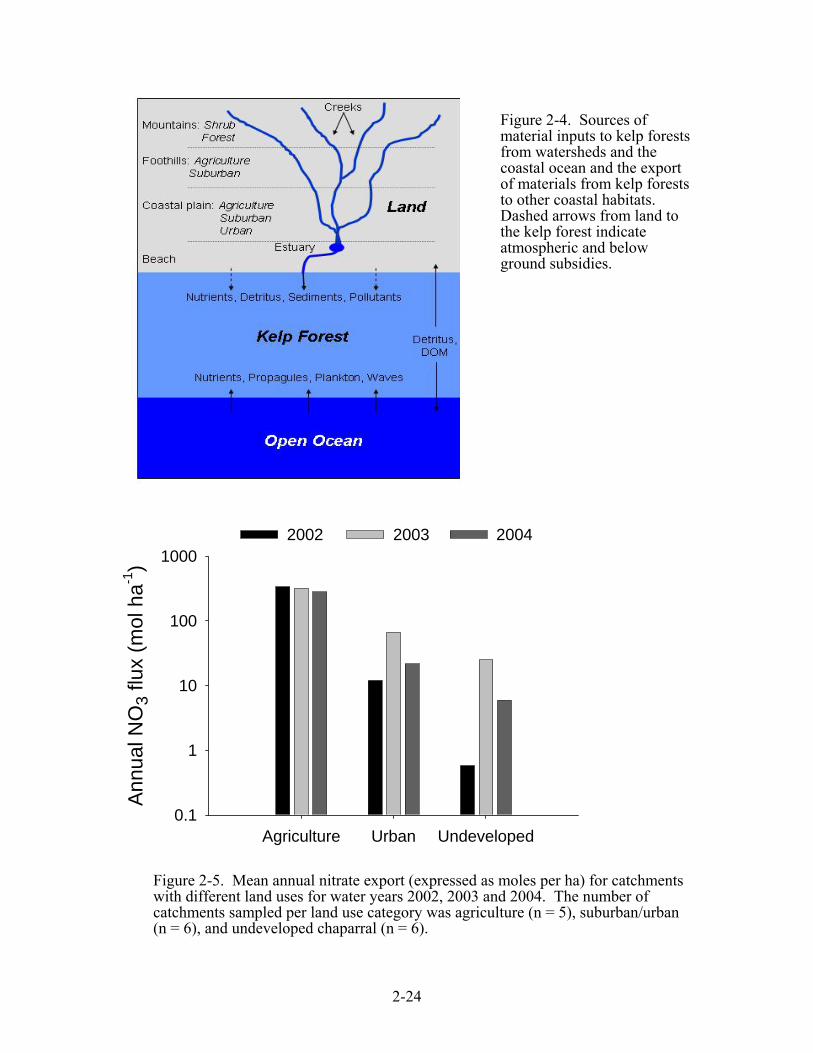
Figure 2-4. Sources of material inputs to kelp forests from watersheds and the coastal ocean and the export of materials from kelp forests to other coastal habitats. Dashed arrows from land to the kelp forest indicate atmospheric and below ground subsidies.
Figure 2-5. Mean annual nitrate export (expressed as moles per ha) for catchwith different land uses for water years 2002, 2003 and 2004. The number ocatchments sampled per land use category was agriculture (n = 5), suburban/(n = 6), and undeveloped chaparral (n = 6).
Agriculture Urban Undeveloped
Annu
al N
O3
flux
(mol
ha-1
)
0.1
1
10
100
10002002 2003 2004
ments f urban
2-24

1955 1960 1965 1970 1975 1980 1985 1990 1995 2000 2005
Mea
n Se
a Su
rface
Tem
pera
ture
(o C)
14
15
16
17
18
mean = 15.9
Non-El NinoEl Nino
b)
1955 1960 1965 1970 1975 1980 1985 1990 1995 2000 2005
Annu
al P
reci
pita
tion
(cm
)
0
20
40
60
80
100
120
140
160
180
mean = 66.3
Non-El NinoEl Nino
a)
Figure 2-6. (a) Annual precipitation for the city of Santa Barbara, and (b) mean sea surface temperature in Santa Barbara Harbor for El Niño and non El Niño years during the period 1955 to 2004. El Niño and non El Niño years were determined by the Multivariate ENSO Index (Wolter and Timlin 1998 http://www.cdc.noaa.gov/people/klaus.wolter/MEI/mei.html). Years with MEI values > 0.75 in January / February were considered El Niño years. The only El Niño event since the establishment of SBC LTER was in 2003 and was relatively weak.
2-25

Oct Dec Feb Apr Jun Aug
?
a) El Niño year
Beach pore water Internal wavesUpwellingRunoff
Oct Dec Feb Apr Jun Aug
?
b) La Niña year
Oct Dec Feb Apr Jun Aug
?
a) El Niño year
Beach pore water Internal wavesUpwellingRunoff
Oct Dec Feb Apr Jun Aug
?
b) La Niña year
Figure 2-7. Diagram illustrating temporal patterns of nitrogen delivery to giant kelp forests from different sources during (a) warm nutrient-poor El Niño years, and (b) cool nutrient-rich La Niña years. Colored horizontal lines represent different mechanisms of nitrogen delivery and the thickness of the lines indicates an estimate of their relative contributions.
Wrack abundance (kg / m shoreline)0 20000 40000 60000 80000
DIN
(uM
)
1
10
100
1000
10000
100000 r2 = 0.678, P < 0.0001Figure 2-8. Concentrations of dissolved inorganic nitrogen (DIN) in intertidal porewater were significantly correlated with the standing crop of macrophyte wrack (wet biomass) on 30 beach transects within the SBC LTER in late summer. The salinity of intertidal porewater samples shown here was in the range of seawater (35 o/oo) for the majority of samples, suggesting a marine source.
2-26

Gaviota
ArroyoBurro
RefugioArroyoHondo
El Capitan
Mission
Santa MonicaFranklin
CarpinteriaRincon
City of Santa Barbara, CA
~ Santa Barbara Channel ~
BellSan Onofre
DevereuxTecolotito
AtascaderoLos Carneros
Gaviota
ArroyoBurro
RefugioArroyoHondo
El Capitan
Mission
Santa MonicaFranklin
CarpinteriaRincon
City of Santa Barbara, CA
~ Santa Barbara Channel ~
BellSan Onofre
DevereuxTecolotito
AtascaderoLos Carneros
Figure 2-9. Stream sampling and gauging sites.
0
10
20
30
24-Feb 25-Feb 26-Feb 27-Feb 28-Feb
nitr
ate
(mg/
L)flo
w (m
3 /s)
0
1
2
3
4
cond
uctiv
ity (m
S/cm
)ph
osph
ate
(mg/
L)
flownitrateconductivityphosphate
Figure 2-10. Stormflow variations in nitrate, conductivity and phosphate on Tecolotito Creek (an agricultural catchment) during the largest storm of 2004 (hydrograph shown in the background; peak flow was 28 m3s-1). The variations are typical: storm runoff diluting high background concentrations of nitrate and conductivity while sediment mobilization increases phosphate concentrations.
2-27

0.1
1
10
100
1000
10000
Greenhouse Nursery Commercial Residential Avocado Chaparral
Nitr
ate
flux
(mol
ha-1
)2002 Baseflow2002 Stormflow2003 Baseflow2003 Stormflow
Figure 2-11. Export of nitrate expressed as moles per ha for specific landscape units in the Carpinteria area. 2002 was a year with low rainfall and 2003 had slightly above average rainfall (see Figure 2-6a). Irrigation and fertilization in most of the units resulted in similar export of nitrate in both years and considerable export even during baseflow conditions. In contrast, the upper chaparral catchments exported much less nitrate, and stormflow export was an order of magnitude higher in 2003 compared to 2002.
0.1
1
10
100
1000
10000
1 19 36 51 65 84 101
catchment number
annu
al fl
ux (k
mol
es)
0
20
40
60
80
100
perc
ent l
and
use
urbanagriculture2001-NO32002-NO32003-NO3
Figure 2-12. Annual nitrate flux as kmoles per catchment for water years 2001, 2002 and
2003 for all catchments from Point Conception to the boundary of the Ventura River catchment. Fluxes were derived from runoff modeling and regression equations for nitrate export and are plotted against a background of percent agricultural and urban land uses as stacked percentages.
2-28
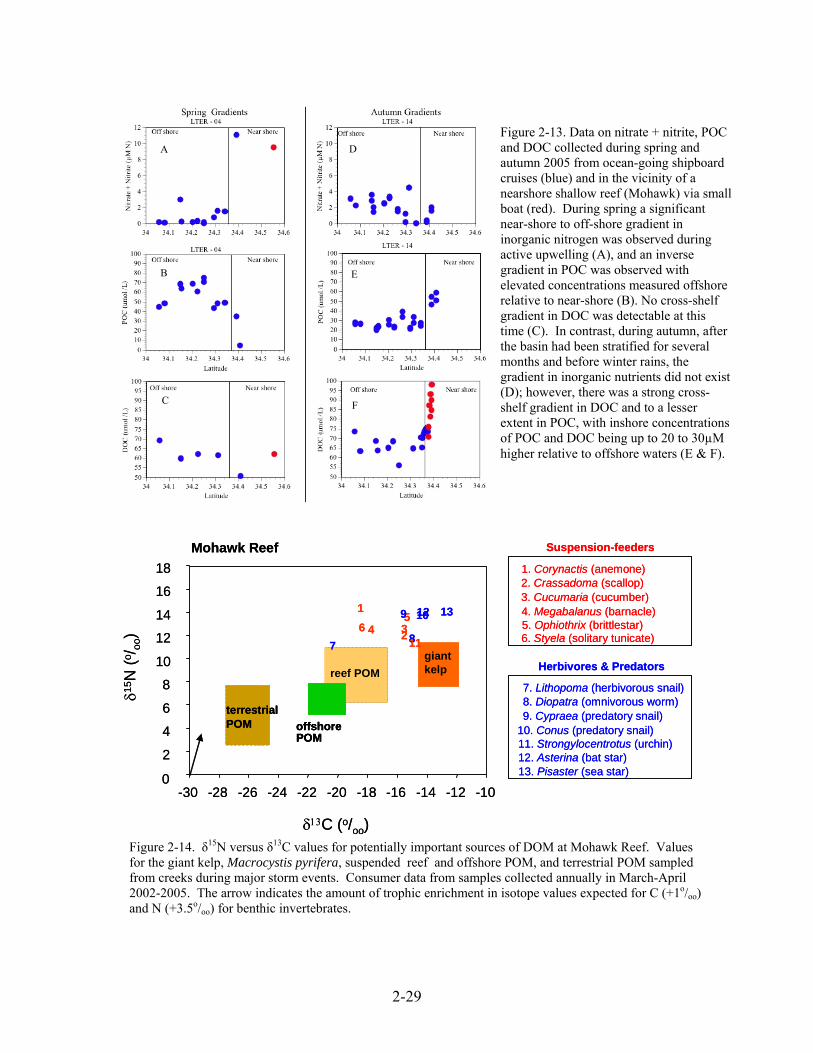
Figure 2-13. Data on nitrate + nitrite, POC and DOC collected during spring and autumn 2005 from ocean-going shipboard cruises (blue) and in the vicinity of a nearshore shallow reef (Mohawk) via small boat (red). During spring a significant near-shore to off-shore gradient in inorganic nitrogen was observed during active upwelling (A), and an inverse gradient in POC was observed with elevated concentrations measured offshore relative to near-shore (B). No cross-shelf gradient in DOC was detectable at this time (C). In contrast, during autumn, after the basin had been stratified for several months and before winter rains, the gradient in inorganic nutrients did not exist (D); however, there was a strong cross-shelf gradient in DOC and to a lesser extent in POC, with inshore concentrations of POC and DOC being up to 20 to 30µM higher relative to offshore waters (E & F).
D A
B E
C F
12
δ13C (o/oo)
Mohawk Reef
-30 -28 -26 -24 -22 -20 -18 -16 -14 -12 -10
terrestrialPOM
giantkelp
2
1
reef POM
offshorePOM
345
0
2
4
6
8
10
12
14
16
18
δ15 N
(o/ oo
) 67
9
811
1310
Suspension-feeders
6. Styela (solitary tunicate)5. Ophiothrix (brittlestar)
1. Corynactis (anemone)
4. Megabalanus (barnacle)
2. Crassadoma (scallop)3. Cucumaria (cucumber)
Herbivores & Predators
12. Asterina (bat star)11. Strongylocentrotus (urchin)
7. Lithopoma (herbivorous snail)
10. Conus (predatory snail)
8. Diopatra (omnivorous worm)9. Cypraea (predatory snail)
13. Pisaster (sea star)
12
δ13C (o/ )
Mohawk Reef
-30 -28 -26 -24 -22 -20 -18 -16 -14 -12 -10
terrestrialPOMterrestrialPOM
giantkelp
2
1
reef POM
offshorePOMoffshorePOM
345
0
2
4
6
8
10
12
14
16
18
δ15 N
(o/ oo
) 67
9
811
1310
Suspension-feeders
6. Styela (solitary tunicate)5. Ophiothrix (brittlestar)
1. Corynactis (anemone)
4. Megabalanus (barnacle)
2. Crassadoma (scallop)3. Cucumaria (cucumber)
Herbivores & Predators
12. Asterina (bat star)11. Strongylocentrotus (urchin)
7. Lithopoma (herbivorous snail)
10. Conus (predatory snail)
8. Diopatra (omnivorous worm)9. Cypraea (predatory snail)
13. Pisaster (sea star)
oo
Figure 2-14. δ15N versus δ13C values for potentially important sources of DOM at Mohawk Reef. Values for the giant kelp, Macrocystis pyrifera, suspended reef and offshore POM, and terrestrial POM sampled from creeks during major storm events. Consumer data from samples collected annually in March-April 2002-2005. The arrow indicates the amount of trophic enrichment in isotope values expected for C (+1o/oo) and N (+3.5o/oo) for benthic invertebrates.
2-29

Land
Kelp Forest
Open OceanDissolved Nutrients Phytoplankton
Zooplankton
Sessile Filter FeedersMacroalgae
Herbivores/Detritivores
Predators(Fish, Mammals)
(Sea Urchins, Snails,)
Predators(Small Fish
Mobile Invertebrates)
Predators(Large Fish, Mammals)
POM
POM/DOMDissolved Nutrients
POM/DOM
Kelp forest food webRunoff (inorganic nutrients, POM, DOM)
Dec
ompo
sers
Beach wrack
POM/DOM
Decom
posers
Phytoplankton Zooplankton POM
Figure 2-15. Generalized kelp forest food web and trophic structure.
Year1980 1985 1990 1995 2000 2005
Pac
hyth
yone
rubr
a de
nsity
log 10
(1+
no. m
-2)
1
10
100
1000
10000
Figure 2-16. Mean density of the small sea cucumber Pachythyone rubra at 11 sites on Santa Cruz Island estimated from annual surveys during the period 1982-2004.
2-30
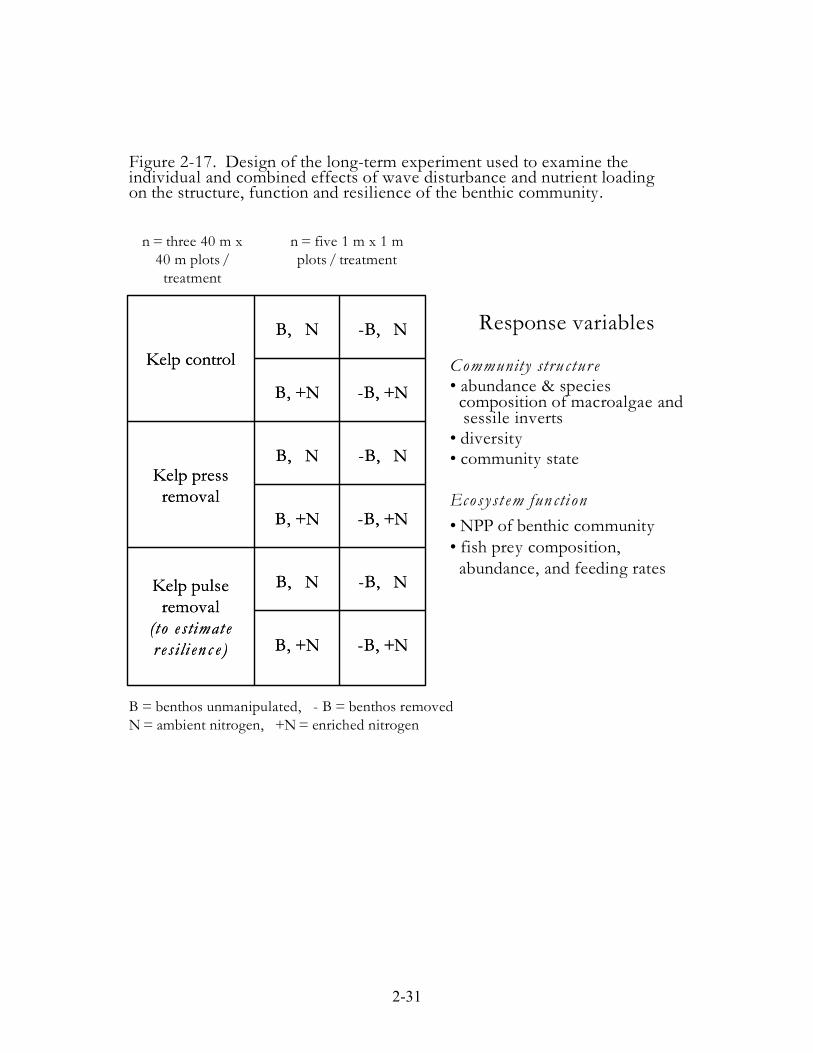
-B, +NB, +N
-B, NB, NKelp pulse removal
(to e stimat e r e s ili en c e )
-B, +NB, +N
-B, NB, NKelp press removal
-B, +NB, +N
-B, NB, N
Kelp control
-B, +NB, +N
-B, NB, NKelp pulse removal
(to e stimat e r e s ili en c e )
-B, +NB, +N
-B, NB, NKelp press removal
-B, +NB, +N
-B, NB, N
Kelp control
Figure 2-17. Design of the long-term experiment used to examine the individual and combined effects of wave disturbance and nutrient loading on the structure, function and resilience of the benthic community.
B = benthos unmanipulated, - B = benthos removedN = ambient nitrogen, +N = enriched nitrogen
Response variables
Community stru ctur e• abundance & species
composition of macroalgae andsessile inverts
• diversity• community state
Ecosy st em fun cti on• NPP of benthic community• fish prey composition,
abundance, and feeding rates
n = five 1 m x 1 m plots / treatment
n = three 40 m x 40 m plots /
treatment
2-31

M e a n s ig n ifica n t w a ve h t (m )0 .5 1 .0 1 .5 2 .0
Sta
ndin
g cr
op (k
g m
-2)
0 .0
0 .5
1 .0
1 .5
2 .0
R 2 = 0 .1 1 3P = 0 .0 0 0 3
T issu e n itro g e n (% )1 2 3 4
NP
P (d
ry m
ass
m-2
d-1)
50 .0 0
0 .0 1
0 .0 2
0 .0 3
0 .0 4
0 .0 5R 2 = 0 .0 0 6P > 0 .5
S e a w a te r n itra te (u m o l L -1)2 4 6 8 1 0 1 2 1 4
Tiss
ue n
itrog
en (%
)
0
1
2
3
4
5
R 2 = 0 .3 2 9P < 0 .0 0 0 1
c .
d .
S ta n d in g c ro p (kg m -2)0 .0 0 .5 1 .0 1 .5 2 .0
NP
P (g
dry
mas
s m
-2d-1
)
0
1 0
2 0
3 0
4 0R 2 = 0 .6 2 3P < 0 .0 0 0 1
a .
b .
Figure 2-18. Comparison of the mean and interannual variability in aboveground NPP of different biomes in the LTER network. Data from the arctic, desert, grassland, oldfields and forest biomes are from Knapp and Smith (2001). Data for giant kelp are from SBC LTER during the period June 2002 to June 2005.
ArticDesert
Grassland
Oldfields
ForestGiant Kelp
NP
P (g
dry
mas
s m
-2 y
-1)
0
500
1000
1500
2000
2500
ArticDesert
Grassland
Oldfields
ForestGiant Kelp
NPP
inte
rann
ual C
V (%
)
0
10
20
30
40
50
60
70
Figure 2-19. Net primary production (NPP) of giant kelp was positively related to its standing crop (a), which in turn is significantly reduced by disturbance from large wave events (b). The nitrogen content of kelp tissue was relatively high during the 3 year study period (usually > 1.5%) and did not explain any significant variation in NPP (c). Kelp tissue N was significantly related to ambient seawater nitrate during this period (d) suggesting that the amount of nitrogen in kelp tissue is influenced significantly by the concentration of nitrate in seawater.
2-32

a. Spring
b. Summer
a. Spring
b. Summer
Figure 2-20. Means and principal components of variability of the currents at Mohawk Reef during (a) spring and (b) summer sampling periods of 2005. The light grey shading represents the extent of the kelp forest. The radii along the long semi-axes of the ellipses indicate standard deviations in alongshore velocity, while the radii in the perpendicular direction indicate standard deviations in cross-shore velocity.
Wat
er D
epth
, m
Outside of the Kelp Bed
5 cm/s N
oC0 3 6 9 12 15 18 21 24
0369 14
16
18
Wat
er D
epth
, m
Outer Edge
0 3 6 9 12 15 18 21 24
0
3
614
16
18
Hours on 08/26/05
Wat
er D
epth
, m
Inside
0 3 6 9 12 15 18 21 24
0
3
614
16
18
Figure 2-21. Isotherms, cross-shore flows (white arrows), and tidal stage (upper black lines in each panel) at stations located outside, at the outer offshore edge, and inside of the kelp forest at Mohawk Reef during the study illustrated in Fig. 2-21b. Cold, nutrient rich water from internal wave upwelling did not fully penetrate the kelp forest leading to spatial differences in the supply of nutrients. Fronts of nearshore warm water induced by the complex interactions of bathymetry and flow reduced the time upwelled water remained in the bed. This process, along with the offshore flows introduced by downwelling, promotes connectivity between the forest and the nearshore.
2-33

Figure 2-22. Profiles measured at three stations across the giant kelp forest at Mohawk Reef on May 21, 2002. Station A (blue), outside the forest and 20 m upcurrent of the edge. Station B (green), 10 m inside the forest. Station C (red), 40 m inside the forest.
Figure 2-23. SPOT 5 subscene of kelp cover from December 25, 2004. This subscene spans Naples to Mohawk reefs. Kelp forests are delineated with the green outline and orange pixels in the interior.
2-34
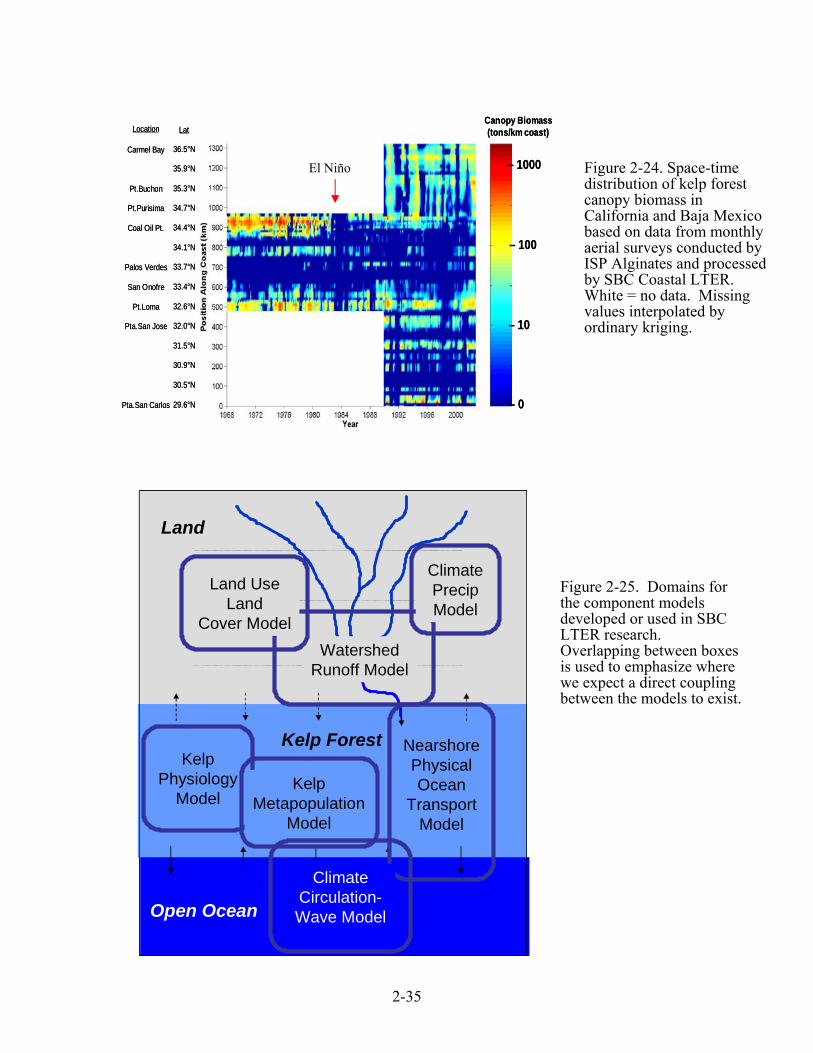
– 1000
– 100
– 10
– 0
Canopy Biomass(tons/km coast)
– 1000
– 100
– 10
– 0
Canopy Biomass(tons/km coast)
36.5°N
35.9°N
35.3°N
34.7°N
34.4°N
34.1°N
33.7°N
33.4°N
32.6°N
32.0°N
31.5°N
30.9°N
30.5°N
29.6°N
LatLocation
Carmel Bay
Pt.Buchon
Pt.Purisima
Coal Oil Pt.
Palos Verdes
San Onofre
Pt.Loma
Pta.San Jose
Pta.San Carlos
36.5°N
35.9°N
35.3°N
34.7°N
34.4°N
34.1°N
33.7°N
33.4°N
32.6°N
32.0°N
31.5°N
30.9°N
30.5°N
29.6°N
LatLocation
Carmel Bay
Pt.Buchon
Pt.Purisima
Coal Oil Pt.
Palos Verdes
San Onofre
Pt.Loma
Pta.San Jose
Pta.San Carlos
Figure 2-24. Space-time distribution of kelp forest canopy biomass in California and Baja Mexico based on data from monthly aerial surveys conducted by ISP Alginates and processed by SBC Coastal LTER. White = no data. Missing values interpolated by ordinary kriging.
El Niño
Kelp Forest
Land
Open Ocean
Watershed Runoff Model
Land Use Land
Cover Model
Nearshore Physical Ocean
Transport Model
Kelp Physiology
ModelKelp
Metapopulation Model
ClimatePrecipModel
ClimateCirculation-Wave Model
Kelp Forest
Land
Open Ocean
Watershed Runoff Model
Land Use Land
Cover Model
Nearshore Physical Ocean
Transport Model
Kelp Physiology
ModelKelp
Metapopulation Model
ClimatePrecipModel
ClimateCirculation-Wave Model
Figure 2-25. Domains for the component models developed or used in SBC LTER research. Overlapping between boxes is used to emphasize where we expect a direct coupling between the models to exist.
2-35

SECTION 3 - SITE MANAGEMENT Governance The research management plan for the Santa Barbara Coastal LTER program encompasses several important focal areas, including internal project governance, project resource allocation and acquisition, day-to-day running of the project, site plan and preservation, agency relations (including NSF) and interactions with the LTER network of sites. We will continue to govern our project using an Executive Committee which has proved to be both effective and efficient. The Executive Committee will consist of the PI (Reed), Co-PIs (Gaines, Holbrook, Melack, and Siegel) and three Associate Investigators. The PI and Co-PIs will serve on the Executive Committee for the entire six-year funding period. The Associate Investigators on the Executive Committee are rotator positions and will be filled by individuals taking lead roles in short-term (i.e., 2-3 year) studies that are ongoing at the time of their appointment. The Executive Committee is responsible for making all major decisions pertaining to the project’s research direction, strategic planning, resource allocation, administrative policies, and staffing. The Executive Committee meets biweekly during the academic year and intermittently during the summer. The two hour meetings, which frequently include short progress reports of ongoing research and education activities, are open to all project personnel and the format allows for open discussion from all in attendance. General discussion is taken into consideration by the Executive Committee and their decisions are generally reached by consensus. The meetings serve to keep everyone informed of the project’s broad range of activities, which aids in coordination and integration of the different project components. Minutes of all meetings are posted on the internal folder on the SBC server and are distributed to all project personnel via email. Project management Day to day management of the project is overseen by PI Reed with assistance from a 50% time Project Coordinator. Management activities include: (1) coordinating the activities of different research groups to maximize efficiency and integration, (2) working with the Outreach Coordinator and SBC investigators to integrate the project’s research and education activities, (3) facilitating the transfer of data and other information from project personnel to the SBC Information Manager, (4) responding to inquires and requests from the LTER Network and non-LTER entities, (5) scheduling and planning project meetings and events, (6) preparing project related reports and proposals, and (7) serving as the site representative at meetings and functions on and off campus. Fund allocation will be structured around the three primary research themes (Section 2- Proposed Research) with a lead investigator assigned to each theme. A separate allotment of funds will be set aside cover the costs of project management, information management, and core long-term measurements. Information exchange The coordination of research and the exchange of information and ideas are facilitated by the fact that 19 of our 23 investigators are located at UCSB. Informal and scheduled meetings involving investigators, post docs, students and staff to discuss project related business occur on a daily basis. The sharing of data, documents, and other project related products is made easy through our central data server which all participants (UCSB and non-UCSB) have access to (see Section 4 - Information Management). In addition to our open biweekly Executive Committee meetings, we hold an annual retreat for all SBC LTER participants and other interested parties to insure coordination across the SBC LTER program and to enhance interdisciplinary discussions. This event has been well attended in the past and has served as an excellent venue for information exchange and team building. Beginning in 2006, we plan to broaden the scope of this event by convening a joint meeting with researchers and educators from the Moorea Coral Reef LTER. A number of SBC investigators are also affiliated with MCR and a joint meeting between the two sites will be especially helpful
3-1
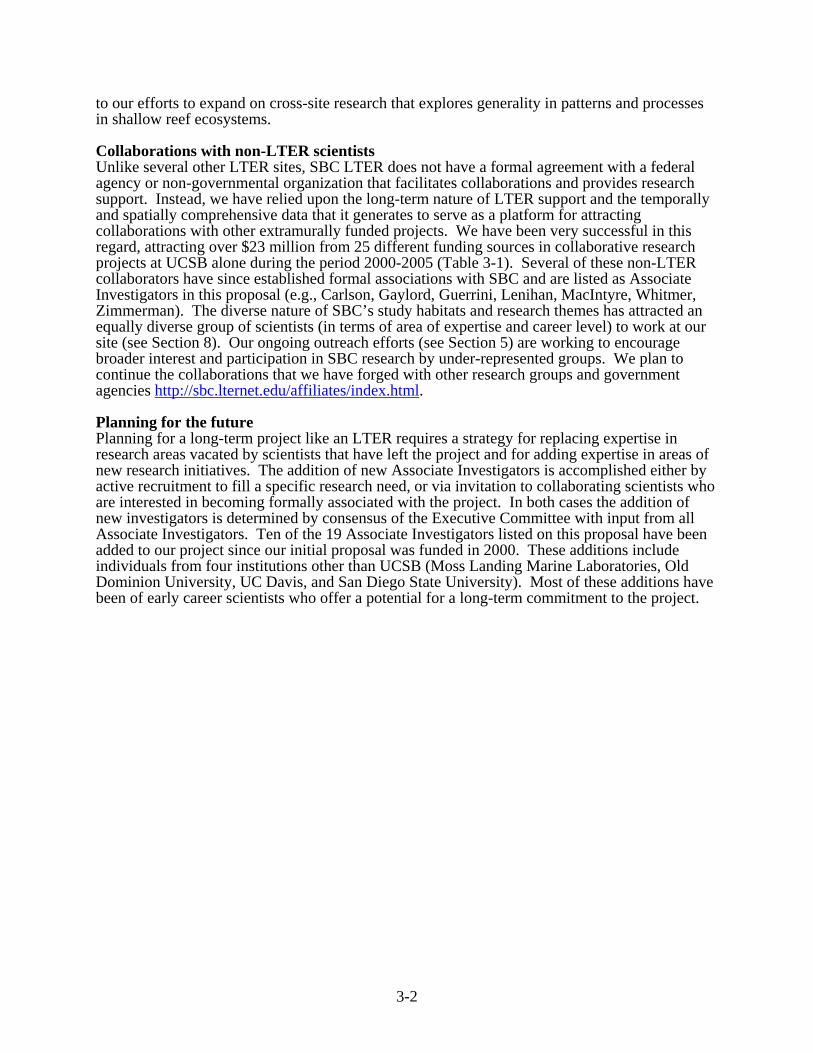
to our efforts to expand on cross-site research that explores generality in patterns and processes in shallow reef ecosystems. Collaborations with non-LTER scientists Unlike several other LTER sites, SBC LTER does not have a formal agreement with a federal agency or non-governmental organization that facilitates collaborations and provides research support. Instead, we have relied upon the long-term nature of LTER support and the temporally and spatially comprehensive data that it generates to serve as a platform for attracting collaborations with other extramurally funded projects. We have been very successful in this regard, attracting over $23 million from 25 different funding sources in collaborative research projects at UCSB alone during the period 2000-2005 (Table 3-1). Several of these non-LTER collaborators have since established formal associations with SBC and are listed as Associate Investigators in this proposal (e.g., Carlson, Gaylord, Guerrini, Lenihan, MacIntyre, Whitmer, Zimmerman). The diverse nature of SBC’s study habitats and research themes has attracted an equally diverse group of scientists (in terms of area of expertise and career level) to work at our site (see Section 8). Our ongoing outreach efforts (see Section 5) are working to encourage broader interest and participation in SBC research by under-represented groups. We plan to continue the collaborations that we have forged with other research groups and government agencies http://sbc.lternet.edu/affiliates/index.html. Planning for the future Planning for a long-term project like an LTER requires a strategy for replacing expertise in research areas vacated by scientists that have left the project and for adding expertise in areas of new research initiatives. The addition of new Associate Investigators is accomplished either by active recruitment to fill a specific research need, or via invitation to collaborating scientists who are interested in becoming formally associated with the project. In both cases the addition of new investigators is determined by consensus of the Executive Committee with input from all Associate Investigators. Ten of the 19 Associate Investigators listed on this proposal have been added to our project since our initial proposal was funded in 2000. These additions include individuals from four institutions other than UCSB (Moss Landing Marine Laboratories, Old Dominion University, UC Davis, and San Diego State University). Most of these additions have been of early career scientists who offer a potential for a long-term commitment to the project.
3-2

Table 3-1. The various agencies and the level of funding that they provided for research projects that collaborated with the Santa Barbara Coastal LTER during the period 2000-2005. Funding Agency Amount 1. American Museum of Natural History, Lerner Gray Fund $1,0002. Andrew W. Mellon Foundation $534,0003. Boyd Foundation $130,0004. California State Parks & Recreation. Department $8,4655. California Coastal Commission $3,653,5016. California Coastal Conservancy $1,186,5397. California Cooperative Ecosystem Studies Unit – National Park Service $80,0008. California Dept. of Fish and Game $15,5589. UC Sea Grant $122,41310. Channel Islands National Marine Sanctuary Foundation $30,45611. David and Lucile Packard Foundation $8,400,00012. Dept. of Defense US. Air Force $49,13813. Environmental Protection Agency $1,890,00014. Homeland Foundation $30,00015. Minerals Management Service $853,95916. National Aeronautics & Space Administration $1,710,22117. National Endowment for the Humanities $158,40118. National Oceanic and Atmospheric Administration $320,02519. National Park Service $29,60220. National Science Foundation $3,746,19121. Office of Naval Research $228,47622. Shoreline Preservation Fund $12,00023. UC Marine Council $646,67724. US Department of Interior $49,20825. Worster Foundation $10,000 Total funding $23,895,830
3-3

SECTION 4 – INFORMATION MANAGEMENT
General description The primary objective of the SBC LTER IM system is to facilitate research and outreach efforts by focusing on data organization and integrity, ease of access, and long-term preservation. To serve researchers with diverse, discipline-specific backgrounds, it has been important to implement an open, cross-platform system that is largely based on Internet standards rather than on vendor-specific technology. We have leveraged existing systems where possible, and are building new tools geared toward collaboration and interoperability. SBC LTER leverages the UC Santa Barbara campus network infrastructure, and works closely with the National Center for Ecological Analysis and Synthesis (NCEAS), the Institute for Computational Earth Systems Science (ICESS), and the Partnership for Interdisciplinary Studies of Coastal Oceans (PISCO). PISCO has provided the server-side software and hardware systems to support the SBC LTER information management program. PISCO and SBC LTER are also establishing common data processing standards and code. A new LTER site, Moorea Coral Reef (MCR), was recently established at UCSB, and shares several scientists and sampling protocols with SBC. MCR has joined our IM group. Our information management team is composed of Margaret O’Brien (SBC’s information manager), Chris Jones (PISCO’s Data Coordinator at UCSB), and Jordan Morris (server administrator). We work closely with the scientists responsible for creating code for data processing and analyses, usually to establish data processing standards and to automate insertion of data into the catalog. The combined background of this group encompasses natural science, scientific computing, data management and computer science, and they readily share knowledge and expertise. SBC’s data manager attends meetings of the SBC Executive Committee, and meets frequently with scientists and project staff. Her background in oceanography and scientific programming enhances her ability to assist scientists with their data management needs. Data contributions and access All SBC members have access to the central data servers, and are encouraged to take advantage of regular backups for their work-in-progress or personal data. We maintain common data areas that have been stable for several years so that returning users will remain familiar with the structure. The directories for incoming data are maintained separately from those for “final” data products that are intended to be shared between disciplines or to be published. The directory tree is publicized to facilitate browsing by new users. All that is required to view any file in this area is an SBC user account, but write-access for incoming data and data products is limited to those responsible for its collection and maintenance. With this system, data are available to all SBC members immediately. SBC has adopted and posted the LTER General Data Use Agreement, and employs the ‘Type I – II’ designations. Access to the public is through the data catalog, and currently we have no registration requirements either for browsing metadata or downloading data tables. Type I data generally are posted within 1 or 2 years of collection, although some ongoing electronic data are available much sooner. Our policy is that Type II data will be fully described in the catalog, but distribution information for the tables set to “offline”, or available by request from the researcher. We are currently exploring mechanisms to incorporate a tool that requests and logs a user’s contact information as part of the display of the data table’s online distribution. Quality control SBC’s quality-control measures have been established to be pertinent to the data collected. For example, diver-collected surveys record the observer along with the taxon to elucidate potential biases. Calibration files for electronic sensors are stored on the data server, and their use is
4-1

recorded in deployment logs. Where appropriate, we are investigating the use of EML to include instrument calibration coefficients along with posted data. Protocols for biological and chemical samples call for random blind samples and replicates, during both collection and analysis. SBC has not yet amassed a long enough time-series to accurately define constraints on the values for most measurements. The result is that, in many cases, quality is assured by visual verification during data reduction and analysis. EML-Metacat SBC has adopted Metacat and EML as a primary information storage tool, rather than just an exchange format. SBC began including metadata in the UCSB’s Metacat in EML format in 2003. As of late 2005, all of SBC’s Type I data were included in our Metacat data catalog, with about half described at Level 4-5, and the remainder at Level 2-3 (see Section 1, Table 1-2 Supplemental Documents for a list of SBC datasets). By and large, we have chosen to create data packages that describe an entire experiment or event, especially if several data tables are related in space or time and we anticipate them being used together. Our EML documents are contributed to NCEAS/LNO by replication or harvesting, depending on the compatibility of the participating Metacat installations. The variety of data types at SBC requires that we employ several strategies for inserting datasets into Metacat (Fig. 4-1). Legacy data, or datasets for which updates are not anticipated, are inserted with the desktop client, Morpho. Datasets with repetitive formats are created with scripts that modify EML templates. These include data from cruises, stream discharge gauges, and moored sensors, which comprise about 40% (by number). Many of our long-term monitoring datasets (e.g., community surveys) require individual handling for periodic updates, and are currently updated manually. Ideally, these are best handled in a semi-automated manner, programmatically updating data lines and metadata. Significant effort went into designing the XSL style sheets used to display our catalog (at http://sbc.lternet.edu/data), and this is an ongoing project. Along with our use of EML-Metacat for datasets, we have employed Metacat for another information type, our publications database. We have converted our existing publications list to a variant of EML, and created code for display and filtering. This project can be viewed at http://sbc.lternet.edu/publications. This work is currently under review by the EML development community for its potential enhancements to the EML schema. Network-Level IM contributions Our information manager is a member of the LTER Network’s EML Best Practices working group and the Unit Dictionary working group. Due to SBC’s proximity to the NCEAS Ecoinformatics staff, she confers frequently with them regarding EML and Metacat implementation, and was recently invited to join the EML Development Committee. SBC also communicates periodically with the information managers from CCE-LTER, whose study area includes the offshore waters of the Santa Barbara Channel. The Moorea Coral Reef LTER (MCR) has begun establishing their information management system at UCSB, and SBC’s data manager has been closely involved with those activities. Future plans We anticipate a long-term commitment to EML-Metacat as a data storage tool, and so our foreseeable projects will focus primarily on tools for automated EML creation and update, and for integrating EML content into the processing software used by our scientists. Our collaborations with MCR-LTER and PISCO result in an economy of scale when creating code for these projects. Some of the possible paths are illustrated in Figure 4-1, and may be applicable to a larger community. Our plans will be flexible, allowing our projects to be modified as new tools or Metacat features are introduced.
4-2
Automated EML creation. A significant proportion of SBC’s EML is created manually or from text tables. While manual editing is manageable for a small number of datasets, as the number increases, automation will be necessary. We plan to increase our use of script-modified templates for dataset creation. Also, once a data product’s format has stabilized, we would like to automate the updates, most likely by creating a web form and script based on the Perl-cgi tool bundled with Metacat. Another use of web forms would be to create a discovery-level template which SBC’s students could then customize, exposing their research projects and metadata through our data catalog. Deliver Data Products. We have existing metadata insertion functions which are able to read an EML document from within analysis software (e.g., Matlab©). These functions could be further developed to retrieve table-specific distribution and column descriptions, and read tables directly into the analysis software. Also, we anticipate that as our project grows, some data tables will become too cumbersome to handle as one unit. We would like to create a means to request specific rows and columns from such tables, or for use when an entire time series is unnecessary. Eventually, data from disparate sources must be merged. SBC is in an ideal position to help evaluate data integration tools currently under development at NCEAS (e.g., http://kepler.ecoinformatics.org/). Searching SBC datasets. We have established an SBC-specific thesaurus of keywords, which are currently used to build ‘canned’ queries from the web index to our catalog. We have found that as the volume of data increases, our search parameters and query terms must be refined. We would like to develop tools to create queries dynamically, and will closely monitor a related effort being undertaken by the LNO for the network-wide Metacat system. We also plan to leverage tools developed by NCEAS for semantic searches as they become available. Using Metacat for other information types. We have been investigating the suitability of EML and Metacat for other information types, for example, as a tool for the central storage of site descriptions, or for a taxonomic database. We have already seen that XML can replace or augment a relational database when used as content for web pages. This could also involve integrating spatial tools into the metadata framework.
4-3

Figure 4-1. SBC data flow. The variety of SBC’s data types requires that several different strategies be employed. Tools and scripts currently in use are shown in solid lines, while those planned or under construction are shown in dashed lines. The colors are categorized as follows: Purple, XSL Stylesheets for web display; Blue, inserts using ‘Morpho’; Green, metadata/data updates via webforms; Red, other scripts, either insertions, or export to analysis software (e.g., matlab, SAS).
4-4

SECTION 5 - EDUCATION AND OUTREACH
The SBC LTER has successfully developed a multifaceted, interdisciplinary approach to education and outreach that highlights and integrates the research interests of SBC investigators, students, and the general public. Our programs include active links with K-12 students and teachers, graduate and undergraduate student training, direct public outreach, and productive interactions with the media, local NGOs and agencies. Our outreach and education programs will continue to expand during the next six years as our collaborations mature and attract additional support from participants and agencies. K-12 Education: The Santa Barbara Coastal Schoolyard-LTER (SLTER) program focuses on developing SBC LTER based K-12 curricula, providing environmental education-based programming to underrepresented students from Santa Barbara, Ventura, and Los Angeles Counties, and professional development opportunities for local area teachers. In addition, we participate in cross-site projects that integrate education efforts across sites and ecological themes. Our program is supported by university facilities, including classroom and laboratory space. In particular, our SLTER co-sponsors an educational aquarium facility, The REEF, located on the UCSB campus. The REEF provides educational tours and activities to K-12 students, most of which are led by undergraduate student docents, and all of which tie directly to topics related to SBC LTER research. Our inaugural SLTER project was the development of a digital resource for teachers based on SBC research that focused on coastal watersheds. The “Virtual Tour of the Arroyo Burro Watershed” includes (1) a flyover experience in which viewers are transported from a satellite view of earth to and through a coastal watershed, (2) a natural history section that describes the various ecosystems present in local coastal watersheds (e.g., riparian, coastal chaparral, estuary, etc.) and engages viewers with stimulating questions, and (3) an interactive watershed discharge (runoff) animation that allows viewers to examine variation in discharge amounts and patterns based on changes they make to land use patterns, storm frequency, and storm intensity. The underlying topographic model and predicted water discharge patterns in the interactive tool were developed based on GIS models ground-truthed at one of our research sites. A subsequent project expanded upon this digital resource by developing a 7-part standards-based watershed lesson plan set for middle school grades. The digital resource is available as a DVD and in PDF format along with these lesson plans at: http://sbc.lternet.edu/education/index.html. All of these SLTER curricular resources have been the basis for a new summer environmental education program for underserved inner-city youth piloted in 2005, which will be a prominent component of our SLTER program in the coming years. The SBC SLTER will focus on two programmatic elements in the next 6 years: (1) a summer environmental education program for underserved youth and (2) improving ocean literacy by supporting teachers and educators to develop and implement standards-based lesson plans. Our summer environmental education program uses the theme of watershed ecology to engage students in learning about their coastal environment. In 2005 we began partnering with the Los Angeles Conservation Corp (LACC) to work with at-risk middle school aged (7th–9th grade) students from inner city Los Angeles. The primary mission of the LACC is to give at-risk youth opportunities for success by providing job skills, training, education, and work experience with an emphasis on conservation and service projects that benefit the community. LACC youth come from underrepresented groups, primarily Latino/a and African American groups, and up to 50% of these young people were previously involved in street gangs. We use a multi-step progression of field trips to research sites, after-school activities and individual counseling to engage prospective students in the SLTER program. Students selected for the SBC SLTER program become acquainted with the UCSB campus with an initial visit to our Saturdays With Scientists program. Interested students (up to 60) are then invited to a weekend camping trip at our Sedgwick Nature Reserve, which focuses on watershed ecology. Participants talk with university advisors and students about their future as college students. SBC SLTER staff follow
5-1

up by providing after-school activities and visits over the following months. Finally, up to 40 students are invited to participate in a weeklong residential program on the UCSB campus. These students are engaged in SBC LTER research based learning activities, conduct field research, and explore the possibility of attending a 4-year college. Follow up with students and their families provides college counseling and application advice as well as support of Spanish language classes for parents on post-secondary educational opportunities in California. Evaluations suggest that our program has significant impact in terms of student confidence in science, in content knowledge on environmental science topics, and in interest in pursuing a college education. Our curriculum development and implementation program is focused on bringing teachers and scientists together to engage each other in identifying appropriate topics for science standards-based lesson plans and in engaging students in field-based research and monitoring. To maximize our outreach capabilities, we have partnered with the Channel Islands National Marine Sanctuary and the Santa Barbara Watershed Resource Center to provide professional development to teachers, to provide students with field experiences, and to disseminate middle and high school level science lesson plans. We have been successful in attracting EdEn funds in the last 2 years and our educators will continue to engage in such scholarly activities. The first EdEn award supported work with local teachers on integrating ocean-based topics into their curriculum. These efforts are attuned to national efforts to improve ocean literacy, particularly through the development of standards-based K-12 lesson plans. The second EdEn award is a cross-site effort of 4 SLTER projects (BES, KBS, SBC, and SGS), which to our knowledge, is the first cross-site SLTER effort. These four sites are working together to assess environmental literacy in K-12 students, including examining current knowledge in students from varied ecological, cultural, and ethnic backgrounds. Results will be used to examine reliability and validity of the measures as well as aid in a larger-scope project based at Michigan State University in developing a national environmental literacy learning progression. SBC K-12 education activities will continue to extend well beyond SLTER and EdEn collaborations. A number of SBC investigators are committed to giving lectures, contributing to classroom curricula and mentoring student projects in local K-12 schools on LTER-related topics (e.g., kelp forest ecology, watershed processes, ocean circulation, sandy beach ecology). University Education and Training: University education and training are tightly integrated into all aspects of SBC research with active participation of postdocs and graduate and undergraduate students. Teachers and the general public also regularly participate in our stream sampling program, gaining first-hand knowledge of watershed processes. SBC-LTER graduate student and postdoctoral training emphasizes the use of interdisciplinary research to examine responses of coastal ecosystems to environmental changes. Our activities and seminars provide cross training on environmental issues pertaining to coastal ecosystems and provide students and postdocs with a common language for communicating scientific information on these issues. Our program includes students and postdocs working in terrestrial, aquatic, and marine environments with diverse interests and seeks to create a scientific community that has an understanding, respect, and appreciation for other disciplines. Public Outreach: Ongoing and continuing SBC outreach activities are diverse and include numerous public presentations on LTER related research to non-scientist groups, education and training of public stakeholder groups (e.g. Santa Barbara Channel Keeper, Surfrider and the Friends of the Santa Clara River), leading natural history tours, contributions on LTER research to news and film products for the public. SBC investigators will also continue to participate in several public working groups to provide education, advice, and a scientific perspective for decision makers and stakeholder groups addressing policies for coastal management, land use, and marine reserves. Additional information on these activities can be found in our most recent annual report (http://sbcdata.lternet.edu/external/Documents/Annual-Reports/SBC_LTER_Annual_Report_2006.pdf).
5-2
SECTION 6 - LITERATURE CITED Anderson, T. W. and B. D. Sabado. 1995. Correspondence between food availability and
growth of a planktivorous temperate reef fish. Journal of Experimental Marine Biology and Ecology 189: 65-76.
Bassin, C. J., L. Washburn, M. A. Brzezinski and E. E. McPhee-Shaw. 2005. Sub-mesoscale coastal eddies observed by high frequency radar: A new mechanism for delivering nutrients to kelp forests in the Southern California Bight. Geophysical Research Letters 32: L12604, doi:10.1029/2005GL023017.
Bauer, J. E. 2002. Carbon isotopic composition of DOM. Pages 405-453 in D. A. Hansell and C. A. Carlson, editors. Biogeochemistry of marine dissolved organic matter, Elsevier Science Publishers.
Beighley, E., J. M. Melack and T. Dunne. 2003. Impacts of California’s climatic regimes and coastal development patterns on streamflow characteristics. Journal of the American Water Resources Association 29:1419-1433.
Beighley, E., T. Dunne and J. M. Melack. 2005. Understanding and modeling basin hydrology: Interpreting the hydrogeological signature. Hydrological Processes 19: 1333-1353.
Booth, D. J. 2004. Synergistic effects of conspecifics and food on growth and energy allocation of a damselfish. Ecology 85:2881-2887.
Brooks, A. J., R. J. Schmitt and S. J. Holbrook. 2002. Declines in regional fish populations: have species responded similarly to environmental change? Marine and Freshwater Research 53:189-198.
Carlson, C. A. and H. W. Ducklow. 1996. Growth of bacterioplankton and consumption of dissolved organic carbon in the Sargasso Sea. Aquatic Microbial Ecology 10:68-85.
Carpenter, R. C. 1985. Relationships between primary production and irradiance in coral reef algal communities. Limnology and Oceanography 30:784-793.
Clark, R. P., M. S. Edwards and M. S. Foster. 2004. Effects of shade from multiple kelp canopies on an understory algal assemblage. Marine Ecology Progress Series 267:107-119.
Clarke, K. C. and L. Gaydos. 1998. Loose coupling a cellular automation model and GIS: Long-term growth prediction for San Francisco and Washington/Baltimore. International Journal of Geographical Information Science 12:699-714.
Coffin, R. B. and L. A. Cifuentes. 1999. Stable isotope analysis of carbon cycling in the Perdido Estuary, Florida. Estuaries 22:917-926.
Cooper, S. R. and G. S. Brush. 1991. Long-term history of Chesapeake Bay anoxia. Science 254:992-996.
Cowen, R. C., C. R. Agegian and M. F. Foster. 1982. The maintenance of community structure in a central California giant kelp forest. Journal of Experimental Marine Biology and Ecology 64:189-201.
Coyer, J. A. 1979. The invertebrate assemblage associated with Macrocystis pyrifera and its utilization as a food source by kelp forest fishes. PhD dissertation. University of Southern California.
Dayton, P. K. and M. J. Tegner. 1984. Catastrophic storms, El Niño and patch stability in a southern California kelp community. Science 224:283-285.
Dayton, P. K. and M. J. Tegner. 1989. Bottoms beneath troubled waters: benthic impacts of the 1982-1984 El Niño in the temperate zone. Pages 433-472 in P.W. Glynn, editor. Global ecological consequences of the 1982-83 El Niño-Southern Oscillation. Elsevier Oceanography Series No. 52, Amsterdam.
Dayton, P. K., V. Currie, T. Gerrodette, B. Keller, R. Rosenthal and D. Van Tresca. 1984. Patch dynamics and stability of some southern California kelp communities. Ecological Monographs 54:253-289.
6-1
Dayton, P. K., M. J. Tegner, P. E. Parnell and P. B. Edwards. 1992. Temporal and spatial patterns of disturbance and recovery in a kelp forest community. Ecological Monographs 62:421-445.
Dayton, P. K., M. J. Tegner, P. B. Edwards and K. L. Riser. 1999. Temporal and spatial scales of kelp demography: the role of oceanographic climate. Ecological Monographs 69:219-250.
Dean, T. A. and F. R. Jacobsen. 1986. Nutrient-limited growth of juvenile kelp, Macrocystis pyrifera during the 1982-1984 “El Niño” in southern California. Marine Biology 90:597-601.
Dever, E. P. 2004. Objective maps of near-surface flow states near Pt. Conception, California. Journal of Physical Oceanography 34:444-461.
Dickson, M. L., J. Orchardo, R. Barber, J. Marra, J. J. McCarthy and R. Sambrotto. 2001. Production and respiration rates in the Arabian Sea during the 1995 Northeast and Southwest monsoons. Deep-Sea Research II 48:1199-1230.
Duffy, J. E., J. P. Richardson and E. A. Canuel. 2003. Grazer diversity effects on ecosystem functioning in seagrass beds. Ecology Letters 6:637-645.
Dugan, J. E., D. M. Hubbard, M. D. McCrary and M. O. Pierson. 2003. The response of macrofauna communities and shorebirds to macrophyte wrack subsidies on exposed sandy beaches of southern California. Estuarine and Coastal Shelf Science 58s:25-40.
Ebeling, A., W., D. R. Laur and R. J. Rowley. 1985. Severe storm disturbances and reversal of community structure in a southern California kelp forest. Marine Biology 84:287-294.
Edwards, M. S. 1998. Effects of long-term kelp canopy exclusion on the abundance of the annual alga Desmarestia ligulata (Light F). Journal of Experimental Marine Biology and Ecology 228:309–326.
Edwards, M. S. 2004. Estimating scale-dependency in disturbance impacts: El Niños and giant kelp forests in the northeast Pacific. Oecologia 138:436-447.
Eppley, R. W., E. H. Renger and W. G. Harrison. 1979. Nitrate and phytoplankton production in southern California coastal waters. Limnology and Oceanography 24:483-494.
Fankboner, P. V. and M. E. de Burgh. 1977. Diurnal exudation of 14-C labeled compounds by the large kelp Macrocystis integrifolia Bory. Journal of Experimental Marine Biology and Ecology 28:151-162.
Fierer, N. and J. Schimel. 2002. Effects of drying-rewetting frequency on soil carbon and nitrogen transformations. Soil Biology and Biochemistry 34:777-787.
Fong, D. A. and W. R. Geyer. 2001. The response of a river plume during an upwelling favorable wind event. Journal of Geophysical Research 106:1067-1084.
Fong, D. A. and M. T. Stacey. 2003. Horizontal dispersion of a near-bed coastal plume. Journal of Fluid Mechanics 489:239-267.
Forrester, G. E. 1990. Factors influencing the juvenile demography of a coral reef fish. Ecology 71:1666-1681.
Foster, M. S. 1982. The regulation of macroalgal associations in kelp forests. Pages 185-205 in L. Srivastava, editor. Synthetic and degradative processes in marine macrophytes, Walter de Gruyter Co., Berlin.
Foster, M. S. and D. R. Schiel. 1985. The ecology of giant kelp forests in California: a community profile. United States Fish and Wildlife Service Biological Report 85(7.2) 152 pp.
Gaylord, B. and S. D. Gaines. 2000. Temperature or transport? Range limits in marine species mediated solely by flow. American Naturalist 155:769–789.
Gaylord, B., J. Rosman, D. Reed, J. Koseff, S. MacIntyre, J. Fram, J. Largier, M. Brzezinski, C. McDonald, S. Monismith, K. Arkema, P. Raimondi and B. Mardian. Patterns of flow in and around a Santa Barbara, California, kelp forest. Limnology and Oceanography in review
6-2
Gerard, V. A. 1984. Physiological effects of El Niño on giant kelp in southern California. Marine Biology Letters 5:317-322.
Goldstein, N. C., J. T. Candau and K. C. Clarke. 2003. Approaches to simulating the march of bricks and mortar. Computers Environment and Urban Systems 28:125-147.
Haines, K. C. and P. A. Wheeler. 1978. Ammonium and nitrate uptake by the marine macrophytes Hypnea musciformis (Rhodophyta) and Macrocystis pyrifera (Phaeophyta). Journal of Phycology 14:319-324.
Harms, S. and C. D. Winant 1998. Characteristic patterns of the circulation in the Santa Barbara Channel. Journal of Geophysical Research 103(C2):3041-3065.
Harrold, C, K. L. Light and S. Lisin. 1998. Organic enrichment of submarine-canyon and continental-shelf benthic communities by macroalgal drift imported from nearshore kelp forests. Limnology and Oceanography 43:669-678.
Hatcher, B. G., A. R. O. Chapman and K. H. Mann. 1977. An annual carbon budget for the kelp Laminaria longicuris. Marine Biology 44:85-96.
Hayes, W. B. 1974. Sand beach energetics: importance of the isopod, Tylos punctatus. Ecology 55:838-847.
Hobday, A. 2000 Abundance and dispersal of drifting kelp, Macrocystis pyrifera rafts in the Southern California Bight. Marine Ecology Progress Series 195:101-116.
Holbrook, S. J. and R. J. Schmitt. 1986. Food acquisition by competing surfperch on a patchy environmental gradient. Environmental Biology of Fishes 16:135-146.
Holbrook, S. J. and R. J. Schmitt. 1992. Causes and consequences of dietary specialization in surfperches: Patch choice and intraspecific competition. Ecology 73:402-412.
Holbrook, S.J. and R.J. Schmitt. 1996. On the structure and dynamics of temperate reef fish assemblages: are resources tracked? Pages 19-48 in M. L. Cody and J. A. Smallwood, editors. Long-term studies of vertebrate communities. Academic Press, San Diego.
Holbrook, S. J., M. H. Carr, R. J. Schmitt and J. A. Coyer. 1990. The effect of giant kelp on local abundance of demersal fishes: the importance of ontogenetic resource requirements. Bulletin of Marine Science 47:104-114.
Holbrook, S. J., R .J. Schmitt and J. S. Stephens. 1997. Changes in an assemblage of temperate reef fishes associated with a climate shift. Ecological Applications 7:1299-1310.
Hubbard, D. M., and J. E. Dugan. 2003. Shorebird use of an exposed sandy beach in southern California. Estuarine, Coastal and Shelf Science 58S:169-182.
Ives, A. R., B. Dennis, K. L. Cottingham and S. R. Carpenter. 2003. Estimating community stability and ecological interactions from time-series data. Ecological Monographs 73:301-330.
Jackson, G. A. 1977. Nutrients and production of the giant kelp, Macrocystis pyrifera, off southern California. Limnology and Oceanography 22:979-995.
Johnston, C. S., R. G. Jones and R. D. Hunt. 1977. Seasonal carbon budget for a laminarian population in a Scottish sea-loch. Helgolander Wissenschaftliche Meeresuntersuchungen 30:527-545.
Khailov, K. M. and Z. P. Burlakova. 1969. Release of dissolved organic matter by marine seaweeds and distribution of their total organic production to inshore communities. Limnology Oceanography 14:521-527.
Knapp, A. K. and M. D. Smith. 2001. Variation among biomes in temporal dynamics of aboveground primary production. Science 291:481-484.
Knight, T. M., M. W. McCoy, J. M. Chase, K. A. McCoy and R. D. Holt. 2005. Trophic cascades across ecosystems. Nature 437:880.
Larrson, U. R., E. Elmgren and F. Wulff. 1985. Eutrophication and the Baltic Sea: causes and consequences. Ambio 14:9-14.
Laur, D. R. and A. W. Ebeling. 1983. Predator-prey relationships in surfperches. Environmental Biology of Fishes 8:217-229.
6-3
Leet, W. S., C. M. Dewees and C. W. Haugen. 1992. California’s living marine resources and their utilization. Sea Grant Extension Publication, Davis, CA.
Lerczak, J. A., M. C. Henderschott and C. D. Winant. 2001. Observations and modeling of coastal internal waves driven by a diurnal sea breeze. Journal of Geophysical Research 106:19715-19729.
Leydecker, A., R. E. Beighley, J. M. Melack, T. H. Robinson and J. S. Coombs. Nutrient inputs to the near-shore waters of the Santa Barbara Channel from terrestrial runoff. Biogeochemistry in review
Lohrenz, S. E., G. L. Fahnenstiel, D. G. Redalje, G. A. Lang, X. G. Chen and M. J. Dagg. 1997. Variations in primary production of northern Gulf of Mexico continental shelf waters linked to nutrient inputs from the Mississippi River. Marine Ecology Progress Series 155:45-54.
Loreau, M., N. Mouquet and R.D. Holt. 2003. Meta-ecosystems: a theoretical framework for a spatial ecosystem ecology. Ecology Letters 6:673-679.
Loreau, M., S. Naeem, P. Inchausti, J. Bengtsson, J. P. Grime, A. Hector, D. U. Hooper, M. A. Huston, D. Raffaelli, B. Schmid, D. Tilman and D. A. Wardle. 2001. Biodiversity and ecosystem functioning: current knowledge and future challenges. Science 294:804-808.
MacIntyre, S., J. O. Sickman, S. A. Goldthwait and G. W. Kling. 2006. Physical pathways of nutrient supply in a small, ultraoligotrophic arctic lake during summer stratification. Limnology and Oceanography 51:1107-1124.
Mann, K. H. 2000. Ecology of Coastal Waters. Blackwell, Maldin, MA, USA. Mantua, N. J., S. R. Hare, Y. Zhang, J. M. Wallace and R. C. Francis. 1997. A Pacific
interdecadal climate oscillation with impacts on salmon production. Bulletin of American Meteorological Society 78:1069-1079.
McGowan, J. A., D. R. Cayan and L. M. Dorman. 1998. Climate-ocean variability and ecosystem response in the Northeast Pacific. Science 281:210-217.
McPhee-Shaw, E. E., D. A. Siegel, L. Washburn, M. A. Brzezinski, J. L. Jones, A. Leydecker and J. Melack. Mechanisms for nutrient delivery to the inner shelf: Observations from Santa Barbara Channel. Limnology and Oceanography in review
Melack, J. M. and A. Leydecker. 2005. Episodic variations in nutrient concentrations in coastal California streams. Verhandlungen Internationale vereinige Limnologia 29:1049-1053.
Mitarai, S., D. A. Siegel and K. B. Winters. 2006. A numerical study of stochastic larval settlement in the California Current System. Journal of Marine Systems in press.
Newell, R. C. and M. I. Lucas. 1981. The quantitative significance of dissolved and particulate organic matter released during fragmentation of kelp in coastal waters. Proceedings of the 15th European Marine Biology Symposium {Special Issue}. Kieler Meeresforsch Sonderheft 5:356-369.
Newell, R. C., M. I. Lucas, B. Velimirov and L. J. Seiderer. 1980. Quantitative significance of dissolved organic losses following fragmentation of kelp (Ecklonia maxima and Laminaria pallida). Marine Ecology Progress Series 2:45-59.
North, W. J. 1994. Review of Macrocystis biology. Pages 447-527 in I. Akatsuka, editor. Biology of Economic Algae. SPB Academic Publishing, The Hague, The Netherlands.
Otero, M. P. and D. A. Siegel. 2004. Spatial and temporal characteristics of sediment plumes and phytoplankton blooms in the Santa Barbara Channel. Deep-Sea Research, Part II 51:1129-1149.
Pearse, J. S. and A. H. Hines. 1979. Expansion of a central California kelp forest following the mass mortality of sea urchins. Marine Biology 51:83-91.
Pineda, J. 1999. Circulation and larval distribution in internal tidal bore warm fronts. Limnology and Oceanography 44:1400-1414.
Polis, G. A., W. B. Anderson and R. D. Holt. 1997. Toward an integration of landscape and food web ecology: The dynamics of spatially subsidized food webs. Annual Review of Ecology and Systematics 28:289-316.
6-4

Pringle, J. M. and K. Riser. 2003. Remotely forced nearshore upwelling in Southern California. Journal of Geophysical Research 108:(C4)3131, doi:10.1029/2002JC001447.
Quast, J.C. 1971. Observations of the food of kelp bed fishes. Pages 541-580 in W. J. North, editor. The biology of giant kelp beds (Macrocystis) in California. Beihefte zur Nova Hedwigia, Verlag von J. Cramer, Lehre, Germany.
Rabalais, N. N., R. E. Turner and D. Scavia. 2002. Beyond science and into policy: Gulf of Mexico hypoxia and The Mississippi River. BioScience 52:129-142.
Raymond, P. A. and J. E. Bauer. 2001. DOC cycling in a temperate estuary: A mass balance approach using natural 14C and 13C isotopes. Limnology and Oceanography 46:655-667.
Reed, D. C. and M. S. Foster. 1984. The effects of canopy shading on algal recruitment and growth in a giant kelp (Macrocystis pyrifera) forest. Ecology 65:937-948.
Reed, D. C., B. P. Kinlan, P. T. Raimondi, L. Washburn, B. Gaylord and P. T. Drake. 2006a. A metapopulation perspective on patch dynamics and connectivity of giant kelp. Pages 353-386 in J. P. Kritzer and P. F. Sale, editors. Marine Metapopulations. Academic Press, San Diego.
Reed, D.C., S.C. Schroeter and D. Huang. 2006b. An experimental investigation of the use of artificial reefs to mitigate the loss of giant kelp forest habitat. A case study of the San Onofre Nuclear Generating Station’s artificial reef project. California Sea Grant College Program University of California, San Diego, CA.
Robinson, T. 2006. Catchment and sub-catchment scale linkages between land use and nutrient concentrations and fluxes in coastal California streams. Ph.D. dissertation, University of California, Santa Barbara.
Robinson, T. H., A. Leydecker, A. A. Keller and J. M. Melack. 2005. Steps towards modeling nutrient export in coastal California streams with a Mediterranean climate. Agricultural Water Management 77:144-158.
Schmitt, R. J. and S. J. Holbrook. 1990. Contrasting effects of giant kelp on dynamics of surfperch populations. Oecologia 69:1-11.
Seymour, R., M. J. Tegner, P. K. Dayton and P. E. Parnell. 1989. Storm wave induced mortality of giant kelp Macrocystis pyrifera in southern California. Estuarine Coastal and Shelf Science 28:277-292.
Shipley, B. 2000. Cause and correlation in biology: A user's guide to path analysis, structural equations, and causal inference. Cambridge University Press, Cambridge, UK.
Siegel, D. A., B. P. Kinlan, B. Gaylord and S. D. Gaines. 2003. Lagrangian descriptions of marine larval dispersion. Marine Ecology-Progress Series 260:83–96.
Siegel, D. A., S. Mitarai, C. J. Costello, S. D. Gaines, B. E. Kendall, R. R. Warner and K. B. Winters. Connectivity among nearshore marine ecosystems: the stochastic nature of larval transport. Nature in review
Smith, D. C. and F. Azam. 1992. A simple, economical method for measuring bacterial protein synthesis rates in seawater using 3H-leucine. Marine Microbial Food Webs 6:107-114.
Smith, S. V., D. P. Swaney, L. Talaue-McManus, J. D. Bartley, P. T. Sandhei, C J. McLaughlin, V. C. Dupra, C. J. Crossland, R. W. Buddemeier, B. A. Maxwell and F. Wulff. 2003. Humans, hydrology and the distribution of inorganic nutrient loading to the ocean. BioScience 53:235-245.
Stevens, C. L., C. L. Hurd and P. E. Isachsen. 2001. Modelling of diffusion boundary-layers in subtidal macroalgal canopies: The response to waves and currents. Aquatic Sciences 65:81-91.
Tegner, M. J. and P. K. Dayton. 1987. El Niño effects on southern California kelp forest communities. Advances in Ecological Research 17:243-279.
6-5

Tegner, M. J., P. K. Dayton, P. B. Edwards and K. L Riser. 1997. Large-scale, low frequency oceanographic effects on kelp forest succession: a tale of two cohorts. Marine Ecology Progress Series 146:117-134.
Valiela I., J. L. Bowen, M. L. Cole K. D. Kroeger, D. Lawrence, W. J. Pabich, G. Tomasky and S. Mazzilli. 2001. Following up on a Margalevian concept: Interactions and exchanges among adjacent parcels of coastal landscapes. Scientia Marina 65:S215-S229.
Wheeler, P. A. and W. J. North. 1980. Effect of nitrogen supply on nitrogen content and growth rates of juvenile Macrocystis pyrifera (Phaeophyta) sporophytes. Journal of Phycology 16:577-582.
Winant, C. D., E. P. Dever and M. C. Hendershott. 2003. Characteristic patterns of shelf circulation at the boundary between central and southern California. Journal of Geophysical Research 108(C2):3021, doi:10.1029/2001JC001302,2003.
Wolter, K. and M. S. Timlin. 1998. Measuring the strength of ENSO - how does 1997/98 rank? Weather 53:315-324.
Worm, B.tor T., B. H. Reusch and H. K. Lotz. 2000. In situ nutrient enrichment: Methods for marine benthic ecology. International Review of Hydrobiology 85:359-375.
Worm, B. and J. E. Duffy. 2003. Biodiversity, productivity and stability in real food webs. Trends in Ecology and Evolution 18:628-632.
Wormersley, H. B. S. 1954. The species of Macrocystis with special reference to those on southern Australia coasts. University of California Publications in Botany 27:109-132.
Zimmerman, R. C. 2003. A biooptical model of irradiance distribution and photosynthesis in seagrass canopies. Limnology and Oceanography 48:568-585.
Zimmerman, R. C. and J. N. Kremer. 1984. Episodic nutrient supply to a kelp forest ecosystem in southern California. Journal of Marine Research 42:591-604.
Zimmerman, R. C. and D. L. Robertson. 1985. Effects of El Niño on local hydrography and growth of the giant kelp, Macrocystis pyrifera, at Santa Catalina Island, California. Limnology and Oceanography 30:1298-1302.
ZoBell, C. E. 1971. Drift seaweeds on San Diego county beaches. Pages109-132 in W. J. North, editor. The biology of giant kelp beds (Macrocystis) in California. Beihefte zur Nova Hedwigia, Verlag von J. Cramer, Lehre, Germany.
6-6

FACILITIES, EQUIPMENT & OTHER RESOURCES
FACILITIES: Identify the facilities to be used at each performance site listed and, as appropriate, indicate their capacities, pertinent capabilities, relative
proximity, and extent of availability to the project. Use "Other" to describe the facilities at any other performance sites listed and at sites for field studies.
USE additional pages if necessary.
Laboratory: The principal investigators have laboratory space in the Marine Science Institute (MSI), Department of Ecology, Evolution and Marine Biology (DEEMB), Department of Geography, the Institute for Computational Earth System Science, and the Donald Bren School of Environmental Science and Management at UCSB that is sufficient for the project’s needs. In addition, over 900 ft2 of laboratory space in UCSB’s new Marine Science Building has been assigned specifically for SBC LTER use. We will also have access to common laboratory space in the Marine Science Building and in DEEMB’s marine biotechnology building, including environmentally controlled temperature rooms and rooms supplied with running seawater. MSI’s Analytical Laboratory is a professionally managed shared-use instrumentation and chemical analysis facility that is well equipped to perform all of the chemical analyses anticipated for this project. Major capabilities of the Analytical Lab include elemental analysis of inorganic and organic substances, stable isotope ratio determination of biological materials, and automated determination of nutrients in natural waters. Clinical: not required for this project Animal: not required for this project Computer: Each of the investigators in this project maintains computing capabilities commensurate with their specific research activities. Data management for the project has the advantage of utilizing the computing capabilities of the PISCO project at the Marine Science Institute (MSI). MSI has a 1000Mb/s connection to the UCSB campus backbone, which provides shared access to a 622Mb/s CALREN-2 connection, which in turn provides access to Internet. PISCO supports 2 IBM servers. The main data server is a* *Dual 3.6 GHz CPU IBM x336, running Redhat Enterprise Linux 4 (64-bit) with 7 GB RAM. Currently we have a 2.4 TB storage array (expandable) and APC 3000 UPS for >12 hours backup battery life. Distributed server backups (via Amanda) are coordinated with MSI. The secondary server is a dual CPU IBM Netfinity 6000R RedHat Linux OS, with1.5 GB memory. Both systems run Apache web server, the Tomcat servlet engine, Windows SMB fileserver, Mac Appletalk fileserver and SSH remote login server. The personnel database uses OpenLDAP. The data server also runs CVS source control, PostgreSQL, MySQL, PHP, SAS, Matlab, GSLIB and PERL. Scientists at ICESS have access to an extensive network of Unix/Linux based servers, with a total hard disk storage of at least 21TB, and full complement of database, computational, image processing, statistical and scientific visualization software. ICESS recently signed an agreement with Terra Image USA that will provide SPOT high spatial resolution commercial satellite remote sensing imagery to UCSB at marginal to no cost. This agreement includes the ability to task satellites for collection of new data, plus access to SPOT data going back to 1986. ICESS also operates a TeraScan satellite receiving and analysis station, which will be used to acquire AVHRR sea surface temperature and MODIS ocean color imagery.
Office: All principal investigators and associate investigators have adequate office space to meet their needs and those of the postdocs and graduate students associated with this project. All offices are equipped with phone and internet services. Other: Special facilities are not required at our field sites, which are all located close to campus. MAJOR EQUIPMENT: List the most important items available for this project and, as appropriate identifying the location and pertinent capabilities of each.
Most chemical analyses will be done using instrumentation in MSI’s Analytical Laboratory. Major equipment in this lab include: two atomic absorption spectrophotometers (AAS) with auto samplers, one instrument equipped for flame atomization, and the other a dedicated furnace system with Zeeman background correction; a microprocessor-controlled gas chromatograph (GC) with various detectors, including flame ionization and photo-ionization; two automated organic elemental analyzers for CHN analyses, an isotope ratio mass spectrometer interfaced with a CHN sample introduction system, and an automated 5-channel wet-chemical analyzer (FIA) for nutrients. The laboratories of several investigators are equipped with additional instrumentation that will be used to do the proposed work including: a liquid scintillation counter for analysis of samples from measurements of primary production using 14C (Brzezinski), a Turner 10AU fluorometer for phytoplankton chlorophyll determination (Brzezinski), a Lachat Autoanalyzer, C/N analyzer, gas chromatograph, and an infrared gas analyzer to be used in nutrient analyses and soil chemistry (Schimel). Oceanographic instrumentation available to this project include: a CTD, fiver acoustic Doppler current profilers and two acoustic Doppler velocitometers for measuring currents in the water column, and five high-frequency radar units (Coastal Ocean Dynamics Applications Radars, CODAR) for measuring surface currents. Oceanographic moored instrumentation purchased with previous LTER funding include two WS Oceans in situ nitrate analyzers, 6 Wetlabs Eco-DFLSB fluorometers, 1 Wetlabs Eco-triplet rhodomine, chlorophyll and CDOM fluorometer, 6 Wetlabs ECO-VSFSB volume scattering function meters and 6 Seabird Electronics SBE37SM CTD’s, 40 Brancker TR-1050 self-contained temperature loggers. A mini-rosette and winch are available for nearshore oceanographic sampling. The SBC LTER also purchased and maintains a 22 ft research boat equipped for SCUBA and water sampling operations. Equipment for watershed sampling includes 4 ISCO automated stream samplers.
OTHER RESOURCES: Provide any information describing the other resources available for the project. Identify support services such as consultant, secretarial, machine shop, and electronics shop, and the extent to which they will be available for the project. Include an explanation of any consortium/contractual arrangements with other organizations.
UCSB has the facilities and trained technical staff typical of large universities. Resources that will be of most value to this project include: machine, electronic, and carpentry shops for constructing apparati for the laboratory and field, a large capacity seawater system, a fleet of small vessels that are maintained by a certified boat mechanic, and a research diving program that includes ~ 100 scuba tanks, and a compressor and technician to fill them. Use of university equipment and consultant and technician services is available to us, generally on a recharge basis.
Table 1-1. SBC LTER Publications and Products Journal Articles Submitted
1. Anderson, C. R., M. A. Brzezinski, L. Washburn and R. Kudela. Mesoscale circulation effects on a toxic diatom bloom in the Santa Barbara Channel, CA. Marine Ecology Progress Series in review.
2. Busse, L. B., J. C. Simpson and S. D. Cooper. Relationships between nutrients, algae and land use in urbanized southern California streams. Canadian Journal of Fisheries and Aquatic Sciences in review.
3. Gaylord, B., D. C. Reed, P. T. Raimondi and L. Washburn. Macroalgal spore dispersal in coastal environments: Mechanistic insights revealed by theory and experiment. Ecological Monographs in review.
4. Gaylord, B., J. Rosman, D. Reed, J. Koseff, S. MacIntyre, J. Fram, J. Largier, M. Brzezinski, C. McDonald, S. Monismith, K. Arkema, P. Raimondi and B. Mardian. Patterns of flow in and around a Santa Barbara,California, kelp forest. Limnology and Oceanography in review.
5. Leydecker, A., R. E. Beighley, J. M. Melack, T. H. Robinson and J. S. Coombs. Regional export of dissolved nitrogen and phosphorus from coastal California catchments. Biogeochemistry in review.
6. McPhee-Shaw. E. E., D. A. Siegel. L. Washburn, M. A. Brzezinski, J. L. Jones, A. Leydecker and J. M. Melack. Mechanisms for nutrient delivery to the inner shelf: observations from Santa Barbara Channel. Limnology and Oceanography in review.
7. Schmitt, R. J. and S. J. Holbrook. Temporal co-variation between young-of-year class strength and the forage base of surfperch (Teleostei: Embiotocidae). Raffles Bulletin of Zoology in review.
In Press 1. Broitman, B. R., C. A. Blanchette and S. D. Gaines. Recruitment of intertidal
invertebrates and oceanographic variability at Santa Cruz Island, CA. Limnology and Oceanography in press.
2. Dugan, J. E. and D. M. Hubbard. 2006. Ecological responses to coastal armoring on exposed sandy beaches. Shore and Beach in press.
3. Mitarai, S., D. A. Siegel and K .B. Winters. 2005. A Numerical Study of Stochastic Larval Settlement in the California Current System. Journal of Marine Systems in press.
4. Page, H. M, J. E. Dugan, C. C. Culver and J. Hoesterey. Exotic invertebrate species on offshore oil platforms. Marine Ecology Progress Series in press.
5. Reed, D. C. S. C. Schroeter, D. Huang, T. W. Anderson and R. F . Ambrose. Quantitative assessment of different artificial reef designs in mitigation losses to kelp forest fishes. Bulletin of Marine Science in press.
6. White, E. P., P. B. Adler, W. K. Lauenroth, R. A. Gill, D. Greenberg, D. M. Kaufman, A. Rassweiler, J. A. Rusak, M. D. Smith, J. R. Steinbeck, R. B. Waide and J. Yao. A comparison of the species-time relationship across ecosystems and taxonomic groups. Oikos in press.
Suppl doc 1-1-1

Published 1. Adler, P. B., E. P. White, W. K. Lauenroth, D. M. Kaufman, A. Rassweiler and J. A.
Rusak. 2005. Evidence for a general species-time-area relationship Ecology 86: 2032-2039.
2. Airamé, S., J. E. Dugan, K. D. Lafferty, H. M. Leslie, D. A. McArdle and R. R. Warner. 2003. Applying ecological criteria to marine reserve design: a case study from the California Channel Islands. Ecological Applications 13(1 Suppl S):S170-S184.
3. Allison, G. W., S. D. Gaines, J. Lubchenco and H. P. Possingham. 2003. Ensuring persistence of marine reserves: Catastrophes require adopting an insurance factor. Ecological Applications 13 (Suppl. S): S8-S24.
4. Bay, S., B. H. Jones, K. Schiff and L. Washburn. 2003. Water quality impacts of stormwater discharges to Santa Monica Bay. Marine Environmental Research 56 (1-2): 205-223.
5. Baskett, M. L., S. A. Levin, S. D. Gaines and J. Dushoff. 2005. Marine reserve design and the evolution of size at maturation in harvested fish. Ecological Applications 15: 882-901.
6. Bassin, C. J., L. Washburn, M. A. Brzezinski and E. E. McPhee-Shaw. 2005. Sub-mesoscale coastal eddies observed by high frequency radar: A new mechanism for delivering nutrients to kelp forests in the Southern California Bight, Geophysical Research Letters 32(12): L12604. doi:10.1029/2005GL023017.
7. Beckenbach, E. H. and L. Washburn 2004. Low frequency waves in the Santa Barbara Channel observed by high frequency radar. Journal of Geophysical Research-Oceans 109(C2): Art. No.C02010, DOI:10.1029/2003JC001999
8. Beighley, R. E., T. Dunne and J. M. Melack. 2005. Understanding and modeling basin hydrology: Interpreting the hydrogeological signature. Hydrological Processes 19:1333-1353.
9. Beighley, R. E. and G. E. Moglen. 2002. Assessment of stationarity in rainfall - runoff behavior in urbanizing watersheds. Journal of Hydrologic Engineering ASCE 7(1):27-34.
10. Beighley, R. E. and G. E. Moglen. 2003 Adjusting measured peak discharges from an urbanizing watershed to feflect a stationary land use signal. Water Resources Research 39 (4): Art. No. 1093.
11. Beighley, R. E., J. M. Melack and T. Dunne. 2003. Impacts of California’s climatic regimes and coastal land use change on streamflow characteristics. Journal of the American Water Resources Association 39:1419-1433.
12. Beighley, R. E., D. L. Johnson and A. C. Miller. 2002. A subsurface response model for storm events within the Susquehanna River Basin. Journal of Hydrologic Engineering ASCE, 8(1):185-191.
13. Blanchette, C. A., S. D. Gaines and B. Miner. 2002. Geographic variability in form, size and survival of Egregia menziesii (Turner) Areschoug around Point Conception, California. Marine Ecology Progress Series 230: 69-82
14. Boles, J. R., J. F. Clark, I. Leifer and L. Washburn. 2001. Temporal variations in natural hydrocarbon seep rate due to tides, Coal Oil Point area, California, Journal of Geophysical Research-Oceans 106 (C11): 27,077-27,086.
15. Bomkamp, R. Page, H. M. and J. E. Dugan. 2004. Role of food subsidies and habitat structure in influencing benthic communities of shell mounds at sites of existing and former offshore oil platforms. Marine Biology 46: 201-211.
Suppl doc 1-1-2
16. Bose, R. 2002. A conceptual framework for composing and managing scientific DataLineage. Proceedings of the 14th International Conference on Scientific and Statistical Database Management (SSDBM 2002), Edinburgh, Scotland, pp. 15-19.
17. Bose, R. and J. Frew. 2005.Lineage retrieval for scientific data processing: A Survey. ACM Computing Surveys (CSUR) 37(1): 1-28.
18. Bose R. and J. Frew. 2004. Composing lineage metadata with XML for custom satellite-derived data products. pp. 275-284, In: Proceedings of the 16th International Conference on Scientific and Statistical Database Management (SSDBM 2004), Santorini, Greece.
19. Botsford, L. W., A. Hastings and S. D. Gaines. 2001. Dependence of sustainability on the configuration of marine reserves and larval dispersal distance. Ecology Letters 4: 144-150.
20. Bram, J.B., Page, H. M. and J. E. Dugan. 2005. Spatial and temporal variability in early successional patterns of an invertebrate assemblage at an offshore oil platform. Journal of Experimental Marine Biology and Ecology 317(2): 223-237.
21. Bull, J. S., D. C. Reed and S. J. Holbrook. 2004. An experimental evaluation of different methods of restoring Phyllospadix torreyi (Surfgrass). Restoration Ecology 12(1): 70-79.
22. Chomko, R. M., H. R. Gordon, S. Maritorena and D. A. Siegel. 2003. Simultaneous determination of oceanic and atmospheric parameters for ocean color imagery by spectral optimization: a validation. Remote Sensing of the Environment 84: 208-220
23. Clark, J. F., I. Leifer, L. Washburn and B. P. Luyendyk. 2003. Compositional changes in natural gas bubble plumes: Observations from the Coal Oil Point marine hydrocarbon seep field. Geo-Marine Letters 23: 187-193.
24. Cudaback, C. N., L. Washburn and E. Dever. Subtidal inner-shelf circulation near Point Conception, California. Journal of Geophysical Research-Oceans 110(C10): Art. No. C10007.
25. DiGiacomo, P. M., L. Washburn, B. Holt and B. H. Jones. 2004. Coastal pollution hazards in Southern California observed by SAR imagery: stormwater plumes, wastewater plumes and natural hydrocarbon seeps. Marine Pollution Bulletin 49(11-12): 1013-1024.
26. Dugan, J. E., D. M. Hubbard, M. McCrary and M. Pierson. 2003. The response of macrofauna communities and shorebirds to macrophyte wrack subsidies on exposed sandy beaches of southern California. Estuarine, Coastal and Shelf Science 58S: 133-148.
27. Dugan, J. E., D. M. Hubbard, E. Jaramillo, H. Contreras and C. Duarte. 2004. Competitive interactions in macroinfaunal animals of exposed sandy beaches. Oecologia 139(4): 630-640.
28. Emery, B. M., L. Washburn and J. A. Harlan. 2004. Evaluating radial current component from CODAR high frequency and moored in situ current meters. Journal of Atmospheric and Oceanic Technology 21(8): 1259-1271.
29. Field, K., E. C. Chern, L. K. Dick, J. Fuhrman, J. Griffith, P. A. Holden, M. G. LaMontagne, J. Le, B. Olson and M. T. Simonich. 2003. A comparative study of culture-independent, library-independent genotypic methods of fecal source tracking. Journal of Water and Health 1:181-194.
30. Fierer N., J. P. Schimel and P. A. Holden. 2003. Variations in microbial community composition through two soil depth profiles. Soil Biology & Biochemistry 35 (1): 167-176
Suppl doc 1-1-3
31. Fierer N., J. P. Schimel and P. A. Holden. 2003. Influence of drying-rewetting frequency on soil bacterial community structure. Microbial Ecology 45 (1): 63-71.
32. Frew, J. and R. Bose. 2001. Earth System Science Workbench: A data management infrastructure for earth science products. pp. 180-189 In: Proceedings of the 13th International Conference on Scientific and Statistical Database Management (SSDBM 2001), Fairfax, VA.
33. Gaines, S. D., B. Gaylord and J. L. Largier. 2003. Avoiding current oversights in marine reserve design. Ecological Applications 13(1 Suppl. S): S32-S46
34. Gaylord B., D. C. Reed, P. T. Raimondi, L. Washburn and S. R. McLean. 2002. A physically-based model of macroalgal spore dispersal in the wave and current-dominated nearshore. Ecology 83: 1239-1251.
35. Gaylord, B., D. C. Reed, L. Washburn and P. T. Raimondi. 2004. Biological-physical coupling in spore dispersal of kelp forest macroalgae. Journal of Marine Systems 49: 19-39.
36. Gaylord, B., S. D. Gaines, D. A. Siegel and M. Carr. 2005. Marine reserves exploit population structure and life history in potentially improving fisheries yields. Ecological Applications 5(6): 2180-2191.
37. Gerber, L. R., S. J. Andelman, L. W. Botsford, S. D. Gaines, A. Hastings, S. R. Palumbi and H. P. Possingham. 2003. Population models for marine reserve design: A retrospective and prospective synthesis. Ecological Applications 13(1 Suppl. S): S47-S64.
38. Guichard, F. R., S. Levin, A. Hastings and D. Siegel. 2004: Toward a metacommunity approach to marine reserve theory. Bioscience 54,: 1003-1011.
39. Halpern, B., S. D. Gaines and R. R. Warner 2004. Confounding effects of the export of production and the displacement of fishing effort from marine reserves. Ecological Applications 14: 1248-1256.
40. Halpern, B., S. D. Gaines and R. R. Warner 2005. Habitat size, recruitment and longevity as factors limiting population size in stage-structured species. American Naturalist 165: 82-94.
41. Halpern, B., R. R. Warner, S. D. Gaines. 2004. Moving the discussion about marine reserve science forward. Marine Protected Area News 5: 1-2.
42. Holbrook, S. J., D. C. Reed and J. S. Bull. 2002. Survival experiments with outplanted seedlings of surfgrass (Phyllospadix torreyi) to enhance establishment on artificial structures. CES Journal of Marine Science 59:350-355.
43. Hubbard, D. M. and J. E. Dugan. 2003 Shorebird use of an exposed sandy beach in southern California. Estuarine, Coastal and Shelf Science 58S: 169-182
44. Keller, A. A., Y. Zheng and T. H. Robinson. 2004. Determining critical water quality conditions for inorganic nitrogen in dry semi-urban watersheds. Journal of American Water Resources 40: 721-735.
45. Kinlan, B. P., M. H. Graham and J. M. Erlandson. 2005. Late Quaternary change in the size and shape of the California Channel Islands: implications for marine subsidies to terrestrial communities. Pp. 119-130 in Proceedings of the 6th California Islands Symposium (D.K. Garcelon and C.A. Schwemm, eds.), Institute for Wildlife Studies, Arcata, CA.
46. Kinlan, B. P., S. D. Gaines and S. E. Lester. 2005. Propagule dispersal and the scales of marine community process. Diversity & Distributions 11:139-148.
Suppl doc 1-1-4

47. Kinlan, B. and S. D. Gaines. 2003 Propagule dispersal in marine and terrestrial environments: A community perspective. Ecology 84 (8): 2007-2020.
48. Kinlan, B. P., M. H. Graham, E. Sala and P. K. Dayton. 2003. Arrested development of embryonic sporophytes in the perennial giant kelp Macrocystis pyrifera (Phaeophyceae): a mechanism for delayed recruitment? Journal of Phycology. 39(1):47-57.
49. LaMontagne M. G., J. P. Schimel and P. A. Holden. 2003. Comparison of subsurface and surface soil bacterial communities in California grassland as assessed by terminal restriction fragment length polymorphisms of PCR-amplified 16S rRNA genes. Microbial Ecology 46 (2): 216-227.
50. LaMontagne M. G. and P. A. Holden. 2003 Comparison of free-living and particle-associated bacterial communities in a coastal lagoon Microbial Ecology 46 (2): 228-237
51. LaMontagne M. G., I. Leifer, S. Bergmann, L. C. Van De Werfhorst and P. A. Holden. 2004. Bacterial diversity in marine hydrocarbon seep sediments. Environmental Microbiology 6 (8): 799-808.
52. Lubchenco, J., S. Palumbi, S. D. Gaines and S. Andelman. 2003. Plugging a hole in the ocean: an introduction to the special feature on marine reserves. Ecological Applications 13 (1 Suppl. S): S3-S7.
53. Maritorena, S. and D. A. Siegel. 2005. Consistent merging of satellite ocean color data using a semi-analytical model. Remote Sensing of the Environment 94: 429-440
54. McCuen R. H. and R. E. Beighley. 2003. Seasonal flow frequency analysis. Journal of Hydrology 279 (1-4): 43-56.
55. Melack, J. M. and A. Leydecker. 2005. Episodic variations in nutrient concentrations in coastal Californian streams. Verhandlungen Internationale vereinige Limnologia 29: 1049-1053.
56. Menge, B. A., C. Blanchette, P. Raimondi, T. Freidenburg, S. D. Gaines, J. Lubchenco, D. Lohse, G. Hudson, M. Foley and J. Pamplin. 2004. Species interaction strength: testing model predictions along an upwelling gradient. Ecological Monographs 74: 663-684
57. Mertes L. A. K. and J. A. Warrick. 2001. Measuring flood output from 110 coastal watersheds in California with field measurements and SeaWiFS. Geology 29: 659-662.
58. Miller A.E., J.P. Schimel, T. Meixner, J.O. Sickman and J.M. Melack. 2005. Episodic rewetting enhances carbon and nitrogen release from chaparral soils. Soil Biology and Biogeochemistry 37: 2195-2204.
59. Moglen, G. E. and R. E. Beighley. 2002. Spatially Explicit Hydrologic Modeling of Land Use Change. Journal of the American Water Resources Association 38(1): 241-253.
60. Nishimoto, M. M. and L. Washburn. 2002. Patterns of coastal eddy circulation and abundance of pelagic juvenile fish in the Santa Barbara Channel, California, USA, Marine Ecology Progress Series 241:183-199.
61. Otero, M. P. and D. A. Siegel, 2004. Spatial and temporal characteristics of sediment plumes and phytoplankton blooms in the Santa Barbara Channel. Deep-Sea Research Part II 51:1129-1149.
62. Page, H. M., S. Schroeter, D. C. Reed. R. F. Ambrose, J. Callaway and J. Dixon. 2003. Variation in the distribution and abundance of salt marsh vegetation associated with elevation and height of tidal inundation. Bulletin of the Southern California Academy of Sciences 102(3): 130-142.
Suppl doc 1-1-5
63. Palumbi, S. R. S. D. Gaines, H. Leslie and R. R. Warner. 2003. New wave: high-tech tools to help marine reserve research. Frontiers in Ecology and the Environment 1: 73-79
64. Parmesan, C., S. Gaines, L. Gonzalez, D. M. Kaufman, J. Kingsolver, A. T. Peterson and R. Sagarin. 2005. Empirical perspectives on species borders: from traditional biogeography to global change. Oikos 108: 58-75.
65. Phillips, N. E. 2004. Variable timing of larval food has consequences for early juvenile performance in a marine mussel. Ecology 85(8): 2341-2346.
66. Phillips, N. E. and S. D. Gaines. 2002. Spatial and temporal variability in size at settlement of intertidal mytilid mussels from around Pt. Conception, California. Invertebrate Reproduction and Development 41(1-3): 171-177.
67. Raimondi P. T., D. C. Reed, B. Gaylord and L. Washburn. 2004. Effects of self-fertilization in the giant kelp, Macrocystis pyrifera. Ecology 85(12): 3267-3276.
68. Reed, D. C., S. C. Schroeter and P. T. Raimondi. 2004. Spore supply and habitat availability as sources of recruitment limitation in giant kelp. Journal of Phycology 40 (2): 275-284.
69. Roberts, C., G. Branch, R. Bustamante, J. Carlos-Castilla, J. Dugan, B. Halpern, H. Leslie, K. Lafferty, J. Lubchenco, D. McArdle, M. Ruckleshaus and R. Warner. 2003 Application of ecological criteria in selecting marine reserves and developing reserve networks. Ecological Applications (1 Suppl S): S215-S228.
70. Roberts, C., S. Andelman, G. Branch, R. Bustamante, J. Carlos-Castilla, J. Dugan, B. Halpern, H. Leslie, K. Lafferty, J. Lubchenco, D. McArdle, H. Possingham, M. Ruckleshaus and R. Warner. 2003. Ecological criteria for evaluating candidate sites for marine reserves. Ecological Applications 13(1 Suppl S): S199-S214
71. Robinson, T. H., A. Leydecker, A..A. Keller and J. M. Melack. 2005. Steps towards modeling nutrient export in coastal Californian streams with a Mediterranean climate. Agricultural Water Management 77: 144-158.
72. Sagarin, R. and S..D. Gaines. 2002. R. D. Sagarin and S. D. Gaines: Geographical abundance distributions of coastal invertebrates: using one-dimensional ranges to test biogeographic hypotheses. Journal of Biogeography 29:985-998.
73. Sagarin, R. and S. D. Gaines. 2002. The "abundant center" distribution: to what extent is it a biogeographic rule? Ecology Letters 5:137-148.
74. Sax, D., J. Brown and S. D. Gaines. 2002. Species invasions exceed extinctions on islands world-wide: a comparative study of plants and birds. American Naturalist 160 (6): 766-783.
75. Schroeter S. C., D. C. Reed, D. J. Kushner, J. A. Estes and D. S. Ono. 2001. The use of marine reserves in evaluating the dive fishery for the warty sea cucumber (Parastichopus parvimensis) in California, U.S.A. Canadian Journal of Fisheries and Aquatic Science 58: 1773-1781.
76. Shima, J. S. and A. M. Findlay. 2002. Pelagic larval growth rate impacts benthic settlement and survival of a temperate reef fish. Marine Ecology Progress Series 235:303-309.
77. Shipe, R. F., U. Passow, M. A. Brzezinski, D. A. Siegel and A. L. Alldredge. 2002. Effects of the 1997-98 El Nino on seasonal variations in suspended and sinking particles in the Santa Barbara Basin. Progress in Oceanography 54: 105-127.
Suppl doc 1-1-6

78. Siegel, D. A., S. Maritorena, N. B. Nelson and M. J. Behrenfeld. 2005. Independence and interdependencies of global ocean color properties; Reassessing the bio-optical assumption. Journal of Geophysical Research 110: C07011, doi:10.1029/2004JC002527.
79. Siegel, D. A., S. Maritorena, N. B. Nelson, M. J. Behrenfeld and C. R. McClain, 2005. Colored dissolved organic matter and the satellite-based characterization of the ocean biosphere. Geophysical Research Letters 32(20): Art. No. L20605
80. Siegel, D. A., P. Kinlan, B. Gaylord and S. D. Gaines. 2003. Lagrangian descriptions of marine larval dispersion. Marine Ecology Progress Series 260: 83-96.
81. Siegel D. A., A. C. Thomas and J. Marra. 2004. Views of ocean processes from the Sea-viewing Wide Field-of-view Sensor mission: introduction to the first special issue. Deep-Sea Research Part II- Topical Studies in Oceanography 51 (1-3): 1-3.
82. Steets, B. and P. A. Holden. 2003. A mechanistic model of runoff-associated fecal coliform fate and transport through a coastal lagoon. Water Research 37: 589-608.
83. Strayer, D. L., R. E. Beighley, L. C. Thompson, S. Brooks, C. Nilsson, G. Pinay and R. J. Naiman. 2003 Effects of land-cover change on stream ecosystems roles of empirical models and scaling issues. Ecosystems 6(5): 407-423.
84. Stoms, D. M., F. W. Davis, S. J. Andelman, M. H. Carr, S. D. Gaines, B. S. Halpern, R. Hoenicke, S. G. Leibowitz, A. Leydecker, E. P. Madin, H. Tallis and R. R. Warner. 2005. Integrated coastal reserve planning: making the land-sea connection. Frontiers in Ecology and the Environment 3: 429-436.
85. Thornber C. S. and Gaines S. D. 2004. Population demographics in species with biphasic life cycles. Ecology 85(6):1661-1674.
86. Thornber, C. S., B. P. Kinlan, M. H. Graham and J. J. Stachowicz. 2004. Population ecology of the invasive kelp Undaria pinnatifida in California: environmental and biological controls on demography. Marine Ecology Progress Series 268: 69-80.
87. Wares, J., S. D. Gaines and C. Cunningham. 2001. A comparative study of asymmetric migration events across a marine biogeographic boundary. Evolution 55: 295-306.
88. Warrick J. A., L. A. K. Mertes, L. Washburn and D. A. Siegel. 2004. Dispersal forcing of southern California river plumes, based on field and remote sensing observations. Geo-Marine Letters 24: 46–52.
89. Warrick, J. A., L. A. K. Mertes, D. A. Siegel and C. MacKenzie, 2004: Estimating suspended sediment concentrations in turbid coastal waters with SeaWiFS. International Journal of Remote Sensing 25, 1995-2002.
90. Warrick J. A., L. A. K. Mertes, L. Washburn and D. A. Siegel. 2004. A conceptual model for river water and sediment dispersal in the Santa Barbara Channel, California. Continental Shelf Research 24: 2029-2043.
91. Warrick J. A., L. Washburn, M. A. Brzezinski and D. A. Siegel. 2005. Nutrient contributions to the Santa Barbara Channel, California, from the ephemeral Santa Clara River. Estuarine, Coastal and Shelf Research 62: 559-574.
92. Washburn, L., J. F. Clark and P. Kyriakidis. 2005. The spatial scales, distribution and intensity of natural marine hydrocarbon seeps near Coal Oil Point, California, Marine and Petroleum Geology 22: 569–578.
93. Washburn, L., K. A. McClure, B. H. Jones and S. M. Bay. 2003. Spatial Scales and Evolution of Stormwater Plumes in Santa Monica Bay, Marine Environmental Research 56 (1-2): 103-125.
Suppl doc 1-1-7
94. Zacherl D, S. D. Gaines and S. I. Lonhart. 2003. The limits to biogeographical distributions: insights from the northward extension of the marine snail, Kelletia kelletia (Forbes 1852). Journal of Biogeography 30 (6): 913-924.
95. Zacherl D. C., G. Paradis and D. W. Lea. 2003. Barium and strontium uptake into larval protoconchs and statoliths of the marine neogastropod Kelletia kelletia. Geochimica et Cosmochimica Acta 67(21): 4091-4099.
96. Zacherl, D. C., P. H. Manríquez, G. Paradis, R. W. Day, J. C. Castilla, R. R. Warner, D. W. Lea and S. D. Gaines. 2003. Trace elemental fingerprinting of gastropod statoliths to study larval dispersal strategies. Marine Ecology Progress Series 248: 297-303.
Books
1. Reed, D. C., B. Mardian and B. Evans. 2005. A field guide to common subtidal plants and animals. 2nd Edition. Santa Barbara Coastal Ecosystem Long-Term Ecological Research Program, Marine Science Institute, University of California, Santa Barbara CA http://sbc.lternet.edu/data/research/reef.
2. Reed, D. C., S. C. Schroeter and D. Huang. An experimental investigation of the use of artificial reefs to mitigate the loss of giant kelp forest habitat. A case study of the San Onofre Nuclear Generating Station’s artificial reef project. California Sea Grant College Program University of California, San Diego, CA 92093-0232. in press.
3. Sax, D. F., J. J. Stachowicz and S. D. Gaines, Editors 2005. Species invasions: insights into ecology, evolution and biogeography. Sinauer Associates, Sunderland, MA.
Book Chapters
1. Dugan, J. E. and D. Hubbard. Southern New Zealand Beaches. 2003. Pages 278-282 in J. Darby, J, R. E. Fordyce, A. Mark, K. Probert and C. Townsend, Editors. The natural history of southern New Zealand. University of Otago Press, Dunedin, New Zealand.
2. Gaylord, B. Hydrodynamic forces. in M.W. Denny and S.D. Gaines, Editors. Encyclopedia of tidepools. University of California Press. in review.
3. Kinlan, B. P. and A. M. Hastings. 2005. Rates of population spread and geographic range expansion: what exotic species tell us. Pages 381-419 in D. F. Sax, J. J. Stachowicz and S. D. Gaines, Editors. Species invasions: insights to ecology, evolution and biogeography. Sinauer Associates, Sunderland, MA.
4. Reed, D. C., B P. Kinlan, P. T. Raimondi, L. Washburn, B. Gaylord and P. T. Drake. 2006. A Metapopulation perspective on patch dynamics and connectivity of giant kelp. Pages 353-386 in J. P. Kritzer and P. F. Sale, Editors. Marine metapopulations. Academic Press. San Diego.
5. Sax, D. F. and S D. Gaines. The biogeography of naturalized species and the species-area relationship: reciprocal insights to biogeography and invasion biology. in M. W. Cadotte, S. M. McMahon and T. Fukami, Editors. Conceptual ecology and invasions biology: reciprocal approaches to nature. Kluwer, Netherlands. in press.
6. Sax, D. F., J. H. Brown, E. P. White and S. D. Gaines. 2005. The dynamics of species invasions: insights into the mechanisms that limit species diversity. Pages 447-466 in D. F. Sax, J. J. Stachowicz and S. D. Gaines, Editors. Species invasions: insights into ecology, evolution and biogeography. Sinauer Associates, Sunderland, MA.
7. Sax, D. F., J. J. Stachowicz and S. D. Gaines. 2005. Introduction: species invasions help complete the puzzle. Pages 1-8 in D. F. Sax, J. J.Stachowicz and S. D. Gaines, Editors.
Suppl doc 1-1-8

Species invasions: insights into ecology, evolution and biogeography. Sinauer Associates, Sunderland, MA.
8. Sax, D. F., J. J. Stachowicz and S. D. Gaines. 2005. Where do we go from here? Pages 467-480 in D. F. Sax, J. J. Stachowicz and S. D. Gaines, Editors. Species invasions: insights into ecology, evolution and biogeography. Sinauer Associates, Sunderland, MA.
Dissertations and Theses
1. Bose, R. 2004. Composing and conveying lineage metadata for environmental science research computing. PhD. Dissertation. Bren School of Environmental Science and Management.
2. Bull, J. S. 2002. An experimental evaluation of different methods of restoring Phyllospadix torreyi (Surfgrass). Master’s Thesis. University of California, Santa Barbara, CA.
3. Otero, M. P. 2002. Spatial and temporal characteristics of sediment plumes and phytoplankton blooms in the Santa Barbara Channel. Master’s Thesis. University of California, Santa Barbara, CA 113 pp.
4. Rennebarth, T. 2002. Impact of nutrients on diatom communities in a California Salt Marsh (Einfluesse von Naehrstoffeintraegen auf die Diatomeengesellschaften einer kalifornischen Salzmarsch) Master’s Thesis, Technical University of Munich, Limnologial Field Station at the Osterseen, Germany.
5. Robinson, T. H. 2006. Catchment and sub-catchment scale linkages between land use and nutrient concentrations and fluxes in coastal California streams Ph.D. Dissertation, Bren School of Environmental Science and Management, University of California, Santa Barbara, CA.
6. Schwager, K. 2005. Surface gas flux and chemical composition of marine hydrocarbon seeps at Coal Oil Point, California. Masters Thesis, Interdepartmental Program in Marine Science, University of California, Santa Barbara, CA 64 pp.
7. Warrick, J A. 2002. Short-term (1997-2000) and long-term (1928-2000) observations of river water and sediment discharge to the Santa Barbara Channel, California. Ph.D. Dissertation, University of California, Santa Barbara, CA 337 pp.
Other Publications
1. Airame, A., S. D. Gaines and C. Caldow. 2003. Ecological Linkages: Marine and Estuarine Ecosystems of Central and Northern California 2003. National Oceanographic and Atmospheric Administration booklet.
2. Dugan, J. E., D. M. Hubbard and H. M. Page. 2005. Ecological effects of grooming on exposed sandy beaches in Southern California. Pages 824-826 in O. T. Magoon, H. Converse, B. Baird, B. Jines and M. Miller-Henson, Editors. California and the world ocean ’02: revisiting and revising California’s ocean agenda: proceedings of the conference. American Society of Civil Engineers.
3. Hanrahan, M., M. Marquardt and J. Waters. 2004. Hopping with life: the ecology of kelp on the beach. Short film for public exhibit at the Santa Barbara Museum of Natural History’s Ty Warner Sea Center. The Ocean Channel. see: http://www.ocean.com/film.asp?resourceid=3500&catid=48&locationid=3
Suppl doc 1-1-9

4. Leydecker, A., T. H. Robinson and J. M. Melack. 2004. Nitrate Storm Flux from Coastal Catchments in Southern California. EOS Trans. AGU 85(47), Fall Meeting Supplement, Abstract H53A-1216.
5. Leydecker, A., J. Simpson, L. A. Grabowski and M. D. Lim, 2004. Nutrient uptake and cycles of change: the Ventura River in southern California. Extended abstract, 228th ACS National Meeting, Philadelphia, PA, August 22-26, ENVR-209, American Chemical Society,Washington D.C.
6. Paduan, J. D., J. O'Donnell, A. Allen, P. M. Kosro, S. Glenn, M. Bushnell, D. Musgrave, N. Shay, L. Washburn and M. Luther. 2004. Surface current mapping in U.S. coastal waters: implementation of a national system. US Ocean Steering Committee Report, Arlington, VA, 22 pp.
7. Robinson, T. H., A. Leydecker, J. M. Melack and A. A. Keller. 2002. Nutrient concentrations in southern California streams related to land use. Pages 339-343 in J. R. Lesnick, Editor. Coastal water resources, AWRA 2002 spring specialty conference proceedings, American Water Resources Association, Middleburg, Virginia, TPS-02-1.
8. Robinson, T. H., A. Leydecker, A. A. Keller and J. M. Melack. 2003. Nutrient export coefficient modeling in Mediterranean coastal streams. D-191. Proceedings of VI Inter-regional Conference on Environment-Water, Land and Water Use Planning and Management. Centro Regional de Estudios de Agua, Universidad de Castilla-La Mancha, Albacete, Spain.
9. Robinson, T. H., A. Leydecker, J. M. Melack and A. A. Keller. 2005. Nutrient Concentrations in Coastal Streams and Variations with Land Use in the Carpinteria Valley, California. Pages 811-823 in O. T. Magoon, H. Converse, B. Baird, B. Jines and M. Miller-Hessen, Editors. California and the world ocean ’02, revisiting and revising California’s ocean agenda, proceedings of the conference, American Society of Civil Engineers.
Suppl doc 1-1-10

Table 1-2a. Type I Datasets collected by Santa Barbara Coastal LTER and available via the SBC LTER website http://sbc.lternet.edu/data/index.html. SBC also makes use of and provides links to other data products available from other agencies or projects, including US Geological Survey, National Climactic Data Center, Santa Barbara County Public Works Dept., National Data Buoy Center.
Dataset Title Summary of measurements Years
Covered Hydrology and Stream Chemistry: Precipitation Rainfall at 12 stations, interpolated to 5min 2003 - 2005 Stream Discharge Stream stage and discharge at 26 stations,
interpolated to 15 min 2002 – 2005
Stream Chemistry Nutrients, major anions and cations at up to 200 locations
2001- 2004
Ocean Biogeochemistry: Nearshore Ocean Water Chemistry Profiles
Profiled CTD and chemistry for 40-50 constituents at 9 reef stations, collected monthly
2001-2004
Moored Hydrography and Currents
Continuous CTD, ADCP and optical measurements at 3 core reefs sites, interpolated to 20min
2001-2005
Bottom Temperature at Reef Sites Bottom temperature every 15 min at 11 sites 2001-2005 UNOLS Cruises in the Santa Barbara Channel
Hydrography and Chemical constituents at 30+ sites in the coastal ocean, 14 cruises
2001-2005
Foodweb stable isotopes: Natural Abundance of Stable Isotopes of C and N
Samples collected from kelp and consumers, plus particulates from stream and nearshore seawater
2001-2004
Kelp Forest Community Dynamics:
Cover of Sessile Organisms Sessile invertebrates, understory algae and substrate types using Uniform point contact method
2000 - 2005
Fish Abundance Abundance and size of resident fish at 11 sites, 2-8 transects/site
2000 - 2005
Abundance and Size of Giant Kelp Macrocystis pyrifera sampled at 11 sites, 2-8 transects/site
2000 - 2005
Invertebrate and Algal Density Abundance and size of selected benthic invertebrates and understory algae at 11 sites, 2-8 transects/site
2000 - 2005
Historical Data on Giant Kelp Biomass
Visual estimates of harvestable kelp biomass in the Southern California Bight
1957 - 2005
: Primary production Kelp Net Primary Production In terms of dry mass and carbon, calculated
from frond density, tissue content, and loss terms
2002 - 2005
Suppl doc 1-2-1
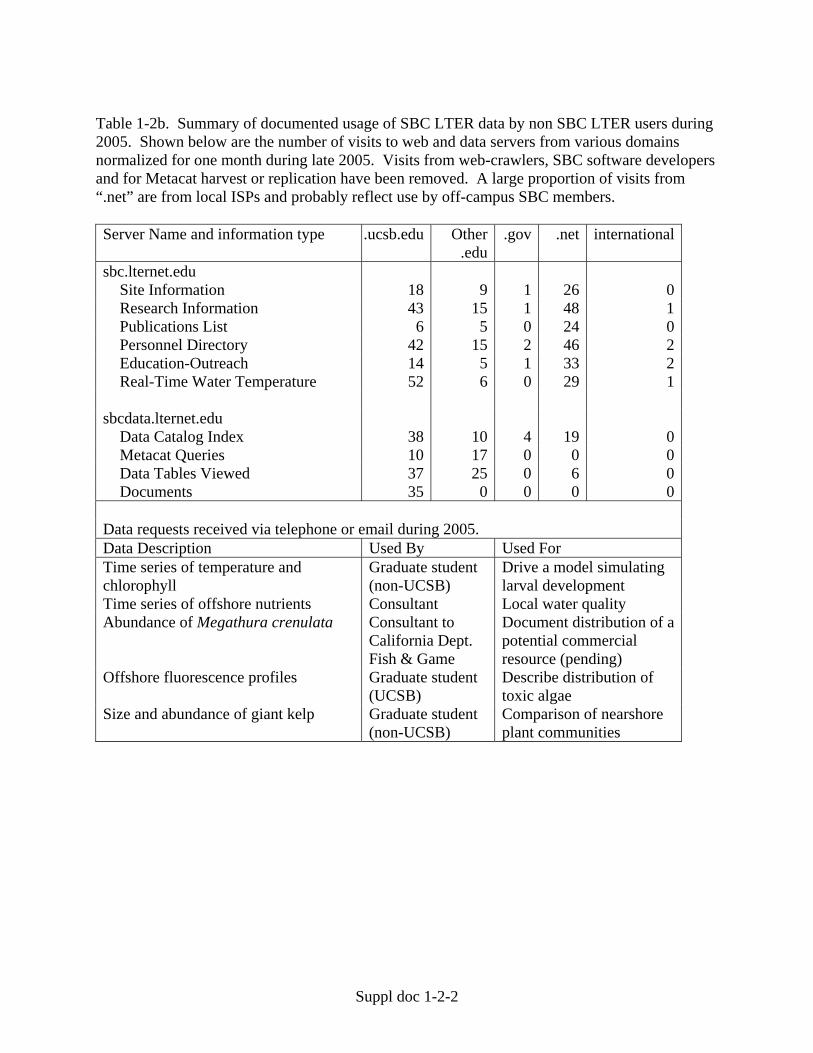
Table 1-2b. Summary of documented usage of SBC LTER data by non SBC LTER users during 2005. Shown below are the number of visits to web and data servers from various domains normalized for one month during late 2005. Visits from web-crawlers, SBC software developers and for Metacat harvest or replication have been removed. A large proportion of visits from “.net” are from local ISPs and probably reflect use by off-campus SBC members. Server Name and information type .ucsb.edu Other
.edu.gov .net international
sbc.lternet.edu Site Information 18 9 1
26 0
Research Information 43 15 1 48 1Publications List 6 5 0 24 0Personnel Directory 42 15 2 46 2Education-Outreach 14 5 1 33 2Real-Time Water Temperature 52 6 0 29 1
sbcdata.lternet.edu
Data Catalog Index 38 10 4 19 0Metacat Queries 10 17 0 0 0Data Tables Viewed 37 25 0 6 0Documents 35 0 0 0 0
Data requests received via telephone or email during 2005. Data Description Used By Used For Time series of temperature and chlorophyll
Graduate student (non-UCSB)
Drive a model simulating larval development
Time series of offshore nutrients Consultant Local water quality Abundance of Megathura crenulata Consultant to
California Dept. Fish & Game
Document distribution of a potential commercial resource (pending)
Offshore fluorescence profiles Graduate student (UCSB)
Describe distribution of toxic algae
Size and abundance of giant kelp Graduate student (non-UCSB)
Comparison of nearshore plant communities
Suppl doc 1-2-2