cover sheet c 1 9 9 8 0 0 1 3 4 - aboitizpower.com 1 9 9 8 0 0 1 3 4 a b o i t i z p o w e r c o r p...
TRANSCRIPT
C 1 9 9 8 0 0 1 3 4
A B O I T I Z P O W E R C O R P O R A T I O N
3 2 N D S T R E E T , B O N I F A C I O G L O B A L
C I T Y , T A G U I G C I T Y , M E T R O M A N I L A
P H I L I P P I N E S
3rd Monday of May
1 2 3 1 1 7 - Q 0 5 2 0
S E C
Remarks = pls. Use black ink for scanning purposes
Document I.D. Cashier
S T A M P S
To be accomplished by SEC Personnel concerned
File Number LCU
Total No. of Stockholders Domestic Foreign
- - - - - - - - - - - - - - - - - - - - - - - - - - - - - - - - - - - - - - - - - - - - - - - - - - - - - - - - - - - - - - - - - - - - - -
x
Secondary License Type, if Applicable
Amended Articles Number/SectionDept. Requiring this Doc
Month Day
Annual Meeting
Month Day
S.E.C. Registration Number
( Company's Full Name )
( Business Address: No. Street City / Town / Province )
COVER SHEET
Fiscal Year
FORM TYPE
M. JASMINE S. OPORTO
Contact Person Company Telephone Number
02-886-2800
2nd Quarterly Report 2013

SECURITIES AND EXCHANGE COMMISSION
SEC FORM 17-Q
QUARTERLY REPORT PURSUANT TO SECTION 17 OF THE SECURITIES REGULATION CODE AND SRC RULE 17(2)(b) THEREUNDER
1. For the quarterly period ended JUNE 30, 2013 2. Commission identification number C1998001343. BIR Tax Identification No. 200-652-460 4. Exact name of issuer as specified in its charter ABOITIZ POWER CORPORATION 5. Province, country or other jurisdiction of incorporation or organization Philippines 6. Industry Classification Code: (SEC Use Only) 7. Address of issuer's principal office Postal Code 32nd Street, Bonifacio Global City,Taguig City, Metro Manila, Philippines 1634 8. Issuer's telephone number, including area code (032) 886-2800 9. Former name, former address and former fiscal year, if changed since last report
Gov. Manuel A. Cuenco Avenue,Kasambagan, Cebu City 6000 10. Securities registered pursuant to Sections 8 and 12 of the Code, or Sections 4 and 8 of the RSA Title of Each Class Number of Shares of Common Stock
Outstanding and Amount of Debt Outstanding (as of June 30, 2013)
Common Stock P1 Par Value 7,358,604,307
Amount of Debt Outstanding P59,540,906,000.00
11. Are any or all of the securities listed on a Stock Exchange? Yes [ x ] No [ ]
If yes, state the name of such Stock Exchange and the class/es of securities listed therein: Philippine Stock Exchange Common

2
12. Indicate by check mark whether the registrant:
(a) has filed all reports required to be filed by Section 17 of the Code and SRC Rule 17 thereunder or Sections 11 of the RSA and RSA Rule 11(a)-1 thereunder, and Sections 26 and 141 of the Corporation Code of the Philippines, during the preceding twelve (12) months (or for such shorter period the registrant was required to file such reports)
Yes [x ] No [ ] (b) has been subject to such filing requirements for the past ninety (90) days. Yes [x ] No [ ]
PART I--FINANCIAL INFORMATION
Item 1. Financial Statements. Please refer to the financial statements and schedules attached herewith. Item 2. Management's Discussion and Analysis of Financial Condition and Results of Operations. The following discussion and analysis of Aboitiz Power Corporation’s (AP, AboitizPower or the Company)consolidated financial condition and results of operations should be read in conjunction with the consolidated financial statements and accompanying schedules and disclosures set forth elsewhere in this report.
Top Five Key Performance Indicators Management uses the following indicators to evaluate the performance of registrant AboitizPower and its subsidiaries (the Company and its subsidiaries are hereinafter collectively referred to as the “Group”):
1. Share in Net Earnings of Associates. Share innet earnings (losses) of associates represents the Group's share in the undistributed earnings or losses of its investees for each reporting period subsequent to acquisition of said investment, net of goodwill impairment cost, if any. Goodwill is the difference between the purchase price of an investment and the investor's share in the value of the net identifiable assets of the investee at the date of acquisition. Share in Net Earnings of Associates indicates profitability of the investment and investees' contribution to the group's net income.
Manner of Computation: Associate's Net Income (Loss) x Investor's % ownership - Goodwill Impairment Cost
2. Earnings before Interest, Taxes, Depreciation and Amortization (EBITDA). The Company computes EBITDA as earnings before extra-ordinary items, net finance expense, income tax provision, depreciation and amortization. It provides management and investors with a tool for determining the ability of the Group to generate cash from operations to cover financial charges and income taxes. It is also a measure to evaluate the Group’s ability to service its debts.
3
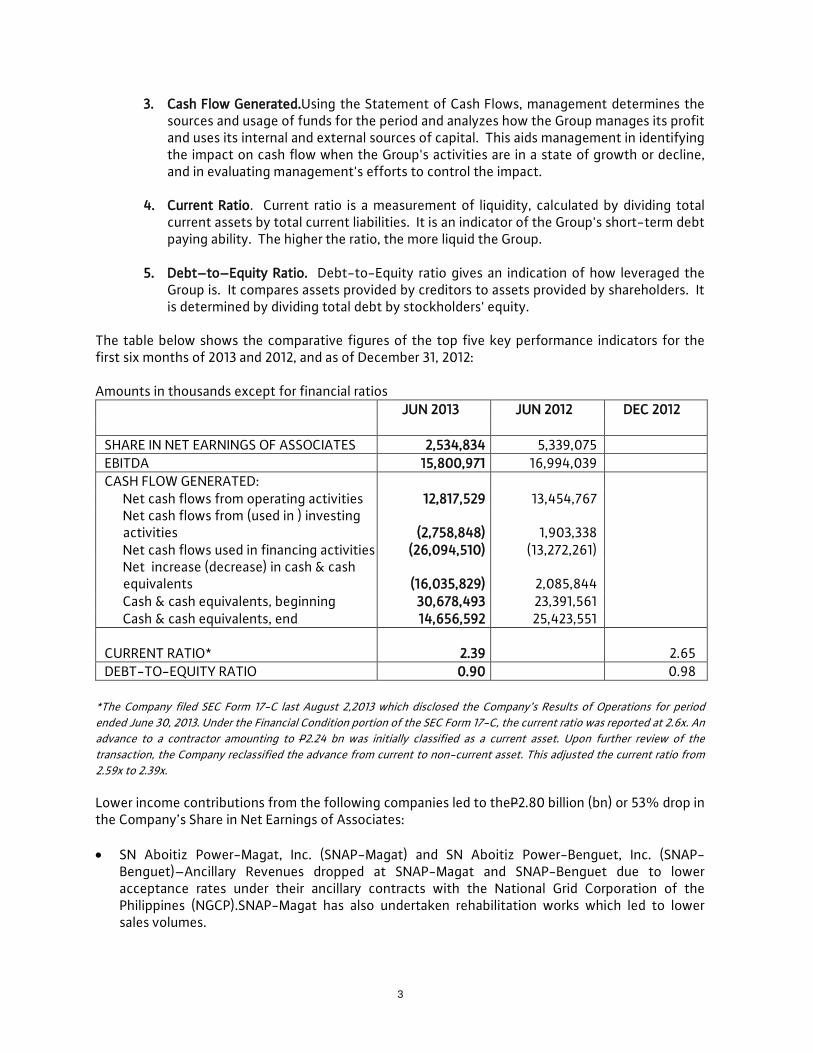
3. Cash Flow Generated.Using the Statement of Cash Flows, management determines the sources and usage of funds for the period and analyzes how the Group manages its profit and uses its internal and external sources of capital. This aids management in identifying the impact on cash flow when the Group's activities are in a state of growth or decline, and in evaluating management's efforts to control the impact.
4. Current Ratio. Current ratio is a measurement of liquidity, calculated by dividing total
current assets by total current liabilities. It is an indicator of the Group's short-term debt paying ability. The higher the ratio, the more liquid the Group.
5. Debt–to–Equity Ratio. Debt-to-Equity ratio gives an indication of how leveraged the
Group is. It compares assets provided by creditors to assets provided by shareholders. It is determined by dividing total debt by stockholders' equity.
The table below shows the comparative figures of the top five key performance indicators for the first six months of 2013 and 2012, and as of December 31, 2012: Amounts in thousands except for financial ratios JUN 2013 JUN 2012 DEC 2012
SHARE IN NET EARNINGS OF ASSOCIATES 2,534,834 5,339,075 EBITDA 15,800,971 16,994,039 CASH FLOW GENERATED:
Net cash flows from operating activities 12,817,529 13,454,767 Net cash flows from (used in ) investing
activities (2,758,848) 1,903,338 Net cash flows used in financing activities (26,094,510) (13,272,261) Net increase (decrease) in cash & cash
equivalents (16,035,829) 2,085,844 Cash & cash equivalents, beginning 30,678,493 23,391,561 Cash & cash equivalents, end 14,656,592 25,423,551
CURRENT RATIO* 2.39
2.65 DEBT-TO-EQUITY RATIO 0.90 0.98
*The Company filed SEC Form 17-C last August 2,2013 which disclosed the Company’s Results of Operations for period ended June 30, 2013. Under the Financial Condition portion of the SEC Form 17-C, the current ratio was reported at 2.6x. An advance to a contractor amounting to P2.24 bn was initially classified as a current asset. Upon further review of the transaction, the Company reclassified the advance from current to non-current asset. This adjusted the current ratio from 2.59x to 2.39x. Lower income contributions from the following companies led to theP2.80 billion (bn) or 53% drop in the Company’s Share in Net Earnings of Associates: • SN Aboitiz Power-Magat, Inc. (SNAP-Magat) and SN Aboitiz Power-Benguet, Inc. (SNAP-
Benguet)–Ancillary Revenues dropped at SNAP-Magat and SNAP-Benguet due to lower acceptance rates under their ancillary contracts with the National Grid Corporation of the Philippines (NGCP).SNAP-Magat has also undertaken rehabilitation works which led to lower sales volumes.
4
A contractual rebasing of STEAG State Power, Inc.’s (STEAG) tariffs which resulted into lower margins has led to lower income contributions from STEAG.
• Visayan Electric Company, Inc. (VECO) posted higher earnings contribution from higher margins
as a result of the continued implementation of its approved distribution tariff under the Performance Based Regulation (PBR) scheme as well as higher electricity sales in VECO’s franchise area on the back of stronger demand.
The Company’s Current ratio as of June 30, 2013 slightly declined from 2.65x as of the end of 2012 to 2.39x as of the end of June 2013. The decrease in this ratio came about from a decrease in the Company’s current assets as a result of lower Cash and Cash equivalents as various long term debt was paid down during the period. With significant payments made on its long term debt, the Company’s Debt to Equity ratioimproved from 0.97x as of December 31, 2012 to 0.90x as of June 30,2013. Results of Operations The Company’s consolidated net income in the first half of 2013 came in at P9.51bn, a 22% decrease from the prior year results of P12.18 bn. Core net income for the period is P10.89 bn a 6% decrease from the prior year. This is after adjusting for a non-recurring foreign exchange loss of P1.28 bn (versus last year’s foreign exchange gain of P945 million (mn)) and for a non-recurring expense from debt prepayment amounting to P93 mn. Power Generation The Company’s Generation group contributed P8.07 bn in the first six months of the year, a 29% decrease when compared to contributions made in the prior year. After adjusting for non-recurring items, the Company’s generation business amounted to P9.42 bn for the period, which was 11% lower than last year. Attributable net generation for the semester grew by 5% YoY, from 5,096 GWh to 5,360 GWh for the period in review due to the increase in demand brought about by the hotter weather during the summer months. The increase in sales was not enough to offset the effects of the decline in ancillary volumes which dropped by 63% during the period due to the lower acceptance rate by the NGCP. Average selling prices also decreased by 11% YoY during the first half of 2013. This is from the combined effect of the lower average selling price of electricity sold to the spot market lower by 19% and average selling price under bilateral contracts lower by 10%. On a capacity basis, the Company’s attributable sales decreased by 6% YoY from 1,560 MW to 1,465 MW as a result of lower sales for ancillary services. This more than offset the impact of the 74% increase in capacity sales made by the Company through bilateral contracts as a result of the Company’s efforts to shift to de risked capacity based contracts. Power Distribution The distribution group increased its income contribution this year, from P1.41 bn to P1.63 bn. The improved contributions come from higher sales volumes, up 2% this period and growth in the group’s margins.
5
The residential segment grew by 6%, while sales to non-residential customers (commercial and industrial customers) increased by 3%. The group’s margins improved from an average ofP1.56 per kWh to P1.71 per kWh. A contributor to the improvement in the group’s gross margin was the continued efficiencies realized in the management of the systems loss levels of both VECO and Cotabato Light &Power Company (Cotabato Light), which registered reductions of 1.1 and 3.1 percentage points, respectively. Changes in Line Items of Registrant’s Statements of Income and Comprehensive Income Consolidated Statements of Income (January – June2013 vs. January –June2012)
The various movements in the revenue and expense line items leading to the consolidated net income of P9.51bnare shown below:
Consolidated net income attributable to equity holders of the Parent (January – June2012) P12,182,979 Decrease in operating revenues (1,570,153) Decrease in operating expenses 3,013,145 Decrease in interest income (138,296) Decrease in interest expense and other financing costs 641,136 Decrease in other income (2,332,390) Decrease in share in net earnings of associates (2,804,241) Lower provision for taxes 487,892 Decrease in income attributable tonon-controlling interests 33,067 Total (2,669,840) Consolidated net income attributable to equity holders of the Parent (January – June 2013) P 9,513,139
Operating Revenues (5% decrease from P31.27bn to P29.70bn) Aslight decrease in distribution revenues came from lower operating revenues at SubicEnerzone Corporation(SEZ) as a result of lower sales to a major industrial customer. Operating revenues at MactanEnerzone Corporation (MEZ) and BalambanEnerzone Corporation (BEZ) also decreased slightly due to lower revenues from their industrial customers. Operating revenues for the consolidated generating companies declined by 7%mainly from the lower revenues at AP Renewables, Inc. (APRI) due to a 13% decrease in sales volume and a 5% drop in average selling prices.Therma Luzon, Inc. (TLI) also had lower operating revenues for the period as an increase in energy sales of 11% was unable to make up for the effects of the decrease in average selling prices which were lower by 15%. Operating Expenses (14% decrease from P21.49bn to P18.47bn) The decrease in operating expenses for the first six months of 2013 as compared to the same period last year can be mainly attributed to the lower operating expenses at APRI due to lower steam costs during the period. This year Luzon Hydro Corporation (LHC) has lower operating expenses as
6
compared to the prior year when it had to incur significant expenses relating to its tunnel repairs.At TLI, operating expenses decreased as a result of lower coal prices. Interest Income (35% decrease from P392mn to P254mn) Lower interest incomein the first semester of the year is due to the lower averagecash balances held by the Group during the period. Interest Expense (17% decrease from P3.71bn to P3.1bn) In the past year, the Group has paid down long term debt at Parent and subsidiary companies. The lower average debt balances has led to the decrease in interest expense. Share in Net Earnings of Associates (53% decrease from P5.34bn to P2.53 bn) The P2.80bn drop in the Company’s share in net earnings of associates is mainly attributed to the decreased contributions from the two large hydro companies, SNAP-Magat and SNAP-Benguet. The contributions from both companies yielded to the pressure brought about by the significantly lower acceptance rates by NGCP, on its ancillary services. In the first quarter of the year lower water levels at both impounding dams have led to limited sales to the spot market.In the second quarter, planned refurbishment works at SNAP-Magat also led to lower sales volumes during the period. STEAG’s income contribution also lagged behind last year’s with the lower margins from its rebased tariffs. VECO managed to contribute higher this period than last year with the continued improvement in its gross margins and reduction in its systems losses. Others - net (186% decrease from P1.26bnOther-Income to P1.08 bn Other -Expense) The account moved from an unrealized foreign exchange gain of P945 mn in the prior year reporting period, to an unrealized foreign exchange loss of P1.28 bn this period. The huge swing comes from the restatement of TLI’s dollar denominated debt on its monthly obligations to the Power Sector Assets and Liabilities Management Corporation (PSALM). This is accounted for as a finance lease obligation. Provision for Income Tax (80% decrease from P 613 mn to P125 mn) The decrease in provision for income tax (P125 million vsP613 million in 1H2012) was mainly due to the deferred tax benefits recognized on the unrealized foreign exchange losses recorded by TLI.

7
Net Income Attributable to Non-controlling Interests (13% decrease from P265 mn to P232 mn) Lower net income contributed by Cebu Private Power Corporation (CPPC-40% of which is owned by minority shareholders) for the reporting period compared to prior years led to lower Net Income attributable to Non-controlling interests. Consolidated Statements of Comprehensive Income (January - June 2013 vs. January – June 2012) Total Consolidated comprehensive income attributable to equity holders of the Parent decreased by 20% after taking up the Share in movement in cumulative translation adjustments. Changes in Registrant’s Resources, Liabilities and Shareholders’ Equity Assets (June 30, 2013 vs. December 31, 2012 AsRestated) Total assets decreased by 7% from P163.14. bn as of December 31, 2012 to P151.99bn as of June 30, 2013. The significant accounts contributing to the decreasein total assets are discussed below:
a) The Company’s Cash and cash equivalents decreased by P16.02 bn. The decrease comes after the following major outflows to support financing activities: 1) P13.83 bn to pay dividends in the first half of the year 2) Payment of long term debt amounting to P8.29 bn 3) TLI’s payments on its finance lease obligation. Cash from operating activities of P10.57 bn mitigated the cash outflows used for financing activities.
b) Trade and other receivables increased by 8% (from P8.12bn in December 2012 to P8.76bn in June 2013). The increase is due to higher receivable balances at TLI due to new contracts.
c) The P19mn increase in derivative asset is mainly arising from an existing interest rate swap
agreement under LHC. d) The inventory account decreased by 26% mainly from lower levels of coal inventory held
at TLI. e) Other current assets increased by 46% (from P1.04 bn in December 2012 to P1.52bn in
June 2013). The build-up of input VAT by power generation subsidiaries during the period in reviewparticularly at Therma Marine, Inc. (TMI), APRI and Therma Mobile, Inc. (TMO), led to the increase in the Other current assets account.
f) Although in percentage terms the increase in the Power plant and Equipment account is
not significant but it is worth noting that the Company has continued to infuse into the construction of the 300-MW coal plant in Davao which led to the P2.90 bnincrease. Also, adding to the increase in the account is the on-going rehabilitation of the power barges under TMO. This is net of depreciation recorded during the period.

8
g) Available for sale (AFS) Investments increased by 5% due to the purchase of an additional share in a membership club by Davao Light& Power Company, Inc. (Davao Light).
h) Decrease in Pension Assets is due to the accrual of defined benefit expense during the
period. i) The increase in deferred income tax assets is due to the effect of the provisions made at
TLI as unrealized foreign exchange losses resulted in a corresponding increase in deferred income tax assets during the period.
j) Other non-current assets increased by 6% mainly due to an increase in deferred input vat
at Therma South, Inc. (Therma South). Liabilities (June 30, 2013 vs. December 31, 2012 As Restated) Consolidated liabilities as of June 30, 2013 decreased by 11% or by P8.68 bn from December 31, 2012 balances.The major changes leading to the decrease are as follows:
a) Bank loans are lower by P203 mn. Davao Light and Cotabato Light paid their short term bank loans in the first half of the year. This is net of an increase of short term loans at Hedcor, Inc. of P298 mn.
b) In November 28,2012, the Board of Directors of the Company approved the declaration of special cash dividends totaling P1.62bn. This amount was payable as of December 31, 2012 but was subsequently paid in January 11, 2013. This accounts for the 15% decrease in Trade and Other Payables.
c) The reported Derivative Liability as of December 31, 2012 was cancelled out asinterest rate
movements that were favorable to the outstanding interest rate swap agreements at LHC swung to a derivative asset position.
d) The increase in Income tax payable as of June 30, 2013 is from Davao Light’s higher tax
payable balances as at the end of the first half of the year.
e) Long Term debt decreased by P8.14 bn. The following long term debt payments were made by the group:
I. Parent Company - payment made on P5 bn Fixed Rate Notes; and II. HedcorSibulan, Inc. (HedcorSibulan)–pre-payment on P3 bn long term debt.
f) Interest accretion on SEZ’s Long-term obligation on power distribution system increased
this account by 7%.
g) Payable to preferred shareholders of a subsidiary inclusive of current portion decreased by P19mn as payments to preferred shareholders were made during the year.
h) Customer Deposits went up by 6% as the customer base at the Company’s distribution utilities particularly at Davao Light continue to expand.

9
i) Deferred income tax liability decreased due to the effect of the foreign exchange movements which led to an elimination of previously recognized deferred income tax liability at TLI.
Equity (June 30, 2013 vs. December 31, 2012 As Restated) Under the Equity section (As restated for December 31, 2012) the Group accounts for unrealized actuarial gains and losses for the group and its associates as required by PAS 19 “Employee Benefits”. Equity attributable to equity holders of the Parent decreasedby P2.52bn from P80.90 bn as ofDecember 31, 2012 to P78.38bn as of June 30, 2013, asP9.51 bnin income for the current period is recognized and net of P12.22 bn in cash dividends paid. Material Changes in Liquidity and Cash Reserves of Registrant (June 30, 2013 vs. December 31, 2012) The major movements in the group’s Cash and cash equivalents which decreased by P16.02bn are accounted for as follows: Cash flows from Operating activities, for the period ending June 30,2013 was P12.82 bn. As compared to last year’s inflows, this represents a 5% decrease. This decrease is attributed to lower EBITDA from the Company’s subsidiaries. Cash during the period was used in Investing activities decreasing the Group’s cash balances by P2.76 bn a change in direction of cash flowsas compared to last year’s investing activities which contributed P1.90 bn.This is mainly due to continued investments into the on-going construction of various Greenfield projects particularly for the 300 MW Davao coal plant as well aslower dividends received during the period.
The Company’s financing activities in the six months of 2013 were close to double the outflows made during the same period last year. A total of P13.83 bn of dividends were paid while P8.29 bn was used to pay down long term debt. TLI monthly payments on its finance lease obligations have also increased during the period.
As a result of the above cash outflows, Cash and cash equivalents is now 52% lower from P30.68 bn as of December 31, 2012 to P14.66 bn as of June 30, 2013. Financial Ratios Last August 2, 2013, the Company filed SEC Form 17-C which disclosed the Company’s Results of Operations for period ended June 30, 2013. Under the Financial Condition portion of the SEC Form 17-C, the current ratio was reported at 2.6x. An advance to a contractor amounting to P2.24 bn was initially classified as a current asset. Upon further review of the transaction, the Company reclassified the advance from current to non-current asset. This adjusted the current ratio from 2.59x to 2.39x. With the 37% decrease in the Company’s current assets resulting from the lower cash balances as of the first semester ending 2013, the Current Ratio dropped from 2.65x as of December 31, 2012 to 2.39x as of June 30,2013.

10
The lower debt balances as of June 30, 2012 led to an improved Debt to equity ratio from 0.97x as of December 31, 2012 to 0.90x as of June 30,2013. Outlook for the Upcoming Year/ Known Trends, Events, Uncertainties which may have Material Impact on Registrant Over the long term, AboitizPower remains to be in a very good position to benefit from the opportunities that developments concerning the electricity industry will bring. Its sound financial condition, coupled with a number of initiatives that the Company is undertaking will allow it to create additional generating capacity over the next several years. Nevertheless, AboitizPower sees several challenges that it may severely constrain earnings growth in 2013. These developments are as follows: Power Generation Business 1. Ancillary Services SN Aboitiz Power (SNAP) a partnership between AboitizPower and SN Power Invest AS (SN Power), is currently providing ancillary services to National Grid Corporation of the Philippines (“NGCP”) under an Ancillary Services Procurement Agreement (ASPA). The ASPA for Magat expired last November 5, 2012 while Binga’s ASPA expired on June 25, 2013. The Company earlier disclosed that its affiliates, SNAP-Magat and SNAP-Benguet, have respectively signed ASPAs with NGCP for the provision of regulating, contingency, and dispatchable reserves from the Magat and Ambuklao Hydroelectric Power Plants. Another affiliate, TLI, which runs the Pagbilao Coal Plant, also signed an ASPA with the NGCP covering both firm and non-firm capacities for contingency reserve. The ASPA of Magat and Ambuklao shall be valid for three years once the approval of the Energy Regulatory Commission (ERC) for the contract has been secured. On the other hand, TLI’s ASPA is valid for a period of five years from the date of approval by the ERC. A provisional authority from the ERC has been obtained recently, paving the way for the implementation of the new ASPAs for the Magat, Ambuklao and Pagbilao plants starting July 26, 2013. AboitizPower believes that the implementation of the new ASPAs will result in a significant reduction in the Company’s ancillary revenues due to the restructuring of the pricing mechanism for ancillary services, which is currently linked to spot market rates. On the other hand, the addition of the Ambuklao and Pagbilao plants as licensed ancillary service providers will help offset the expected decline in ancillary revenue. 2. Conversion of AP Renewables, Inc.’s (APRI) existing steam contract to a Geothermal Resource Sales Contract On May 26, 2013, APRI’s current steam supply contract with Chevron shifted to a Geothermal Resource Sales Contract (GRSC). The change is due to an existing provision under the government’s existing contract with Chevron when the Tiwi-Makban facilities were bidded out under the former’s privatization program. The shift to the GRSC will result in a change in the determination of the cost that Chevron can charge to APRI for the steam supply. Consequently, APRI’s annual steam cost will be significantly higher and will adversely impact both top-line sales and operating margins.

11
As of the moment, AboitizPower is in talks with Chevron regarding the possibility of replacing GRSC with a revenue-sharing scheme to maximize plant utilization. 3. Increase in Attributable Generating Capacity Notwithstanding the challenges over the short-term, AboitizPower has built the necessary foundation to sustain its growth trajectory over the long term. Over the next several years, AboitizPower looks to expanding its portfolio of generation assets by implementing the following projects. - Rehabilitation of the Binga Hydro Power Plant
In 2011, SNAP commenced the programmed rehabilitation of the 100 MW Binga hydropower plant, which is consisted of four units with a capacity of 25 MW each. The program involves the increase of each unit’s capacity by 5 MW. Rehabilitation of the first, second, and third units were completed in December 2011, July 2012, and January 2013 respectively. Works on the fourth unit has been completed last July 2013. Full completion will result to Binga’s total net sellable capacity reaching 120 MW. AboitizPower has an effective stake of 50% in this facility.
- Greenfield and Brownfield developments
600 MW (net) Coal-fired Power Plant in Subic. This is a project by Redondo Peninsula Energy, Inc. (RP Energy), a joint venture among MeralcoPowerGen Corporation (“MPGC”), Aboitiz subsidiary Therma Power, Inc. (TPI) and Taiwan Cogeneration International Corporation (TCIC). The project involves the construction and operation of a 2x300 MW (net) circulating-fluidized-bed (CFB) coal-fired power plant located within the Subic Bay Freeport Zone. On November 15, 2012, RP Energy was issued an amended Environmental Compliance Certificate to cover two high-efficiency 300-MW (net) units with main steam reheat systems. Site preparation is substantially completed. The EPC contract has been awarded to Hyundai with Foster Wheeler and Toshiba as major subcontractors/suppliers of the CFB boilers and turbines, respectively. Hyundai has not been issued a notice to proceed with the works, however, because of the filing of a petition for a Writ of Kalikasan and environmental protection order. The petition was denied, but the court’s decision is the subject of a petition for review to the Supreme Courtthat may require the balance of 2013 to resolve. Thus, commercial operation of the power plant now is estimated to begin in early 2017.AboitizPower, through TPI has equity interest of 25% in RP Energy. 300 MW Coal-fired Power Plant in Davao.AboitizPower, through 100%-owned subsidiary Therma South, is putting up a 2x150 MW coal-fired power plant in Davao, which is the biggest load center in the island of Mindanao. The project broke ground in 2012. The EPC contract for the power block was awarded to Formosa Heavy Industries (FHI) with FHI supplying the CFB boilers and Fuji as major subcontractor/supplier of the turbines. The EPC contract for the balance of plant equipment and their integration with the power block was awarded to a consortium of Black & Veatch Corporation and Leighton Contractors (Philippines), Inc. The first generating unit (150 MW) is expected to be completed 34 months after (or March 2015), with the second unit (150 MW) to follow in 3 months (or June 2015). 400 MW (net) Coal-fired Power Plant in Pagbilao, Quezon.On September 27, 2011, AboitizPower signed a Memorandum of Understanding with Marubeni Corporation (Marubeni) to formalize their intention to jointly develop, construct and operate a coal-fired power plant with a capacity of approximately 400 MW (net). The proposed location will be within the premises of the existing 735 MW (net) Pagbilao Units I and II Coal Fired Thermal Power Plant in Quezon province.

12
The terms and conditions of the joint investment will be finalized in a definitive shareholder agreement to be agreed upon by the parties. Marubeni and Tokyo Electric are part-owners of TeaM Energy Corporation (TeaM Energy), which owns and operates the Pagbilao Units I and II under a build-operate-transfer contract with the National Power Corporation (NPC). On the other hand, AboitizPower, through wholly owned subsidiary TLI, is the Independent Power Producer Administrator of the Energy Conversion Agreement between TeaM Energy and NPC under an IPP Administration Agreement with the Power Sector Assets and Liabilities Management Corporation (PSALM), which manages the assets and IPP contracts of NPC. Commercial operations of the first generating unit are targeted within the year 2017. 300-MW (net) Coal-Fired Project in Toledo City, Cebu. AboitizPower, through 100%-owned subsidiary, ThermaVisayas, Inc. (ThermaVisayas), is developing a 2 x 150-MW (net) coal-fired power project in Toledo City. The project site was acquired in December 2011. The Environmental Compliance Certificate for the project was issued in May 2013. 150 MW Coal-fired Power Plant in Misamis Oriental.On June 28, 2010, AboitizPower and its partners in STEAG, owner of the 232 MW coal plant located at the Phividec Industrial Estate in Villanueva, Misamis Oriental, firmed up their collective intention to develop a third unit of approximately 120 MW capacity adjacent to the existing facility.AboitizPower and its partners agreed to maintain their shareholdings in the same proportions in the new corporation to be established for the planned additional capacity. Certain essential facilities, such as the jetty, coal handling facilities and stockyards and the 138-kV interconnection with the Mindanao Grid are to be shared with the existing facilities. Majority control of STEAG has since changed, so the development of a third unit is being reevaluated. 7 MW Tudaya 1 Hydro Power Plant Project.HedcorSibulan started the construction of Tudaya 1 which is located upstream of the existing Sibulan A pondage in the third quarter of 2012. Almost 50% complete, it is scheduled to be finished in the first quarter of 2014. The energy to be produced by Tudaya 1 will be sold to Davao Light through the power supply agreement signed in 2007. 6.6 MW Tudaya 2 Hydro Power Plant Project.AboitizPower’s wholly owned subsidiary HedcorTudaya, Inc. (HedcorTudaya) has started the construction of Tudaya 2 located downstream of the existing Sibulan B. The project which commenced construction in the third quarter of 2012 is already 90% complete. The project is estimated to be completed by the first quarter of 2014. 14 MW Sabangan Hydro Power Plant Project.This involves the construction and operation of a hydropower plant facility in Mt. Province, in Northern Luzon. This project will be undertaken by a wholly owned subsidiary of AboitizPower, HedcorSabangan, Inc. (HedcorSabangan).The project was granted all the permits and licenses in the first quarter of 2013. The construction which will take approximately 24 months has commenced in May 2013. 12 MW HedcorTamugan Hydro Power Plant Project. In 2010, wholly owned subsidiary, HedcorTamugan, Inc. (HedcorTamugan), has reached an agreement with the Davao City Water District on the use of the Tamuganriver. Originally planned as a 27.5 MW run-of-river facility, HedcorTamugan submitted a new proposal, which involves the construction of a 12 MW hydropower plant. HedcorTamugan is waiting for the Davao City council to approve the project. Once approval and permits are secured, the two-year construction period will commence.
13
Other Greenfield and Brownfield developments.AboitizPower, together with its subsidiaries and associate companies, is conducting feasibility studies for potential Greenfield and Brownfield projects.
• SNAP is in the process of evaluating several hydropower plant projects. A Brownfield
project is being evaluated for its Magat hydropower plant, which involves the construction of a pumped storage facility that could potentially increase its capacity by at least 90 MW. SNAP is likewise evaluating several Greenfield hydropower plant projects that have at least 70 MW of potential capacity each.
• Hedcor is conducting feasibility studies for potential hydropower projects located in
Luzon, Visayas, and Mindanao. Based on current findings, Hedcor sees the potential of building plants with capacities ranging from 10 MW to 50 MW. When the projects pass the evaluation stage and once permits are secured, the two-year construction period for the hydropower plant facilities will commence.
4. Participation in the Government’s Privatization Program for its Power Assets AboitizPower continues to closely evaluate the investment viability of the remaining power generation assets that PSALM intends to auction off. AboitizPower is also keen on participating in PSALM’s public auction for the IPP Administrator contracts, which involves the transfer of the management and control of total energy output of power plants under contract with NPC to the IPP administrators. Distribution Business AboitizPower remains optimistic that it will realize modest growth on its existing distribution utilities. It continually seeks efficiency improvements in its operations to maintain healthy margins. On December 13, 2006, the ERC issued the Rules for Setting Distribution Wheeling Rates (“RDWR”) for privately-owned distribution utilities entering PBR for the second and later entry points, setting out the manner in which this new PBR rate-setting mechanism for distribution-related charges will be implemented. PBR replaces the Return on Rate Base (“RORB”) mechanism which has historically determined the distribution charges paid by customers. Under PBR, the distribution-related charges that distribution utilities can collect from customers over a 4-year regulatory period is set by reference to projected revenues which are reviewed and approved by the ERC and used by the ERC to determine a distribution utility’s efficiency factor. For each year during the regulatory period, a distribution utility’s distribution charges are adjusted upwards or downwards taking into consideration the utility’s efficiency factor as against changes in overall consumer prices in the Philippines. The ERC has also implemented a Performance Incentive Scheme whereby annual rate adjustments under PBR will take into consideration the ability of a distribution utility to meet or exceed service performance targets set by the ERC, such as the average duration of power outages, the average time of restoration to customers and the average time to respond to customer calls, with utilities being rewarded or penalized depending on their ability to meet these performance targets. Cotabato Light was supposed to start with its Third Regulatory Period on April 1, 2013. The reset process, however, is potentially delayed due to the absence of the Position Paper, the document
14
covering the issues at hand and the information requirements for the upcoming reset. This is a result of the ERC's direction of adopting a new set of procurement process for its Regulatory Reset Experts which has not been finalized. For the meantime, Cotabato Light shall file an annual rate adjustment application for Regulatory Year 2014. The filing is targeted to be done this August 2013. VECO and Davao Light recently received approvals for the annual rate adjustment application for the Fourth Regulatory Year (July 1, 2013 to June 30, 2014). The new rates have been implemented in the July 2013 billings. For SEZ and San Fernando Electric Light and Power Co., Inc.’s (SFELAPCO) Second Regulatory Year covering October 1, 2012 to September 30, 2013, SEZ was able to implement the new rate schedule starting February 2013 while SFELAPCO implemented beginning April 2013. The filing for the Third Regulatory Year is scheduled this August 2013. Market and Industry Developments Open Access and Retail Competition Per EPIRA, the conditions for the commencement of the Open Access and Retail Competition are as follows:
(a) Establishment of the WESM; (b) Approval of unbundled transmission and distribution wheeling charges; (c) Initial implementation of the cross subsidy removal scheme; (d) Privatization of at least 70% of the total capacity of generating assets of NPC in Luzon
and Visayas; and (e) Transfer of the management and control of at least 70% of the total energy output of
power plants under contract with NPC to the IPP administrators. Under the Open Access and Retail Competition, an eligible contestable customer, which is defined as an end-user with a monthly average peak demand of at least 1 MW for the preceding 12 months, will have the option to source their electricity from eligible suppliers that have secured a Retail Electricity Supplier license from the ERC. Eligible suppliers shall include the following: - Generation companies that own, operate or control 30% or less of the installed generating
capacity in a grid and/or 25% or less of the national installed capacity;
- NPC-Independent Power Producers with respect to capacity which is not covered by contracts; IPP Administrators with respect to the uncontracted energy which is subject to their administration and management; and
- Retail Electricity Suppliers (RES) duly licensed by the ERC.
The implementation of the Open Access and Retail Competition presents a big opportunity for AboitizPower, as it has two wholly owned subsidiaries (i.e. Aboitiz Energy Solutions, Inc. and AdventEnergy, Inc.) that are licensed retail suppliers, which can enter into contracts with the eligible contestable customers. Moreover, AboitizPower’s generation assets that have uncontracted capacity will be able to have direct access to eligible contestable customers through AboitizPower’s licensed RES.

15
In June 2011, the ERC declared December 26, 2011 as the Open Access Date to mark the commencement of the full operations of the competitive retail electricity market in Luzon and Visayas. However, after careful deliberation, the ERC acknowledged that not all the necessary rules, systems and infrastructures required for the implementation of the Open Access and Retail Competition have been put in place to meet the contemplated timetable for implementation. In October 2011, the ERC announced the deferment of the Open Access Date.In September 2012, the ERC declared the start of Open Access on December 26, 2012. Commercial transactions under an interim development system have been implemented starting June 26, 2013.


ABOITIZ POWER CORPORATION AND SUBSIDIARIES Unaudited Consolidated Financial Statements As of June 30, 2013 (with Comparative Audited Consolidated Figures as of December 31, 2012) and for the SixMonths Ended June 30, 2013 and 2012

ABOITIZ POWER CORPORATION AND SUBSIDIARIES CONSOLIDATED BALANCE SHEETS (Amounts in Thousands) (Unaudited) (Restated)(Restated) June 30 December 31 January 1 2013 2012 2012 ASSETS Current Assets Cash and cash equivalents P=14,656,592 P=30,678,493 P=23,391,561 Trade and other receivables 8,755,706 8,115,031 9,505,778 Derivative asset 22,122 2,631 - Inventories 1,604,966 2,173,999 2,173,617 Other current assets 1,519,282 1,038,678 1,107,039 Total Current Assets 26,558,668 42,008,832 36,177,995 Noncurrent Assets Property, plant and equipment 88,043,968 85,145,298 78,708,118 Intangible asset - service concession rights 3,792,133 3,685,417 4,162,768 Investment property 10,000 10,000 10,000 Investments in and advances to associates 26,685,591 25,830,638 29,083,522 Available-for-sale (AFS) investments 3,944 3,744 3,744 Goodwill 996,005 996,005 996,005 Pension assets - 17,573 7,757 Deferred income tax assets 393,219 229,779 293,497 Other noncurrent assets 5,507,253 5,902,972 3,952,445 Total Noncurrent Assets 125,432,113 121,128,426 117,217,856 TOTAL ASSETS P=151,990,781 P=163,137,258 P=153,395,851 LIABILITIES AND EQUITY Current Liabilities Bank loans P=1,073,628 P=1,277,000 P=1,614,600 Trade and other payables 8,588,057 10,052,055 7,121,754 Derivative liabilities – 29,173 7,580 Income tax payable 197,703 123,631 142,683 Current portion of: Long-term debts 465,319 3,582,308 1,504,800 Finance lease obligation 725,471 725,471 - Long-term obligation on power distribution system 40,000 40,000 40,000 Payable to preferred shareholder of a subsidiary 23,303 20,705 16,902 Total Current Liabilities 11,113,481 15,850,343 10,448,319 Noncurrent Liabilities Noncurrent portions of:
Long-term debts 2,572,364 7,593,641 17,300,182 Finance lease obligation 54,677,072 53,654,843 52,714,959 Long-term obligation on power distribution system 247,354 230,843 237,046 Payable to preferred shareholder of a subsidiary 3,749 25,363 46,068
Customers’ deposits 2,558,210 2,404,361 2,164,195 Pension liabilities 215,992 207,154 218,089 Deferred income tax liabilities 565,828 668,848 368,717 Total Noncurrent Liabilities 60,840,569 64,785,053 73,049,256 Total Liabilities 71,954,050 80,635,396 83,497,575 Equity Attributable to Equity Holders of the Parent Capital stock 7,358,604 7,358,604 7,358,604 Additional paid-in capital 12,588,894 12,588,894 12,588,894 Cumulative translation adjustments (66,952) (169,845) (57,668) Share in cumulative translation adjustments of associates (767,982) (847,589) (546,753) Unrealized actuarial gains (losses) (307,000) (307,000) (277,530) Share in unrealized actuarial gains (losses) of associates (73,792) (73,792) (74,316) Share in unrealized valuation gain on AFS investments of an associate 85,296 85,296 73,952 Acquisition of non-controlling interests (259,147) (259,147) (259,147) Retained earnings 59,818,627 62,520,771 49,421,137 78,376,548 80,896,192 68,227,173 Non-controlling Interests 1,660,183 1,605,670 1,671,103 Total Equity 80,036,731 82,501,862 69,898,276 TOTAL LIABILITIES AND EQUITY P=151,990,781 P=163,137,258 P=153,395,851

ABOITIZ POWER CORPORATION AND SUBSIDIARIES CONSOLIDATED STATEMENTS OF INCOME (Amounts in Thousands, Except Earnings Per Share Amounts) (Unaudited) Restated JAN-JUN/13 JAN-JUN/12 APR-JUN/13 APR-JUN/12
OPERATING REVENUES P=29,698,435 P=31,268,588 P=16,394,146 P=16,171,370 OPERATING EXPENSES 18,472,515 21,485,660 10,052,567 11,385,748
FINANCIAL INCOME (EXPENSES) Interest income 253,881 392,177 87,743 221,021 Interest expense and other financing costs (3,067,930) (3,709,066) (1,641,706) (1,877,530) (2,814,049) (3,316,889) (1,553,963) (1,656,509)
OTHER INCOME (EXPENSES) Share in net earnings of associates 2,534,834 5,339,075 1,574,712 3,328,165 Others - net (1,076,882) 1,255,508 (1,408,635) 563,713 1,457,952 6,594,583 166,077 3,891,878
INCOME BEFORE INCOME TAX 9,869,823 13,060,622 4,953,693 7,020,991
PROVISION FOR INCOME TAX 125,148 613,040 (100,231) 281,272
NET INCOME P=9,744,675 P=12,447,582 P=5,053,924 P=6,739,719
Attributable to: Equity holders of the parent P=9,513,139 P=12,182,979 P=4,918,311 P=6,583,146 Non-controlling interests 231,536 264,603 135,613 156,573 P=9,744,675 P=12,447,582 P=5,053,924 P=6,739,719
EARNINGS PER COMMON SHARE Basic and diluted, income for the period
attributable to ordinary equity holders of the parent P=1.29 P=1.66 P=0.67 P=0.89
See Disclosure H for the computation of Earnings per Common Share,

ABOITIZ POWER CORPORATION AND SUBSIDIARIES CONSOLIDATED STATEMENTS OF COMPREHENSIVE INCOME (Amounts in Thousands) (Unaudited) JAN-JUN/13 JAN-JUN/12 APR-JUN/13 APR-JUN/12
NET INCOME ATTRIBUTABLE TO: Equity holders of the parent P=9,513,139 P=12,182,979 P=4,918,311 P=6,583,146 Non-controlling interests 231,536 264,603 135,613 156,573
9,744,675 12,447,582 5,053,924 6,739,719
OTHER COMPREHENSIVE INCOME (LOSS)
Movement in cumulative translation adjustments 102,893 (102,108) 101,911 (68,702) Share in movement in cumulative translation
adjustments of associates 79,607 24,561 26,867 69,229
Income tax effect on other comprehensive income – – – –
Total other comprehensive income (loss), net of tax 182,500 (77,547) 128,778 527 TOTAL COMPREHENSIVE INCOME P=9,927,175 P=12,370,035 P=5,182,702 P=6,740,246 Attributable to: Equity holders of the parent P=9,695,639 P=12,105,432 P=5,047,089 P=6,583,673 Non-controlling interests 231,536 264,603 135,613 156.573 P=9,927,175 P=12,370,035 P=5,182,702 P=6,740,246

ABOITIZ POWER CORPORATION AND SUBSIDIARIES CONSOLIDATED STATEMENTS OF CHANGES IN EQUITY FOR THE PERIODS ENDED JUNE 30, 2013 AND DECEMBER 31, 2012, AND JUNE 30, 2012 (Amounts in Thousands, Except Dividends Per Share Amounts) (Unaudited) Attributable to Equity Holders of the Parent
Capital
Stock Additional
Paid-in-Capital
Share in Unrealized Gain on AFS of
Associates
Cumulative Translation
Adjustments
Share in Cumulative Translation
Adjustments of Associates
Net Unrealized Actuarial Gains
(Losses)
Share in Net Unrealized
Actuarial Gains (Losses) of Associates
Acquisition of Non-controlling
Interests Retained Earnings
Non-controlling Interests Total
Balances at January 1, 2013 as previously stated P=7,358,604 P=12,588,894 P=85,296 (P=169,845) (P=847,589) P=– P=– (P=259,147) P=62,475,256 P=1,577,207 P=82,808,676
Effects of adoption of new accounting standard (PAS 19) – – – – –
(307,000)
(73,792) – 45,515 28,463 (306,814) Balances at January 1, 2013 as restated 7,358,604 12,588,894 85,296 (169,845) (847,589) (307,000) (73,792) (259,147) 62,520,771 1,605,670 82,501,862 Net income for the year – – – – – – – – 9,513,139 231,536 9,744,675 Other comprehensive income (loss) – – – 102,893 79,607 – – – – – 182,500 Total comprehensive income (loss) – – – 102,893 79,607 – – – 9,513,139 231,536 9,927,175 Cash dividends – P=1.66 a share – – – – – – – – (12,215,283) – (12,215,283) Cash dividends paid to non-controlling interests – – – – – – – – – (177,023) (177,023) Balances at June 30, 2013 P=7,358,604 P=12,588,894 P=85,296 (P=66,952) (P=767,982) (P=307,000) (P=73,792) (P=259,147) P=59,818,627 P=1,660,183 P=80,036,731
Balances at January 1, 2012 as previously stated P=7,358,604 P=12,588,894 P=73,952 (P=57,668) (P=546,753) P=– P=– (P=259,147) P=49,400,692 P=1,633,643 P=70,192,217 Effects of adoption of new accounting standard (PAS 19) – – – – – (277,530) (74,316) – 20,445 37,460 (293,941) Balances at January 1, 2012 as restated 7,358,604 12,588,894 73,952 (57,668) (546,753) (277,530) (74,316) (259,147) 49,421,137 1,671,103 (69,898,276) Net income as restated – – – – – – – – 24,431,885 490,135 24,922,020 Other comprehensive income (loss) – – 11,344 (112,177) (300,836) (29,470) 524 – – – (430,615) Total comprehensive income (loss) – – 11,344 (112,177) (300,836) (29,470) 524 – 24,431,885 490,135 24,491,405

Attributable to Equity Holders of the Parent
Capital
Stock Additional
Paid-in-Capital
Share in Unrealized Gain on AFS of
Associates
Cumulative Translation
Adjustments
Share in Cumulative Translation
Adjustments of Associates
Net Unrealized Actuarial Gains
(Losses)
Share in Net Unrealized
Actuarial Gains (Losses) of Associates
Acquisition of Non-controlling
Interests Retained Earnings
Non-controlling Interests Total
Cash dividends – P=1.54 a share – – – – – – – – (11,332,251) – (11,332,251) Cash dividends paid to non-controlling interests – – – – – – – – – (431,308) (431,308) Change in non-controlling interests – – – – – – – – – (124,260) (124,260) Balances at December 31, 2012 P=7,358,604 P=12,588,894 P=85,296 (P=169,845) (P=847,589) (P=307,000) (P=73,792) (P=259,147) P=62,520,771 P=1,605,670 P=82,501,862
Balances at January 1, 2012 as restated P=7,358,604 P=12,588,894 P=73,952 (P=57,668) (P=546,753) (P=277,530) (P=74,316) (P=259,147) P=49,421,137 P=1,671,103 (P=69,898,276) Net income as restated – – – – – – – – 12,182,979 264,603 12,447,582 Other comprehensive income (loss) – – – (102,108) 24,561 – – – – – (77,547) Total comprehensive income (loss) – – – (102,108) 24,561 – – – 12,182,979 264,603 12,370,035 Cash dividends – P=1.32 a share – – – – – – – – (9,713,358) – (9,713,358) Change in non-controlling interests – – – – – – – – – (10) (10) Balances at June 30, 2012 P=7,358,604 P=12,588,894 P=73,952 (P=159,776) (P=522,192) (P=277,530) (P=74,316) (P=259,147) P=51,890,758 P=1,935,696 P=72,554,943

ABOITIZ POWER CORPORATION AND SUBSIDIARIES CONSOLIDATED STATEMENTS OF CASH FLOWS (Amounts in Thousands) (Unaudited) JAN-JUN/13 JAN-JUN/12 APR-JUN/13 APR-JUN/12 CASH FLOWS FROM OPERATING ACTIVITIES Income before income tax P=9,869,823 P=13,060,622 P=4,953,693 P=7,020,991 Adjustments for:
Interest expense and other financing costs 3,067,930 3,709,066 1,641,706 1,877,530 Depreciation and amortization 1,749,858 1,616,599 895,857 797,865 Amortization of software 8,107 3,964 2,645 1,780 Unrealized fair valuation loss on derivatives (315) (736) (315) (994) Gain on sale of property, plant and equipment (7,878) (6,116) (2,663) (5,591) Gain on redemption of preferred shares – (27,087) – – Interest income (253,881) (392,177) (87,743) (221,021) Net unrealized foreign exchange losses (gains) 1,350,094 (1,008,248) 1,500,785 (505,810) Share in net earnings of associates (2,534,834) (5,339,075) (1,574,713) (3,328,164)
Operating income before working capital changes 13,248,904 11,616,812 7,329,252 5,636,586 Decrease (increase) in operating assets (646,229) 202,892 (175,828) (161,041) Increase in operating liabilities 487,548 2,017,094 1,201,349 2,062,499 Cash provided by operations 13,090,223 13,836,798 8,354,773 7,538,044 Income and final taxes paid (272,694) (382,031) (253,574) (299,859) Net cash flows from operating activities 12,817,529 13,454,767 8,101,199 7,238,185 CASH FLOWS FROM INVESTING ACTIVITIES Cash dividends received 1,808,925 4,222,679 1,178,918 3,585,454 Interest received 292,268 449,438 87,671 215,349 Proceeds from redemption of preferred shares – 318,509 – – Additions to property, plant and equipment (4,544,697) (2,994,885) (3,225,935) (2,151,608) Acquisitions of available for sale investments (200) – – – Additional investments in associates (428,865) (1,516) (428,865) (20) Net collection of (additional) advances to associates 374,891 2,331 374,891 1,064 Additions to intangible assets (41,108) (69,856) (1,867) (18,881) Decrease (increase) in other assets (220,062) (23,362) (647,532) (121,468) Net cash flows from (used in) investing activities (2,758,848) 1,903,338 (2,662,719) 1,509,890 CASH FLOWS FROM FINANCING ACTIVITIES Net proceeds (payment) of bank loans (203,372) (555,700) 80,650 (154,000) Net proceeds (payment) of long-term debt (8,290,326) (1,620,206) (175,617) (1,399,831) Payments of finance lease obligation (3,314,582) (546,085) (1,662,933) (272,625) Changes in non-controlling interests (177,023) – (131,399) – Payments to preferred shareholders of a subsidiary (31,070) (24,520) – (5,176) Decrease in derivative liabilities (48,349) (6,844) (42,489) 587 Interest paid (195,612) (805,548) (137,496) (356,739) Cash dividends paid (13,834,176) (9,713,358) (12,215,283) (9,713,358) Net cash flows used in financing activities (26,094,510) (13,272,261) (14,284,567) (11,901,142) NET INCREASE IN CASH AND CASH EQUIVALENTS (16,035,829) 2,085,844 (8,846,087) (3,153,067) EFFECT OF EXCHANGE RATE CHANGES ON CASH AND CASH EQUIVALENTS 13,928 (53,854) 23,168 2,821 CASH AND CASH EQUIVALENTS AT BEGINNING OF THE PERIOD 30,678,493 23,391,561 23,479,511 28,573,797 CASH AND CASH EQUIVALENTS AT END OF THE PERIOD P=14,656,592 P=25,423,551 P=14,656,592 P=25,423,551

- 8 - ABOITIZ POWER CORPORATION AND SUBSIDIARIES FINANCIAL STATEMENTS SCHEDULES AND DISCLOSURES (Amounts in Thousands, Except Share and Exchange Rate Data and When Otherwise Indicated) A Components of Other Comprehensive Income (Loss) JAN-JUN/13 JAN-JUN/12 Share in movement in cumulative translation adjustments of associates P=79,607 P=24,561 Movement in cumulative translation adjustments 102,893 (102,108) Other comprehensive income (loss) for the period – net of tax P=182,500 (P=77,547) B Tax Effects Relating to Each Component of Other Comprehensive Income (Loss) JAN-JUN/13 Before-Tax Tax (Expense) Net-of-Tax Amount Benefit Amount Share in movement in cumulative translation adjustments of associates P=79,607 - P=79,607 Movement in cumulative translation adjustments 102,893 - 102,893 Other comprehensive income for the period – net of tax P=182,500 - P=182,500
JAN-JUN/12
Before-Tax Tax (Expense) Net-of-Tax Amount Benefit Amount Share in movement in cumulative translation adjustments of associates P=24,561 - P=24,561 Movement in cumulative translation adjustments (102,108) - (102,108) Other comprehensive loss for the period – net of tax (P=77,547) - (P=77,547)

- 9 -
C Investments in and Advances to Associates
Restated % Ownership June 30, 2013 December 31, 2012 Acquisition cost:
Manila Oslo Renewable Enterprise, Inc. 83.33 P=9,290,416 P=9,290,416 STEAG State Power, Inc. 34.00 4,400,611 4,400,611 Cebu Energy Development Corp. 44.00 2,438,621 2,438,621 Hijos de F. Escano, Inc. 46.73 858,070 858,070 Visayan Electric Co., Inc. 55.25 665,181 662,456 AEV Aviation, Inc. 49.25 291,400 291,400 Pampanga Energy Ventures, Inc. 42.84 209,465 209,465 San Fernando Electric Light & Power Co., Inc. 43.78 180,864 180,864 East Asia Utilities Corporation 50.00 180,616 180,616 Western Mindanao Power Corporation 20.00 79,099 79,099 Southern Philippines Power Corporation 20.00 99,166 99,166 Redondo Peninsula Energy, Inc. 25.00 431,140 5,000 Others 86 4,623
Balance at end of period P=19,124,735 P=18,700,407 Accumulated equity in net earnings:
Balance at beginning of the year 7,109,428 9,397,547 Share in net earnings 2,534,834 9,938,709 Effect of redemption of preferred shares by an
associate – (16,501) Cash dividends received or receivable (1,808,925) (12,210,327) Balance at end of period 7,835,337 7,109,428
26,960,072 25,809,835 Share in net unrealized gains (losses) on available-for-sale
securities & underwriting accounts of an associate 85,296 85,296 Share in unrealized actuarial gains (losses) of associates (36,217) (36,217) Share in cumulative translation adjustments of associates (767,982) (847,589) Investments in associates at equity 26,241,169 25,011,325 Advances to associates - net 444,422 819,313 P=26,685,591 P=25,830,638
D Trade and Other Payables
June 30, 2013 Trade P=3,124,654 DOSRI – Others 5,463,403 P=8,588,057
E Bank Loans
Interest Rate Jun 30/13 Dec 31/12 Peso loans - financial institutions - unsecured 2.75% to 3.25% P=1,073,628 P=1,277,000

- 10 -
F Long-term Debts
Interest Rate Jun 30/13 Dec 31/12 Company
Financial and non-financial institutions - unsecured Fixed rate notes 6.17% – 5,000,000
HedcorSibulan, Inc.
Financial institutions - secured 8.52% – 3,043,895 Hedcor, Inc. Financial institution - secured 8.36% 387,600 419,900 Cebu Private Power Corporation
Financial institutions - secured 3.84% - 4.65% 106,619 213,334 Subic EnerzoneCorporation Financial institution – secured 5.61% - 6.06% 508,500 508,500 Luzon Hydro Corporation
Financial institution – secured 2.00% -3.51% 2,049,840 2,054,963 Total 3,052,559 11,240,592 Less deferred financing costs 14,876 64,643 3,037,683 11,175,949 Less current portion – net of deferred financing costs 465,319 3,582,308 P=2,572,364 P=7,593,641
G Debt Securities As of June 30, 2013, there are no outstanding debt securities issued by the Group.
H Earnings Per Common Share Earnings per common share amounts were computed as follows:
JAN-JUN/13 JAN-JUN/12 a. Net income attributable to equity holders
of the parent P=9,513,139 P=12,182,979 b. Weighted average number of common shares issued
and outstanding 7,358,604,307 7,358,604,307 c. Earnings per common share (a/b) P=1.29 P=1.66
There are no dilutive potential common shares as of June 30, 2013 and 2012.
I Business Segment Information
Operating segments are components of the Group that engage in business activities from which they may earn revenues and incur expenses, whose operating results are regularly reviewed by the Group’s Chief Operating Decision Maker (CODM) to make decisions about how resources are to be allocated to the segment and assess their performances, and for which discrete financial information is available. For purposes of management reporting, the Group’s operating businesses are organized and managed separately according to services provided, with each segment representing a strategic business segment. The Group identified operating segments, which are consistent with the segments reported to the Board of Directors (BOD), which is the Group’s CODM, are as follows:
- 11 -
• “Power Generation” segment, which is engaged in the generation and supply of power to various customers under power supply contracts and for trading in WESM;
• “Power Distribution” segment, which is engaged in the distribution and sale of electricity to the end-users; and
• “Parent Company and Others”, which includes the operations of the Company and electricity-related services of the Group such as installation of electrical equipment.
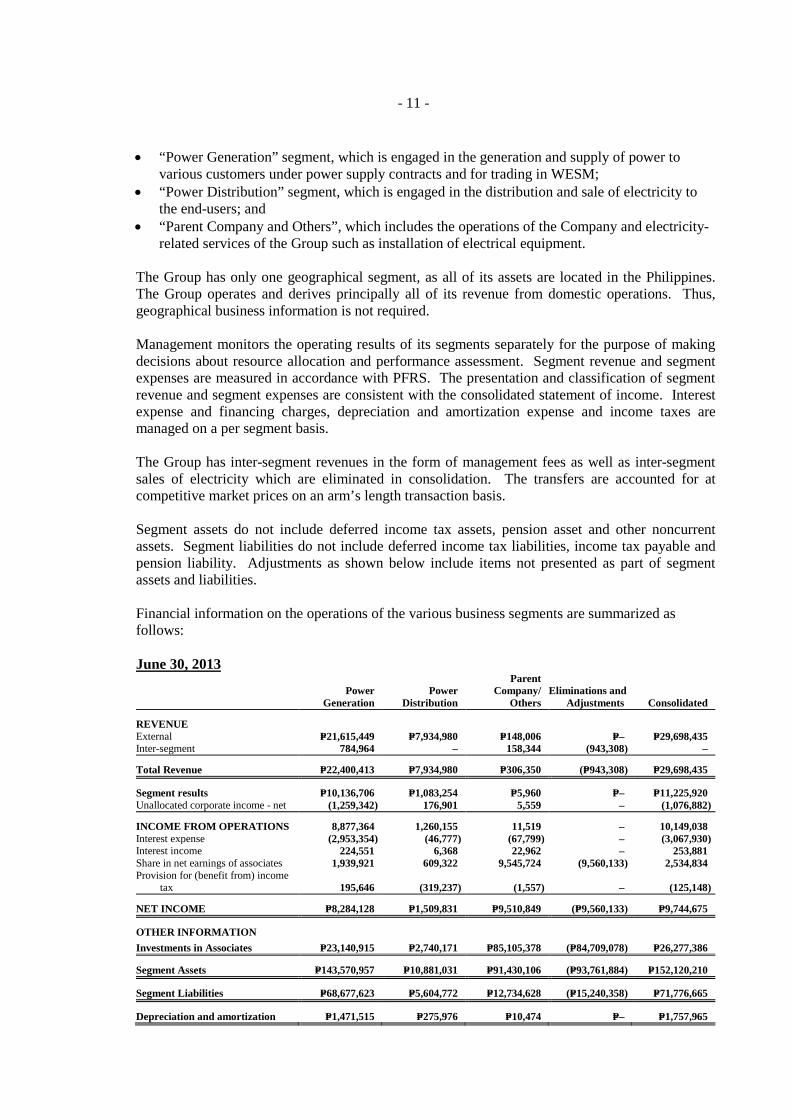
The Group has only one geographical segment, as all of its assets are located in the Philippines. The Group operates and derives principally all of its revenue from domestic operations. Thus, geographical business information is not required. Management monitors the operating results of its segments separately for the purpose of making decisions about resource allocation and performance assessment. Segment revenue and segment expenses are measured in accordance with PFRS. The presentation and classification of segment revenue and segment expenses are consistent with the consolidated statement of income. Interest expense and financing charges, depreciation and amortization expense and income taxes are managed on a per segment basis. The Group has inter-segment revenues in the form of management fees as well as inter-segment sales of electricity which are eliminated in consolidation. The transfers are accounted for at competitive market prices on an arm’s length transaction basis. Segment assets do not include deferred income tax assets, pension asset and other noncurrent assets. Segment liabilities do not include deferred income tax liabilities, income tax payable and pension liability. Adjustments as shown below include items not presented as part of segment assets and liabilities. Financial information on the operations of the various business segments are summarized as follows: June 30, 2013
Power
Generation Power
Distribution
Parent Company/
Others Eliminations and
Adjustments Consolidated
REVENUE External P=21,615,449 P=7,934,980 P=148,006 P=– P=29,698,435 Inter-segment 784,964 – 158,344 (943,308) –
Total Revenue P=22,400,413 P=7,934,980 P=306,350 (P=943,308) P=29,698,435
Segment results P=10,136,706 P=1,083,254 P=5,960 P=– P=11,225,920 Unallocated corporate income - net (1,259,342) 176,901 5,559 – (1,076,882)
INCOME FROM OPERATIONS 8,877,364 1,260,155 11,519 – 10,149,038 Interest expense (2,953,354) (46,777) (67,799) – (3,067,930) Interest income 224,551 6,368 22,962 – 253,881 Share in net earnings of associates 1,939,921 609,322 9,545,724 (9,560,133) 2,534,834 Provision for (benefit from) income tax 195,646 (319,237) (1,557) – (125,148)
NET INCOME P=8,284,128 P=1,509,831 P=9,510,849 (P=9,560,133) P=9,744,675
OTHER INFORMATION Investments in Associates P=23,140,915 P=2,740,171 P=85,105,378 (P=84,709,078) P=26,277,386
Segment Assets P=143,570,957 P=10,881,031 P=91,430,106 (P=93,761,884) P=152,120,210
Segment Liabilities P=68,677,623 P=5,604,772 P=12,734,628 (P=15,240,358) P=71,776,665
Depreciation and amortization P=1,471,515 P=275,976 P=10,474 P=– P=1,757,965

- 12 -
June 30, 2012
Power
Generation Power
Distribution
Parent Company/
Others Eliminations and
Adjustments Consolidated
REVENUE External P=23,193,137 P=7,962,258 P=113,193 P=– P=31,268,588 Inter-segment 684,237 – 164,720 (848,957) –
Total Revenue P=23,877,374 P=7,962,258 P=277,913 (P=848,957) P=31,268,588
Segment results P=8,594,035 P=1,162,041 P=26,853 (P=1) P=9,782,928 Unallocated corporate income (expenses) 1,071,826 187,460 (3,778) – 1,255,508
INCOME FROM OPERATIONS 9,665,861 1,349,501 23,075 (1) 11,038,436 Interest expense (3,108,708) (58,575) (541,783) – (3,709,066) Interest income 282,440 9,990 99,747 – 392,177 Share in net earnings of associates 5,007,108 342,180 12,594,414 (12,604,627) 5,339,075 Provision for income tax (267,621) (342,911) (2,508) – (613,040)
NET INCOME P=11,579,080 P=1,300,185 P=12,172,945 (P=12,604,628) P=12,447,582
OTHER INFORMATION Investments in Associates P=26,121,129 P=2,419,463 P=72,117,465 (P=71,704,434) P=28,953,623
Segment Assets P=137,395,695 P=9,826,547 P=81,423,752 (P=71,033,909) P=157,612,085
Segment Liabilities P=72,802,099 P=5,355,653 P=10,590,324 (P=3,984,875) P=84,763,201
Depreciation and amortization P=1,384,840 P=225,730 P=9,993 P=– P=1,620,563
J Financial Risk Management Objectives and Policies
The Group’s principal financial instruments comprise cash and cash equivalents and long-term debts. The main purpose of these financial instruments is to raise finances for the Group’s operations. The Group has various other financial instruments such as trade and other receivables, AFS investments, restricted cash, bank loans, trade and other payables, finance lease obligation, payable to preferred shareholder of a subsidiary, long-term obligation on power distribution system and customers’ deposits, which arise directly from its operations. The Group also enters into derivative transactions, particularly foreign currency forwards, to economically hedge its foreign currency risk from foreign currency denominated liabilities and purchases. Risk Management Structure The BOD is mainly responsible for the overall risk management approach and for the approval of risk strategies and principles of the Group. Financial risk committee The Financial Risk Committee has the overall responsibility for the development of risk strategies, principles, frameworks, policies and limits. It establishes a forum of discussion of the Group’s approach to risk issues in order to make relevant decisions. Treasury service group The Treasury Service Group is responsible for the comprehensive monitoring, evaluating and analyzing of the Group’s risks in line with the policies and limits.
- 13 -
The main risks arising from the Group’s financial instruments are interest rate risk resulting from movements in interest rates that may have an impact on outstanding long-term debt; credit risk involving possible exposure to counter-party default on its cash and cash equivalents, AFS investments and trade and other receivables; liquidity risk in terms of the proper matching of the type of financing required for specific investments; and foreign exchange risk in terms of foreign exchange fluctuations that may significantly affect its foreign currency denominated placements and borrowings. The main risks arising from the Group’s financial instruments are liquidity risk, interest rate risk, foreign exchange risk, and credit risk. The BOD reviews and agrees on policies for managing each of these risks and they are summarized below.
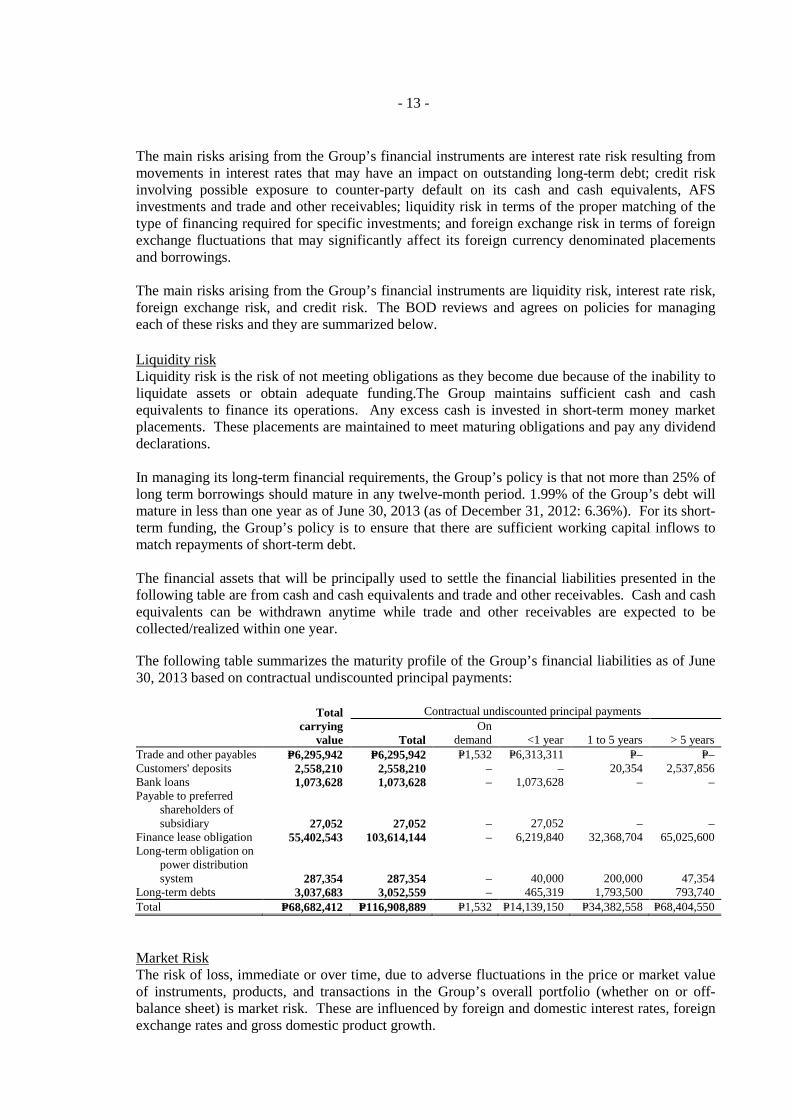
Liquidity risk Liquidity risk is the risk of not meeting obligations as they become due because of the inability to liquidate assets or obtain adequate funding.The Group maintains sufficient cash and cash equivalents to finance its operations. Any excess cash is invested in short-term money market placements. These placements are maintained to meet maturing obligations and pay any dividend declarations. In managing its long-term financial requirements, the Group’s policy is that not more than 25% of long term borrowings should mature in any twelve-month period. 1.99% of the Group’s debt will mature in less than one year as of June 30, 2013 (as of December 31, 2012: 6.36%). For its short-term funding, the Group’s policy is to ensure that there are sufficient working capital inflows to match repayments of short-term debt. The financial assets that will be principally used to settle the financial liabilities presented in the following table are from cash and cash equivalents and trade and other receivables. Cash and cash equivalents can be withdrawn anytime while trade and other receivables are expected to be collected/realized within one year. The following table summarizes the maturity profile of the Group’s financial liabilities as of June 30, 2013 based on contractual undiscounted principal payments:
Total carrying
value
Contractual undiscounted principal payments
Total On
demand <1 year 1 to 5 years > 5 years Trade and other payables P=6,295,942 P=6,295,942 P=1,532 P=6,313,311 P=– P=– Customers' deposits 2,558,210 2,558,210 – – 20,354 2,537,856 Bank loans 1,073,628 1,073,628 – 1,073,628 – – Payable to preferred
shareholders of subsidiary 27,052 27,052 – 27,052 – –
Finance lease obligation 55,402,543 103,614,144 – 6,219,840 32,368,704 65,025,600 Long-term obligation on
power distribution system 287,354 287,354 – 40,000 200,000 47,354
Long-term debts 3,037,683 3,052,559 – 465,319 1,793,500 793,740 Total P=68,682,412 P=116,908,889 P=1,532 P=14,139,150 P=34,382,558 P=68,404,550 Market Risk The risk of loss, immediate or over time, due to adverse fluctuations in the price or market value of instruments, products, and transactions in the Group’s overall portfolio (whether on or off-balance sheet) is market risk. These are influenced by foreign and domestic interest rates, foreign exchange rates and gross domestic product growth.

- 14 -
Interest rate risk The Group’s exposure to market risk for changes in interest rates relates primarily to its long-term debt obligations. To manage this risk, the Group determines the mix of its debt portfolio as a function of the level of current interest rates, the required tenor of the loan, and the general use of the proceeds of its various fund raising activities.As of June 30, 2013, 71% of the Group’s long-term debt had floating interest rates ranging from 2.00% to 4.65%, and 29% have fixed rates ranging from 5.61% to 8.36%. As of December 31, 2012, 20% of the Group’s long-term debt had floating interest rates ranging from 2.00% to 4.65%, and 80% have fixed rates ranging from 5.61% to 8.52%. The following tables set out the carrying amounts, by maturity, of the Group’s financial instruments that are exposed to interest rate risk: As of June 30, 2013
<1 year 1-5 years >5 years Total Floating rate - long-term debt P=344,219 P=1,173,124 P=624,240 P=2,141,583 Floating rate - payable to preferred
shareholdersof subsidiaries 23,303 3,749 – 27,052 P=367,522 P=1,176,873 P=624,240 P=2,168,635
As of December 31, 2012
<1 year 1-5 years >5 years Total Floating rate - long-term debt P=435,035 P=805,766 P=1,011,062 P=2,251,863 Floating rate - payable to preferred
shareholders of subsidiaries 20,705 25,363 – 46,068 P=455,740 P=831,129 P=1,011,062 P=2,297,931
Interest on financial instruments classified as floating rate is repriced at intervals of less than one year. Interest on financial instruments classified as fixed rate is fixed until the maturity of the instrument. The other financial instruments of the Group that are not included in the above tables are noninterest-bearing and are therefore not subject to interest rate risk. The Group’s derivative asset and liabilities are subject to fair value interest rate risk. The following table demonstrates the sensitivity to a reasonably possible change in interest rates, with all other variables held constant, of the Group’s income before tax (through the impact on floating rate borrowings).
Increase (decrease) in basis points
Effect on income before tax
June 30, 2013 200 (P=42,832) (100) 21,416 December 31, 2012 200 (45,037) (100) 22,519
There is no other impact on the Group’s equity other than those already affecting the consolidated statements of income.
- 15 -
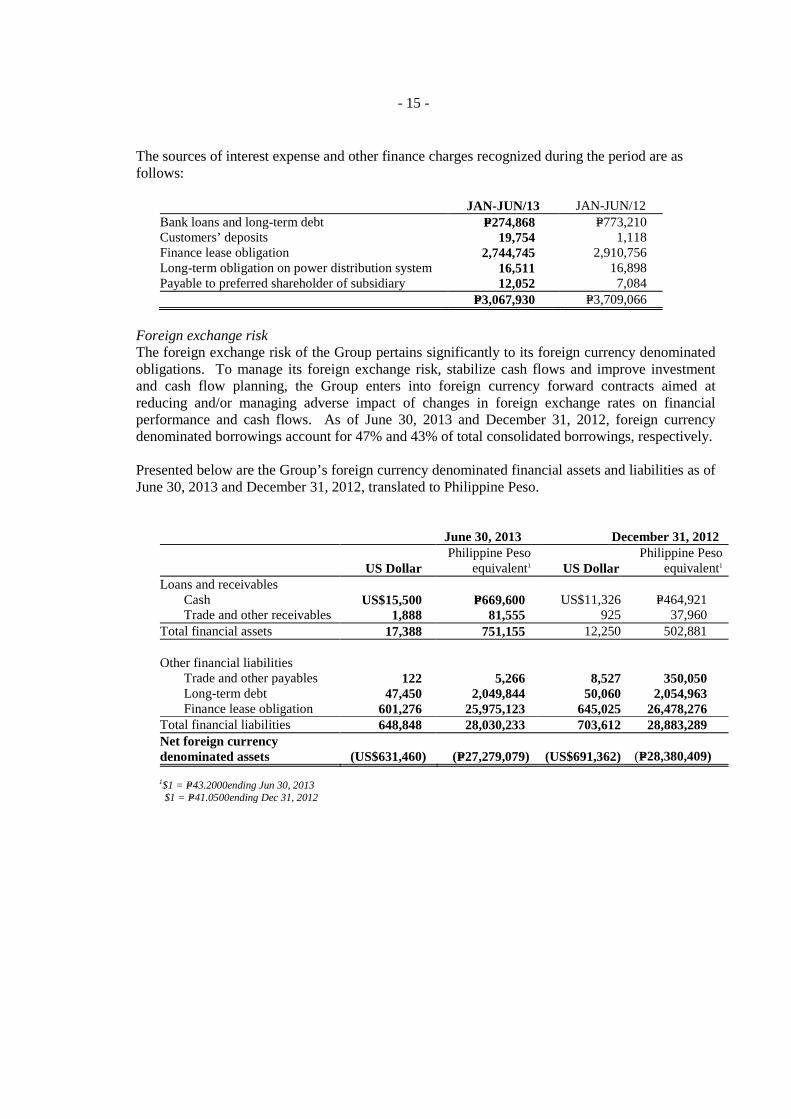
The sources of interest expense and other finance charges recognized during the period are as follows:
JAN-JUN/13 JAN-JUN/12 Bank loans and long-term debt P=274,868 P=773,210 Customers’ deposits 19,754 1,118 Finance lease obligation 2,744,745 2,910,756 Long-term obligation on power distribution system 16,511 16,898 Payable to preferred shareholder of subsidiary 12,052 7,084 P=3,067,930 P=3,709,066
Foreign exchange risk The foreign exchange risk of the Group pertains significantly to its foreign currency denominated obligations. To manage its foreign exchange risk, stabilize cash flows and improve investment and cash flow planning, the Group enters into foreign currency forward contracts aimed at reducing and/or managing adverse impact of changes in foreign exchange rates on financial performance and cash flows. As of June 30, 2013 and December 31, 2012, foreign currency denominated borrowings account for 47% and 43% of total consolidated borrowings, respectively. Presented below are the Group’s foreign currency denominated financial assets and liabilities as of June 30, 2013 and December 31, 2012, translated to Philippine Peso.
June 30, 2013 December 31, 2012
US Dollar Philippine Peso
equivalent1 US Dollar Philippine Peso
equivalent1 Loans and receivables
Cash US$15,500 P=669,600 US$11,326 P=464,921 Trade and other receivables 1,888 81,555 925 37,960 Total financial assets 17,388 751,155 12,250 502,881 Other financial liabilities
Trade and other payables 122 5,266 8,527 350,050 Long-term debt 47,450 2,049,844 50,060 2,054,963 Finance lease obligation 601,276 25,975,123 645,025 26,478,276
Total financial liabilities 648,848 28,030,233 703,612 28,883,289 Net foreign currency denominated assets (US$631,460) (P=27,279,079) (US$691,362) (P=28,380,409)
1$1 = P=43.2000ending Jun 30, 2013
$1 = P=41.0500ending Dec 31, 2012

- 16 -
The following table demonstrates the sensitivity to a reasonably possible change in the US dollar exchange rates, with all other variables held constant, of the Group’s income before tax as of June 30, 2013 and December 31, 2012.
Increase/ (decrease) in US
Dollar Effect on income
before tax June 30, 2013
US dollar denominated accounts US Dollar strengthens by 5% (P=1,363,954) US dollar denominated accounts US Dollar weakens by 5% 1,363,954
December 31, 2012
US dollar denominated accounts US Dollar strengthens by 5% (P=1,419,020) US dollar denominated accounts US Dollar weakens by 5% 1,419,020
The increase in US Dollar rate represents the depreciation of the Philippine Peso while the decrease in US Dollar rate represents appreciation of the Philippine Peso. There is no other impact on the Group’s equity other than those already affecting the consolidated statements of income. Credit risk For its cash investments, AFS investments and receivables, the Group’s credit risk pertains to possible default by the counterparty, with a maximum exposure equal to the carrying amount of these investments. With respect to cash investments and AFS investments, the risk is mitigated by the short-term and/or liquid nature of its cash investments mainly in bank deposits and placements, which are placed with financial institutions and entities of high credit standing. With respect to receivables, credit risk is controlled by the application of credit approval, limit and monitoring procedures. It is the Group’s policy to only enter into transactions with credit-worthy parties to mitigate any significant concentration of credit risk. The Group ensures that sales are made to customers with appropriate credit history and it has internal mechanisms to monitor the granting of credit and management of credit exposures. Concentration Risk Credit risk concentration of the Group’s receivables according to the customer category as of June 30, 2013 and December 31, 2012 is summarized in the following table:
June 30, 2013 December 31, 2012 Power distribution Residential P=368,619 P=345,155 Commercial 139,884 118,114 Industrial 530,646 488,937 City street lighting 13,914 10,903 Power generation Spot market 1,107,552 978,530 Power supply contracts 6,564,335 5,771,265 P=8,724,950 P=7,712,904
Capital management Capital includes equity attributable to the equity holders of the parent. The primary objective of the Group’s capital management is to ensure that it maintains a strong credit rating and healthy capital ratios in order to support its business and maximize shareholder value.
- 17 -
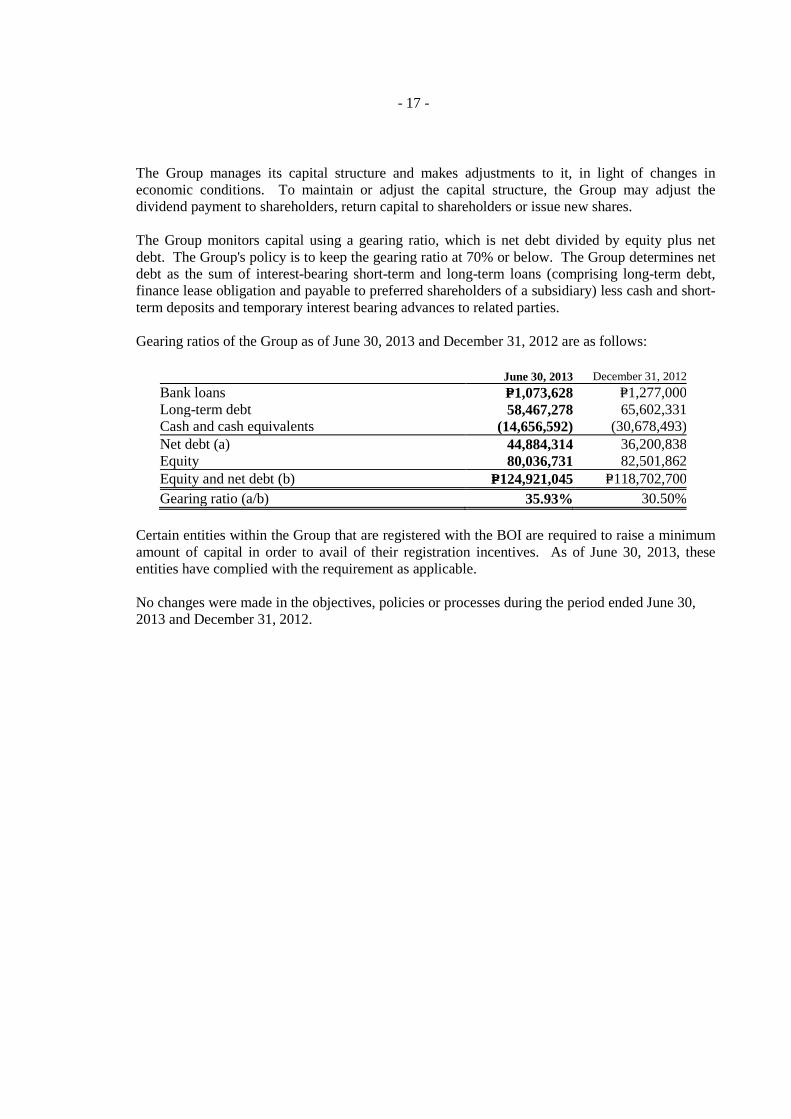
The Group manages its capital structure and makes adjustments to it, in light of changes in economic conditions. To maintain or adjust the capital structure, the Group may adjust the dividend payment to shareholders, return capital to shareholders or issue new shares.
The Group monitors capital using a gearing ratio, which is net debt divided by equity plus net debt. The Group's policy is to keep the gearing ratio at 70% or below. The Group determines net debt as the sum of interest-bearing short-term and long-term loans (comprising long-term debt, finance lease obligation and payable to preferred shareholders of a subsidiary) less cash and short-term deposits and temporary interest bearing advances to related parties. Gearing ratios of the Group as of June 30, 2013 and December 31, 2012 are as follows:
June 30, 2013 December 31, 2012 Bank loans P=1,073,628 P=1,277,000 Long-term debt 58,467,278 65,602,331 Cash and cash equivalents (14,656,592) (30,678,493) Net debt (a) 44,884,314 36,200,838 Equity 80,036,731 82,501,862 Equity and net debt (b) P=124,921,045 P=118,702,700 Gearing ratio (a/b) 35.93% 30.50%
Certain entities within the Group that are registered with the BOI are required to raise a minimum amount of capital in order to avail of their registration incentives. As of June 30, 2013, these entities have complied with the requirement as applicable. No changes were made in the objectives, policies or processes during the period ended June 30, 2013 and December 31, 2012.
- 18 -
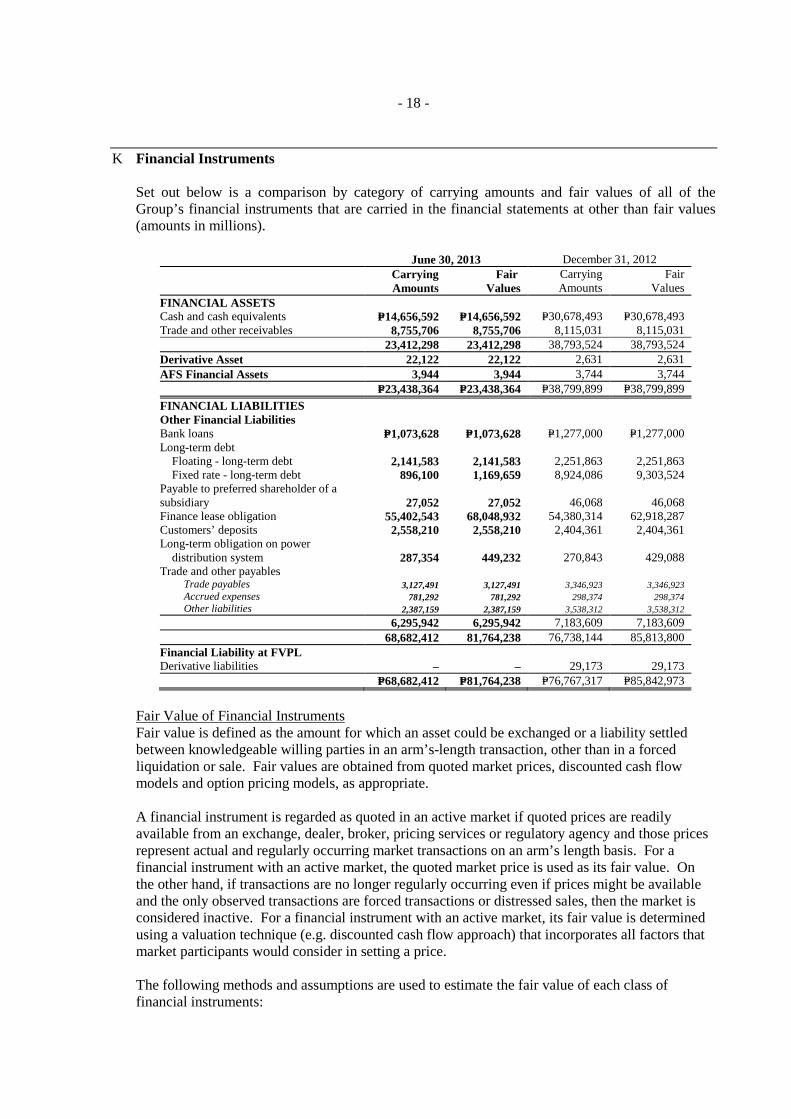
K Financial Instruments
Set out below is a comparison by category of carrying amounts and fair values of all of the Group’s financial instruments that are carried in the financial statements at other than fair values (amounts in millions).
June 30, 2013 December 31, 2012
Carrying Amounts
Fair Values
Carrying Amounts
Fair Values
FINANCIAL ASSETS Cash and cash equivalents P=14,656,592 P=14,656,592 P=30,678,493 P=30,678,493 Trade and other receivables 8,755,706 8,755,706 8,115,031 8,115,031 23,412,298 23,412,298 38,793,524 38,793,524 Derivative Asset 22,122 22,122 2,631 2,631 AFS Financial Assets 3,944 3,944 3,744 3,744 P=23,438,364 P=23,438,364 P=38,799,899 P=38,799,899 FINANCIAL LIABILITIES Other Financial Liabilities Bank loans P=1,073,628 P=1,073,628 P=1,277,000 P=1,277,000 Long-term debt
Floating - long-term debt 2,141,583 2,141,583 2,251,863 2,251,863 Fixed rate - long-term debt 896,100 1,169,659 8,924,086 9,303,524
Payable to preferred shareholder of a subsidiary 27,052 27,052 46,068 46,068 Finance lease obligation 55,402,543 68,048,932 54,380,314 62,918,287 Customers’ deposits 2,558,210 2,558,210 2,404,361 2,404,361 Long-term obligation on power
distribution system 287,354 449,232 270,843 429,088 Trade and other payables
Trade payables 3,127,491 3,127,491 3,346,923 3,346,923 Accrued expenses 781,292 781,292 298,374 298,374 Other liabilities 2,387,159 2,387,159 3,538,312 3,538,312
6,295,942 6,295,942 7,183,609 7,183,609 68,682,412 81,764,238 76,738,144 85,813,800 Financial Liability at FVPL Derivative liabilities – – 29,173 29,173 P=68,682,412 P=81,764,238 P=76,767,317 P=85,842,973
Fair Value of Financial Instruments Fair value is defined as the amount for which an asset could be exchanged or a liability settled between knowledgeable willing parties in an arm’s-length transaction, other than in a forced liquidation or sale. Fair values are obtained from quoted market prices, discounted cash flow models and option pricing models, as appropriate. A financial instrument is regarded as quoted in an active market if quoted prices are readily available from an exchange, dealer, broker, pricing services or regulatory agency and those prices represent actual and regularly occurring market transactions on an arm’s length basis. For a financial instrument with an active market, the quoted market price is used as its fair value. On the other hand, if transactions are no longer regularly occurring even if prices might be available and the only observed transactions are forced transactions or distressed sales, then the market is considered inactive. For a financial instrument with an active market, its fair value is determined using a valuation technique (e.g. discounted cash flow approach) that incorporates all factors that market participants would consider in setting a price. The following methods and assumptions are used to estimate the fair value of each class of financial instruments:

- 19 -
Cash and cash equivalents, trade and other receivables, bank loans and trade and other payables.The carrying amounts of cash and cash equivalents, trade and other receivables and trade and other payables approximate fair value due to the relatively short-term maturity of these financial instruments. Derivative asset and liabilities.The fair value is calculated by reference to prevailing interest rate differential and spot exchange rate as of valuation date, taking into account its remaining term to maturity. Fixed-rate borrowings. The fair value of fixed rate interest bearing loans is based on the discounted value of future cash flows using the applicable rates for similar types of loans. Floating-rate borrowings.Since repricing of the variable-rate interest bearing loan is done on a quarterly basis, the carrying value approximates the fair value. Finance lease obligation. The fair value of the finance lease obligation was calculated by discounting future cash flows using applicable interest rates. Long-term obligation on PDS.The fair value of the long-term obligations on power distribution system is calculated by discounting expected future cash flows at prevailing market rates. Customers’ deposits.The fair value of bill deposits approximates the carrying values as these deposits earn interest at the prevailing market interest rate in accordance with regulatory guidelines. The timing and related amounts of future cash flows relating to transformer and lines and poles deposits cannot be reasonably and reliably estimated for purposes of establishing their fair values using an alternative valuation technique. AFS investments.These are carried at cost less impairment because fair value cannot be determined reliably due to the unpredictable nature of cash flows and lack of suitable methods of arriving at reliable fair value. Fair Value Hierarchy The Company uses the following hierarchy for determining and disclosing the fair value of financial instruments by valuation technique: Level 1: quoted (unadjusted) prices in active markets for identical assets or liabilities Level 2: other techniques for which all inputs which have a significant effect on the recorded fair
value are observable, either directly or indirectly Level 3: techniques which use inputs which have a significant effect on the recorded fair value that
are not based on observable market data. Only the Group’s quoted AFS investments and derivative instruments, which are classified under Level 1 and Level 2, are measured and carried at fair value. During the reporting period ending March 31, 2012, there were no transfers between Level 1 and Level 2 fair value measurements, and no transfers into and out of Level 3 fair value measurements.
L Disclosures
1. Basis of Preparation, Statement of Compliance and Changes in Accounting Policies
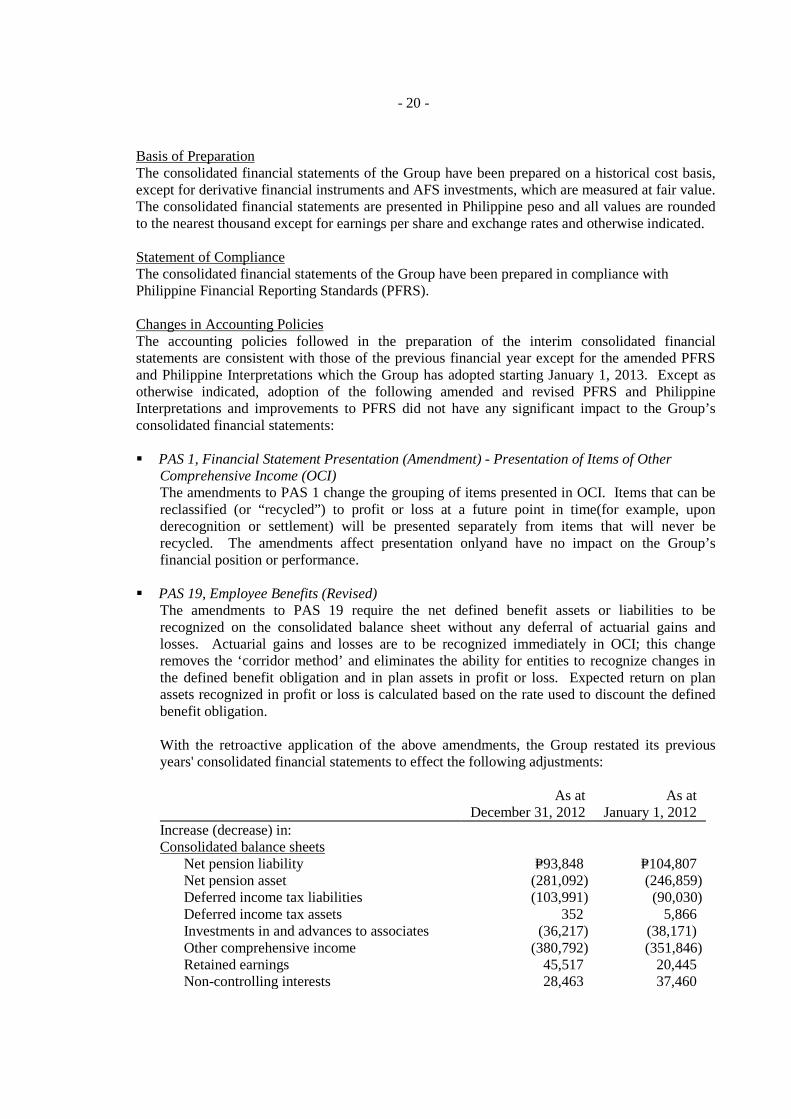
- 20 -
Basis of Preparation The consolidated financial statements of the Group have been prepared on a historical cost basis, except for derivative financial instruments and AFS investments, which are measured at fair value. The consolidated financial statements are presented in Philippine peso and all values are rounded to the nearest thousand except for earnings per share and exchange rates and otherwise indicated. Statement of Compliance The consolidated financial statements of the Group have been prepared in compliance with Philippine Financial Reporting Standards (PFRS). Changes in Accounting Policies The accounting policies followed in the preparation of the interim consolidated financial statements are consistent with those of the previous financial year except for the amended PFRS and Philippine Interpretations which the Group has adopted starting January 1, 2013. Except as otherwise indicated, adoption of the following amended and revised PFRS and Philippine Interpretations and improvements to PFRS did not have any significant impact to the Group’s consolidated financial statements: PAS 1, Financial Statement Presentation (Amendment) - Presentation of Items of Other
Comprehensive Income (OCI) The amendments to PAS 1 change the grouping of items presented in OCI. Items that can be reclassified (or “recycled”) to profit or loss at a future point in time(for example, upon derecognition or settlement) will be presented separately from items that will never be recycled. The amendments affect presentation onlyand have no impact on the Group’s financial position or performance.
PAS 19, Employee Benefits (Revised) The amendments to PAS 19 require the net defined benefit assets or liabilities to be recognized on the consolidated balance sheet without any deferral of actuarial gains and losses. Actuarial gains and losses are to be recognized immediately in OCI; this change removes the ‘corridor method’ and eliminates the ability for entities to recognize changes in the defined benefit obligation and in plan assets in profit or loss. Expected return on plan assets recognized in profit or loss is calculated based on the rate used to discount the defined benefit obligation. With the retroactive application of the above amendments, the Group restated its previous years' consolidated financial statements to effect the following adjustments:
As at
December 31, 2012 As at
January 1, 2012 Increase (decrease) in: Consolidated balance sheets Net pension liability P=93,848 P=104,807 Net pension asset (281,092) (246,859) Deferred income tax liabilities (103,991) (90,030) Deferred income tax assets 352 5,866 Investments in and advances to associates (36,217) (38,171) Other comprehensive income (380,792) (351,846) Retained earnings 45,517 20,445 Non-controlling interests 28,463 37,460

- 21 -
The consolidated statements of income and of comprehensive income for the period ended March 31, 2012 are not restated since 2012 remeasurements of defined benefit obligation and plan assets would have been done at year end 2012, and the impact to interim profit or loss resulting from the revised computation of net benefit expense or income is immaterial.
PAS 27, Separate Financial Statements (as revised in 2011) As a consequence of the new PFRS 10, Consolidated Financial Statement and PFRS 12, Disclosure of Interests in Other Entities, what remains of PAS 27 is limited to accounting for subsidiaries, jointly controlled entities, and associates in separate parent company financial statements.
PAS 28, Investments in Associates and Joint Ventures (as revised in 2011) As a consequence of the new PFRS 11, Joint Arrangements and PFRS 12, PAS 28 has been renamed PAS 28, Investments in Associates and Joint Ventures, and describes the application of the equity method to investments in joint ventures in addition to associates.
PFRS 7, Financial Instruments: Disclosures - Offsetting Financial Assets and Financial Liabilities These amendments require an entity to disclose information about rights of set-off and related arrangements (such as collateral agreements). The new disclosures are required for all recognized financial instruments that are set off in accordance with PAS 32. These disclosures also apply to recognized financial instruments that are subject to an enforceable master netting arrangement or ‘similar agreement’, irrespective of whether they are set-off in accordance with PAS 32. The amendments affect disclosures only and have no impact on the Group’s financial position or performance.
PFRS 10, Consolidated Financial Statements PFRS 10 replaces the portion of PAS 27 that addresses the accounting for consolidated financial statements. It also includes the issues raised in SIC-12, Consolidation - Special Purpose Entities. PFRS 10 establishes a single control model that applies to all entities including special purpose entities. The changes introduced by PFRS 10 will require management to exercise significant judgment to determine which entities are controlled, and therefore, are required to be consolidated by a parent, compared with the requirements that were in PAS 27.
PFRS 11, Joint Arrangements PFRS 11 replaces PAS 31, Interests in Joint Ventures and SIC-13, Jointly-controlled Entities - Non-monetary Contributions by Venturers. PFRS 11 removes the option to account for jointly controlled entities (JCEs) using proportionate consolidation. Instead, JCEs that meet the definition of a joint venture must be accounted for using the equity method.
PFRS 12, Disclosure of Interests with Other Entities As a consequence of the new PFRS 11, Joint Arrangements and PFRS 12, PAS 28 has been renamed PAS 28, Investments in Associates and Joint Ventures, and describes the application of the equity method to investments in joint ventures in addition to associates.
PFRS 13, Fair Value Measurement PFRS 13 establishes a single source of guidance under PFRSs for all fair value measurements. PFRS 13 does not change when an entity is required to use fair value, but rather provides guidance on how to measure fair value under PFRS when fair value is required or permitted. This standard is applied prospectively as of the beginning of the annual period in which it is

- 22 -
initially applied. Its disclosure requirements need not be applied in comparative information provided for periods before initial application of PFRS 13. New Accounting Standards and Amendments to Existing Standards Effective Subsequent to March 31, 2013
PAS 32, Financial Instruments: Presentation - Offsetting Financial Assets and Financial Liabilities (Amendments) The amendments clarify the meaning of “currently has a legally enforceable right to set-off” and also clarify the application of PAS 32 offsetting criteria to settlement systems (such as central clearing house systems) which apply gross settlement mechanisms that are not simultaneous. The amendments affect presentation only and have no impact on the Group’s financial position or performance. The amendments to PAS 32 are to be retrospectively applied for annual periods beginning on or after January 1, 2014.
PFRS 9, Financial Instruments PFRS 9, as issued, reflects the first phase on the replacement of PAS 39 and applies to the classification and measurement of financial assets and liabilities as defined in PAS 39, Financial Instruments: Recognition and Measurement. Work on impairment of financial instruments and hedge accounting is still ongoing, with a view to replacing PAS 39 in its entirety. PFRS 9 requires all financial assets to be measured at fair value at initial recognition. A debt financial asset may, if the fair value option (FVO) is not invoked, be subsequently measured at amortized cost if it is held within a business model that has the objective to hold the assets to collect the contractual cash flows and its contractual terms give rise, on specified dates, to cash flows that are solely payments of principal and interest on the principal outstanding. All other debt instruments are subsequently measured at fair value through profit or loss. All equity financial assets are measured at fair value either through OCI or profit or loss. Equity financial assets held for trading must be measured at fair value through profit or loss. For FVO liabilities, the amount of change in the fair value of a liability that is attributable to changes in credit risk must be presented in OCI. The remainder of the change in fair value is presented in profit or loss, unless presentation of the fair value change in respect of the liability’s credit risk in OCI would create or enlarge an accounting mismatch in profit or loss. All other PAS 39 classification and measurement requirements for financial liabilities have been carried forward into PFRS 9, including the embedded derivative separation rules and the criteria for using the FVO. The adoption of the first phase of PFRS 9 will have an effect on the classification and measurement of the Group’s financial assets, but will potentially have no impact on the classification and measurement of financial liabilities. After evaluating the impact of PFRS 9 and considering that it will not have any significant effect on the Group's operating results or financial condition, management has decided not to early adopt the said standard. It will be implemented only when it becomes effective on January 1, 2015. Thus, the interim consolidated financial statements do not reflect the impact of the said standard.
2. Seasonality of Interim Operations Operations of hydropower plants are generally affected by climatic seasonality. Seasonality and location have a direct effect on the level of precipitation. In Luzon where rainy and summer seasons are more pronounced, higher rainfall is normally experienced in the months of June to September. As such, the hydropower plants located in Luzon operate at their maximum capacity during this period. In contrast, the hydropower plants in Mindanao experience a well-distributed rainfall throughout the year, with a slightly better precipitation during the months of December to

- 23 -
April. This precipitation seasonality greatly affects subsidiary companies HI, HSI and LHC, which operate ‘run-of-river’ hydropower plants since these plants do not have any means to impound water. Any unexpected change in the seasonal aspects will have no material effect on the Group's financial condition or results of operations. 3. Material Events and Changes
a) Dividend declaration On March 5, 2013, the BOD approved the declaration of cash dividends of P=1.66 a share (P=12.22 billion) to all stockholders of record as of March 19, 2013. These dividends were paid on April 15, 2013. Except for the above developments and as disclosed in some other portions of this report, no other significant event occurred that would have a material impact on the registrant and its subsidiaries, and no other known trend, event or uncertainty came about that had or were reasonably expected to have a material favorable or unfavorable impact on revenues or income from continuing operations, since the end of the most recently completed fiscal year. There were also no significant elements of income or loss that did not arise from the continuing operations of the registrant and its subsidiaries. Other than those disclosed above, no material off-balance sheet transactions, arrangements, obligations (including contingent obligations), and other relationships with unconsolidated entities or other persons entities or other persons were created during the interim period. There were also no events that would trigger substantial direct or contingent financial obligations or cause any default or acceleration of an existing obligation. Likewise, there were no other material changes made in such items as: accounting principles & practices, estimates inherent in the preparation of financial statements, status of long-term contracts, changes in the composition of the issuer, and reporting entity resulting from business combinations or dispositions. Lastly, there were no changes in estimates of amounts reported in prior interim period and financial year that would have a material effect in the current interim period. 4. Material Adjustments
There were no material, non-recurring adjustments made during period that would require appropriate disclosures. All other adjustments are of a normal recurring nature.
5. Contingencies There are legal cases filed against certain subsidiaries in the normal course of business. Management and its legal counsel believe that the subsidiaries have substantial legal and factual bases for their position and are of the opinion that losses arising from these cases, if any, will not have a material adverse impact on the consolidated financial statements.

- 24 -
M. Schedule of Relevant Financial Ratios Restated FORMULA JUN 2013 DEC 2012
LIQUIDITY RATIOS
Current ratioi Current assetsCurrent liabilities
2.39 2.65
Acid test ratio Cash + Marketable securities
+ Accounts receivable+ Other liquid assets
Current liabilities
2.11 2.45
SOLVENCY RATIOS
Debt to equity ratio Total liabilites
Total equity 0.90 0.98
Asset to equity ratio Total AssetsTotal Equity
1.90 1.98
Net debt to equity ratio Debt - Cash & cash equivalents
Total Equity 0.56 0.44
Gearing ratio Debt - Cash & cash equivalents
Total Equity+ (Debt - Cash & cash equivalents)
35.93% 30.50%
Interest coverage ratio EBIT
Interest expense n.a. 5.33
PROFITABILITY RATIOS
Operating margin Operating profitTotal revenues
n.a. 32.92%
Return on equity Net income after tax
Total equity n.a. 39.87%
Ratio marked * is deemed not applicable (n.a.) for the interim reporting period since this would not be comparable to the ratio reported in the previous period.
iThe Company filed SEC Form 17-C last August 2, 2013 which disclosed the Company’s Results of Operations for period ended June 30, 2013. Under the Financial Condition portion of the SEC Form 17-C, the current ratio was reported at 2.6x. An advance to a contractor amounting to P2.24 bn was initially classified as a current asset. Upon further review of the transaction, the Company reclassified the advance from current to non-current asset. This adjusted the current ratio from 2.59x to 2.39x.
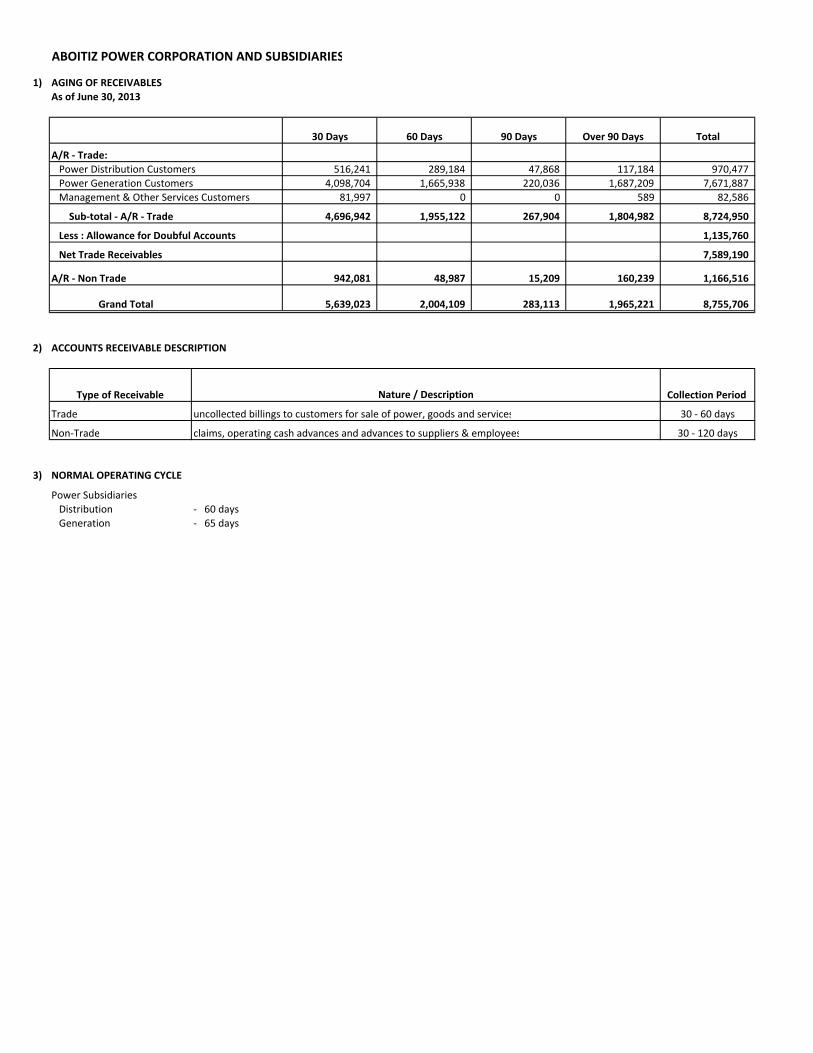
1) AGING OF RECEIVABLES
As of June 30, 2013
30 Days 60 Days 90 Days Over 90 Days Total
A/R - Trade:
Power Distribution Customers 516,241 289,184 47,868 117,184 970,477
Power Generation Customers 4,098,704 1,665,938 220,036 1,687,209 7,671,887
Management & Other Services Customers 81,997 0 0 589 82,586
Sub-total - A/R - Trade 4,696,942 1,955,122 267,904 1,804,982 8,724,950
Less : Allowance for Doubful Accounts 1,135,760
Net Trade Receivables 7,589,190
A/R - Non Trade 942,081 48,987 15,209 160,239 1,166,516
Grand Total 5,639,023 2,004,109 283,113 1,965,221 8,755,706
2) ACCOUNTS RECEIVABLE DESCRIPTION
Type of Receivable Collection Period
Trade uncollected billings to customers for sale of power, goods and services 30 - 60 days
Non-Trade claims, operating cash advances and advances to suppliers & employees 30 - 120 days
3) NORMAL OPERATING CYCLE
Power Subsidiaries
Distribution - 60 days
Generation - 65 days
ABOITIZ POWER CORPORATION AND SUBSIDIARIES
Nature / Description