cover photos: natural and planted forest (veracel/n. souza ... · transport-related emissions 62...
TRANSCRIPT

Cover photos:Natural and planted forest (Veracel/N. Souza); paper industry (Bahia Specialty Cellulose)

food and agriculture organization of the united nationsRome, 2010
FAO FORESTRY
PAPER
159
reid MinerVice President – Sustainable ManufacturingNational Council for Air and Stream Improvement (NCASI)Research Triangle Park, North Carolina, United States of America
Impact of the global forest industry on atmospheric greenhouse gases

The designations employed and the presentation of material in this information product do not imply the expression of any opinion whatsoever on the part of the Food and Agriculture Organization of the United Nations (FAO) concerning the legal or development status of any country, territory, city or area or of its authorities, or concerning the delimitation of its frontiers or boundaries. The mention of specific companies or products of manufacturers, whether or not these have been patented, does not imply that these have been endorsed or recommended by FAO in preference to others of a similar nature that are not mentioned.
The views expressed in this information product are those of the author(s) and do not necessarily reflect the views of FAO.
ISBN 978-92-5-106560-0
All rights reserved. FAO encourages the reproduction and dissemination of material in this information product. Non-commercial uses will be authorized free of charge, upon request. Reproduction for resale or other commercial purposes, including educational purposes, may incur fees. Applications for permission to reproduce or disseminate FAO copyright materials, and all queries concerning rights and licences, should be addressed by e-mail to [email protected] or to the Chief, Publishing Policy and Support Branch, Office of Knowledge Exchange, Research and Extension, FAO, Viale delle Terme di Caracalla, 00153 Rome, Italy.
© FAO 2010

iii
Contents
Foreword viiAcknowledgements viiiAcronyms and abbreviations ixSummary x
1. Introduction 1Overview of the global forest products industry 1
Forest industry and the global carbon cycle 5
2. The role of forests in sequestering and storing carbon 7Carbon in the world’s forests 7
Effects of the forest products industry on forest ecosystem carbon 8
3. Carbon in forest products 13
4. Manufacturing-related emissions 17Direct emissions from primary manufacturing 17
Direct emissions from final product manufacturing 19
Direct emissions from management of mill wastes 20
Emissions associated with purchased electricity 21
5. Other cradle-to-gate emissions from the forest products value chain 23Emissions associated with wood production 23
Upstream emissions associated with non-wood inputs and fossil fuels 23
Emissions associated with transporting raw materials and fuels 24
6. Emissions from the gate-to-grave portion of the value chain 27Transport of products to consumers 27
Emissions associated with product use 27
Emissions associated with transporting used products to the end of the life cycle 27
Emissions associated with the end of the life cycle 27
7. Emissions avoided elsewhere in society owing to forest industry activities 29Methane emissions that would occur if recovered paper products were
sent to landfills 29
Benefits of burning non-recyclable discarded products at the end of the life cycle 30
Impacts of the forest industry’s exports of low greenhouse gas intensity electricity and steam 30
Societal benefits of using wood-based building materials instead of more greenhouse gas intensive alternatives 31
The value of markets for wood as an incentive for keeping land in forest 32
iv
8. The global forest industry’s overall carbon and greenhouse gas profile 33
9. The potential for forest-based materials to displace fossil fuels 37
10. IPCC’s findings regarding the mitigation potential of forests 39“In the long term…” 39
“…a sustainable forest management strategy…” 39
“…aimed at maintaining or increasing forest carbon stocks…” 40
“…while producing an annual sustained yield of timber, fibre or energy from the forest…” 40
“…will generate the largest sustained mitigation benefit.” 40
11. Key findings 43
References 45
Annex 1. Calculations 49Carbon storage in paper products in use and in landfills 49
Carbon storage in wood products in use and in landfills 53
Emissions from manufacturing 57
Emissions associated with purchased electricity 57
Upstream emissions associated with non-wood inputs and fossil fuels 61
Transport-related emissions 62
End-of-life emissions 63
Annex 2. An overview of harvested wood products accounting in national greenhouse gas inventories 67The major options 68
Concerns about HWP accounting 69
Outlook 71

v
Figures1 Economic impact of the global forest products industry (2006) 1
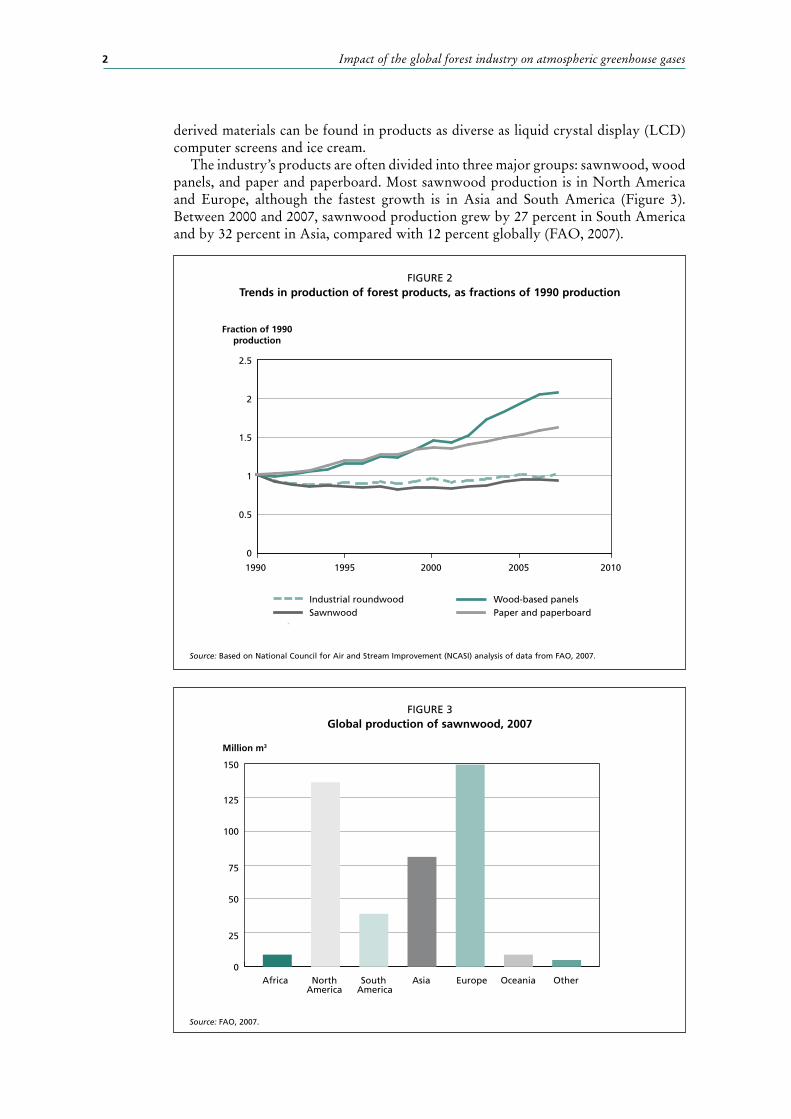
2 Trends in production of forest products, as fractions of 1990 production 2
3 Global production of sawnwood, 2007 2
4 Global production of wood-based panels, 2007 3
5 Global production of paper and paperboard, 2007 3
6 Global production of roundwood, 2007 4
7 Types of planted forests, 2005 9
8 Uses of planted forests 10
9 Growth in global stocks of stored carbon (estimated long-term storage of carbon in products sold in 2007) 15
10 Greenhouse gas intensity of forest products manufacturing 18
11 Comparison of conventional and CHP generation systems 21
12 Greenhouse gas emissions for the global forest products sector 33
13 Factors in increased pine plantation productivity in the southeastern United States 38
Tables 1 Industrial reliance on biomass energy 17
2 Selected studies examining the emissions from final product manufacturing 19
3 Greenhouse gas emission factors associated with forest management 23
4 Upstream emissions associated with fossil fuels and chemical inputs in manufacturing 24
5 Transport-related emissions in the forest products industry value chain 25
6 Estimated emissions and sequestration in the global forest products industry value chain, circa 2006/2007 34
7 Summary of selected avoided emissions associated with the forest products value chain 35
8 Potential biomass supply in 2050 37
A-1 Countries responsible for 90 percent of paper and paperboard consumption 50
A-2 Calculation of the carbon in paper remaining in use and in discards to landfills 51
A-3 IPCC’s methane correction factors 51
A-4 Calculation of carbon stored in paper and paperboard products in landfills 52
A-5 Countries accounting for 90 percent of global wood products consumption 54
A-6 Calculation of carbon stored in wood products in use and in discards to landfills 55
A-7 Calculation of carbon stored in wood products in landfills 56
A-8 Emissions associated with purchased electricity at paper and paperboard mills 58
A-9 Emissions associated with purchased electricity at timber mills 59
A-10 Emissions associated with purchased electricity at panel plants 60
A-11 Upstream emissions associated with chemicals used in producing paper and paperboard 61

vi
A-12 Upstream emissions associated with chemicals used in producing wood-based panels 61
A-13 Upstream emissions associated with fossil fuel use at forest products manufacturing facilities 62
A-14 Final calculation of emissions associated with international transport 63
A-15 Calculation of transport emissions related to domestic transport 63
A-16 Emissions from burning used products at the end of the life cycle, 2007 64
A-17 Methane emissions from paper and paperboard disposed of in landfills 64
A-18 Methane emissions from wood products disposed of in landfills 65

vii
Foreword
FAO and the International Council of Forest and Paper Associations (ICFPA) commissioned this study at the request of the forty-ninth session of the Advisory Committee on Pulp and Wood Products (ACPWP), held in Backubung, South Africa in June 2008. It outlines the global roundwood production, pulp and paper, and wood processing industry’s contribution to climate change mitigation and aims to raise the industry’s profile in international negotiations on global warming.
Over the years, climate change has become a priority issue for the global environment. Recently, the focus of the global climate change agenda has started to shift from carbon sequestration to low carbon emission products and technologies, in which forest industries should play a crucial role. Stable demand for forest products is one of the most important factors in avoiding forest land-use change and maintaining stable forest cover to withstand global warming.
FAO does not necessarily share or support all of the statements in this report. However, we think it is an important attempt to present the climate profile of modern forest management and industries impartially, based on solid facts and figures. We hope that the report will open avenues for further clarification, discussion, findings and solutions.
Michael MartinDirector, Forest Economics and Policy DivisionForestry Department, FAO

viii
Acknowledgements
FAO wishes to thank the author and all contributors and reviewers of this study, particularly:
Teresa Presas, President of the International Council of Forest and Paper Associations (ICFPA) and Managing Director of the Confederation of European Paper Industries (CEPI);Bernard De Galembert, Forest and Research Director, Confederation of European Paper Industries (CEPI);Susan Braatz, Rikiya Konishi, Andrea Perlis and Simmone Rose, FAO;the Advisory Committee on Pulp and Wood Products (ACPWP);the Confederation of European Paper Industries (CEPI);the International Council of Forest and Paper Associations (ICFPA);the National Council for Air and Stream Improvement (NCASI).

ix
Acronyms and abbreviations
ACEEE American Council for an Energy-Efficient Economy ACPWP Advisory Committee on Pulp and Wood ProductsBSI British Standards InstitutionCEPI Confederation of European Paper IndustriesCHP combined heat and powerCO2 carbon dioxideCoC chain-of-custody certificateEJ exajouleEU European UnionFICAT Forest Industry Carbon Assessment Tool FSC Forest Stewardship CouncilGDP gross domestic productGha gigahectareGJ gigajouleGt gigatonneGW gigawattHWP harvested wood productICFPA International Council of Forest and Paper AssociationsIEA International Energy AgencyIFC International Finance CorporationIIED International Institute for Environment and DevelopmentIPCC Intergovernmental Panel on Climate ChangeICFPA International Council of Forest and Paper AssociationsLHV lower heating valueMCF methane correction factor MW megawattNCASI National Council for Air and Stream ImprovementOECD Organisation for Economic Co-operation and DevelopmentPAS Publicly Available SpecificationPEFC Programme for the Endorsement of Forest Certification schemesPPP purchasing power parityUNFCCC United Nations Framework Convention on Climate ChangeUSEPA United States Environmental Protection AgencyWBCSD World Business Council for Sustainable DevelopmentWRI World Resources Institute
x
Summary
This book examines the influence of the forest products (roundwood, processed wood products and pulp and paper) value chain on atmospheric greenhouse gases. Forests managed for natural conservation, for protection of soil and water resources or for non-wood forest products may also have a considerable role in the global carbon balance, but these are beyond the scope of this publication.
Many forest owners and forest product companies engage in practices that will increase forest ecosystem carbon stocks or help avoid their decline, chiefly the establishment of planted forests on areas that were not previously forested, adherence to sustainable management practices in production forests and, increasingly, participation in chain-of-custody programmes.
Experiences in North America and the European Union (EU) suggest the effectiveness of sustainable management of production forests. These regions contain most of the world’s certified forests, and their forest carbon stocks are generally stable or increasing, even though these areas also account for 69 percent of global industrial roundwood production. National-level statistics do not necessarily reflect the carbon stocks on land used for wood production, but some countries can provide information specific to production forests. In the United States of America, for instance, government statistics demonstrate that carbon stocks are stable on industrial timberland, the areas most likely to be used for wood production.
Total greenhouse gas emissions from the forest products value chain are estimated to be 890 million tonnes of carbon dioxide (CO2) equivalent per year, not counting the sequestration accomplished in the value chain. However, the forest products value chain also accomplishes large net removals of CO2 from the atmosphere, because a portion of the CO2 it removes from the atmosphere is stored as carbon for long periods in forests, products in use and products in landfills. In 2007, the net sequestration of CO2 from the atmosphere into the forest products industry value chain was 424 million tonnes of CO2 equivalent, enough to offset 86 percent of the greenhouse gas emissions associated with manufacturing forest products, and almost half of the value chain’s total emissions. When sequestration is taken into account, net greenhouse gas emissions from the forest products value chain decline to 467 million tonnes of CO2 equivalent per year.
Between 2002 and 2007, the direct emissions intensity (direct greenhouse gas emissions per tonne of product) of pulp and paper mills declined by 13 percent, while that from wood product facilities fell by 16 percent. The methods used to characterize other aspects of the global profile were too different from earlier methods to allow similar comparisons over time.
The pulp and paper sector and wood products sector are closely connected through wood flows, ownership of facilities and land, and economics. As a result, their carbon footprints are intimately connected, and attempts to influence one sector will likely have an impact on the other. When looked at separately, however, the pulp and paper sector is generally characterized by higher emissions and less sequestration than the wood products sector.
Several aspects of the forest industry’s activities are not adequately captured by looking at only the emissions and sequestration accomplished in the value chain. For example, the use of wood-based building materials avoids emissions of 483 million tonnes of CO2 equivalent a year, via substitution effects. In addition, by displacing fossil fuels, the burning of used products at the end of the life cycle avoids the emission of more than 25 million tonnes of CO2 equivalent per year, which could be increased to

xi
135 million tonnes per year by diverting material from landfills. The Intergovernmental Panel on Climate Change (IPCC) estimates that forest biomass-derived energy could reduce global emissions by between 400 million and 4.4 billion tonnes of CO2 equivalent per year, a goal that the forest products industry can help society to reach through its forest biotechnology research and forest biomass infrastructure. The market for wood encourages landowners to keep land under forest, helping to avoid large-scale losses of carbon to the atmosphere via land-use change.
IPCC has stated that “In the long term, a sustainable forest management strategy aimed at maintaining or increasing forest carbon stocks, while producing an annual sustained yield of timber, fibre or energy from the forest, will generate the largest sustained mitigation benefit.” The analysis contained in the present report gives strong support to IPCC’s assertion that sustainable management of production forests represents an important mitigation option over the long term.


1
1. Introduction
OVERVIEW OF THE GLOBAL FOREST PRODUCTS INDUSTRYEconomic importanceIn 2006, the forest industry – in this book taken to include roundwood production, pulp and paper, and wood processing – contributed approximately US$468 billion to the global economy, or 1 percent of the total (Figure 1). Although between 1990 and 2006 the industry’s contribution to the global economy grew by about 10 percent in absolute terms, it became relatively less important owing to the much faster growth of other sectors over the same period. The industry’s economic contribution varies among regions and nations. In Latin America, for instance, it represents about 2 percent of the economy, twice the global average (FAO, 2009).
In 2006, the forest products sector was estimated to employ 13.7 million people, divided among roundwood production (almost 3.9 million), pulp and paper manufacturing (4.4 million) and wood processing (5.5 million) (FAO, 2009).
Forest productsIn 2007, approximately 3.6 billion cubic metres of roundwood (wood in its natural state as felled, with or without bark [FAO, 2008]) was removed from the world’s forests, of which 1.7 billion cubic metres was industrial roundwood and the rest fuelwood (FAO, 2007). Most of this wood is converted into products or burned for energy in industrial boilers, and the forest industry is becoming increasingly efficient at using it. The combined output of sawnwood, wood-based panels and paper and paperboard increased by 30 percent between 1990 and 2005, while industrial roundwood production remained essentially unchanged (Figure 2).
The industry’s products serve a wide range of society’s needs. Sawnwood and engineered wood products are used in structures that provide shelter and comfort (e.g. housing and furniture), facilitate transportation (e.g. railroad sleepers), and serve a broad range of other functions. Paper and paperboard products transmit written material, protect packaged goods, and fulfil a range of personal hygiene needs. Wood-
FIGURE 1Economic impact of the global forest products industry (2006)
Note: Data are subject to rounding.Source: FAO, 2009.
Roundwood production US$118 billion
Pulp and paperUS$201 billion
Wood processingUS$150 billion
Impact of the global forest industry on atmospheric greenhouse gases2
derived materials can be found in products as diverse as liquid crystal display (LCD) computer screens and ice cream.
The industry’s products are often divided into three major groups: sawnwood, wood panels, and paper and paperboard. Most sawnwood production is in North America and Europe, although the fastest growth is in Asia and South America (Figure 3). Between 2000 and 2007, sawnwood production grew by 27 percent in South America and by 32 percent in Asia, compared with 12 percent globally (FAO, 2007).
FIGURE 3Global production of sawnwood, 2007
Source: FAO, 2007.
FIGURE 2Trends in production of forest products, as fractions of 1990 production
Source: Based on National Council for Air and Stream Improvement (NCASI) analysis of data from FAO, 2007.
2.5
2
1.5
1
0.5
0
1990 1995 2000 2005 2010
Fraction of 1990 production
Industrial roundwoodSawnwood
Wood-based panelsPaper and paperboard
0
25
50
75
100
125
150
Africa North South Asia Europe Oceania OtherAmerica America
Million m3
Introduction 3
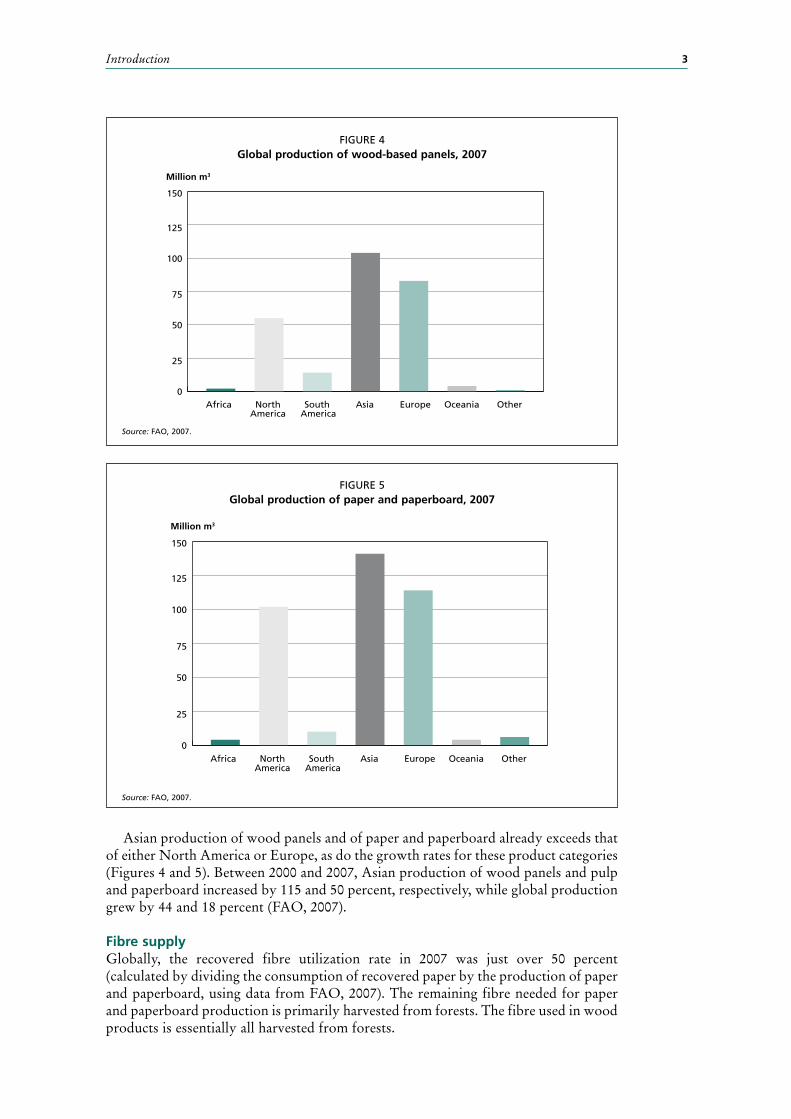
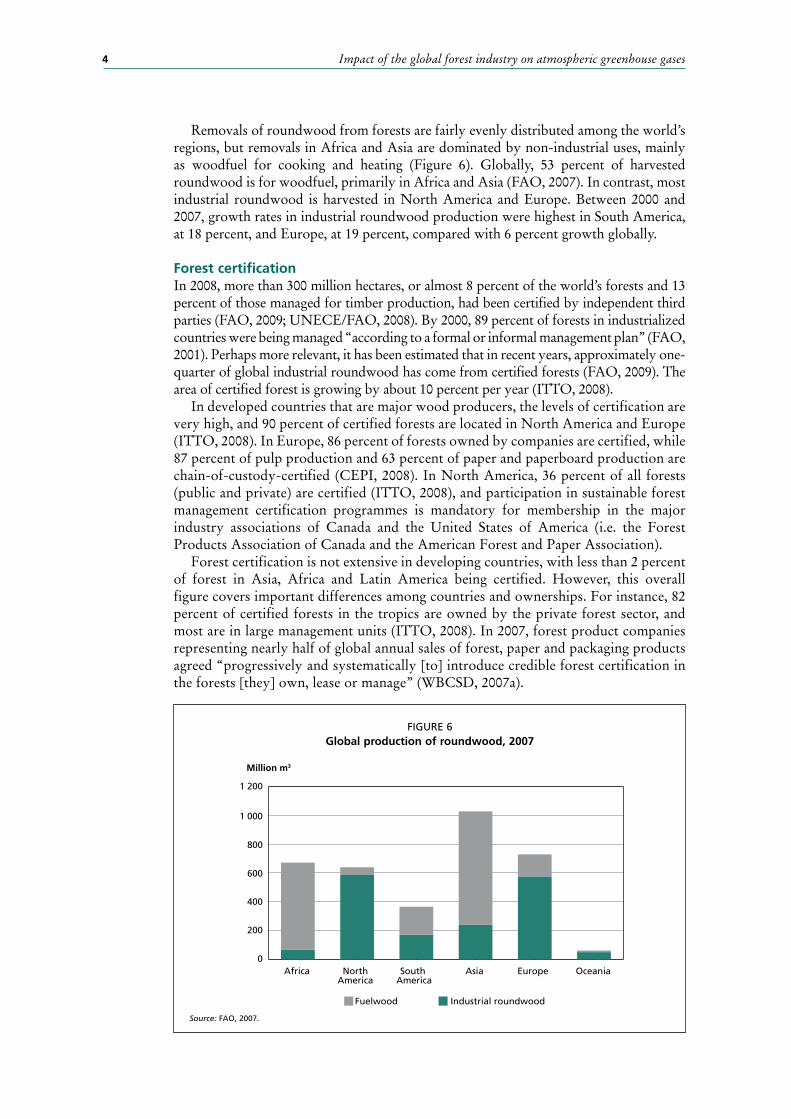
Asian production of wood panels and of paper and paperboard already exceeds that of either North America or Europe, as do the growth rates for these product categories (Figures 4 and 5). Between 2000 and 2007, Asian production of wood panels and pulp and paperboard increased by 115 and 50 percent, respectively, while global production grew by 44 and 18 percent (FAO, 2007).
Fibre supplyGlobally, the recovered fibre utilization rate in 2007 was just over 50 percent (calculated by dividing the consumption of recovered paper by the production of paper and paperboard, using data from FAO, 2007). The remaining fibre needed for paper and paperboard production is primarily harvested from forests. The fibre used in wood products is essentially all harvested from forests.
FIGURE 4Global production of wood-based panels, 2007
Source: FAO, 2007.
0
25
50
75
100
125
150
Africa North South Asia Europe Oceania OtherAmerica America
Million m3
FIGURE 5Global production of paper and paperboard, 2007
Source: FAO, 2007.
0
25
50
75
100
125
150
Africa North South Asia Europe Oceania OtherAmerica America
Million m3
Impact of the global forest industry on atmospheric greenhouse gases4
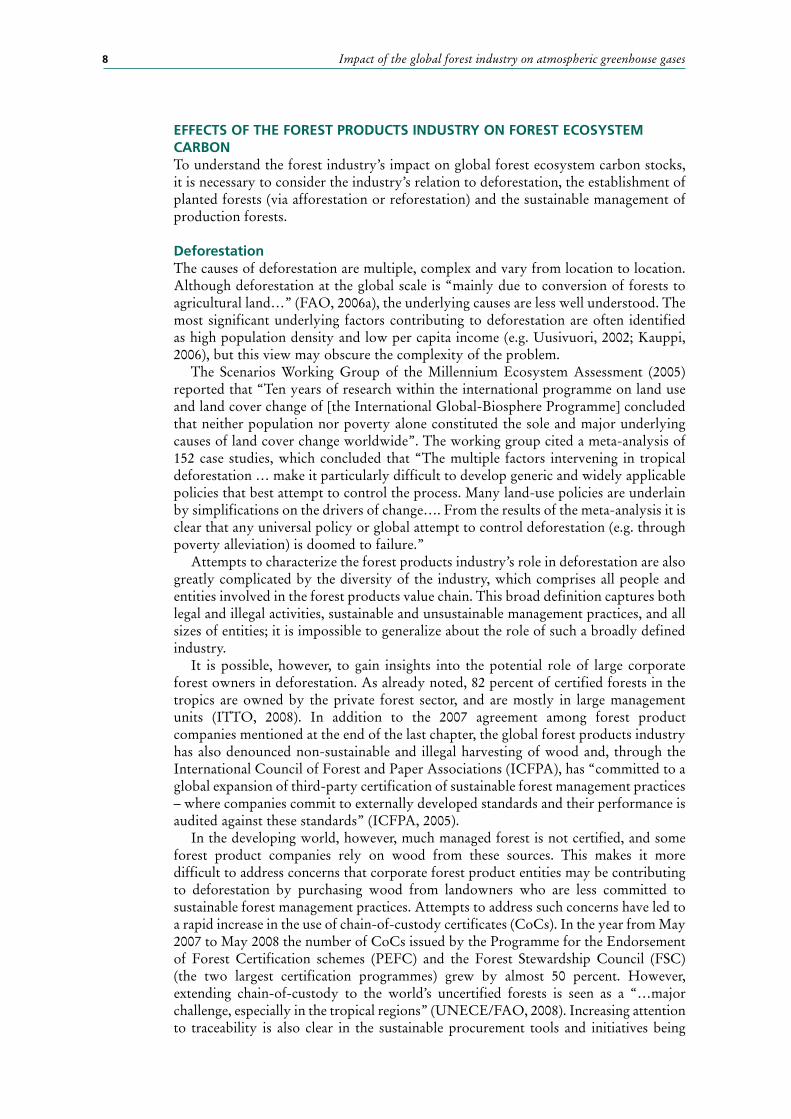
Removals of roundwood from forests are fairly evenly distributed among the world’s regions, but removals in Africa and Asia are dominated by non-industrial uses, mainly as woodfuel for cooking and heating (Figure 6). Globally, 53 percent of harvested roundwood is for woodfuel, primarily in Africa and Asia (FAO, 2007). In contrast, most industrial roundwood is harvested in North America and Europe. Between 2000 and 2007, growth rates in industrial roundwood production were highest in South America, at 18 percent, and Europe, at 19 percent, compared with 6 percent growth globally.
Forest certificationIn 2008, more than 300 million hectares, or almost 8 percent of the world’s forests and 13 percent of those managed for timber production, had been certified by independent third parties (FAO, 2009; UNECE/FAO, 2008). By 2000, 89 percent of forests in industrialized countries were being managed “according to a formal or informal management plan” (FAO, 2001). Perhaps more relevant, it has been estimated that in recent years, approximately one-quarter of global industrial roundwood has come from certified forests (FAO, 2009). The area of certified forest is growing by about 10 percent per year (ITTO, 2008).
In developed countries that are major wood producers, the levels of certification are very high, and 90 percent of certified forests are located in North America and Europe (ITTO, 2008). In Europe, 86 percent of forests owned by companies are certified, while 87 percent of pulp production and 63 percent of paper and paperboard production are chain-of-custody-certified (CEPI, 2008). In North America, 36 percent of all forests (public and private) are certified (ITTO, 2008), and participation in sustainable forest management certification programmes is mandatory for membership in the major industry associations of Canada and the United States of America (i.e. the Forest Products Association of Canada and the American Forest and Paper Association).
Forest certification is not extensive in developing countries, with less than 2 percent of forest in Asia, Africa and Latin America being certified. However, this overall figure covers important differences among countries and ownerships. For instance, 82 percent of certified forests in the tropics are owned by the private forest sector, and most are in large management units (ITTO, 2008). In 2007, forest product companies representing nearly half of global annual sales of forest, paper and packaging products agreed “progressively and systematically [to] introduce credible forest certification in the forests [they] own, lease or manage” (WBCSD, 2007a).
FIGURE 6Global production of roundwood, 2007
Source: FAO, 2007.
0
200
400
600
800
1 000
1 200
Africa North South Asia Europe OceaniaAmerica America
Million m3
Fuelwood Industrial roundwood

Introduction 5
FOREST INDUSTRY AND THE GLOBAL CARBON CYCLEThe connections between climate change concerns and the product value chain are perhaps more complex in the forest industry than in any other industry. The forests that supply the industry’s raw material remove carbon dioxide (CO2) from the atmosphere and store the carbon not only in trees, but also below ground in soil and root systems. The carbon is also ultimately stored in the forest products. Forests and their carbon sequestration potential are affected by management practices, climate and the rise in atmospheric CO2.
Most of the forest industry’s manufacturing facilities use fossil fuels, which generate greenhouse gases when burned. However, the industry also uses much energy from woody biomass. This is preferable to burning fossil fuels because the CO2 released when wood is burned is part of a natural cycle and is offset by growing trees. The forest products industry is a leader in using co-generation, also known as combined heat and power (CHP), to produce electricity. CHP systems use fuels far more efficiently than conventional electricity generation systems do, so smaller amounts of fuel are required and fewer greenhouse gases emitted.
The forest industry’s products compete with products that have different greenhouse gas and carbon attributes. As a result, market forces that cause product substitutions can have important implications for greenhouse gases and carbon. The end-of-life management options for forest products, which include recycling, landfilling and burning for energy, have important but complex greenhouse gas and carbon implications.
To help understand these complex connections, the Confederation of European Paper Industries (CEPI) has developed a carbon footprint framework of ten elements that cover the complete life cycle of forest products (CEPI, 2007). This report addresses all of these elements, but for simplification it condenses them into six:
carbon sequestration and storage in forests and forest products;manufacturing-related emissions – essentially Scope 1 and 2 emissions as defined in the Corporate Accounting and Reporting Standard of the World Resources Institute (WRI)/World Business Council for Sustainable Development (WBCSD) Greenouse Gas Protocol, which was developed as a multi-stakeholder initiative and is arguably the most widely recognized corporate accounting standard for greenhouse gas emissions, covering accounting and reporting of the six greenhouse gases covered by the Kyoto Protocol;other emissions associated with the cradle-to-gate portion of the value chain (encompassing all activities, direct and ancillary, starting in the forest, such as seedling development, planting or regeneration, forest management and harvesting, and extending to the manufacture of a finished product) – upstream emissions, mostly Scope 3;emissions from product transport and use – essentially downstream Scope 3emissions not including end-of-life emissions;emissions associated with end-of-life management – Scope 3;emissions avoided elsewhere in society owing to activities of the forest products industry:
recycling, which avoids landfill methane emissions;-use of non-recyclable discarded products for energy, which avoids methane -emissions and displaces fossil fuel;exports of electricity and steam with low greenhouse gas-intensity, which -displaces the electricity and steam produced with fossil fuels;use of wood-based building materials, which displaces more greenhouse gas -intensive building materials.


7
2. The role of forests in sequestering and storing carbon
CARBON IN THE WORLD’S FORESTSThe world’s forests store and cycle enormous quantities of carbon. FAO (2006a) estimates that they store 283 gigatonnes (Gt) of carbon in their biomass alone, and that this plus the carbon stored in dead wood, litter and soil is more than the carbon in the atmosphere (estimated by the Intergovernmental Panel on Climate Change [IPCC, 2007b] as 762 Gt). The total annual turnover of carbon between global forests and the atmosphere (as characterized by gross primary production) is in the range of 55 to 85 Gt per year (from data in IPCC, 2000; Sabine et al., 2004; Field, 1998; Zhang, 2009). The amount of atmospheric carbon transformed into forest biomass, which is essentially equal to net primary production, has been estimated at 25 to 30 Gt per year (Field, 1998; Sabine et al., 2004). In comparison, the amounts of carbon removed from global forests in industrial roundwood are small, at approximately 0.42 Gt per year (estimated from data in FAO, 2007).
Atmospheric levels of CO2 are directly affected by changes in forest area, net gains or losses in carbon on forested land, and gains or losses in off-site stocks of carbon in products. At the global level, forested area continues to decline, largely owing to continued deforestation in the tropics (although the rates of tropical deforestation are “uncertain and hotly debated” [IPCC, 2007b]). Between 1990 and 2000, forested area declined by 0.22 percent per year, slowing to 0.18 percent per year between 2000 and 2005. Even at this diminished rate, more than 7.3 million hectares of forest were being lost per year (FAO, 2009). This loss of forested area is associated with transfers of carbon to the atmosphere, which for the 1990s were estimated to average 1.6 Gt per year, ranging from 0.5 to 2.7 Gt. This represented about 20 percent of global carbon emissions in this period (IPCC, 2007a).
For areas that remain in forest, it is difficult to determine how the amounts of carbon are changing at the global level. Attempts to develop global carbon budgets have found a large unexplained uptake of carbon by the terrestrial ecosystem (IPCC, 2007a). This residual land sink is not well understood, but explanations have been proposed, including continuing accumulation of carbon in undisturbed tropical forests, and in forest regrowth in other areas such as abandoned agricultural lands and managed forests (IPCC, 2007a). The residual land sink is large, but impossible to determine accurately. In the 1990s, it was estimated to average 2.6 Gt carbon per year, ranging from 0.9 to 4.3 Gt per year (IPCC, 2007a).
In summary, the world’s forests have important effects on the levels of CO2 in the atmosphere. Enormous amounts of carbon are stored by forests and cycled between forests and the atmosphere. Losses of forested area, mostly owing to deforestation in the tropics, are causing transfers of 0.5 to 2.7 Gt carbon to the atmosphere every year. At the same time, annual net removals of 0.9 to 4.3 Gt carbon from the atmosphere are accomplished via a poorly understood residual land sink. Gains in the amounts of carbon in existing forests are often cited as a possible explanation for this sink. Compared with the amounts of carbon converted annually into forest biomass, the amounts removed in industrial roundwood are relatively small, representing less than 2 percent of net primary production in forests.
Impact of the global forest industry on atmospheric greenhouse gases8
EFFECTS OF THE FOREST PRODUCTS INDUSTRY ON FOREST ECOSYSTEMCARBONTo understand the forest industry’s impact on global forest ecosystem carbon stocks, it is necessary to consider the industry’s relation to deforestation, the establishment of planted forests (via afforestation or reforestation) and the sustainable management of production forests.
DeforestationThe causes of deforestation are multiple, complex and vary from location to location. Although deforestation at the global scale is “mainly due to conversion of forests to agricultural land…” (FAO, 2006a), the underlying causes are less well understood. The most significant underlying factors contributing to deforestation are often identified as high population density and low per capita income (e.g. Uusivuori, 2002; Kauppi, 2006), but this view may obscure the complexity of the problem.
The Scenarios Working Group of the Millennium Ecosystem Assessment (2005) reported that “Ten years of research within the international programme on land use and land cover change of [the International Global-Biosphere Programme] concluded that neither population nor poverty alone constituted the sole and major underlying causes of land cover change worldwide”. The working group cited a meta-analysis of 152 case studies, which concluded that “The multiple factors intervening in tropical deforestation … make it particularly difficult to develop generic and widely applicable policies that best attempt to control the process. Many land-use policies are underlain by simplifications on the drivers of change…. From the results of the meta-analysis it is clear that any universal policy or global attempt to control deforestation (e.g. through poverty alleviation) is doomed to failure.”
Attempts to characterize the forest products industry’s role in deforestation are also greatly complicated by the diversity of the industry, which comprises all people and entities involved in the forest products value chain. This broad definition captures both legal and illegal activities, sustainable and unsustainable management practices, and all sizes of entities; it is impossible to generalize about the role of such a broadly defined industry.
It is possible, however, to gain insights into the potential role of large corporate forest owners in deforestation. As already noted, 82 percent of certified forests in the tropics are owned by the private forest sector, and are mostly in large management units (ITTO, 2008). In addition to the 2007 agreement among forest product companies mentioned at the end of the last chapter, the global forest products industry has also denounced non-sustainable and illegal harvesting of wood and, through the International Council of Forest and Paper Associations (ICFPA), has “committed to a global expansion of third-party certification of sustainable forest management practices – where companies commit to externally developed standards and their performance is audited against these standards” (ICFPA, 2005).
In the developing world, however, much managed forest is not certified, and some forest product companies rely on wood from these sources. This makes it more difficult to address concerns that corporate forest product entities may be contributing to deforestation by purchasing wood from landowners who are less committed to sustainable forest management practices. Attempts to address such concerns have led to a rapid increase in the use of chain-of-custody certificates (CoCs). In the year from May 2007 to May 2008 the number of CoCs issued by the Programme for the Endorsement of Forest Certification schemes (PEFC) and the Forest Stewardship Council (FSC) (the two largest certification programmes) grew by almost 50 percent. However, extending chain-of-custody to the world’s uncertified forests is seen as a “…major challenge, especially in the tropical regions” (UNECE/FAO, 2008). Increasing attention to traceability is also clear in the sustainable procurement tools and initiatives being

The role of forests in sequestering and storing carbon 9
applied to forest products. A recent review of 22 such tools and initiatives revealed that more than 80 percent address traceability and legality, while 30 percent also specifically address forest conversion (WBCSD/WRI, 2007).
Given the complexity of deforestation, it is not possible to calculate how much global loss of forest area can be attributed to specific causes. It is also impossible to quantify the potential role of corporations that own forests or manufacture forest products, although empirical evidence suggests that large corporate producers of wood are already involved in sustainable forest management activities that would be expected to combat deforestation. Large corporate users of wood are also increasingly engaged in programmes that help to ensure that wood is sourced from sustainably managed forests.
Planted and assisted forestsIn 2005, total planted forests covered 271 million hectares, or 6.9 percent of global forested area. This does not include an additional 128 million hectares of “assisted” semi-natural forest, which is a major wood source in some regions, but is not considered planted forest by FAO. In the planted forest estate of 2005, 141 million hectares were in plantations and 130 million hectares in planted semi-natural forest (Figure 7). Between 2000 and 2005, total planted forest area grew by 1.9 percent. About three-quarters of planted forest is primarily for production rather than protection purposes. Among the predominant, large-scale end-uses of productive planted forests, sawlogs and pulpwood/fibre represent about 75 percent of those specified by reporting countries (and about 65 percent when unspecified outputs are included in the total) (Figure 8).
The global forest products industry is increasingly reliant on planted forests for raw material. In 2000, fast-growing plantations had the potential to supply 259 million cubic metres of high-value timber (i.e. “logs to be sawn, sliced or peeled”) per year, representing 27 percent of all high-value wood production (FAO, 2005). Although accounting for only 5 percent of global forest cover in 2000, forest plantations supplied about 35 percent of global roundwood, and this figure was expected to increase to 44 percent by 2020 (FAO, 2001). Clearly, planted forests are increasingly important sources of wood for the forest products industry. It is therefore important to understand their impact on forest carbon stocks.
FIGURE 7Types of planted forests, 2005
Source: FAO, 2006b.
Planted seminatural –productive
Plantation –productive
Planted seminatural – protective
Plantation –protective

Impact of the global forest industry on atmospheric greenhouse gases10
Planted forests are often established by converting non-forested land into forest, via afforestation. In some cases, however, planted forests and assisted semi-natural forests are established on forested land that has not previously been managed for wood production, via forest conversion. Afforestation almost always increases land-based carbon stocks, while forest conversion often, although not always, decreases forest carbon stocks.
Few recent data are available for characterizing accurately the types of land converted to planted or assisted semi-natural forest. Between 1990 and 2000, plantations were established via afforestation at approximately the same rate as they were via forest conversion (1.6 million hectares and 1.5 million hectares per year, respectively) (FAO, 2001). The carbon-related impacts of these activities cannot be calculated with certainty at the global level. In general, afforestation significantly increases above-ground carbon stocks and often also increases those below ground, although losses in soil carbon have also been reported. Forest conversion often results in decreases in forest carbon stocks, although increases are possible in some situations. In spite of these uncertainties, based on the types of impacts on carbon stocks that would commonly be expected, it is reasonable to assume that from 1990 to 2000, the carbon gains from the 1.6 million hectares per year of afforestation would have approximately offset the losses associated with forest conversion of 1.5 million hectares per year (Miner and Perez-Garcia, 2007a).
Among global forest product companies, afforestation appears to be a far more common approach for establishing forest plantations than forest conversion. According to information from ten major forest product companies, 90 percent of the plantation area that they established between 2000 and 2006 was on previously non-forested land, and only 5 percent on converted forest land that had not been used for wood production (WBCSD, 2007b). Although this information is not adequate for characterizing the industry’s overall practices, with 23 percent of 2006 sales from the top 100 forest, paper and packaging industry companies (PwC, 2007), these ten companies represent a large
80
70
60
50
40
30
20
10
0
1990 1995 2000 2005
Million ha
Pulpwood/fibreSawlogsBioenergy
Non-wood productsUnspecified
FIGURE 8Uses of planted forests
Source: FAO, 2006b.

The role of forests in sequestering and storing carbon 11
enough share of global sales to suggest that the net carbon-related effects of plantation establishment among major companies are often positive.
It is even more difficult to estimate the carbon-related impacts of converting natural forests – which are influenced primarily by natural disturbances – to forests that FAO classifies as assisted semi-natural forests. Some such conversions result in forests that closely resemble the original forest, with very little impact on carbon stocks; in other cases, the replacement forest may have very different carbon stocks from those of the forest before conversion. Modelling of these conversion practices in Canada, for example, found widely varying carbon impacts, depending on the type of forest involved (Kurz, 1998).
Current information is clearly insufficient to allow accurate estimates of the carbon-related impacts resulting from the global forest products industry’s establishment of planted and assisted forests. There is evidence suggesting that global forest product companies are far more likely to develop plantations on non-forested than forested land, implying that the carbon impacts from plantation establishment are likely to be positive. However, the carbon-related impacts of converting forests from natural disturbance regimes to managed, assisted semi-natural forest are not known at the global level.
Although global estimates remain problematic, some individual companies have adequate information on the forests that they have established (or converted), so reasonable estimates of the carbon-related impacts associated with these activities are possible.
Sustainable management of production forestsA major objective of all sustainable management programmes in production forests is to achieve a long-term balance between harvesting and regrowth. The operational guidelines of PEFC, the world’s largest certification programme, stipulate that “forest management practices should safeguard the quantity and quality of the forest resources in the medium and long term by balancing harvesting and growth rates” (PEFC, 2007a, 2007b; MCPFE, 1998). A key principle of the FSC Standard, the second largest certification programme, is that “the rate of harvest of forest products shall not exceed levels which can be permanently sustained” (FSC, 2002). Although certification programmes are not always explicit about the connections between sustainable forest management and carbon, the practical effect of maintaining a balance between harvesting and regrowth is to achieve stable long-term carbon stocks in managed forests.
Insights into the benefits of sustainable forest management can be gained by examining forest carbon stocks in the regions with the most certified forest. As already noted, 90 percent of certified forests are in North America and Europe (ITTO, 2008), and forest carbon stocks are continuing to grow in the United States and the European Union (EU-27) countries (USEPA, 2009; MCPFE, 2007). Although this finding does not necessarily reflect what is happening in forests used for wood production, evidence of the effects of sustainable forest management on carbon stocks can be derived from the subset of United States forests comprising industry-owned timberland, where carbon stocks are essentially stable (Heath et al., 2010).
Empirical evidence therefore appears to support the existence of a link between sustainable forest management and stable or increasing forest carbon stocks in production forests.
Efforts by forest products industry to limit losses of forest ecosystem carbonFor the variety of reasons explained in the previous paragraphs, it is not possible to quantify the global forest products industry’s effect on forest ecosystem carbon stocks. However, evidence suggests that corporate forest owners and forest product companies commonly engage in practices that help avoid the loss of forest ecosystem carbon. Key among these practices are:

Impact of the global forest industry on atmospheric greenhouse gases12
the establishment of planted forests, primarily on non-forested areas;adherence to sustainable forest management practices (and increasingly chain-of-custody programmes).
The effectiveness of sustainable forest management practices in maintaining carbon stocks in production forests is clear from experiences in North America and the EU. These regions contain most of the world’s certified forests and have generally stable or increasing forest carbon stocks, even though they also account for more than 55 percent of global industrial roundwood production (FAO, 2007).

13
3. Carbon in forest products
The industrial roundwood removed every year from global forests contains approximately 420 million tonnes of carbon (data from FAO, 2007, assuming densities of coniferous and non-coniferous roundwood of 0.45 and 0.56 tonnes per cubic metres, respectively, and a carbon content of 50 percent). Much of this carbon is returned to the atmosphere relatively quickly, often via use of the roundwood as a source of biomass energy. However, a significant fraction of the carbon in industrial roundwood is stored in products for periods ranging from months to centuries.
If all the carbon removed from the atmosphere by forests was quickly returned to the atmosphere, the net impact of this cycle on atmospheric CO2 would be zero. However, because some of the carbon is stored in products, the biomass carbon cycle can be a net sink for atmospheric CO2. For this to happen, the amounts of carbon returned to the atmosphere from the product carbon pool over a given period must be less than the amounts of carbon added to the pool. It is only the net growth in stored carbon that affects the atmosphere. If the amounts of stored carbon are constant, the carbon stored in the product pool has no effect on atmospheric CO2.
Until recently, IPCC’s national greenhouse gas accounting guidelines defaulted to the assumption of zero growth in the product carbon pool (this is mathematically equivalent to assuming the carbon in harvested wood is oxidized instantaneously). However, countries have the option of including the effects of carbon stored in products, and several countries have been estimating these effects (e.g. USEPA, 2009; Australia Department of Climate Change, 2009). In 2006, IPCC updated its guidelines for national greenhouse gas inventories (IPCC, 2006). Instead of assuming zero growth in the harvested wood products carbon pool as the recommended default approach, the updated guidelines provide countries with various approaches for calculating the impacts of carbon stored in harvested wood products. (The implications of different accounting approaches on national inventory results are discussed in Annex 2.)
The global pool of carbon stored in forest products is estimated to be growing by 150 million tonnes (±50 percent) per year (Miner and Perez-Garcia, 2007b). This is equivalent to removing 540 million tonnes (±50 percent) of CO2 from the atmosphere every year. The growth in the pool attributable to United States and Canadian production alone is more than 35 million tonnes of carbon per year (USEPA, 2009; Environment Canada, 2009). Growth in the carbon pool stored in products is due to:
the long times over which many forest products remain in use; the growth in annual demand for forest products;the very long storage time for a fraction of the carbon in products in landfills.
The importance of carbon in products is acknowledged in a range of activities beyond national greenhouse gas inventories. For instance, in the British Standards Institution’s (BSI) Publicly Available Specification (PAS) 2050, on the carbon footprint, the forest products footprint is credited with the weighted average amount of carbon stored over a 100-year period (BSI, 2008). Using IPCC’s first order model and half-lives for the time-in-use of forest products (two years for paper and 30 years for wood products) (IPCC, 2006), the 100-year weighted average of carbon storage in paper is 2.9 percent of the original biomass carbon, while the storage in wood products is 39 percent of the original carbon. Using typical biomass carbon contents, these translate into carbon storage benefits (equivalent to net removals from the atmosphere) of approximately 50 kg of CO2 equivalent per tonne of paper and 700 kg of CO2 equivalent per tonne of wood products. Additional storage is accomplished in anaerobic landfills.

Impact of the global forest industry on atmospheric greenhouse gases14
In this study, the global benefits of carbon storage in forest products in use have been estimated using the PAS 2050 method, FAO production statistics (FAO, 2007) and the IPCC default factors described above. Additional details are provided in Annex 1. The carbon storage benefits of products in use were determined to be 20 million and 243 million tonnes of CO2 equivalent per year for paper and wood products, respectively, totalling 263 million tonnes of CO2 equivalent per year, based on 2007 production. This is reasonably close to the 200 million tonnes of CO2 equivalent per year estimated by an earlier study using a different approach (Miner and Perez-Garcia, 2007b).
To estimate carbon storage in landfills, the amounts not remaining in use were assumed to pass to end-of-life management. The amounts of paper recovered at the end of the life cycle were estimated from FAO statistics (FAO, 2007), and it was assumed that 30 percent of wood was recovered. The amounts remaining in the waste stream and sent to landfills were estimated using IPCC waste management statistics (IPCC, 2006). Landfill design and operating practices were described using IPCC approaches and factors (IPCC, 2006) and were assigned to the countries accounting for 90 percent of consumption according to national per capita gross domestic product (GDP) groupings (World Bank, 2009). (One exception was the assumed loss of carbon from products under landfill conditions. IPCC’s default assumption is 50 percent loss for all forest products, but other data suggest that while 50 percent may be a reasonable average for paper products, a 20 percent loss is a more appropriate assumption for wood products [USEPA, 2006; IFC, 2009].)
Details of the calculations are described in Annex 1. The results indicate that in 2007 the carbon storage benefits of products in landfills were approximately 67 million tonnes of CO2 equivalent per year for paper and paperboard, and 94 million tonnes of CO2 equivalent per year for wood products, resulting in a total of 161 million tonnes of CO2 equivalent per year for all forest products. This is less than the 340 million tonnes of CO2 equivalent per year estimated in an earlier study using a different approach (Miner and Perez-Garcia, 2007b). Most of the difference can be attributed to different assumptions about landfill design and operation; this study assumed that a lower fraction of waste goes to anaerobic landfills, especially in developing and least-developed countries. This results in reduced landfill carbon storage, because biomass carbon is stored in landfills only under anaerobic conditions. The difference between the two estimates highlights the uncertainties associated with attempting to characterize the effect of end-of-life management on the carbon footprint of forest products.
The fate of the degradable fraction of carbon in landfills (the fraction that is not stored) is also very important to the life cycle profile of forest products. Of particular relevance is the generation and release of methane attributable to the decomposition of forest products in anaerobic landfills. Landfill methane emissions are examined in detail later in this report. Based on the current analysis, it appears that the global methane emissions (adjusted for global warming potential) associated with paper products in landfills are larger than the offsetting carbon storage benefits. Other studies have shown that this balance varies greatly by grade of paper, depending on the non-degradable fraction of the paper (USEPA, 2006), with some grades of paper having carbon storage attributes similar to those of wood products; however, the differences among paper grades are not explored in the current analysis. For wood products, the inverse appears to be true: i.e. globally, the carbon storage associated with the non-degradable fraction of wood products seems to be greater than the impact of the methane emissions associated with the degradation of wood products in landfills. However, the uncertainties involved in estimating end-of-life impacts are too large to allow precise definition of the net balance between landfill-related emissions and carbon storage at the global level.
It is important to understand that the pulp and paper and wood product sectors are closely connected via wood flows, the ownership of facilities and land, and economics.

Carbon in forest products 15
For instance, manufacturing residuals (e.g. sawdust and chips) from wood product manufacturing represent a major source of fibre for pulp production. In the United States, for example, residuals from forests and manufacturing provide 15 percent of the virgin fibre used for pulp (AF&PA, 2007). Wood product facilities earn substantial income from sales of these residuals to pulp mills. Through these connections, the carbon footprints of the two sectors are closely connected, and attempts to influence one sector will likely have impacts on the other.
The carbon storage benefits of forest products are summarized in Figure 9. Although there are uncertainties associated with these estimates, it is clear that growth in the product carbon pool represents an important part of the footprint of forest products. The methods used in this study indicate that this growth in carbon storage is equivalent to removing 424 million tonnes of CO2 from the atmosphere per year.
FIGURE 9Growth in global stocks of stored carbon
(estimated long-term storage of carbon in products sold in 2007)
0
50
100
150
200
250
300
350
400
450
In use In landfills Total
Million tonnes of CO2equivalent
Paper and paperboard Wood products Total


17
4. Manufacturing-related emissions
The manufacturing of forest products often results in the release of greenhouse gases from manufacturing facilities (usually Scope 1 emissions) and from electricity producers selling electricity to manufacturers (Scope 2 emissions).
DIRECT EMISSIONS FROM PRIMARY MANUFACTURINGEmissions from manufacturing of pulp, paper, paperboard and wood products are greatly influenced by the industry’s reliance on biomass for energy. Biomass provides almost 50 percent of the fuel energy used by the pulp and paper industry and more than 60 percent of the fuel energy used by the wood products industry (IEA, 2006) – far more than in any other industry sector (Table 1).
A study from 2002 estimated the emissions from fossil fuel combustion at pulp and paper mills to be approximately 205 million tonnes of CO2 equivalent, based on data from national trade associations from around the world (Miner and Perez-Garcia, 2007b). This estimate has been updated for the present report, again using data from national trade associations (via a survey distributed by ICFPA), but including a more robust method for estimating emissions from China. The details are explained in Annex 1. Most of the data obtained were for 2006/2007. Using these data, global emissions from fossil fuel use in the paper and paperboard sector were estimated to be approximately 202 million tonnes of CO2 equivalent. From IEA energy data and corresponding FAO production data, the emissions of nitrous oxide and of methane from burning biomass were estimated to be approximately 5 million tonnes of CO2 equivalent per year, bringing the total greenhouse gas emissions from pulp, paper and paperboard production to 207 million tonnes of CO2 equivalent a year, which is essentially the same as estimated for 2002. Between 2002 and 2006/2007, however, global production of paper and paperboard increased from 331 million to 384 million tonnes.
Given the uncertainties in estimating global emissions, it is useful to examine some of the better documented national statistics to see whether the trend revealed at the global level is evident in national-level data. Information from the major trade associations in the United States, Europe and Japan, where more than half of the world’s paper and
TABLE 1 Industrial reliance on biomass energy
Sector % of fuel energy from biomass
Iron and steel 0.0
Chemicals and petrochemicals 0.2
Non-ferrous metals 0.3
Non-metallic minerals 1.0
Transport equipment 0.1
Machinery 0.1
Mining and quarrying 0.0
Food and tobacco 8.3
Paper, pulp and print 48.0
Wood and wood products 61.1
Construction 0.5
Textiles and leather 0.8
Source: Based on data from IEA, 2006.

Impact of the global forest industry on atmospheric greenhouse gases18
paperboard are produced, were examined to determine the greenhouse gas intensity of the industries in these countries over the same four to five-year period. The data indicate that the industries in all three regions reduced emissions intensity by 14 to 15 percent between 2002 and 2006/2007. The data sources cited here indicate that at the global level, the greenhouse gas intensity of the paper and paperboard sector in 2002 was 0.62 tonnes of CO2 equivalent per cubic metre of production, dropping to 0.54 tonnes in 2007, an improvement of 13 percent, which is consistent with the regional-level improvements.
The emissions from wood products manufacturing are less well documented. In a survey of ICFPA members, only four countries provided wood product emissions data, representing only 19 percent of global production. Because of the small and non-representative character of the data, IEA fuel consumption data and corresponding FAO country data were used to estimate global emissions from the wood products sector (IEA, 2006; FAO, 2007). This yielded an estimate of 24.5 million tonnes of CO2 equivalent from fossil fuel combustion. The same sources yielded an estimate of 1.1 million tonnes of CO2 equivalent in methane and nitrous oxide from biomass combustion at wood product facilities, indicating total greenhouse gas emissions from wood products manufacturing of 25.6 million tonnes of CO2 equivalent per year. This is approximately the same as an earlier estimate of 2001 emissions (26 million tonnes of CO2 equivalent per year) derived from the same sources (Miner and Perez-Garcia, 2007b). Over the four years from 2001 to 2004, global production of sawnwood and wood-based panels increased by 17 percent (FAO, 2007), suggesting that the improvement in greenhouse gas intensity of wood products manufacturing was at least as rapid as that of pulp and paper production. The data sources cited here indicate that the greenhouse gas intensity of the wood products sector in 2001 was 0.046 tonnes of CO2 equivalent per cubic metre of production, dropping to 0.039 tonnes in 2004, an improvement of 16 percent (Figure 10).
FIGURE 10Greenhouse gas intensity of forest products manufacturing
0
0.1
0.2
0.3
0.4
0.5
0.6
0.7
2001 2002 2004 2007
Tonnes of emissions per unit of production
Pulp and paper (tonnes CO2 equivalent/tonne production)
Wood products (tonnes CO2 equivalent/m3 production)

Manufacturing-related emissions 19
DIRECT EMISSIONS FROM FINAL PRODUCT MANUFACTURINGPaper, paperboard, wood and panels are made into a wide range of products. It is therefore not feasible to calculate the emissions associated with the manufacturing step of converting these intermediate products into all of the final products that are made from them. However, a large number of life cycle studies calculate the emissions related to conversion of intermediate forest products into final products. This literature, and expert judgements, can be used to estimate global emissions from final product manufacturing.
Some products require very little processing to convert them from intermediate to final products. For example, the process of converting rolls of uncoated freesheet into reams of office paper involves only cutting and packaging, with a small amount of printing required on the packaging. Tissue and paper towel converting operations consist mainly of cutting, folding and placing in printed packages. Converting sawnwood into pallets results in almost no emissions of greenhouse gases, but other products involve much more final processing. Corrugated containers, for instance, require cutting, folding, corrugating, gluing and printing. The production of magazines containing a large number of high-quality images can result in significant emissions of greenhouse gases, owing not only to the printing operations but also to upstream emissions associated with ink manufacturing (Table 2).
The large range in emissions documented in these studies clearly demonstrates that any estimate of global emissions from final manufacturing is very uncertain. In this study, it is assumed that final manufacturing emissions are equal to 20 percent of emissions from primary and intermediate product manufacturing, and that the emissions are equally divided between those related to combustion of fossil fuel and those associated with purchased electricity consumption. This value is larger than those estimated in earlier studies (e.g. Miner and Perez-Garcia, 2007b) owing to a judgement that these earlier assessments underestimated the effects of printing, which is widely used on paper and paperboard products. However, it is also possible that this figure of 20 percent of upstream production-related emissions overstates the emissions from converting activities for the overall forest products industry, because almost half of the industry’s output is in wood products, and the final manufacturing processes for wood products (e.g. house building) generally produce emissions that are much less than 20 percent of the accumulated embodied emissions in the construction materials (e.g. Cole, 1999). The range of uncertainty around estimates of emissions from final manufacturing is therefore large.
TABLE 2 Selected studies examining the greenhouse gas emissions from final product manufacturing
Final product % contribution of final product manufacturing
Contribution (kg CO2/tonne product)
Reference
Magazine production 3% to 7% of emissions from paper manufacturing
12 to 135 (averaging 55) Gower et al., 2006
Magazine production and distribution
37% of emissions from paper manufacturing
611 Wegner, 2009
Multi-layer corrugated board
14% of cradle-to-gate emissions from manufacturing multi-layer corrugated board
67.6 kg FEFCO, 2006
Wood-framed houses Construction activities, not including worker transport, are less than 10% of the total embodied emissions
? Cole, 1999
Printed graphic papers 8% of emissions from pulp and paper manufacturing
76 per tonne of paper consumed
Tiedemann, 2001
Newspapers and magazines
42% to 100% of emissions from pulp and paper manufacturing
300 to 500 per tonne of product printed
Axel Springer Verlag, Stora and Canfor, 1998
Impact of the global forest industry on atmospheric greenhouse gases20
Twenty percent of total direct and indirect emissions from purchased electricity (described later in this report) for the forest products sector is 77.4 million tonnes of CO2 equivalent per year. The direct emissions from converting are estimated by halving this, to derive 38.7 million tonnes of CO2 equivalent per year, which is significantly larger than an earlier estimate of 12 million tonnes (Miner and Perez-Garcia, 2007b), for the reasons explained in the previous paragraph.
DIRECT EMISSIONS FROM MANAGEMENT OF MILL WASTESUnder anaerobic conditions, mill liquid and solid wastes can degrade to a mixture of CO2 and methane. Estimates of these emissions are highly uncertain owing to a lack of information on global waste management practices and incomplete scientific understanding of the factors that influence methane generation. Based on the following calculations, however, it is clear that these emissions are small.
When considering the methane emissions from mill wastes placed in landfills, the following assumptions can be made. For pulp and paper mill landfills, it can be assumed that:
mill solid waste going to anaerobic landfills is equal to 4 percent of production (a value between those of the European and the United States paper industries [CEPI, 2008; AF&PA, 2008]);waste is 25 percent biomass carbon (value based on NCASI testing [Heath et al., 2010]);50 percent of the biomass carbon in mill solid wastes can degrade under anaerobic conditions to gas containing equal amounts (by volume) of methane and CO2 (the IPCC default for paper products); none of the landfills have systems for capturing methane, so the only destruction is a 10 percent oxidation that occurs in the upper layers of the landfill via natural processes (the IPCC default assumption).
Under these circumstances, ultimate emissions from the pulp and paper mill wastes placed in landfills in 2007 are expected to be approximately 24 million tonnes of CO2 equivalent.
For wood product mill landfills, it can be assumed that:the mill solid waste going to anaerobic landfills is equal to only 1 percent of production, because most of the waste from wood product plants has high value as fuel and is burned rather than discarded (an assumption with large uncertainty, especially in developing countries where mill solid waste is sometimes disposed of in piles instead of being sent to landfills or burned);the waste is 25 percent biomass carbon, based on awareness that material placed in landfills is often unusable as fuel owing to contamination with soil, rocks and other debris;50 percent of the biomass carbon in mill solid wastes can degrade under anaerobic conditions to gas containing equal amounts (by volume) of methane and CO2 (the IPCC default for paper products, which is likely to overstate the degradation of wood waste); none of the landfills have systems for capturing methane, so the only destruction is a 10 percent oxidation that occurs in the upper layers of the landfill via natural processes (the IPCC default assumption).
Under these circumstances, ultimate emissions from the wood product mill wastes placed in landfills in 2007 are expected to be approximately 2 million tonnes of CO2 equivalent.
Adding the mill landfill-related emissions from the pulp and paper and wood products sectors yields an estimate of total global methane emissions from mill landfills of 26 million tonnes of CO2 equivalent per year. This is somewhat larger than the amounts estimated in an earlier profile of the global industry (20 million tonnes of CO2
equivalent per year) (Miner and Perez-Garcia, 2007b). However, the earlier estimate was of current emissions from industry landfills, considering the rate at which all past

Manufacturing-related emissions 21
wastes decompose, whereas the updated estimate is a projection of ultimate emissions from waste placed in landfills in 2007. In any event, the estimates of methane emissions from mill wastes are highly uncertain owing to uncertainties regarding the amounts of waste generated and the methods used to manage this waste.
It is also possible to generate methane where wastewater is treated under anaerobic conditions. Only a small amount of wastewater in the pulp and paper industry is treated in anaerobic treatment systems. Although many aerated wastewater treatment systems have anaerobic zones, studies indicate that these emissions are very small relative to other emissions from the forest products industry, amounting to 400 000tonnes of CO2 equivalent for the 93 million tonnes of paper and paperboard produced in the United States (Heath et al., 2010). Almost no wastewater is generated in wood products manufacturing. Extrapolated to global production of paper and paperboard (384 million tonnes in 2007), the United States estimate of emissions yields a global estimate of 1.7 million tonnes of CO2 equivalent per year.
The total emissions from managing mill wastes generated in 2007 are therefore approximately 28 million tonnes of CO2 equivalent, with most of these being ultimate methane releases from pulp and paper waste placed in landfills.
EMISSIONS ASSOCIATED WITH PURCHASED ELECTRICITYBoth pulp and paper mills and wood product manufacturing facilities use electricity. A significant fraction of the electricity used at pulp and paper mills is self-generated. Almost all of this self-generated electricity is produced in CHP systems (e.g. CEPI, 2008; AF&PA, 2008). In the most common CHP systems, the steam used by the mill for pulp and paper production is first passed through a turbine where it produces electricity. Some CHP systems also produce hot water or steam for district heating. The CHP process extracts far more usable energy from fuel than separate electricity and steam production systems do. Typical CHP system requires about 50 percent less fuel energy than separate systems producing the same amount of usable energy (ACEEE, 1999) (Figure 11).
FIGURE 11Comparison of conventional and CHP generation systems
Source: ACEEE, 1999.
95(Losses)
Conventionalgeneration
Powerststion fuel
(130)
Boilerfuel(59)
GRID
ElectricityElectricity
Heat
15(Losses)
9(Losses)
Heat
Combined heat and power
CHP
NEWBOILER
189
100
35
50

Impact of the global forest industry on atmospheric greenhouse gases22
IEA’s analysis of the pulp and paper industry in several countries found that CHP systems were supplying 20 to 60 percent of the electricity requirements for the industry (IEA, 2007c). This is especially significant considering that most of the fuel used in pulp and paper mill CHP systems is biomass, primarily pulping liquors that are burned to recover pulping chemicals as well as generating steam and electricity. In some situations, chemical pulp mills can generate enough energy from biomass to become net exporters of biomass-based electricity to the electricity grid.
In spite of the extensive reliance on biomass-driven CHP systems, most pulp and paper mills must purchase electricity. The emissions associated with these purchases (Scope 2 emissions under the WRI/WBCSD Greenhouse Gas Protocol) were estimated by first determining how much electricity is typically purchased. Information from the pulp and paper associations in Europe, the United States and Japan was examined to calculate the average electricity purchases per tonne of production in each of these regions. These regional estimates ranged from 0.44 to 0.59 MW per tonne, averaging 0.5 MW per tonne. Given the large amounts of production represented by these three regions, it seems reasonable to model the industry’s purchased electricity requirements on the average value for the three regions, 0.5 MW per tonne. National-level purchased electricity requirements were then estimated from FAO production statistics (FAO, 2007). Countries that cumulatively represent 91 percent of global production were selected, with the remaining 9 percent treated as a separate group. The emissions associated with these purchases were then calculated using country-specific electricity emission factors published by IEA (2007a). The detailed calculations are shown in Annex 1.
This approach produced an estimate of 106 million tonnes of CO2 associated with the global pulp and paper industry’s electricity purchases in 2007. This estimate is significantly smaller than an earlier estimate of 140 million tonnes of CO2 , primarily because it relies on country-level factors to estimate emissions from purchased electricity, whereas the earlier study did not attempt to provide this level of resolution for the many countries where industry associations lacked Scope 2 emissions estimates of their own (Miner and Perez-Garcia, 2007b).
Owing to a scarcity of information, it is more difficult to estimate global emissions related to purchased electricity used at wood products facilities. Purchased electricity factors were developed for sawnwood and wood-based panels from several sources, mostly focused on North American and European facilities (NCASI, 2008; ecoinvent, 2008; USDOE, 2009). For sawnwood, the factors from these three sources ranged from 0.07 to 0.09 MW per cubic metre, so a value of 0.08 MW per cubic metre was used in the calculations. For wood panels, the values varied widely, depending on the type of panel, and ranging from 0.1 to 0.35 MW per cubic metre. A weighted average factor of 0.2 MW per cubic metrewas derived, based on the global production of each panel type according to FAO data (FAO, 2007). National-level production data were obtained for the same countries used for pulp and paper, in this case representing 85 percent of sawnwood and 89 percent of wood-based panel production. The results were extrapolated to global production, and the same national-level electricity factors were used as for the pulp and paper sector.
This approach produced an estimate of 48.8 million tonnes of CO2 associated with the global wood product sector’s electricity purchases in 2007. This estimate is approximately the same as an earlier estimate of 40 million tonnes of CO2 per year (Miner and Perez-Garcia, 2007b).
Emissions associated with electricity purchases by final manufacturing operations (i.e. converting plants) were estimated at 38.7 million tonnes of CO2 equivalent per year, as described previously.
Combined, the pulp and paper and wood products sectors, including converting, are responsible for Scope 2 emissions of approximately 193 million tonnes of CO2 per year. This is approximately the same as an earlier estimate of 180 million tonnes, developed using different methods, as explained previously (Miner and Perez-Garcia, 2007b).

23
5. Other cradle-to-gate emissions from the forest products value chain
The cradle-to-gate portion of the forest products value chain includes several other sources of emissions. Because most of these sources of emissions are not owned or controlled by forest product companies (and because they are not due to purchases of electricity or steam), these emissions are mostly Scope 3, as defined under the WRI/WBCSD Greenhouse Gas Protocol.
EMISSIONS ASSOCIATED WITH WOOD PRODUCTIONIn addition to transport-related emissions (examined elsewhere in this report), there are several other potential sources of greenhouse gas emissions related to the production of wood: at a minimum, fossil fuel is used in thinning and harvesting operations; as forest management becomes more intensive, the opportunities for greenhouse gas impacts often increase; the use of fire as a forest management tool releases methane and nitrous oxide; the production of herbicides, pesticides and fertilizers requires energy, so is associated with upstream greenhouse gas emissions; and nitrogen-containing fertilizer can release nitrous oxide after application.
The International Finance Corporation (IFC, 2009) has developed generic factors representing different management intensities for use in its Forest Industry Carbon Assessment Tool (FICAT) (Table 3). These factors do not address all situations and are not appropriate for some practices. Nonetheless, they can be used for estimating global emissions from forest management. It was assumed that half of industrial roundwood was produced under Category 1 management, and that the remaining 50 percent was divided evenly among the other three categories. Industrial roundwood production in 2007 was obtained from FAO (FAO, 2007). From this, it was estimated that forest management activities result in emissions of 36.9 million tonnes of CO2 equivalent per year.
UPSTREAM EMISSIONS ASSOCIATED WITH NON-WOOD INPUTS AND FOSSILFUELSAlthough most of the raw material mass used in forest products manufacturing is wood fibre, other raw materials are also often used. These materials and fossil fuels are associated with their own upstream emissions. It is not universally accepted that these upstream emissions should be considered part of the forest products value chain, but they are included in this study for completeness. Earlier studies of the global forest products sector have not included these emissions (e.g. Miner and Perez-Garcia, 2007b; Subak, 1999).
TABLE 3 Greenhouse gas emission factors associated with forest management
Category Management practice Tonne CO2 equivalent/m3 harvested
1 Only harvesting and thinning 0.015
2 Harvesting plus burning for site preparation or undergrowth control
0.024
3 Harvesting plus fertilizer and herbicide use on the land 0.026
4 Harvesting plus burning, fertilizer and herbicide use 0.035
Source: NCASI, 2009.

Impact of the global forest industry on atmospheric greenhouse gases24
To estimate the upstream emissions associated with chemicals and additives, the FICAT factors were used (IFC, 2009). These factors reflect generic “recipes” for the chemicals and additives used to produce different forest products, and data from several life cycle databases. Factors for the major grades of paper tracked by FAO range from 30 to 200 kg of CO2 per tonne of product. The FICAT factors suggest that a reasonable value for wood panels is 200 kg of CO2 per tonne of product, equivalent to 50 to 200 kgof CO2 per cubic metre of product, depending on the type of wood panel. Sawnwood was assumed to have no upstream emissions associated with chemicals and additives (although this is not the case for preservative-treated wood). These factors were applied to the FAO production statistics for the respective products (FAO, 2007). Details of the calculations are explained in Annex 1.
The results of the calculations indicate that the upstream emissions associated with chemicals and additives used in the pulp and paper and wood products sectors are 34.9 and 22.4 million tonnes of CO2 equivalent per year, respectively, based on 2007 production. In total, these upstream emissions equal 57.3 million tonnes of CO2
equivalent per year. The upstream emissions associated with fossil fuels used in the global forest products sector can be estimated using:
IEA energy consumption data for Organisation for Economic Co-operation and Development (OECD) countries (IEA, 2006);FAO production statistics to extrapolate the IEA data to the rest of the globe (FAO, 2007);upstream emission factors from the United States life cycle database, modified for IFC’s FICAT (USDOE, 2009; IFC, 2009).
The results of the calculations, described in more detail in Annex 1, indicate that the upstream emissions associated with fossil fuel use in the pulp and paper sector totalled 30.5 million tonnes of CO2 equivalent in 2004, and those from the wood products sector 4.6 million tonnes of CO2 equivalent per year. Together, the upstream emissions associated with fossil fuels used by the forest products sector in 2004 therefore totalled 35.1 million tonnes of CO2 equivalent (Table 4).
EMISSIONS ASSOCIATED WITH TRANSPORTING RAW MATERIALS AND FUELSThe forest products value chain involves the shipment of large amounts of raw materials and products, both domestically and internationally. To estimate the emissions associated with the international transport of fibrous raw materials and products, FAO data were obtained for exporting countries representing 80 percent of global exports of each of industrial roundwood, sawnwood, wood-based panels, paper and paperboard, and recovered paper. For these countries, FAO data were also used to identify the major export destinations for each material (FAO, 2007). One-way transport distances and modes were approximated for each pairing of an exporting country and a major importing destination. The emissions associated with transport were estimated using emission factors from the WRI/WBCSD Greenhouse Gas Protocol calculation tools, as presented in documentation for the FICAT model (IFC, 2009), and then extrapolated
TABLE 4 Upstream emissions associated with fossil fuels and chemical inputs in manufacturing
Product Upstream emissions (tonnes CO2 equivalent/year)
Chemicals Fossil fuels Total
Paper and paperboard 34.9 30.5 65.4
Wood products 22.4 4.6 27
Total 57.3 35.1 92.4

Other cradle-to-gate emissions from the forest products value chain 25
to account for the remaining 20 percent of the material exported by countries not included in the calculations.
For each of the materials identified, the difference between global production and global exports was assumed to be transported domestically. This amounted to approximately 75 percent of the total production mass of the materials. The transport distances were assumed to be 100 km for industrial roundwood and 500 km for all other materials. Domestic transport was assumed to be by land.
Because land-based transport uses a combination of truck and train carriers, two sets of calculations were made. One assumed that most international and domestic land-based transport was by diesel truck, and the other that it was by diesel train. The average of these two values was used in the final estimates. To account for the transport of non-fibrous raw materials and fuels, the emissions associated with transport of fibrous raw materials were increased by 15 percent; various sources of information suggest that such an adjustment should be adequate (e.g. Diesen, 1998; Lofgren, 2005; Kline, 2004). In addition, it was assumed that the emissions associated with discarded paper are equal to half those associated with transporting recovered fibre. The detailed calculations are shown in Annex 1.
Cradle-to-gate emissions for transport of fibrous raw materials, non-fibrous raw materials and fuels are estimated to be 21 million tonnes of CO2 equivalent per year (Table 5). Of this, approximately 40 percent is related to domestic and 60 percent to international shipping. Emissions related to gate-to-customer (i.e. product) transport are 26.7 million tonnes of CO2 equivalent per year, with about 43 percent of these occurring domestically and 57 percent being associated with international shipments of products. Cradle-to-gate emissions are lower than gate-to-customer emissions because, although the quantities of products are smaller than those of raw materials, the shipping distances for fibrous raw materials are typically much shorter than those for finished products. Another 3.6 million tonnes of CO2 equivalent per year are assumed to be associated with transport of used paper to the end of the life cycle (half of the emissions associated with transporting product to customers).
In total, transport-related emissions are estimated to be 51.2 million tonnes of CO2
equivalent per year, of which approximately 60 percent is associated with international trade.An earlier study combined fibre procurement emissions with transport-related
emissions and estimated the total of these to be 70 million tonnes of CO2 equivalent per
TABLE 5 Transport-related emissions in the forest products industry value chain
Material Emissionsa
(million tonnes CO2 equivalent/year)
International trade Domestic consumption Total
Industrial roundwood 3.55 3.46 7.00
Market pulp 4.08 Not estimated 4.08
Recovered paper 3.89 3.28 7.17
Total cradle-to-gate associated with fibre 11.50 6.74 18.30
Total cradle-to-gate extrapolated to include non-fibrous raw materials and fuels 13.20 7.75 21.00
Sawnwood 4.47 3.54 8.01
Wood-based panels 3.45 1.98 5.44
Pulp and paper 7.30 5.92 13.20
Total gate-to-consumer 15.20 11.40 26.70
Consumer-to-grave (assumed to equal transport for recovered fibre) 1.94 1.64 3.58
Total cradle-to-grave 30.40 20.80 51.20
a Inconsistencies may reflect rounding.

Impact of the global forest industry on atmospheric greenhouse gases26
year (Miner and Perez-Garcia, 2007b). The current study estimates forest management-related emissions to be 36.9 million tonnes of CO2 per year. Adding this to the transport-related emissions estimated previously (51.2 million tonnes per year) yields a total of 88.1 million tonnes of CO2 equivalent per year, which is close to the earlier estimate derived using different methods.
27
6. Emissions from the gate-to-grave portion of the value chain
TRANSPORT OF PRODUCTS TO CONSUMERSAs already noted, gate-to-customer (i.e. product) transport-related emissions are estimated to be 26.7 million tonnes of CO2 equivalent per year, of which about 43 percent occurs domestically and 57 percent is associated with international shipments of products.
EMISSIONS ASSOCIATED WITH PRODUCT USEForest products are sometimes used as a component in final products that consume energy, and therefore release greenhouse gases (e.g. wood used in home construction). However, it is seldom the wood-derived component that consumes the energy or releases greenhouse gases. Although it may sometimes be possible to allocate a portion of a final product’s energy consumption to the wood-derived components it contains, this is seldom done, is often inappropriate, and is not possible for a global profile.
One type of forest product that is responsible for releasing greenhouse gases during use is the wood-derived fuels that are sold by the forest products industry for use elsewhere. When burned, these fuels release small amounts of methane and nitrous oxide. Significant quantities of wood-derived fuel by-products are sold by forest products companies, but almost all of these are used elsewhere in the forest products industry, so the emissions are included in the manufacturing-related emissions. Wood from industry-owned forests is increasingly being used for energy in other industries, especially for electricity production. However, the emissions of methane and nitrous oxide from all of the biomass burned in the forest products industry amount to only about 6 million tonnes of CO2 equivalent per year (as calculated previously). The emissions associated with burning wood from industry-owned forests at sources outside the forest products industry are therefore small enough to be ignored in this study.
EMISSIONS ASSOCIATED WITH TRANSPORTING USED PRODUCTS TO THE ENDOF THE LIFE CYCLEThe emissions generated by transporting used products to the end of the life cycle are assumed to be half of those associated with transporting products from mills to customers, or 3.58 million tonnes of CO2 equivalent per year.
EMISSIONS ASSOCIATED WITH THE END OF THE LIFE CYCLEAfter use, most forest products are recovered for recycling, burned for energy, or sent to landfills. Emissions associated with recycling are included in the manufacturing and transport elements of the footprint. The emissions associated with burning used products for energy are small, consisting only of the methane and nitrous oxide formed in the combustion process. Using the calculations associated with estimating carbon storage in forest products, and assuming that used forest products are burned if they are not recovered or sent to landfills, it is estimated that the burning of used products at the end of the life cycle releases about 3.0 million tonnes of CO2 equivalent per year. The calculations are shown in Annex 1.
The emissions of methane, a potent greenhouse gas, from used forest products in landfills are far more significant. To estimate these, it is first necessary to calculate

Impact of the global forest industry on atmospheric greenhouse gases28
the carbon stored in products in use and in landfills. These calculations identify the quantities of used products disposed in landfills that have the potential to generate methane (because the landfills are partly or completely anaerobic). The calculations employ the IPCC approach, in which the carbon in forest products located in anaerobic zones is partly stored, with the remainder decomposing into a mixture (50/50 by volume) of methane and biogenic CO2. Ten percent of the methane is assumed to oxidize as it migrates through the landfill. In addition, some landfills capture and burn the methane that they generate.
The fraction of waste under anaerobic conditions and the fraction of methane captured and burned are two very important variables in methane emission calculations, but few data on national practices are available, especially in developing countries. Most landfills in developed countries are designed to minimize the intrusion of water and oxygen, so are largely anaerobic. In developing countries, landfills tend to be shallow and unmanaged, allowing more oxygen and water to enter. IPCC divides landfills into five categories: managed-anaerobic, managed-semi-aerobic, unmanaged-shallow, unmanaged-deep, and uncategorized. A factor is assigned to each type of landfill, reflecting the extent of anaerobic conditions within it (IPCC, 2006). For this study, the landfill types for each major consuming country were based on 2008 per capita GDP (based on purchasing power parity [PPP]) published by the World Bank (World Bank, 2009). It was assumed that countries with per capita GDP of more than US$30 000 were using landfills of the two most anaerobic types (managed anaerobic and unmanaged deep). Countries with per capita GDP of less than US$10 000 were assumed to be using unmanaged shallow landfills, and the remaining countries were assumed to be using a combination of deep and shallow unmanaged landfills.
The values selected for capturing and burning methane were also based on per capita GDP. It was assumed that countries with per capita GDP of more than US$30 000 were capturing and burning 40 percent of the methane from decomposing forest products; those with per capita GDP of less than US$10 000 were assumed to be capturing none; and the remaining countries were assumed to be capturing and burning 10 percent. Details of the calculations are shown in Annex 1.
Based on the results of these calculations, products manufactured in 2007 and disposed of in landfills (rather than being recovered or burned for energy) are expected eventually to release 235 million tonnes of CO2 equivalent per year in methane. About 75 percent of this (176 million tonnes of CO2 equivalent per year) is due to the decomposition of paper and paper products, while the remainder is associated with wood products. This estimate is similar to that developed in an earlier study (250 million tonnes of CO2 equivalent per year), although the estimates were developed using different approaches (Miner and Perez-Garcia, 2007b).

29
7. Emissions avoided elsewhere in society owing to forest industry activities
The elements of the industry’s emissions profile already discussed involve movements of greenhouse gases to or from the atmosphere in the course of a year. They occur within the industry’s value chain and require no assumptions about alternative scenarios. However, the industry’s activities also influence societal emissions of greenhouse gases in other ways. These impacts often occur outside the industry’s value chain, and measuring them usually requires assumptions about the emissions that would occur in the absence of the industry’s activities.
Grouped under the general heading of “avoided emissions”, these impacts, although important, are generally understood to be more uncertain than those that occur within the industry’s value chain, because they require assumptions about what would occur in the absence of industry activity. In addition, their occurrence outside the industry’s value chain gives rise to questions about the extent to which they should be used to offset emissions that occur within the value chain.
Nonetheless, it is important to understand the types of societal impacts that are associated with various activities of the forest products industry. This review examines five types of impacts, some quantitatively and some qualitatively:
the methane emissions that would occur if the paper that is now recovered for recycling was sent to landfills;the fossil fuel-related emissions that would occur if the used products now being burned for energy were instead burned without energy recovery;the increased emissions from electricity producers that would occur if the forest products industry was not exporting low greenhouse gas intensity fuel to the grid;the avoided emissions (and opportunities for reducing societal emissions) associated with using wood-based building materials instead of non-wood materials;the importance of a market for wood as a means of encouraging landowners to keep land in forest.
METHANE EMISSIONS THAT WOULD OCCUR IF RECOVERED PAPER PRODUCTSWERE SENT TO LANDFILLSOne greenhouse gas related impact of recycling can be illustrated by estimating the methane emissions from landfills that would be associated with sending to landfills the paper that is currently recovered. This calculation is useful for understanding the importance of recycling, but the resulting value should not be viewed as an estimate of avoided emissions because the scenario being modelled (i.e. sending all used paper to landfills) is not likely to occur.
In addition, the calculation highlights only one aspect of the relationship between recycling and societal greenhouse gas emissions. Recycling has extremely complex effects on greenhouse gas emissions and carbon sequestration. Among the factors that have to be considered in estimating avoided emissions attributable to recycling are:
the methane from landfills that is avoided;the carbon storage in landfills that is avoided;the biomass energy that is precluded (i.e. recycled used products are not available for biomass energy);

Impact of the global forest industry on atmospheric greenhouse gases30
the difference in greenhouse gas intensity between virgin and recycled manufacturing;the differences in processing and transport requirements between virgin and recycled fibre;the impact of increased use of recovered fibre on forest carbon.
In the calculations of methane emissions associated with paper in landfills (Annex 1),it is estimated that globally the amounts of paper being recovered are about 1.7 times the amounts going to landfills. Accordingly, the additional methane that would be released if recovered paper were sent to landfills should be 1.7 times the amount estimated for the paper currently going to landfills, or approximately 300 million tonnes of CO2 equivalent per year. For all of the reasons noted above, however, the estimated impact of recycling on avoided landfill emissions should be regarded as illustrating the importance of recycling, and not as an estimate of avoided emissions.
BENEFITS OF BURNING NON-RECYCLABLE DISCARDED PRODUCTS AT THE ENDOF THE LIFE CYCLEAlthough IPCC and FAO data can be used to estimate the amounts of recovered forest products removed from the waste stream and the amounts of non-recovered material going to landfills, the methods used to manage the remaining used forest products are less well documented. For this study, it was assumed that in countries with per capita GDP of more than US$30 000 half of non-recovered forest products not going to landfills were being burned for energy. The remaining material in these countries, and all such material from other countries, was assumed to be going to other end-of-life systems (composting, burning without energy recovery, etc.). This approach yields an estimated 40 million tonnes of used forest products produced in 2007 that will be burned for energy, about evenly divided between paper and wood products. Assuming that this material has a heat content of 15.6 GJ per tonne (lower heating value, LHV) and that it displaces natural gas, and considering the differences in the combustion efficiencies for the different types of fuels, it is estimated that the use of this material as a source of fuel is currently avoiding the emission of 25.8 million tonnes of CO2 equivalent per year. This does not include situations where methane gas from decomposing forest products is captured from landfills and used as a source of biomass energy, displacing fossil fuels.
The magnitude of this number reveals the opportunity for reducing societal greenhouse gas emissions by diverting material from landfills to biomass energy applications. If the products made in 2007 that are expected to go to landfills were instead burned as a source of biomass energy to displace natural gas, the expected global benefit would be a reduction in greenhouse gas emissions of 135 million tonnes of CO2 equivalent per year (not considering the impacts on landfill methane emissions, or the offsetting impacts of burning landfill methane as biomass energy and of carbon storage).
IMPACTS OF THE FOREST INDUSTRY’S EXPORTS OF LOW GREENHOUSE GASINTENSITY ELECTRICITY AND STEAMPulp and paper making requires large amounts of steam. This steam is often used to produce electricity before being used in the pulp and paper making process (i.e. mills commonly use CHP systems). In some cases, the amount of electricity generated exceeds the mill’s demands, so the excess can be exported for societal use. For example, IEA indicates that modern market pulp mills generate an excess of 2 GJ of electricity per tonne of pulp (IEA, 2007c). The greenhouse gas intensity of this exported electricity is usually very low, both because it is generated in CHP systems and because biomass is often a large portion of the fuel used to produce it.
The societal greenhouse gas benefits of exported electricity vary greatly, depending on the greenhouse gas intensities of the exported electricity and of the electricity that

Emissions avoided elsewhere in society owing to forest industry activities 31
is assumed to be displaced from the grid. Using IEA’s estimate of 2 GJ of exported electricity per tonne of pulp, a 500 000 tonne per year pulp mill producing biomass-based electricity might accomplish avoided emissions of only 1 500 tonnes of CO2
equivalent per year in Norway, but more than 200 000 tonnes of CO2 equivalent per year in China, based on national average electricity emission factors (IEA, 2007a).
Owing to a lack of information about the amounts of electricity exported by the forest industry in countries around the world, it is not possible to derive a global estimate of the emissions avoided by these exports. However, it is clear that exports of low greenhouse gas intensity electricity can have large benefits, particularly where they displace high greenhouse gas intensity electricity.
SOCIETAL BENEFITS OF USING WOOD-BASED BUILDING MATERIALS INSTEADOF MORE GREENHOUSE GAS INTENSIVE ALTERNATIVESIn commerce, many different products can often fulfil the same function. If the impacts of these different choices on greenhouse gas emissions vary, societal emissions are affected when one product substitutes another. Forest products compete with other types of products in many situations, so there are an enormous number of potential substitution effects involving the forest products industry. It is therefore not possible to characterize substitution effects for the global industry, as there are too many potential product substitutions to examine. In recent decades, however, one substitution effect that is important to a large segment of the forest products industry has been examined in detail. This is the use of wood-based building materials as substitutes for non-wood alternatives, primarily concrete and steel. The substitution effect for housing construction has been especially well studied.
The findings of these studies have been varied, partly because of the different assumptions they make regarding effects on forest carbon and what happens to used products at the end of the life cycle (e.g. Upton, 2008; Gustavsson, 2006; Petersen, 2005). However, the overall conclusion of these studies has been remarkably consistent: in comparisons of housing structures designed to have similar energy demands for heating and cooling, wood-based materials have almost always been found to have lower life cycle greenhouse gas emissions than other materials. Reviews of this literature can be found in Upton (2008) and Sathre (2008), for example.
The energy required to heat and cool residential structures usually generates far more emissions than are generated from producing construction materials, transporting them and assembling the structure (although Nassen [2007] supplies evidence that many studies may be underestimating the importance of these pre-occupancy emissions). Because of the importance of heating and cooling-related emissions, comparisons of building materials must be based on structures with similar thermal performances. Many building codes help to ensure that houses built of different construction materials have similar thermal performances.
The literature suggests that differences in thermal performance may give rise to an exception to the general finding that wood-based building systems result in lower life cycle greenhouse gas emissions. This exception arises in climates where thermal mass is important to a structure’s thermal performance. Such situations are generally limited to arid regions where there is a large difference between day- and night-time temperatures and where the human comfort zone lies midway between the two (Upton, 2008). In these situations, it may be difficult for wood-based structures to match the thermal performance of construction materials with high thermal mass, such as concrete. However, the literature suggests that in most temperate, tropical and cold climates, wood-based construction systems will have lower life cycle greenhouse gas emissions.
Sathre (2008) recently reviewed 48 North American and European studies of the substitution effects associated with using wood-based building materials in place of alternatives. Data from 20 of these studies were used in a meta-analysis to develop an

Impact of the global forest industry on atmospheric greenhouse gases32
average factor describing substitution effects for wood-based building products. This analysis revealed that:
“The calculated displacement factors ranged from a low of -2.3 to a high of 15.0 [tonnes of carbon of emission reduction per tonne of carbon in wood product], with most lying in the range of 1.0 to 3.0. The average displacement factor value was 2.0, meaning that for each tonne of carbon in wood products substituted for non-wood products, an average greenhouse gas emission reduction of approximately 2 tonnes of carbon can be expected. In other units, this value corresponds to roughly 3.7 tonnes of CO2 equivalent emission reduction per tonne of dry wood used. This average number can be viewed as a reasonable estimate of the greenhouse gas mitigation efficiency of wood product use, over a range of product substitutes and analytical methodologies.”
Applying this average substitution factor to housing construction in the United States in 2006, McKeever (2009) suggests that the use of wood in housing in the United States avoided the emission of 135 million tonnes of CO2 equivalent per year. In the United States, wood-based housing accounts for more than 90 percent of total housing, but this share is lower in many other countries (Eriksson, 2009), implying significant opportunities for expanding the benefits of using wood in house construction. Based on information from several decades ago suggesting that approximately 40 percent of global wood products were used for housing construction (FAO, 1971), a global substitution effect of 483 million tonnes of CO2 equivalent can be estimated for 2007.
THE VALUE OF MARKETS FOR WOOD AS AN INCENTIVE FOR KEEPING LANDIN FORESTIn many places in the world, landowners have the opportunity to convert forest to other uses, to improve the economic returns from their land. Where these conversion pressures exist, the value of harvested wood can help to keep land in forest. This indirect effect of the forest industry’s activities is very important. For instance, if only 1 percent per year of industry-owned timberland in the United States was converted to non-forest uses, the result would be a transfer of carbon to the atmosphere equal to 90 million tonnes of CO2 equivalent per year, not including the soil carbon impacts (based on carbon data in Heath et al., 2010). Although it is impossible to calculate precisely the role of wood markets in keeping land in forest, the effect is clearly important.
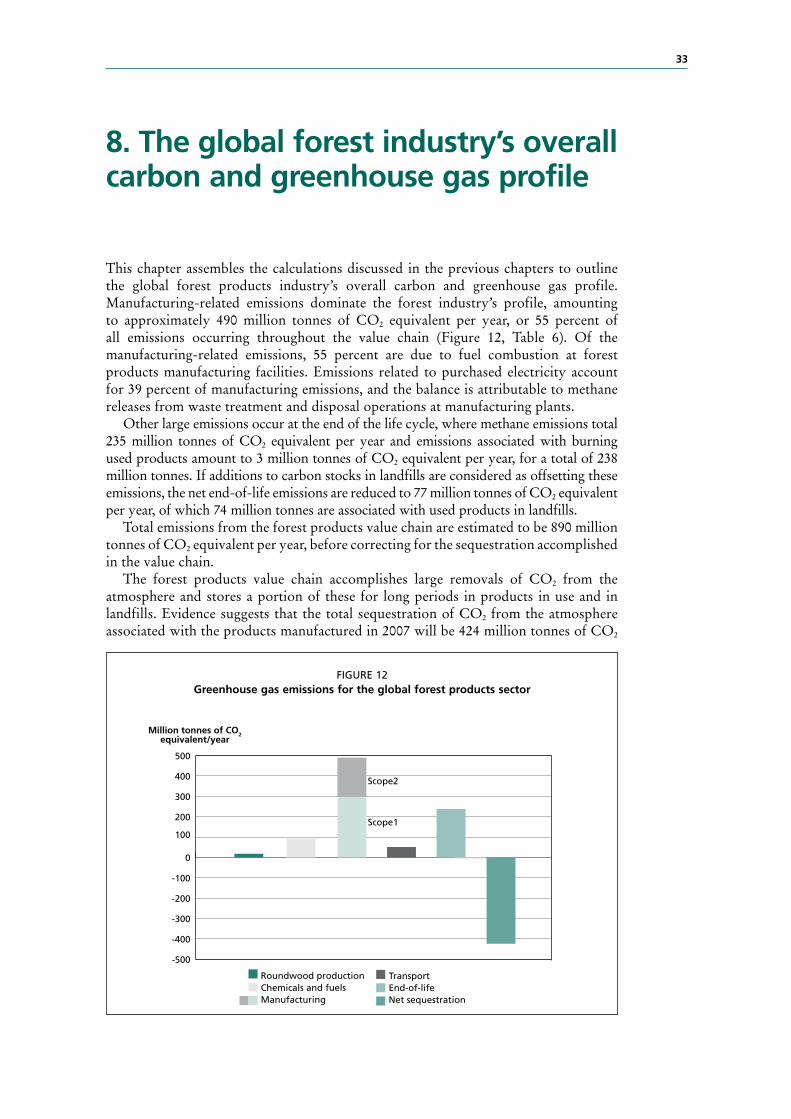
33
8. The global forest industry’s overall carbon and greenhouse gas profile
This chapter assembles the calculations discussed in the previous chapters to outline the global forest products industry’s overall carbon and greenhouse gas profile. Manufacturing-related emissions dominate the forest industry’s profile, amounting to approximately 490 million tonnes of CO2 equivalent per year, or 55 percent of all emissions occurring throughout the value chain (Figure 12, Table 6). Of the manufacturing-related emissions, 55 percent are due to fuel combustion at forest products manufacturing facilities. Emissions related to purchased electricity account for 39 percent of manufacturing emissions, and the balance is attributable to methane releases from waste treatment and disposal operations at manufacturing plants.
Other large emissions occur at the end of the life cycle, where methane emissions total 235 million tonnes of CO2 equivalent per year and emissions associated with burning used products amount to 3 million tonnes of CO2 equivalent per year, for a total of 238 million tonnes. If additions to carbon stocks in landfills are considered as offsetting these emissions, the net end-of-life emissions are reduced to 77 million tonnes of CO2 equivalent per year, of which 74 million tonnes are associated with used products in landfills.
Total emissions from the forest products value chain are estimated to be 890 million tonnes of CO2 equivalent per year, before correcting for the sequestration accomplished in the value chain.
The forest products value chain accomplishes large removals of CO2 from the atmosphere and stores a portion of these for long periods in products in use and in landfills. Evidence suggests that the total sequestration of CO2 from the atmosphere associated with the products manufactured in 2007 will be 424 million tonnes of CO2
FIGURE 12Greenhouse gas emissions for the global forest products sector
-500
-400
-300
-200
-100
0
100
200
300
400
500
Million tonnes of CO2equivalent/year
Roundwood productionChemicals and fuelsManufacturing
Scope2
Scope1
TransportEnd-of-lifeNet sequestration

Impact of the global forest industry on atmospheric greenhouse gases34
equivalent, enough to offset 86 percent of the emissions associated with manufacturing and almost half of total value chain emissions.
When sequestration is considered, the emissions from the forest products value chain are estimated to be 467 million tonnes of CO2 equivalent per year.
When examined separately, the pulp and paper sector’s profile is different from that of the wood products sector. The paper products value chain emissions, after adjusting for carbon sequestration, appear to be between 500 and 600 million tonnes of CO2 equivalent per year, while the wood products value chain appears to accomplish net sequestration of approximately 100 million tonnes of CO2 equivalent per year. However, separating the wood products and paper sectors overlooks the extent to which they are connected via economics and physical flows. For instance, in many
TABLE 6 Estimated emissions and sequestration in the global forest products industry value chain, circa 2006/2007
Process Emissions(million tonnes CO2 equivalent/ year)
Direct emissions from manufacturing (Scope 1)Fuel combustion: pulp and paper 207.0Fuel combustion: wood products 25.6Fuel combustion: converting 38.7Methane from manufacturing waste 26.2Total 297
Emissions associated with electricity purchases (Scope 2)Pulp and paper 106.0Wood products 48.8Converting 38.7Total 193
Wood production 18.2
Upstream emissions associated with chemicals and fossil fuelsNon-fibre inputs: pulp and paper 34.9Non-fibre inputs: wood products 22.4Fossil fuels: pulp and paper 30.5Fossil fuels: wood products 4.6Total 92.4
TransportCradle-to-gate 21.0Gate-to-consumer 26.7Consumer-to-grave 3.6Total 51.2
Product useEmissions 0Effect of additions to carbon stocks in paper products in use -20Effect of additions to carbon stocks in wood products in use -243Total -263
End-of-lifeBurning used products 3.0Paper-derived methane 176.0Effect of additions to carbon stocks in paper products in landfills -67.0Wood-derived methane 58.6Effect of additions to carbon stocks in wood products in landfills -93.6Total 77.1
Note: Data are subject to rounding.Total cradle-to-gate emissions = 622 million tonnes of CO2 equivalent per year (not considering sequestration).Total cradle-to-grave emissions = 890 million tonnes of CO2 equivalent per year (not considering sequestration).Value chain sequestration = net uptake of 424 million tonnes of CO2 equivalent per year, based on estimates of the accumulation of carbon stocks in product pools and an assumption that globally, regeneration and regrowth are keeping carbon stocks stable in the forests the industry relies on.Net value chain emissions, cradle-to-grave = 467 million tonnes of CO2 equivalent per year.

The global forest industry’s overall carbon and greenhouse gas profile 35
regions, by-products from wood product operations comprise a sizeable fraction of the fibre input for pulp and paper production.
The general features of this profile are similar to those of an earlier global profile by Miner and Perez-Garcia (2007b) and generally consistent with an earlier study by the International Institute for Environment and Development (IIED) (Subak, 1999). After correcting for sequestration, however, the net emissions are larger in this study. The first cause of this increase is that the present study uses a far smaller estimate of carbon storage in landfills, based on a more refined method for identifying regions that are unlikely to have the types of landfills that store carbon. The second major cause of this study’s higher net emissions is the inclusion of several categories of emissions that were not previously included (e.g. upstream emissions associated with fossil fuels and non-fibre inputs in manufacturing). Each of these changes increased net emissions by approximately 100 million tonnes of CO2 equivalent per year compared with the earlier study.
The indirect benefits occurring elsewhere in society and attributable to the forest products value chain are summarized in Table 7. Although the uncertainty associated with these estimates is large, the effects are clearly significant and in many cases could be expanded.
TABLE 7 Summary of selected avoided emissions associated with the forest products value chain
Avoided emission Global impacts (for illustrative purposes)
(million tonnes CO2 equivalent/year)
Comments
Due to recyclingNet releases of greenhouse gases from landfills that would occur if paper recovered in 2007 went into landfills instead (emissions minus carbon storage)
300 Recovery and reuse of used fibre has many more effects on greenhouse gases than avoided methane from landfills
Due to burning used productsEmissions from fossil fuel (natural gas) combustion that do not occur because forest products are used as a source of biomass energy
25.8 If the products made in 2007 that are expected to be sent to landfill were instead burned for energy, the expected global benefit would be a reduction in greenhouse gas emissions of at least 135 million tonnes of CO2
equivalent per year
Due to exports of electricityEmissions from electricity production that do not occur because of exports of low-emissions-intensity electricity from pulp, paper and paperboard mills
Not possible to develop a global estimate
Highly variable, depending on source of displaced electricity. Biomass-based electricity exported from a single mill can avoid the generation of several hundred thousand tonnes of CO2
per year from coal-based electricity generation
Due to substituting wood for non-wood materials in housing constructionNet benefit of using wood-based systems for housing construction in 2007
483 Estimated benefits depend on many factors, including assumptions about forest carbon stocks’ response and end-of-life practices. Where wood-based construction is not common, there are large opportunities for increasing these benefits
Due to providing a reason for keeping land in forestCarbon not lost to the atmosphere because land is kept in forest to supply the forest products industry
Not possible to develop a global estimate
Although an estimate is not possible, the impact is significant: If only 1% per year of industry-owned timberland in the United States was converted to non-forest uses, the result would be a transfer of carbon to the atmosphere equal to 90 million tonnes of CO2
equivalent per year, not including soil carbon impacts


37
9. The potential for forest-based materials to displace fossil fuels
Currently, biomass supplies 10.6 percent of global energy demand. However, developing countries rely far more on biomass for energy, with some using it to meet 50 to 90 percent of their energy demand, mostly for cooking and space heating (FAO, 2008; IEA, 2007b). Industry uses biomass to meet about 10 percent of its energy requirements globally, but almost all of this use is concentrated in the forest products industry, with the wood products and pulp and paper sectors deriving 61 and 48 percent, respectively, of their energy needs from biomass (IEA, 2006). In 2000, the global capacity for generating electricity from biomass was 40 GW, representing just over 1 percent of global generation capacity (FAO, 2008; IEA, 2002). Biofuels account for only about 1.5 percent of transport fuel use worldwide (IEA, 2007b), implying that there are significant opportunities for increasing the use of biomass for energy, especially outside the forest products industry.
IEA (2007b) estimates that by 2050, an additional 40 to 1 100 EJ of biomass energy could be available globally, with the likely range being 200 to 400 EJ (Table 8). This would be approximately four to eight times the current global use of biomass energy, estimated at 45 ± 10 EJ.
TABLE 8Potential biomass supply in 2050
Biomass category Main assumptions and remarks Energy potential from biomass by 2050
(EJ)
Energy farming on current agricultural land
Potential land surplus: 0–4 Gha (average: 1–2 Gha). A large surplus requires structural adaptation towards more efficient agricultural production systems. If this is not feasible, the bioenergy potential could be reduced to zero. On average, higher yields are likely from better soil quality: 8–12 dry tonnes per hectare per year is assumed.
0–700(average: 100–300)
Biomass production on marginal lands
Globally, a maximum of 1.7 Gha could be involved. Low productivity of 2–5 dry tonnes per hectare per year. The net supplies could be low owing to poor economics or competition with food production.
<60–110
Residues from agriculture
Potential depends on yield-to-product ratios, the total agricultural land and the type of production system. Extensive production systems require reuse of residues for maintaining soil fertility. Intensive systems allow higher utilization rates of residues.
15–70
Forest residues The sustainable energy potential of the world’s forests is unclear – some natural forests are protected. Low value: includes limitations related to logistics and strict standards for removals of forest material. High value: technical potential. Figures include processing residues.
30–150
Dung Use of dried dung. Low estimate based on current global use. High estimate: technical potential. Utilization (collection) in the longer term is uncertain.
5–55
Organic wastes Estimated from literature values. Strongly dependent on economic development, consumption and the use of biomaterials. Figures include the organic fraction of municipal solid waste and waste wood. Higher values possible from more intensive use of biomaterials.
5–50
Combined potential Most pessimistic scenario: no land available for energy farming; utilization of residues only. Most optimistic scenario: intensive agriculture concentrated on better-quality soils. In between: average potential in a world aiming for large-scale deployment of bioenergy.
40–1 100(average: 200–400)
Source: IEA, 2007b.

Impact of the global forest industry on atmospheric greenhouse gases38
IEA estimates that forest residues, including processing residues, are capable of providing 30 to 150 EJ of additional biomass energy by 2050. IPCC estimates that biomass from forestry can contribute 12 to 74 EJ per year to energy consumption, with a mitigation potential equal to about 0.4 to 4.4 billion tonnes of CO2 per year. With total global biomass energy consumption currently at 45 EJ, both of these estimates suggest the likelihood of a major increase in the demand for forest-derived biomass.
This has significant implications for companies owning forest and/or using wood. For forest owners, biomass energy provides an important new market and additional incentives for enhancing forest productivity and recovering unused biomass. For wood users, it represents competition for raw material. For instance, it has been estimated that 380 million cubic metres of wood will be needed to meet the EU’s renewable energy commitments, an amount equal to the total currently used by the European forest products industry (de Galembert, 2008).
It is clear that meeting the need for additional forest biomass will require continued improvements in technologies for improving forest productivity. Figure 13 shows the productivity improvements in pine plantations in the southeastern United States as an example. With continued investment in forest productivity research, such gains can continue.
The efficient use of biomass to replace fossil fuels is an important component of efforts to reduce the accumulation of atmospheric CO2. At present, approximately half of harvested wood is used for energy in low-efficiency heating or cooking applications in developing countries. Improving the efficiency of wood use in these applications will be important but challenging (FAO, 2008; 2007b). Also important will be the development of new technologies that use biomass efficiently in industrial and commercial applications. A number of biomass-conversion technologies are currently under study or being commercially deployed (IEA, 2007b; FAO, 2008).
FIGURE 13Factors in increased pine plantation productivity in the southeastern United States
Rauscher, 2004.
Clonal and biotech
Fertilization
Site preparation
Tree improvement
Weed control
Planting
Natural stand
1940 1950 1960 1970 1980 1990 2000 2010
Volume at harvest (tonnes/ha)
500
450
400
350
300
250
200
150
100
50
0
Establishment period

39
10. IPCC’s findings regarding the mitigation potential of forests
In the section on mitigation in IPCC’s Fourth Assessment Report, the value of forests in climate change mitigation was summarized as follows:
“In the long term, a sustainable forest management strategy aimed at maintaining or increasing forest carbon stocks, while producing an annual sustained yield of timber, fibre or energy from the forest, will generate the largest sustained mitigation benefit.” (IPCC, 2007b)
(In this mitigation report, IPCC’s discussion of sustainable forest management generally refers to management practices in forests used for production of wood or non-wood forest products.)
The basis for this important summary statement warrants closer examination. This chapter examines the scientific bases for the disaggregated components of the statement.
“IN THE LONG TERM…”The processes that govern the cycling of carbon between the atmosphere and the biosphere operate over time scales ranging from seconds to centuries. Forest-based mitigation activities designed to achieve short-term benefits may, therefore, not be helpful in the medium to long term. One important reason for this is that there are limits to the amount of carbon that can be stored in the forest: i.e. the benefit saturates. The saturation point and the time it takes to reach it depend on many factors, including the starting conditions, the type of forest and the growing conditions (e.g. Marland, 1997).
In the short term, maximum atmospheric CO2 reductions may sometimes be accomplished by preservation, allowing carbon to accumulate in forests. At some point, however, the accumulation of carbon in the forest saturates and the net removals of CO2 from the atmosphere cease. In the long term, using sustainably produced forest biomass as a substitute for carbon-intensive products and fossil fuels provides greater permanent reductions in atmospheric CO2 than preservation does. The time required for long-term effects to become more important than short-term ones is highly variable. The optimum approach in a particular situation depends not only on the forest’s response to various management strategies, but also on the size of the substitution effect (e.g. Marland, 1997; Schlamadinger, 1996).
“…A SUSTAINABLE FOREST MANAGEMENT STRATEGY…”Sustainable forest management is at the heart of forest-based mitigation activities in production forests. The value of forests in climate change mitigation is primarily related to their ability to remove and store carbon from the atmosphere, and this ability is a function of the health of the forest. This report’s earlier discussion of the role of sustainable forest management bears repeating here.
The core objective of all sustainable management programmes in production forests is to achieve a long-term balance between harvesting and regrowth. The operational guidelines for PEFC stipulate that “forest management practices should safeguard the quantity and quality of the forest resources in the medium and long term by balancing harvesting and growth rates” (PEFC, 2007a; 2007b; MCPFE, 1998). A key principle of

Impact of the global forest industry on atmospheric greenhouse gases40
the FSC Standard is that “the rate of harvest of forest products shall not exceed levels which can be permanently sustained” (FSC, 2002). Although certification programmes are not always explicit about the connections between sustainable management and carbon in production forests, the practical effect of maintaining a balance between harvesting and regrowth is to keep long-term carbon stocks stable in managed forests.
The benefits of sustainable management of production forests are clear when examining the forest carbon stocks in the regions with the largest amounts of certified forest. For example, in industry-owned timberland in the United States, forest carbon stocks are essentially stable (Heath et al., 2010). In Canada, there is very large year-to-year variability in forest carbon stocks, due primarily to fires and insect damage. As a result, forest carbon stocks drop in some years. On average, however, forest carbon stocks in Canada’s managed forest grew during the period 1990 to 2005 (NRC, 2007). The empirical evidence therefore supports the conceptual link between sustainable forest management and stable or increasing forest carbon stocks.
“…AIMED AT MAINTAINING OR INCREASING FOREST CARBON STOCKS…”The net benefits of any forest-based mitigation activity reflect both the impacts in the forest and the carbon storage and substitution effects accomplished elsewhere. If the mitigation activity reduces forest carbon stocks, this reduction must be netted against any benefits that the activity may accomplish. If the activity increases forest carbon stocks, the increase can be added to the activity’s other carbon benefits.
As already noted, sustainable management activities in production forests are a critical element in maintaining forest carbon stocks. In addition to the benefits of regeneration and regrowth, such management can reduce the risk of catastrophic carbon losses due to fire (e.g. Lippke, 2008).
Where sustainable forest management involves converting forest type, the impact on forest carbon stocks (positive or negative) should be accounted for when assessing the overall benefits of forest-based mitigation activities (e.g. Kurz, 1998).
“…WHILE PRODUCING AN ANNUAL SUSTAINED YIELD OF TIMBER, FIBRE ORENERGY FROM THE FOREST…”The wood removed from sustainably managed forests can have various carbon-related benefits. Only part of the carbon removed from the atmosphere in the forest is returned to the atmosphere, because some of it remains stored in forest products. Some forest products, notably wood-based building materials and biomass burned for energy, can reduce society’s use of fossil fuels. The ability to produce these benefits continuously, via sustainable forest management, is a key feature of forest-based mitigation.
The benefits are significant. As estimated previously, the use of wood-based building materials may be avoiding global greenhouse gas emissions of 483 million tonnes of CO2 equivalent per year, via substitution effects. During use, the long-term storage of carbon in these wood-based building materials is equivalent to removing an additional 243 million tonnes of CO2 from the atmosphere per year. Burning used products at the end of the life cycle avoids the emission of more than 25 million tonnes of CO2
equivalent per year, with an opportunity to increase this to 135 million tonnes by diverting material from landfills. IPCC estimates that forest biomass-derived energy could reduce global emissions by 400 million to 4.4 billion tonnes of CO2 equivalent per year. These benefits can occur and continue only if forests are used to produce “an annual sustained yield of timber, fibre or energy”.
“…WILL GENERATE THE LARGEST SUSTAINED MITIGATION BENEFIT.”For climate change mitigation, the optimal use of any plot of forest land depends on the specific conditions that apply to that land and the products it produces. Nonetheless,

41IPCC’s findings regarding the mitigation potential of forests
the greatest long-term benefits are obtained when forest carbon stocks are maintained or increased while the forest continues to produce products that directly or indirectly reduce societal greenhouse gas emissions.
The scientific justification for IPCC’s summary statement is sound, and has been reaffirmed by a body of research stretching back to at least the mid-1990s (Marland, 1997; Schlamadinger, 1996).


43
11. Key findings
In 2006, the forest industry (roundwood production, pulp and paper, and wood processing) contributed approximately US$468 billion annually to the global economy – approximately 1 percent of global economic activity – and provided employment for 13.7 million people.
In 2007, approximately 3.6 billion cubic metres of roundwood were removed from the world’s forests. Over one-half (53 percent) of this was used as fuelwood, 90 percent of which is used in developing countries, primarily for heating and cooking. The remaining 47 percent of roundwood harvests were for industrial purposes. Sixty-nine percent of the harvesting of industrial roundwood takes place in North America and Europe. Global production of wood and paper products amounts to approximately 710 million tonnes per year, about 54 percent of which is paper and paperboard products.
Certification of sustainable forest management is widespread in the developed world and growing in the developing world. By 2008, almost 8 percent of the world’s forests and 13 percent of the world’s managed forests had been third-party certified. Approximately one-quarter of global industrial roundwood comes from certified forests, most of which are located in North America and Europe. The amount of certified forest is growing globally by about 10 percent per year. Certification is less common in developing countries. Less than 2 percent of forest in Asia, Africa and Latin America is certified. Eighty-two percent of certified forests in the tropics are privately owned, and most of these are in large management units.
In addition to wood, the forest products industry uses large amounts of recovered fibre. Approximately 50 percent of the paper and paperboard produced globally is recovered, and most of this is recycled to make paper and paperboard.
This study has characterized the complex connections between the forest products industry value chain and the global carbon cycle. These connections include:
carbon sequestration and storage in forests and forest products;emissions from forest products manufacturing operations;emissions that occur upstream of manufacturing;emissions from product transport and use;emissions associated with end-of-life management;emissions avoided elsewhere in society because of forest industry activities.
Although it is not possible to quantify the effect of the forest products industry’s activities on global forest ecosystem carbon stocks, the evidence suggests that in many places corporate forest owners and forest product companies are engaged in practices that will increase forest ecosystem carbon stocks or help avoid their declines. Key among these practices are the establishment of planted forests, primarily on areas that were not previously forested, and adherence to sustainable management practices in production forests (and increasingly, chain-of-custody programmes). Experiences in North America and the European Union, the regions with most of the world’s certified forests, offer insights into the effectiveness of sustainable management of production forests. Even though these regions account for more than two-thirds of the world’s global industrial roundwood production, their forest carbon stocks are generally stable or increasing.
Sustainable forest management is key to maintaining forest carbon stocks. Although maintenance of carbon stocks is not addressed directly in the main programmes for certifying sustainable forest management, it is inherent in their requirements. The operational guidelines for PEFC, the largest certification programme, stipulate that

Impact of the global forest industry on atmospheric greenhouse gases44
“forest management practices should safeguard the quantity and quality of the forest resources in the medium and long term by balancing harvesting and growth rates…”. A key principle of the FSC Standard, the second largest certification programme, is that “the rate of harvest of forest products shall not exceed levels which can be permanently sustained”.
Total greenhouse gas emissions from the forest products value chain are estimated to be 890 million tonnes CO2 equivalent per year, not considering the sequestration accomplished in the value chain. Of these, 33 percent are from manufacturing facilities, 22 percent are associated with purchased electricity, 10 percent are related to production of non-fibre inputs to manufacturing, 2 percent are related to wood production, 6 percent are transport related and 27 percent are associated with the end of the product’s life, almost entirely methane emissions from landfills receiving used products.
The forest products value chain accomplishes large net removals of CO2 from the atmosphere as a result of uptake in forests and storage in forests, products in use and products in landfills. Net sequestration of CO2 from the atmosphere into the forest products industry value chain in 2007 was 424 million tonnes CO2 equivalent, enough to offset 86 percent of the greenhouse gas emissions associated with manufacturing of forest products and almost one-half of the total emissions of the value chain. After considering sequestration, the net greenhouse gas emissions from the forest products value chain are 467 million tonnes CO2 equivalent per year.
Between 2002 and 2007, the direct emissions intensity (direct greenhouse gas emissions per tonne of product) of pulp and paper mills was reduced by 13 percent. Over the same period, the direct emissions intensity from wood product facilities fell by 16 percent. The emissions intensity of the forest industry would be higher if biomass fuels were not used so extensively – they comprise over one-half of the fuel used by the industry.
The pulp and paper and wood products sectors are closely connected via wood flows, ownership of facilities and land, and economics. As a result, the carbon footprints of these sectors are also closely connected, and attempts to influence one sector are likely to have impact on the other. Looked at separately, however, the pulp and paper sector is generally characterized by higher emissions and less sequestration than the wood products sector.
A number of aspects of the forest industry’s activities are not adequately captured by looking only at the emissions and sequestration accomplished in the value chain. On an annual basis, the use of wood-based building materials avoids, via substitution effects, emissions of 483 million tonnes of CO2 equivalent per year. Also, by displacing fossil fuels, burning used products at the end of the life cycle avoids the emission of over 25 million tonnes of CO2 equivalent per year. These avoided emissions could be increased to 135 million tonnes CO2 equivalent per year by diverting material from landfills. IPCC estimates that energy derived from forest biomass could reduce global emissions by 400 million to 4.4 billion tonnes CO2 equivalent per year. The industry can help society reach this goal through its forest biotechnology research and its forest biomass infrastructure. The market for wood gives landowners a reason to keep land in forest, helping to avoid large-scale losses of carbon to the atmosphere via land use change.

45
References
ACEEE. 1999. Combined heat and power: capturing wasted energy, by R.N. Elliott and M. Spurr. Available at: www.aceee.org/pubs/ie983.htm (retrieved 27 August 2009)
AF&PA. 2007. 2007 Annual statistics of paper, paperboard and wood pulp. Washington, DC, USA, American Forest and Paper Institute.
AF&PA. 2008. AF&PA Environmental, Health & Safety Verification Program – Biennial
Report 2008. Washington, DC.Australia Department of Climate Change. 2009. Australia’s national greenhouse accounts:
National Inventory Report 2007. Canberra, Australia.Axel Springer Verlag, Stora & Canfor. 1998. A life cycle assessment of the production of a
daily newspaper and a weekly magazine. Hamburg, Germany.BSI. 2008. PAS 2050: Specification for the assessment of the life cycle greenhouse gas
emissions of goods and services. London, UK, British Standards Institution.CAR. 2009. Forest project protocol, final draft, version 3.0, 22 June 2009. Los Angeles,
California, USA, Climate Action Reserve.CEPI. 2007. Framework for the development of carbon footprints for paper and board
products. Brussels, Belgium, Confederation of European Paper Industries.CEPI. 2008. Confederation of European Paper Industries sustainability report 2007.
Brussels, Belgium.Cole, R.J. 1999. Energy and greenhouse gas emissions associated with the construction of
alternative structural systems. Building and Environment, 34(3): 335–348.de Galembert, B. 2008. Bio-energy and wood mobilisation. In Solid biomass mobilisation
for the forest-based industries and the bio-energy sector, pp. 20–24. Brussels, Belgium, CEPI.
Diesen, M. 1998. Economics of the pulp and paper industry. Papermaking Science and Technology Series Book 1. Helsinki, Finland, Fapet Oy.
ecoinvent. 2008. ecoinvent lifecycle database. Dubendorf, Switzerland, Swiss Centre for Life Cycle Inventories, Swiss Federal Laboratories for Materials Testing and Research. Available at: www.ecoinvent.org/database
Environment Canada. 2009. National Inventory Report 1990–2007: greenhouse gases and
sinks in Canada. Ottawa, Canada.Eriksson, L.L. 2009. Climate implications of increased wood use in the construction sector –
towards an integrated modeling framework. Umea, Sweden, Sveriges lantbruksuniversitet, Institutionen för skoglig resurshushållning.
FAO. 1971. World consultation on the use of wood in housing – Section 2: Supply of wood materials for housing. Unasylva, 101-102-103: 28–52.
FAO. 2001. Global Forest Resources Assessment 2000: Main report. FAO Forestry Paper 140. Rome.
FAO. 2005. The potential for fast-growing commercial forest plantations to supply high
value roundwood, by R. James & A. Del Lungo. Planted Forests and Trees Working Paper 33. Rome.
FAO. 2006a. Global Forest Resources Assessment 2005 – Progress towards sustainable forest
management. FAO Forestry Paper 147. Rome.FAO. 2006b. Global planted forests thematic study: results and analysis. Planted Forests and
Trees Working Paper 38. Rome.FAO. 2007. FAOSTAT database – forestry. Available at: faostat.fao.org/site/626/default.
aspx (retrieved 28 July 2009)FAO. 2008. Forests and energy. FAO Forestry Paper 154. Rome.

Impact of the global forest industry on atmospheric greenhouse gases46
FAO. 2009. State of the World’s Forests 2009. Rome.FEFCO. 2006. European database for corrugated board life cycle studies 2006. Brussels,
European Federation of Corrugated Board Producers.Field, C.B. 1998. Primary production for the biosphere: integrating terrestrial and oceanic
components. Science, 281: 237.FSC. 2002. FSC principles and criteria for forest stewardship, FSC-STD-01-001 (Version
4-0) Amended 2002. Bonn, Germany, Forest Stewardship Council.Gower, S.T., McKeon-Ruediger, A., Reitter, A., Bradley, M., Refkin, D.J., Tollefson, T.,
Souba, F.J. Jr, Taup, A., Embury-Williams, L., Schiavone, S., Weinbauer, J., Janetos, A.C. & Jarvis, R. 2006. Following the paper trail – the impact of magazine and dimensional
lumber production on greenhouse gas emissions: a case study. Washington, DC, USA, H. John Heinz III Center for Science, Economics, and the Environment.
Gustavsson, L. 2006. Variability in energy and carbon dioxide balances of wood and concrete building materials. Building and Environment, 41: 940–951.
Heath, L., Skog, K., Smith, J., Miner, R., Upton, B., Unwin, J. & Maltby, V. 2010. Greenhouse gas and carbon profile of the U.S. forest products industry. Journal of
Environmental Science and Technology. (In press) ICFPA. 2005. Global forest industry leaders condemn illegal logging, call for increased
global forest certification. Vancouver, Canada, International Council of Forest and Paper Associations. Available at: www.icfpa.org/media_center/press_releases/050603_e_summit.php (retrieved 6 August 2009)
IEA. 2002. World energy outlook 2002. Paris, France, International Energy Agency.IEA. 2006. Energy statistics of OECD countries: 2003–2004. Paris, France.IEA. 2007a. CO2 emissions from fuel combustion. Paris, France.IEA. 2007b. Potential contribution of bioenergy to the world’s future energy demand. Paris,
France.IEA. 2007c. Tracking industrial energy efficiency and CO2 emissions. Paris, France.IFC. 2009. The Forest Industry Carbon Assessment Tool (FICAT). Washington, DC, USA,
International Finance Corporation Available at: www.ficatmodel.org (retrieved 27 August 2009)
IPCC. 2000. Land use, land-use change and forestry. A special report of the IPCC.
Cambridge, UK, Cambridge University Press.IPCC. 2006. IPCC guidelines for national greenhouse gas inventories. Hayama, Kanagawa,
Japan, Institute for Global Environmental Strategies.IPCC. 2007a. Couplings between changes in the climate system and biogeochemistry.
In Climate change 2007: The physical science basis. Contribution of Working Group I
to the Fourth Assessment Report of the Intergovernmental Panel on Climate Change.
Cambridge, UK & New York, USA, Cambridge University Press.IPCC. 2007b. Forestry. In Climate Change 2007: Mitigation. Contribution of Working
Group III to the Fourth Assessment Report of the Intergovernmental Panel on Climate
Change. Cambridge, UK & New York, USA, Cambridge University Press.ITTO. 2008. Developing forest certification: towards increasing comparability and acceptance
of forest certification systems worldwide. ITTO Technical Series No. 29. Yokohama, Japan, International Tropical Timber Organization.
Kauppi, P.J. 2006. Returning forests analyzed with the forest identity. Washington, DC, USA, National Academy of Sciences of the United States of America.
Kline, E. 2004. CORRIM: Phase I final report – Module E – Southeast oriented strandboard
production. Seattle, Washington, USA, Consortium for Research on Renewable Industrial Materials (CORRIM).
Kurz, W.S. 1998. Carbon budget implications of the transition from natural to managed disturbance regimes in forest landscapes. Mitigation and Adaptation Strategies for Global
Change, 2: 405–421.Lippke, B. 2008. Impacts of thinning intensity and implementation schedules on fire, carbon

47References
storage, and economics. In Woody biomass utilization: challenges and opportunities, pp. 47–59. Madison, Wisconsin, USA, Forest Products Society.
Lofgren, P. 2005. Lifecycle inventory for kraft sack paper. Brussels, Belgium, Eurosac, Eurokraft & CEPI.
Marland, G. 1997. Forests for carbon sequestration or fossil fuel substitution. Biomass and
Bioenergy, 13(6): 389–397.McKeever, D. 2009. Estimated annual timber products consumption in major end uses
in the United States, 1950–2006. General Technical Report FPL-GTR-181. Madison, Wisconsin, USA, United States Forest Service, Forest Products Laboratory.
MCPFE. 1998. Annex 2 of Resolution L2 – Pan-European operational level guidelines for sustainable forest management. In Third Ministerial Conference on the Protection of
Forests in Europe. Lisbon, Portugal, Ministerial Conference on the Protection of Forests in Europe.
MCPFE. 2007. State of Europe’s Forests 2007. Warsaw, Poland.Millennium Ecosystem Assessment. 2005. Ecosystems and human well-being, Vol. 2,
Scenarios. Washington, DC, USA, Island Press.Miner, R. & Perez-Garcia, J. 2007a. The greenhouse gas and carbon profile of the global
forest products industry. Special Report 07-02. Research Triangle Park, North Carolina, USA, NCASI.
Miner, R. & Perez-Garcia, J. 2007b. The greenhouse gas and carbon profile of the global forest products industry. Forest Products Journal, 57(10): 80–90.
Nassen, J.J. 2007. Direct and indirect energy use and carbon emissions in the production phase of buildings: An input–output analysis. Energy, 32: 1593–1602.
NCASI. 2008. Monitoring progress toward the AF&PA climate VISION commitment:
Report on progress 2000 to 2006. Research Triangle Park, North Carolina, USA, National Council for Air and Stream Improvement.
NCASI. 2009. Model documentation for the Forest Industry Carbon Assessment Tool
(FICAT). Research Triangle Park, North Carolina.NRC. 2007. Is Canada’s forest a carbon sink or source? Ottawa, Canada, Natural Resources
Canada.PEFC. 2007a. Endorsement and mutual recognition of national schemes and their
review – Annex 7. Geneva, Switzerland, Programme for the Endorsement of Forest Certification.
PEFC. 2007b. PEFC Council technical document. Geneva, Switzerland.Petersen, A. 2005. Environmental and economic impacts of substitution between wood
products and alternative materials: a review of micro-level analyses from Norway and Sweden. Forest Policy and Economics, 7: 249–259.
PwC. 2007. Global forest, paper and packaging industry survey 2007 – survey of 2006
results. London, UK, PriceWaterhouseCooper.Rauscher, M. 2004. Southern forest science: past, present, and future. Southern Research
Station, General Technical Report SRS-75. Ashville, North Carolina, United States Forest Service Southern Research Station.
Sabine, C.L., Heimann, M., Artaxo, P., Bakker, D.C.E., Chen, C.T.A., Field, C.B., Gruber, N., Le Quéré, C., Prinn, R., Richey, J.E., Lankao, P.R., Sathaye, J.A. & Valentini, R.2004. Current status and past trends of the carbon cycle. In C.B. Field & M.R. Raupach,The global carbon cycle: integrating humans, climate, and the natural world, pp. 17–44. Washington, DC, USA, Island Press.
Sathre, R.J. 2008. A synthesis of research on wood products and greenhouse gas impacts.
Technical Report No. TR-19. Vancouver, British Colombia, Canada, FPInnovations – Forintek Division.
Schlamadinger, B. 1996. Carbon implications of forest management strategies. In M. Price, ed. Forest ecosystems: forest management and the global carbon cycle, pp. 217–232. Berlin, Germany, Springer-Verlag.

Impact of the global forest industry on atmospheric greenhouse gases48
SFI. 2004. Sustainable forestry initiative 2005–2009 Standard. Washington, DC, USA, Sustainable Forestry Initiative.
Subak, S. 1999. The contribution of the paper cycle to global warming. Mitigation and
Adaptation for Global Change, 4(2): 113–135.Tiedemann, A. 2001. Life cycle assessments for graphic papers. Berlin, Germany, Federal
Environmental Agency (Umweltbundesamt).UNECE/FAO. 2008. Forest Products Annual Market Review, 2007–2008. Geneva,
Switzerland, United Nations Economic Commission for Europe & FAO.Upton, B.R. 2008. The greenhouse gas and energy impacts of using wood instead of
alternatives in residential construction in the United States. Biomass and Bioenergy, (32):1–10.
USDOE. 2009. US life cycle inventory database. Washington, DC, USA, United States Department of Energy, National Renewable Energy Laboratory. Available at: www.nrel.gov/lci/database (accessed 10 April 2010)
USEPA. 2006. Solid waste management and greenhouse gases – a life cycle assessment of
emissions and sinks, 3rd edition. Washington, DC, USA, United States Environmental Protection Agency.
USEPA. 2009. Inventory of US greenhouse gas emissions and sinks: 1990–2007. Washington, DC, USA.
Uusivuori, J.E. 2002. Population, income and ecological conditions as determinants of forest area variation in the tropics. Global Environmental Change, 12(4): 313–323.
WBCSD. 2007a. Membership principles and responsibilities. Geneva, Switzerland, World Business Council for Sustainable Development, Sustainable Forest Products Industry Working Group.
WBCSD. 2007b. The sustainable forest products industry; carbon and climate change – key
messages for policy makers. Geneva, Switzerland.WBCSD. 2009. Recommendations for government negotiators to effectively include
harvested wood products within the UN Framework Convention on Climate Change
(UNFCCC). Geneva, Switzerland. WBCSD/WRI. 2007. Sustainable procurement of wood and paper-based products: an
introduction. Geneva, Switzerland, WBCSD & World Resources Institute.Wegner, H. 2009. Carbon footprint LCA for National Geographic Magazine. Toronto,
Ontario, Canada, Gravure Association of America.World Bank. 2009. Gross national income per capita 2008, Atlas method and PPP. In World
development indicators. Washington, DC, USA.Zhang, Y.M. 2009. Global pattern of NPP to GPP ratio derived from MODIS data: effects
of ecysystem type, geographical location and climate. Global Ecology Biogeography, 18:280–290.

49
Annex 1
Calculations
CARBON STORAGE IN PAPER PRODUCTS IN USE AND IN LANDFILLSThe amount of paper stored in paper products was calculated using the PAS 2050 approach in which the footprint of forest products is credited with the weighted average amount of carbon stored over a 100-year period (BSI, 2008). Using IPCC’s first order model, and half-lives for the time-in-use of forest products (two years for paper) (IPCC, 2006), the 100-year weighted average for the carbon storage in paper is 2.885 percent of the original biomass carbon.
The countries responsible for 90 percent of global paper and paperboard consumption were identified by adding each country’s imports to its production, and subtracting its exports (FAO, 2007) (Table A-1).
Each country’s consumption was multiplied by 2.885 percent to determine the amount remaining in use (Table A-2) , which also shows the amounts going to landfill in each country. These estimates were calculated by subtracting the amount remaining in use from each country’s consumption, and assuming that the remainder was recycled or sent for end-of-life management. The amounts of paper recovered for recycling were taken from FAOSTAT (FAO, 2007) and subtracted from these remainders, to yield estimates of the amounts destined for end-of-life management at solid waste disposal sites or landfills. This was assumed to be the same as the fraction of municipal solid waste destined for landfills in each country, as reported in IPCC’s 2006 national inventory guidelines (IPCC, 2006).
To estimate the amount of carbon stored in landfills, the quantities going to landfill were multiplied by the carbon content, assumed to be 50 percent. Carbon storage was assumed to be limited to the non-degradable fraction of the carbon. Because biomass carbon in forest products is non-degradable only under anaerobic conditions, it was necessary to calculate the fraction of waste in each country that was disposed in anaerobic conditions. In general, highly engineered landfills in developed countries are more anaerobic than unmanaged landfills in developing countries. IPCC’s methane correction factors (MCFs) give an estimate of the fractions of waste held under anaerobic conditions in a number of different landfill types (Table A-3).
Based on the values in Table A-3, it was assumed that countries with per capita GDP (on a purchasing power parity [PPP] basis) of more than US$30 000 would have an MCF value of 0.9; those with per capita GDP of less than US$10 000 would have an MCF of 0.4; and those with per capita GDP of between US$10 000 and US$30 000would have an MCF of 0.6. From this, the amount of carbon in disposed paper and paperboard products destined for anaerobic landfills was estimated for each country.
To estimate the fraction of non-degradable anaerobic carbon, the IPCC default value of 50 percent was used (IPCC, 2006). The amount of non-degradable carbon was then converted to CO2 equivalent (Table A-4).
Note that data in the tables are subject to rounding, which results in some minor inconsistencies.

Impact of the global forest industry on atmospheric greenhouse gases50
TABLE A-1Countries responsible for 90 percent of paper and paperboard consumption
Country Per capita GDP(PPP basis)
(US$)
Production 2007
(‘000 tonnes)
Imports 2007(‘000 tonnes)
Exports 2007(‘000 tonnes)
Consumption 2007
(‘000 tonnes)
% of global consumption
Argentina 14 020 1 545 872 155 2 262 0.6
Australia 34 040 3 192 1 490 684 3 998 1.0
Austria 37 680 5 199 1 328 4 268 2 259 0.6
Belgium 34 760 1 897 3 957 3 298 2 556 0.7
Brazil 10 070 5 836 1 046 2 590 4 293 1.1
Canada 36 220 18 113 2 839 13 131 7 821 2.0
China 6 020 78 026 7 820 7 253 78 594 20.5
France 34 400 9 871 6 360 5 098 11 133 2.9
Germany 35 940 23 172 9 376 11 028 21 519 5.6
India 2 960 4 183 1 381 299 5 265 1.4
Indonesia 3 830 7 223 385 3 718 3 890 1.0
Italy 30 250 10 112 5 295 3 513 11 894 3.1
Japan 35 220 28 930 1 664 1 667 28 927 7.6
Korea, Republic of 28 120 10 932 844 3 066 8 710 2.3
Malaysia 13 740 1 062 2 228 275 3 015 0.8
Mexico 14 270 5 594 3 335 386 8 543 2.2
Netherlands 41 670 3 224 3 519 3 106 3 637 1.0
Poland 17 310 2 992 2 838 1 553 4 277 1.1
Russian Federation 15 630 7 559 1 462 2 512 6 509 1.7
South Africa 9 780 3 033 527 944 2 616 0.7
Spain 31 130 6 714 5 878 2 737 9 855 2.6
Sweden 38 180 11 902 1 056 10 649 2 309 0.6
Switzerland 46 460 1 536 958 761 1 733 0.5
Thailand 5 990 4 484 751 984 4 251 1.1
Turkey 13 770 1 643 2 495 196 3 942 1.0
United Kingdom 36 130 5 284 7 883 970 12 197 3.2
United States 46 970 83 826 14 964 10 972 87 818 22.9
Viet Nam 2 700 1 309 648 24 1 933 0.5
Sources: World Bank, 2009 (GDP); FAO, 2007.

Annex 1: Calculations 51
TABLE A-2Calculation of the carbon in paper remaining in use and in discards to landfills
Country % waste sent to landfill after recovery 2000 (from IPCC, 2006)
Remaining in usea
(‘000 tonnes)Recovered paper
(‘000 tonnes)Discardsb
(‘000 tonnes)Discards to landfill
(‘000 tonnes)
Argentina 59 65 943 1 253 739
Australia 100 115 3 032 851 851
Austria 30 65 1 539 655 196
Belgium 17 74 2 295 187 32
Brazil 80 124 3 642 527 421
Canada 71 226 2 851 4 744 3 368
China 97 2 268 31 324 45 002 43 652
France 43 321 5 947 4 865 2 092
Germany 30 621 15 746 5 153 1 546
India 70 152 850 4 263 2 984
Indonesia 80 112 1 163 2 615 2 092
Italy 70 343 5 580 5 971 4 180
Japan 25 835 22 837 5 255 1 314
Korea, Republic of 42 251 7 998 461 193
Malaysia 70 87 1 112 1 816 1 271
Mexico 49 247 4 302 3 995 1 957
Netherlands 11 105 2 307 1 225 135
Poland 98 123 1 550 2 603 2 551
Russian Federation 71 188 2 100 4 221 2 997
South Africa 90 75 923 1 617 1 456
Spain 68 284 5 678 3 893 2 647
Sweden 23 67 1 598 644 148
Switzerland 100 50 1 324 359 359
Thailand 80 123 1 708 2 421 1 936
Turkey 99 114 1 016 2 812 2 784
United Kingdom 82 352 8 617 3 228 2 647
United States 55 2 534 46 431 38 853 21 369
Viet Nam 60 56 77 1 800 1 080
Total from above 9 976 106 999
Extrapolated to global consumption 11 042 118 426
Converted to tonnes of CO2 equivalent, assuming 50% carbon
20 243
a Fraction remaining in use = 0.02885.b Consumption minus recovered minus remaining in use.
TABLE A-3IPCC’s methane correction factors
Type of site MCF Comments
Managed: anaerobic 1.0
Managed: semi-aerobic 0.5
Unmanaged: deep (> 5 m) 0.8 Also applies to sites with a high water table
Unmanaged: shallow (< 5 m) 0.4
Uncategorized solid waste disposal sites 0.6
Source: IPCC, 2006.

Impact of the global forest industry on atmospheric greenhouse gases52
TABLE A-4Calculation of carbon stored in paper and paperboard products in landfills
Country Carbon to landfillsa
(‘000 tonnes)
IPCC MCF(fraction
anaerobic)
Carbon in anaerobic zones
of landfills(‘000 tonnes)
Carbon remaining after degradationb
(‘000 tonnes)
Carbon storage(‘000 tonnes CO2
equivalent)
Argentina 370 0.6 222 111 407
Australia 425 0.9 383 191 702
Austria 98 0.9 88 44 162
Belgium 16 0.9 14 7 26
Brazil 211 0.6 126 63 232
Canada 1 684 0.9 1 516 758 2 779
China 21 826 0.4 8 730 4 365 16 006
France 1 046 0.9 941 471 1 726
Germany 773 0.9 696 348 1 275
India 1 492 0.4 597 298 1 094
Indonesia 1 046 0.4 418 209 767
Italy 2 090 0.9 1 881 940 3 448
Japan 657 0.9 591 296 1 084
Korea, Republic of 97 0.6 58 29 106
Malaysia 635 0.6 381 191 699
Mexico 979 0.6 587 294 1 077
Netherlands 67 0.9 61 30 111
Poland 1 276 0.6 765 383 1 403
Russian Federation 1 499 0.6 899 450 1 648
South Africa 728 0.4 291 146 534
Spain 1 323 0.9 1 191 596 2 184
Sweden 74 0.9 67 33 122
Switzerland 179 0.9 161 81 296
Thailand 968 0.4 387 194 710
Turkey 1 392 0.6 835 418 1 531
United Kingdom 1 324 0.9 1 191 596 2 184
United States 10 685 0.9 9 616 4 808 17 630
Viet Nam 540 0.4 216 108 396
Total from above 60 339
Extrapolated to world 67 043
a Carbon content = 50 percent.b Assuming 50 percent of carbon in anaerobic zones is non-degradable under anaerobic conditions.
Annex 1: Calculations 53
CARBON STORAGE IN WOOD PRODUCTS IN USE AND IN LANDFILLSThe amount of carbon stored in wood products in use was also calculated using the PAS 2050 approach, which credits the footprint of forest products with the weighted average amount of carbon stored over a 100-year period (BSI, 2008). Using IPCC’s first order model and half-lives for the time-in-use of forest products (30 years for wood products) (IPCC, 2006), the 100-year weighted average for the carbon storage in wood products is 38.987 percent of the original biomass carbon.
The countries responsible for 90 percent of global wood product consumption (Table A-5) were identified by adding each country’s imports to its production, and subtracting its exports (FAO, 2007). Cubic metres were converted to tonnes using separate conversion factors for sawnwood and wood panels. Both factors represent weighted average conversion factors, which for sawnwood were weighted by the global production of coniferous and non-coniferous wood, and for panels by the global production of veneer, plywood, particleboard and fibreboard.
The consumption of each country was multiplied by 39.987 percent to determine the amount remaining in use (Table A-6). The amount going to landfill in each country was estimated by subtracting the amount remaining in use from each country’s consumption, and the remainder was assumed to be recycled or sent to end-of-life management (landfills). It was assumed that 30 percent of this wood was recovered for recycling, and the rest was destined for end-of-life management. For each country, the fraction of discarded wood (after recovery for recycling) destined for landfills was assumed to be the same as the fraction of municipal solid waste destined for landfills, as reported in IPCC’s 2006 national inventory guidelines (IPCC, 2006).
To estimate the amount of carbon stored in landfills, the quantities going to landfill were multiplied by the carbon content, assumed to be 50 percent. Carbon storage was assumed to be limited to the non-degradable fraction of the carbon. Because biomass carbon in forest products is non-degradable only under anaerobic conditions, it was necessary to calculate the fraction of waste in each country that was disposed in anaerobic conditions. In general, highly engineered landfills in developed countries are more anaerobic than unmanaged landfills in developing countries. IPCC’s MCFs give an estimate of the fractions of waste held under anaerobic conditions in a number of different landfill types, as shown in Table A-3.
Again, it was assumed that countries with per capita GDP of more than US$30 000would have an MCF value of 0.9; those with per capita GDP of less than US$10 000would have an MCF of 0.4; and those with per capita GDP of between US$10 000 and US$30 000 would have an MCF of 0.6. From this, the amount of carbon in discarded wood products destined for anaerobic landfills was estimated for each country.
To estimate the non-degradable fraction of the anaerobic carbon, it was necessary to know the fraction of carbon in wood products that does not degrade under anaerobic environments. The IPCC default value is 50 percent (IPCC, 2006), but information from other sources indicates that this value significantly overstates the degradation of wood products in anaerobic landfills. Studies by Barlaz (summarized in USEPA, 2006; IFC, 2009) suggest that 80 percent of the biomass carbon in wood products will not degrade under anaerobic conditions, and this figure was used for the calculations in Table A-6. The amount of non-degradable carbon was then converted into CO2
equivalent (Table A-7).
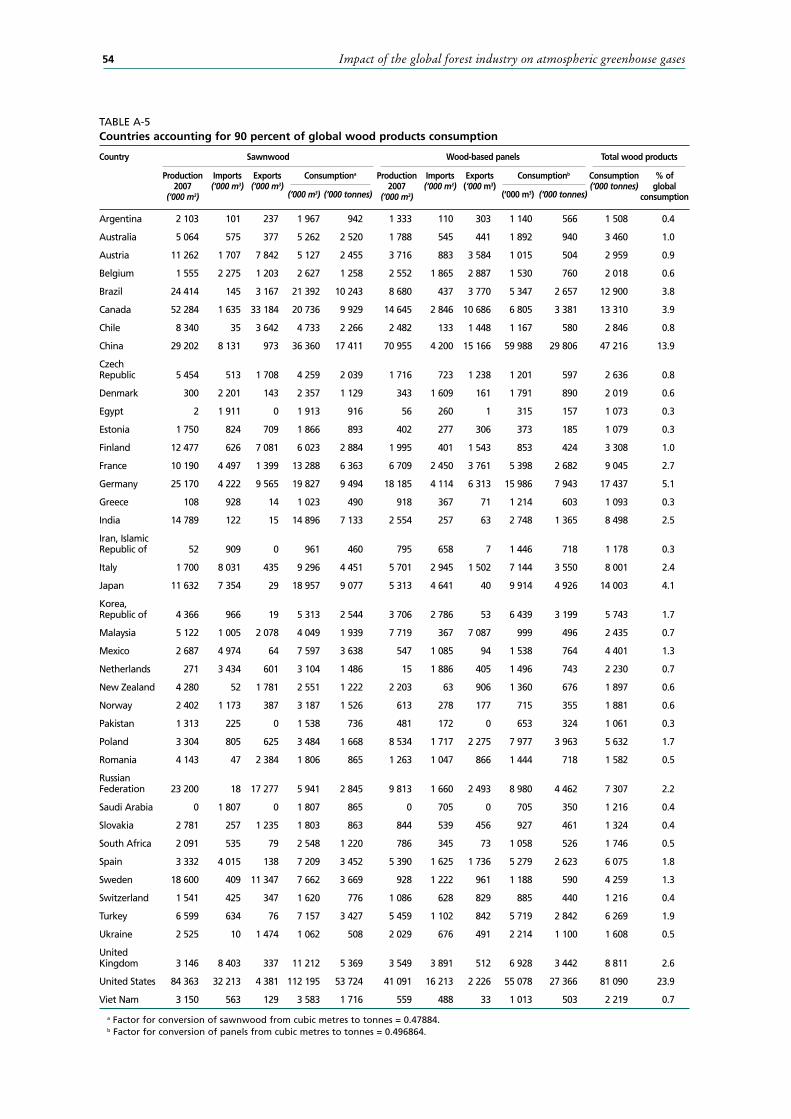
Impact of the global forest industry on atmospheric greenhouse gases54
TABLE A-5Countries accounting for 90 percent of global wood products consumption
Country Sawnwood Wood-based panels Total wood products
Production2007
(‘000 m3)
Imports(‘000 m3)
Exports(‘000 m3)
Consumptiona Production2007
(‘000 m3)
Imports(‘000 m3)
Exports (‘000 m3)
Consumptionb Consumption(‘000 tonnes)
% of global
consumption(‘000 m3) (‘000 tonnes) (‘000 m3) (‘000 tonnes)
Argentina 2 103 101 237 1 967 942 1 333 110 303 1 140 566 1 508 0.4
Australia 5 064 575 377 5 262 2 520 1 788 545 441 1 892 940 3 460 1.0
Austria 11 262 1 707 7 842 5 127 2 455 3 716 883 3 584 1 015 504 2 959 0.9
Belgium 1 555 2 275 1 203 2 627 1 258 2 552 1 865 2 887 1 530 760 2 018 0.6
Brazil 24 414 145 3 167 21 392 10 243 8 680 437 3 770 5 347 2 657 12 900 3.8
Canada 52 284 1 635 33 184 20 736 9 929 14 645 2 846 10 686 6 805 3 381 13 310 3.9
Chile 8 340 35 3 642 4 733 2 266 2 482 133 1 448 1 167 580 2 846 0.8
China 29 202 8 131 973 36 360 17 411 70 955 4 200 15 166 59 988 29 806 47 216 13.9
Czech Republic 5 454 513 1 708 4 259 2 039 1 716 723 1 238 1 201 597 2 636 0.8
Denmark 300 2 201 143 2 357 1 129 343 1 609 161 1 791 890 2 019 0.6
Egypt 2 1 911 0 1 913 916 56 260 1 315 157 1 073 0.3
Estonia 1 750 824 709 1 866 893 402 277 306 373 185 1 079 0.3
Finland 12 477 626 7 081 6 023 2 884 1 995 401 1 543 853 424 3 308 1.0
France 10 190 4 497 1 399 13 288 6 363 6 709 2 450 3 761 5 398 2 682 9 045 2.7
Germany 25 170 4 222 9 565 19 827 9 494 18 185 4 114 6 313 15 986 7 943 17 437 5.1
Greece 108 928 14 1 023 490 918 367 71 1 214 603 1 093 0.3
India 14 789 122 15 14 896 7 133 2 554 257 63 2 748 1 365 8 498 2.5
Iran, Islamic Republic of 52 909 0 961 460 795 658 7 1 446 718 1 178 0.3
Italy 1 700 8 031 435 9 296 4 451 5 701 2 945 1 502 7 144 3 550 8 001 2.4
Japan 11 632 7 354 29 18 957 9 077 5 313 4 641 40 9 914 4 926 14 003 4.1
Korea, Republic of 4 366 966 19 5 313 2 544 3 706 2 786 53 6 439 3 199 5 743 1.7
Malaysia 5 122 1 005 2 078 4 049 1 939 7 719 367 7 087 999 496 2 435 0.7
Mexico 2 687 4 974 64 7 597 3 638 547 1 085 94 1 538 764 4 401 1.3
Netherlands 271 3 434 601 3 104 1 486 15 1 886 405 1 496 743 2 230 0.7
New Zealand 4 280 52 1 781 2 551 1 222 2 203 63 906 1 360 676 1 897 0.6
Norway 2 402 1 173 387 3 187 1 526 613 278 177 715 355 1 881 0.6
Pakistan 1 313 225 0 1 538 736 481 172 0 653 324 1 061 0.3
Poland 3 304 805 625 3 484 1 668 8 534 1 717 2 275 7 977 3 963 5 632 1.7
Romania 4 143 47 2 384 1 806 865 1 263 1 047 866 1 444 718 1 582 0.5
Russian Federation 23 200 18 17 277 5 941 2 845 9 813 1 660 2 493 8 980 4 462 7 307 2.2
Saudi Arabia 0 1 807 0 1 807 865 0 705 0 705 350 1 216 0.4
Slovakia 2 781 257 1 235 1 803 863 844 539 456 927 461 1 324 0.4
South Africa 2 091 535 79 2 548 1 220 786 345 73 1 058 526 1 746 0.5
Spain 3 332 4 015 138 7 209 3 452 5 390 1 625 1 736 5 279 2 623 6 075 1.8
Sweden 18 600 409 11 347 7 662 3 669 928 1 222 961 1 188 590 4 259 1.3
Switzerland 1 541 425 347 1 620 776 1 086 628 829 885 440 1 216 0.4
Turkey 6 599 634 76 7 157 3 427 5 459 1 102 842 5 719 2 842 6 269 1.9
Ukraine 2 525 10 1 474 1 062 508 2 029 676 491 2 214 1 100 1 608 0.5
United Kingdom 3 146 8 403 337 11 212 5 369 3 549 3 891 512 6 928 3 442 8 811 2.6
United States 84 363 32 213 4 381 112 195 53 724 41 091 16 213 2 226 55 078 27 366 81 090 23.9
Viet Nam 3 150 563 129 3 583 1 716 559 488 33 1 013 503 2 219 0.7
a Factor for conversion of sawnwood from cubic metres to tonnes = 0.47884.b Factor for conversion of panels from cubic metres to tonnes = 0.496864.

Annex 1: Calculations 55
TABLE A-6Calculation of carbon stored in wood products in use and in discards to landfills
Country Per capita GDP PPP
2008(US$)
Consumption2007
(tonnes)
% municipal solid waste sent to landfill
after recovery2000a
Remainingin useb
(tonnes)
Recovered wood waste
2007c
Discardsd Discards to landfill
Argentina 14 020 1 508 59 588 276 644 380
Australia 34 040 3 460 100 1 349 633 1 478 1 478
Austria 37 680 2 959 30 1 154 542 1 264 379
Belgium 34 760 2 018 17 787 369 862 147
Brazil 10 070 12 900 80 5 029 2 361 5 509 4 408
Canada 36 220 13 310 71 5 189 2 436 5 685 4 036
Chile 13 270 2 846 40 1 110 521 1 216 486
China 6 020 47 216 97 18 408 8 642 20 166 19 561
Czech Republic 22 790 2 636 75 1 028 483 1 126 844
Denmark 37 280 2 019 10 787 369 862 86
Egypt 5 460 1 073 70 418 196 458 321
Estonia 19 280 1 079 98 421 197 461 452
Finland 35 660 3 308 61 1 290 605 1 413 862
France 34 400 9 045 43 3 526 1 656 3 863 1 661
Germany 35 940 17 437 30 6 798 3 192 7 447 2 234
Greece 28 470 1 093 91 426 200 467 425
India 2 960 8 498 70 3 313 1 555 3 629 2 541
Iran, Islamic Republic of 10 840 1 178 100 459 216 503 503
Italy 30 250 8 001 70 3 119 1 465 3 417 2 392
Japan 35 220 14 003 25 5 459 2 563 5 981 1 495
Korea, Republic of 28 120 5 743 42 2 239 1 051 2 453 1 030
Malaysia 13 740 2 435 70 949 446 1 040 728
Mexico 14 270 4 401 49 1 716 806 1 880 921
Netherlands 41 670 2 230 11 869 408 952 105
New Zealand 25 090 1 897 70 740 347 810 567
Norway 58 500 1 881 55 733 344 803 442
Pakistan 2 700 1 061 100 414 194 453 453
Poland 17 310 5 632 98 2 196 1 031 2 405 2 357
Romania 13 500 1 582 1 617 290 676 7
Russian Federation 15 630 7 307 71 2 849 1 337 3 121 2 216
Saudi Arabia 22 950 1 216 100 474 223 519 519
Slovakia 21 300 1 324 100 516 242 565 565
South Africa 9 780 1 746 90 681 320 746 671
Spain 31 130 6 075 68 2 369 1 112 2 595 1 764
Sweden 38 180 4 259 23 1 661 780 1 819 418
Switzerland 46 460 1 216 100 474 222 519 519
Turkey 13 770 6 269 99 2 444 1 147 2 677 2 651
Ukraine 7 210 1 608 90 627 294 687 618
United Kingdom 36 130 8 811 82 3 435 1 613 3 763 3 086
United States 46 970 81 090 55 31 614 14 843 34 633 19 048
Viet Nam 2 700 2 219 60 865 406 948 569
Total product from above 119 140 Total from above 83 945
Extrapolated to world 132 378 Extrapolated to world 93 026
Converted to tonnes of CO2 equivalent, assuming 50% carbon 242 693
a From IPCC, 2006.b Fraction remaining in use = 0.38987. c Fraction assumed diverted from disposal = 0.30.d Consumption minus recovered minus remaining in use.

Impact of the global forest industry on atmospheric greenhouse gases56
TABLE A-7Calculation of carbon stored in wood products in landfills
Country Discards to landfills
(‘000 tonnes)
Carbon to landfillsa
(‘000 tonnes)
IPCC MCF (fraction
anaerobic)
Carbon in anaerobic zones
of landfills(‘000 tonnes)
Carbonremaining after
degradationb
(‘000 tonnes)
Carbon storage(‘000 tonnes
CO2 equivalent)
Argentina 380 190 0.6 114 91 334
Australia 1 478 739 0.9 665 532 1 950
Austria 379 190 0.9 171 137 501
Belgium 147 73 0.9 66 53 193
Brazil 4 408 2 204 0.6 1 322 1 058 3 879
Canada 4 036 2 018 0.9 1 816 1 453 5 328
Chile 486 243 0.6 146 117 428
China 19 561 9 780 0.4 3 912 3 130 11 476
Czech Republic 844 422 0.6 253 203 743
Denmark 86 43 0.9 39 31 114
Egypt 321 160 0.4 64 51 188
Estonia 452 226 0.6 135 108 397
Finland 862 431 0.9 388 310 1 138
France 1 661 831 0.9 747 598 2 193
Germany 2 234 1 117 0.9 1 005 804 2 949
Greece 425 212 0.6 127 102 374
India 2 541 1 270 0.4 508 406 1 490
Iran, Islamic Republic of 503 252 0.6 151 121 443
Italy 2 392 1 196 0.9 1 076 861 3 157
Japan 1 495 748 0.9 673 538 1 974
Korea, Republic of 1 030 515 0.6 309 247 907
Malaysia 728 364 0.6 218 175 641
Mexico 921 461 0.6 276 221 811
Netherlands 105 52 0.9 47 38 138
New Zealand 567 284 0.6 170 136 499
Norway 442 221 0.9 199 159 583
Pakistan 453 226 0.4 91 72 266
Poland 2 357 1 179 0.6 707 566 2 074
Romania 7 3 0.6 2 2 6
Russian Federation 2 216 1 108 0.6 665 532 1 950
Saudi Arabia 519 260 0.6 156 125 457
Slovakia 565 283 0.6 170 136 498
South Africa 671 336 0.4 134 107 394
Spain 1 764 882 0.9 794 635 2 329
Sweden 418 209 0.9 188 151 552
Switzerland 519 260 0.9 234 187 685
Turkey 2 651 1 325 0.6 795 636 2 333
Ukraine 618 309 0.4 124 99 363
United Kingdom 3 086 1 543 0.9 1 389 1 111 4 073
United States 19 048 9 524 0.9 8 572 6 857 25 143
Viet Nam 569 284 0.4 114 91 334
Total from above 84 283
Extrapolated to world 93 648
a Assuming carbon content of discards is 50 percent.b Assuming 80 percent of carbon in anaerobic zones is non-degradable under anaerobic conditions.
Annex 1: Calculations 57
EMISSIONS FROM MANUFACTURINGAn NCASI survey of ICFPA member associations provided emissions data for 2008 or the most recent estimates available. Information was obtained from countries representing 64 percent of global paper and paperboard production. The remaining countries, except China, were assumed to have the average emissions intensity (emissions per tonne of production) of these countries.
Because China is a very large producer of paper and paperboard, a more refined approach was used to estimate emissions from Chinese paper and paperboard producers. IEA has published information that allows the structure and emissions intensity of the Chinese paper industry to be compared with those of other countries (IEA, 2007b). This analysis indicates that the United States and China are reasonably similar with respect to both the weighted average expectation for best-available technology (which accounts for the structural differences among the industries in different countries) and the energy efficiency indicator for heat. Both the Chinese and United States industries also rely more heavily on coal than the industries in many other countries do. Emissions from the Chinese industry were therefore estimated by assuming that Chinese production had the same greenhouse gas intensity as United States production (rather than assuming the greenhouse gas intensity for the global industry).
To check the resulting global estimate, a separate estimate was developed using IEA energy consumption data for 2004 and extrapolating accepted emission factors from OECD production to global production, using FAO statistics (IEA, 2006; FAO, 2007). This yielded an estimate of approximately 180 million tonnes of CO2 per year, which would be expected to be somewhat lower than other estimates because IEA allocates some fuel use at pulp and paper mills to electricity generation in the transformation sector (IEA, 2006). Because of this, and because the data collected for this report were both more extensive than the IEA OECD data (representing 80 percent of global production if China is included, rather than 71 percent) and more representative (in terms of representing both developing and developed countries), the estimate developed here is felt to be more robust. This estimate is 202 million tonnes of CO2 per year from fossil fuel combustion at pulp and paper mills, plus 5 million tonnes of CO2 equivalent in methane and nitrous oxide from all fuel combustion, including biomass.
Wood product emissions data were provided by four countries, representing only 19 percent of global production. As this sample was too small to be representative, IEA fuel consumption data and FAO data from OECD countries in the IEA dataset were used to develop the estimate of global emissions from the wood products sector (IEA, 2006; FAO, 2007). The IEA data were appropriate for this, because electricity is seldom generated at wood product facilities. This yielded an estimate of 24.5 million tonnes of CO2 per year from fossil fuel combustion and another 1.1 million tonnes of CO2 equivalent in methane and nitrous emissions from fossil fuel and biomass combustion. This is approximately the same as an earlier estimate of 2001 emissions (25 million tonnes of CO2) derived from the same sources (Miner and Perez-Garcia, 2007b).
EMISSIONS ASSOCIATED WITH PURCHASED ELECTRICITYThe emissions associated with purchased electricity (Scope 2 emissions under the WRI/WBCSD Greenhouse Gas Protocol) were estimated by first determining how much electricity is typically purchased. Information from pulp and paper associations in Europe, the United States and Japan was examined to calculate the electricity purchases per tonne of production in each of these regions. These estimates ranged from 0.44 to 0.59 MW per tonne, averaging 0.5 MW per tonne. Given the large proportion of global production that these three regions account for, it was felt reasonable to model the industry’s purchased electricity requirements on the average value of these regions. National-level purchased electricity requirements were then estimated using FAO production statistics (FAO, 2007). The countries that together account for 91 percent of global production were selected, and those accounting for the remaining 9 percent were treated as a separate group. The

Impact of the global forest industry on atmospheric greenhouse gases58
emissions associated with electricity purchases were then calculated using country-specific electricity emission factors published by IEA (2007a) (Table A-8).
Owing to the scarcity of information, it is more difficult to estimate global emissions related to purchased electricity used at wood product facilities. Purchased electricity factors were developed for sawnwood and wood-based panels based on information from several sources (NCASI, 2008; ecoinvent, 2008; USDOE, 2009), referring mostly to North American and European facilities. For sawnwood, the factors from these three sources ranged from 0.07 to 0.09 MW per cubic metre, so a value of 0.08 MW per cubic metrewas used in the calculations (Table A-9). For wood panels, the values varied dramatically, depending on the type of panel, and ranging from 0.1 to 0.35 MW per cubic metre. A weighted average factor of 0.2 MW per cubic metre was derived, based on FAO (2007) data for global production of each panel type (Table A-10). National-level production data were obtained for the same countries as were used for pulp and paper, in this case representing 85 percent of sawnwood and 89 percent of wood-based panel production. The results were extrapolated to the global level. The same national-level electricity factors were used as for the pulp and paper sector.
TABLE A-8Emissions associated with purchased electricity at paper and paperboard millsa
Country Production(‘000 tonnes)
CO2 emissions
Per MW(kg)
Total(‘000 tonnes)
Australia 3 192 873 1 393
Austria 5 199 225 585
Belguim 1 897 268 254
Brazil 5 836 84 245
Canada 18 113 199 1 802
Chile 1 344 357 240
China 78 026 788 30 742
Czech Republic 1 023 516 264
Finland 14 334 194 1 390
France 9 871 91 449
Germany 23 172 349 4 044
India 4 183 942 1 970
Indonesia 7 223 771 2 784
Italy 10 112 405 2 048
Japan 28 930 429 6 205
Malaysia 1 062 557 296
Netherlands 3 224 387 624
New Zealand 872 275 120
Norway 2 010 5.5 6
Poland 2 992 659 986
Portugal 1 644 498 409
Russian Federation 7 559 338 1 277
South Africa 3 033 848 1 286
Spain 6 714 394 1 323
Sweden 11 902 45 268
Switzerland 1 536 26 20
Thailand 4 484 531 1 191
United Kingdom 5 284 473 1 250
United States 83 826 573 24 016
Uruguay 90 000 103 5
Rest of world 34 916 501 8 747
World 383 603
Coverage, % of world 91% Total of above 96 238
Total extrapolated 105 875
a Assuming electricity purchased = 0.5 MW per tonne.

Annex 1: Calculations 59
TABLE A-9Emissions associated with purchased electricity at timber millsa
Country Production(‘000 m3)
CO2 emissions
Per MW(kg)
Total(‘000 tonnes)
Australia 5 064 873 354
Austria 11 262 268 241
Belgium 1 555 225 28
Brazil 24 414 84 164
Canada 52 284 199 832
Chile 8 340 357 238
China 29 202 788 1 841
Czech Republic 5 454 516 225
Finland 12 477 194 194
France 10 190 91 74
Germany 25 170 349 703
India 14 789 942 1 114
Indonesia 525 771 32
Italy 1 700 405 55
Japan 11 632 429 399
Malaysia 5 122 557 228
Netherlands 271 387 8
New Zealand 4 280 275 94
Norway 2 402 5.5 1
Poland 3 304 659 174
Portugal 1 010 498 40
Russian Federation 23 200 338 627
South Africa 2 091 848 142
Spain 3 332 394 105
Sweden 18 600 45 67
Switzerland 1 541 26 3
Thailand 288 531 12
United Kingdom 3 146 473 119
United States 84 363 573 3 867
Uruguay 308 103 3
Rest of world 63 725 501 2 554
World 431 042
Coverage, % of world 85% Total of above 14 541
Total extrapolated to world 17 064
a Assuming electricity purchased = 0.08 MW per cubic metre.

Impact of the global forest industry on atmospheric greenhouse gases60
TABLE A-10Emissions associated with purchased electricity at panel plantsa
Country Production(‘000 m3)
CO2 emissions
Per MW(kg)
Total(‘000 tonnes)
Australia 1 788 873 312
Austria 3 716 268 199
Belgium 2 552 225 115
Brazil 8 680 84 146
Canada 14 645 199 583
Chile 2 482 357 177
China 70 955 788 11 182
Czech Republic 1 716 516 177
Finland 1 995 194 77
France 6 709 91 122
Germany 18 185 349 1 269
India 2 554 942 481
Indonesia 4 305 771 664
Italy 5 701 405 462
Japan 5 313 429 456
Malaysia 7 719 557 860
Netherlands 15 387 1
New Zealand 2 203 275 121
Norway 613 5.5 1
Poland 8 534 659 1 125
Portugal 1 341 498 134
Russian Federation 9 813 338 663
South Africa 786 848 133
Spain 5 390 394 425
Sweden 928 45 8
Switzerland 1 086 26 6
Thailand 1 365 531 145
United Kingdom 3 549 473 336
United States 41 091 573 4 709
Uruguay 163 103 3
Rest of world 30 278 501 3 034
World 266 170
Coverage, % of world 89% Total of above 28 127
Total extrapolated to world 31 737
a Assuming electricity purchased = 0.2 MW per cubic metre.

Annex 1: Calculations 61
UPSTREAM EMISSIONS ASSOCIATED WITH NON-WOOD INPUTS AND FOSSILFUELSTo estimate the upstream emissions associated with chemicals and additives, the factors in FICAT were used (IFC, 2009). These reflect generic “recipes” of chemicals and additives used to produce different forest products, and data from several life cycle databases. Sawnwood was assumed to have no upstream emissions associated with chemicals and additives (although this is not the case for preservative-treated wood). These factors were applied to FAO production statistics for the respective products (FAO, 2007) (Tables A-11 and A-12).
The upstream emissions associated with fossil fuel use in the global forest products sector were estimated using: IEA energy consumption data for OECD (IEA, 2006); FAO production statistics to extrapolate the IEA data to the rest of the world (FAO, 2007); and upstream emission factors from the United States life cycle database, modified for IFC’s FICAT (USDOE, 2009; IFC, 2009) (Table A-13).
TABLE A-11Upstream emissions associated with chemicals used in producing paper and paperboard
FAO grade of paper and paperboard
Global production2007
(‘000 tonnes)
%of global
production
Upstream emission factor
(kg CO2
equivalent/tonne)
FICAT factors used to select the upstream emission factor
Upstream emissions (‘000 tonnes
CO2 equivalent)
Household and sanitary paper
26 278 7 200 Midway between integrated and non-integrated uncoated freesheet
5 256
Newsprint 38 096 10 75 Newsprint: average of 100% and 0% de-inked pulp
2 857
Paper and paperboard not elsewhere specified
19 603 5 100 Selected factor is within the range for all grades. If anything, it may be biased high
1 960
Printing and writing paper
113 635 30 165 Average of coated freesheet, uncoated freesheet, coated mechanical and uncoated mechanical
18 750
Wrapping and packaging paper and board
185 911 48 32.5 Average of semi-chemical, recycled corrugating medium, recycled liner and kraft liner
6 042
Total 383 523 100 34 865
TABLE A-12Upstream emissions associated with chemicals used in producing wood-based panels
FAO grade of wood- based panels
Globalproduction
2007(‘000 m3)
%of global
production
Upstream emission factor
(kg CO2
equivalent/tonne)
FICAT factors used to select the upstream
emission factor
Conversionfactor for m3
to tonnes
2007 global production
(‘000 tonnes)
Upstream emissions
(‘000 tonnes CO2 equivalent)
Hardboard 9 716 4 MDF 1.02 9 911 1 982
Insulatingboard
7 105 3 200 MDF 0.5 3 553 711
Mediumdensityfibreboard(MDF)
55 573 21 200 MDF 0.5 27 786 5 557
Particleboard
106 144 40 200 Oriented strand board
0.26 27 598 5 520
Plywood 76 127 29 200 Plywood,outside
0.48 36 541 7 308
Veneer sheets
11 505 4 200 Plywood,outside
0.59 6 788 1 358
Total 266 170 100 Total upstream emissions
22 435

Impact of the global forest industry on atmospheric greenhouse gases62
TRANSPORT-RELATED EMISSIONSTo estimate the emissions associated with the international transport of fibrous raw materials and products, FAO data were obtained for the countries representing 80 percent of exports of each of the following materials: industrial roundwood, sawnwood, wood-based panels, paper and paperboard, and recovered paper. FAO data were also used to identify the major export destinations for each material from these countries (FAO, 2007). One-way transport distances and modes were approximated for each pairing of exporting country and major importing destination. The emissions associated with this transport were estimated using emission factors from WRI/WBCSD Greenhouse Gas Protocol calculation tools, as presented in documentation for IFC’s FICAT model (IFC, 2009) and then extrapolated to account for the remaining 20 percent of exports from countries not included in the calculations.
Because most land-based shipping uses a combination of truck and train carriers, two sets of calculations were made: one assuming that most overland international transport was by diesel locomotive and the other assuming that overland international transport was by diesel truck. The average of these two values was used for the final estimates (Tables A-14 and A-15). To account for the transport of non-fibrous raw materials and fuels, the emissions associated with transporting fibrous raw materials were increased by 15 percent. Several sources of information suggest that this was an adequate adjustment (e.g. Diesen, 1998; Lofgren, 2005; Kline, 2004). In addition, it was assumed that the emissions associated with discarded paper are equal to half those associated with transporting recovered fibre.
TABLE A-13Upstream emissions associated with fossil fuel use at forest products manufacturing facilities
Fuel Fuel consumption(terrajoules [LHV])
Upstream emission factor(kg CO2 equivalent/GJ [LHV])
Upstream emissions(tonnes CO2 equivalent/year)
OECD paper, pulp and print
OECD wood and wood products
Paper, pulp and print
Wood and wood products
Other bitumen coal 263 243 8 037 6.03 1 587 48
Sub-bitumen coal 22 813 67 6.03 138 -
Lignite 4 097 6.03 25 -
Peat 15 880 6.03 96 -
Oven and gas coke 801 6.03 5 -
Patented fuel and brown coal briquettes 10 509 6.03 63 -
Liquefied petroleum gas and ethane 16 590 4 503 12.83 213 58
Kerosene 3 043 269 12.89 39 3
Gas and diesel 99 312 99 356 12.89 1 280 1 281
Heavy fuel oil 391 250 14 187 12.83 5 020 182
Petroleum coke 2 170 12.83 28 -
Natural gas 1 067 765 111 354 12.33 13 166 1 373
Gas works 23 12.33 - -
Coke ovens 829 842 6.03 5 5
Totals for OECD 21 664 2 951
Fraction of global production in OECD countries 0.71 0.64
Extrapolated totals for world 30 513 4 611

Annex 1: Calculations 63
TABLE A-14Final calculation of emissions associated with international transport
Factor Emissions 2007(‘000 tonnes CO2 equivalent)
Overland mostly by locomotive
Overland mostly by truck
Midpoint estimate between locomotive and truck
Industrial roundwood 3 036 4 061 3 549
Pulp 3 508 4 652 4 080
Recovered paper 3 409 4 362 3 885
Cradle-to-gate fibre total 11 514
Add 15% for fuel/chemicals for cradle-to-gate total 13 241
Sawnwood 2 569 6 366 4 468
Panels 2 575 4 329 3 452
Paper and paperboard 4 242 10 353 7 298
Gate-to-consumer total 15 217
Post-consumer (half of recovered paper transport emissions) 1 943
Overall total 30 401
TABLE A-15Calculation of transport emissions related to domestic transport
Factor Global domestic consumptiona
(‘000 tonnes)
Distance(km)
Emissions 2007(‘000 tonnes CO2 equivalent)
Overland mostly by locomotive
Overland mostly by truck
Midpoint estimate between locomotive and truck
Industrial roundwood 751 611 100 1 503 5 412 3 457
Pulp n.a.b 0 0 0
Recovered paper 142 781 500 1 428 5 140 3 284
Cradle-to-gate fibre total 6 741
Add 15% for fuel/chemicals for cradle-to-gate total 7 753
Sawnwood 154 047 500 1 540 5 546 3 543
Panels 86 246 500 862 3 105 1 984
Paper and paperboard 257 369 500 2 574 9 265 5 919
Gate-to-consumer total 11 446
Post-consumer (half of recovered paper transport emissions) 1 642
Overall total 20 841
a Global consumption minus global exports.b n.a. = not available.
END-OF-LIFE EMISSIONSIn the tables estimating the carbon stored in products, the amounts of product reaching the end of the life cycle and going to landfills were estimated. It was assumed that all products not recovered or sent to landfills are burned (Table A-16).
Estimates of methane emissions attributable to forest products in landfills (Tables A-17 and A-18) begin with the estimates shown for the carbon stored in landfills. For products in landfills, it is assumed that half of the degradable carbon under anaerobic conditions is converted into methane, and 10 percent of methane is assumed to oxidize naturally as it migrates through the upper layers of the landfill. Additional amounts can be captured and burned, but this depends on the use of landfill gas capture systems.

Impact of the global forest industry on atmospheric greenhouse gases64
TABLE A-16Emissions from burning used products at the end of the life cycle, 2007
Product Not landfilled or recycled(‘000 tonnes per year)
‘000 GJa CO2 equivalentb
(‘000 tonnes)
Paper 49 020 764 712 1 484
Wood products 51 609 805 100 1 562
Total 100 629 1 569 812 3 045
a Calculated based on 15.6 GJ per tonne (LHV), from IPPC, 2006.b Calculated based on1.94 kg of CO2 equivalent in CH4 and N2O emissions per GJ (LHV), from IPPC, 2006.
TABLE A-17Methane emissions from paper and paperboard disposed of in landfills
Country Per capita GDPPPP 2008
(US$/year)
C to methane(‘000 tonnes/
year)
Methane produced
(‘000 tonnes)
Methane remaininga
(‘000 tonnes)
Fraction captured and
burned
Methane released
(‘000 tonnes)
Methane released(‘000 tonnes CO2
equivalent)
Argentina 14 020 55 74 67 0.1 60 1 258
Australia 34 040 96 128 115 0.4 69 1 447
Austria 37 680 22 29 27 0.4 16 334
Belgium 34 760 4 5 4 0.4 3 54
Brazil 10 070 32 42 38 0.1 34 717
Canada 36 220 379 505 455 0.4 273 5 730
China 6 020 2 183 2 910 2 619 0 2 619 55 001
France 34 400 235 314 282 0.4 169 3 558
Germany 35 940 174 232 209 0.4 125 2 629
India 2 960 149 199 179 0 179 3 760
Indonesia 3 830 105 139 126 0 126 2 636
Italy 30 250 470 627 564 0.4 339 7 109
Japan 35 220 148 197 177 0.4 106 2 235
Korea, Republic of 28 120 15 19 17 0.1 16 329
Malaysia 13 740 95 127 114 0.1 103 2 162
Mexico 14 270 147 196 176 0.1 159 3 329
Netherlands 41 670 15 20 18 0.4 11 229
Poland 17 310 191 255 230 0.1 207 4 340
Russian Federation 15 630 225 300 270 0.1 243 5 098
South Africa 9 780 73 97 87 0 87 1 834
Spain 31 130 298 397 357 0.4 214 4 502
Sweden 38 180 17 22 20 0.4 12 252
Switzerland 46 460 40 54 48 0.4 29 610
Thailand 5 990 97 129 116 0 116 2 440
Turkey 13 770 209 278 251 0.1 226 4 736
United Kingdom 36 130 298 397 357 0.4 214 4 503
United States 46 970 2 404 3 205 2 885 0.4 1 731 36 349
Viet Nam 2 700 54 72 65 0 65 1 361
Total 158 543
Extrapolated to world 176 159
a After 10 percent oxidized naturally.
The fraction of methane captured and burned is an important variable in methane emission calculations, but there are few data on national practices, especially in developing countries. In this study, the values selected for capturing and burning methane were based on per capita GDP (PPP basis) published by the World Bank (2009). It was assumed that countries with per capita GDP greater than US$30 000were capturing and burning 40 percent of the methane from decomposing forest products; countries with per capita GDP of less than US$10 000 were capturing none; and the remaining countries were capturing and burning 10 percent.

Annex 1: Calculations 65
TABLE A-18Methane emissions from wood products disposed of in landfills
Country Per capita GDP PPP 2008
(US$/year)
C to methane(‘000 tonnes/
year)
Methaneproduced
(‘000 tonnes)
Methaneremaininga
(‘000 tonnes)
Fractioncaptured
and burned
Methanereleased
(‘000 tonnes)
Methane released(‘000 tonnes
CO2 equivalent)
Argentina 14 020 11 15 14 0.1 12 259
Australia 34 040 66 89 80 0.4 48 1 005
Austria 37 680 17 23 20 0.4 12 258
Belgium 34 760 7 9 8 0.4 5 100
Brazil 10 070 132 176 159 0.1 143 2 999
Canada 36 220 182 242 218 0.4 131 2 746
Chile 13 270 15 19 18 0.1 16 331
China 6 020 391 522 469 0 469 9 859
Czech Republic 22 790 25 34 30 0.1 27 575
Denmark 37 280 4 5 5 0.4 3 59
Egypt 5 460 6 9 8 0 8 162
Estonia 19 280 14 18 16 0.1 15 307
Finland 35 660 39 52 47 0.4 28 586
France 34 400 75 100 90 0.4 54 1 130
Germany 35 940 101 134 121 0.4 72 1 520
Greece 28 470 13 17 15 0.1 14 289
India 2 960 51 68 61 0 61 1 280
Iran, Islamic Republic of 10 840 15 20 18 0.1 16 342
Italy 30 250 108 144 129 0.4 78 1 628
Japan 35 220 67 90 81 0.4 48 1 017
Korea, Republic of 28 120 31 41 37 0.1 33 701
Malaysia 13 740 22 29 26 0.1 24 495
Mexico 14 270 28 37 33 0.1 30 627
Netherlands 41 670 5 6 6 0.4 3 71
New Zealand 25 090 17 23 20 0.1 18 386
Norway 58 500 20 27 24 0.4 14 301
Pakistan 2 700 9 12 11 0 11 228
Poland 17 310 71 94 85 0.1 76 1 604
Romania 13 500 0 0 0 0.1 0 5
Russian Federation 15 630 66 89 80 0.1 72 1 508
Saudi Arabia 22 950 16 21 19 0.1 17 353
Slovakia 21 300 17 23 20 0.1 18 385
South Africa 9 780 13 18 16 0 16 338
Spain 31 130 79 106 95 0.4 57 1 200
Sweden 38 180 19 25 23 0.4 14 285
Switzerland 46 460 23 31 28 0.4 17 353
Turkey 13 770 80 106 95 0.1 86 1 803
Ukraine 7 210 12 16 15 0 15 312
United Kingdom 36 130 139 185 167 0.4 100 2 099
United States 46 970 857 1 143 1 029 0.4 617 12 960
Viet Nam 2 700 11 15 14 0 14 287
Sum of above 52 753
Extrapolated to world 58 614
a After 10 percent oxidized naturally.


67
Annex 2
An overview of harvested wood products accounting in national greenhouse gas inventories
Currently, countries reporting greenhouse gas emissions under the Kyoto Protocol use IPCC’s 1996 default accounting approach for carbon in harvested wood products (HWPs). This approach assumes that there is no growth in the carbon stored in HWPs. From the standpoint of the calculations, this is the same as assuming that carbon in biomass is emitted in the year the biomass is harvested. Although most countries reporting under the United Nations Framework Convention on Climate Change (UNFCCC) use the original IPCC default assumption, IPCC guidelines allow other approaches, and some countries use these. In 2006, IPCC revised the hierarchy of HWP accounting approaches so that the former default is now one of several equally favoured alternatives. However, the parties to UNFCCC have not yet adopted the 2006 guidelines for national inventory reporting. Since these were issued, a number of alternative accounting approaches have been suggested.
It is important to understand that in carbon accounting under UNFCCC or the Kyoto Protocol, HWPs include all biomass removed from the forest, and is not limited to manufactured products.
It is well documented that the stocks of carbon stored in HWPs are growing, in both products in use and in landfills. The assumption of no growth in stored carbon therefore overstates the transfers of CO2 to the atmosphere from the forest products value chain. Based on the estimates in this report, the assumption of no growth in stored carbon is overstating global emissions from the forest products value chain by 424 million tonnes of CO2 per year.
In spite of many years of discussion, it has not been possible to reach international consensus on which accounting approach, other than the original IPCC default, to use for national greenhouse gas inventories submitted under UNFCCC. The lack of consensus can be attributed to such concerns as:
the sometimes significant differences between the greenhouse gas inventories of HWP importing countries and those of exporting countries;uncertainties associated with approaches that require assumptions about how exported products will be used and disposed of;perverse incentives that may be created;the implications of having some countries within the accounting framework and others outside it;the potential impacts on international trade;producers’ concerns that the accounting approaches do not account for substitution effects.
Several recent proposals attempt to address some of these concerns by limiting the accounting to countries within the reporting framework, or to the HWPs produced and used domestically.
The lack of international consensus has resulted in IPCC recommending (in the 2006 revised guidelines) that countries report a series of parameter values in their national inventories, which can be used to calculate emissions according to any of the different approaches.

Impact of the global forest industry on atmospheric greenhouse gases68
THE MAJOR OPTIONSConceptually, the major HWP accounting options fall into three general categories:
stored in HWPs (mathematically equivalent to assuming instant oxidation of harvested biomass).
atmosphere by adding up all the changes in amounts of stored biomass carbon within national boundaries. If the total amount of carbon stored in a country’s forests and forest products has increased over time (and if the carbon in imports equals the carbon in exports), a corresponding amount of carbon must have been removed from the atmosphere.
carbon with the atmosphere by adding up all the flows of carbon to and from the atmosphere at all points along the forest-based value chain within national boundaries. Carbon is removed from the atmosphere in the forest and is subsequently returned to the atmosphere both from the forest and from downstream points along the value chain that lie within national boundaries. If not all of the carbon is returned (and if the carbon in imports equals the carbon in exports), there has been a net removal of carbon from the atmosphere equal to the amount not returned.
At the global level, the stock change and atmospheric flow approaches give essentially the same results. The differences between them are important primarily for countries that are large net importers or exporters of HWPs. This is because, under stock change accounting, exported HWP represents the export of carbon storage, while in atmospheric flow accounting it represents the export of delayed emissions. As a result, large net importers of HWPs will have significantly larger HWP emissions using atmospheric flow accounting, while large net exporters will have larger emissions using stock change accounting. The differences for such countries can be more than 5 to 10 million tonnes of carbon a year. In Canada, for instance, annual emissions estimated using the atmospheric flow approach are 60 million tonnes of CO2 lower than those estimated using the stock change approach, an amount equal to 8 percent of national emissions. In turn, annual emissions estimated using the stock change approach are 15 million tonnes of CO2 lower than those estimated using the IPCC default approach (Environment Canada, 2009).
In addition to the old IPCC default, stock change accounting, and atmospheric flow accounting, the 2006 IPCC guidelines explain two other approaches:
attributes the stock changes associated with carbon stored in HWPs to the country where the wood was harvested.
it attributes delayed emissions associated with HWPs to the country where the wood was harvested.
In many cases, these approaches yield results that lie between those obtained with atmospheric flow and stock change accounting. It is important to understand that, at the global level and in most national inventories, the IPCC default approach, which does not acknowledge the accumulation of carbon in HWP pools, gives higher emissions than any of the alternatives that recognize this accumulation. There are exceptions, however. For instance, countries without domestic forest resources that import large amounts of forest products will calculate higher emissions under atmospheric flow accounting than under the IPCC default.

Annex 2: An overview of harvested wood products accounting in national greenhouse gas inventories 69
CONCERNS ABOUT HWP ACCOUNTINGThis section elaborates on the issues that have prevented global consensus on an approach to HWP carbon accounting.
Concern: The greenhouse gas inventories of HWP importing and exporting countries sometimes differ significantly.There is no question that the selection of accounting approach will affect the national inventories of many countries, particularly those that are large net importers or large net exporters of HWP. This concern could be addressed by selecting an accounting approach that reduces the differences among countries and by adjusting national targets to reflect the effects of the selected accounting approach.
Concern: The estimates are too uncertain for use in national inventories, especially when they are used to judge compliance against reduction targets.There are uncertainties in all the emissions estimates contained in national inventories. However, when discussing the uncertainties associated with HWP estimates, it is important to remember that these same HWP calculations are also used to estimate national emissions of landfill methane, when their results are used in further analyses that apply additional assumptions and involve additional uncertainty. For instance, the United States Environmental Protection Agency (USEPA) has estimated that the uncertainty in the estimates of growth in HWP stocks is -26 to +24 percent, while the uncertainty in methane emissions from landfills is -39 to +33 percent (USEPA, 2009). In spite of the uncertainty, the estimates of landfill methane emissions are readily accepted in national greenhouse gas inventories, suggesting that estimates of HWP-related carbon sequestration should also be accepted.
Concern: Some of the approaches require assumptions about how exported products will be used and disposed of, creating uncertainties in the results.A number of the accounting approaches require the producing country (i.e. the country where the wood is grown) to calculate the carbon storage or emissions that will be attributable to the wood or forest products it exports to other countries. This requires information from the importing country regarding: how the wood or forest product will be used; the typical time in use for the imported products or for products made from the imported wood; the amounts of used products that are sent to landfill at the end of their life; and the design and operation of landfills typically receiving this material. Many countries do not have good-quality information on these topics. The IPCC 2006 guidelines contain default values for these parameters, but there is likely to be significant uncertainty associated with the use of these defaults. This concern is likely to diminish over time, as countries develop the national-level data needed to replace these defaults.
Concern: Perverse incentives may be created.A wide range of perverse incentives are potentially related to HWP accounting practices. The following are some of the most important of these:
The old IPCC default assumption credits the forest-related value chain only for carbon left in the forest and for biomass removed from the forest and used to reduce fossil fuel-related emissions. Fossil fuels can be displaced by biomass in many ways, but national authorities often incentivize only the direct burning of forest biomass for fuel. Thus, the current IPCC default has the practical effect of encouraging countries to promote policies that leave wood in the forest (foregoing substitution effects from wood products), except where wood is removed to be used as fuel. In either case, less wood becomes available for manufacturing forest products.
Impact of the global forest industry on atmospheric greenhouse gases70
A system that does not require reporting from all countries could encourage the overuse of forests in non-reporting countries and exports of the wood to reporting countries, where it could be used to reduce emissions. The emission reductions reported by the reporting country would be overstated if the exporting country had reduced its forest carbon stocks to produce the wood but was not required to report this. Because most HWP accounting approaches place a value on carbon stored in forest products, there is concern in some circles (and hope in others) that this would encourage more harvesting and increased production of forest products. This would depend on the national policies put in place for using the value of carbon stored in products to influence the decisions of landowners and producers. Some policies would allow landowners and producers to benefit directly from this value, while others would make the value irrelevant to landowners and producers. Ultimately, therefore, it is national policies and not carbon accounting approaches that dictate how the value of stored carbon is translated into incentives to increase or decrease the production of wood and forest products.Because landfills are responsible for much of the growth in carbon storage in the forest carbon value chain, there is concern that crediting this storage might somehow promote landfilling over other end-of-life management options for used forest products. This concern can be addressed by public policies that ensure that end-of-life management bears the responsibility for greenhouse gas emissions occurring at the end of the life cycle (e.g. methane from landfills) and that properly credit reductions in societal greenhouse gas emissions associated with other end-of-life management options (e.g. burning non-recyclable products for energy).There have been concerns that atmospheric flow accounting (and other flow-based approaches) could encourage national policies that do not differentiate between biomass-derived CO2 emissions and fossil fuel-derived emissions. This concern arises because flow-based approaches focus on emissions of biomass-derived CO2 in calculating national biomass carbon emissions/sequestration, and this is the same method used to track fossil fuel-related emissions. However, it should be remembered that these accounting approaches are only for estimating national-level emissions. National policies are designed to encourage activities that help the country to meet national emission targets. A national policy that did not differentiate between biomass CO2 and fossil fuel CO2 would increase national emissions, because many facilities using biomass for fuel would switch to fossil fuels, which deliver more usable energy per unit of carbon than biomass fuels. This suggests that such a national policy is unlikely.
Concern: Having some countries within the accounting framework and others outside it could result in practices that cause global emissions to increase.The most likely unwanted consequence of this is that countries with emissions reduction targets will stop harvesting domestic forests to obtain the benefits of additional storage, while increasing imports of biomass from other countries, to obtain the carbon storage and fossil fuel displacement benefits. If an exporting country has no accounting responsibility for domestic forest carbon stocks, it might deplete these stocks in response to the strong market demand from countries within the accounting framework. Several accounting methods have been proposed to address this concern. In general, these account for HWPs only from wood harvested in countries within the accounting framework. Concerns with such proposals include the reductions in HWP benefits that would occur for some countries, relative to other approaches; and the difficulty of tracing all HWPs to the country where the wood was

Annex 2: An overview of harvested wood products accounting in national greenhouse gas inventories 71
grown. Other proposals limit the accounting to HWPs associated with domestically grown wood. Although this simplifies the tracing difficulties, it also greatly reduces HWP benefits, not only for countries with limited domestic forest resources but also for HWP exporting countries with relatively small domestic markets.
Concern: There will be effects on international trade in wood and forest products.Recognition of the carbon storage (and other) greenhouse gas related benefits associated with HWPs could have effects on the prices of wood and forest products. This would affect countries in different ways depending on: national policies for incentivizing HWP-related benefits; whether the country is inside or outside the HWP accounting framework; and the accounting approach used for HWPs. While international trade might be affected in many ways, it is reasonable to assume that the effects will primarily be related to national policies aimed at distributing the benefits (or costs) associated with HWPs (e.g. policies for transferring HWP-related impacts on greenhouse gas inventories to the forest products sector) or policies that address international trade concerns directly.
Concern: None of the accounting approaches accounts for substitution effects.For many forest products, substitution effects have a greater impact than carbon storage benefits on long-term trends in atmospheric CO2. There has therefore been interest in finding HWP accounting approaches that explicitly recognize substitution effects. This is difficult because it involves combining two different types of carbon accounting. HWP carbon accounting attempts to calculate carbon flows to/from the atmosphere as they occur, while substitution effects are based on a hypothetical alternative situation (e.g. “emissions would be X percent lower if we used Y percent more wood” or “emissions are X percent lower than they might otherwise be because we are using Y tonnes of wood per year”). The carbon accounting framework for HWPs is so different from that for substitution effects that it is difficult to envision a single accounting framework that would adequately address both.
OUTLOOKThe global forest products sector supports adoption of a global HWP accounting framework that acknowledges the benefits of carbon stored in forest products (see, for instance, Recommendations for government negotiators to effectively include harvested wood products (HWP) within the UN Framework Convention on Climate Change (UNFCCC), endorsed by the Sustainable Forest Products Industry Working Group of WBCSD and ICFPA [WBCSD, 2009]). The original IPCC default approach does not do this. As a result, it greatly overstates the emissions from the forest products value chain. Unfortunately, various concerns prevent international consensus. A number of proposals under consideration attempt to address one or more of these concerns, but no approach can address all of them.
