covenant-light contracts and creditor coordination files/ssrn... · swedish house of finance...
TRANSCRIPT

Swedish House of Finance Research Paper No 16-09
Covenant-Light Contracts and Creditor Coordination
Bo Becker Stockholm School of Economics and Swedish House of Finance
Victoria Ivashina Harvard University and National Bureau of Economic Research (NBER)
´
Swedish House of Finance (SHoF) is a research center focusing on financial markets, and is jointly supported by the Stockholm School of Economics,
SIFR, Vinnova, and the financial industry. The goal of SHoF is to produce and disseminate financial research through providing financial support,
organizing PhD courses, hosting a financial data center, and organizing seminars, conferences, and visitors programs for both academics and
practitioners.
Electronic copy available at: http://ssrn.com/abstract=2756926
COVENANT-LIGHT CONTRACTS AND CREDITOR COORDINATION
Bo Becker*
Stockholm School of Economics
Victoria Ivashina*
Harvard University and NBER
This draft: March, 2016
In 2015, 70% of newly-issued leveraged loans had weaker enforcement features, called covenant-
light or “cov-lite;” this is nearly a three-time increase in cov-lite issuance compared to a previous
peak in 2007. We evaluate whether this development can be attributed to market overheating,
increased borrower demand for cov-lite loans, or a rise in creditor coordination costs. The last
hypothesis stems from the increasing involvement of non-bank institutions and, in particular, the
rise of mutual fund participation in the leveraged loan market after the financial crisis. Based on
the wider syndication, (narrower) skills, and diverse incentives of non-bank institutional lenders,
optimal contracts between them and corporate borrowers likely involve fewer monitoring tools
and weaker control rights. We evaluate these explanations of cov-lite contract provisions in a
large sample of U.S. loans for the 2001–2014 period. Consistent with creditor-driven
explanations for cov-lite issuance, we show that cov-lite prices compress as the prevalence of
cov-lite rises. Time patterns in cov-lite issuance closely match inflows to institutional lenders,
and at a given time, cov-lite loans are, overwhelmingly, those with the highest ownership by
structured products and/or mutual funds. The number and share of structured products and mutual
funds also impact the propensity toward other contractual features that influence when and how
creditors have control. However, these factors are less relevant in explaining the strength of
restrictions on indebtedness, liens, payments, or assets sales.
Keywords: Credit cycles; Loan contracts; Debt Covenants.
JEL Codes: G11, G22, G30
_______________________________________ * Stockholm School of Economics, and Harvard and NBER, respectively. The opinions expressed in this
article are the sole responsibility of the author(s) and should not be interpreted as reflecting the views of
Sveriges Riksbank. We are grateful to Jennifer Dlugosz (discussant), Chris Malloy, Giovani Olivei,
Mariassunta Giannetti and Jeremy Stein as well as seminar participants at the AEA, Boston Federal
Reserve Bank, Einaudi, Sveriges Riksbank, NHH, Nanyang Technical University, Brandeis University,
Harvard Business School, Yale University and Rice University for comments and suggestions. We thank
Lampros Baltas and Canli Hua for excellent research support.

Electronic copy available at: http://ssrn.com/abstract=2756926
The allocation of control between firms and their investors is a key dimension of financial
contracting. In corporate credit markets, the division of control is mainly decided by covenants,
conditions on borrower behavior that are written into the loan contract. In one of the largest shifts
to date in the use of contracts to protect creditor interests, a significant amount of recent corporate
loan issuance has been “cov-lite”. Contrary to what their name might suggest, cov-lite loans do
not have fewer covenants. What differentiates these loans and makes them riskier is weaker
covenant enforcement. A cov-lite contract (equivalently, a contract with incurrence provisions)
requires the firm to comply with its financial covenants only in the event that a firm pursues
(incurs) an active event, such as issuance of additional financing, sale of assets, or merger. In
contrast, a “cov-heavy” contract (a contract with maintenance provisions) requires the issuer to
maintain its compliance with contractual financial covenants at all points in time.1 For example, a
prominent financial covenant in many loans is the leverage ratio, which limits firm indebtedness
to a multiple of earnings before interest, taxes, depreciation, and amortization (EBITDA). A drop
in a firm’s EBITDA due to operational deterioration typically leads to a violation of a cov-heavy,
but not a cov-lite, loan contract.
Cov-lite loans existed as a fringe phenomenon in corporate lending for several years, but took
off in the years prior to the financial crisis. The financial crisis saw their issuance drop again. As
indicated in Figure 1, although covenant-light issuance disappeared in 2008, it then reemerged in
2009. By the end of 2012, quarterly covenant-light origination had surpassed its earlier peak
(25% of loan issuance as of 2007:Q2) and it remained substantially above that level through the
1 Effectively, maintenance covenants are tested for compliance every fiscal quarter.
2
end of 2014. In the first quarter of 2014, 43% of all new leveraged loans and 54% of the volume
of leveraged loan dollar flows were cov-lite.2
[FIGURE 1]
It has been argued that high recent issuance of cov-lite loans reflects reaching-for-yield—a
preference for assets with partially-priced, but generally hard-to-measure, risk—spurred by the
prolonged low interest rate environment. Stein (2013) points out that investors that are reaching
for yield may be willing to forego control rights in order to boost yields, even if those control
rights are more valuable, because yields are visible to investors and included in performance
benchmarks, whereas control rights are less visible and are not explicitly accounted for in
benchmarks. This observation is consistent with the fact that, as the incidence of cov-liteness in
loans was rising, the spreads for leveraged loans did not compress—they remained substantially
above historic levels, even excluding the securitization boom.
In this paper we argue that the rise in cov-lite issuance, to a large degree, has to do with the
ways contracts shift in response to changes in the investor base for leveraged loans. Historically,
loans were almost always covenant-heavy.3 It is against this background that the rise in cov-
liteness is typically seen as alarming. But this is not the right benchmark. Cov-liteness is
exclusively a feature of leveraged loans, a segment of the loan market that is widely syndicated to
a diverse group of institutional investors. In this loan segment, traditional lenders like banks and
finance companies account for about 10–15% of loan origination (and arguably even less, as
2 We follow industry jargon and refer to syndicated loans of low credit quality as “leveraged loans.” This
term is always used to refer to high risk loans, but the specific definition—i.e., the exact cut-off for the
loan spread and overall leverage—might vary by source and time period. In our study we rely on Standard
and Poor’s classification. 3 We should clarify that a detailed covenant structure is a feature of the so-called “cash-flow based loan,”
that is, senior secured debt that is not backed by easily tracked or valued collateral. In contrast, “asset
backed” loans are typically backed by collateral like real estate, heavy machinery, airplanes, and credit
card receivables.

3
some of their stake is sold in the secondary market). The bulk of leveraged loans are funded by
collateralized loan obligations (CLOs), loan mutual funds, hedge funds, and securities firms, and
to a lesser degree, insurance companies and pension funds. Thus, the investor base for leveraged
loans today looks much more like the investor base for high-yield bonds. Perhaps it is not that all
alarming, then, that the contract between creditors and the borrower in this setting would be cov-
lite, as it always has been for bonds.
The central point is that the use of covenants requires coordination among investors.
Covenant violations constitute default, and accelerate all payments. Simply put, upon covenant
violation, the loan becomes due immediately, which typically forces the borrower to file for
bankruptcy protection. In practice, it is often better for both parties to renegotiate to avoid
default. Indeed, Roberts and Sufi (2009) show that anticipated covenant violations often lead to
renegotiations between borrowers and lenders. Thus, many financial covenants are intended to
serve as triggers to renegotiation: covenant violations shift control toward creditors, but do not
necessarily lead to bankruptcy. For credit provided by a single lender, such as a conventional
bank loan, this negotiation takes place between two parties, the borrower and the lender. But for
credit provided by many investors, renegotiation requires that multiple parties coordinate.
The presence of coordination costs between different investors suggests that the usefulness of
covenants may depend on the size and composition of the group of investors. For example, the
quantity of investors may matter: Gertner and Scharfstein (1991) argue that a major impediment
to efficient reorganizations is the inability for dispersed creditors to coordinate bargaining among
themselves and with the managers of the bankrupt firm. Likewise, Bolton and Scharfstein (1996)
argue that capital structures with many creditors can deter efficient ex-post renegotiation of
defaulted contracts. Taken together, these arguments would suggest that covenant-driven shifts in
control from owners to creditors make less sense for firms that have a dispersed creditor base. For
4
example, changing non-payment features of a bond’s indenture typically requires an approval of
at least two thirds (by value of bonds) of bondholders. As such, these changes involve a large
number of investors, many of whom hold a large number of bonds without having detailed
insights into individual issuers.4 Holding the number of investors fixed, coordination may also be
more costly when investors have different preferences (e.g., Van den Steen, 2010).
We conjecture that creditor coordination costs—reflecting the number of investors, their
identity, and the overall composition—are relevant for the design of leveraged loan contracts.
Importantly, over time, institutional investors’ demand for leveraged loans has been subject to
substantial level and compositional shifts. This, in turn, affected coordination costs and optimal
contract construction. Specifically, in periods when the investor base of a leveraged loan
resembles that of a public bond (such as the last few years), loan contract covenants intended to
lead to renegotiation become less attractive, and one should expect more bond-like (cov-lite)
contracts, as well as a lower cost of such features.5
Apart from investor-driven explanations, the rise in cov-lite volumes could also be a borrower
demand phenomenon. In the recent period, the popularity of cov-lite loan contracts might have
increased among firms based on their experiences in the financial crisis. This is a prominent view
among defenders of the recent increase in cov-lite issuance.6 From this perspective, given what
4 As an example, in December 2014, Fidelity’s Total Bond Fund, which invests across U.S. bond markets,
held 2,453 different bonds, had a total assets of $16.9 billion, and was run by a team of four. Fidelity’s
High Income Fund, which focuses on lower rated corporate bonds, had assets of $5.7 billion and 594
holdings, and was run by a single manager. 5 Conceptually, what we mean by “the price” of a contract feature (such as cov-lite) is the difference in
promised yield to maturity between contracts with and without this feature. Measuring this price is
challenging in practice. We discuss measurement issues in detail below. 6 “These ‘ratio maintenance’ covenants can often present future onerous restrictions to borrowing
companies on managing their business, and in some cases ensuring the survival of their business. As a
CFO, I don’t want to be overly controlled by strict maintenance covenants that limit my ability to manage
my company at exactly the time I need flexibility.” From an op-ed by Steve Trollope, Chief Financial

5
was learned from the crisis, more issuers may have then been willing to pay a higher yield to get
cov-lite features. Indeed, it is worth keeping in mind that, although the leveraged loan market is
quite sizable, it is relatively young and its contractual practices (as well understandings of the
implications of these practices) are constantly evolving. Additionally, Billett, Elkhami, Popov,
and Pungaliya (2015) propose an alternative interpretation of the time trend in cov-lite. In their
model, the mix of banks and institutions (such as mutual funds and CLOs) investing in loans can
drive the frequency of covenant light, just as under the coordination cost hypothesis we propose.
Billett et al. assume that banks care more about borrowers’ long-term performance (because of
relationship rents), and are better at enforcing covenants. The main implication of the model is
that covenant light loans are held by institutions. One difference between the predictions made by
the Billett et al. model and the coordination cost hypothesis is the importance of the number of
institutions in a renegotiation situation (such as one triggered by covenant violation). In the
Billett et al. model, the number of institutions is not important, because different institutions of a
given type agree costlessly. In coordination cost models, reaching agreement is generally
increasingly harder the more parties are involved, so that the number of investors matters, as well
as their type. We address this difference empirically below.
We start our empirical analysis by addressing the hypothesis that firm demand for cov-lite
terms has increased since the financial crisis. Using an extensive sample of syndicated loans, we
construct a covenant-light premium. We do so, first, by comparing the loan yields on new loans
that are cov-lite and cov-heavy, controlling for several observable loan and issuer features.
Second, we compare yields that the same borrower receives when refinancing a loan from cov-
heavy to cov-lite, as compared to borrowers that also refinance their loans but continue with a
Officer for CoGen Power Solutions, LLC. “Leveraged Loans Should Be Lauded, Not Maligned,” Forbes,
September 26, 2014.
6
cov-heavy contract. We show that, while cov-lite volumes have expanded, cov-lite pricing has
contracted. If the time pattern of cov-lite were driven by borrowers alone, the implicit price of
cov-lite would be expected to rise along with loan volumes. Thus, our finding contradicts the
view that this phenomenon is driven by borrowers.
The bulk of our results focus on the hypothesis that the rise in cov-liteness is a response to the
rise in coordination costs. Indeed, there are two episodes of considerable cov-lite issuance, one in
2006–2007 and one, even larger, in the period since 2010. These peaks in cov-lite issuance
coincide with peaks in institutional shares of syndicated loans. We explore the time-series
determinants of aggregate covenant-light frequency and pricing in more detail. In particular, we
relate cov-lite volumes and prices to determinants of investor compositions: the net flow to CLOs
that invest in leveraged loans, and to mutual funds (closed end, open end, and ETFs). We also
relate volumes and prices to proxies for overheating in the credit markets: time-on-the-market, or
how long it takes to syndicate and close on a new loan, and the break price as compared to
starting price used by Ivashina and Sun (2011), as well as four variables measuring general credit
market conditions from Gilchrist and Zakrajšek (2012) and Greenwood and Hanson (2013). If
cov-lite provisions reflect irrational or exuberant behavior by investors, we expect these variables
to be related to cov-lite features. If the coordination argument is correct, controlling for market
level conditions, we expect higher flows into these investor categories to be reflected in more
frequent cov-lite features for new issues.
The fund flow variables are associated with high cov-lite frequency and low pricing. In other
words, the time series is consistent with the coordination theory. The R-squared in the time series
is high (above 0.50 for volumes, and above 0.10 for cov-lite premiums, which contain more
noise). The overheating variables have some correlation with volumes and prices of cov-lite, but
this correlation is inconsistent and often insignificant. The credit condition variables are also

7
weakly related to both the price and volume of cov-lite. Thus, time series patterns lend most
support to the coordination theory of cov-lite. These results are robust to the inclusion of macro-
economic forecasts.
The second set of results that directly backs the coordination hypothesis examines the cross-
sectional determinants of covenant-light contracts. That is, holding the point in time fixed, we
investigate which loans are cov-lite and which are not. To do so, we collect data on CLOs’ and
mutual funds’ loan-level holdings. As predicted, the loans that have many CLO or mutual fund
investors are considerably more likely to be covenant-light.7 Extending the analysis to maturity
and amortization, which also influence when and how creditors have control, we find that the
same ownership structures that are associated with cov-lite also have long maturities and less
amortization. A 5% increase in the ownership stake of mutual funds and CLOs is associated with
a 3.2% increase in the likelihood of cov-lite structures (about half of the unconditional average);
a 2.0% drop in the likelihood that the loan amortizes before maturity (about half of the
unconditional average); and a 0.2-year increase in loan maturity (the mean maturity is around 4.5
years). These results hold for CLOs and mutual funds individually, and as such are unlikely to be
driven by individual institutional features. Moreover, building on stock mutual funds literature,
we show that a mutual fund manager’s inattention to an individual loan, as proxied by the number
of holdings in their portfolio, is strongly positively correlated with their propensity to hold cov-
lite loans.
7 There should be no causal interpretation here in the context of individual loans. There is matching
between covenant-light loans and passive, dispersed investors. The design of an individual loan contract
happens before the actual investor composition is determined. However, this contract design likely
depends on both issuer preferences and market conditions, the latter perhaps transmitted to the firm by the
lead bank or other financial advisors.
8
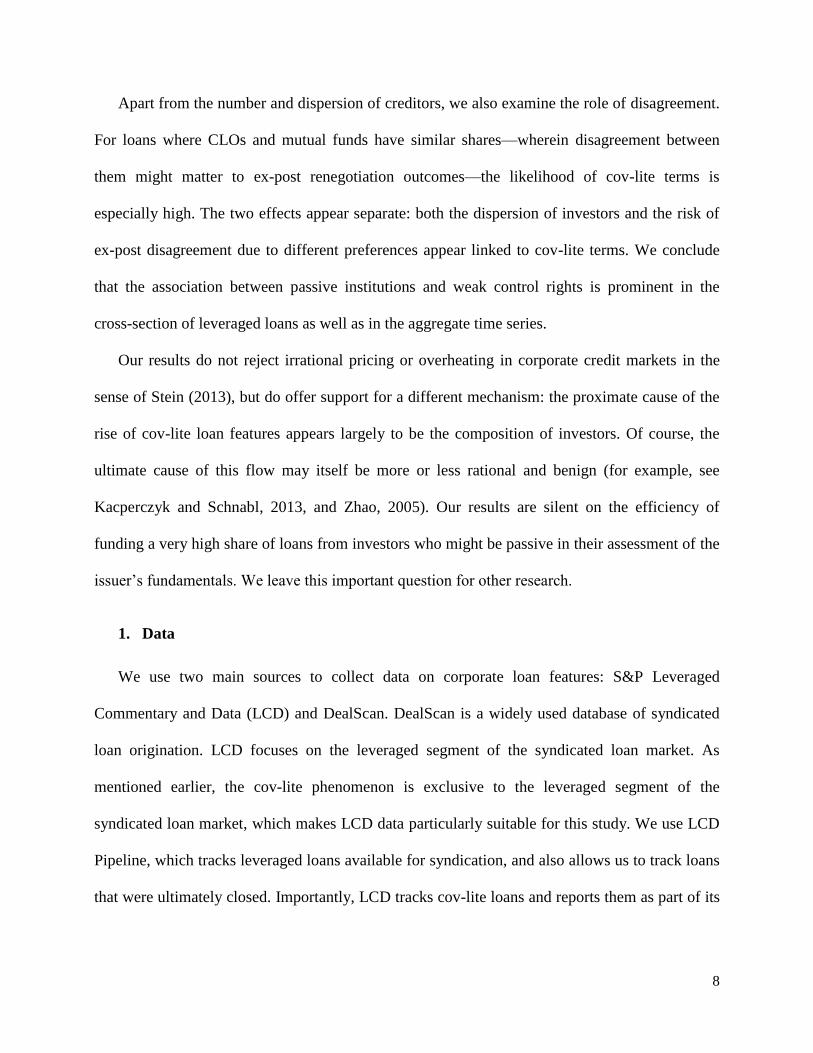
Apart from the number and dispersion of creditors, we also examine the role of disagreement.
For loans where CLOs and mutual funds have similar shares—wherein disagreement between
them might matter to ex-post renegotiation outcomes—the likelihood of cov-lite terms is
especially high. The two effects appear separate: both the dispersion of investors and the risk of
ex-post disagreement due to different preferences appear linked to cov-lite terms. We conclude
that the association between passive institutions and weak control rights is prominent in the
cross-section of leveraged loans as well as in the aggregate time series.
Our results do not reject irrational pricing or overheating in corporate credit markets in the
sense of Stein (2013), but do offer support for a different mechanism: the proximate cause of the
rise of cov-lite loan features appears largely to be the composition of investors. Of course, the
ultimate cause of this flow may itself be more or less rational and benign (for example, see
Kacperczyk and Schnabl, 2013, and Zhao, 2005). Our results are silent on the efficiency of
funding a very high share of loans from investors who might be passive in their assessment of the
issuer’s fundamentals. We leave this important question for other research.
1. Data
We use two main sources to collect data on corporate loan features: S&P Leveraged
Commentary and Data (LCD) and DealScan. DealScan is a widely used database of syndicated
loan origination. LCD focuses on the leveraged segment of the syndicated loan market. As
mentioned earlier, the cov-lite phenomenon is exclusive to the leveraged segment of the
syndicated loan market, which makes LCD data particularly suitable for this study. We use LCD
Pipeline, which tracks leveraged loans available for syndication, and also allows us to track loans
that were ultimately closed. Importantly, LCD tracks cov-lite loans and reports them as part of its

9
quarterly industry reviews. DealScan also has an indicator for cov-lite loans; however, reporting
quality is poor. We classify loans as cov-lite based on indicators in LCD.8
Data capital flow into CLOs and loan mutual funds also comes from LCD. For the cross-
sectional results, we collect data on loan ownership by CLOs and mutual funds. CLO holding
data is from trustee reports collected by CreditFlux and mutual fund holding data is from
Morningstar.
We collect macro-economic forecasts from the survey of professional forecasters run by the
Philadelphia Federal Reserve. In particular, we use the median four-quarter real GDP growth
forecast. We also use time series variables measuring credit market conditions from Gilchrist and
Zakrajšek (2012) and Greenwood and Hanson (2013). The variables are summarized in Table 1.
[TABLE 1]
2. Cov-lite pricing
We start by evaluating the proposition that the 2007–2008 financial crisis may have raised
managers’ willingness to pay for financial contract features that make them less vulnerable to
financial turmoil and to loss of control to creditors. If increased cov-lite issuance reflected a shift
in borrower demand for cov-lite loans (as more firms decide to pursue this option)—with an
inelastic supply—we would expect that the spread on cov-lite loans would have gone up. But the
trend in prices was just the opposite: as illustrated in Figure 2, the drop in loan spreads in the
post-crisis period was more pronounced for cov-lite loans than for cov-heavy loans. For cov-lite
8 The classification is based on whether enforcement of financial covenants is incurrence-based, as for
corporate bonds, or maintenance-based, as for traditional loans. While the distinction between
maintenance and incurrence covenants (and hence that between cov-lite and cov-heavy leveraged loans) is
essentially binary, a few intermediate cases also exist. For example, different categories of lenders may
have different covenant protections, or covenants may become incurrence-based only when a certain
amount of a revolving credit facility is drawn (these are called “springing covenants” or “quasi cov-lite”
loans). These situations are sufficiently rare that we have not attempted to deal with them.

10
loans, the spread drop between the first and second half of this period was roughly 170 bps (from
615 bps to 445 bps), whereas for cov-heavy loans the drop over the same period was about 35 bps
(from 468 bps to 436 bps).9 A 135-basis-point differential translated to a nearly a quarter drop in
spreads for cov-lite loans.
The pooled averages in Figure 2 may be confounded by selection effects. In Figure 3, we
present results after controlling for firm and loan characteristics such as deal size and purpose and
issuer credit rating, all of which are allowed to vary with issuance quarter. As before, these
results suggest that the price of covenant-light has been contracting, not increasing, contrary to
the managerial preference view. The initial differential is smaller once one accounts for quality,
but it still points to about a 50-basis-point drop in the price of cov-lite loans.
[FIGURES 2 & 3]
We should also consider shifts in the composition of the demand for cov-lite loans as an
explanation for the pricing patterns in Figures 2 and 3. In particular, cov-lite provisions are often
associated with higher quality issuers. (Indeed, large leveraged buyouts are most often not cov-
lite, which is not to say that they do not have other contractual weaknesses.) This observation is
consistent with a relatively small difference in the level of pricing between cov-lite and cov-
heavy loans leading up to the financial crisis, or over the more recent period (note that the quality
difference must be conditional on the control variables in Figure 3). Over time, this price
difference has narrowed, which could reflect a rising average quality—an increasing fraction of
better companies—choosing cov-lite provisions. One way to control for this quality difference is
to look at loan refinancing. This would generally help to account for unobserved variation
9 According to the NBER, 2009:Q2 marks the end of the 2007–2009 economic recession. However,
issuance of cov-lite loans over the later part of the recession period was nearly nonexistent. 2009:Q4
represents the first calendar quarter with at least two borrowers receiving cov-lite loans.

11
remaining between firms of the same size and rating issuing loans of similar characteristics (but
different covenant liteness).
In Figure 4 we examine loan pricing at refinancing. The refinancing decision is often dictated
by the maturity of the outstanding loan, and in that sense is not influenced by market conditions
(Almeida et al., 2012). The same point emerges from this analysis as from the cross-sectional
comparison: while there is an overall drop in prices following the Great Recession, the drop in
the prices of cov-lite loans is particularly aggressive. In the five-and-a-half years following the
Great Recession, the spread for firms refinancing into cov-lite loans dropped from a roughly 70
bps premium in the first half of the period to zero in the second half of the period.
[FIGURE 4]
The rise in cov-lite issuance has been accompanied by a contraction in its pricing (i.e., the
spread difference between otherwise comparable loans that are cov-lite and cov-heavy). This
contradicts the view that this phenomenon is driven by borrowers (if the time pattern of cov-lite
was driven by borrowers alone, the implicit price of cov-lite would be expected to rise as
volumes rose). We next turn to whether fluctuations in the leveraged loan investor base, which
are tied to the cost of coordination, can partially account for the increased incidence of cov-
liteness.
3. Coordination cost and incidence of cov-lite provisions
Although leveraged loans are originated by banks, non-banks or institutional investors
constitute the primary lender base in this market segment. According to S&P, in 2014, at loan
origination, only 10.4% of leveraged loans were held by banks.10
The three main institutional
10 Due to the over-the-counter nature of the loan market, there is little information about participants in the
secondary market. But arguably, the institutional base should only broaden through trading; in that sense,

12
types dominating this market are collateralized loan obligations (CLOs), mutual funds, and hedge
funds. In 2013, their total holdings exceeded 80% of loans at origination.
As illustrated in Figure 5, the institutional flow coincides with periods of cov-lite issuance.
The correlation of the incidence of cov-lite with CLO issuance and with the flow into loan funds
is 0.68 and 0.48, respectively, both statistically significant at the 1% level. The number of
different fund managers in this market—important from a coordination prospective—follows a
very similar pattern: it grew from 74 in 2000 to 307 (with nearly 900 different investment
vehicles) in 2007. This includes managers who either participated in at least three loans or made
at least $10 million of commitments. After the securitization shutdown at the end of 2007, the
number of institutional groups investing in leveraged loans dropped almost by half. However, this
number was essentially back to its pre-crisis level by the end of 2013, and reached 316 investor
groups by mid-2014.11
[FIGURE 5]
While the number of investors engaging in the leveraged loan market in the post-crisis period
is large, it is comparable to the pre-crisis levels; in contrast, the composition of the investor base
following the crisis is more diverse and complex. In 2013, CLOs were still the largest
institutional investor group, with roughly 45% of all primary holdings. But the new post-crisis
phenomenon is a rise in loan mutual funds. The share held by these mutual funds nearly tripled
following the financial crisis, rising from roughly 10% in 2006 to 27% by the end of 2013. As we
elaborate below, there are several structural differences between mutual funds and CLOs that
might lead to differences in incentives during loan renegotiation, making coordination among
institutional investors’ funding contribution in the primary market is a lower bound. Similarly, it is likely
that the number of the investors increases once the loan starts trading and stakes acquired on the primary
market get partially sold off. 11
For more information on institutional engagement in the leveraged loan market see Ivashina (2013).

13
creditors even more costly. Consequently, recent compositional changes in the leveraged loan
investor base may have driven a rise in renegotiation costs.
A. Time-series results
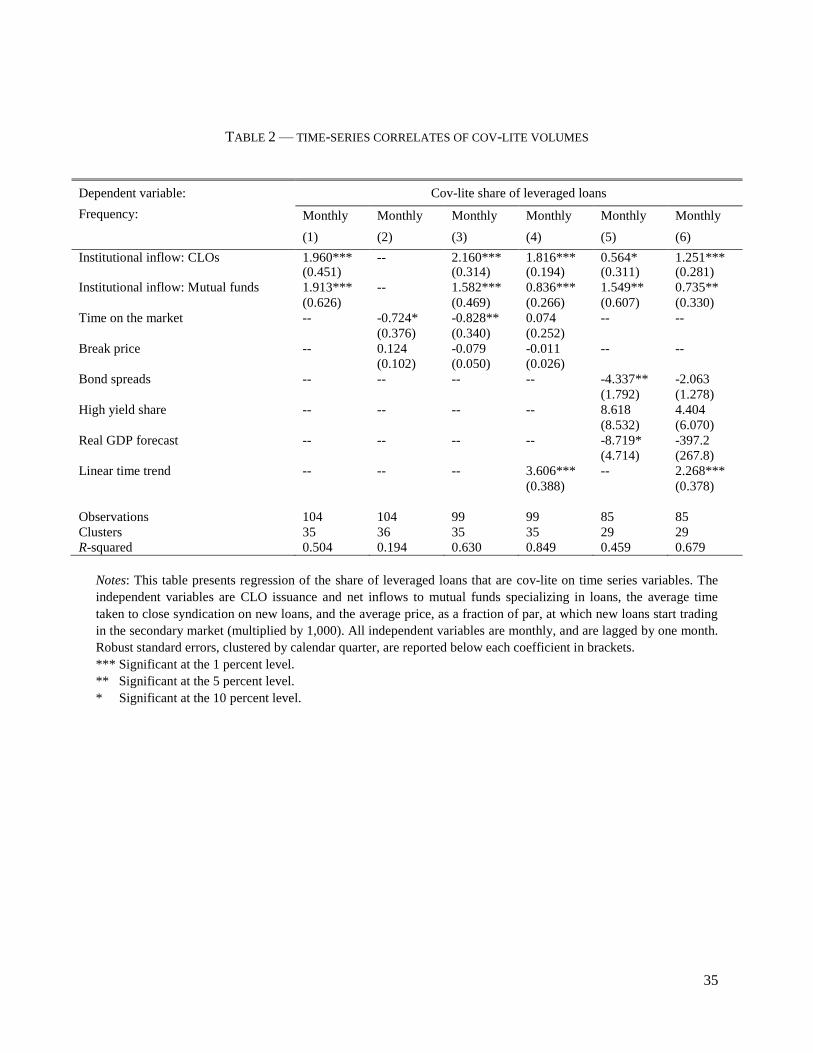
We first consider correlates of the time series pattern of prices and volumes. We use the
fraction (Table 2) and implied price on cov-lite (Table 3) as dependent variables. The implied
price is a regression coefficient on a cov-lite indicator (separate for each calendar month or
quarter) in a regression of loan yields on controls for size, size squared, maturity, loan rating, deal
purpose, and loan type, all interacted with issuance quarter fixed effects (Figure 3 illustrates these
prices).12
We explain the time series of volumes and prices at the monthly frequency (or quarterly, as
robustness checks) in a regression with three groups of variables: capturing the loan investor
composition, capturing general overheating, and capturing a generic time trend. As discussed
above, the key leveraged loan investor categories are mutual funds and CLOs. We measure
aggregate inflows, in billions of U.S. dollars, at the monthly frequency. When inflows are high,
the coordination theory predicts higher volumes of cov-lite and lower prices. We measure
overheating using two measures: the average time taken to close syndication on new loans, and
the average price, as a fraction of par, at which new loans start trading in the secondary market
(multiplied by 1,000). Both of these are expected to move if markets are somehow overheating in
the sense of Stein (2013). They could also move for other reasons, so that significant coefficients
need not be interpreted as firm evidence of mistakes or irrationality. We lag all the dependent
12 The regression standard errors are adjusted for the fact that the dependent variable is estimated. A more
efficient procedure estimating the coefficients of interest directly in one step is also possible, but the
regression output is less easy to interpret.

14
variables by one month to make sure we don’t include market responses to issuance as dependent
variables.
[TABLES 2 & 3]
In Table 2, we test whether coordination and overheating can explain the overall time pattern
in volumes. Institutional investor flows are strongly related to volumes (positively), as well as
prices (negatively). This holds whether or not we control for overheating variables, for variables
measuring credit market conditions, and for a time trend. In Table 3, we test whether lagged
variables can explain how implicit prices move over time. For both regressions, institutional flow
is highly significant. Overheating variables have more mixed significance (four out of 12
coefficients at the monthly frequency are significant). The linear time trend is positively
associated with volumes, but not pricing. The magnitude of the estimated effect of institutional
flows on volumes is large: a one-standard-deviation increase in the institutional flow variables is
associated with increases in the cov-lite share of 7.8% (CLOs) and 2.1% (mutual funds). The two
variables explain about half of the time series variation in the cov-lite share. The effect on pricing
is also large: one-standard-deviation increases reduce the price of cov-lite by 15bps and 13 bps,
respectively. The R-squared is lower for prices, in line with the noisy nature of this time series.
B. Cross-sectional results
Table 4 shows results relating cov-lite to loan syndicate structures in cross-sectional micro
data. The table uses a sample of 31,836 syndicated loans issued in the period from 2001–2014,
and rated below investment grade at issue. We have data on loan features for a little more than
14,000 of these. In column (1), we document that there is a strong correlation between the
number of mutual funds and CLOs participating in a loan syndicate at issue and the likelihood
that the loan is cov-lite. Each mutual fund in the syndicate increases the likelihood of cov-lite by
15
1.9% and each CLO increases the likelihood by 2.1%. In column (2), we control for the exact
month when a loan was issued. The coefficient estimates in this column are therefore purely
cross-sectional: if two loans are issued in the same month, is one with higher institutional
ownership more likely to be cov-lite? The answer is yes, and magnitudes are virtually identical.
In column (3), we add control variables. Large loans, long maturity loans, loans issued by private
equity-controlled issuers, and loans used to fund LBOs are all more likely to be cov-lite.
Furthermore, loans featuring no amortization (“Term Loan B” only loans) are more likely to be
cov-lite. To the extent that repayment increases control rights, the lower rate of repayment and
weak covenant protection may naturally go together. Controlling for these features, the number of
institutional investors still strongly predicts cov-lite structure (with similar magnitude and
significance).
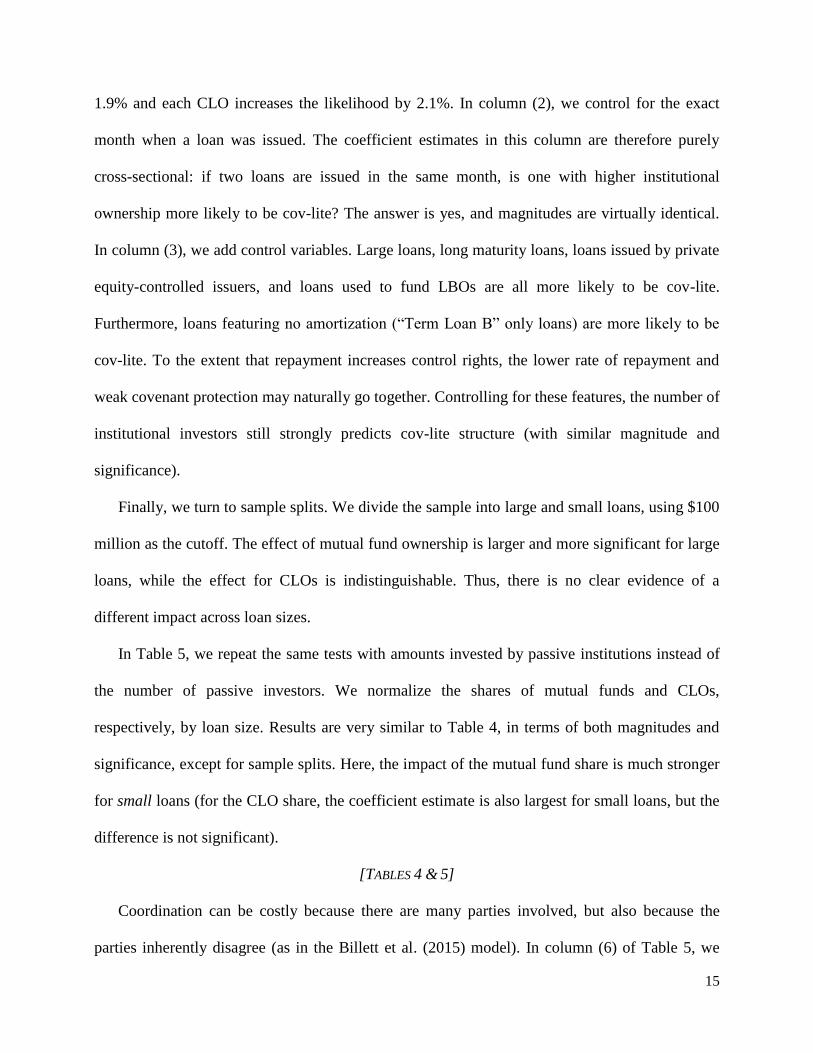
Finally, we turn to sample splits. We divide the sample into large and small loans, using $100
million as the cutoff. The effect of mutual fund ownership is larger and more significant for large
loans, while the effect for CLOs is indistinguishable. Thus, there is no clear evidence of a
different impact across loan sizes.
In Table 5, we repeat the same tests with amounts invested by passive institutions instead of
the number of passive investors. We normalize the shares of mutual funds and CLOs,
respectively, by loan size. Results are very similar to Table 4, in terms of both magnitudes and
significance, except for sample splits. Here, the impact of the mutual fund share is much stronger
for small loans (for the CLO share, the coefficient estimate is also largest for small loans, but the
difference is not significant).
[TABLES 4 & 5]
Coordination can be costly because there are many parties involved, but also because the
parties inherently disagree (as in the Billett et al. (2015) model). In column (6) of Table 5, we

16
include both the dollar share of investors and number of institutional investors, to run a ‘horse
race’ between the two types of variables. The number of investors appears more important,
suggesting that coordination costs may be associated with having many passive investors.
Another way to investigate the nature of coordination problems is to look at situations when
CLOs and mutual funds may disagree. The interests of these two types of investors may differ in
several ways. First, the managers at mutual funds and CLOs have different economics. In a
mutual fund, investors hold a pro-rata claim on the collateral pool and the manager’s incentives
are tied to its performance. In a CLO, the claims over the collateral pool differ in their seniority.
A CLO manager’s incentives are typically tied up in the equity. So one fundamental conflict
between a mutual fund manager and a CLO manager is akin to that between equity and debt
(Jensen and Meckling, 1976). A CLO manager might prefer to risk-shift by delaying a loan
restructuring, which is not the case for a mutual fund manager. In addition, differences in
institutional features—such as marking to book for a CLO vs. marking to market for a mutual
fund, or lack of redemptions for a CLO vs. mutual fund manager’s sensitivity to redemptions, or
a CLO hold-to-maturity structure with a limited ability to reinvest vs. active portfolio
management for a mutual fund, or simply less powered incentives of a CLO manager vs. a
mutual fund manager—could make the voting agents for CLOs and mutual funds behave
differently. One prominent example of high coordination cost due to the misalignment of
incentives is a loan amendment proposed by Momentive Performance Materials in 2009.13
The
loan amendment was structured as a coercive exchange; this was a common practice for the bond
market (where coordination is very costly, a necessary condition for a coercive exchange to go
through), but until 2009 there was no precedent for this practice in the loan market. This case
13 More details on this case can be found in Ivashina, V., and D. Scharfstein, “Momentive Performance
Materials, Inc." Harvard Business School Case 210-081.
17
specifically highlights the conflict between CLOs and hedge funds, pointing out that the proposal
would not have been possible in that context.14
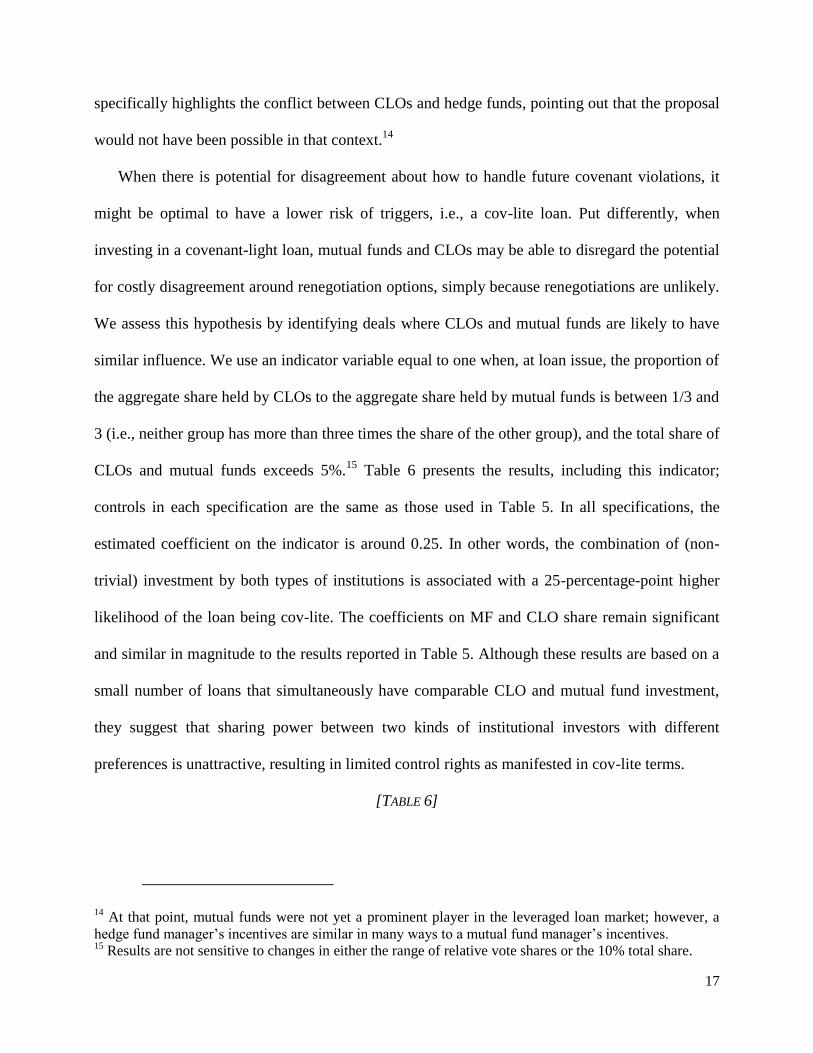
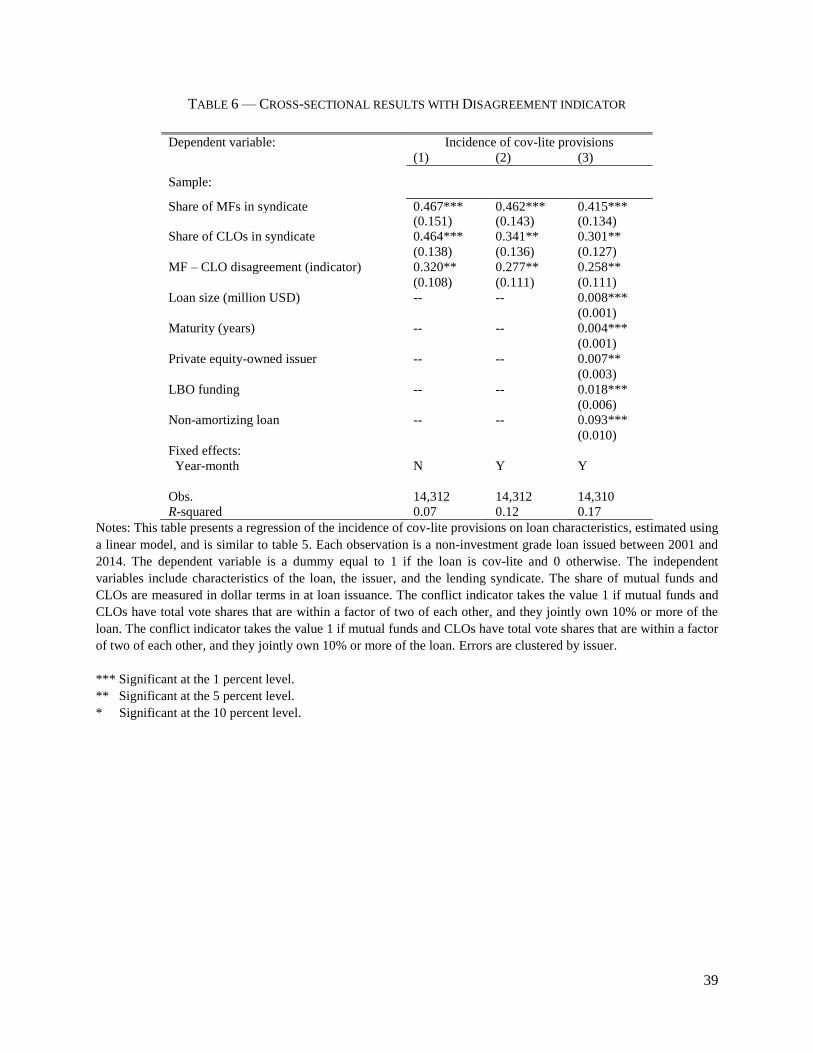
When there is potential for disagreement about how to handle future covenant violations, it
might be optimal to have a lower risk of triggers, i.e., a cov-lite loan. Put differently, when
investing in a covenant-light loan, mutual funds and CLOs may be able to disregard the potential
for costly disagreement around renegotiation options, simply because renegotiations are unlikely.
We assess this hypothesis by identifying deals where CLOs and mutual funds are likely to have
similar influence. We use an indicator variable equal to one when, at loan issue, the proportion of
the aggregate share held by CLOs to the aggregate share held by mutual funds is between 1/3 and
3 (i.e., neither group has more than three times the share of the other group), and the total share of
CLOs and mutual funds exceeds 5%.15
Table 6 presents the results, including this indicator;
controls in each specification are the same as those used in Table 5. In all specifications, the
estimated coefficient on the indicator is around 0.25. In other words, the combination of (non-
trivial) investment by both types of institutions is associated with a 25-percentage-point higher
likelihood of the loan being cov-lite. The coefficients on MF and CLO share remain significant
and similar in magnitude to the results reported in Table 5. Although these results are based on a
small number of loans that simultaneously have comparable CLO and mutual fund investment,
they suggest that sharing power between two kinds of institutional investors with different
preferences is unattractive, resulting in limited control rights as manifested in cov-lite terms.
[TABLE 6]
14 At that point, mutual funds were not yet a prominent player in the leveraged loan market; however, a
hedge fund manager’s incentives are similar in many ways to a mutual fund manager’s incentives. 15
Results are not sensitive to changes in either the range of relative vote shares or the 10% total share.
18
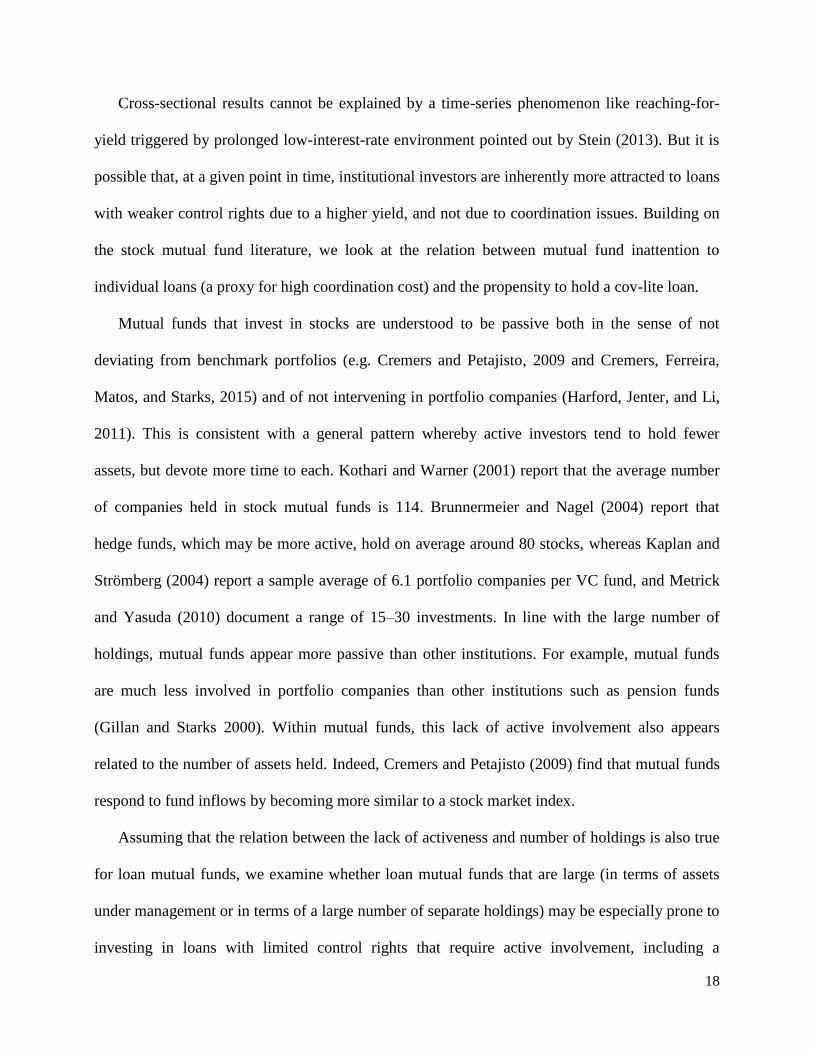
Cross-sectional results cannot be explained by a time-series phenomenon like reaching-for-
yield triggered by prolonged low-interest-rate environment pointed out by Stein (2013). But it is
possible that, at a given point in time, institutional investors are inherently more attracted to loans
with weaker control rights due to a higher yield, and not due to coordination issues. Building on
the stock mutual fund literature, we look at the relation between mutual fund inattention to
individual loans (a proxy for high coordination cost) and the propensity to hold a cov-lite loan.
Mutual funds that invest in stocks are understood to be passive both in the sense of not
deviating from benchmark portfolios (e.g. Cremers and Petajisto, 2009 and Cremers, Ferreira,
Matos, and Starks, 2015) and of not intervening in portfolio companies (Harford, Jenter, and Li,
2011). This is consistent with a general pattern whereby active investors tend to hold fewer
assets, but devote more time to each. Kothari and Warner (2001) report that the average number
of companies held in stock mutual funds is 114. Brunnermeier and Nagel (2004) report that
hedge funds, which may be more active, hold on average around 80 stocks, whereas Kaplan and
Strömberg (2004) report a sample average of 6.1 portfolio companies per VC fund, and Metrick
and Yasuda (2010) document a range of 15–30 investments. In line with the large number of
holdings, mutual funds appear more passive than other institutions. For example, mutual funds
are much less involved in portfolio companies than other institutions such as pension funds
(Gillan and Starks 2000). Within mutual funds, this lack of active involvement also appears
related to the number of assets held. Indeed, Cremers and Petajisto (2009) find that mutual funds
respond to fund inflows by becoming more similar to a stock market index.
Assuming that the relation between the lack of activeness and number of holdings is also true
for loan mutual funds, we examine whether loan mutual funds that are large (in terms of assets
under management or in terms of a large number of separate holdings) may be especially prone to
investing in loans with limited control rights that require active involvement, including a

19
preference for covenant-light loans. We test this by comparing the cov-lite share of individual
mutual funds with the number of loans they hold. In Figure 7, we plot the quarter-fund
observations of number of holdings and cov-lite share (in value terms). As is clear from this
figure, there is a strong positive relationship between the log of the number of holdings and cov-
lite share.16
[FIGURE 7 & TABLE 7]
We provide more detailed results in Table 7. For each mutual fund and holding period (i.e.,
quarter), we calculate the value-weighted share of cov-lite loans of the portfolio. This ranges
from zero to 16.4%, with a mean of 2.2%. We regress the cov-lite share on fund size, measured
as number of assets and number of holdings, with no fixed effects in column (1), with time fixed
effects in column (2) , with fund fixed effects in column (3), and with both types of fixed effects
in column (4). In most specifications, there is a positive association between the number of assets
and the cov-lite share of fund holdings, and when we control for mutual fund fixed effects, there
is a positive association between assets under management and cov-lite share. In columns (5) and
(6), we show that this holds for both open-end and closed-end mutual funds (the point estimate
for the coefficient is slightly higher for closed-end funds (the difference is not statistically
significant). We conclude from Table 7 and Figure 7 that there appears to be a robust positive
relationship between mutual fund size and holding more cov-lite loans. This is consistent with the
mutual fund literature’s finding that large mutual funds are the most passive, and consistent with
the idea that covenant-light is a control tool that passive investors find less appealing.
C. Other loan features
16 The relationship also holds with time fixed effects, mutual fund fixed effects, and with both. The linear
trend in Figure 6 has a t-statistic of 3.4 with time FE and clustering by fund. The effect also holds within
closed end and within open end funds.

20
In this last section of the paper we explore the relation between cov-liteness and other
contractual features. First, if the high incidence and low price of cov-lite in the recent period
reflects high coordination costs, other features of loans that impact the need for coordination
should demonstrate related time patterns. Specifically, we consider maturity and amortization. As
covenant enforcement, these are some of the fundamental contractual differences between bank
debt and bonds (e.g., Fridson, 2015). One way to increase creditor control is to ensure that the
initial debt must be partially or completely repaid (i.e., amortized or repaid), and thus refinanced
or renegotiated (e.g., Barnea, Haugen, and Senbert, 1980; Leland and Toft, 1996; and He and
Xiong, 2011).
In Table 8 we present results with an indicator for non-amortizing loan status and total loan
maturity at issue (we adjust the set of controls to match the dependent variable). For both
variables, there is a statistically significant association with the share of CLOs and mutual funds
in ownership structure.17
The effect holds whether or not we control for other loan features, such
as loan size and private equity (PE)-related issuers. The magnitudes are modest but interesting. In
loans where the share is positive, the average CLO and mutual fund shares are around 14% and
16%, respectively. Moving from zero to these typical values is associated with an increase in the
likelihood of no amortization of 1.8% and 4.5%, respectively, and an increase in loan maturity of
0.37 years and 0.12 years, respectively. Therefore, it appears these contract features reflect
similar forces beyond covenant type.
[TABLE 8]
The second set of results looks at four main categories of covenants: (i) restrictions on
indebtedness; (ii) restrictions on liens; (iii) restrictions on payments; and (iv) restrictions on asset
17 These results are similar using the number of investors instead of their share in the loan amount.

21
sales. These are the four categories that are common for almost all senior secured debt contracts.
The information on these features is tracked by XTRACT Research, which is the source of our
data, and which is commonly used by investors in the leveraged loan market to assess contract
terms. XTRACT is a relatively new company, and, as such, they have best coverage for the most
recent period. In the data that we have, each category is rated “weak,” “average,” or “strong.” We
count these as 0, 1, and 2. For each loan, we then aggregate covenant strength by adding up the
four numbers to get a covenant strength index ranging from zero to eight (we get very similar
results by treating average and strong as the same category). The index is available for 355 of the
loans in our sample, has an average of 3.24, a median of 4, and a standard deviation of 1.30. We
relate this index both to covenant light and to the mutual fund and CLO syndicate shares in Table
9.
[TABLE 9]
The results in Table 9 suggest that covenant tightness is unrelated to both the cov-lite
indicator and the share of mutual funds and CLOs in a loan syndicate. There is a negative relation
between tightness and the buyout indicator, suggesting that loans financing buyouts tend to have
less tight covenants. The absence of a link here suggests that loan institutions do not buy weaker
control across the board.
4. Final remarks
Credit markets exhibit strong cyclical patterns, which are associated with large swings in
output and investment. Evidence suggests that credit is low in recessions in part because banks
are unwilling to lend, i.e. the supply of loans is moving (see, e.g., Becker and Ivashina, 2014,
Ivashina and Scharfstein, 2010, and Jimenez, Ongena, Peydro, and Saurina, 2012). This suggests

22
that lending is “too low” in bad times, in the sense that frictions (in banking) have negative
effects on growth.
To what extent are credit markets also “too easy” in good times? There is a well-understood
theoretical mechanism that describes feedback between asset prices and leverage (e.g., Kiyotaki
and Moore, 1997, and Geanakopolos, 2009). Other mechanisms involving agency problems or
behavioral mistakes are also possible (see Stein, 2013). Understanding the extent to which credit
market swings reflect irrational exuberance is key for informed monetary policy formation, for
regulation, and for market participants.
In this paper, we consider a feature of syndicated loans—covenant-lightness—which has
recently been linked to exuberance and overheating. We provide a comprehensive framework for
thinking about cross-sectional patterns as well as trends in cov-lite loan issuance. We highlight
that analyses of cov-lite loans must account for (i) loan prices, and (ii) the composition of the
lender base.
Apart from the overheating explanation, an alternative theory suggests that optimal contracts
should give weaker control mechanisms to loan syndicates when participants are less informed
(as in Billett et al., 2015) and more dispersed (due to coordination costs). The recent uptick in
cov-lite lending does coincide with broadened participation in loan syndicates by mutual funds,
hedge funds, structured products, and other non-bank investors. A third explanation for the recent
boom argues that the uptick in volume reflects a shift in borrower preferences: in the wake of the
financial crisis, managers have increased the value they place on financial flexibility (which can
be improved by cov-lite borrowing).
Time series patterns of volumes do not offer clean separations between the overheating,
managerial flexibility, and coordination views of cov-lite, simply because there are few periods
and many variables changing at once. Therefore, we consider two pieces of additional evidence:

23
prices and cross-sectional variation in the use of cov-lite features. We document that holding
observables fixed, the price (i.e., yield difference) between cov-lite and cov-heavy has fallen at
the same time that the share of cov-lite rose rapidly. Thus, the “supply” of cov-lite, i.e., the
willingness of investors to accept it, appears to have increased considerably. This rules out the
managerial flexibility explanation of the recent cov-lite boom. The contracting explanation is
consistent with a sizeable increase in the share of leveraged loan tranches being acquired by
structured products.
We complement the time series findings with cross-sectional results, comparing loans with
different ownership structures issued at the same time. We find a strong association between
diverse ownership (many CLOs and mutual funds investing in a loan) and the incidence of cov-
lite.
In this paper, we have followed regulatory and industry interest in cov-lite provisions.
However, as far as credit cycles go, cov-liteness is just one of the contractual features that may be
associated with weaker creditor control rights, increases in the risk of new credit, and possible
reaching-for-yield. There is a multitude of other provisions (increased use of second liens and
pay-in-kind provisions, to name a few) that are likely to make loans riskier, but fit with a more
hands-off investor base. Cov-lite provisions are particularly interesting because the recent
increase in volumes has been so steep and because the contracts are so similar to existing
contracts in the bond market. However, we also document that loan repayment characteristics
follow a related pattern: repayment is slower and later in loans that involve many CLOs and
mutual funds. Thus, we document a broad connection between loan investors and loan
characteristics that affect creditor control rights.
Finally, our results shows that credit markets match contract terms to both creditor and
investor characteristics. When ownership changes, contract terms change. The data speaks a little

24
less clearly on whether overheating, over-optimism, or irrational exuberance can also play a role
in corporate credit markets. Our evidence suggests that overheating plays a limited role,
controlling for investor composition. Whether or not an increased share of institutions in credit
markets is on balance good or bad, whether it increases or reduces systemic risk, and whether it
may be a sign of possible overheating (for example, due to yield chasing by retail investors or by
regulated entities), is not addressed by our results.
25
References
Almeida, Heitor, Murillo Campello, Bruno Laranjeira and Scott Weisbenner, 2012, “Corporate Debt
Maturity and the Real Effects of 2007 Credit Crisis,” Critical Finance Review, 1(1), 3–58.
Barnea, Amir, Robert A. Haugen and Lemma W. Senbert, 1980, “A Rationale for Debt Maturity Structure
and Call Provisions in the Agency Theoretic Framework,” Journal of Finance, 35(5), 1223–1234.
Becker, Bo, and Victoria Ivashina, 2014, “Cyclicality of Credit Supply: Firm Level Evidence,” Journal of
Monetary Economics 62, 76–93.
Benmelech, Efraim, Jennifer Dlugosz, and Victoria Ivashina, 2012, “Securitization without adverse
selection: The case of CLOs,” Journal of Financial Economics, 106(1), 91–113.
Billet, Matthew, Redouane Elkamhi, Latchezar Popov, and Raunaq Pungaliya, 2014, “Bank Skin in the
Game and Loan Contract Design: Evidence from Covenant-Lite Loans,” Journal of Financial and
Quantitative Analysis, forthcoming.
Bolton, Patrick, and David, Scharfstein, 1996, “Optimal Debt Structure and the Number of Creditors,”
Journal of Political Economy 104, 1–25.
Cremers, K. J. Martin, Miguel A. Ferreira, Pedro P. Matos and Laura T. Starks, 2015, “Indexing and Active
Fund Management: International Evidence,” working paper.
Cremers, K. J. Martin, and Antti Petajisto, 2009, “How Active Is Your Fund Manager? A New Measure
That Predicts Performance,” Review of Financial Studies, 22(9), 3329–3365.
Fridson, Martin, (editor), 2015, High Yield, Future Tense: Cracking the Code of Speculative Debt. New
York Society of Security Analysts.
Geanakopolos, John, 2009, “The Leverage Cycle”, NBER Macroeconomics Manual, 24, 1–65.
Gertner, Robert, and David Scharfstetin, 1991, “A Theory of Workouts and the Effects of Reorganization
Law,” Journal of Finance 46, 1189–1221.
Gilchrist, Simon, and Egon Zakrajšek, 2012, “Credit Spreads and Business Cycle Fluctuations,” American
Economic Review, 102(4), 1692–1720.
Gillan, Stuart L., and Laura T. Starks, 2000, “Corporate governance proposals and shareholder activism:
the role of institutional investors,” Journal of Financial Economics, 57, 275–305.
Greenwood, Robin, and Samuel G. Hanson, 2013, “Issuer Quality and Corporate Bond Returns,” Review of
Financial Studies, 26(6), 1483–1525.
Harford, Jarrad, Dirk Jenter and Kai Li, 2011, “Institutional cross-holdings and their effect on acquisition
decisions,” Journal of Financial Economics, 99, 27–39.
He, Zhiguo, and Wei Xiong, 2011, “Rollover Risk and Credit Risk,” Journal of Finance, 67(2), 391–430.

26
Ivashina, Victoria, and David Scharfstein, 2010, “Bank Lending During the Financial Crisis of 2008,”
Journal of Financial Economics 97, 319v338.
Ivashina, Victoria, and Zheng Sun, 2011, “Institutional Demand Pressure and the Cost of Corporate
Loans,” Journal of Financial Economics 99, 500–522.
Jensen, M., and W. Meckling, 1976, “Theory of the Firm: Managerial Behavior, Agency Costs, and Capital
Structure,” Journal of Financial Economics 3, 305–360.
Jimenez, Gabriel, Steven Ongena, Jose-Luis Peydro and Jesus Saurina, 2012, “Credit Supply and Monetary
Policy: Identifying the Bank Balance-Sheet Channel with Loan Applications,” American Economic
Review, 102(5), 2301–2326.
Kacperczyk, Marcin, and Philipp Schnabl, 2013, “How Safe are Money Market Funds,” The Quarterly
Journal of Economics, 128(3), 1073–1122.
Kiyotaki, Nobuhiro, and John Moore, 1997, “Credit Cycles,” Journal of Political Economy, 105(2), 211–
248.
Kothari, S. P., and Jerold P. Warner, 2001, “Evaluating Mutual Fund Performance,” Journal of Finance,
61(5), 1985–2010.
Leland, Hayne, and Klaus Bjerre Toft, 1996, “Optimal capital structure, endogenous bankruptcy, and the
term structure of credit spreads,” Journal of Finance 51(3), 987–1019.
Metrick, Andrew, and Ayako Yasuda, 2010, “The Economics of Private Equity Funds,” Review of
Financial Studies, 23(6), 2303–2341.
Roberts, Michael, and Amir Sufi, 2009, “Renegotiation of Financial Contracts: Evidence from Private
Credit Agreements,” Journal of Financial Economics 93, 159–184.
Stein, Jeremy, 2013, Remarks at the Restoring Household Financial Stability after the Great Recession
Research Symposium, Federal Reserve Bank of St. Louis,
www.federalreserve.gov/newsevents/speech/stein20130207a.htm.
Smith, Clifford, and Jerold Warner, 1979, “On Financial contracting: an Analysis of Bond Contracts,”
Journal of Financial Economics 7, 117–161.
Van den Steen, Eric , 2010, “Disagreement and the Allocation of Control,” Journal of Law, Economics, &
Organization, 26(2), August, 385–426.
Zhao, Xinge, 2005, “Determinants of Flows into Retail Bond Funds,” Financial Analysts Journal, 61(4),
July, 47–59.

27
FIGURE 1. COV-LITE LOAN ISSUANCE, 1997–2014
Notes: The figure plots the fraction of newly issued leveraged loans that are “covenant-light.” Data is
compiled from Standard and Poor’s LCD U.S. loan pipeline data accessed on December 4, 2014. The
sample excludes deals classified by S&P as Middle Market. The volume for the fourth quarter of 2014 is
estimated using data through November 30, 2014.
0%
10%
20%
30%
40%
50%
60%19
97:Q
1
19
97:Q
3
19
98:Q
1
19
98:Q
3
19
99:Q
1
19
99:Q
3
20
00:Q
1
20
00:Q
3
20
01:Q
1
20
01:Q
3
20
02:Q
1
20
02:Q
3
20
03:Q
1
20
03:Q
3
20
04:Q
1
20
04:Q
3
20
05:Q
1
20
05:Q
3
20
06:Q
1
20
06:Q
3
20
07:Q
1
20
07:Q
3
20
08:Q
1
20
08:Q
3
20
09:Q
1
20
09:Q
3
20
10:Q
1
20
10:Q
3
20
11:Q
1
20
11:Q
3
20
12:Q
1
20
12:Q
3
20
13:Q
1
20
13:Q
3
20
14:Q
1
20
14:Q
3
Fraction of cov-lite loans (v.w.) Fraction of cov-lite loans (e.w.)

28
FIGURE 2. LOAN SPREAD: COV-LITE VS. COV-HEAVY LOANS
Notes: The figure plots all-fees-in-drawn spread paid over LIBOR. Data is compiled from Standard and
Poor’s LCD U.S. loan pipeline data accessed on December 4, 2014. The sample excludes deals classified
by S&P as Middle Market. For cov-lite loans, the sample excludes quarters with fewer than two
borrowers receiving new loans.
0
100
200
300
400
500
600
700
19
97:Q
1
19
97:Q
3
19
98:Q
1
19
98:Q
3
19
99:Q
1
19
99:Q
3
20
00:Q
1
20
00:Q
3
20
01:Q
1
20
01:Q
3
20
02:Q
1
20
02:Q
3
20
03:Q
1
20
03:Q
3
20
04:Q
1
20
04:Q
3
20
05:Q
1
20
05:Q
3
20
06:Q
1
20
06:Q
3
20
07:Q
1
20
07:Q
3
20
08:Q
1
20
08:Q
3
20
09:Q
1
20
09:Q
3
20
10:Q
1
20
10:Q
3
20
11:Q
1
20
11:Q
3
20
12:Q
1
20
12:Q
3
20
13:Q
1
20
13:Q
3
20
14:Q
1
20
14:Q
3
Bas
is p
oin
ts
Cov-lite loans Cov-heavy loans

29
FIGURE 3. COV-LITE PREMIUM: CROSS-SECTIONAL EVIDENCE
Notes: The figure plots all-fees-in-drawn spreads paid over LIBOR for cov-lite loans. Each column
represents the coefficient on a covenant-light indicator, controlling for size, size squared, maturity, loan
rating, deal purpose, loan type, all interacted with issuance quarter fixed effects. Data is compiled from
Standard and Poor’s LCD U.S. loan pipeline data accessed on December 4, 2014. The sample excludes
deals classified by S&P as Middle Market. Error bars indicate 95% confidence intervals based on robust
standard errors.
-100
-50
0
50
100
1502
00
63
200
64
200
71
200
72
200
73
200
74
200
81
200
82
200
83
200
84
200
91
200
92
200
93
200
94
201
01
201
02
201
03
201
04
201
11
201
12
201
13
201
14
201
21
201
22
201
23
201
24
201
31
201
32
201
33
201
34
201
41

30
FIGURE 4. COV-LITE PREMIUM: EVIDENCE FROM REFINANCING
Notes: The figure plots change in all-fees-in-drawn spread paid over LIBOR by the same borrower paid
on refinanced loans. Data is compiled from Standard and Poor’s LCD U.S. loan pipeline data accessed on
December 4, 2014 and DealScan. For cov-lite loans, the sample excludes quarters with fewer than two
borrowers receiving new loans.
-100
-50
0
50
100
150
200
250
300
350
400
450
Mar
-04
Sep
-04
Mar
-05
Sep
-05
Mar
-06
Sep
-06
Mar
-07
Sep
-07
Mar
-08
Sep
-08
Mar
-09
Sep
-09
Mar
-10
Sep
-10
Mar
-11
Sep
-11
Mar
-12
Sep
-12
Mar
-13
Sep
-13
Mar
-14
Sep
-14
Bas
is p
oin
ts
∆Spread, from cov-heavy to cov-lite ∆Spread, from cov-lite to cov-lite
∆Spread, from cov-heavy to cov-heavy
-50
-25
0
25
50
75
100
125
150
Mar
-04
Sep
-04
Mar
-05
Sep
-05
Mar
-06
Sep
-06
Mar
-07
Sep
-07
Mar
-08
Sep
-08
Mar
-09
Sep
-09
Mar
-10
Sep
-10
Mar
-11
Sep
-11
Mar
-12
Sep
-12
Mar
-13
Sep
-13
Mar
-14
Sep
-14
Bas
is p
oin
ts
Diff. (cov-lite - cov-heavy)

31
FIGURE 5. LOAN MARKET INSTITUTIONAL FUND FLOW
Notes: The figure plots fund flow into collateralized loan obligations (CLOs) and loan mutual funds. Both
of the institutional types concentrate their assets in leverage loans. The figure uses data from Lipper
downloaded from Standard and Poor’s LCD.
-6
0
6
12
18Ja
n-0
1
Jun
-01
Nov
-01
Apr-
02
Sep
-02
Feb
-03
Jul-
03
Dec
-03
May
-04
Oct
-04
Mar
-05
Aug
-05
Jan-0
6
Jun
-06
Nov
-06
Apr-
07
Sep
-07
Feb
-08
Jul-
08
Dec
-08
May
-09
Oct
-09
Mar
-10
Aug
-10
Jan-1
1
Jun
-11
Nov
-11
Apr-
12
Sep
-12
Feb
-13
Jul-
13
Dec
-13
May
-14
Bil
lion
US
D
New CLOs Mutual funds

32
FIGURE 6. MICRO EVIDENCE ON COV-LITE LOAN OWNERSHIP
Notes: The figures plot the mix of cov-lite and cov-heavy loans by number of institutional owners
participating in each loan at issue. Institutional owners are loan mutual funds in the first panel and
collateralized loan obligations (CLOs) in the second. The figure uses data from Lipper downloaded from
Standard and Poor’s LCD.
0%
10%
20%
30%
40%
50%
60%
70%
80%
90%
100%
0 1 2-3 4-6 7 or more
Cov-Lite Cov-Heavy
Number
of Mutual
Funds
0%
10%
20%
30%
40%
50%
60%
70%
80%
90%
100%
0 1 2-3 4-6 7 or moreCov-Lite Cov-Heavy
Number
of CLOs

33
FIGURE 7. MUTUAL FUND SIZE AND COV-LITE LOAN OWNERSHIP
Notes: The figure plots value-weighted share of cov-lite loans for a mutual fund in a given quarter against
the total number of loan holdings.
y = 6E-05x + 0.0134
R² = 0.0424
0
0.05
0.1
0.15
0.2
0.25
1 10 100 1000

34
TABLE 1. SUMMARY STATISTICS
Variable:
Mean Standard
deviation
Minimum Maximum
Institutional inflow: CLOs ($ billion) 4.25 4.27 0 13.78
Institutional inflow: Mutual funds ($ billion) 0.98 2.54 -5.46 8.91
Time on the market (days) 18.55 6.74 4.00 47.10
Break price (relative to par x 1,000) 991.6 22.4 815 1,012.9
Bond spread (Gilchrist and Zakrajšek, 2012) 2.83 1.43 1.43 7.95
High yield share (Greenwood and Hanson, 2013) 0.334 0.119 0.053 0.504
Cov-lite price, quarterly estimate 32.0 26.5 -43.2 70.4
Cov-lite price, monthly estimate -31.0 55.4 -277.7 150.8
Cov-lite share, leveraged loans (%) 14.1 14.3 0 43.1
Syndicate: Number of MFs 0.13 1.08 0 20
Syndicate: Number of CLOs 0.17 1.57 0 20
Notes: This table presents summary statistics for times series variables. Institutional inflow represents
inflow minus outflow to key investors in leveraged loans, based on data from Lipper, Standard & Poor’s
Structured Finance Group, JP Morgan, Merrill Lynch, Citigroup, S&P/LSTA Index, Standard & Poor’s
LCD. Mutual funds include open-end funds, close-end funds, and ETF funds. Time on the market is the
average time between when a new loan is introduced and when the deal is closed. Break price is the price
at which a loan first trades in the secondary market, as a fraction of par. Cov-lite price is a regression
coefficient on a cov-lite indicator, controlling for size, size squared, maturity, loan rating, deal purpose,
and loan type, all interacted with issuance quarter fixed effects (se Figure 3). When nothing else is
indicated, a variable is measured at monthly frequency.
35
TABLE 2 — TIME-SERIES CORRELATES OF COV-LITE VOLUMES
Dependent variable: Cov-lite share of leveraged loans
Frequency: Monthly Monthly Monthly Monthly Monthly Monthly
(1) (2) (3) (4) (5) (6)
Institutional inflow: CLOs 1.960*** -- 2.160*** 1.816*** 0.564* 1.251*** (0.451) (0.314) (0.194) (0.311) (0.281)
Institutional inflow: Mutual funds 1.913*** -- 1.582*** 0.836*** 1.549** 0.735**
(0.626) (0.469) (0.266) (0.607) (0.330)
Time on the market -- -0.724* -0.828** 0.074 -- --
(0.376) (0.340) (0.252)
Break price -- 0.124 -0.079 -0.011 -- --
(0.102) (0.050) (0.026)
Bond spreads -- -- -- -- -4.337** -2.063
(1.792) (1.278)
High yield share -- -- -- -- 8.618 4.404
(8.532) (6.070)
Real GDP forecast -- -- -- -- -8.719* -397.2
(4.714) (267.8)
Linear time trend -- -- -- 3.606*** -- 2.268***
(0.388) (0.378)
Observations 104 104 99 99 85 85
Clusters 35 36 35 35 29 29
R-squared 0.504 0.194 0.630 0.849 0.459 0.679
Notes: This table presents regression of the share of leveraged loans that are cov-lite on time series variables. The
independent variables are CLO issuance and net inflows to mutual funds specializing in loans, the average time
taken to close syndication on new loans, and the average price, as a fraction of par, at which new loans start trading
in the secondary market (multiplied by 1,000). All independent variables are monthly, and are lagged by one month.
Robust standard errors, clustered by calendar quarter, are reported below each coefficient in brackets.
*** Significant at the 1 percent level.
** Significant at the 5 percent level.
* Significant at the 10 percent level.

36
TABLE 3 — TIME-SERIES CORRELATES OF COV-LITE PRICING
Dependent variable: Cov-lite price
Frequency: Monthly Monthly Monthly Monthly Monthly Monthly Quarterly
(1) (2) (3) (4) (5) (6) (7)
Institutional inflow: CLOs -2.479* -- -3.501*** -3.504*** -6.851** -6.252* -2.635*** (1.379) (1.1175) (1.195) (3.129) (3.580) (0.782)
Institutional inflow: Mutual funds -3.420* -- -5.167*** -5.175*** -5.600** -6.149** -3.350***
(1.572) (1.430) (1.494) (2.751) (2.900) (1.721)
Time on market -- -0.180 -0.476 -0.448 -- -- 1.198**
(0.595) (0.631) (0.708) (0.520)
Break price -- 0.075 1.017** 1.017** -- -- 1.327***
(0.756) (0.486) (0.493) (0.235)
Bond spreads -- -- -- -- -119.7 -55.018 --
(73.77) (35.065)
High yield share -- -- -- -- -57.071 -121.97 --
(38.712) (80.24)
Real GDP forecast -- -- -- -- -41.828 -31.956 --
(29.433) (40.643)
Linear time trend -- -- -- 0.086 -- 1.527 -0.823
(2.465) (5.285) (1.640)
Obs. 71 73 71 71 52 50 71
Clusters 26 27 26 26 20 20 24
R-squared 0.059 0.006 0.091 0.091 0.143 0.144 0.497
Notes: This table presents regression of the implicit price of cov-lite by time period on time series variables. The
implicit price is the coefficient on a cov-lite indicator (separate for each calendar month or quarter) in a regression of
loan yields on controls for size, size squared, maturity, loan rating, deal purpose, and loan type, all interacted with
issuance quarter fixed effects (presented in Figure 3). The independent variables are new CLOs and net inflows to
mutual funds specializing in loans, the average time taken to close syndication on new loans, and the average price,
as a fraction of par, at which new loans start trading in the secondary market (multiplied by 1,000). All independent
variables are monthly, and are lagged by one month. Robust standard errors, clustered by calendar quarter, are
reported below each coefficient in brackets.
*** Significant at the 1 percent level.
** Significant at the 5 percent level.
* Significant at the 10 percent level.

37
TABLE 4 — CROSS-SECTIONAL RESULTS (NUMBER OF INVESTORS AT ISSUE)
Dependent variable: Incidence of cov-lite provisions
(1) (2) (3) (4) (5)
Sample:
Below
$100m
$100m or
larger
Syndicate: Number of MFs 0.019*** 0.020*** 0.017*** 0.045*** 0.012** (0.005) (0.005) (0.005) (0.010) (0.005)
Syndicate: Number of CLOs 0.021*** 0.017*** 0.015*** 0.015*** 0.012***
(0.004) (0.004) (0.004) (0.006) (0.004)
Loan size (million USD) -- -- 0.007*** 0.002*** 0.022***
(0.001) (0.000) (0.004)
Maturity (years) -- -- 0.003*** 0.002*** 0.005***
(0.001) (0.000) (0.001)
Private equity-owned issuer -- -- 0.008** 0.002 0.022***
(0.003) (0.002) (0.008)
LBO funding -- -- 0.016*** 0.001 0.050***
(0.006) (0.003) (0.016)
Non-amortizing loan -- -- 0.089*** 0.048*** 0.108***
(0.011) (0.011) (0.014)
Fixed effects:
Year-month N Y Y Y Y
Obs. 14,312 14,312 14,031 9,429 4,881
R-squared 0.11 0.15 0.19 0.19 0.23
Notes: This table presents regression of the incidence of cov-lite provisions on loan characteristics, estimated using a
linear model. Each observation is a non-investment grade loan issued between 2001 and 2014. The dependent
variable is a dummy equal to 1 if the loan is cov-lite and 0 otherwise. The independent variables include
characteristics of the loan, the issuer, and the lending syndicate. The variables measuring the number of mutual
funds and CLOs in the loan syndicate are both capped at 20. Errors are clustered by issuer.
*** Significant at the 1 percent level.
** Significant at the 5 percent level.
* Significant at the 10 percent level.

38
TABLE 5 — CROSS-SECTIONAL RESULTS (AMOUNTS PURCHASED AT ISSUE)
Dependent variable: Incidence of cov-lite provisions
(1) (2) (3) (4) (5) (6)
Sample:
Below
$100m
$100m or
larger
Share of MFs in syndicate 0.617*** 0.590*** 0.567*** 0.418*** 0.746*** 0.163 (0.163) (0.157) (0.153) (0.154) (0.231) (0.118)
Share of CLOs in syndicate 0.527*** 0.388*** 0.330*** 0.308*** 0.686** 0.016
(0.141) (0.137) (0.130) (0.120) (0.283) (0.121)
Syndicate: Number of MFs -- -- -- -- -- 0.014***
(0.006)
Syndicate: Number of CLOs -- -- -- -- -- 0.015***
(0.004)
Loan size (million USD) -- -- 0.009**** 0.003*** 0.006*** 0.006***
(0.001) (0.000) (0.001) (0.001)
Maturity (years) -- -- 0.004*** 0.001*** 0.006*** 0.003***
(0.001) (0.000) (0.001) (0.001)
Private equity-owned issuer -- -- 0.008** 0.001 0.023*** 0.006*
(0.003) (0.002) (0.008) (0.003)
LBO funding -- -- 0.018*** 0.004 0.052*** 0.018***
(0.006) (0.003) (0.016) (0.006)
Non-amortizing loan -- -- 0.094*** 0.054*** 0.052*** 0.087***
(0.011) (0.011) (0.016) (0.010)
Fixed effects:
Year-month N Y Y Y Y Y
Obs. 14,313 14,313 14,310 9,429 4,881 14,313
R-squared 0.05 0.10 0.17 0.14 0.20 0.19
Notes: This table presents a regression of the incidence of cov-lite provisions on loan characteristics, estimated using
a linear model. Each observation is a non-investment grade loan issued between 2001 and 2014. The dependent
variable is a dummy equal to 1 if the loan is cov-lite and 0 otherwise. The independent variables include
characteristics of the loan, the issuer, and the lending syndicate. The share of mutual funds and CLOs are measured
in dollar terms in at loan issuance. Errors are clustered by issuer.
*** Significant at the 1 percent level.
** Significant at the 5 percent level.
* Significant at the 10 percent level.
39
TABLE 6 — CROSS-SECTIONAL RESULTS WITH DISAGREEMENT INDICATOR
Dependent variable: Incidence of cov-lite provisions
(1) (2) (3)
Sample:
Share of MFs in syndicate 0.467*** 0.462*** 0.415*** (0.151) (0.143) (0.134)
Share of CLOs in syndicate 0.464*** 0.341** 0.301**
(0.138) (0.136) (0.127)
MF – CLO disagreement (indicator) 0.320** 0.277** 0.258**
(0.108) (0.111) (0.111)
Loan size (million USD) -- -- 0.008***
(0.001)
Maturity (years) -- -- 0.004***
(0.001)
Private equity-owned issuer -- -- 0.007**
(0.003)
LBO funding -- -- 0.018***
(0.006)
Non-amortizing loan -- -- 0.093***
(0.010)
Fixed effects:
Year-month N Y Y
Obs. 14,312 14,312 14,310
R-squared 0.07 0.12 0.17
Notes: This table presents a regression of the incidence of cov-lite provisions on loan characteristics, estimated using
a linear model, and is similar to table 5. Each observation is a non-investment grade loan issued between 2001 and
2014. The dependent variable is a dummy equal to 1 if the loan is cov-lite and 0 otherwise. The independent
variables include characteristics of the loan, the issuer, and the lending syndicate. The share of mutual funds and
CLOs are measured in dollar terms in at loan issuance. The conflict indicator takes the value 1 if mutual funds and
CLOs have total vote shares that are within a factor of two of each other, and they jointly own 10% or more of the
loan. The conflict indicator takes the value 1 if mutual funds and CLOs have total vote shares that are within a factor
of two of each other, and they jointly own 10% or more of the loan. Errors are clustered by issuer.
*** Significant at the 1 percent level.
** Significant at the 5 percent level.
* Significant at the 10 percent level.

40
TABLE 7 — CROSS-FUND RESULTS: SIZE AND COV-LITE SHARE
Dependent variable: Cov-lite share of fund holdings
(1) (2) (3) (4) (5) (6)
Sample: All All All All Open-end Closed-end
Log of assets under management -0.0004 -0.0002 0.0134*** 0.0047** 0.0000 -0.0043
(0.0017) (0.0014) (0.0024) (0.0023) (0.0019) (0.0044)
Log of number of holdings 0.0108*** 0.0058*** 0.0154*** 0.0035 0.0093*** 0.0136***
(0.0016) (0.0016) (0.0026) (0.0022) (0.0022) (0.0017)
Fixed effects:
Year-quarter - Yes - Yes - -
Mutual fund - - Yes Yes - -
Obs. 830 830 830 830 495 335
R-squared 0.15 0.48 0.53 0.70 0.11 0.24
Notes: This table presents a regression of the cov-lite loan holdings of mutual funds. Each observation is a quarterly
observation of a mutual fund’s loan holdings. The sample period is 2010:Q1–2014:Q4. The last column indicates
independent variable means and standard deviations.
The dependent variable is either a dummy indicating whether a loan is amortizing (1) or bullet (0); or a continuous
variable measuring loan maturity (in years). The independent variables include characteristics of the loan, the issuer,
and the lending syndicate. The share of mutual funds and CLOs are measured in dollar terms in at loan issuance.
Errors are clustered by mutual fund.
*** Significant at the 1 percent level.
** Significant at the 5 percent level.
* Significant at the 10 percent level.

41
TABLE 8 — LOAN FEATURES REGULATING LENDER CONTROL
Dependent variable: Non-amortizing loan Maturity
(1) (2) (3) (4)
Share of MFs in syndicate 0.220 0.133* 4.174*** 3.363***
(0.152) (0.076) (0.829) (0.420)
Share of CLOs in syndicate 0.408*** 0.276*** 1.164** 0.766*
(0.135) (0.095) (0.487) (0.441)
Loan size (million USD) -- 0.039*** -- 0.160***
(0.002) (0.018)
Maturity (years) -- 0.007*** -- --
(0.002)
Private equity-owned issuer -- 0.007 -- 0.584***
(0.008) (0.049)
LBO funding -- -0.051*** -- 0.775***
(0.009) (0.063)
Non-amortizing loan -- -- -- 0.302***
(0.080)
Fixed effects:
Year-month Y Y Y Y
Obs. 14,313 14,310 14,313 14,310
R-squared 0.05 0.05 0. 08 0.14
Notes: This table presents a regression of the incidence of cov-lite provisions on loan characteristics, estimated using
a linear model. Each observation is a non-investment grade loan issued between 2001 and 2014. The dependent
variable is either a dummy indicating whether a loan is amortizing (1) or bullet (0); or a continuous variable
measuring loan maturity (in years). The independent variables include characteristics of the loan, the issuer, and the
lending syndicate. The share of mutual funds and CLOs are measured in dollar terms in at loan issuance. Errors are
clustered by issuer.
*** Significant at the 1 percent level.
** Significant at the 5 percent level.
* Significant at the 10 percent level.
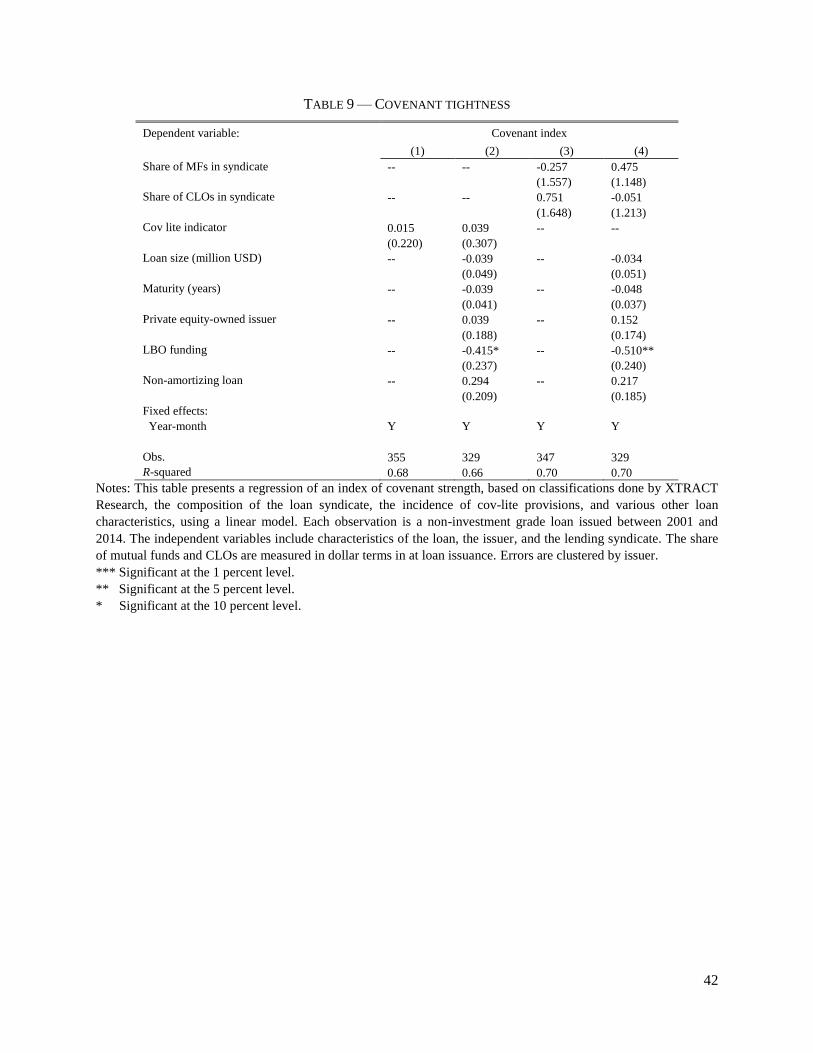
42
TABLE 9 — COVENANT TIGHTNESS
Dependent variable: Covenant index
(1) (2) (3) (4)
Share of MFs in syndicate -- -- -0.257 0.475
(1.557) (1.148)
Share of CLOs in syndicate -- -- 0.751 -0.051
(1.648) (1.213)
Cov lite indicator 0.015 0.039 -- --
(0.220) (0.307)
Loan size (million USD) -- -0.039 -- -0.034
(0.049) (0.051)
Maturity (years) -- -0.039 -- -0.048
(0.041) (0.037)
Private equity-owned issuer -- 0.039 -- 0.152
(0.188) (0.174)
LBO funding -- -0.415* -- -0.510**
(0.237) (0.240)
Non-amortizing loan -- 0.294 -- 0.217
(0.209) (0.185)
Fixed effects:
Year-month Y Y Y Y
Obs. 355 329 347 329
R-squared 0.68 0.66 0.70 0.70
Notes: This table presents a regression of an index of covenant strength, based on classifications done by XTRACT
Research, the composition of the loan syndicate, the incidence of cov-lite provisions, and various other loan
characteristics, using a linear model. Each observation is a non-investment grade loan issued between 2001 and
2014. The independent variables include characteristics of the loan, the issuer, and the lending syndicate. The share
of mutual funds and CLOs are measured in dollar terms in at loan issuance. Errors are clustered by issuer.
*** Significant at the 1 percent level.
** Significant at the 5 percent level.
* Significant at the 10 percent level.