course guide ibm network performance insight 1.3.1
TRANSCRIPT
®
Course Guide
IBM Network Performance Insight 1.3.1 Installation and ConfigurationCourse code: TN530 ERC 1.0
IBM Training

March 2020 edition
NOTICESThis information was developed for products and services offered in the USA.
IBM may not offer the products, services, or features discussed in this document in other countries. Consult your local IBM representative for information on the products and services currently available in your area. Any reference to an IBM product, program, or service is not intended to state or imply that only that IBM product, program, or service may be used. Any functionally equivalent product, program, or service that does not infringe any IBM intellectual property right may be used instead. However, it is the user's responsibility to evaluate and verify the operation of any non-IBM product, program, or service.
IBM may have patents or pending patent applications covering subject matter described in this document. The furnishing of this document does not grant you any license to these patents. You can send license inquiries, in writing, to:
IBM Director of Licensing IBM Corporation North Castle Drive, MD-NC119 Armonk, NY 10504-1785 United States of America
The following paragraph does not apply to the United Kingdom or any other country where such provisions are inconsistent with local law: INTERNATIONAL BUSINESS MACHINES CORPORATION PROVIDES THIS PUBLICATION "AS IS" WITHOUT WARRANTY OF ANY KIND, EITHER EXPRESS OR IMPLIED, INCLUDING, BUT NOT LIMITED TO, THE IMPLIED WARRANTIES OF NON-INFRINGEMENT, MERCHANTABILITY OR FITNESS FOR A PARTICULAR PURPOSE. Some states do not allow disclaimer of express or implied warranties in certain transactions, therefore, this statement may not apply to you.
This information could include technical inaccuracies or typographical errors. Changes are periodically made to the information herein; these changes will be incorporated in new editions of the publication. IBM may make improvements and/or changes in the product(s) and/or the program(s) described in this publication at any time without notice.
Any references in this information to non-IBM websites are provided for convenience only and do not in any manner serve as an endorsement of those websites. The materials at those websites are not part of the materials for this IBM product and use of those websites is at your own risk.
IBM may use or distribute any of the information you supply in any way it believes appropriate without incurring any obligation to you.
Information concerning non-IBM products was obtained from the suppliers of those products, their published announcements or other publicly available sources. IBM has not tested those products and cannot confirm the accuracy of performance, compatibility or any other claims related to non-IBM products. Questions on the capabilities of non-IBM products should be addressed to the suppliers of those products.
This information contains examples of data and reports used in daily business operations. To illustrate them as completely as possible, the examples include the names of individuals, companies, brands, and products. All of these names are fictitious and any similarity to the names and addresses used by an actual business enterprise is entirely coincidental.
TRADEMARKSIBM, the IBM logo, and ibm.com are trademarks or registered trademarks of International Business Machines Corp., registered in many jurisdictions worldwide. Other product and service names might be trademarks of IBM or other companies. A current list of IBM trademarks is available on the web at “Copyright and trademark information” at www.ibm.com/legal/copytrade.shtml.
Adobe, the Adobe logo, PostScript, and the PostScript logo are either registered trademarks or trademarks of Adobe Systems Incorporated in the United States, and/or other countries.
Cell Broadband Engine is a trademark of Sony Computer Entertainment, Inc. in the United States, other countries, or both and is used under license therefrom.
Intel, Intel logo, Intel Inside, Intel Inside logo, Intel Centrino, Intel Centrino logo, Celeron, Intel Xeon, Intel SpeedStep, Itanium, and Pentium are trademarks or registered trademarks of Intel Corporation or its subsidiaries in the United States and other countries.
IT Infrastructure Library is a Registered Trade Mark of AXELOS Limited.
ITIL is a Registered Trade Mark of AXELOS Limited.
Java and all Java-based trademarks and logos are trademarks or registered trademarks of Oracle and/or its affiliates.
Linear Tape-Open, LTO, the LTO Logo, Ultrium, and the Ultrium logo are trademarks of HP, IBM Corp. and Quantum in the U.S. and other countries.
Linux is a registered trademark of Linus Torvalds in the United States, other countries, or both.
Microsoft, Windows, Windows NT, and the Windows logo are trademarks of Microsoft Corporation in the United States, other countries, or both.
UNIX is a registered trademark of The Open Group in the United States and other countries.
© Copyright International Business Machines Corporation 2016. This document may not be reproduced in whole or in part without the prior written permission of IBM.
US Government Users Restricted Rights - Use, duplication or disclosure restricted by GSA ADP Schedule Contract with IBM Corp.

ContentsAbout this course . . . . . . . . . . . . . . . . . . . . . . . . . . . . . . . . . . . . . . . . . . . . . . . . . . . . . . . . . . . . . . . . . v
Course objectives . . . . . . . . . . . . . . . . . . . . . . . . . . . . . . . . . . . . . . . . . . . . . . . . . . . . . . . . . . . . . . . . . . . . . viiAudience . . . . . . . . . . . . . . . . . . . . . . . . . . . . . . . . . . . . . . . . . . . . . . . . . . . . . . . . . . . . . . . . . . . . . . . . . . . . viiPrerequisites . . . . . . . . . . . . . . . . . . . . . . . . . . . . . . . . . . . . . . . . . . . . . . . . . . . . . . . . . . . . . . . . . . . . . . . . . viiAgenda . . . . . . . . . . . . . . . . . . . . . . . . . . . . . . . . . . . . . . . . . . . . . . . . . . . . . . . . . . . . . . . . . . . . . . . . . . . . viii
Unit 1 Overview and installation . . . . . . . . . . . . . . . . . . . . . . . . . . . . . . . . . . . . . . . . . . . . . . . . . . . . 1-1Unit objectives . . . . . . . . . . . . . . . . . . . . . . . . . . . . . . . . . . . . . . . . . . . . . . . . . . . . . . . . . . . . . . . . . . . . . . . 1-2Lesson 1 Overview . . . . . . . . . . . . . . . . . . . . . . . . . . . . . . . . . . . . . . . . . . . . . . . . . . . . . . . . . . . . . . . . . . 1-3What is Network Performance Insight? . . . . . . . . . . . . . . . . . . . . . . . . . . . . . . . . . . . . . . . . . . . . . . . . . . . . 1-4Network Performance Insight dashboards and reports . . . . . . . . . . . . . . . . . . . . . . . . . . . . . . . . . . . . . . . . 1-5
. . . . . . . . . . . . . . . . . . . . . . . . . . . . . . . . . . . . . . . . . . . . . . . . . . . . . . . . . . . . . . . . . . . . . . . . . . . . . . . . 1-5Architecture . . . . . . . . . . . . . . . . . . . . . . . . . . . . . . . . . . . . . . . . . . . . . . . . . . . . . . . . . . . . . . . . . . . . . . . . . 1-6Lesson 2 Installation . . . . . . . . . . . . . . . . . . . . . . . . . . . . . . . . . . . . . . . . . . . . . . . . . . . . . . . . . . . . . . . . . 1-8Setting up passwordless SSH . . . . . . . . . . . . . . . . . . . . . . . . . . . . . . . . . . . . . . . . . . . . . . . . . . . . . . . . . . . 1-9Editing kernel parameters . . . . . . . . . . . . . . . . . . . . . . . . . . . . . . . . . . . . . . . . . . . . . . . . . . . . . . . . . . . . . 1-11Processes and open files . . . . . . . . . . . . . . . . . . . . . . . . . . . . . . . . . . . . . . . . . . . . . . . . . . . . . . . . . . . . . . 1-12Required operating system packages . . . . . . . . . . . . . . . . . . . . . . . . . . . . . . . . . . . . . . . . . . . . . . . . . . . . 1-13Disabling the python security certificate verification . . . . . . . . . . . . . . . . . . . . . . . . . . . . . . . . . . . . . . . . . 1-14Installing Ambari and Hortonworks Data Platform (HDP) . . . . . . . . . . . . . . . . . . . . . . . . . . . . . . . . . . . . . 1-15Setting up the Network Performance Insight cluster . . . . . . . . . . . . . . . . . . . . . . . . . . . . . . . . . . . . . . . . . 1-17Key fields in the installation wizard . . . . . . . . . . . . . . . . . . . . . . . . . . . . . . . . . . . . . . . . . . . . . . . . . . . . . . 1-18Unit summary . . . . . . . . . . . . . . . . . . . . . . . . . . . . . . . . . . . . . . . . . . . . . . . . . . . . . . . . . . . . . . . . . . . . . . . 1-19Exercise: Installation . . . . . . . . . . . . . . . . . . . . . . . . . . . . . . . . . . . . . . . . . . . . . . . . . . . . . . . . . . . . . . . . . 1-20
Unit 2 Integration . . . . . . . . . . . . . . . . . . . . . . . . . . . . . . . . . . . . . . . . . . . . . . . . . . . . . . . . . . . . . . . . . 2-1Unit objectives . . . . . . . . . . . . . . . . . . . . . . . . . . . . . . . . . . . . . . . . . . . . . . . . . . . . . . . . . . . . . . . . . . . . . . . 2-2Lesson 1 Integration with IBM Tivoli Network Manager . . . . . . . . . . . . . . . . . . . . . . . . . . . . . . . . . . . . . . . 2-3IBM Tivoli Network Manager settings in Ambari . . . . . . . . . . . . . . . . . . . . . . . . . . . . . . . . . . . . . . . . . . . . . 2-4IBM Tivoli Network Manager encryption key . . . . . . . . . . . . . . . . . . . . . . . . . . . . . . . . . . . . . . . . . . . . . . . . 2-5IBM Tivoli Network Manager kafka.properties file . . . . . . . . . . . . . . . . . . . . . . . . . . . . . . . . . . . . . . . . . . . . 2-6Lesson 2 Integration with Netcool/OMNIbus . . . . . . . . . . . . . . . . . . . . . . . . . . . . . . . . . . . . . . . . . . . . . . . 2-7Add an alias for the ObjectServer . . . . . . . . . . . . . . . . . . . . . . . . . . . . . . . . . . . . . . . . . . . . . . . . . . . . . . . . 2-8Configure the Standard Input probe . . . . . . . . . . . . . . . . . . . . . . . . . . . . . . . . . . . . . . . . . . . . . . . . . . . . . . 2-9Edit the OMNIbus interfaces file . . . . . . . . . . . . . . . . . . . . . . . . . . . . . . . . . . . . . . . . . . . . . . . . . . . . . . . . 2-10
Course materials may not be reproduced in whole or in part without the prior written permission of IBM.© Copyright IBM Corp. 2020 iii
Contents
V7.0
Uempt
y Lesson 3 Integration with Dashboard Application Services Hub . . . . . . . . . . . . . . . . . . . . . . . . . . . . . . . 2-11Generate the SSL certificate and keystore files . . . . . . . . . . . . . . . . . . . . . . . . . . . . . . . . . . . . . . . . . . . . . 2-12Enable the integration with Jazz for Service Management and DASH . . . . . . . . . . . . . . . . . . . . . . . . . . . 2-14DASH settings in Ambari . . . . . . . . . . . . . . . . . . . . . . . . . . . . . . . . . . . . . . . . . . . . . . . . . . . . . . . . . . . . . . 2-15Configure SSL certificates in WebSphere Application Server . . . . . . . . . . . . . . . . . . . . . . . . . . . . . . . . . . 2-17Unit summary . . . . . . . . . . . . . . . . . . . . . . . . . . . . . . . . . . . . . . . . . . . . . . . . . . . . . . . . . . . . . . . . . . . . . . . 2-19Exercise: Integration with Netcool Operations Insight . . . . . . . . . . . . . . . . . . . . . . . . . . . . . . . . . . . . . . . . 2-20 . . . . . . . . . . . . . . . . . . . . . . . . . . . . . . . . . . . . . . . . . . . . . . . . . . . . . . . . . . . . . . . . . . . . . . . . . . . . . . . . . . 2-20Unit 3 Post-installation configuration . . . . . . . . . . . . . . . . . . . . . . . . . . . . . . . . . . . . . . . . . . . . . . . . 3-1 . . . . . . . . . . . . . . . . . . . . . . . . . . . . . . . . . . . . . . . . . . . . . . . . . . . . . . . . . . . . . . . . . . . . . . . . . . . . . . . . . . . 3-1Unit objectives . . . . . . . . . . . . . . . . . . . . . . . . . . . . . . . . . . . . . . . . . . . . . . . . . . . . . . . . . . . . . . . . . . . . . . . 3-2Installing technology packs . . . . . . . . . . . . . . . . . . . . . . . . . . . . . . . . . . . . . . . . . . . . . . . . . . . . . . . . . . . . . 3-3Installing the Device Dashboard . . . . . . . . . . . . . . . . . . . . . . . . . . . . . . . . . . . . . . . . . . . . . . . . . . . . . . . . . 3-5Add DASH roles to the Network Performance Insight users . . . . . . . . . . . . . . . . . . . . . . . . . . . . . . . . . . . . 3-7Configure IBM Tivoli Network Manager to access flow data . . . . . . . . . . . . . . . . . . . . . . . . . . . . . . . . . . . . 3-9Installing an interim fix . . . . . . . . . . . . . . . . . . . . . . . . . . . . . . . . . . . . . . . . . . . . . . . . . . . . . . . . . . . . . . . . 3-10Updating the technology packs . . . . . . . . . . . . . . . . . . . . . . . . . . . . . . . . . . . . . . . . . . . . . . . . . . . . . . . . . 3-12Restoring the Network Performance Insight users . . . . . . . . . . . . . . . . . . . . . . . . . . . . . . . . . . . . . . . . . . 3-14Uninstalling and reinstalling the Device Dashboard . . . . . . . . . . . . . . . . . . . . . . . . . . . . . . . . . . . . . . . . . 3-16Configuring the Console Integration . . . . . . . . . . . . . . . . . . . . . . . . . . . . . . . . . . . . . . . . . . . . . . . . . . . . . 3-18Setting the resource scope . . . . . . . . . . . . . . . . . . . . . . . . . . . . . . . . . . . . . . . . . . . . . . . . . . . . . . . . . . . . 3-19Unit summary . . . . . . . . . . . . . . . . . . . . . . . . . . . . . . . . . . . . . . . . . . . . . . . . . . . . . . . . . . . . . . . . . . . . . . . 3-21Exercise: Post-installation configuration . . . . . . . . . . . . . . . . . . . . . . . . . . . . . . . . . . . . . . . . . . . . . . . . . . 3-22
Unit 4 Solution verification. . . . . . . . . . . . . . . . . . . . . . . . . . . . . . . . . . . . . . . . . . . . . . . . . . . . . . . . . 4-1 . . . . . . . . . . . . . . . . . . . . . . . . . . . . . . . . . . . . . . . . . . . . . . . . . . . . . . . . . . . . . . . . . . . . . . . . . . . . . . . . . . . 4-1Unit objectives . . . . . . . . . . . . . . . . . . . . . . . . . . . . . . . . . . . . . . . . . . . . . . . . . . . . . . . . . . . . . . . . . . . . . . . 4-2Example data sources . . . . . . . . . . . . . . . . . . . . . . . . . . . . . . . . . . . . . . . . . . . . . . . . . . . . . . . . . . . . . . . . . 4-3Network flow dashboards . . . . . . . . . . . . . . . . . . . . . . . . . . . . . . . . . . . . . . . . . . . . . . . . . . . . . . . . . . . . . . 4-5On demand dashboards . . . . . . . . . . . . . . . . . . . . . . . . . . . . . . . . . . . . . . . . . . . . . . . . . . . . . . . . . . . . . . . 4-6Time series reports . . . . . . . . . . . . . . . . . . . . . . . . . . . . . . . . . . . . . . . . . . . . . . . . . . . . . . . . . . . . . . . . . . . 4-7Historical trend dashboard . . . . . . . . . . . . . . . . . . . . . . . . . . . . . . . . . . . . . . . . . . . . . . . . . . . . . . . . . . . . . . 4-8Device Dashboard . . . . . . . . . . . . . . . . . . . . . . . . . . . . . . . . . . . . . . . . . . . . . . . . . . . . . . . . . . . . . . . . . . . . 4-9Configuring network flow thresholds . . . . . . . . . . . . . . . . . . . . . . . . . . . . . . . . . . . . . . . . . . . . . . . . . . . . . 4-10Traffic details dashboard . . . . . . . . . . . . . . . . . . . . . . . . . . . . . . . . . . . . . . . . . . . . . . . . . . . . . . . . . . . . . . 4-12Unit summary . . . . . . . . . . . . . . . . . . . . . . . . . . . . . . . . . . . . . . . . . . . . . . . . . . . . . . . . . . . . . . . . . . . . . . . 4-14Exercise: Solution verification . . . . . . . . . . . . . . . . . . . . . . . . . . . . . . . . . . . . . . . . . . . . . . . . . . . . . . . . . . 4-15
Course materials may not be reproduced in whole or in part without the prior written permission of IBM.© Copyright IBM Corp. 2020 iv

About this course
Course materials may not be reproduced in whole or in part without the prior written permission of IBM.© Copyright IBM Corporation 2020
IBM Network Performance Insight 1.3.1 Installation and Configuration
Course materials may not be reproduced in whole or in part without the prior written permission of IBM.© Copyright IBM Corp. 2020 v
About this course
V7.0
Uempt
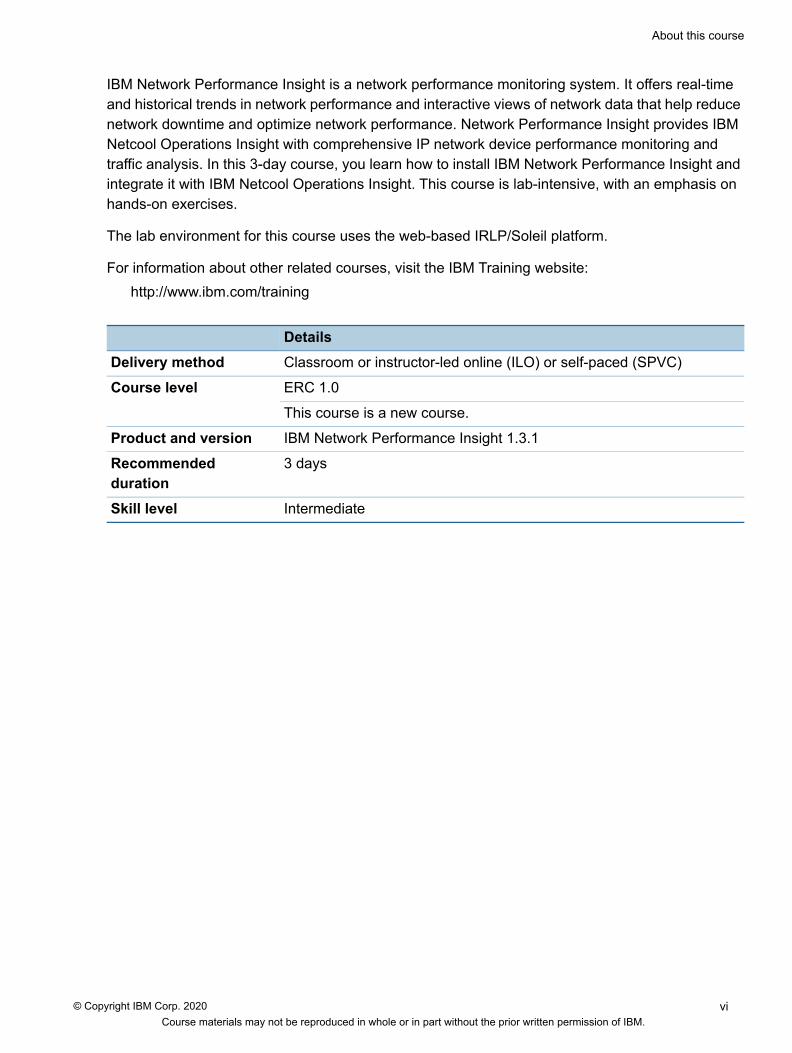
y IBM Network Performance Insight is a network performance monitoring system. It offers real-time and historical trends in network performance and interactive views of network data that help reduce network downtime and optimize network performance. Network Performance Insight provides IBM Netcool Operations Insight with comprehensive IP network device performance monitoring and traffic analysis. In this 3-day course, you learn how to install IBM Network Performance Insight and integrate it with IBM Netcool Operations Insight. This course is lab-intensive, with an emphasis on hands-on exercises.The lab environment for this course uses the web-based IRLP/Soleil platform.
For information about other related courses, visit the IBM Training website:http://www.ibm.com/training
DetailsDelivery method Classroom or instructor-led online (ILO) or self-paced (SPVC)
Course level ERC 1.0
This course is a new course.
Product and version IBM Network Performance Insight 1.3.1
Recommended duration
3 days
Skill level Intermediate
Course materials may not be reproduced in whole or in part without the prior written permission of IBM.© Copyright IBM Corp. 2020 vi

About this course Course objectives
V7.0
Uempt
yCourse objectives
AudienceThis course is designed for implementers, administrators, and technical sellers.
PrerequisitesBefore taking this course, make sure that you have the following skills: • Linux administration skills
• A working knowledge of IBM Netcool Operations Insight
• A general knowledge of IP network monitoring methods, such as SNMP, IP Flow, and IP SLA
IBM Network Performance Insight 1.3.1 Installation and Configuration
Course objectives
• Describe the features of Network Performance Insight• Prepare the hosts for installation• Install Ambari and Hortonworks Data Platform• Set up and install Network Performance Insight• Integrate discovery and metric collection with IBM Tivoli Network Manager• Integrate the event service with Netcool/OMNIbus• Integrate the UI service with Dashboard Application Services Hub• Install technology packs• Install and configure the Device Dashboard• Configure Dashboard Application Services Hub (DASH) roles• Install an interim fix• Set the resource scope• Verify the installation
© Copyright IBM Corporation 2020
Course materials may not be reproduced in whole or in part without the prior written permission of IBM.© Copyright IBM Corp. 2020 vii

About this course Agenda
V7.0
Uempt
yAgenda
The course contains the following units:1. Overview and installation
This unit begins with a description of the features and functions of Network Performance Insight. You then learn how to install Network Performance Insight, including all prerequisite setup tasks.
In the exercises for this unit, you prepare the hosts, install Ambari, install Hortonworks Data Platform, and install Network Performance Insight
2. IntegrationIn this unit, you learn how to integrate Network Performance Insight with other Netcool Operations Insight software.
In the exercises for this unit, you integrate Network Performance Insight with IBM Tivoli Network Manager, Netcool/OMNIbus, and Dashboard Application Services Hub (DASH).
3. Post-installation configurationThis unit walks you through several post-installation tasks.
IBM Network Performance Insight 1.3.1 Installation and Configuration
Agenda
• Unit 1 Overview and installation• Unit 2 Integration• Unit 3 Post-installation configuration• Unit 4 Solution verification
© Copyright IBM Corporation 2020
Course materials may not be reproduced in whole or in part without the prior written permission of IBM.© Copyright IBM Corp. 2020 viii
About this course Agenda
V7.0
Uempt
y In the exercises for this unit, you complete the following tasks: • Install technology packs• Install and configure the Device Dashboard
• Configure user and roles
• Install an interim fix
Set the resource scope
4. Solution verificationThis unit describes several IBM Network Performance Insight dashboards and reports. You can use these reports to confirm that IBM Network Performance Insight is successfully processing data.
In the exercises for this unit, you verify that IBM Network Performance Insight is successfully collecting, aggregating, and reporting performance data. You also learn how to navigate the IBM Network Performance Insight user interface and set thresholds on flow data.
Course materials may not be reproduced in whole or in part without the prior written permission of IBM.© Copyright IBM Corp. 2020 ix

About this course Agenda
V7.0
Uempt
yCourse materials may not be reproduced in whole or in part without the prior written permission of IBM.© Copyright IBM Corp. 2020 x

Unit 1 Overview and installation
This unit begins with a description of the features and functions of Network Performance Insight. You then learn how to install Network Performance Insight, including all prerequisite setup tasks.
Course materials may not be reproduced in whole or in part without the prior written permission of IBM.© Copyright IBM Corp. 2020 1-1

Unit 1 Overview and installation Unit objectives
V7.0
Uempt
yUnit objectives
Course materials may not be reproduced in whole or in part without the prior written permission of IBM.© Copyright IBM Corp. 2020 1-2

Unit 1 Overview and installation Lesson 1 Overview
V7.0
Uempt
yLesson 1 OverviewIn this lesson, you learn about Network Performance Insight features, reports, and architecture.
Course materials may not be reproduced in whole or in part without the prior written permission of IBM.© Copyright IBM Corp. 2020 1-3
Unit 1 Overview and installation What is Network Performance Insight?
V7.0
Uempt
yWhat is Network Performance Insight?
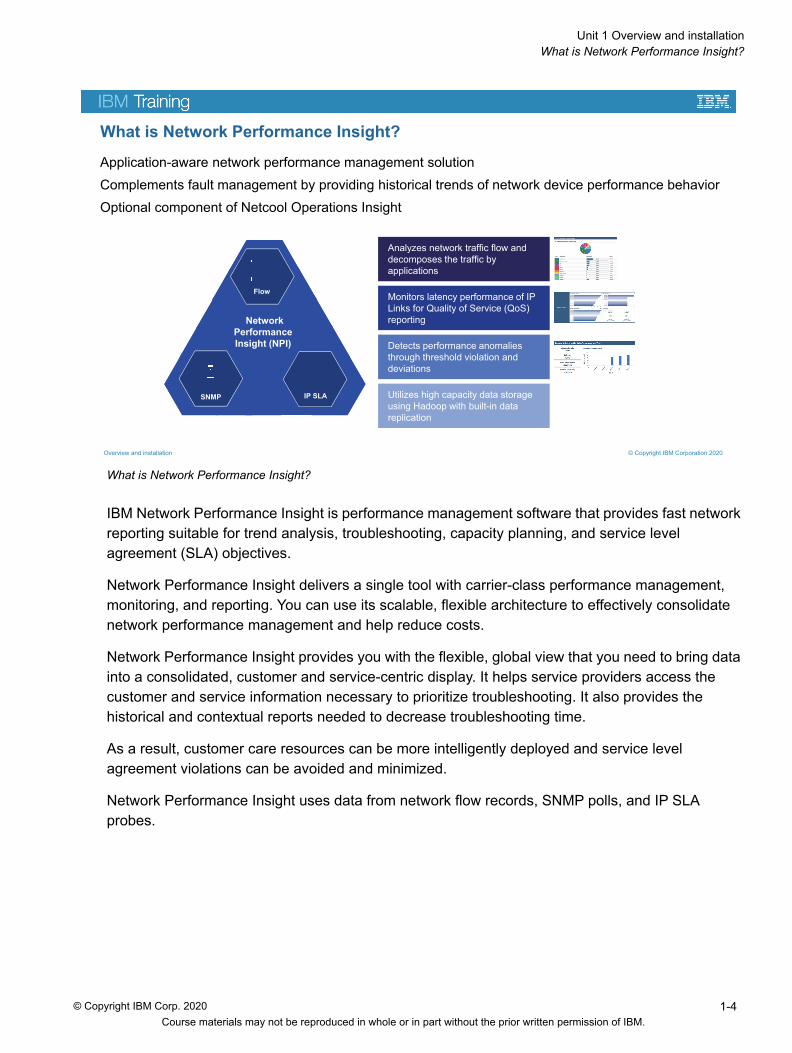
IBM Network Performance Insight is performance management software that provides fast network reporting suitable for trend analysis, troubleshooting, capacity planning, and service level agreement (SLA) objectives.
Network Performance Insight delivers a single tool with carrier-class performance management, monitoring, and reporting. You can use its scalable, flexible architecture to effectively consolidate network performance management and help reduce costs.
Network Performance Insight provides you with the flexible, global view that you need to bring data into a consolidated, customer and service-centric display. It helps service providers access the customer and service information necessary to prioritize troubleshooting. It also provides the historical and contextual reports needed to decrease troubleshooting time.
As a result, customer care resources can be more intelligently deployed and service level agreement violations can be avoided and minimized.
Network Performance Insight uses data from network flow records, SNMP polls, and IP SLA probes.
Overview and installation
What is Network Performance Insight?
Application-aware network performance management solutionComplements fault management by providing historical trends of network device performance behaviorOptional component of Netcool Operations Insight
© Copyright IBM Corporation 2020
Analyzes network traffic flow and decomposes the traffic by applications
Monitors latency performance of IP Links for Quality of Service (QoS) reporting
Detects performance anomalies through threshold violation and deviations
Utilizes high capacity data storage using Hadoop with built-in data replication
FlowFlow
SNMPSNMP IP SLAIP SLA
Network Performance Insight (NPI)
Course materials may not be reproduced in whole or in part without the prior written permission of IBM.© Copyright IBM Corp. 2020 1-4
Unit 1 Overview and installation Network Performance Insight dashboards and reports
V7.0
Uempt
yNetwork Performance Insight dashboards and reports
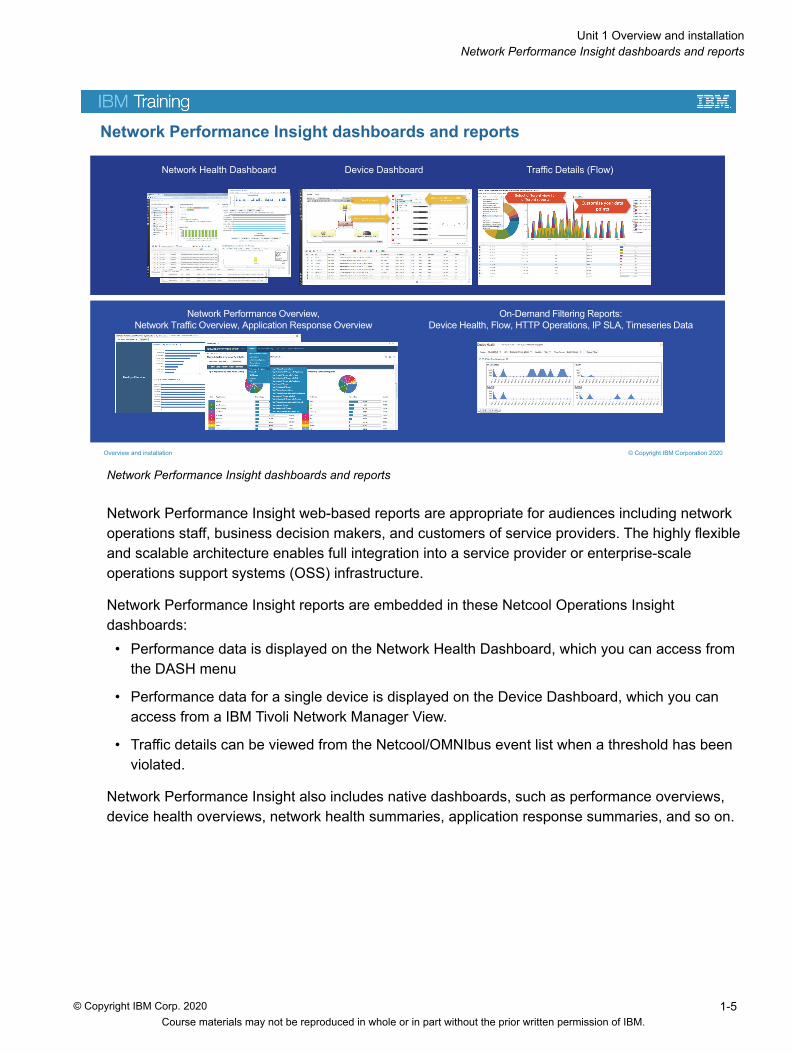
Network Performance Insight web-based reports are appropriate for audiences including network operations staff, business decision makers, and customers of service providers. The highly flexible and scalable architecture enables full integration into a service provider or enterprise-scale operations support systems (OSS) infrastructure.
Network Performance Insight reports are embedded in these Netcool Operations Insight dashboards: • Performance data is displayed on the Network Health Dashboard, which you can access from
the DASH menu
• Performance data for a single device is displayed on the Device Dashboard, which you can access from a IBM Tivoli Network Manager View.
• Traffic details can be viewed from the Netcool/OMNIbus event list when a threshold has been violated.
Network Performance Insight also includes native dashboards, such as performance overviews, device health overviews, network health summaries, application response summaries, and so on.
Overview and installation
Network Performance Insight dashboards and reports
© Copyright IBM Corporation 2020
Network Health Dashboard Device Dashboard Traffic Details (Flow)
On-Demand Filtering Reports:Device Health, Flow, HTTP Operations, IP SLA, Timeseries Data
Network Performance Overview,Network Traffic Overview, Application Response Overview
Course materials may not be reproduced in whole or in part without the prior written permission of IBM.© Copyright IBM Corp. 2020 1-5
Unit 1 Overview and installation Architecture
V7.0
Uempt
yArchitecture
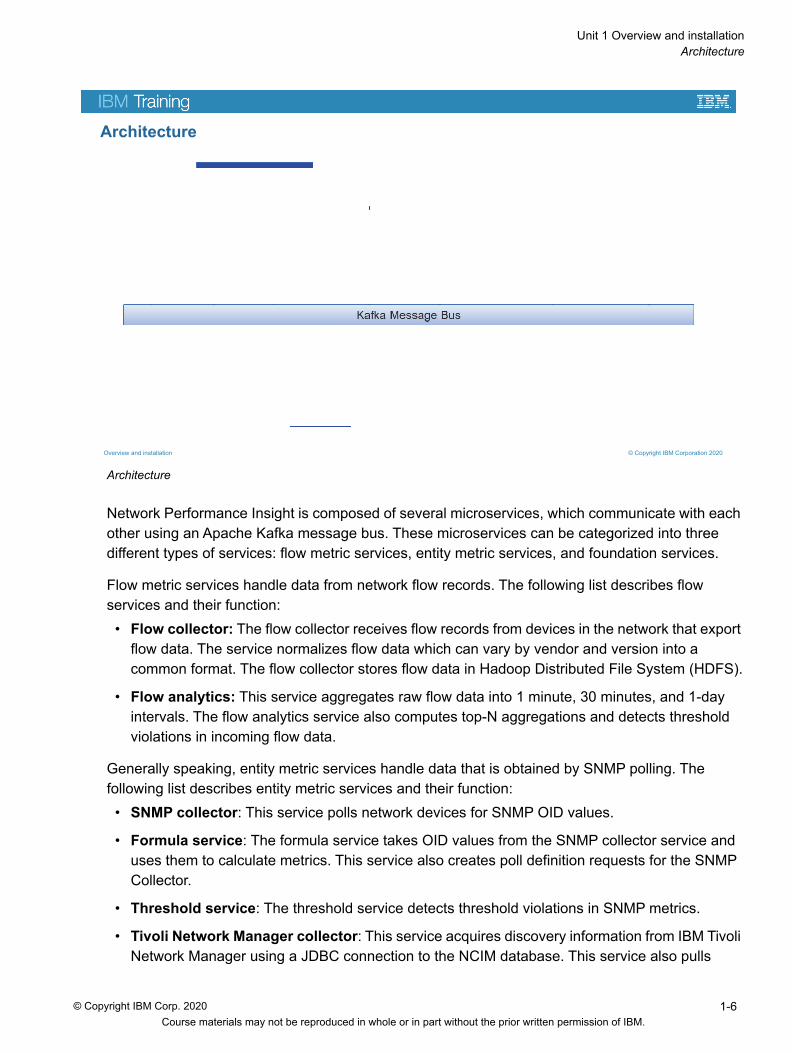
Network Performance Insight is composed of several microservices, which communicate with each other using an Apache Kafka message bus. These microservices can be categorized into three different types of services: flow metric services, entity metric services, and foundation services.
Flow metric services handle data from network flow records. The following list describes flow services and their function: • Flow collector: The flow collector receives flow records from devices in the network that export
flow data. The service normalizes flow data which can vary by vendor and version into a common format. The flow collector stores flow data in Hadoop Distributed File System (HDFS).
• Flow analytics: This service aggregates raw flow data into 1 minute, 30 minutes, and 1-day intervals. The flow analytics service also computes top-N aggregations and detects threshold violations in incoming flow data.
Generally speaking, entity metric services handle data that is obtained by SNMP polling. The following list describes entity metric services and their function: • SNMP collector: This service polls network devices for SNMP OID values.
• Formula service: The formula service takes OID values from the SNMP collector service and uses them to calculate metrics. This service also creates poll definition requests for the SNMP Collector.
• Threshold service: The threshold service detects threshold violations in SNMP metrics.
• Tivoli Network Manager collector: This service acquires discovery information from IBM Tivoli Network Manager using a JDBC connection to the NCIM database. This service also pulls
Overview and installation
Architecture
© Copyright IBM Corporation 2020
Course materials may not be reproduced in whole or in part without the prior written permission of IBM.© Copyright IBM Corp. 2020 1-6
Unit 1 Overview and installation Architecture
V7.0
Uempt
y metrics that IBM Tivoli Network Manager is polling and makes that data available to other Network Performance Insight services.• Cacti collector: Cacti is open source network monitoring software. Network Performance Insight can use Cacti discovery data, as well as metrics that Cacti has collected. The Cacti collector service obtains inventory and metrics from an instance of Cacti.
• Timeseries exporter: This service exports metrics to IBM Operations Analytics Predictive Insights using a compatible Kafka topic.
Foundation services are basic infrastructure services that are used by other Network Performance Insight services. The following list describes foundation services and their function: • Dashboard service: This service holds all of the content to support the Network Performance
Insight dashboards.
• DNS service: This service resolves DNS names for reporting.
• Event service: The event service sends alerts to the Netcool/OMNIbus ObjectServer when a threshold has been violated.
• Inventory service: The inventory service collects metadata about devices that are monitored via SNMP, for example the property names and values of a device.
• Manager service: This service monitors the status and health of all Network Performance Insight microservices.
• Storage service: This service provides high-volume data storage as well as high-bandwidth query and data analysis.
• UI service: The UI Service controls all the visualizations that are associated with Network Performance Insight.
In addition to the services pictured in the diagram, Network Performance Insight uses the following Hortonworks Data Platform (HDP) components: • Apache Hadoop
• Apache Kafka
• Apache Ambari
• Apache Spark
• Apache ZooKeeper
Course materials may not be reproduced in whole or in part without the prior written permission of IBM.© Copyright IBM Corp. 2020 1-7

Unit 1 Overview and installation Lesson 2 Installation
V7.0
Uempt
yLesson 2 InstallationIn this lesson, you review the steps necessary to install Network Performance Insight.
Overview and installation
Lesson 2: Installation
© Copyright IBM Corporation 2020
Course materials may not be reproduced in whole or in part without the prior written permission of IBM.© Copyright IBM Corp. 2020 1-8

Unit 1 Overview and installation Setting up passwordless SSH
V7.0
Uempt
ySetting up passwordless SSH
During the installation process, Ambari run commands and transfers files to other hosts in your Network Performance Insight cluster, including hosts that are running Netcool Operations Insight components. Before you start the installation, you must set up passwordless SSH from the Ambari host to all other hosts, including the Ambari host itself.
To facilitate this task, the setup_cluster_ssh.sh tool is included in the Network Performance Insight media. Run this tool as the root user. Use fully qualified domain names when you are prompted for the name of each remote host.
This tool configures passwordless SSH for the root user. Often, Netcool Operations Insight components run as a non-root user. To configure passwordless SSH from the Ambari host as the root user to a Netcool Operations Insight host as a non-root user, you must copy the public keys manually. In the following example, passwordless SSH is configured for a user named netcool on a host named host1.csite.edu.
Overview and installation
Setting up passwordless SSH
• Apache Ambari requires passwordless SSH authentication to all hosts in the Ambari cluster, including its own host and the host where IBM Netcool Operations Insight is running.
• Use the setup_cluster_ssh.sh tool to setup passwordless SSH to your hosts as the root user.
• IBM Netcool Operations Insight is commonly owned and run by a non-root user, so you must set up passwordless SSH manually.
© Copyright IBM Corporation 2020
Course materials may not be reproduced in whole or in part without the prior written permission of IBM.© Copyright IBM Corp. 2020 1-9

Unit 1 Overview and installation Setting up passwordless SSH
V7.0
Uempt
ycd /root/.ssh
ssh-copy-id -i id_rsa.pub [email protected]
/bin/ssh-copy-id: INFO: Source of key(s) to be installed: "id_rsa.pub"/bin/ssh-copy-id: INFO: attempting to log in with the new key(s), to filter out any that are already installed/bin/ssh-copy-id: INFO: 1 key(s) remain to be installed -- if you are prompted now it is to install the new keys
[email protected]'s password:
Course materials may not be reproduced in whole or in part without the prior written permission of IBM.© Copyright IBM Corp. 2020 1-10

Unit 1 Overview and installation Editing kernel parameters
V7.0
Uempt
yEditing kernel parameters
Edit these three kernel settings to tune network performance: • net.core.rmem_default: The TCP/UDP default receive buffer size, in bytes
• net.core.rmem_max: The TCP/UDP maximum receive buffer size, in bytes
• net.core.netdev_max_backlog: The maximum amount of input packets that are buffered when an interface receives data faster than the system can process it
Overview and installation
Editing kernel parameters
You must change the system settings for the hosts where Network Performance Insight will be installed. Add the following settings to /etc/sysctl.conf:
net.core.rmem_default = 33554432
net.core.rmem_max = 33554432
net.core.netdev_max_backlog = 10000
Run the following command to refresh the host with the new configuration:
sysctl -p
© Copyright IBM Corporation 2020
Course materials may not be reproduced in whole or in part without the prior written permission of IBM.© Copyright IBM Corp. 2020 1-11

Unit 1 Overview and installation Processes and open files
V7.0
Uempt
yProcesses and open files
Increase the number of processes and open files on the hosts where you install Network Performance Insight. Do this by creating a file with the extension .conf in the /etc/security/limits.d/ directory.
You must log out and log back in to apply the changes.
Overview and installation
Processes and open files
• Increase the number of processes and open files permitted for all users.• Create a .conf file in the /etc/security/limits.d/ directory and add the following lines:
* - nofile 65536
* - nproc 65536
© Copyright IBM Corporation 2020
Course materials may not be reproduced in whole or in part without the prior written permission of IBM.© Copyright IBM Corp. 2020 1-12
Unit 1 Overview and installation Required operating system packages
V7.0
Uempt
yRequired operating system packages
You must install the following operating system packages on the hosts where you install Network Performance Insight: • libtirpc-devel
• redhat-lsb
• python-devel
• gcc
• zlib, 32-bit
• ncurses, 32-bit
• bzip2, 32-bit
• libstdc++, 32-bit
Overview and installation
Required operating system packages
The following operating system packages must be installed:• libtirpc-devel• redhat-lsb• python-devel• gcc• zlib• ncurses• bzip2• libstdc++• ntp
© Copyright IBM Corporation 2020
Course materials may not be reproduced in whole or in part without the prior written permission of IBM.© Copyright IBM Corp. 2020 1-13
Unit 1 Overview and installation Disabling the python security certificate verification
V7.0
Uempt
yDisabling the python security certificate verification
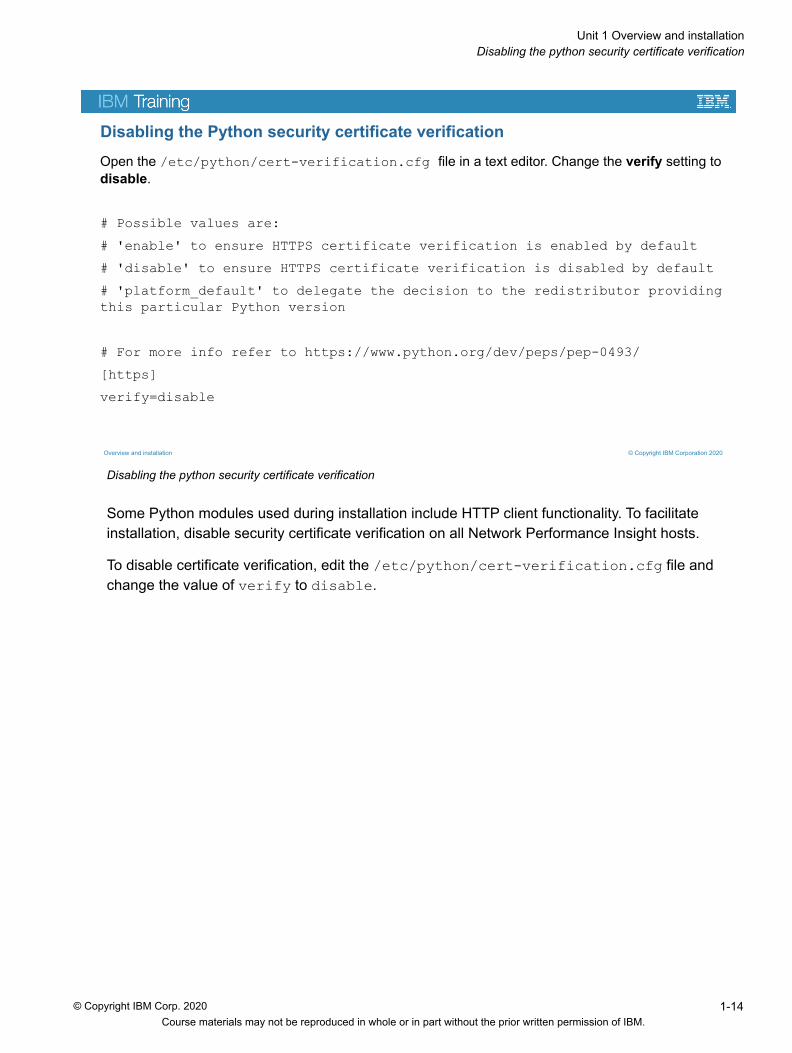
Some Python modules used during installation include HTTP client functionality. To facilitate installation, disable security certificate verification on all Network Performance Insight hosts.
To disable certificate verification, edit the /etc/python/cert-verification.cfg file and change the value of verify to disable.
Overview and installation
Disabling the Python security certificate verificationOpen the /etc/python/cert-verification.cfg file in a text editor. Change the verify setting to disable.
# Possible values are:
# 'enable' to ensure HTTPS certificate verification is enabled by default
# 'disable' to ensure HTTPS certificate verification is disabled by default
# 'platform_default' to delegate the decision to the redistributor providing this particular Python version
# For more info refer to https://www.python.org/dev/peps/pep-0493/
[https]
verify=disable
© Copyright IBM Corporation 2020
Course materials may not be reproduced in whole or in part without the prior written permission of IBM.© Copyright IBM Corp. 2020 1-14

Unit 1 Overview and installation Installing Ambari and Hortonworks Data Platform (HDP)
V7.0
Uempt
yInstalling Ambari and Hortonworks Data Platform (HDP)
You install Ambari, Hortonworks Data Platform (HDP), and the Network Performance Insight repositories with an installation script. Remove the existing yum cache on all Network Performance Insight hosts before you start the installation. Run the following command as the root user to remove the cache:
rm –rf /var/cache/yum
You can download the Ambari and Hortonworks Data Platform installation media here:https://www.ibm.com/support/knowledgecenter/SSCVHB_1.3.1/install/tnpi_download_iop.html
Move the Hortonworks Data Platform installation packages to the same directory where the NPI-1.3.1.0 subdirectory is located. The NPI-1.3.1.0 subdirectory is created when you decompress the Network Performance Insight installation media.
Run the installation script, install.sh, followed by the path where you downloaded and decompressed the Network Performance Insight installation files.
In this example, the Network Performance Insight media was copied to /software/NPI/. When the installer archive (named NOIPM_1.3.1_LNX_ML.tgz) was decompressed, the CC29WML subdirectory was created.
ls /software/NPI/
CC29WML NOIPM_1.3.1_LNX_ML.tgz
Overview and installation
Installing Ambari and Hortonworks Data Platform (HDP)
After you decompress the Network Performance Insight installation media, the installation script is in the following directory:<DISTRIBUTION_DIRECTORY>/NPI-1.3.1.0/bin/
Run the installation script with the location of the Network Performance Insight and Hortonworks Data Platform installation media, for example:./install.sh /software/NPI/CC29WML
© Copyright IBM Corporation 2020
Course materials may not be reproduced in whole or in part without the prior written permission of IBM.© Copyright IBM Corp. 2020 1-15

Unit 1 Overview and installation Installing Ambari and Hortonworks Data Platform (HDP)
V7.0
Uempt
y In the CC29WML subdirectory, you see the NPI-1.3.1.0 subdirectory. Move the Hortonworks Data Platform installation packages to the same level as the NPI-1.3.1.0 subdirectory.ls /software/NPI/CC29WML/
ambari-2.6.2.2-centos7.tar.gz HDP-GPL-2.6.4.0-centos7-rpm.tar.gz NPI-1.3.1.0HDP-2.6.4.0-centos7-rpm.tar.gz HDP-UTILS-1.1.0.22-centos7.tar.gz NPI-1.3.1.0.tgz
In this example, the command to start the installation script is:./install.sh /software/NPI/CC29WML
After the installation script starts, you are prompted for the number of hosts in your Network Performance Insight cluster, followed by each of their host names.
Course materials may not be reproduced in whole or in part without the prior written permission of IBM.© Copyright IBM Corp. 2020 1-16

Unit 1 Overview and installation Setting up the Network Performance Insight cluster
V7.0
Uempt
ySetting up the Network Performance Insight cluster
You use a wizard to setup and install your Network Performance Insight cluster. To access the wizard, open a browser and go to the following URL, where host_name is the Ambari host.
http://<host_name>:8080
After you log in to the Ambari Manager page, you see the button to launch the installation wizard.
Note: The wizard prompts you for the private SSH key of the root user. If you choose to upload this key, you must run the browser as the root user.
Overview and installation
Setting up the Network Performance Insight cluster
Access the Ambari Manager page at the following URL.
http://<host_name>:8080
After you log in, start the installation wizard.
© Copyright IBM Corporation 2020
Course materials may not be reproduced in whole or in part without the prior written permission of IBM.© Copyright IBM Corp. 2020 1-17

Unit 1 Overview and installation Key fields in the installation wizard
V7.0
Uempt
yKey fields in the installation wizard
At minimum, you need the following information as you complete the required fields in the installation wizard: • List of host names: Use the fully qualified domain name of each host.
• SSH private key of the root user: You can upload this key or copy and paste it into the wizard.
• Grafana admin password: Used for Ambari monitoring metrics.
• Cassandra seed nodes: Used during Cassandra startup to discover other Cassandra nodes in the cluster. Typically this is a host that runs Network Performance Insight flow or entity services.
• JDBC URL for storage connection: The host name and port number that is in the JDBC path to the storage location. This setting is required only if the storage service is not installed on all Network Performance Insight hosts. Typically, the host name is the storage service host and the port number is 13081.
• Ambari manager password: The password to access the Ambari Manager page.
Overview and installation
Key fields in the installation wizard
These are the settings and values that are required by the installation wizard:• List of host names• SSH private key of the root user• Grafana admin password• Cassandra seed nodes• JDBC URL for storage connection• Ambari manager password
© Copyright IBM Corporation 2020
Course materials may not be reproduced in whole or in part without the prior written permission of IBM.© Copyright IBM Corp. 2020 1-18

Unit 1 Overview and installation Unit summary
V7.0
Uempt
yUnit summary
Overview and installation
Unit summary
You should now be able to perform the following tasks:• Describe the features of Network Performance Insight• Prepare the hosts for installation• Install Ambari and Hortonworks Data Platform• Set up and install Network Performance Insight
© Copyright IBM Corporation 2020
Course materials may not be reproduced in whole or in part without the prior written permission of IBM.© Copyright IBM Corp. 2020 1-19

Unit 1 Overview and installation Exercise: Installation
V7.0
Uempt
yExercise: Installation
Overview and installation
Exercise: InstallationIn the exercises for this unit, you prepare the hosts, install Ambari, install Hortonworks Data Platform, and install Network Performance Insight.This course includes four virtual images. The following diagram shows the function of each virtual machine. You install Network Performance Insight on npi1.csite.eduand npi2.csite.edu.
© Copyright IBM Corporation 2020
Course materials may not be reproduced in whole or in part without the prior written permission of IBM.© Copyright IBM Corp. 2020 1-20

Unit 2 Integration
In this unit, you learn how to integrate Network Performance Insight with other Netcool Operations Insight software.
Course materials may not be reproduced in whole or in part without the prior written permission of IBM.© Copyright IBM Corporation 2020
Unit 2: Integration
Course materials may not be reproduced in whole or in part without the prior written permission of IBM.© Copyright IBM Corp. 2020 2-1

Unit 2 Integration Unit objectives
V7.0
Uempt
yUnit objectives
Integration
Unit objectives
In this unit, you learn to perform the following tasks:• Integrate discovery and metric collection with IBM Tivoli Network Manager• Integrate the event service with Netcool/OMNIbus• Integrate the UI service with Dashboard Application Services Hub
© Copyright IBM Corporation 2020
Course materials may not be reproduced in whole or in part without the prior written permission of IBM.© Copyright IBM Corp. 2020 2-2

Unit 2 Integration Lesson 1 Integration with IBM Tivoli Network Manager
V7.0
Uempt
yLesson 1 Integration with IBM Tivoli Network ManagerNetwork Performance Insight can acquire discovery information from IBM Tivoli Network Manager. Network Performance Insight can also obtain metrics that IBM Tivoli Network Manager is polling. This lesson teaches you how to integrate Network Performance Insight and IBM Tivoli Network Manager.
Integration
Lesson 1: Integration with IBM Tivoli Network Manager
© Copyright IBM Corporation 2020
Course materials may not be reproduced in whole or in part without the prior written permission of IBM.© Copyright IBM Corp. 2020 2-3

Unit 2 Integration IBM Tivoli Network Manager settings in Ambari
V7.0
Uempt
yIBM Tivoli Network Manager settings in Ambari
You use the Ambari Manager page to configure Network Performance Insight. To access the manager page, open a browser and go to the following URL, where host_name is the Ambari host.
http://<host_name>:8080
To access the NOI Core Settings tab, click NPI in the menu on the left of the page, then click the Configs tab.
Enter the following details about your IBM Tivoli Network Manager environment: • Choose DB2 or Oracle as the platform
• Enter the host name where IBM Tivoli Network Manager is running
• Enter the database port number
• Enter the database user name
• Enter the database password
• Enter the database name, which is typically NCIM
• Enter a URL like the following example in the itnm.kafka.connect.rest.url field, where host_name is the host where Kafka connect is running.
http://<host_name>:8083/connectors
You must restart the Network Performance Insight services after you save your changes.
Integration
IBM Tivoli Network Manager settings in Ambari
Use the NOI Core Settingstab to enter the details of your IBM Tivoli Network Manager environment.
© Copyright IBM Corporation 2020
Course materials may not be reproduced in whole or in part without the prior written permission of IBM.© Copyright IBM Corp. 2020 2-4

Unit 2 Integration IBM Tivoli Network Manager encryption key
V7.0
Uempt
yIBM Tivoli Network Manager encryption key
Copy the encryption key file from IBM Tivoli Network Manager to Network Performance Insight. This key is used to obtain SNMP community strings from IBM Tivoli Network Manager.
On the hosts where the Tivoli Network Manager collector service is installed, create the following directory:
/opt/IBM/npi/npi-itnm-collector/resources/itnm/security/keys
Copy the conf.key file from the IBM Tivoli Network Manager host into the new directory. You can find the file in the $NCHOME/etc/security/keys directory, for example:
/opt/IBM/tivoli/netcool/etc/security/keys/conf.key
Integration
IBM Tivoli Network Manager encryption keyCopy the IBM Tivoli Network Manager encryption key (conf.key) to the following directory. You must create the resources/itnm/security/keys sub-directory.
/opt/IBM/npi/npi-itnm-collector/resources/itnm/security/keys
Perform this task on all Network Performance Insight hosts where the Tivoli Network Manager collector service is installed.
© Copyright IBM Corporation 2020
Course materials may not be reproduced in whole or in part without the prior written permission of IBM.© Copyright IBM Corp. 2020 2-5
Unit 2 Integration IBM Tivoli Network Manager kafka.properties file
V7.0
Uempt
yIBM Tivoli Network Manager kafka.properties file
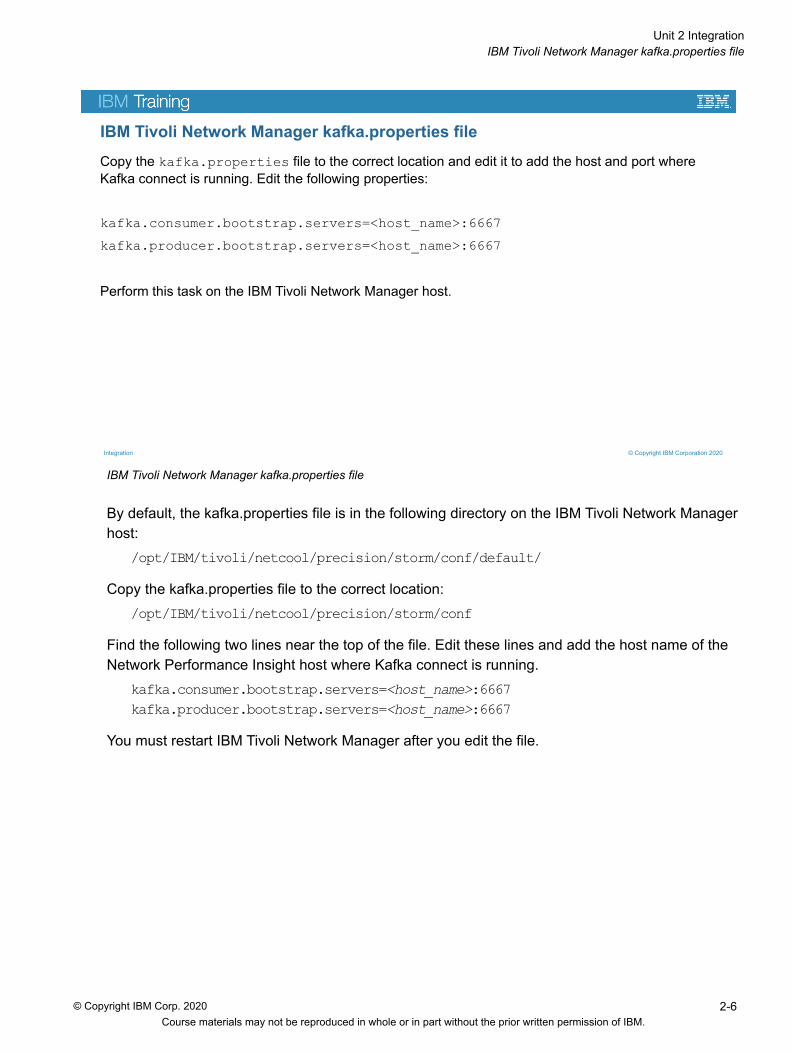
By default, the kafka.properties file is in the following directory on the IBM Tivoli Network Manager host:
/opt/IBM/tivoli/netcool/precision/storm/conf/default/
Copy the kafka.properties file to the correct location:/opt/IBM/tivoli/netcool/precision/storm/conf
Find the following two lines near the top of the file. Edit these lines and add the host name of the Network Performance Insight host where Kafka connect is running.
kafka.consumer.bootstrap.servers=<host_name>:6667kafka.producer.bootstrap.servers=<host_name>:6667
You must restart IBM Tivoli Network Manager after you edit the file.
Integration
IBM Tivoli Network Manager kafka.properties fileCopy the kafka.properties file to the correct location and edit it to add the host and port where Kafka connect is running. Edit the following properties:
kafka.consumer.bootstrap.servers=<host_name>:6667
kafka.producer.bootstrap.servers=<host_name>:6667
Perform this task on the IBM Tivoli Network Manager host.
© Copyright IBM Corporation 2020
Course materials may not be reproduced in whole or in part without the prior written permission of IBM.© Copyright IBM Corp. 2020 2-6

Unit 2 Integration Lesson 2 Integration with Netcool/OMNIbus
V7.0
Uempt
yLesson 2 Integration with Netcool/OMNIbusNetwork Performance Insight sends alerts to the Netcool/OMNIbus ObjectServer when a threshold has been violated. In this lesson, you configure the Netcool/OMNIbus Standard Input probe that is installed with Network Performance Insight.
Integration
Lesson 2: Integration with Netcool/OMNIbus
© Copyright IBM Corporation 2020
Course materials may not be reproduced in whole or in part without the prior written permission of IBM.© Copyright IBM Corp. 2020 2-7

Unit 2 Integration Add an alias for the ObjectServer
V7.0
Uempt
yAdd an alias for the ObjectServer
To facilitate communication from the Network Performance Insight event service to the Netcool/OMNIbus ObjectServer, add the alias omnihost in the /etc/hosts file where the event service is running.
Integration
Add an alias for the ObjectServerAdd the alias omnihost in the hosts file where the Network Performance Insight event service is running.In this example, the ObjectServer is running on host1.csite.edu.cat /etc/hosts
127.0.0.1 localhost localhost.localdomain localhost4 localhost4.localdomain4
::1 localhost localhost.localdomain localhost6 localhost6.localdomain6
192.168.100.195 npi1.csite.edu npi1
192.168.100.196 npi2.csite.edu npi2
192.168.100.100 host1.csite.edu host1 omnihost10.10.255.1 BRU.csite.ibm.com # Loopback
© Copyright IBM Corporation 2020
Course materials may not be reproduced in whole or in part without the prior written permission of IBM.© Copyright IBM Corp. 2020 2-8

Unit 2 Integration Configure the Standard Input probe
V7.0
Uempt
yConfigure the Standard Input probe
When you install Network Performance Insight, the Netcool/OMNIbus Standard Input probe is installed as part of the event service. Configure the probe to send events to your Netcool/OMNIbus ObjectServer by editing its properties file, which is named npi-flow-stdin.props.
The npi-flow-stdin.props file is in the following directory:/opt/IBM/npi/npi-event/stdin-probe/omnibus/probes/linux2x86
Add a line like the following example to the bottom of the file, where OBJSERVER is the name of your Netcool/OMNIbus ObjectServer:
Server : 'OBJSERVER'
Integration
Configure the Standard Input probe
Edit the Standard Input probe properties file to include the name of your ObjectServer. In this example, the ObjectServer name is NOI_AGG_P:
#######################################################################
#
# Add your settings here
#
#######################################################################
Manager : 'NPI'
Server : 'NOI_AGG_P'
© Copyright IBM Corporation 2020
Course materials may not be reproduced in whole or in part without the prior written permission of IBM.© Copyright IBM Corp. 2020 2-9

Unit 2 Integration Edit the OMNIbus interfaces file
V7.0
Uempt
yEdit the OMNIbus interfaces file
OMNIbus component communication information is saved in an interfaces file. Edit the interfaces file on the host where the Network Performance Insight event service is running. The interfaces file, which is named interfaces.linux2x86, is in the following directory:
/opt/IBM/npi/npi-event/stdin-probe/etc
Replace the string NCOMS with the name of your Netcool/OMNIbus ObjectServer.
To apply these changes, you must restart the Network Performance Insight Event service.
Integration
Edit the OMNIbus interfaces file
Edit the OMNIbus interfaces file to include the name of your ObjectServer. In this example, the ObjectServer name is NOI_AGG_P:
# NCOMS => omnihost 4100
#NCOMS
NOI_AGG_P
master tcp sun-ether omnihost 4100
query tcp sun-ether omnihost 4100
© Copyright IBM Corporation 2020
Course materials may not be reproduced in whole or in part without the prior written permission of IBM.© Copyright IBM Corp. 2020 2-10

Unit 2 Integration Lesson 3 Integration with Dashboard Application Services Hub
V7.0
Uempt
yLesson 3 Integration with Dashboard Application Services HubIn this lesson, you learn how to integrate the Network Performance Insight user interface with Dashboard Application Services Hub (DASH).
Integration
Lesson 3: Integration with Dashboard Application Services Hub
© Copyright IBM Corporation 2020
Course materials may not be reproduced in whole or in part without the prior written permission of IBM.© Copyright IBM Corp. 2020 2-11
Unit 2 Integration Generate the SSL certificate and keystore files
V7.0
Uempt
yGenerate the SSL certificate and keystore files
Generating the SSL certificate and keystore files is a three-step procedure:1. Configure the details of the Network Performance Insight SSL certificate by editing the
custom.cfg file
2. Generate the SSL certificate and keystore files with the securityKeyTool.sh utility
3. Verify that the certificate and keystore were created successfully
Editing the custom.cfg file
Configure the details of the Network Performance Insight SSL certificate by editing the custom.cfg file. The custom.cfg file is in the following directory on the host where Ambari is installed.
/opt/IBM/basecamp/basecamp-installer-tools/dash-integration
Change the values of the following three properties. Do not change any other property.
DASH_CONNECTION: Enter the user who owns and runs DASH followed by the fully qualified domain name of the host where DASH is running, for example: [email protected]
DOMAIN_NAME: Enter *, followed by the domain name of your Network Performance Insight hosts, for example: *.csite.edu
NPI_UI_HOST: Enter the fully qualified domain name of the host where the Network Performance Insight UI service is running
Integration
Generate the SSL certificate and keystore files
Complete the following tasks to create a self-signed SSL certificate:1. Configure the details of the Network Performance Insight SSL certificate by editing the custom.cfg
file2. Generate the SSL certificate and keystore files with the securityKeyTool.sh utility3. Verify that the certificate and keystore were created successfully
© Copyright IBM Corporation 2020
Course materials may not be reproduced in whole or in part without the prior written permission of IBM.© Copyright IBM Corp. 2020 2-12
Unit 2 Integration Generate the SSL certificate and keystore files
V7.0
Uempt
y Generating the SSL certificate and keystore filesRun the following command on the Ambari host to generate the SSL certificate and keystore files. Run the entire command on one line. In this example, the key password and keystore password is changeit./opt/IBM/basecamp/basecamp-installer-tools/dash-integration/securityKeyTool.sh -default=/opt/IBM/basecamp/basecamp-installer-tools/dash-integration/default.cfg -custom=/opt/IBM/basecamp/basecamp-installer-tools/dash-integration/custom.cfg -keyStorePassword=changeit -keyPassword=changeit
Verifying the files
Check the following log files for any errors or warnings. These log files are on the host where Ambari is installed.
/tmp/ambari_npi_key_startup.log/tmp/securityKeyTool.<timestamp>.log /tmp/genSecurityKey.log
Course materials may not be reproduced in whole or in part without the prior written permission of IBM.© Copyright IBM Corp. 2020 2-13
Unit 2 Integration Enable the integration with Jazz for Service Management and DASH
V7.0
Uempt
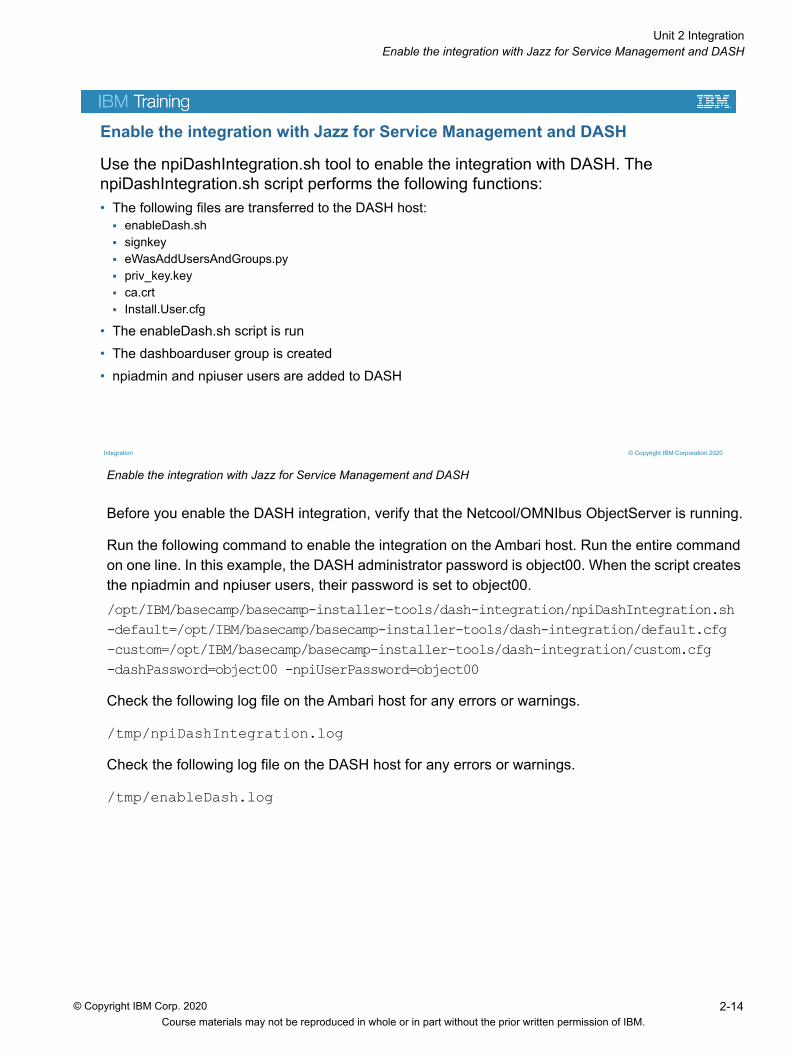
yEnable the integration with Jazz for Service Management and DASH
Before you enable the DASH integration, verify that the Netcool/OMNIbus ObjectServer is running.
Run the following command to enable the integration on the Ambari host. Run the entire command on one line. In this example, the DASH administrator password is object00. When the script creates the npiadmin and npiuser users, their password is set to object00./opt/IBM/basecamp/basecamp-installer-tools/dash-integration/npiDashIntegration.sh -default=/opt/IBM/basecamp/basecamp-installer-tools/dash-integration/default.cfg -custom=/opt/IBM/basecamp/basecamp-installer-tools/dash-integration/custom.cfg -dashPassword=object00 -npiUserPassword=object00
Check the following log file on the Ambari host for any errors or warnings.
/tmp/npiDashIntegration.log
Check the following log file on the DASH host for any errors or warnings.
/tmp/enableDash.log
Integration
Enable the integration with Jazz for Service Management and DASH
Use the npiDashIntegration.sh tool to enable the integration with DASH. The npiDashIntegration.sh script performs the following functions:• The following files are transferred to the DASH host:
enableDash.shsignkeyeWasAddUsersAndGroups.pypriv_key.keyca.crtInstall.User.cfg
• The enableDash.sh script is run• The dashboarduser group is created• npiadmin and npiuser users are added to DASH
© Copyright IBM Corporation 2020
Course materials may not be reproduced in whole or in part without the prior written permission of IBM.© Copyright IBM Corp. 2020 2-14
Unit 2 Integration DASH settings in Ambari
V7.0
Uempt
yDASH settings in Ambari
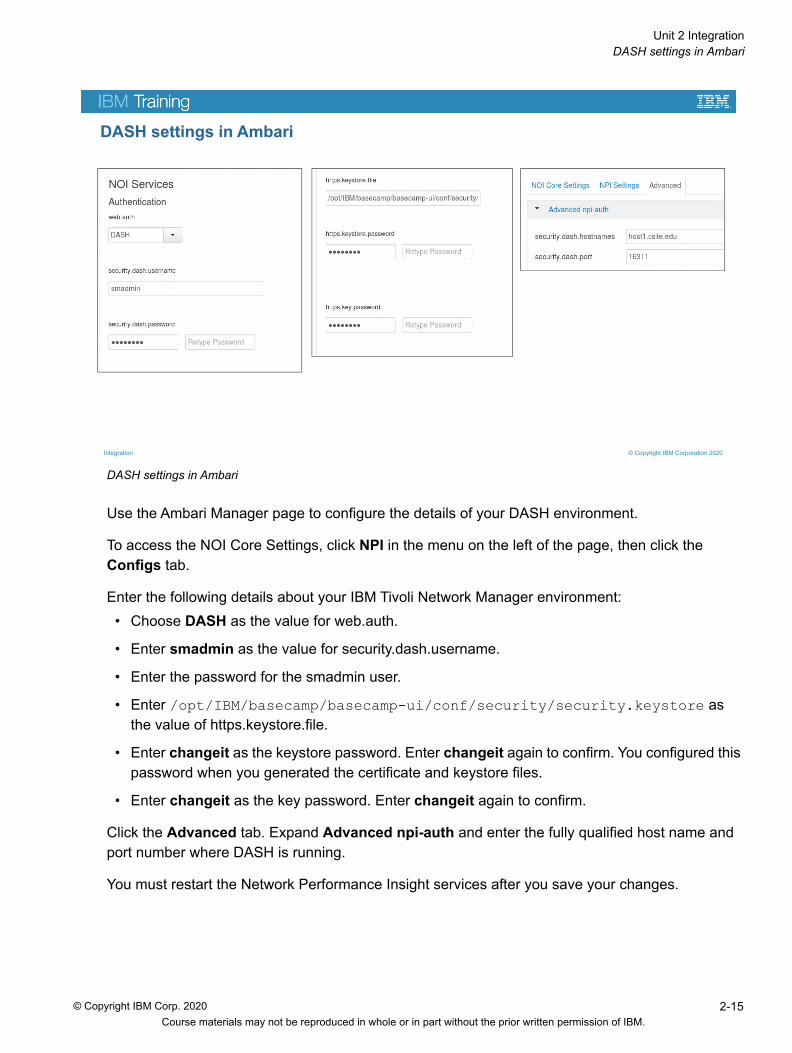
Use the Ambari Manager page to configure the details of your DASH environment.
To access the NOI Core Settings, click NPI in the menu on the left of the page, then click the Configs tab.
Enter the following details about your IBM Tivoli Network Manager environment: • Choose DASH as the value for web.auth.
• Enter smadmin as the value for security.dash.username.
• Enter the password for the smadmin user.
• Enter /opt/IBM/basecamp/basecamp-ui/conf/security/security.keystore as the value of https.keystore.file.
• Enter changeit as the keystore password. Enter changeit again to confirm. You configured this password when you generated the certificate and keystore files.
• Enter changeit as the key password. Enter changeit again to confirm.
Click the Advanced tab. Expand Advanced npi-auth and enter the fully qualified host name and port number where DASH is running.
You must restart the Network Performance Insight services after you save your changes.
Integration
DASH settings in Ambari
© Copyright IBM Corporation 2020
Course materials may not be reproduced in whole or in part without the prior written permission of IBM.© Copyright IBM Corp. 2020 2-15

Unit 2 Integration DASH settings in Ambari
V7.0
Uempt
y Verifying your changesRun the following command to verify that the security.keystore file exists and is in the correct directory. Run the command on the host where the Network Performance Insight UI is running.
ls -al /opt/IBM/basecamp/basecamp-ui/conf/security
-rwxr-xr-x 1 root root 3437 Jan 17 16:39 security.keystoreOn the host where the Network Performance Insight UI is running, compare the following two certificate fingerprints to verify that they match: • WebSphereCACert, in the cacerts file
• npi_ca, in the key store file
Run the following command to show the details of the WebSphereCACert certificate. Run the entire command on one line. Note the certificate fingerprint in the output of the command. The fingerprint in your environment will be different than the following example.
keytool -keystore /opt/IBM/basecamp/basecamp-jre/java-1.8.0-openjdk.x86_64/jre/lib/security/cacerts -storepass changeit -list -alias WebSphereCACert
WebSphereCACert, Jan 17, 2020, trustedCertEntry, Certificate fingerprint (SHA1): 83:31:0C:87:E5:66:66:57:FD:B3:E4:5D:D7:0A:E5:8B:94:F1:87:BA
Run the following command to show the details of the npi_ca certificate. Run the entire command on one line. Notice the npi_ca certificate fingerprint in the output of the command. The fingerprint in your environment will be different than the following example. Verify that this matches the WebSphereCACert fingerprint you found with the preceding command.
keytool -keystore /opt/IBM/basecamp/basecamp-ui/conf/security/security.keystore -storepass changeit -list
Keystore type: jksKeystore provider: SUN
Your keystore contains 2 entries
npi_ca, Jan 16, 2020, trustedCertEntry, Certificate fingerprint (SHA1): 83:31:0C:87:E5:66:66:57:FD:B3:E4:5D:D7:0A:E5:8B:94:F1:87:BAnpi, Jan 16, 2020, PrivateKeyEntry, Certificate fingerprint (SHA1): 25:3C:83:B6:DA:F3:D4:9E:5D:4E:F7:8B:C2:72:DE:A0:18:84:7C:B7
Course materials may not be reproduced in whole or in part without the prior written permission of IBM.© Copyright IBM Corp. 2020 2-16
Unit 2 Integration Configure SSL certificates in WebSphere Application Server
V7.0
Uempt
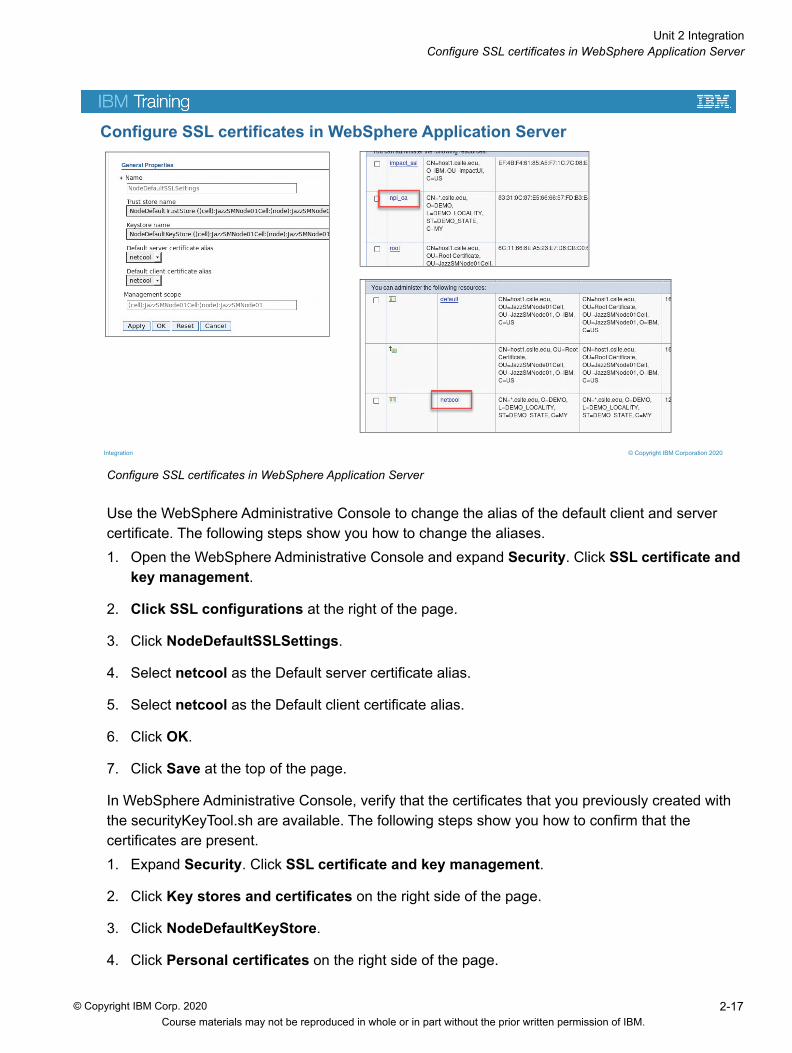
yConfigure SSL certificates in WebSphere Application Server
Use the WebSphere Administrative Console to change the alias of the default client and server certificate. The following steps show you how to change the aliases. 1. Open the WebSphere Administrative Console and expand Security. Click SSL certificate and
key management.
2. Click SSL configurations at the right of the page.
3. Click NodeDefaultSSLSettings.
4. Select netcool as the Default server certificate alias.
5. Select netcool as the Default client certificate alias.
6. Click OK.
7. Click Save at the top of the page.
In WebSphere Administrative Console, verify that the certificates that you previously created with the securityKeyTool.sh are available. The following steps show you how to confirm that the certificates are present.1. Expand Security. Click SSL certificate and key management.
2. Click Key stores and certificates on the right side of the page.
3. Click NodeDefaultKeyStore.
4. Click Personal certificates on the right side of the page.
Integration
Configure SSL certificates in WebSphere Application Server
© Copyright IBM Corporation 2020
Course materials may not be reproduced in whole or in part without the prior written permission of IBM.© Copyright IBM Corp. 2020 2-17

Unit 2 Integration Configure SSL certificates in WebSphere Application Server
V7.0
Uempt
y 5. Verify that the netcool certificate is present.6. Click the Key stores and certificates link at the top of the page.
7. Click NodeDefaultTrustStore.
8. Click Signer certificates.
9. Verify that the npi_ca certificate is present.
You must restart Jazz, DASH, and WebSphere Application Server after you change the certificate aliases.
Course materials may not be reproduced in whole or in part without the prior written permission of IBM.© Copyright IBM Corp. 2020 2-18
Unit 2 Integration Unit summary
V7.0
Uempt
yUnit summary
Integration
Unit summary
You should now be able to perform the following tasks:• Integrate discovery and metric collection with IBM Tivoli Network Manager• Integrate the event service with Netcool/OMNIbus• Integrate the UI service with Dashboard Application Services Hub
© Copyright IBM Corporation 2020
Course materials may not be reproduced in whole or in part without the prior written permission of IBM.© Copyright IBM Corp. 2020 2-19

Unit 2 Integration Exercise: Integration with Netcool Operations Insight
V7.0
Uempt
yExercise: Integration with Netcool Operations Insight
Integration
Exercise: Integration with NetcoolOperations InsightIn the exercises for this unit, you integrate Network Performance Insight with IBM Tivoli Network Manager, Netcool/OMNIbus, and Dashboard Application Services Hub (DASH).
© Copyright IBM Corporation 2020
Course materials may not be reproduced in whole or in part without the prior written permission of IBM.© Copyright IBM Corp. 2020 2-20

Unit 3 Post-installation configuration
This unit walks you through several post-installation tasks.
Course materials may not be reproduced in whole or in part without the prior written permission of IBM.© Copyright IBM Corp. 2020 3-1
Unit 3 Post-installation configuration Unit objectives
V7.0
Uempt
yUnit objectives
Post-installation configuration
Unit objectives
In this unit, you learn to perform the following tasks:• Install technology packs• Install and configure the Device Dashboard• Configure Dashboard Application Services Hub (DASH) roles• Install an interim fix• Set the resource scope
© Copyright IBM Corporation 2020
Course materials may not be reproduced in whole or in part without the prior written permission of IBM.© Copyright IBM Corp. 2020 3-2
Unit 3 Post-installation configuration Installing technology packs
V7.0
Uempt
yInstalling technology packs
Use the pack-install.sh tool to install technology packs. The pack-install.sh tool is in the following directory:
/opt/IBM/basecamp/basecamp-installer-tools/pack-installer
Technology packs are packaged as JAR files. The technology pack installation files are in the following directory:
/opt/IBM/basecamp/basecamp-installer-tools/ootb-packs
Run the following commands to install a technology pack. The installer prompts you for an administrative user name and password. In the following example, the Network Health technology pack is installed.
cd /opt/IBM/basecamp/basecamp-installer-tools/pack-installer/./pack-install.sh install ../ootb-packs/network-health-1.2.0.jarNPI Username: npiadminNPI Password: NPI Port[9443]:
Repeat this process to install additional technology packs.
Post-installation configuration
Installing technology packs
Technology packs are content plugins. They contain instructions that allow Network Performance Insight to discover and collect data from diverse network devices and technologies.
Technology packs contain:• Discovery formulas, to interrogate network devices and discover their capabilities• Collection formulas, to poll devices for performance measurements • Metrics, to calculate values based on the result of network polls• Standard and vendor-specific MIB files, to facilitate SNMP collection
© Copyright IBM Corporation 2020
Course materials may not be reproduced in whole or in part without the prior written permission of IBM.© Copyright IBM Corp. 2020 3-3
Unit 3 Post-installation configuration Installing technology packs
V7.0
Uempt
y Run the following command to verify that the technology packs were successfully installed:./status.shnpi1.csite.edu network-health-generic 1.2.0 network-health 1.2.0 network-health-cisco 1.1.0 network-probe-cisco 1.0.0
You can also verify installation with the following command:./pack-install.sh status----------------------------------------------------------------------------HOST PACK NAME VERSION ----------------------------------------------------------------------------npi1.csite.edu network-health-huawei 1.1.0 network-health-generic 1.2.0 network-qos-cisco 1.1.0 network-health 1.2.1 ...
Course materials may not be reproduced in whole or in part without the prior written permission of IBM.© Copyright IBM Corp. 2020 3-4
Unit 3 Post-installation configuration Installing the Device Dashboard
V7.0
Uempt
yInstalling the Device Dashboard
Install the Device Dashboard on the host where Dashboard Application Services Hub (DASH) is running.
Copy the Device Dashboard installation media to the DASH host, then decompress it.
Start IBM Installation manager, and follow the next steps to install the Device Dashboard.
Add the Device Dashboard installation media as a repository
1. Click File > Preferences.
2. Click Add Repository.
3. Browse to the 1.1.0-NOI-DeviceDashboard-FP0002.zip file, then click OK. You can find this file in the directory where you decompressed the Device Dashboard installation media.
4. Verify that only the Device Dashboard repository is selected.
5. Click OK to close the preferences window.
Install the Device Dashboard
1. Click Install to start the installation wizard.
2. Select the version 1.1.0.2 package and click Next.
3. Accept the license agreement and click Next.
Post-installation configuration
Installing the Device Dashboard
The Device Dashboard shows performance metric values, anomalies, and trends on any device, link, or interface. You can also view network flow performance data from the Device Dashboard.
You access the Device Dashboard from an IBM Tivoli Network Manager network view.
Install the Device Dashboard with IBM Installation Manager.
© Copyright IBM Corporation 2020
Course materials may not be reproduced in whole or in part without the prior written permission of IBM.© Copyright IBM Corp. 2020 3-5

Unit 3 Post-installation configuration Installing the Device Dashboard
V7.0
Uempt
y 4. Confirm that IBM Netcool GUI Components is selected as the package group and click Next.5. Verify that both features (Widgets and Device Dashboard) are selected and click Next.
6. Enter the password for smadmin and click Next.
7. Enter the Ambari administrative user name and password, then click Next.
8. Click Install at the summary page. The installation takes about 20 minutes.
9. Click Finish to close the installation wizard.
10. Click File > Exit to close Installation Manager.
Course materials may not be reproduced in whole or in part without the prior written permission of IBM.© Copyright IBM Corp. 2020 3-6
Unit 3 Post-installation configuration Add DASH roles to the Network Performance Insight users
V7.0
Uempt
yAdd DASH roles to the Network Performance Insight users
When you install Network Performance Insight, two users are created: npiadmin and npisuer. Use the following steps to add the Network Performance Insight DASH roles to these users.1. Log into DASH as an administrative user.
2. Click Console Settings > Roles.
3. Enter npi in the filter field.
4. Click the noi_npi role.
5. Expand Users and Groups.
6. Click the icon to add users.
7. Enter npi* as the user id, then click Search.
8. Select the npiadmin and npiuser users, then click Add.
9. Verify that the users are listed and click Save.
10. Click the noi_npi_admin role.
11. Expand Users and Groups.
12. Click the icon to add users.
13. Enter npi* as the user id, then click Search.
Post-installation configuration
Add DASH roles to the Network Performance Insight users
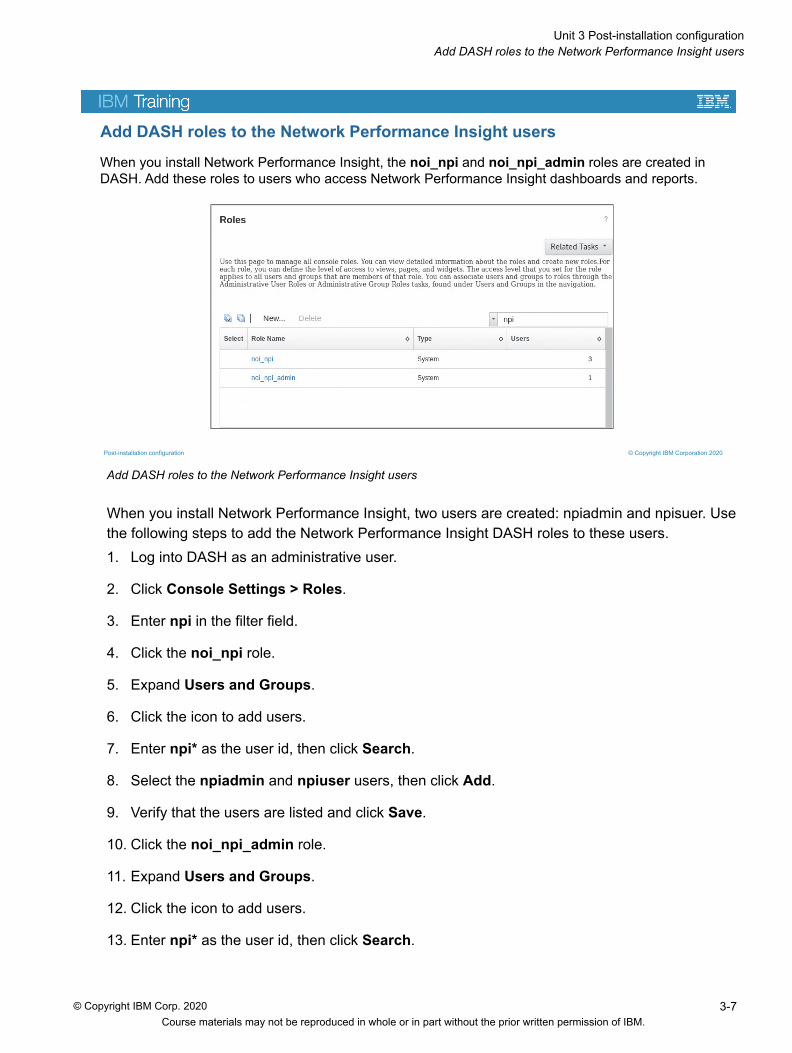
When you install Network Performance Insight, the noi_npi and noi_npi_admin roles are created in DASH. Add these roles to users who access Network Performance Insight dashboards and reports.
© Copyright IBM Corporation 2020
Course materials may not be reproduced in whole or in part without the prior written permission of IBM.© Copyright IBM Corp. 2020 3-7

Unit 3 Post-installation configuration Add DASH roles to the Network Performance Insight users
V7.0
Uempt
y 14. Select the npiadmin user, then click Add.15. Verify that the user is present and click Save.
Course materials may not be reproduced in whole or in part without the prior written permission of IBM.© Copyright IBM Corp. 2020 3-8

Unit 3 Post-installation configuration Configure IBM Tivoli Network Manager to access flow data
V7.0
Uempt
yConfigure IBM Tivoli Network Manager to access flow data
Add details about Network Performance Insight to two IBM Tivoli Network Manager configuration files. The following steps describe how to edit these files.
Configure access to flow data
Configure access to traffic flow data by editing the following file:/opt/IBM/netcool/gui/precision_gui/profile/etc/tnm/tnm.properties
Add the following line to the bottom of the tnm.properties file:tnm.npi.host.name=https://npi2.csite.edu:9443
Configure the Network Performance Insight version
Configure IBM Tivoli Network Manager with the Network Performance Insight version by editing the following file:
/opt/IBM/netcool/gui/precision_gui/profile/etc/tnm/npi.properties
Add the following line to the bottom of the npi.properties file:npi.server.version=1.3.1
Restart WebSphere Application Server, Jazz for Service Management, and DASH to apply the changes.
Post-installation configuration
Configure IBM Tivoli Network Manager to access flow data
Configure IBM Tivoli Network Manager with the host, port number, and version of the Network Performance Insight UI service.
Edit the following files:/opt/IBM/netcool/gui/precision_gui/profile/etc/tnm/tnm.properties
/opt/IBM/netcool/gui/precision_gui/profile/etc/tnm/npi.properties
© Copyright IBM Corporation 2020
Course materials may not be reproduced in whole or in part without the prior written permission of IBM.© Copyright IBM Corp. 2020 3-9

Unit 3 Post-installation configuration Installing an interim fix
V7.0
Uempt
yInstalling an interim fix
Use the following steps to install an interim fix.
Stop the Network Performance Insight services
1. Go to the Ambari Manager page. Log in as the admin user.
2. Click the Services tab.
3. Select the NPI service at the left of the page.
4. Click Service Actions > Stop.
5. Click Confirm Stop.
6. Click OK when the Stop NPI operation is finished.
Decompress the interim fix files
1. Change to the target directory. In this example the interim fix is in the /software/IF2 directory.cd /software/IF2
2. Run the following command to decompress the interim fix pack.tar -zxvf 1.3.1.0-TIV-NPI-IF0002.tgz
Post-installation configuration
Installing an interim fix
The interim fix includes tools to back up your existing users and install the fix:
dashboard_user_backup.sh
fix_update.sh
Follow these steps to install the fix:1. Stop the Network Performance Insight services2. Decompress the interim fix files3. Back up the existing Network Performance Insight users4. Install the interim fix with the fix_update.sh tool5. Restart the Network Performance Insight Storage service and UI service
© Copyright IBM Corporation 2020
Course materials may not be reproduced in whole or in part without the prior written permission of IBM.© Copyright IBM Corp. 2020 3-10
Unit 3 Post-installation configuration Installing an interim fix
V7.0
Uempt
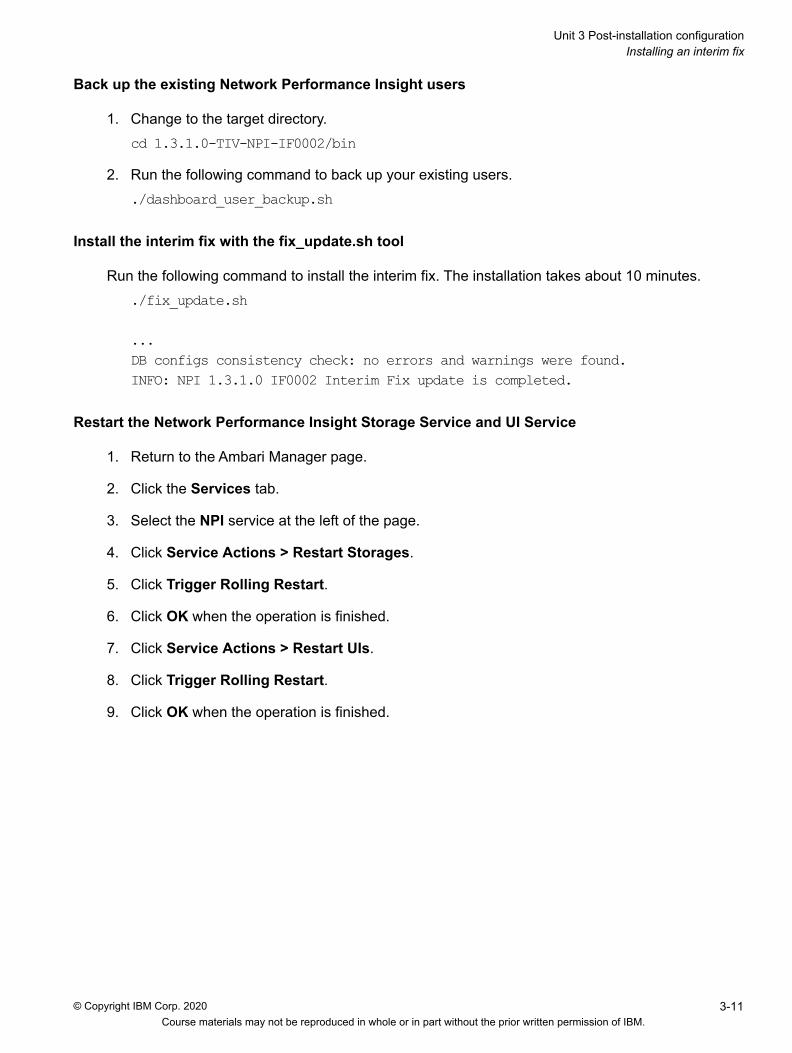
y Back up the existing Network Performance Insight users1. Change to the target directory.cd 1.3.1.0-TIV-NPI-IF0002/bin
2. Run the following command to back up your existing users../dashboard_user_backup.sh
Install the interim fix with the fix_update.sh tool
Run the following command to install the interim fix. The installation takes about 10 minutes../fix_update.sh
...DB configs consistency check: no errors and warnings were found.INFO: NPI 1.3.1.0 IF0002 Interim Fix update is completed.
Restart the Network Performance Insight Storage Service and UI Service
1. Return to the Ambari Manager page.
2. Click the Services tab.
3. Select the NPI service at the left of the page.
4. Click Service Actions > Restart Storages.
5. Click Trigger Rolling Restart.
6. Click OK when the operation is finished.
7. Click Service Actions > Restart UIs.
8. Click Trigger Rolling Restart.
9. Click OK when the operation is finished.
Course materials may not be reproduced in whole or in part without the prior written permission of IBM.© Copyright IBM Corp. 2020 3-11
Unit 3 Post-installation configuration Updating the technology packs
V7.0
Uempt
yUpdating the technology packs
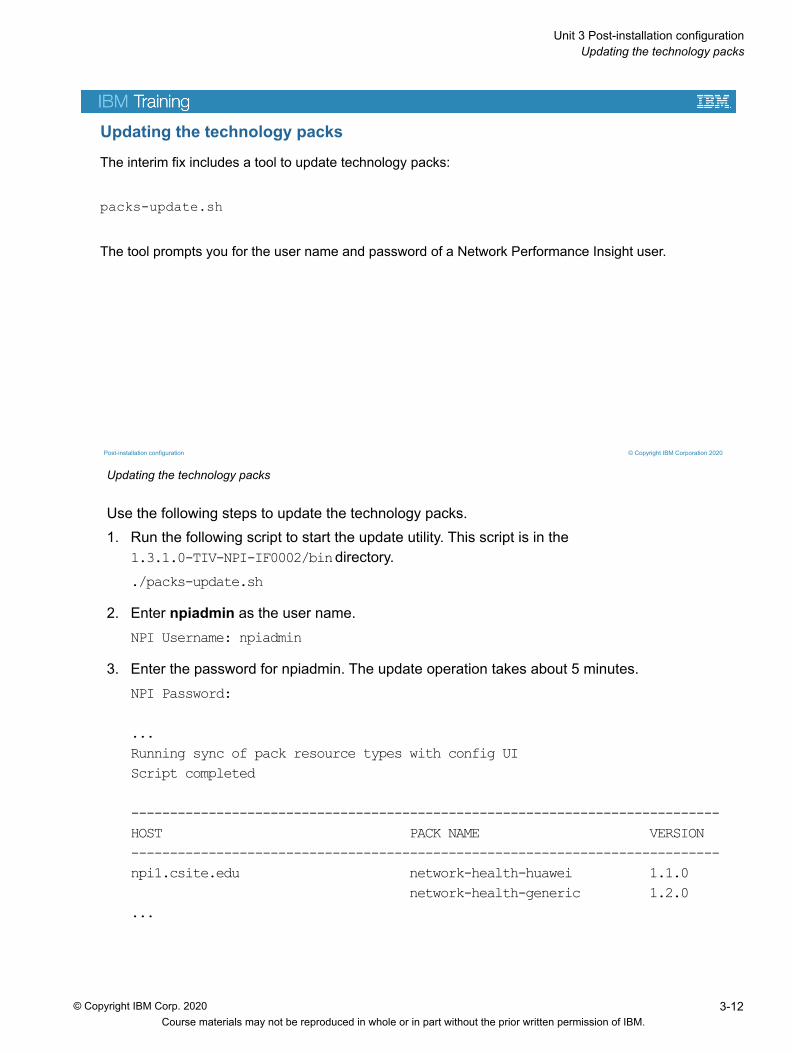
Use the following steps to update the technology packs.1. Run the following script to start the update utility. This script is in the
1.3.1.0-TIV-NPI-IF0002/bin directory../packs-update.sh
2. Enter npiadmin as the user name.NPI Username: npiadmin
3. Enter the password for npiadmin. The update operation takes about 5 minutes.NPI Password:
...Running sync of pack resource types with config UIScript completed
----------------------------------------------------------------------------HOST PACK NAME VERSION ----------------------------------------------------------------------------npi1.csite.edu network-health-huawei 1.1.0 network-health-generic 1.2.0 ...
Post-installation configuration
Updating the technology packs
The interim fix includes a tool to update technology packs:
packs-update.sh
The tool prompts you for the user name and password of a Network Performance Insight user.
© Copyright IBM Corporation 2020
Course materials may not be reproduced in whole or in part without the prior written permission of IBM.© Copyright IBM Corp. 2020 3-12

Unit 3 Post-installation configuration Updating the technology packs
V7.0
Uempt
y 4. Start all Network Performance Insight services that are not running.a. Return to the Firefox browser where the Ambari Manager page is open.b. Click the Services tab.
c. Select the NPI service at the left of the page.
d. Click Service Actions > Start.
e. Click Confirm Start.
f. Click OK when the operation is finished.
Course materials may not be reproduced in whole or in part without the prior written permission of IBM.© Copyright IBM Corp. 2020 3-13
Unit 3 Post-installation configuration Restoring the Network Performance Insight users
V7.0
Uempt
yRestoring the Network Performance Insight users
After you install the interim fix and update the technology packs, use the following steps to restore the users you previously backed-up.
Stop the Network Performance Insight Dashboard service
1. Go to the Ambari Manager page.
2. Click the Hosts tab and click npi2.csite.edu.
3. Scroll down and find the Dashboard service. Click the Started button then click Stop.
4. Click OK to confirm.
5. Click OK when the operation is finished.
Restore the users with the dashboard_user_restore.sh tool
Run the following command to restore the users. This script is in the 1.3.1.0-TIV-NPI-IF0002/bin directory.
./dashboard_user_restore.sh
...INFO: User restore done on npi2.csite.edu
Post-installation configuration
Restoring the Network Performance Insight users
Follow these steps to restore the Network Performance Insight users:1. Stop the Network Performance Insight Dashboard service2. Restore the users with the dashboard_user_restore.sh tool
3. Start the Network Performance Insight Dashboard service
© Copyright IBM Corporation 2020
Course materials may not be reproduced in whole or in part without the prior written permission of IBM.© Copyright IBM Corp. 2020 3-14

Unit 3 Post-installation configuration Restoring the Network Performance Insight users
V7.0
Uempt
y Start the Network Performance Insight Dashboard service1. Return to the Ambari Manager page.
2. Find the Dashboard service. Click the Stopped button and click Start.
3. Click OK to confirm.
4. Click OK when the operation is finished.
Course materials may not be reproduced in whole or in part without the prior written permission of IBM.© Copyright IBM Corp. 2020 3-15
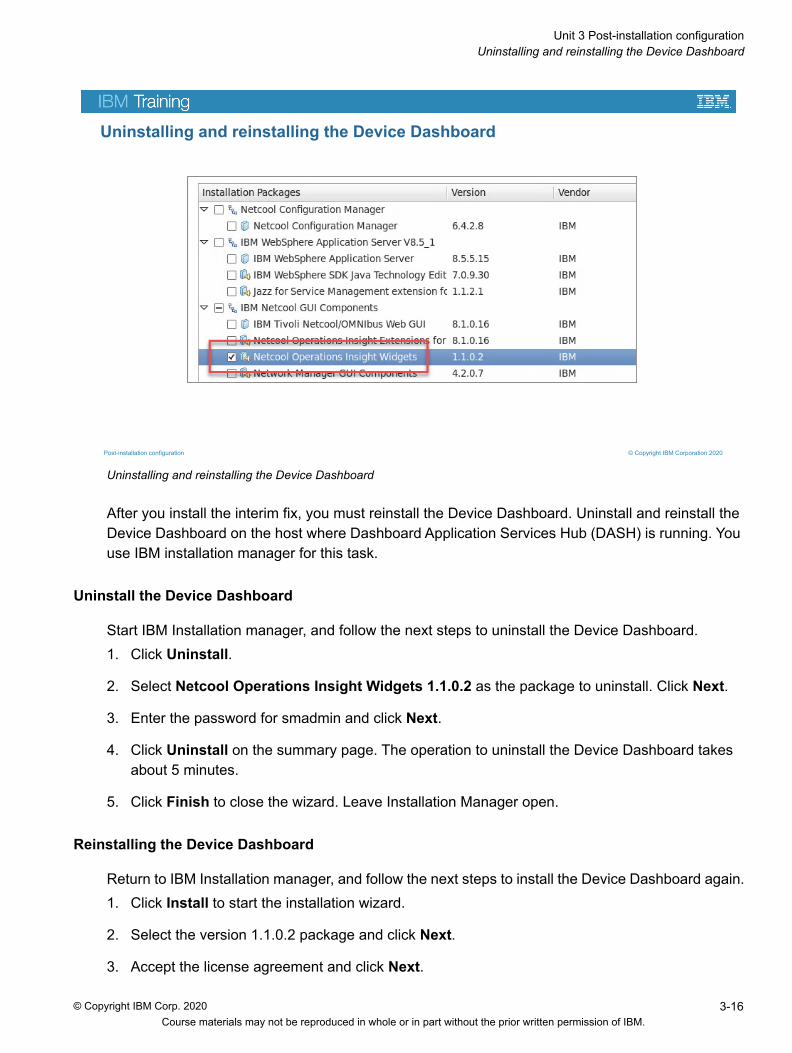
Unit 3 Post-installation configuration Uninstalling and reinstalling the Device Dashboard
V7.0
Uempt
yUninstalling and reinstalling the Device Dashboard
After you install the interim fix, you must reinstall the Device Dashboard. Uninstall and reinstall the Device Dashboard on the host where Dashboard Application Services Hub (DASH) is running. You use IBM installation manager for this task.
Uninstall the Device Dashboard
Start IBM Installation manager, and follow the next steps to uninstall the Device Dashboard.1. Click Uninstall.
2. Select Netcool Operations Insight Widgets 1.1.0.2 as the package to uninstall. Click Next.
3. Enter the password for smadmin and click Next.
4. Click Uninstall on the summary page. The operation to uninstall the Device Dashboard takes about 5 minutes.
5. Click Finish to close the wizard. Leave Installation Manager open.
Reinstalling the Device Dashboard
Return to IBM Installation manager, and follow the next steps to install the Device Dashboard again.1. Click Install to start the installation wizard.
2. Select the version 1.1.0.2 package and click Next.
3. Accept the license agreement and click Next.
Post-installation configuration
Uninstalling and reinstalling the Device Dashboard
© Copyright IBM Corporation 2020
Course materials may not be reproduced in whole or in part without the prior written permission of IBM.© Copyright IBM Corp. 2020 3-16

Unit 3 Post-installation configuration Uninstalling and reinstalling the Device Dashboard
V7.0
Uempt
y 4. Confirm that IBM Netcool GUI Components is selected as the package group and click Next.5. Verify that both features are selected and click Next.
6. Enter the password for smadmin and click Next.
7. Enter the Ambari administrative user name and password, then click Next.
8. Click Install at the summary page. The installation takes about 20 minutes.
9. Click Finish to close the installation wizard.
10. Click File > Exit to close Installation Manager.
Course materials may not be reproduced in whole or in part without the prior written permission of IBM.© Copyright IBM Corp. 2020 3-17

Unit 3 Post-installation configuration Configuring the Console Integration
V7.0
Uempt
yConfiguring the Console Integration
Use the following steps to configure the DASH Console Integration for Network Performance Insight.1. Open a Firefox browser. Go to the following URL, where DASH_HOST is the host name where
DASH is running. Log in as the user name npiadmin user.https://<DASH_HOST>:16311/ibm/console/logon.jsp
2. Click Console Settings > Console Integrations.
3. Click NPI.
4. Click Test. You can ignore the status message.
5. Click Save.
6. Verify that the connection is successful for the NPI Console Integration. Verify that you see a snowflake icon in the menu on the left.
Post-installation configuration
Configuring the Console Integration
© Copyright IBM Corporation 2020
Course materials may not be reproduced in whole or in part without the prior written permission of IBM.© Copyright IBM Corp. 2020 3-18

Unit 3 Post-installation configuration Setting the resource scope
V7.0
Uempt
ySetting the resource scope
The following steps show you an example of how to set the resource scope for SNMP metric collection. In this example, the scope is set for a range of devices.1. Change to the target directory.
cd /opt/IBM/basecamp/basecamp-installer-tools/snmp/
2. Run the following command to enable SNMP collection for a host named npi2.csite.edu, where a Network Performance Insight SNMP collector is running../snmp-scoping.sh set npi2.csite.edu true
3. Run the following command to set the resource scope to include a range of devices. In this example, the host named npi2.csite.edu is set to poll devices from 10.10.255.1 to 10.10.255.254../snmp-scoping.sh set npi2.csite.edu "range(resource.agentIp, '10.10.255.1', '10.10.255.254')"
4. Run the following command to list resource scopes../snmp-scoping.sh list
npi-npi2.csite.edu : { "formula.entity-scope" : "range(resource.agentIp, '10.10.255.1', '10.10.255.254')" }
Post-installation configuration
Setting the resource scope
To enable SNMP collection, set the resource scope to start polling SNMP data from a device or a range of devices.
The snmp-scoping.sh tool can assign polling targets to an SNMP collector, for example:./snmp-scoping.sh set npi2.csite.edu "range(resource.agentIp, '10.10.255.1', '10.10.255.254')“
Use the snmp-scoping.sh tool to configure a Network Performance Insight SNMP collector to start polling, for example:./snmp-scoping.sh set npi2.csite.edu true
© Copyright IBM Corporation 2020
Course materials may not be reproduced in whole or in part without the prior written permission of IBM.© Copyright IBM Corp. 2020 3-19

Unit 3 Post-installation configuration Setting the resource scope
V7.0
Uempt
y 5. Run a command like the following example to test your scope. ./snmp-scoping.sh test npi2.csite.edu "range(resource.agentIp, '10.10.255.1', '10.10.255.254')"[{"entityName":"10.10.255.5"},{"entityName":"10.10.255.7"},{"entityName":"10.10.255.10"},{"entityName":"10.10.255.12"},{"entityName":"10.10.255.11"},{"entityName":"10.10.255.2"},{"entityName":"10.10.255.15"},{"entityName":"10.10.255.14"}...
After you set the resource scope, use the following steps restart all affected Network Performance Insight services.1. Go to the Ambari Manager page.
2. Click the Services tab and select NPI.
3. Click Restart > Restart All Affected.
4. Click Confirm Restart All.
5. Click OK when the operation is finished.
6. Start the Dashboard service manually. Click the Hosts tab close to the top of the page.
7. Click npi2.csite.edu.
8. Scroll down and find the Dashboard service. If it is not running, click the Stopped button, then click Start.
9. Click OK to confirm.
10. In a short time, the start operation will be 100% complete. Click OK to confirm.
Course materials may not be reproduced in whole or in part without the prior written permission of IBM.© Copyright IBM Corp. 2020 3-20
Unit 3 Post-installation configuration Unit summary
V7.0
Uempt
yUnit summary
Post-installation configuration
Unit summary
You should now be able to perform the following tasks:• Install technology packs• Install and configure the Device Dashboard• Configure Dashboard Application Services Hub (DASH) roles• Install an interim fix• Set the resource scope
© Copyright IBM Corporation 2020
Course materials may not be reproduced in whole or in part without the prior written permission of IBM.© Copyright IBM Corp. 2020 3-21
Unit 3 Post-installation configuration Exercise: Post-installation configuration
V7.0
Uempt
yExercise: Post-installation configuration
Post-installation configuration
Exercise: Post-installation configurationIn the exercises for this unit, you complete several post-installation tasks.
© Copyright IBM Corporation 2020
Course materials may not be reproduced in whole or in part without the prior written permission of IBM.© Copyright IBM Corp. 2020 3-22

Unit 4 Solution verification
This unit describes several IBM Network Performance Insight dashboards and reports. You can use these reports to confirm that IBM Network Performance Insight is successfully processing data.
Course materials may not be reproduced in whole or in part without the prior written permission of IBM.© Copyright IBM Corporation 2020
Unit 4: Solution verification
Course materials may not be reproduced in whole or in part without the prior written permission of IBM.© Copyright IBM Corp. 2020 4-1

Unit 4 Solution verification Unit objectives
V7.0
Uempt
yUnit objectives
Solution verification
Unit objectives
In this unit, you learn to perform the following tasks:• Use performance dashboards and reports• Verify that IBM Network Performance Insight is processing data
© Copyright IBM Corporation 2020
Course materials may not be reproduced in whole or in part without the prior written permission of IBM.© Copyright IBM Corp. 2020 4-2

Unit 4 Solution verification Example data sources
V7.0
Uempt
yExample data sources
In the labs for this course, IBM Network Performance Insight obtains performance data using the following three methods: • From network flow records: A network flow record is data that is generated by a network
device, such as a router or switch. The data in a network flow record describes the network traffic that has passed through the router or switch. These records contain data about network traffic; for example, every network flow record contains information about the source and destination of the traffic.
Flow-enabled network devices export network flow records to an external application for collection and analysis. The role of IBM Network Performance Insight is to accept flow records from network devices, analyze them, store them, and present users with reports about the flow of traffic through the network.
IBM Network Performance Insight users get reports and dashboards to help them understand the traffic on their network. Here are examples of information that users quickly learn from Network Performance Insight:
– Traffic source and destination
– Which applications are using the most bandwidth
– Monitor new applications or network segments to observe their impact on the network
• From SNMP polls: Network devices can expose performance measurements about themselves using SNMP agents. IBM Network Performance Insight can directly poll these SNMP-enabled devices to obtain the current value of these measurements. In your lab
Solution verification
Example data sources
© Copyright IBM Corporation 2020
IBM Tivoli Network Manager
IBM Network Performance
Insight
SNMP polls from ITNM (Bandwidth utilization, CPU, Memory, etc.)
Direct SNMP polls to network devices (IP SLA, temperature)
Network devices
Network flow records sent from enabled devices
Course materials may not be reproduced in whole or in part without the prior written permission of IBM.© Copyright IBM Corp. 2020 4-3

Unit 4 Solution verification Example data sources
V7.0
Uempt
y environment, IBM Network Performance Insight is directly polling the simulated network devices for IP SLA metrics.• From IBM Tivoli Network Manager: IBM Tivoli Network Manager can also poll devices for SNMP data. IBM Network Performance Insight can obtain the metrics that are generated by IBM Tivoli Network Manager and use them in reports and dashboards. In your environment, IBM Network Performance Insight is reusing IBM Tivoli Network Manager metrics such as bandwidth utilization, CPU utilization, memory utilization, and others.
Course materials may not be reproduced in whole or in part without the prior written permission of IBM.© Copyright IBM Corp. 2020 4-4

Unit 4 Solution verification Network flow dashboards
V7.0
Uempt
yNetwork flow dashboards
IBM Network Performance Insight provides several dashboards that present flow data. These dashboards show different aspects of your network traffic, including the following: • Traffic source
• Traffic destination
• Conversations between network endpoints
• Applications within your traffic
• Network protocols
These dashboards are interactive. You can change the device, the interface, the traffic direction, and the time period of the dashboard page. You can also click on data points or table rows to drill-down to more detailed data.
Click NetFlow at the top of the IBM Network Performance Insight user interface to access the network flow data dashboards.
Solution verification
Network flow dashboards
© Copyright IBM Corporation 2020
Course materials may not be reproduced in whole or in part without the prior written permission of IBM.© Copyright IBM Corp. 2020 4-5
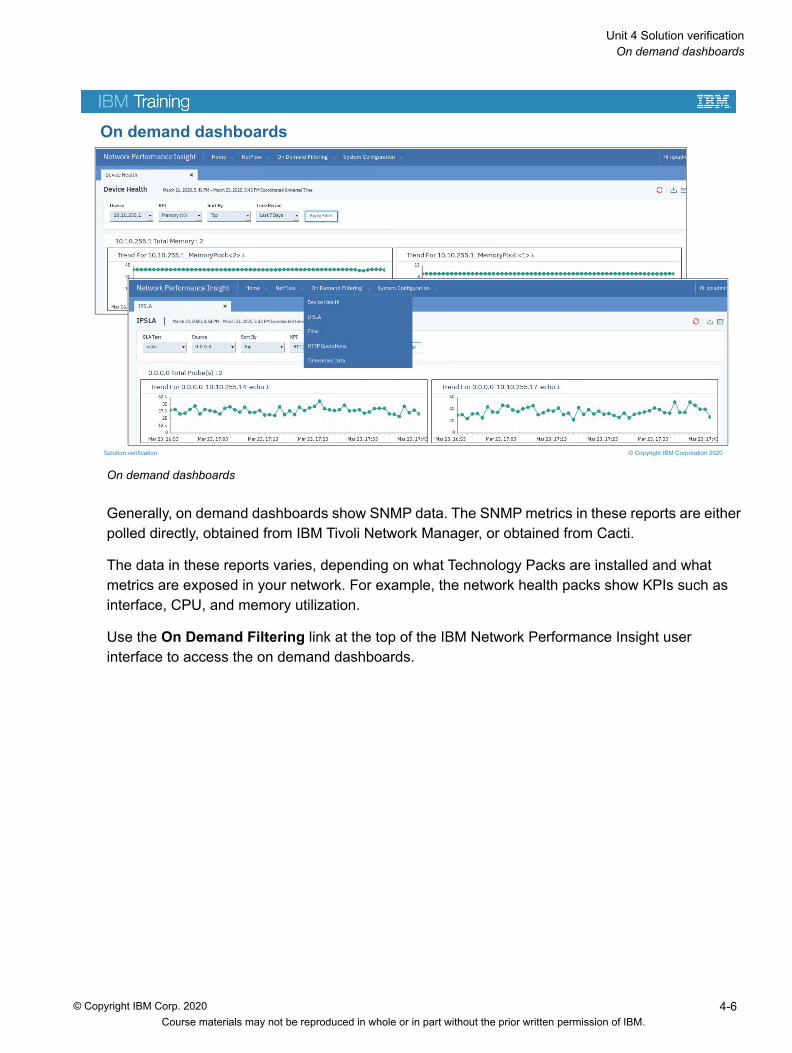
Unit 4 Solution verification On demand dashboards
V7.0
Uempt
yOn demand dashboards
Generally, on demand dashboards show SNMP data. The SNMP metrics in these reports are either polled directly, obtained from IBM Tivoli Network Manager, or obtained from Cacti.
The data in these reports varies, depending on what Technology Packs are installed and what metrics are exposed in your network. For example, the network health packs show KPIs such as interface, CPU, and memory utilization.
Use the On Demand Filtering link at the top of the IBM Network Performance Insight user interface to access the on demand dashboards.
Solution verification
On demand dashboards
© Copyright IBM Corporation 2020
Course materials may not be reproduced in whole or in part without the prior written permission of IBM.© Copyright IBM Corp. 2020 4-6
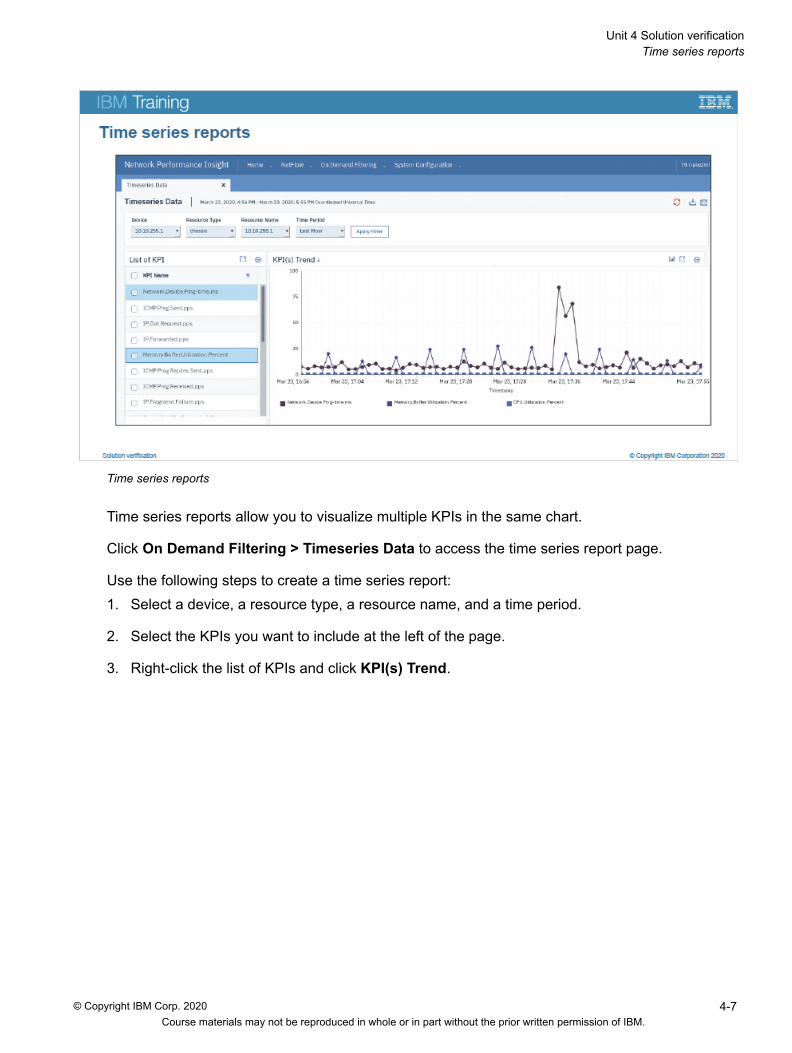
Unit 4 Solution verification Time series reports
V7.0
Uempt
yTime series reports
Time series reports allow you to visualize multiple KPIs in the same chart.
Click On Demand Filtering > Timeseries Data to access the time series report page.
Use the following steps to create a time series report:1. Select a device, a resource type, a resource name, and a time period.
2. Select the KPIs you want to include at the left of the page.
3. Right-click the list of KPIs and click KPI(s) Trend.
Course materials may not be reproduced in whole or in part without the prior written permission of IBM.© Copyright IBM Corp. 2020 4-7

Unit 4 Solution verification Historical trend dashboard
V7.0
Uempt
yHistorical trend dashboard
Historical trend dashboards show metric data over multiple time ranges on one page: • Last hour
• Last day
• Last week
• Last 30 days
• Last 365 days
Historical trend dashboards also show the maximum, minimum, and average values for each time range.
To access a historical trend dashboard, click a data point in a time series report or an on demand dashboard.
Course materials may not be reproduced in whole or in part without the prior written permission of IBM.© Copyright IBM Corp. 2020 4-8
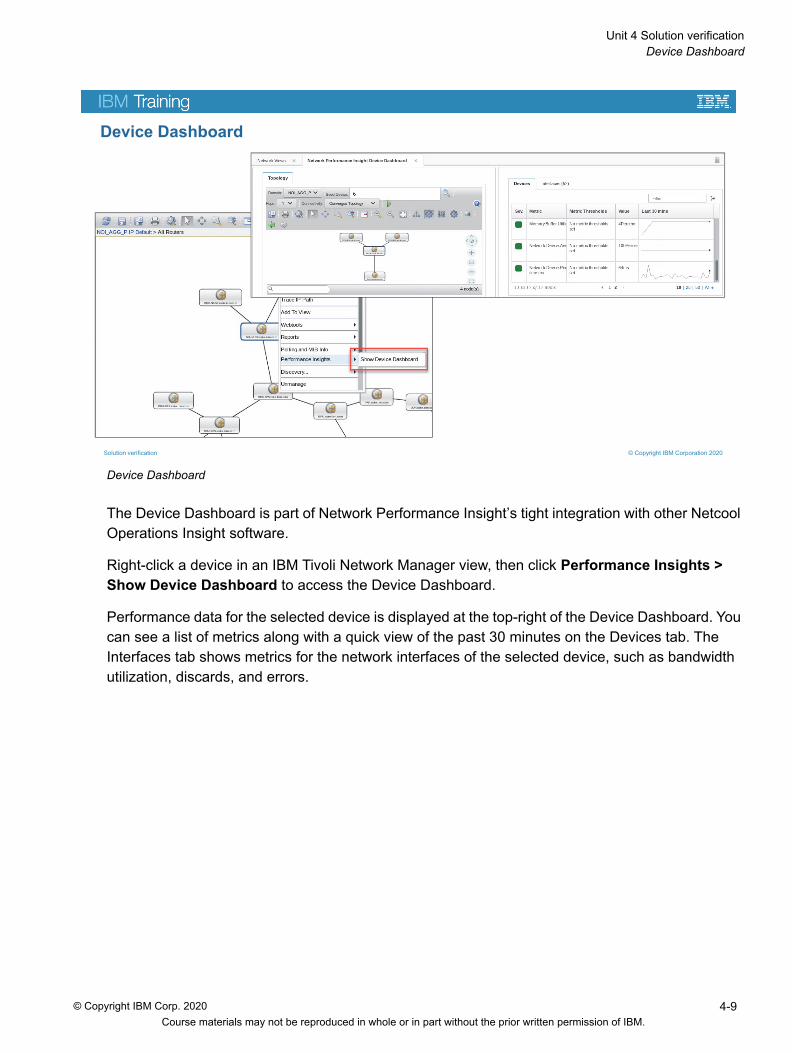
Unit 4 Solution verification Device Dashboard
V7.0
Uempt
yDevice Dashboard
The Device Dashboard is part of Network Performance Insight’s tight integration with other Netcool Operations Insight software.
Right-click a device in an IBM Tivoli Network Manager view, then click Performance Insights > Show Device Dashboard to access the Device Dashboard.
Performance data for the selected device is displayed at the top-right of the Device Dashboard. You can see a list of metrics along with a quick view of the past 30 minutes on the Devices tab. The Interfaces tab shows metrics for the network interfaces of the selected device, such as bandwidth utilization, discards, and errors.
Solution verification
Device Dashboard
© Copyright IBM Corporation 2020
Course materials may not be reproduced in whole or in part without the prior written permission of IBM.© Copyright IBM Corp. 2020 4-9

Unit 4 Solution verification Configuring network flow thresholds
V7.0
Uempt
yConfiguring network flow thresholds
You can configure IBM Network Performance Insight to send notification to Netcool/OMNIbus if traffic on a flow interface exceeds a predefined level. To set a traffic volume threshold on a flow interface, click System Configuration > Threshold > Flow Thresholds.
When you edit a threshold, there are several configuration options.
The Limit Type field can be Over, Under, or Band: • Over means that the threshold is violated when interface volume exceeds the upper or lower
limits.
• Under means that the threshold is violated when interface volume is less than the upper or lower limits.
• Band means that the threshold is violated when interface volume exceeds the upper limit or is less than the lower limit.
Number of events is the number of consecutive threshold violations that trigger an event, which is sent to Netcool/OMNIbus.
Threshold limits and Netcool/OMNIbus events
The severity of a threshold event that is sent to Netcool/OMNIbus is determined by the type of threshold. The following table lists the event severity for each type of threshold.
Solution verification
Configuring network flow thresholds
© Copyright IBM Corporation 2020
Course materials may not be reproduced in whole or in part without the prior written permission of IBM.© Copyright IBM Corp. 2020 4-10
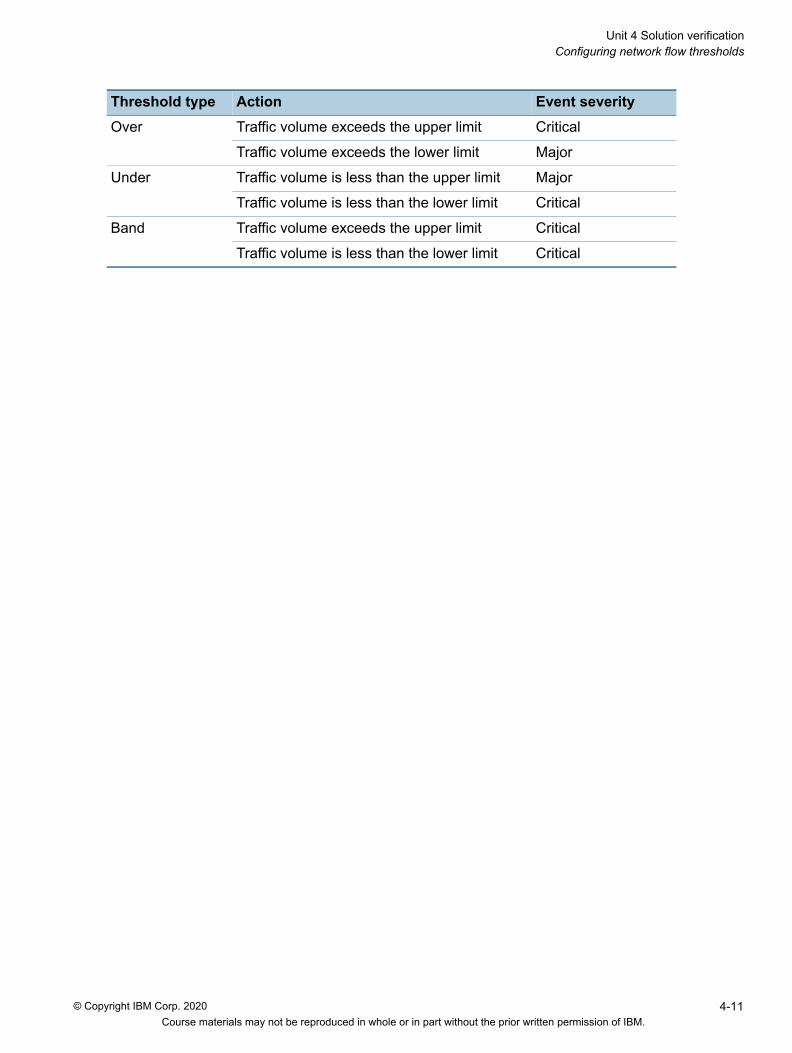
Unit 4 Solution verification Configuring network flow thresholds
V7.0
Uempt
yThreshold type Action Event severityOver Traffic volume exceeds the upper limit CriticalTraffic volume exceeds the lower limit Major
Under Traffic volume is less than the upper limit Major
Traffic volume is less than the lower limit Critical
Band Traffic volume exceeds the upper limit Critical
Traffic volume is less than the lower limit Critical
Course materials may not be reproduced in whole or in part without the prior written permission of IBM.© Copyright IBM Corp. 2020 4-11

Unit 4 Solution verification Traffic details dashboard
V7.0
Uempt
yTraffic details dashboard
Threshold violations are displayed in the Traffic Details dashboard. Access the dashboard from the Netcool/OMNIbus event viewer. Right-click a threshold violation event, then click Performance Insight > Show Traffic to open the Traffic Details dashboard.
The traffic details dashboard shows you details about network traffic at the network and interface level. Each traffic details report can show ingress traffic, egress traffic, or both. You can access the following traffic details reports, and others, by changing the report view:
•Top Sources
•Top Sources with Application
•Top Applications
•Top Applications with Source
•Top Applications with Destination
•Top Applications with Conversation
•Top Protocols
•Top Protocols with Source
•Top Protocols with Application
•Top Protocols with Conversation
Solution verification
Traffic details dashboard
© Copyright IBM Corporation 2020
Course materials may not be reproduced in whole or in part without the prior written permission of IBM.© Copyright IBM Corp. 2020 4-12

Unit 4 Solution verification Traffic details dashboard
V7.0
Uempt
y •Top Protocols with Destination•Top Conversations
•Top Conversations with Application
•Top Destinations
•Top Destinations with Application
Course materials may not be reproduced in whole or in part without the prior written permission of IBM.© Copyright IBM Corp. 2020 4-13
Unit 4 Solution verification Unit summary
V7.0
Uempt
yUnit summary
Solution verification
Unit summary
You should now be able to perform the following tasks:• Use performance dashboards and reports• Verify that IBM Network Performance Insight is processing data
© Copyright IBM Corporation 2020
Course materials may not be reproduced in whole or in part without the prior written permission of IBM.© Copyright IBM Corp. 2020 4-14
Unit 4 Solution verification Exercise: Solution verification
V7.0
Uempt
yExercise: Solution verification
Solution verification
Exercise: Solution verificationIn the exercises for this unit, you use reports and dashboards to confirm that IBM Network Performance Insight is installed correctly.
© Copyright IBM Corporation 2020
Course materials may not be reproduced in whole or in part without the prior written permission of IBM.© Copyright IBM Corp. 2020 4-15

Unit 4 Solution verification Exercise: Solution verification
V7.0
Uempt
yCourse materials may not be reproduced in whole or in part without the prior written permission of IBM.© Copyright IBM Corp. 2020 4-16
V7.0
Uempty
®
IBM Training
© Copyright IBM Corporation 2020. All Rights Reserved.