coupling lidar data and landsat 8 oli in …. coupling_lida… · coupling lidar data and landsat 8...
TRANSCRIPT

COUPLING LIDAR DATA AND LANDSAT 8 OLI IN DELINEATING CORN PLANTATIONS
IN BUTUAN CITY, PHILIPPINES
Michelle V. Japitana, James Earl D. Cubillas and Arnold G. Apdohan
Phil-LiDAR 2.B.14 Project, College of Engineering and Information Technology, Caraga State University,
Butuan City, Philippines, Email: [email protected]
Email: [email protected] Email: [email protected]
KEY WORDS: Corn, Landsat, OBIA
ABSTRACT: This paper illustrates the classification of corn in the LiDAR data using Landsat indices as features.
The Landsat data are calibrated in order to have a noise free reflectance image. Preliminary field in-situ spectral
measurements were carried out in order to determine the unique reflectance values of corn in Butuan City, Philippines.
In-situ spectral response measurement was done using Ocean OpticsTM VIS-NIR Spectrometer with spectral range
from 350 nm to 1000 nm. The computed average reflectance values of corn samples would then be used in order to
derive specific values for the Enhance Vegetation Index (EVI) and Green Ratio of corns within the study area. When
RGB aerial images are unavailable, classification using LiDAR data only can proved to be futile. However, the Green
Ratio and EVI from the transformed Landsat image could be the key features to classify any entities in the image.
This paper highlights the classification of a certain class of vegetation objects having a height of 0.5 to 2 meters in
the LiDAR nDSM. This class was referred to as class “Medium Elevation” in this paper. Subclasses of this class are
class “Corn” and class “Shrub”. Segmentation was based on LiDAR nDSM and Intensity images. Samples were then
collected for each of the two classes. A Supervised learning algorithm called SVM (Support Vector Machine) was
used to classify entities in the image. The SVM model was constructed using the LiDAR derivatives (nDSM, DSM
intensity), Green Ratio, and EVI as features. High overall accuracies were obtained for the classification of corn and
shrub in both the train (91.08%) and test site (91.52%). With this, moderate resolution image like Landsat can indeed
compliment other remotely sensed data like LiDAR. Specific band ratios derived from the spectral signature of corn,
and features like the Green Ratio and Enhanced Vegetation Index can prove to be reliable features in discriminating
corn from other vegetation species.
1. INTRODUCTION
Corn is the second most important crop in the Philippines. About 14 million Filipinos prefer white corn as their main
staple and yellow corn accounts for about 50% of livestock mixed feeds. Some 600,000 farm households depend on
corn as a major source of livelihood, in addition to transport services, traders, processors and agricultural input
suppliers who directly benefit from corn production, processing, marketing and distribution (www.da.gov.ph, 2012).
Since the importance of corn in the region could give livelihood and sort of needs of the people, a detailed map by
means of remote sensing is needed to locate the corn species and analyze the location, growth, and its adaptability.
There is limited (or none at all) spatial data that can describe or give information on the extent and production trends
in the region. Most of the available agricultural crops profiles and statistics are based on interviews that comprise data
that were not supported with appropriate spatial measurements.
Recently, a new approached called OBIA – Object based image analysis, has been gaining a large amount of attention
in the remote sensing community. When methods become contextual they allow for the utilization of “surrounding”
information and attributes. The workflows are usually highly customizable or adaptive allowing for the inclusion of
human semantics and hierarchical networks (Blaschke, Johansen, & Tiede, 2011). Among the machine learning
algorithms, Support Vector Machine has recently received a lot of attention and the number of works utilizing this
technique has increased exponentially. The basic concept behind SVM is to search for a balance between the
regularization term and the training errors (Chang & Lin, 2001). The most important characteristic is SVM’s ability
to generalize well from a limited amount and/or quality of training data. Compared to other methods like artificial
neural networks, SVMs can yield comparable accuracy using a much smaller training sample size (Mountrakis, Im,
& Ogole, 2009). Recent work of (Japitana, et al., 2014) has developed SVM optimized model, when tested against a
different scene resulted to good classification accuracy.
Multispectral sensors for remote sensing are designed to capture the reflected energy from various objects on the
ground in the visible and the infrared wavelengths of the electromagnetic (EM) spectrum of the sun. Some of the
sensor ranges extend all the way into the thermal spectral range, whereas most of the commercial sensors today
primarily capture data in the visible and near-infrared regions of the EM spectrum (Navulur, 2007). Moreover, Remote
Sensing techniques can lead an accurate inventory by collecting and processing in-situ spectral data (Santillan,

Japitana, Apdohan, & Amora, 2012). (Nidamanuri & Bernd, 2011) cited the works of (Black & Guo, 2008; Martin,
Smith, Ollinger, Plourde, & Hallett, 2003; Nidamanuri, Garg, Ghosh, & Dadhwal, 2008; Thenkabail, Smith, & De-
Pauw, 2002; Zhang, Chen, Miller, & Noland, 2008) that advances in hyperspectral remote sensing provide
opportunities for detailed mapping, modelling, and biophysical characterisation of agricultural crops.
Producing a more precise inventory of agricultural resources specifically corn crop is also a challenge in the area.
With the advances in LiDAR technologies and the use of high resolution satellite imageries, it provides opportunities
for detailed mapping and modeling of agricultural crops. To aid the precise inventory of corn, this study therefore
demonstrate the applicability of using LiDAR data, remote sensing techniques, and object-based image analysis in
order to delineate corn plantations in the study area. This paper explores the application of remote sensing paradigm
by determining the unique spectral features by performing in-situ measurements and employing remote sensing
techniques combining moderate resolution image (Land 8 OLI), spectral signatures, and LiDAR-derived datasets to
characterize corn plantations.
2. METHODOLOGY
This paper illustrates the utilization of the spectral data to delineate the spectral signatures of corn (Zea mays) crop
for classification employing Object-Based Image Analysis (OBIA). The preliminary measurements were carried out
in the selected corn areas in Butuan City, Philippines. In-situ spectral response measurement was done using Ocean
OpticsTM VIS-NIR Spectrometer with spectral range from 350 nm to 1000 nm. Analysis of the spectral reflectance
was conducted in order to determine the unique spectral response characteristics of corn at its varying growth stages.
The Spectral Signatures and LandSat 8 TOA reflectance image with Noise reduction were re-sampled to a new
transformed reflectance image. The reflectance image was transformed for a second time based on the Green Ratio
and EVI (Enhanced Vegetation Index). These two transformed images were used to extract the feature values that
determine the properties of corn and other entities in the image. When RGB aerial images are unavailable,
classification using LiDAR data only can prove to be futile. However, the Green Ratio and EVI from the transformed
Landsat image could be the key features to classify any entities in the image.
This paper highlights the classification of a certain class of vegetation objects having a height of 0.5 to 2 meters in
the LiDAR nDSM. This class was referred to as class “Medium Elevation” in this paper. Subclasses of this class are
class “Corn” and class “Shrub”. Segmentation was based on LiDAR nDSM and Intensity images. Samples were then
collected for each of the two classes. A Supervised learning algorithm called SVM (Support Vector Machine) was
used to classify entities in the image. The SVM model was constructed using the LiDAR derivatives (nDSM, DSM
intensity), Green Ratio, and EVI as features.
Figure 1. Process Flow for Classifying Corn Features
2.1 In-situ Spectral Measurements
Corn at two (2) different growth stages was subjected to in-situ spectral measurements (i.e. vegetative and
reproductive stage). Reflectance spectra were measured within each sampling site just above the canopy of Corn
using Ocean OpticsTM VIS-NIR Spectrometer. The sensor detects and records data with spectral range from 350 nm
to 1000 nm. In order to measure the spectra of the Corn crop, the set-up was composed of the sensor, mounted in an
improvised pole, attached to the fiber optics and was positioned just above the canopy. The spectrometer is connected
to a laptop computer that performs the scanning procedure, displays the plot of the observed reflectance and stores
the reflectance data.
For each sampled Corn crop, the spectral measurement will be performed in three modes on the side of the canopy
(i.e., at 45 degrees separation). For each mode, it will take 20 scans, the average of which represents the spectral
reflectance of the sample at that sampling site. In each site, two kinds of measurements will be taken: (i.) the amount
of radiation reflected by the sample Corn crop and (ii.) reflected radiation from a “white reference panel” (Ocean
Optics LS1 diffused reflectance standard). Measurement of the white reference panel will perform before and after
measurements of the sample Corn crop (Figure 3). All gathered data will be converted to Microsoft Excel format and
the reflectance was calculated using the equation:
𝑅 =𝐿𝑐𝑎𝑛𝑜𝑝𝑦−𝐿𝑑𝑎𝑟𝑘
𝐿𝑝𝑎𝑛𝑒𝑙−𝐿𝑑𝑎𝑟𝑘 𝑥 100 (1)
where R is the canopy reflectance, Lcanopy is the measured radiance above canopy (average), Lpanel is the radiance
measured for the calibration panel, and Ldark is dark reference. All spectral data in Microsoft Excel format are
compiled in one spreadsheet file to compute the average reflectance and graphically assess the spectral patterns of the
each corn crop stage.
2.2 Landsat 8 OLI Pre-processing of Green Ratio and EVI
LandSat data from USGS (U.S. Geological Survey) was used with a 30 meters pixel size. The LandSat 8 data must
be atmospherically corrected, converting the DN (Digital Numbers) into Radiance using Radiometric Calibration.
ENVI 5.1 have a ready FLAASH tool for Landsat 8 images which is easy to use to obtain surface reflectance image.
The surface reflectance must be noise corrected in order to have minimal errors in some pixel values in the output
image. The computed average reflectance values of corn samples would then be used in order to derive specific values
for the Enhance Vegetation Index (EVI) and Green Ratio of corns within the study area.
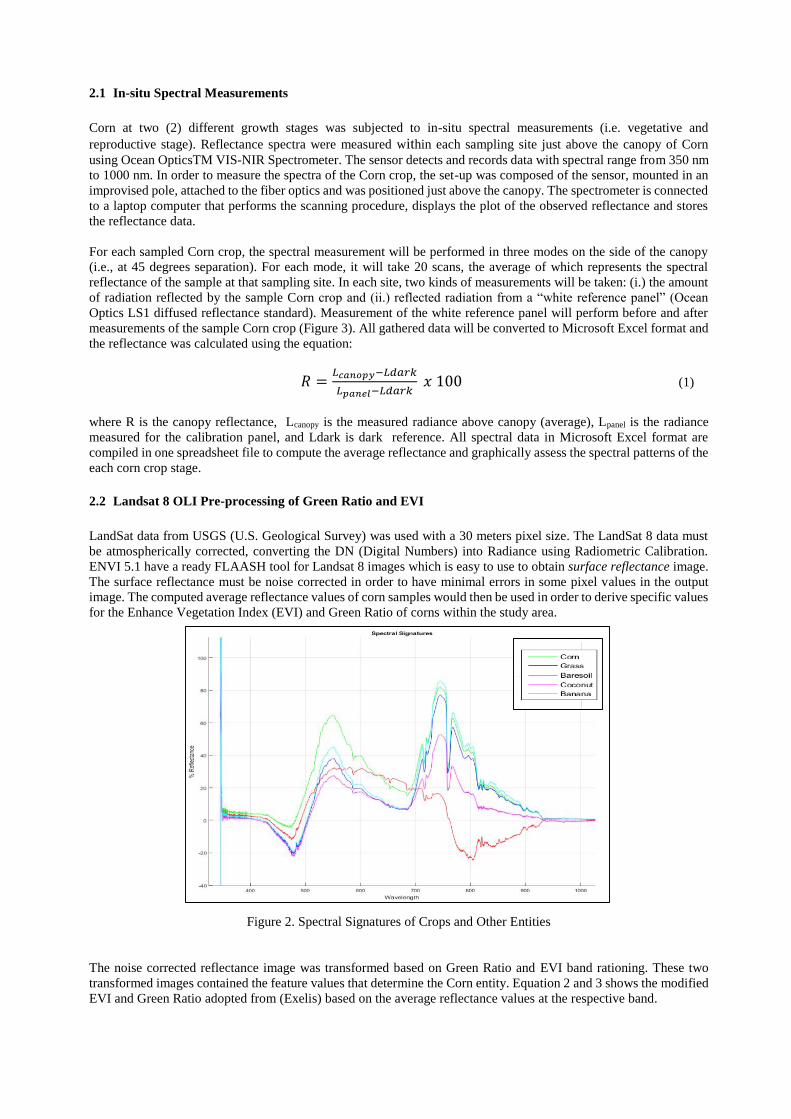
Figure 2. Spectral Signatures of Crops and Other Entities
The noise corrected reflectance image was transformed based on Green Ratio and EVI band rationing. These two
transformed images contained the feature values that determine the Corn entity. Equation 2 and 3 shows the modified
EVI and Green Ratio adopted from (Exelis) based on the average reflectance values at the respective band.

𝐸𝑉𝐼𝑐𝑜𝑟𝑛 =[(%𝑁𝐼𝑅∗𝐵5)−(%𝑅𝐸𝐷∗𝐵4)]
[(%𝑁𝐼𝑅∗𝐵5)+6(%𝑅𝐸𝐷∗𝐵4)−7.5(%𝐵𝐿𝑈𝐸∗𝐵2)] 𝑥 100 (2)
where: %NIR is an average reflectance of corn at Near-infrared spectrum
%RED is an average reflectance of corn at VIS range (RED)
%BLUE is an average reflectance of corn at VIS range (BLUE)
B5 is Band 5 - Near Infrared (NIR) 850 - 880 nm
B4 is Band 4 - Red 640- 670 nm
B2 is Band 2 - Blue 450-510 nm
𝐺𝑅𝐸𝐸𝑁 𝑅𝐴𝑇𝐼𝑂𝑐𝑜𝑟𝑛 =(%𝐺𝑅𝐸𝐸𝑁∗𝐵3)
[(%𝑅𝐸𝐷∗𝐵4) + (%𝐺𝑅𝐸𝐸𝑁∗𝐵3) − (%𝐵𝐿𝑈𝐸∗𝐵2)] 𝑥 100 (3)
where: %RED is an average reflectance of corn at VIS range (RED)
%GREEN is an average reflectance of corn at VIS range (GREEN)
%BLUE is an average reflectance of corn at VIS range (BLUE)
B2 is Band 2 - Blue 450-510 nm
B3 is Band 3 - Green 530-590 nm
B4 is Band 4 - Red 640- 670 nm
2.3 Image Classification
2.3.1 Segmentation
Classification of the image objects were done by developing rule sets in eCognition. Landsat 8 OLI processed rasters
(i.e. Green Ratio and EVI) were used as features to create class definitions. Image Layers were assigned in order to
have a synchronized process in segmentation procedures (Figure 3).
Figure 3. Image layers: (A) NDSM (Normalized Digital Surface Model), (B) DSM_int (Digital Surface Model
Intensity), (C) Green Ratio image and (D) EVI (Enhanced Vegetation Index) image.
Figure 4 Process of Segmentation and Pre-classification

Segmentation algorithms were used to subdivide entire images at a pixel level, or specific image objects from other
domains into smaller image objects. The image was segmented according to its homogeneity. To discriminate other
objects, the researchers used nDSM as a discriminating factor to group the objects according to their heights.
2.3.2 Supervised Learning Algorithm
Sample objects of corn and shrub were extracted from the segmented images. Features from the collected samples
were used for classification and for creating class definitions. Some classes of objects were not linearly separable in
the feature space making it difficult to develop rule sets. To address this problem, the image objects were subjected
to a supervised learning algorithm.
A Supervised learning algorithm called SVM (Support Vector Machine) was used to classify land features in the
image. The LiDAR derivatives (nDSM, DSM intensity), Green Ratio, and EVI were used as features for developing
the SVM model. Among the machine learning algorithms, Support Vector Machine has recently received a lot of
attention and the number of works utilizing this technique has increased exponentially. Support Vector Machines
have gained popularity because of their ability to generalize well given a limited number of training samples.
However, SVMs also suffer from parameter assignment issues that can significantly affect the classification results.
More specifically, the regularization parameter C in Linear SVM has to be optimized to increase the accuracy. We
perform the optimization procedure in MATLAB. The learned hyperplanes separating one class from another in the
multi-dimensional feature space can be thought of as a super feature which will then be used in developing the rule
set in eCognition.
Figure 5. Top Right: SVM algorithm, Plots: Samples of Corn and Shrub with respect to Features

3. RESULTS AND DISCUSSION
3.1 CLASSIFIED IMAGE
The output parameters set by Support Vector Machine will be used as threshold between class Corn and Shrub. Figure
6 shows the classified objects, representing Corn as yellow and Shrub as purple.
Figure 6 Training site with Classification based on SVM parameters
Figure 7. Accuracy Assessment of the Training site
The accuracy assessment based on the training site is shown in Figure 7. A high overall accuracy of 91.08 % was
obtained with a KIA of 78.46 %. The developed SVM model was also tested in other areas where corn is known to
be present. Applying the SVM model to a different area still resulted to high classification accuracy. Shown in Figure
9 is the accuracy assessment of the test site with an overall accuracy of 91.52% with KIA of 82.94%.

Figure 8. Classified Corn Area using SVM parameters to a Test site
Figure 9. Accuracy Assessment of the Test site
4. CONCLUSION
High overall accuracies were obtained for the classification of corn and shrub in both the train (91.08%) and test site
(91.52%). With this, the researchers conclude that spectral signature correlated with Landsat data can indeed
complement other remotely sensed data like LiDAR. Specific band ratios derived from the spectral signature of corn,
and features like the Green Ratio and Enhanced Vegetation Index can prove to be reliable features in discriminating
corn from other vegetation species.
5. ACKNOWLEDGEMENT
We would like to thank the Department of Science and Technology for funding this research and for the guidance of
the Monitoring Team from the Philippine Council for Industry, Energy and Emerging Technology Research and
Development (PCIEERD-DOST) of DOST. The Caraga State University's Bachelor of Science in Geodetic
Engineering students namely: Amira Janine T. Magusara and Jared P. Culdora in helping us during the data collection.
6. REFERENCES
Blaschke, T., Johansen, K., & Tiede, D. (2011). Object-Based Image Analysis for Vegetation Mapping and
Monitoring. Advances in Environmental Remote Sensing: Sensors, 241-271.
Chang, C.-C., & Lin, C.-J. (2001). LIBSVM: A Library for Support Vector Machines. National Taiwan University,
Taipei, Taiwan.
Exelis. (n.d.). Retrieved from Broad Band Greeness, Enhanced Vegetation Index:
http://www.exelisvis.com/docs/broadbandgreenness.html

Japitana, M., Candare, R., Apdohan, A., Ramirez, C., Bermoy, M., Pondog, A., et al. (2014). Optimization of the
SVM Regularization Parameter C in Matlab for Developing Rulesets in Ecognition. International Symposium on
Remote Sensing, 530-533.
Mountrakis, G., Im, J., & Ogole, C. (2009). Suppport Vector Machines in Remote Sensing: A review. ISPRS Journal
of Photogrammetry and Remote Sensing, 247-259.
Navulur, K. (2007). Multispectral Image Analysis Using the Object-Oriented Paradigm. Boca Raton, FL, USA: CRC
Press.
Nidamanuri, R. R., & Bernd, Z. (2011). Use of field reflectance data for crop mapping using airborne hyperspectral
image. ISPRS Journal of Photgrammetry and Remote Sensing, 683-691.
Santillan, M. M., Japitana, M. V., Apdohan, A. G., & Amora, A. M. (2012). Discrimination of Sago Palm from other
Palm Species Based on In-situ Spectral Response Measurements. Asian Conference on Remote Sensing. Pattaya,
Thailand: Asian Association on Remote Sensing.