county, to age, and - eric · · 2013-10-24who di not desire "to wade" through the data...
TRANSCRIPT

DOCUMENT RESUME
ED 097 537 CE 002 308
AUTHOR Jordan, Jimmie L.TITLE An Assessment of Adult Basic Education in Shelby
County, Tennessee.INSTITUTION Shelby County Board of Education, Memphis, Tenn.PUB DATE . Dec 73NOTE 63p.
EDRS PRICE MF-$0.75 HC-$3.15 PLUS POSTAGEDESCRIPTORS *Adult Basic Education; Data Collection; Educational
Attitudes; Educational Research; *Program Attitudes;*Program Evaluation; Questionnaires; StudentAttitudes; Student Teacher Relationship; Surveys;Teacher Attitudes
IDENTIFIERS *Tennessee
ABSTRACTThis report of an exploratory study of Adult Basic
Education (ABE) gives a brief summary of background and methodologyand represents findings about students and teachers in Shelby County,Tennessee. For the students 41 findings are reported relLting to age,sex, race, marital status, years of schooling completed., employment,income, life style, reasons for enrollment, problems, and reactionsto the program. For the teachers 65 findings are reported relating toage, sex, race, education, teaching experience, experience with andreactions to the ABE program, and their feelings as to the areas inwhich the program was successful in helping the students. Problemsencountered in conducting the study made drawing conclusionsdifficult. Comments are offered with respect to several ways ofimproving the conduct of future studies; improving student-teacherrelationships; assistance for teachers, both preservice andon-the-job; a followup of dropouts; and vocational choices ofstudents. The results of the student and teacher questionnaires aretabulated as percentages in two appendixes to provide support for thestatements in the report. The questionnaires are also included.(SA)

AN ASSESSMENT OF ADULT
BASIC EDUCATION IN
SHELBY COUNTY, TENNESSEE
by
Jimmie L. Jordan
Supervisor of Adult Basic Education
Shelby County Schools
Memphis, Tennessee
Shelby County Board of Education
Memphis, Tennessee
December, 1973
,,,111TYF Y'r 7F .4F A, "1f IMF AL7F
N'ti TF
t, 6%, )4

FOREWORD
A decision was made late during the 1972-73 academic year to study various
facets of the Shelby County Adult Basic Education (ABE) Program. In a last minute
effort to gather data prior to the closing of classes, insufficient time was available to
give proper attention to the construction of suitable questionnaires and the controls
placed on their administration and return. Consequently, due to those as well as other
limitations, the results reported herein should be viewed as an exploratory study. That
is, instead of providing relatively concrete facts, the data should be viewed merely as
trends that might be. developing.
The main body of this report will consist of a summary and conclusions for those
who di not desire "to wade" through the data supporting the statements. For those
who iesire to examine the data, this information is presented in the Appendices. All
data are reported only in percentages for ease of comparison and readability. Formal
academic tables have been emitted for the shame reason. In short, this represents a
radical departure horn formal research reporting; however, it is felt that this decision
should aid in reading and comprehending the results, since this is written primarily as
an internal office report.
ii

ACKNOWLEDGEMENTS
Acknowledgement and appreciation are made to Mr. George H. Barnes,
Superintendent of Shelby County Schools, for his support and continuing interest in
Adult Basic Education in Shelby County.
The contributions of Mr. C. L. Wells, Assistant Superintendent for Special Services
for Shelby County Schools, are acknowledged. The status of Adult Basic Education in
Shelby County is a direct result of his commitments and untiring efforts.
The contributions of Dr. Marshall C. Perritt, Assistant Superintendent of
instruction, Shelby County Schools, are acknowledged. This evaluation of Adult Basic
Education in Shelby County was mule possible through his approval and support.
Acknowledgement is made to Mr. Blake Welch, Director of Adult Education,
Memphis City Schools,for his support and approval of this assessment of the Adult Basic
Education Program.
Special acknowledgement and appreciation are made to Dr. Donnie Dutton,
Professor of Adult Education, Memphis State University. He has served as consultant and
resource person for the improvement of Shelby County's Adult Education Program.
Without Dr. Dutton's assistance, this prograrn could not have been assessed due to the
limited amount of time that was available. Dr. Dutton's time and generosity has
contributed to making this program a success.
iii
TABLE OF CONTENTS
Seciion
SUMMARY AND CONCLUSIONSBackgroundMethodologyFindings Relative io StudentsFindings Relatiye to TeachersConclusions and Comments
APPENDIX IRESULTS OF ABE STUDENT QUESTIONNAIRE
Page
1
1
1
47
APPENDIX IIRESULTS OF ABE TEACHER QUESTIONNAIRE 24
APPENDIX IIIABE STUDENT QUESTIONNAIRE 42
APPENDIX IVABE TEACHER QUESTIONNAIRE 51
iv

SUMMARY AND CONCLUSIONS
Background
The purpose of this research was to study the participants and teachers in theShelby County Adult Basic Education Program to determine certain personal andeducational characteristics that might have potential implications for programadministrators.
Methodology
Participant-wise, all those adults attending ABE classes in the Shelby Countyprogram on the dates of May 14-31, 1973, were administered questionnaires by theirrespective teachers. Due to various factors such As lack of attendance on the datesadministered, incomplete questionnaires, and data retrieval and storage problems, only125 questionnaires were usable.
For the teacher portion of the study, all nineteen teachers in the programserved as the study population.
Findings Relative to Students
Relative to adult basic education students, generally speaking:
1. No single age group was predominant; however, the majority were under fortyyear of age.
2. Males were about as likely to enroll as females.
5. Blacks were slightly more inclined to enroll than whites.
4. There was little difference between the tendency to enroll for black and whitemales; however, black females were more inclined to do so than were whitefemales.
5. Black f. males wee Ago more inclined to enroll than black males, with littledifference between white males and white females.
6. The majority were married; however, a sizeable minority were single.
7. 'I ne majority indicated that they had completed between nine and twelve grades(4f public school prior to enrolling in ABE.
1

8. The majority were not employed at the time of the study. Those that wereemployed were working at menial, unskilled jobs. Most had aspirations for askilled or semi-skilled job, with few aspiring for a professional occupation.
9. The income of the participants was low, with a sizeable number in the povertycategory.
10. Most watched television, but no predominant viewing pattern emerged as far asprograms or time of viewing, except most watched the 10 p.m. news on one ofthe three stationsChannel 13 received almost half of the responses.
11. Most listened to the radio, but the stations they listened to were many andvaried; however, WDIA, WLOK, and WIIBQ seemed to be the favorites. The timeof day they listened was scattered throughout the spectrum; however, 6-8 a.m.seemed to be the favorite time; yet, only 41.6 percent listened at that particulartime.
12. Of those that attended, friends or neighbors and teachers or principals seem to bethe major sources from whom they learned about the ABE program. Employers,radio, television, and newspapers seem to have failed "to reach" those peopleif,in fact, these media have been used by administrative personnel.
13. Travel to and from classes did not appear to bp a major i)roblem by thoseparticipating in the study.
14. The major reasons these people enrolled were varied; however, the three majorreasons, listed in order of importance, were to improve myself, be able to dosomething I could not do very well, and to get a job or a better job.
15. Lets than one percent indicated that their spouse disapproved of theirparticipation in the ABE program.
16. The major thing the students wanted to learn upon enrolling in the class was math,with language and reading as second and third in importance.
17. Most were satisfied with their learning progress since enrolling.
18. For those having children, the spouse or relatives appeared to serve as babysitterswhile the participants attended chases.
19. Most of the participants were not receiving financial assistance from thegovernment.
20. The major personal problem encountered by the participants was money. Drinkingand drugs were listed by less than four percent of the participants respectively.
21. As far as consulting help relative to problems, they turned primarily to relativesand friends. Sources of free professional assistance such as public health personneland cooperative extension agents were used rarely.
2
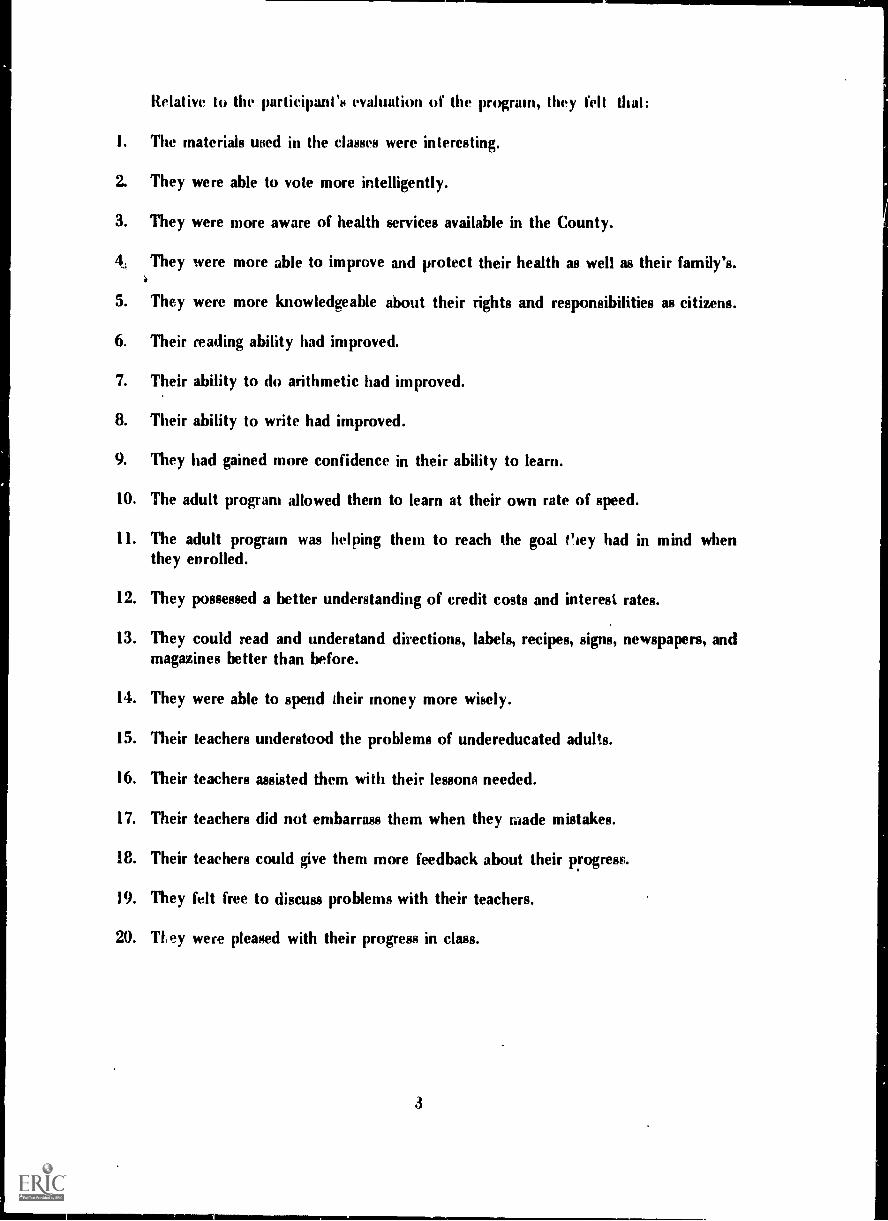
Relative to the participant's evaluation of the program, they felt that:
1. The materials used in the classes were interesting.
2. They were able to vote more intelligently.
3. They were more aware of health services available in the County.
4, They were more able to improve and protect their health as well as their family's.
5. They were more knowledgeable about their rights and responsibilities as citizens.
6. Their reading ability had improved.
7. Their ability to do arithmetic had improved.
8. Their ability to write had improved.
9. They had gained more confidence in their ability to learn.
10. The adult program allowed them to learn at their own rate of speed.
11. The adult program was helping them to reach the goal trey had in mind whenthey enrolled.
12. They possessed a better understanding of credit costs and interest rates.
13. They could read and understand directions, labels, recipes, signs, newspapers, andmagazines better than before.
14. They were able to spend their money more wisely.
15. Their teachers understood the problems of undereducated adults.
16. Their teachers assisted them with their lessons needed.
17. Their teachers did not embarrass them when they made mistakes.
18. Their teachers could give them more feedback about their progress.
19. They felt free to discuss problems with their teachers.
20. ney were pleased with their progress in class.
3

k51 .C.U.E1 AVIIILR2LE
Findings Relative to Teachers
Relative to adult basic education teachers, generally speaking:
I. They ranged in age from less than thirty to fifty, with no single age grouppredominating.
2. Most of them were male.
3. The majority were white, but there was not a greet deal of difference.
4. The majority possessed a master's degree.
5. The majority possessed more than one year's experience m adult basic education.
6. The majority devoted thirty minutes or less to lesson preparation for each class.
7. Almost half of the teachers received no pre-service training prior to teaching theirfirst class, while the majority felt that they should have received a minimum offive hours of training.
8. Most of the teachers gave their local ABE administration a high rating relative totheir support of ABE, belief in ABE, and knowledge of ABE.
9. Most teachers felt that the major reasons for non-enrollment by undereducatedadults were unawareness of these people of the value of ABE, lack of interest,lack of transportation, and lack of child care.
10. Most teachers felt that their local ABE administration provided considerableassistance in guidance and counseling, ABE materials, program planning, teachingmethods, recruitment, dropouts, and professional development. Almost half of theteachers felt that too little assistance was given relative to audio visual resources.
11. When asked to indicate to what extent they needed additional help from theirlocal ABE administration, they listed guidance and counseling, ABE materials,teaching methods, recruitment, dropouts, audio visual resources, and professionaldevelopment.
12. Most teachers indicated they seldom sought assistance from certain agencies tohelp their ABE students. These agencies were Employment Security, Publichealth. MDTA Welfare, Rehabilitation, Religion, Law, Military, Civic Clubs,Business and Industry, and Agricultural Extension.
13. Most teachers sought assistance with ABE problems from their supervisors. Theonly other major resources used were (Alm teachers and guidance counselors.
4
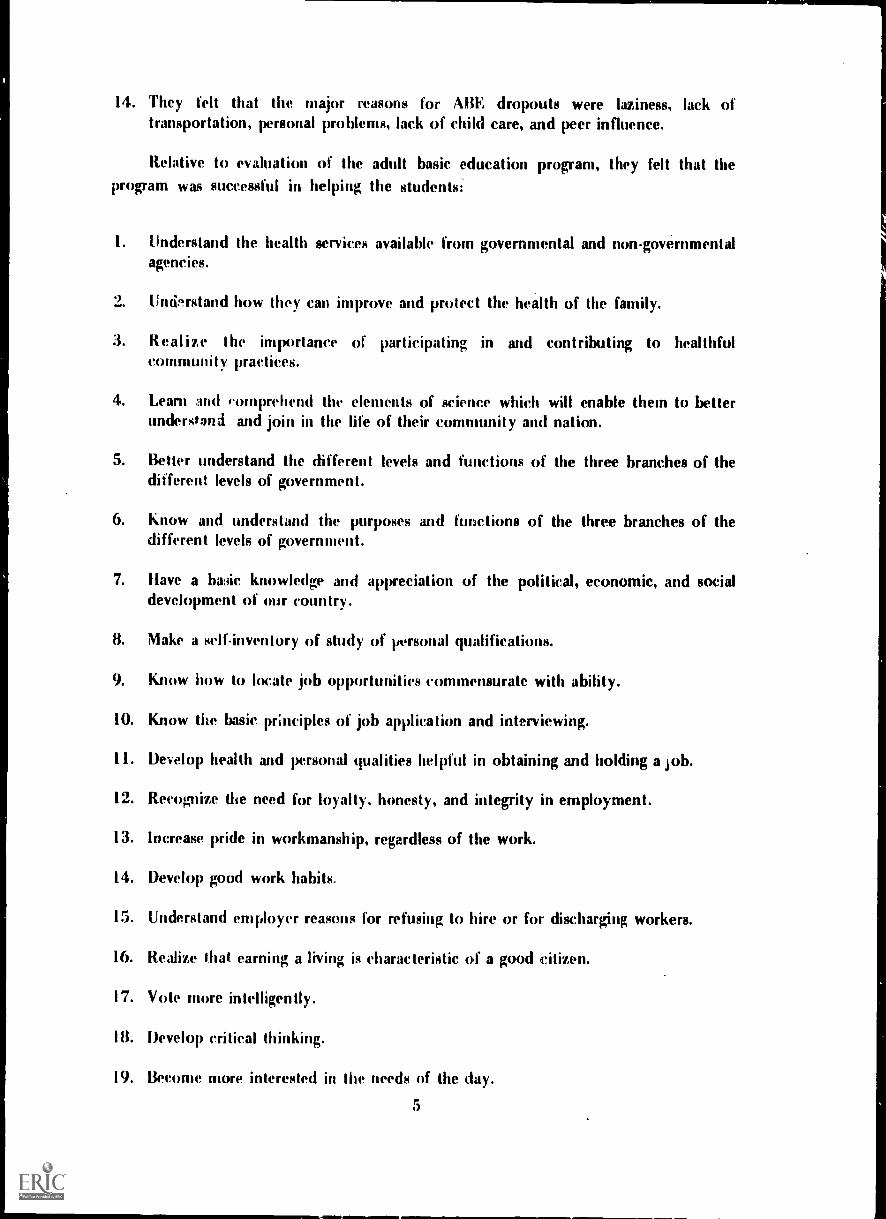
14. They felt that the major reasons for ABE dropouts were laziness, lack oftransportation, personal problems, lack of child care, and peer influence.
Relative to evaluation of the adult basic education program, they felt that theprogram was successful in helping the students:
1. Understand the health services available from governmental and non-governmentalagencies.
UndPrstand how they can improve and protect the health of the family.
3. Realize the importance of participating in and contributing to healthfulcommunity practices.
4. Learn and comprehend the elements of science which will enable them to betterunderstand and join in the life of their community and nation.
5. Better understand the different levels and functions of the three branches of thedifferent levels of government.
6. Know and understand the purposes and functions of the three branches of thedifferent levels of government.
7. Have a ba3ic knowledge and appreciation of the political, economic, and socialdevelopment of our country.
8. Make a self-inventory of study of personal qualifications.
9. Know how to locate job opportunities commensurate with ability.
10. Know the basic principles of job application and interviewing.
11. Develop health and personal qualities helpful in obtaining and holding a job.
12. Recognize the need for loyalty, honesty, and integrity in employment.
13. Increase pride in workmanship, regardless of the work.
14. Develop good work habits.
15. Understand employer reasons for refusing to hire or for discharging workers.
16. Realize that earning a living is characteristic of a good citizen.
17. Vote more intelligently.
18. Develop critical thinking.
19. Become more interested in the needs of the day.
5

20. Better use leisure lime.
21. Recognize desirability of family unity.
22. Realize importance of cooperation with and consideration of other people ineveryday living.
23. Improve and protect the health of themselves and their families.
24. Promote adherence to the democratic process.
25. Understand the responsibilities which accompany the rights of a citizen.
26. Acquire and improve the skills of addition, subtraction, multiplication, anddivision.
27. Develop naderstanding of fractions, decimals, percent and percentage.
28. Develop mathematical understanding of interest, budgeting, purchasing, andpurchasing on time.
29. Apply arithmetic to ordinary daily activities.
30. Understand wages, income, and expenditures.
31. Enunciate and pronunciate more clearly.
32. Improve their writing.
33. Improve their listening skills.
34. improve their composition.
35. Improve their word usage.
36. Improve their speaking ability.
37. Improve their reading comprehension.
38. Improve their ward recognition.
39. Improve their reading vocabulary.
40. Improve their reading to increase knowledge.
41. Improve their ability to locate information.
42. Increase their recreational reading.
43. Develop the skills, attitudes, and knowledge rewired for existing or emergingjobs.
6

44. Apply arithmetic knowledge to shopping and spending money.
45. Increase motivation for joh promotions or better jobs.
46. Realize the importance and was of budgeting income.
47. Better understand and participate more in the life of the community.
48. Better comprehend and engage in political activities.
49. Understand credit costs and interest rates.
50. Read and understand labels, recipes, signs, newNpapers, and simple directions.
51. Develop an appreciation for improved hoptes and surroundings.
Conchisiou.,-, and Comments
With the problems encourit: iv conducting the study, it is difficult to drawmany conclusions; however, th,, following seem appropriate:
I. The study was not ,i,aducted properly. Future efforts in this regard should beundertaken when insufficient time does not limit the construction, pre-testing,and administration of the questionnaires. A better data storage and retrievalsystem is needed in order to examine accurate facts about the program. Also, thequestionnaires were teacher administered with no way of measuring the influencethat may have been exerted on the participants to make the "teacher look good."
2. The penal population should lie studied as a distinct group, and then one mightpossibly desire to compare them with other kinds of participants.
3. The teachers and students should have been given the same evaluation statementsso that perceptual comparisons of program effectiveness could be made.
4. Thu television viewing and radio listening habits of the participants wereexamined, with no predomMant trend emerging, except for the 10 p.m. News.One should be cognizant of the fact that the study was conducted at at timewhen reruns filled the television screens which may have affected the results.
Maybe an even more important question for study is the television and radiohabits of those people who need the instruction but do not enroll. Comparedwith the total need Ihat exists, the percentage of enrollment is very small. Oneneeds to ascertain ways of reaching this "large" group of people. One might evenconsider doing somethinu so ridiculous as to locate some of these non-enrolleesand simply ask them what it would take to get them in the classroom.
5. 'Transportation did not appear to he a major problem of those who attend;however, no measure is available of the effect this might have on nonenrollees.
7

gEST CC
6. (hie might cctictinte that apprval is necessary for participaticm in theprogram 01111 .9 Ili a ilVIA 1 ;11111` 16111 (1.18apprOVill.
7. The sliidel,( iesponses lack of use of much free professional help suchas public health and al and home economics extension personnel. Theleachers also did 11(11 11 Me 1111` 111CM1` ;111(1 (1111e1.
Zagenes personnel to a,4151 thrt, s(11(1('Ilk. 110NRibI1 , some attention might need Iiibe given 10 this III (11111re itoien Ms.:S1011S.
8. The perceptions of 01, -Iii!out indicated that, generally speaking, the AREprogram was succe,sfol; iii,w,.11 final conclusion in this regard should not bedrown without ',mowing the asei.igi. ,ain. This implies a uniform, systematicesill"1 and e\it level SC00' I.or each suident. Steps should be taken to assure theavailability of such data in the future.
9. One hundred percent of I he ..1.14. snider' ts indicated that they were allowed toteam at their own rate of speed. The teachers should be commended for this.
10. SOilie prObillth should be made relative to instruction on health,rights and responsibilities. writing. and the spending of money. It does not appearto be a serious problem, but Softie concern should be shown.
1I. While seven percent is a Nei-1 small number statistically, it represents too 110111 N.*
people to he embarrassed teachers when they make mistakes. One can onlywonder as to how man% others may have become dropouts because of thiscondithm. "Word of mouth" tends to be the "best or worst" public relationsdevice.
12. Students should feel free to discuss problems with their teachers. Most did;however, 6,5 peret did not -again a AMA number, but too many.
13. S nu: ents n eed more feedback Anna their progress. They need constantinformation as to how well they are performing, and they need as much positivestroking as possible.
14. The teachers (lid not reueiNe adequate pre.service instruction before teaching theirfirst All3F, class. Some consideration should he given to correcting this, either withacademic courses or adequate pre-service, non-credit sessions. One expects theteachers of day school to he profeAsionally prepared for their duties. Why shouldIlse same not he expected of MO, teachers?
13. There were a few subject areas where the teachers indicated that they could useadditional help such at guidance and counseling, dropouts, and the like. Thesecould be given attention in workshops.
16. The leachers had various opinions as to why they felt that students dropped out.Maybe, one should conduct a follow-op study of the dropouts and obtain theirreasons for leaving the edlicati(mal scene. The results might or might not bedifferent from will teacher.; "think- they dropout.
8

17. With 62.3 percent of the participants indicating that they had completed betweennine and twelve grades, there appears to be a wide discrepancy between gradecompletion level and grade functional level. It was hoped that actual entry levelor functional level in the ABE program could have been compared with gradecompletion level; however, insufficient data was available for this purpose.
18. When asked if they could have airy job they wanted and were trained to do thisjob, sixty-two different positions were listed. Less than five percent of these werein professional occupations, with the remainder being about equally dividedbetween semi-skilled and skilled jobs. This might indicate a realistic view of whattheir potential probable is, rather than viewing things through "rose coloredglasses."
9

APPENDIX I
RESULTS OF ABE STUDENT QUESTIONNAIRE
AGE
The age distribution of the ABE participants was as follows:
Under 20 = 22.5 percent20 -29 = 24.2 percent30-39 = 18.4 percent40-49 = 17.3 percent50-59 = 9.6 percent60-69 = 6.9 percent70-79 = 1.1 percent
100.0
SEX
The sex distribution of the ABE participants was as follows:
Male = 48.4 percentFemale = 51.6 percent
100.0
RACE
The race distribution of the ABE participants was as follows:
Black = 55.8 percentWhite = 44.2 percent
100.0
RACE AND SEX
If one were to hold the race of the ABE participants constant and examine the sexdistribution, it would be divided as follows:
Black malesWhite males
10
= 47.9 percent= 52.1 percent
100.0

Black femalesWhite females
Black malesBlack females
White malesWhite females
MARITAL STATUS
= 60.2 percent= 39.8 percent
100.0
= 30.9 percent= 69.1 percent
100.0
= 42.4 percent= AM percent
100.0
The distribution of the ABE participants relative to marital status was as follows:
Married = 54.0 percentSingle = 30.6 percentSeparated = 7.3 percentDivorced = 5.7 percentWidowed = 2.4 percent
100.0
LAST GRADE COMPLETED
The last public school grade completed by the. ABE participants prior to enrolling inthe program was as follows:
Grades 1.3Grades 4-6Grades 7-8Grades 9-12
EMPLOYMENT
= 1.7 percent= 10.2 percent= 25.6 percent= 62.5 percent100.0
When asked if they were presently employed, 43.0 percent indicated yes, and 57.0percent said no.
Those that were employed were asked to list the job they held. Thirty-five differentpositions were listed, and they were all menial, unskilled jobs. They included suchthings as maid, cook, cafeteria worker, gas attendant, wood work, baby sitter, andlaborer, among others.
When asked if they could have any job that they wanted and were trained to do thisjob, 62 different positions were listed. Less than 5 percent of those were inprofessional occupations, with the remainder being about equally divided betweensemi-skilled and skilled jobs.
11

YEARLY INCOME
The income distribution of the ABE participants was as follows:
Less than $1,000 = 36.1 percent$1,000 $1,999 = 12.8 percent$2,000 $2,999 = 11.6 percent$3,000 $3,999 = 11.6 percent$4,000 $4,999 = 7.0 percent$5,000 or more = 20.9 percent
100.0
RECRUITMENT INR,RMATION
The participants were asked vai ious questions as to their television and radio habits, aswell as other information of potential recruiting value. This information follows.
Television Program ViewedWhen asked to indicate three television r.ograms that they normally watched, 70different programs were listed. Individually, the programs most often watched were asfollows:
News
Sanford and Son
Kung Fu
Movies
Flip Wilson
1 Love Lucy
Marcus We lby
12
Yes = 72.5 percentNo = 27.5 percent
100.0
Yes = 12.8 percentNo = 87.2 percent
100.0
Yes = 11.2 percentNo = 88.8 percent
100.0
Yes = 9.6 percentNo = 90.4 percent
100.0
Yes = 7.2 percentNo = 92.8 percent
100.0
Yes = 7.2 percentNo = 92.8 percent
100.0
Yes = 7.2 percentNo = 92.8 percent
100.0
Bill Cosby
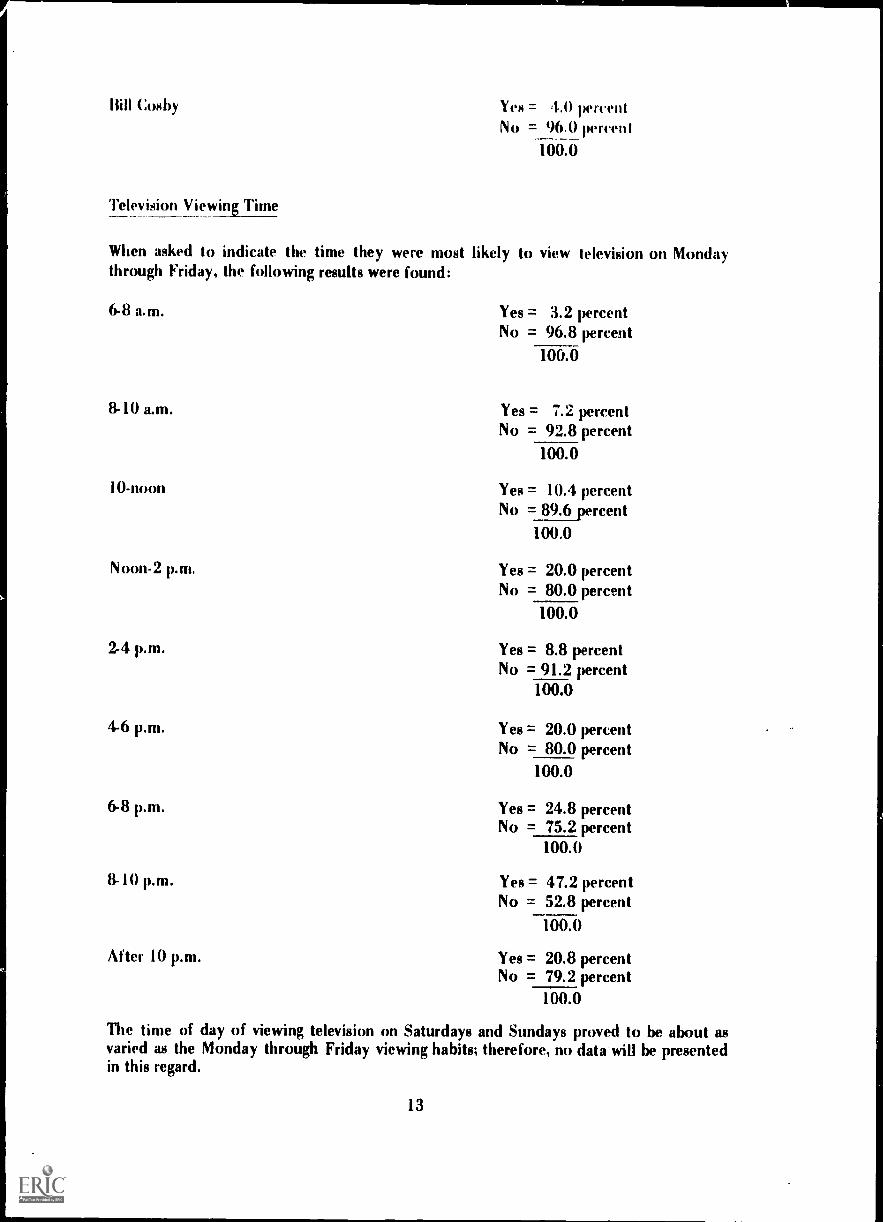
Television Viewing Time
Yes = 4.0 percentNo = 96.0 percent
100.0
When asked to indicate the time they were most likely to view television on Mondaythrough Friday, the following results were found:
6-8 a.m. Yes = 3.2 percentNo = 96.8 percent
100.0
8-10 a.m. Yes = 7.2 percentNo = 92.8 percent
10-noon
Noon-2 p.m.
2-4 p.m.
4-6 p.m.
6-8 p.m.
8-10 p.m.
After 10 p.m.
100.0
Yes = 10.4 percentNo = 89.6 percent
100.0
Yes = 20.0 percentNo = 80.0 percent
100.0
Yes = 8.8 percentNo = 91.2 percent
100.0
Yes = 20.0 percentNo = 80.0 percent
100.0
Yes = 24.8 percentNo = 75.2 percent
100.0
Yes = 47.2 percentNo = 52.8 percent
100.0
Yes = 20.8 percentNo = 79.2 percent
100.0
The time of day of viewing television on Saturdays and Sundays proved to be about asvaried as the Monday through Friday viewing habits; therefore, no data will be presentedin this regard.
13

When asked if they generally watched the 10 p.m. news on television, 72.5 percentindicated yes.
When asked which channel they generally viewed the news on, the following results werefound:
Channel 3 = 49.4 percentChannel 3 = 32.6 percentChannel 5 = 18.0 percent
100.0
RADIO STATIONS TO WHICH THEY LISTENED
When asked to indicate the radio stations to which they normally listened, the responseswere divided among 18 radio stations as follows:
Yes = 49.6 percentNo = 50.4 percent
100.0
Yes = 44.0 percentNo = 56.0 percent
100.0
Yes = 36.0 percentNo = 64.0 percent
l OA
Yes = 21.6 percentNo = 78.4 percent
100.0
Yes = 16.8 percentNo = 83.2 percent
100.0
Yes = 16.8 percentNo = 83.2 percent
100.0
Yes = 16.0 percentNo = 84.0 percent
100.0
Yes = 8.8 percentNo = 91.2 percent
100.0
Yes = 6.4 percentNo = 93.6 percent
100.0

KWAM
KWEM
FM 106
WHER
WMQM
WELT
FM 105
WILAC
WHAM
Yes = 4.0 percentNo = 96.0 percent
100.0
Yes = 3.2 percentNo = 96.8 percent
100.0
Yes = 2.4 percentNo = 97.6 percent
100.0
Yes = 1.6 percentNo = 98.4 percent
100.0
Yes = 1.6 percentNo = 98.4 percent
100.0
Yes = 1.6 percentNo = 98.4 percent
100.0
Yes = 1.6 percentNo = 98.4 percent
100.0
Yes = 1.6 percentNo = 98.4 percent
100.0
Yes = 1.6 percentNo = 98.4 percent
100.0
When asked to indicate the times they were most likely to listen to the radio, thefollowing results were found:
6-8 a.m.
8-10 %M.
10-noon
15
Yes = 41.6 percentNo = 58.4 percent
100.0
Yes = 16.8 percentNo = 83.2 percent
TOTO
Yes = 8.0 percentNo = 92.0 percent
100.0

Noon-2 p.m.
2-4 p.m.
4-6 p.m.
6-8 p.m.
Yes = 11.2 percentNo = 88.8 percent
100.0
Yes = 17.6 percentNo = 82.4 percent
100.0
Yes = 24.8 percentNo = 75.2 percent
100.0
Yes = 16.8 percentNo = 83.2 percent
100.0
3-10 p.m. Yes = 14.4 percentNo = 85.6 percent
100.0
After 10 p.m. Yes = 16.8 percentNo = 83.2 percent
100.0
All day
SOURCES LEARNED ABOUT ABE
Yes = 1.6 percentNo = 98.4 percent
100.0
When asked to indicate the sources from which they heard about ABE classes, thefollowing results were found:
Friends or neighbors Yen 39.2 percentNo = 60.8 percent
100.0
Teacher or principal Yes = 32.8 percentNo = 67.2 percent
100.0
Relatives Yes = 10.4 percentNo = 89.6 percent
100.0
Employer Yes = 8.8 percentNo = 91.2 percent
100.0
16

Newspaper
Radio
Television
Church
Yes = 6.4 percentNo = 93.6 percent
100.0
Yes = 5.6 percentNo = 94.4 percent
100.0
Yes = 4.8 percentNo = 95.2 percent
100.0
Yes = 4.0 percentNo = 96.0 percent
100.0
CLASS TRANSPORTATION
The participants were asked various questions pertaining to class transportation. Theresults follow.
Distance Traveled
When asked to indicate the distance traveled to class, the participants responded asfollows:
Less than I mile1-4.9 miles5-9.9 miles10 or more miles
= 51.8 percent= 34.5 percent= 8.2 percent= 5.5 percent
1 .
Method of Travel
When asked how they usually traveled to class, the participants res' 3nded as follows:
Own car = 39.8 percentWalked = 32.7 percentRode with others = 26...1 percentBus or taxi = 1.0 percent
100.0
Transportation Problems
'When asked how often they missei class due to transportation problems, the participantsresponded as follows:
17

Never = 60.2 percentSeldom = 23.0 percentSome = 11.5 percentA great deal = 5.3 percent
100.0
REASONS FOR ENROLLING
When asked to indicate the main reasons for enrolling in class, the participants respondedas follows:
Improve myself
Be able to do somethingI could not do very well
Get a job or better job
Meet new friends
Impress my friends
Wanted something to do
Get out of the house
Yes = 52.8 percentNo = 47.2 percent
100.0
Yes = 37.6 percentNo = 62.4 percent
100.0
Yes = 28.0 pelcentNo = 72.0 percent
100.0
Yes = 7.2 percentNo = 92.8 percent
100.0
Yes = 4.0 percentNo = 96.0 percent
100.0
Yes = 2.4 percentNo = 97.6 percent
100.0
Yes = 2.4 percentNo = 97.6 percent
100.0
When asked to indicate the most important reason for enrolling, the participantsresponded as follows:
Improve myselfGet a job or better jobWanted something to doTo be able to do something
I could not do very well
18
= 48.7 percent= 27.0 percent= 13.5 percent
= 10.8 percent100.0

APPROVAL OF SPOUSE
When asked how their wife (girlfriend) or husband (boyfriend) felt about them taking theclass, the participants responded as follows:
Pleased = 84.9 percentDoes not care = 14.2 percentNot pleased = .9 percent
100.0
MAJOR LEARNING DESIRE
When asked what they want to learn most of all when they first enrolled in class, theparticipants responded as follows:
Math = 36.5 percentLangli age = 19.8 percentReading = 15.1 percentGED = 10.3 percentSpelling = 4.0 percentScience = 2.4 percentTyping = 1.6 percentWriting = 1.6 percentGeography = .8 percentVarious other statements = 7.9 percent
100.0
PROGRESS SATISFACTION
When asked if they were satisfied with their progress toward learning, 89.7 percentindicated yes, while 10.3 percent steed no.
CHILD CARE
When asked who cared for their children while they attended school, the participantsresponded as follows:
Do not Ime children = 37.9 percentWife, husband, girlfriend = 41.0 percentRelatives = 16.8 percentNeigithors or friends = 3.2 percentNursery School = percent
100.0
19
FINANCIAL. ASSISTANCE
When asked if they received money from any government agencies, the participantsresponded as follows:
None = 83.0 percentWelfare of AID = 8.0 percentSocial security = 6.3 percentUnemployment = 2.7 percent
PERSONAL OR FAMILY PROBLEMS
When asked to indicate the personal or family problems that bothered them quite often,the participants responded as follows:
Money Yes = 49.6 percentNo = 50.4 percent
Family
Sickness
Work
Housing
Drinking
Drugs
20
100.0
Yes = 28.0 percentNo = 72.0 percent
100.0
Yes = 19.2 percentNo = 80.8 percent
100.0
Yes = 10.4 percentNo = 89.6 percent
100.0
Yes = 8.8 percentNo = 91.2 percent
100.0
Yes = 1.6 percentNo = 98.4 percent
100.0
Yes = 1.6 percentNo = 98.4 percent
100.0

When asked who they had consulted about their problems in the past three years, theparticipants responded as follows:
Relatives
Friend
Doctor
Lawyer
School teacher or principal
Welfare worker
Preacher
Banker, money lender
Police
Public health nurse
Politicians
21
Yes = 45.6 percentNo = 54.4 percent
100.0
Yes = 40.0 percentNo = 60.0 percent
100.0
Yes = 24.0 percentNo = 76.0 percent
PO.41
Yes = 15.2 percentNo = 84.8 percent
100.0
Yes = 11.2 percentNo = 88.8 percent
100.0
Yes = 11.2 percentNo = 88.8 percent
100.0
Yes = 9.6 percentNo = 90.4 percent
100.0
Yes = 10.4 percentNo = 89.6 percent
100.0
Yes = 4.8 percentNo = 95.2 percent
100.0
Yes = 1.6 percentNo = 98.4 percent
100.0
Yes = 1.6 percentNo = 98.4 percent

Palmist or fortune teller
Extension agent
Yes = 1.6 percentNo = 98.4 percent
100.0
Yes = 0.8 percentNo = 99.2 percent
100.0
PROGRAM EVALUATION
The participants were given twenty statements relative to the ABE program and wereasked to indicate their agreement or disagreement with these. Their responses follows:
1. Materials provided for me in thisclass are interesting to adults.
2. The adult program has helped me to beable to vote more intelligently.
3. The adult prog :am has helped me tobecome aware of health servicesavailable in the county.
4. The adult program has shown mehow I can improve and protect thehealth of myself and my family.
5. The adult program has helped me tounderstand my rights and responsi-bilities as an individual citizen.
6. The adult program has helped meto improve my reading ability.
7. The adult program has helped meto improve my arithmetic ability.
8. The adult program has helped meto improve my ability to write.
9. The adult program has given memore confidence in my ability tolearn.
22
Agree = 93.2 percentDisagree = 6.8 percent
100.0
Agree = 74.3 percentDisagree = 25.7 percent
100.0
Agree = 60.8 percentDisagree = 39.2 percent
100.0
Agree = 74.3 percentDisagree = 25.7 percent
100.0
Agree = 84.1 percentDisagree = 15.9 percent
100.0
Agree = 96.6 percentDisagree = 3.4 percent
100.0
Agree = 98.3 percentDisagree = 1.7 percent
100.0
Agree = 86.4 percentDisagree = 13.6 percent
100.0
Agree = 93.2 percentDisagree = 6.8 percent
100.0

10. The adult program allows me tolean, at my own rate of speed.
11. The adult program is helping me toreach the goal I had in mind whenI enrolled.
12. The adult program has helped me tobetter understand credit costs andinterest rates.
13. The adult program has helped me to readand understand directions, labels, recipes,signs, newspapers, and magazines.
14. The adult program has helped me inspending my money more wisely.
15. My teacher understands the problems ofundereducated adults.
16. My teacher readily helps me with mylessons when I need help.
17. My teacher sometimes embarrassesstudents when they make mistakes.
18. My teacher should talk more oftenwith me about my progress.
19. 1 feel free to discuss with myteachers any problems that interferewith my attending class or that interferewith my learning in class.
20. In general, I am pleased with my progressin this adult class.
23
Agree =100.0 percentDisagree = 0.0 percent
100.0
Agree = 94.7 percentDisagree = 5.3 percent
100.0
Agree = 86.4 percentDisagree = 13.6 percent
100.0
Agree = 93.2 percentDisagree = 6.8 percent
100,0
Agree = 75.5 percentDisagree = 24.5 percent
100.0
Agree = 98.2 percentDisagree = 1.8 percent
100.0
Agree = 96.6 percentDisagree = 3.4 percent
100.0
Agree = 7.0 percentDisagree =_93.0 percent
Too.o
Agree = 52.2 percentDisagree = 47.8 percent
100.0
Agree = 93.5 percentDisagree = 6.5 percent
100.0
Agree = 95.7 percent= 4.3 percent
100.0

APPENDIX 11
RES U ITS OF TEACHER QUESTIONNAIRE
AGE
The age distribution of the teachers in the ABE program was as follows:
Less than 30 = 26.4 percent30-39 = 36.8 percent40-49 = 36.8 percent50 and over . = 0.0 percent
100.0
SEX
The sex distribution of the teachers in the ABE program was as follows:
Male = 70.5 percentFemale = 29.5 percent
100.0
RACE
The race distribution of the teachers in the ABE program was as follows:
White = 55.6 percentBlack = 44.4 percent
100.0
EDUCATIONAL BACKGROUND
The educational background of the teachers in the ABE program was as follows:
Less than master'sMaster's or more
24
= 38.9 percent= 61.1 percent
100.0
YEARS EXPERIENCE IN ABE
The distribution according to years of experience in ABE was as follows:
less than I
1-3
More than
PLANNING TIME
= 21.1 percent= 42.1 percent= 36.8 percent
100.0
Whon asked as to the amount of time they generally devoted to lessonpuparation for each ABE class, the distribution was as follows:
30 minutes or less31-60 minutesmore than 60 minutes
PRE-SERVICE TRAINING
= 52.6 percent= 36.8 percent= 10.6 percent
100.0
When asked to indicate the amount of training they received prior to teachingtheir first class., the results were as follows:
None = 47.4 percent1-4 hours = 21.1 percent5 or more = 31.5 percent
100.0
When asked to indicate the minimum amount of training that they felt a newABE teacher should receive prior to teaching his or her first class, the resultswere as follows:
None = 16.6 percent1-4 hours = 27.8 percent5 or more hours = 55.6 percent
100.0
25

RATING OF ABE ADMINISTRATION
When asked to rate their local ABE administration on support of ABE, belief inABE, and knowledge of ABE, the results were as follows:
Support of ABE
Strong = 84.2 percentModerate = 15.8 percentWeak = 0.0 percent
100.0
Belief in ABE
Strong = 94.4 percentModerate = 5.6 percentWeak = 0.0 percent
100.0
Knowledge of ABE
Strong = 88.9 percentModerate = 11.1 percentWeak =- 0.0 percent
100.0fr
26

REASONS FOR NON-ENROLLMENT
When asked to indicate why they felt eligible ABE participants did not enroll inclasses, the results were as follows:
I. Unawareness of these people of valueof ABE.
Yes = 52.6 percentNo = 47.4 percent
100.0
2. Lack of interest by th.. people. Yes = 52.6 percentNo = 47.4 percent
100.0
3. Lack of transportation. Yes = 47.4 percentNo = 52.6 percent
100.0
4. Lack of child care. Yes = 47.4 percentNo = 52.6 percent
100.0
5. Failure of ABE program to meet Yes = 26.3 percenttheir needs. No = 73.7 percent
100.0
6. Unawareness by these people of value Yes = 26.3 percentof ABE programs. No = 73.7 percent
100.0
7. Conflict with class time. Yes = 15.8 percentNo = 84-2 percent
100.0
8. Lack of funds. Yes = 15.8 percentNo = 84.2 percent
100.0
9. Influence of friends and neighbors. Yes = 15.8 percentNo = 84.2 percent
100.0
10. Influence of spouse or family. Yes = 10.5 percentNo = 89.5 percent
100.0
11. Lack of interest by ABE administration. Yes = 5.3 percentNo = percent_94,7
100.0
12. Unsatisfactory location of classes. Yes = 0.0 percentNo = 100.0 percent
100.0
27

ADMINISTRATIVE ASSISTANCE
When asked to indicate the amount of assistance they received from ABEadministrative personnel in various areas, the teachers responded as follows:
Guidance and Counseling
Great = 31.6 percentModerate = 63.1 percentLittle = 5.3 percentNone 7 0.0 percent
100.0
ABE Materials
Great = 52.6 percentModerate = 42.1 percentLittle = 5.3 percentNone 100.0
Program Planning
Great = 21.1 percentModerate = 52.6 percentLittle = 26.3 percentNone = 0.0 percent
100.0Teaching Methods
Great = 21.1 percentModerate = 52.6 percentLittle = 26.3 percentNone = 0.0 percent
100.0
Recruitment
Great 22.2 percentModerate = 55.6 percentLittle = 22.2 percentNone = 0.0 percent
100.0
28

Dropouts
Great = 15.8 percentModerate = 47.4 percentLittle = 26.3 percentNone = 10.5 percent
gikb
Audio Visual Resources
Great = 26.3 percentModerate = 26.3 percentLittle = 42.1 percentNone = 5.3 percent
MbProfessional Development
Great = 36.8 percentModerate = 52.6 percentLittle = 10.6 percentNone = 0.0 percent
1-60
ADMINISTRATIVE ASSISTANCE NEEDED
When asked to indicate to what extent they need additional help from their local ABEadministrators, the teachers responded as follows:
Guidance and Counseling
Great = 0.0 percentModerate = 47.1 percentLittle = 23.5 percentNone = 29.4 percent
fiRO
ABE Materials
Great = 5.6 percentModerate = 50.0 percentLittle = 22.2 percentNone = 22.2 percent
100.0
29

Program Planning
Great =Moderate =Little =None =
Teaching Methods
Great =Moderate =Little =None =
Recruitment
Great =Moderate =little =None =
5.9 percent23.5 percent47.1 percent23.5 percent
1110:0-
0.0 percent42.1 percent36.8 percent21.1 percent
100.0
38.9 percent22.2 perce it22.2 percent16.7 percent
100.0
Dropouts
Great = 11.8 percentModerate = 35.3 percentLittle = 23.5 percentNone = 29.4 percent
100.0
Audio-Visual Resources
Great = 5.9 percentModerate = 35.3 r..ercentLittle = 35.3 percentNone = 23.5 crcent
100.0
Professional Development
Great = 0.0 percentModerate = 55.6 percentLittle = 27.8 percentNone = 16.6 percent
100.0
30

AGENCY REFERRALS
When asked to indicate the extent to which they used the services of various agenciesto help their ABE students, the teachers responded as follows:
Employment Security
Often = 0.0 percentSometimes = 26.3 percentSeldom = 21.1 percentNot used = 52.6 percent
100.0
Public Health
Often = 5.6 percentSometimes = 16.7 percentSeldom = 22.2 percentNot used = 55.5 percent
100.0
MDTA
Often = 11.8 percentSometimes = 23.5 percentSeldom = 17.6 percentNot used = 47.1 percent
100.0
Welfare
Often = 5.6 percentSometimes = 11.1 percentSeldom = 22.2 percentNot used = 61.1 percent
100.0
Rehabilitation
Often . = 10.0 percentSometimes = 5.0 percentSeldom = 20.0 percentNot used = 65.0 percent
100.0
31

Religious
Often = 11.8 percentSometimes = 17.6 percentSeldom = 5.9 percentNot used = 64.7 percent
100.0
Law
Often = 5.6 percentSometimes = 16.6 percentSeldom = 5.6 percentNot used = 72.2 percent
100.0
Military
Often = 0.0 percentSometimes = 11.1 percentSeldom = 11.1 percentNot used = 77.8 percent
100.0
Civic
Often = 0.0 percentSometimes = 17.6 percentSeldom = 29.5 percentNot used = 52.9 percent
100.0
Business and Industry
Often ,-- = 5.9 percentSometimes = 29.4 percentSeldom = 17.6 percentNot used = 47.1 percent
100.0
Public Schools
Often = 38.9 percentSometimes = 22.2 percentSeldom = 11.1 percentNot used = 27.8 percent
100.0
32

Agricultural Extension
Often = 0.0 percentSometimes = 12.5 percentSeldom = 18.8 percentNot used = 68.7 percent
100.0
PROBLEM DISCUSSION
When asked with whom they usually discussed problems encountered in their ABEduties, the teachers responded as follows:
SuperintendentYes = 5.3 percentNo = 94.7 percent
100.0
ABE Supervisor
Yes = 100.0 percentNo = 0.0 percent
100.0
State Department PersonnelYes = 21.1 percentNo = 78.9 percent
100.0
Public School PrincipalYes = 0.0 percentNo = 100.0 percent
100.0
Another TeacherYes = 63.2 percentNo = 36.8 percent
100.0
Guidance CounselorYes = 42.1 percentNo = 57.9 percent
100.0
33

ATTENDANCE
When asked as to the percent of students who generally attended each ABE class, itwas found that class attendance was approximately 60 percent; however, it varied fromabout 15 to 95 percent.
REASONS FOR DROPOUTS
When asked what they thought were the primary reasons for dropouts in the ABEprogram, the teachers responded as follows:
Undesirable Location of ClassesYes = 0.0 percentNo 1: 100.0 percent
100.0
irrelevant CurriculumYes = 21.1 percentNo = 78.9 percent
100.0
School Work Too DifficultYes = 5.3 percentNo = 94.7 percent
100.0
Personality DifficultiesYes = 5.3 percentNo = 94.7 percent
100.0
Moved from CommunityYes = 26.3 percentNo = 73.7 percent
100.0
Lack of Guidance and CounselingYes = 0.0 percentNo = 100.0 percent
100.0
Lack of Satisfactory ProgressYes = 10.5 percentNo = 89.5 percent
100.0
34

Meeting TimeYes = 0.0 percentNo =100.0 percent
100.0
Entered Training ProgramYes = 5.3 percentNo = 94.7 percent
100.0
Declining InterestYes = 21.1 percentNo = 78.9 percent
100.0
Secured JobYes = 15.8 percentNo = 84.2 percent
100.0
LazinessYes = 50.0 percentNo = 50.0 percent
100.0
Lack of TransportationYes = 52.6 percentNo = 47.4 percent
100.0
Personal ProblemsYes = 42.1 percentNo = 57.9 percent
100.0
Child CareYes = 50.0 percentNo = 50.0 percent
100.0
Peer InfluenceYes = 31.6 percentNo = 68.4 percent
100.0
Health ProblemsYesNo
35
= 10.5 percent= 89.5 percent
100.0

PROGRAM ACCOMPLISHMENTS
When asked to rate the Shelby County ABE program inaccomplish various skills, the teachers responded as follows:
1. Understand the health servicesavailable from governmental andnon-governmental agencies.
2. Understand how they can improveand protect the health of the family.
3. Realize the importance ofparticipating in and contributingto healthful community practices.
4. Learn and comprehend the elements ofscience which will enable them to betterunderstand and join in the life of theircommunity and nation.
5. Better understand the different levelsof democratic systems of government andfunctions of each.
6. Know and understand the purposes andfunctions of the three branchesof the different levels of government.
7. Have a basic knowledge and appreciation ofthe political, economic, and socialdevelopment of our country.
8. Make a self-inventory or study ofpersonal qualifications.
9. Know how to locate job opportunitiescommensurate with ability.
36
helping the students to
High = 27.8 percentModerate = 55.6 percentLow = 16.6 percent
100.0
High = 16.7 percentModerate = 72.2 percentLow = 11.1 percent
100.0
High = 22.2 percentModerate = 66.7 percentLow = 11.1 percent
100.0
High = 22.2 percentModerate = 72.2 percentLow = 5.6 percent
100.0
High = 50.0 percentModerate = 44.4 percentLow = 5.6 percent
100.0
High = 50.0 percentModerate = 44.4 percentLow = 5.6 percent
100.0
High = 33.3 percentModerate = 55.6 percentLow = ALL percent
100.0High = 23.5 percentModerate = 70.6 percentLow = ___19 percent
100.0
High = 27.8 percentModerate = 55.6 percentLow = 16.6 percent
100.0

10. Know the basic principles of jobapplication and interviewing.
11. Develop health and personal qualitieshelpful in obtaining and holding a job.
12. Recognize the need for loyalty, honestyand integrity in employment.
13. Increase pride in workmanship regardlessof the work.
14. Develop good work habits.
15. Understand employer reasons for refusingto hire or for discharging workers.
16. Realize that earning a living ischaracteristic of a good citizen.
17. Vote more intelligently.
18. Develop critical thinking.
19. Become more interested in theneeds of the day.
37
High = 27.8 percentModerate = 72.2 percentLow =__Lapercent
100.0
High = 16.7 percentModerate = 72.2 pervert!Low = _L1J percent
100.0
High = 55.6 percentModerate = 44.4 percentLow = 0.0 percent
100.0
High = 55.6 percentModerate = 38.9 percentLow =__5.5 percent
100.0
High = 55.6 percentModerate 38.9 percentLow = _5,1percent
100.0
High = 29.4 percentModerate = 58.8 percentLow = 11.8 percent
100.0
High = 64.7 percentModerate = 35.3 percentLow = ALQ percent
100.0
High = 44.4 percentModerate = 50.0 percentLow =_5,6 percent
100.0
High = 50.0 percentModerate = 44.4 percentLow = 5. 6percent
100.0
High = 66.7 perct itM ,derate = 27.8 percentLow = 5.5 percent
100.0
20. Better use of leisure time.
21. Recognize desirability of family unity.
22. Realize importance of cooperationwith and consideration of otherpeople in everyday living.
23. Improve and protect the healthof themselves and their families.
24. Promote adherence to thedemocratic process.
25. Understand the responsibilities whichaccompany the rights of a citizen.
26. Acquire and improve the skills ofaddition, subtraction, multiplicationand division.
27. Develop understanding of fractions,decimals, percent and percentage.
28. Develop mathematical understanding ofinterest, budgeting, purchasing,and purchasing on time.
29. Apply arithmetic to ordinary dailyactivities.
38
High = 38.9 percentModerate = 55.6 percentLow = 5.5 percent
100.0
High = 41.2 percentModerate = 52.9 percentLow = 5.9 percent
100.0
High = 50.0 percentModerate = 50.0 percentLow = 0.0 percent
100.0
High = 44.4 percentModerate = 55.6 percentLow = 0.0 percent
100.0
High = 38.9 percentModerate = 55.6 percentLow = 5.5 percent
100.0
High = 55.6 percentModerate = 38.9 percentLow = 5.5 percent
100.0
High = 89.5 percentModerate = 10.5 percentLow = 0.0 percent
100.0
High = 84.2 percentModerate = 10.5 percentLow =_5.3 percent
100.0
High = 73.7 percentModerate = 21.1 percentLow = 5.2 percent
100.0
High = 63.2 percentModerate = 36.8 percentLow = 0.0 percent
100.0

30. Understand wages, income and High = 73.7 percentexpenditures. Moderate = 26.3 percent
Low = 0.0 percent100.0
:11. Enunciation and pronunciation. High = 57.9 percentModerate = 36.8 percentLow = 5.3 percent
100.0
32. Penmanship. High = 26.3 percentModerate = 57.9 percentLow = 15.8 percent
100.0
33. Listening. High = 42.1 percentModerate = 47.4 percentLow = 10.5 percent
100.0
34. Written composition. High = 26.3 percentModerate = 63.2 percentLow = 10.5 percent
100.0
35. Word usage. High = 66.7 percentModerate = 33.3 percentLow = 0.0 percent
100.0
36. Speaking. High = 57.9 percentModerate = 31.6 percentLow = 10.5 percent
100.0
37. Reading comprehension. High = 63.2 percentModerate = 36.8 percentLow =AL(Lpercent
100.0
38. Word recognition. High = 68.4 percentModerate = 31.6 percentLow = 0.0 percent
100.0
39. Reading vocabulary. High = 63.2 percentModerate = 36.8 percentLow = 0. 0 percent
100.0
39

40. Reading to increase knowledge.
41. Locating information.
42. Recreational reading.
43. Develop the skills, attitudes,and knowledge required forexisting or emerging jobs.
44. Apply arithmetic knowledgeto shopping and spending money.
45. Increase motivation for jobpromotions or better jobs.
46. Realize the importance of andways of budgeting income.
47. Better understand and participatemore in the life of the community.
48. Better comprehend and engage inpolitical activities.
49. Understand credit costsand interest rates.
40
HighModerateLow
HighModerateLow
HighModerateLow
HighModerateLow
HighModerateLow
HighModerateLow,
HighModerateLow
HighModerateLow
HighModerateLow
HighModerateLow
= 68.4 percent= 26.3 percent= 5.3 percent
100.0
= 57.9 percent= 31.6 percent= 10.5 percent
100.0
= 47.4 percent= 36.8 percent= 15.8 percent
100.0
= 42.1 percent= 42.1 percent= 15.8 percent
100.0
= 55.6 percent= 33.3 percent= 11.1 percent
100.0
= 47.4 percent= 42.1 percent= 10.5 percent
100.0
= 63.2 percent= 31.6 percent= 5.2 percent
100.0
= 52.6 percent= 47.4 percent= 0.0 percent
100.0
= 42.1 percent= 42.1 percent= 15.8 percent
100.0
= 68.4 percent= 31.6 percent= 0.0 percent
100:0
50. Read and understand labels,recipes, signs, newspapers,and simple directions.
51. Develop an appreciation forimproved homes and surroundings.
High =Moderate =Low =
High =Moderate =Low =
41
68.4 percent15.8 percent15.8 percent
TNT)
52.6 percent36.8 percent10.6 percent
100.0
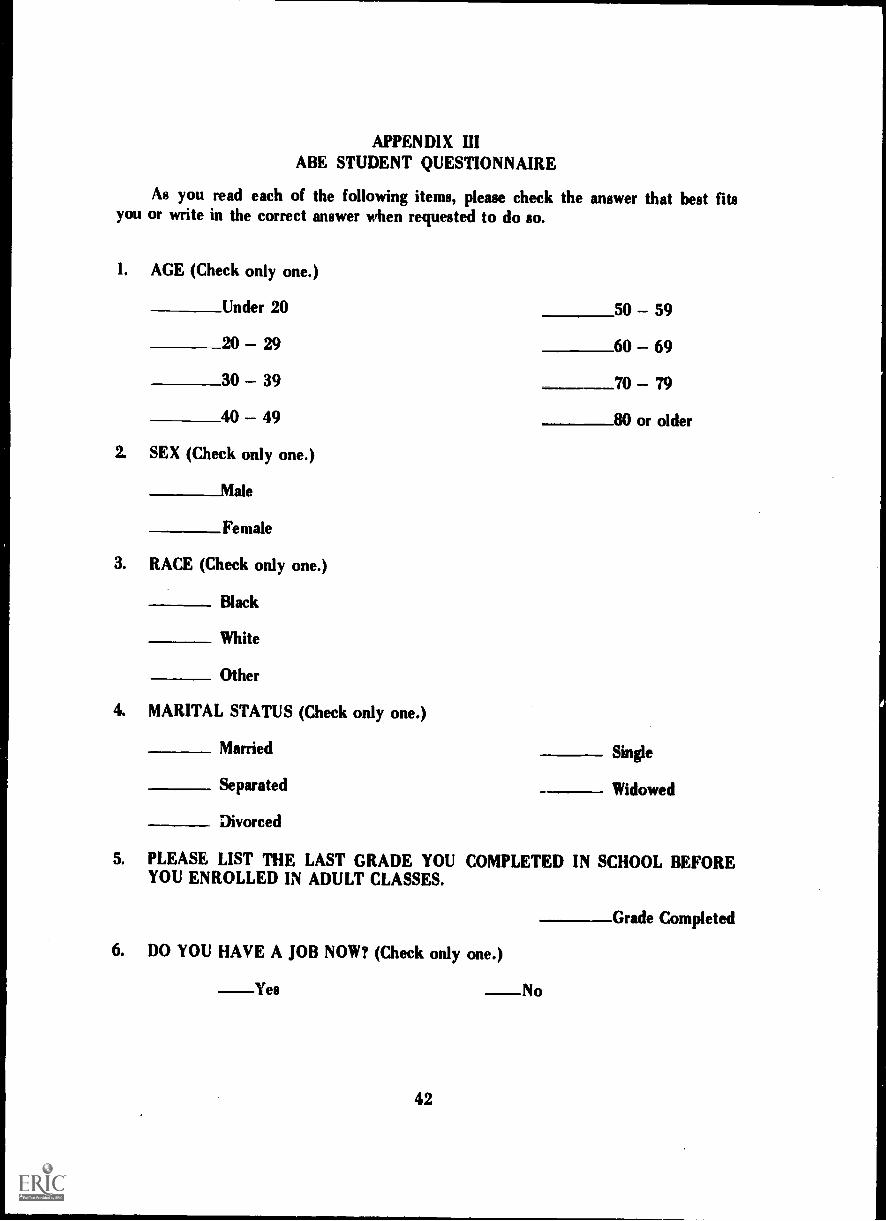
APPENDIX IIIABE STUDENT QUESTIONNAIRE
As you read each of the following items, please check the answer that best fitsyou or write in the correct answer when requested to do so.
1. AGE (Check only one.)
Under 20 50 59
20 29 60 69
30 39 70 7940 49 80 or older
2. SEX (Check only one.)
_Male
Female
3. RACE (Check only one.)
Black
White
Other
4. MARITAL STATUS (Check only one.)
Married Single
Separated Widowed
Divorced
5. PLEASE LIST THE LAST GRADE YOU COMPLETED IN SCHOOL BEFOREYOU ENROLLED IN ADULT CLASSES.
6. DO YOU HAVE A JOB NOW? (Check only one.)
Yes No
42
Grade Completed

7. IF YOU HAVE A JOB NCW, PLEASE LIST IT. (If you do not, do not answerthis item.)
___Name of job
8. IF YOU DO NOT HAVE A JOB, ABOUT HOW LONG HAVE YOU BEENUNEMPLOYED? (If you have a job, do not answer this item. Check only one.)
Less than 6 months
6 months to I year
More than 1 year
9. THE JOB YOU ARE NOW BEST TRAINED TO DO IS:
10. IF YOU COULD HAVE ANY JOB YOU WANTED AND WERE TRAINED TODO THIS JOB, IT WOULD BE:
11. MY !EARLY INCOME IS: (Check only one.)
Less than $1,000 $3,000 $3,999
$1,000 $1,999 $4,000 $4,999
$2,000 $2,999 $5,000 or more
12. NAME THREE PROGRAMS YOU REGULARLY WATCH ON TELEVISION.
13. WHAT TIME ARE YOU MOST LIKELY TO WATCH TELEVISION MONDAYTHROUGH FRIDAY? (Check more than one if hiecessary.)
6 8 a.m. 4 6 p.m.
8 10 a.m. 6 8 p.m.
10 Noon 8 10 p.m.
Noon 2 p.m. After 10 p.m.
2 4 p.m.
43

14. W H AT TIME ARE YOU MOST LIKELY TO WATCH TELEVISION ONSATURDAY? (Check more than one if necessary.)
6 8 a. m. 4 6 p.m.
8 10 a.m 6 8 p.m.
10 Noon 8 10 p.m.
Noon 2 p.m. After 10 p.m.
2 4 p.m.
15. WHAT TIME ARE YOU MOST LIKELY TO WATCH TELEVISION ONSUNDAY? (Check more than one if necessary.)
6 8 a.m. 4 6 p.m.
8 -10 a.m. 6 8 p.m.
10 Noon 8 10 p.m.
Noon 2 p.m. After 10 p.m.
2 - 4 p.m.
16. LIST THE RADIO STATIONS YOU NORMALLY LISTEN TO IN ORDER OFIMPORTANCE.
17. WHAT TIME ARE YOU MOST LIKELY TO LISTEN TO RADIO? (Check morethan one if necessary.)
6 8 a.m. 4 6 p.m.
8 10 a.m. 6 8 p.m.
10 Noon 8-- 10 p.m.
Noon 2 p.m. After 10 p.m.
2 4 p.m.
44

18. DO YOU USUALLY WATCH THE 10:00 NEWS ON TELEVISION AT NIGHT?(Check only one.)
Yes No
19. IF YOU ANSWERED NUMBER 1 YES, WHICH CHANNEL DO YOUUSUALLY WATCH? (Check only one.)
Channel 13, WHBQ
Channel 5, WMC
Channel 3, WREC
20. HOW FAR DO YOU LIVE FROM YOUR ADULT CLASS? (Check only one.)
Less than 1 mile 10 14.9 miles
1 4.9 miles 15 19.9 miles
5 9.9 miles 20 or more miles
21. HOW DO YOU USUALLY GET TO CLASS? (Check only one.)
Walk
Bus
My own car
Ride with friendor relative
Taxi
22. HOW OFTEN DO YOU MISS CLASS DUE TO TRANSPORTATIONPROBLEMS? (Check only one.)
Never
Seldom
Some
A Great Deal
23. FROM WHAT SOURCES HAVE YOU HEARD ABOUT ADULT CLASSES?(Check all that apply. Draw a circle around the first source from which you heardit.)
Friends or neighbors Employment office
Relatives Newspaper
Church TV
My employer Radio
Teacher or principal of school Other (List below)45

24. WHAT WERE THE MAIN REASONS YOU ENROLLED IN ADULT CLASSES?(Check all that apply. Draw a circle around the most important reason forenrolling.)
Get a job
Get a better job
To be able to do some things you could not do very well
To impress my friends
Wanted something to do
To improve myself
To meet new friends
To get out of the house
25. HOW DOES YOUR WIFE (GIRLFRIEND) OR HUSBAND (BOYFRIEND) FEELABOUT YOU TAKING THIS CLASS? (Check only one.)
Pleased
Not Pleased
Does not care either way
Other
26. WHEN YOU FIRST ENROLLED IN THE ADULT CLASS, WHAT DID YOUWANT TO LEARN MOST OF ALL?
27. ARE YOU SATISFIED WITH YOUR PROGRESS TOWARD LEARNING WHATYOU WROTE 1N NUMBER 26? (Check only one.)
Yes No
28. WHO CARES FOR YOUR CHILDREN WHILE YOU ATTEND THIS CLASS?(Check only one.)
Do not have any children A nursery school
My wife My girlfriend
My husband My boyfriend
My neighbors or friends They look out forthemselves
My relatives
46

29. FROM WHICH OF THE FOLLOWING DO YOU RECEIVE MONEY? (Check allthat apply.)
Social security Unemployment agency
Welfare or AID (Aid to Dependent Children) None of these
30. WHICH OF THE FOLLOWING PERSONAL OR FAMILY PROBLEMSBOTHERS YOU QUITE OFTEN? (Check all that apply.)
Money Drinking
Family Kids
Work _ Housing
Sickness Other (List below)
31. OVER THE LAST THREE YEARS OR SO, HAVE YOU TALKED WITH ANYOF THE FOLLOWING PEOPLE ABOUT YOUR PROBLEMS? (Check all thatapply.)
Doctor or dentist
Police
Credit or money lender
Palmist, fortune teller, or astrologer
Lawyer
Politician
Banker
Preacher
Welfare worker
Public health nurse
Extension agent such u the home demonstration agent, county agent,4-H club agent
School teacher or principal, which includes the agricultural teacher,home economics teacher, and adult teacher
Friend
Relative
47

Following are some statements that have no right or wrong answers. Pleaseindicate the degree to which you agree or disagree with each statement by circling theanswer which best describes how you feel.
1. THE MATERIALS PROVIDED FOR ME IN THIS CLASS ARE INTERESTINGTO ADULTS.
Strongly Agree Agree Disagree Strongly Disagree
2. THE ADULT PROGRAM HAS HELPED ME TO BE ABLE TO VOTE MOREINTELLIGEN fLY.
Strongly Agree Agree Disagree Strongly Disagree
3. THE ADULT PROGRAM HAS HELPED ME TO BECOME AWARE OF HEALTHSERVICES AVAILABLE IN THE COUNTY.
Strongly Agree Agree Disagree Strongly Disagree
4. THE ADULT PROGRAM HAS SHOWN ME HOW I CAN IMPROVE ANDPROTECT THE HEALTH OF MYSELF AND MY FAMILY.
Strongly Agree Agree Disagree Strongly Disagree
5. THE ADULT PROGRAM HAS HELPED ME TO UNDERSTAND MY RIGHTSAND MY RESPONSIBILITIES AS AN INDIVIDUAL CITIZEN.
Strongly Agree Agree Disagree Strongly Disagree
6. THE ADULT PROGRAM HAS HELPED ME TO IMPROVE MY READINGABILITY.
Strongly Agree Agree Disagree Strongly Disagree
7. THE ADULT PROGRAM HAS HELPED ME TO IMPROVE MY ARITHMETICABILITY.
Strongly Agree Agree Disagree Strongly Disagree
& THE ADULT PROGRAM HAS HELPED ME TO IMPROVE MY ABILITY TOWRITE.
Strongly Agree Agree Disagree Strongly Disagree
9. THE ADULT PROGRAM HAS GIVEN ME MORE CONFIDENCE IN MYABILITY TO LEARN.
Strongly Agree Agree Disagree Strongly Disagree
48

10. THE ADULT PROGRAM ALLOWS ME TO LEARN AT MY OWN RATE OFSPEED.
Strongly Agree Agree Disagree Strongly Disagree
11. THE ADULT PROGRAM IS HELPING ME TO REACH THE GOALS I HAD INMIND WHEN I ENROLLED.
Strongly Agree Agree Disagree Strongly Disagree
12. THE ADULT PROGRAM HAS HELPED ME TO BETTER UNDERSTANDCREDIT COSTS AND INTEREST RATEL).
Strongly Agree Agree Disagree Strongly Disagree
13. THE ADULT PROGRAM HAS HELPED ME TO READ AND UNDERSTANDDIRECTIONS, LABELS, RECIPES, SIGNS, NEWSPAPERS, AND MAGAZINES.
Strongly Agree Agree Disagree Strongly Disagree
14. THE ADULT PROGRAM HAS HELPED ME IN SPENDING MY MONEY MOREWISELY.
Strongly Agree Agree Disagree Strongly Disagree
15. MY TEACHER UNDERSTANDS THE PROBLEMS OF UNDEREDUCATEDADULTS.
Strongly Agree Agree Disagree Strongly Disagree
16. MY TEACHER READILY HELPS ME WITH MY LESSONS WHEN I NEEDHELP.
Strongly Agree Agree Disagree Strongly Disagree
17. MY TEACHER SOMETIMES EMBARRASSES STUDENTS WHEN THEY MAKEMISTAKES.
Strongly Agree Agree Disagree Strongly Disagree
18. MY TEACHER SHOULD TALK MORE OFTEN WITH ME ABOUT MYPROGRESS.
Strongly Agree Agree Disagree Strongly Disagree
19. I FEEL FREE TO DISCUSS WITH MY TEACHER ANY PROBLEMS THATINTERFERE WITH MY ATTENDING CLASS OR THAT INTERFERE WITHMY LEARNING IN CLASS.
Strongly Agree Agree Disagree Strongly Disagree
49
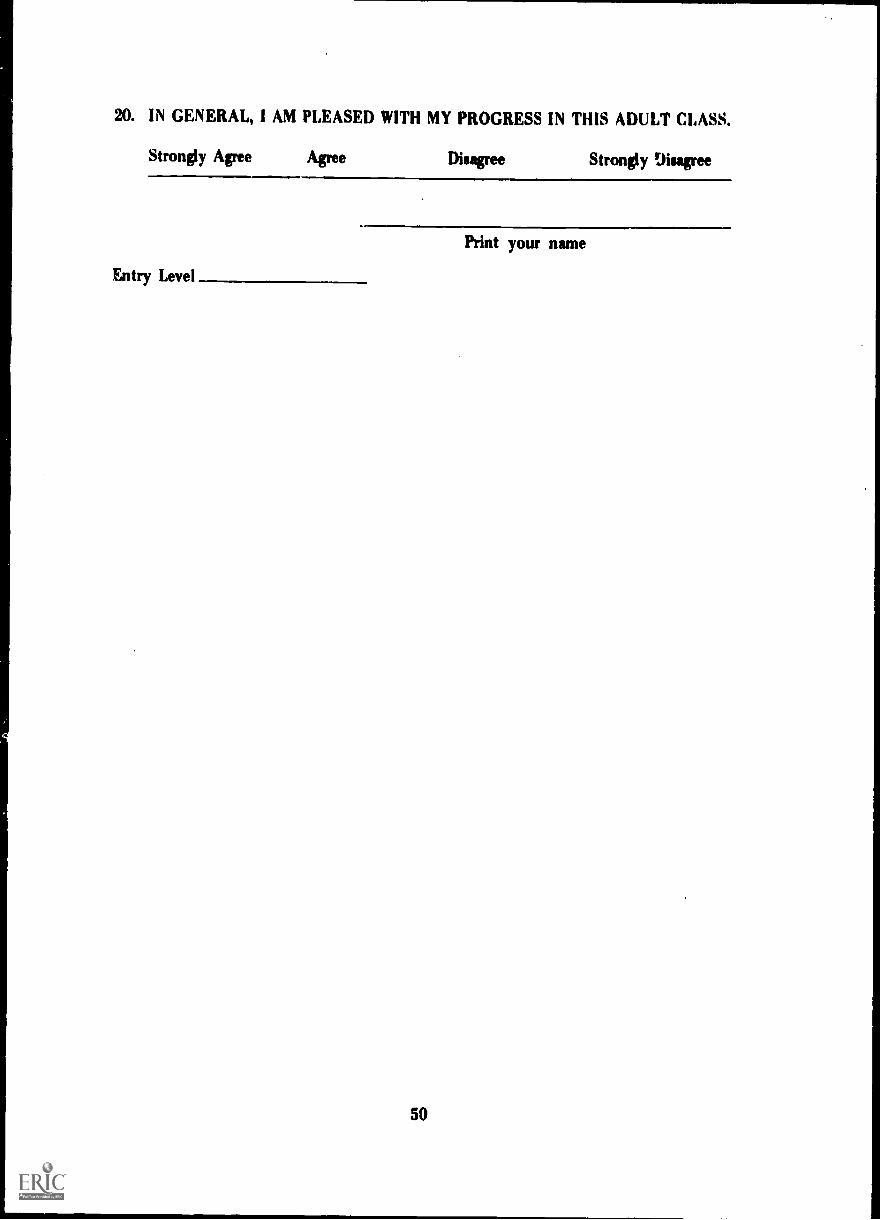
20. IN GENERAL, I AM PLEASED WITH MY PROGRESS IN THIS ADULT CLASS.
Strongly Agree Agree Disagree Strongly Disagree
Entry Level
50
Print your name

APPENDIX IV
ABE TEACHER QUESTIONNAIRE
The information obtained from these response sheets is not to be used for
evaluating any particular person or school; rather, it is to be used accumulatively in anevaluation of the overall ABE program in Shelby County. In order for your responsesto be completely anonymous, please do not put your name or any other identifyinginformation on the instrument.
1. Age Less than 30 40.4930-39 50 and over
2. Sex. Male
Female
3. Race. __White_Non-White
4. Educational :3 kground:
5. Years experience in ABE:
Less than Master's
Mister's or more
Less than 1
1.3
More than 3
6. On the average, how much time do you devote to lesson preparation for each ABEclass meeting?
a) None e) 31.40 minutesb) 1-10 minutes f) 41.50 minutesc) 11.20 minutes g) 51-60 minutesd) 21-30 minutes h) More than 60 minutes
7. How many semester hours of college credits do you have in each of the following areas?
(3 quarter hours equal 2 semester hours.)
Adult EducationGuidance and Counseling
Reading
51
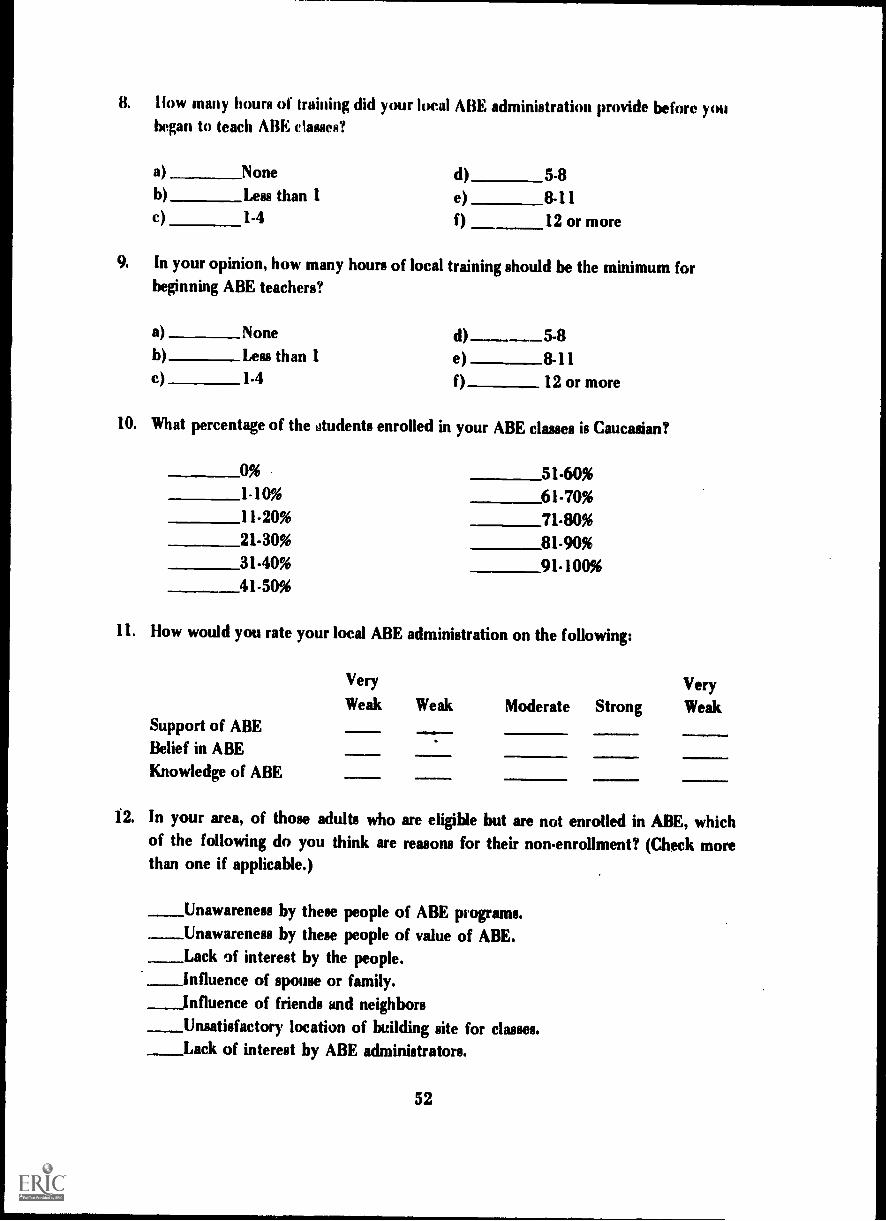
8. How many hours of training did your local ABE administration provide before youbegan to teach ABE classes?
a) None d) 5.8b) Less than 1 e) 8-11c) 1-4 f) 12 or more
9. In your opinion, how many hours of local training should be the minimum forbeginning ABE teachers?
a) None d) 5-8b) Less than 1 e) 8-11c) 1.4 f) 12 or more
10. What percentage of the students enrolled in your ABE classes is Caucasian?
0% 51.60%1-10% 61.70%11-20% 71.80%21.30% 81-90%31.40% 91.100%41-50%
11. How would you rate your local ABE administration on the following:
Support of ABEBelief in ABE
Knowledge of ABE
Very VeryWeak Weak Moderate Strong Weak
12. In your area, of those adults who are eligible but are not enrolled in ABE, whichof the following do you think are reasons for their non-enrollment? (Check morethan one if applicable.)
Unawareness by these people of ABE programs.Unawareness by these people of value of ABE.Lack of interest by the people.Influence of spouse or family.influence of friends and neighborsUnsatisfactory location of building site for classes.Lack of interest by ABE administrators.
52

Failure of ABE program to meet their needsLack of funds for additional classes.Conflict with class time.Lack of transportation.Lack of child care.
13. To what extent does your local ABE administration help you with the followingitems?
Guidance and counselingABE materialsProgram planningRecruitmentDropoutsAudio-visual resourcesProfessional development
None Little Moderate Great
14. To what extent do you need additional help from your local ABE administrationin the following areas?
Guidance and counselingABE materialsProgram planningTeaching methodsRecruitmentDropoutsAudio visual resourcesProfessional development
None Little Moderate Great
15. How often do you use the services of the following agencies to help your ABEstudents?
EmploymentPublic HealthMDTA
Welfare
RehabilitationReligious
Law
Military
Not Used Seldom Sometimes Often
53

(continued) Not Used Seldom Sometimes Often
Civic
Business-IndustryPublic SchoolsAgricultural Extension
,=111110
16. With whom do you discuss problems encountered in your ABE duties? (Checkmore than one if applicable.
_SuperintendentSupervisor
_State Dept. Personnel_Public School principal
_ Another teacherGuidance counselor
No one
17. On the average, what percent of enrolled students attend each of your ABEclasses?
0-10% 51-60%11.20 61.70%21.30% 71-80%31-40% 81-90%41.50% 91.100%
18. Which of the following do you think are the primary reasons for dropouts in theABE program? (Check more than one if applicable.)
Undesirable location of classes._Irrelevant curriculum._School work too difficult.__Personality difficulties.
Movement from community.Lack of satisfactory progress.Lack of guidance and counseling.Meeting time.Entered training program.Decline of interest.
_Secured job.Laziness.
_Lack of transportation.
54
Personal problems.Child care.
__Peer influence.__Health problems.

19. Rate the accomplishments of the Shelby County ABE program in helping studentsto:
Understand the healthservice available fromgovernmental and non-governmental agencies.
Understand how they canimprove and protect thehealth of the family.
Realize the importance ofparticipating in andcontributing to healthfulcommunity practices.
Learn and comprehend theelements of Rcience whichwill enable them to betterunderstand and join in thelife of their community andnation.
Better understand thedifferent levels of democraticsystems of government andfunctions of each.
Know and understand thepurposes and functions ofthe three branches of thedifferent levels of ourgovernment.
Have a basic knowledge
and appreciation of thepoliii- economic, and
, social ,evelopment of our country.
Very VeryLow Low Moderate High High
55
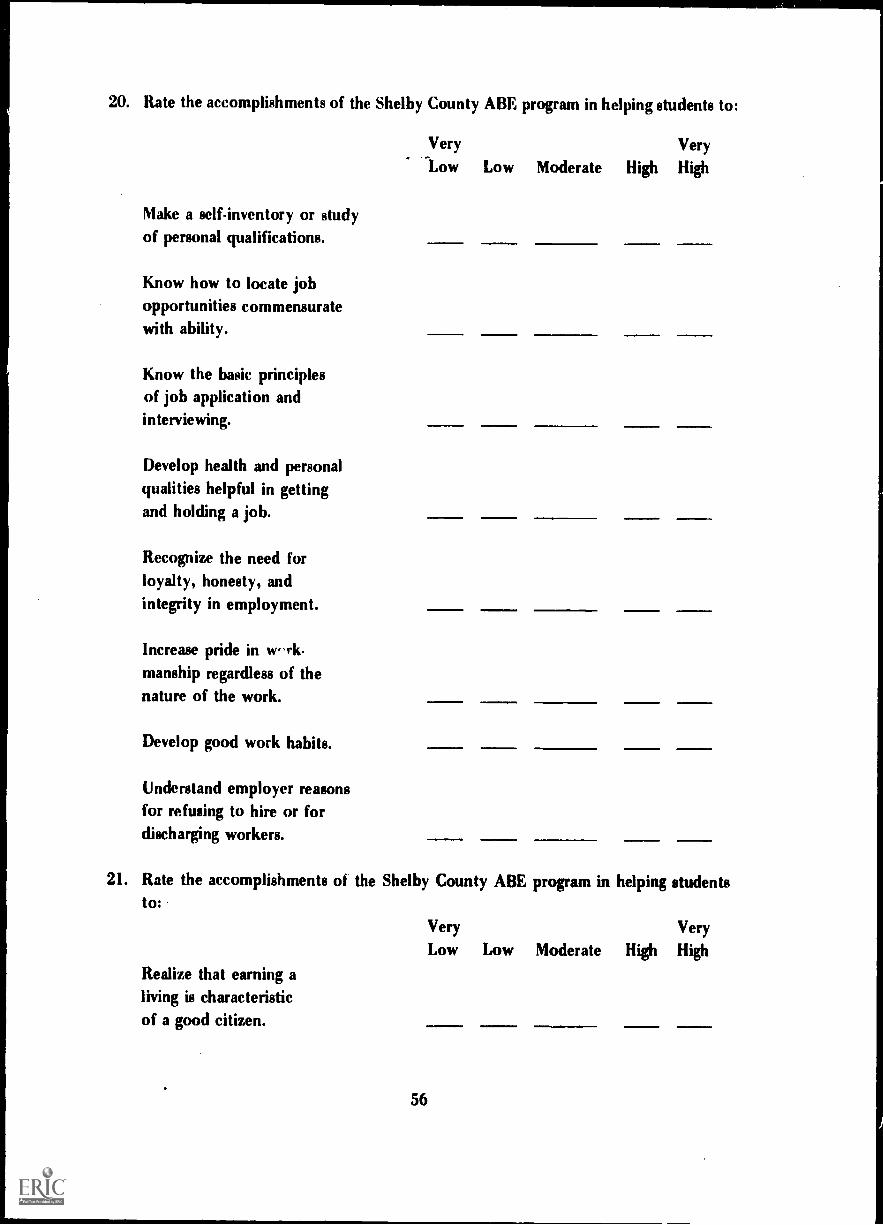
20. Rate the accomplishments of the Shelby County ABE program in helping students to:
Make a self-inventory or studyof personal qualifications.
Know how to locate jobopportunities commensuratewith ability.
Know the basic principlesof job application andinterviewing.
Develop health and personalqualities helpful in gettingand holding a job.
Recognize the need forloyalty, honesty, andintegrity in employment.
Increase pride in w "rk-manship regardless of thenature of the work.
Develop good work habits.
Understand employer reasonsfor refusing to hire or fordischarging workers.
Very Very
Low Low Moderate High High
21. Rate the accomplishments of the Shelby County ABE program in helping studentsto:
Realize that earning aliving is characteristicof a good citizen.
Very VeryLow Low Moderate High High
56

Vote more intelligently.
Develop critical thinking.
Become more interested inthe news of the day.
Better use leisure time.
Recognize desirability offamily unity.
Realize importance ofcooperation with andconsideration of otherpeople in every dayliving.
Improve and protect thehealth of themselves andtheir families.
Promote adherence to thedemocratic process.
Understand the responsi-bilities which accompanythe rights of a citizen.
Very VeryLow Low Moderate High High
.
22. Rate the accomplishments of the Shelby County ABE program in helping studentsto:
Acquire and improve theskills of addition, sub.traction, multiplication, and division.
Develop understanding offractions, decimals, percentand percentage.
Very VeryLow Low Moderate High High
57

Develop mathematicalunderstanding of interest,budgeting, purchasing,and purchasing on time.
Apply arithmetic toordinary daily activities.
Understand wages, income,and expenditures.
Very Very
Low Low Moderate High High
23. Rate the accomplsihments of the Shelby County ABE program in helping studentsacquire and improve the skills of:
Very Very
Low Low Moderate High High
Enunciation and pronunciation.
Penmanship.
Listening.
Written composition.
Work usage.
Speaking.
24. Rate the accomplishments of the Shelby County ABE program in helping studentsacquire and improve the skills:
Reading comprehension.
Word recognition.
Reading vocabulary.
Reading to increase knowledge.
Locating information.
Recreational reading.
Very Very
Low Low Moderate High High
58

25. Rate the accomplishments of the Shelby County ABE program in helping studentsto:
Develop the skills, attitudesand knowledge required forexisting or emerging jobs.
Apply arithmetic knowledgeto shopping and spending
money.
Increase motivation for jobpromotions or better jobs.
Realize the importance of
and ways of budgeting income.
Better understand and toparticipate more in thelife of the community.
Better comprehend and toengage in political activities.
Understand credit costs
and interest rates.
Read and understand labels,
recipes, signs, newspapers,
and simple directions.
Develop an appreciation forimproved homes and surroundings.
Very Very
Low Low Moderate High High
59