county-level correlates of terrorism in the united states, 1990 to
TRANSCRIPT

County-level Correlates of Terrorism in the United States, 1990 to 2010
Final Report to the Resilient Systems Division,
Science and Technology Directorate,
U.S. Department of Homeland Security
March 2013
National Consortium for the Study of Terrorism and Responses to Terrorism A Department of Homeland Security Science and Technology Center of Excellence
Based at the University of Maryland
8400 Baltimore Ave, Suite 250 • College Park, MD 20740 • 301.405.6600
www.start.umd.edu
National Consortium for the Study of Terrorism and Responses to Terrorism
A Department of Homeland Security Science and Technology Center of Excellence
County-level Correlates of Terrorism in the United States, 1990-2010
About This Report
The authors of this report are Gary LaFree, Director of START at the University of Maryland,
College Park and Bianca E. Bersani, Assistant Professor of Sociology at the University of
Massachusetts, Boston. Questions about this report should be directed to [email protected].
This report is part of a series sponsored by the Resilient Systems Division, Science and Technology
Directorate, U.S. Department of Homeland Security, in support of the Prevent/Deter program. The
goal of this program is to sponsor research that will aid the intelligence and law enforcement
communities in assessing potential terrorist threats and support policymakers in developing
prevention efforts.
This research was supported by under Grant Award Number 2009ST108LR0003 from the U.S.
Department of Homeland Security through awards made to the National Consortium for the Study
of Terrorism and Responses to Terrorism (START). The views and conclusions contained in this
document are those of the authors and should not be interpreted as necessarily representing the
official policies, either expressed or implied, of the U.S. Department of Homeland Security or
START.
About START
The National Consortium for the Study of Terrorism and Responses to Terrorism (START) is
supported in part by the Science and Technology Directorate of the U.S. Department of Homeland
Security through a Center of Excellence program based at the University of Maryland. START uses
state‐of‐the‐art theories, methods and data from the social and behavioral sciences to improve
understanding of the origins, dynamics and social and psychological impacts of terrorism. For
more information, contact START at [email protected] or visit www.start.umd.edu.
Citations
To cite this report, please use this format:
LaFree, Gary and Bianca Bersani. “County-level Correlates of Terrorism in the United States, 1990
to 2010,” Final Report to the Resilient Systems Division, Science and Technology Directorate, U.S.
Department of Homeland Security. College Park, MD: START, 2013.

National Consortium for the Study of Terrorism and Responses to Terrorism
A Department of Homeland Security Science and Technology Center of Excellence
County-level Correlates of Terrorism in the United States, 1990-2010 1
Contents
Executive Summary .......................................................................................................................................................................... 2
Key Conclusions ............................................................................................................................................................................ 3
Introduction ........................................................................................................................................................................................ 5
Identifying Clusters of Extremist Violence .................................................................................................................... 6
Characteristics of Clusters of Violent Extremism ........................................................................................................ 6
Social Disorganization Theory ............................................................................................................................................ 6
Data and Methodology .................................................................................................................................................................... 9
Data .................................................................................................................................................................................................... 9
Terrorism .................................................................................................................................................................................. 10
Independent Variables ......................................................................................................................................................... 10
Methodology ................................................................................................................................................................................. 12
Results ................................................................................................................................................................................................. 13
Conclusions ........................................................................................................................................................................................ 22
References .......................................................................................................................................................................................... 24

National Consortium for the Study of Terrorism and Responses to Terrorism
A Department of Homeland Security Science and Technology Center of Excellence
County-level Correlates of Terrorism in the United States, 1990-2010 2
Executive Summary
This report builds on a previous one that examined the patterns and predictors of terrorism in the United
States and presented descriptive data on county-level terrorism from 1970 to 2008 (LaFree and Bersani,
2012). In the current report, we were able to extend our analysis to cover the years from 1990 to 2010.
As in the earlier report, we constructed a list of likely predictors of terrorism based in large part on
variables that have been found to be especially important in predicting ordinary crime, including
concentrated disadvantage, residential instability, and population heterogeneity. We then examined the
relationship between these variables, which were drawn from the U.S. Census, and county-level terrorism
attacks, taken from the Global Terrorism Database (GTD). With the expanded data analysis it soon
became evident that the relationships between the county-level characteristics we examined and our
measures of terrorism were in some cases different before and after the September 11, 2001 terrorist
attacks. Given the impact that these attacks had on public policy regarding terrorism in the United States,
this is hardly surprising. Accordingly, much of the report that follows examines these differences. Three
core research concerns are addressed here:
Geographic Concentration of Terrorism, 1990 to 2010
We examine patterns of dispersion and clustering in terrorist attacks annually from 1990 to 2010. During
this time, nearly 600 terrorist attacks occurred on U.S. soil. We find evidence that incidents of terrorism
have trended downward over the last two decades with a strong majority of these attacks occurring in
the 1990s (n = 348). When we examine patterns of terrorism at the county level, we find clear evidence
that terrorist attacks cluster in specific geographic areas. A quarter of all attacks occurred in just 10
counties. Manhattan, NY experienced the highest number of attacks during this time (n = 30), followed
by Los Angeles County, CA (n = 19), San Diego County, CA (n = 16), Washington, D.C. (n = 15), and Miami-
Dade County, FL (n = 14). But notably, smaller counties were also targeted by terrorism, including
Bernalillo County, NM (n = 13), Lane County, OR (n = 8), and Tulsa County, OK (n = 8). Despite evidence
of geographic clustering of terrorism, it is also clearly evident that terrorist attacks are widely dispersed;
each of the 48 continental U.S. states experienced at least one terrorist attack between 1990 and 2010.
Geographic Profile of the ‘Typical’ U.S. County that Experienced a Terrorist Attack
It is clear that place matters in thinking about patterns of terrorist attacks in the United States. Based on
our analysis of county-level characteristics, we describe what the average or typical county that
experienced at least one terrorist attack looks like. Compared to counties with no terrorist attacks from
1990 to 2010, we find that counties experiencing at least one terrorist attack over this same time period
were characterized by a larger population, more young men aged 15 to 24 years, a greater proportion of
Asian, Hispanic, and foreign-born residents, and higher rates of language diversity.
We are particularly cognizant of the potential and likely effect of the September 11, 2001 attacks, and as
such we were interested in whether or not the characteristics of the ‘typical’ county targeted by terrorism
differed in the 1990s and in the first decade of the 21st century. For the analysis, we disaggregated
National Consortium for the Study of Terrorism and Responses to Terrorism
A Department of Homeland Security Science and Technology Center of Excellence
County-level Correlates of Terrorism in the United States, 1990-2010 3
attacks by decade (i.e., 1991 to 2000 and 2001 to 2010) and compared characteristics of counties that
experienced attacks across these two time periods. Our results provide preliminary evidence that the
geographic targets of terrorist attacks may be changing in important ways. Compared to the average
profile of counties that experienced a terrorist attack in the 1990s, those that experienced a terrorist
attack from 2001 to 2010 had smaller proportions of males aged 15 to 24 years, higher levels of
concentrated disadvantage, greater proportions of foreign-born citizens, and higher rates of language
diversity. We want to be very clear; these results do not suggest that terrorist attacks were more likely to
be completed by individuals who were poor, who were foreign-born or those who primarily speak a
language other than English at home. Our data cannot speak to the profile of individuals involved in
terrorism. Rather, the results suggest that on average, counties that were targets of terrorist attacks in
the last decade were characterized by fewer young males, higher rates of foreign-born population and
language diversity compared to the average county targeted by a terrorist attack in the 1990s.
Predicting Concentrations of Terrorism, 1990 to 2010
Our final core research concern involves examining the county-level characteristics that have the
strongest connections to county-level frequencies of terrorism and determining whether there are
changes in these relationships before and after the September 11, 2001 attacks on the United States. We
find strong, statistical relationships between the frequency of terrorism in a county and its level of
residential instability and language diversity. Specifically, higher levels of residential instability and
language diversity are associated with a higher frequency of terrorism at the county level. We also find
empirical evidence for a significant reduction in terrorist attacks in the first decade of the 21st century
compared to the 1990s. Further investigation revealed that the reduction in terrorism was differentially
felt across U.S. counties. Counties characterized by higher levels of concentrated disadvantage and
residential instability saw the greatest reduction in the rate of terrorism in the last decade. Whereas
counties characterized by higher levels of foreign-born population and language diversity saw lesser
reductions in the rate of terrorism post-2001.
Key Conclusions
We found that a set of variables commonly used for predicting crime rates in the United States had a good
deal of utility in predicting county-level trends in terrorism as well. Moreover, we found substantial
variation in the effects of these variables both in the aggregate and before and after the September 11,
2001 attacks.
Concentrated Disadvantage
Our measure of concentrated disadvantage had a very different relationship with terrorism than what is
widely reported for research on common crime. Overall, more economically disadvantaged counties had
lower than expected rates of terrorism. Further analysis showed that this relationship is being driven
especially by terrorism in the 1990s. Generally, concentrated disadvantage is associated with lower rates

National Consortium for the Study of Terrorism and Responses to Terrorism
A Department of Homeland Security Science and Technology Center of Excellence
County-level Correlates of Terrorism in the United States, 1990-2010 4
of terrorism in the 1990s and has no significant relationship to terrorism in the first decade of the 21st
century.
Residential Instability
Counties with higher rates of residential instability have higher rates of terrorism. This effect is
significant for the full period between 1990 and 2010 and for the first decade of the 21st century. It is
nearly significant for the 1990s.
Percent Foreign-born
For both the 1990s and the first decade of the 21st century, counties with a higher proportion of foreign-
born citizens have higher rates of terrorism. However, when included in the multivariate analysis,
percent foreign-born is not a statistically significant indicator of terrorism rates. This is most likely due
to the fact that percent foreign-born is highly correlated with both residential instability and language
diversity.
Language Diversity
Percent foreign-born has been the most common measure of ethnic heterogeneity in past research. One
of the innovations of this research is that we were able to also measure ethnic heterogeneity by including
a county-level measure of language diversity in the analysis. Greater county-level language diversity is
associated with higher rates of terrorism in the 1990s, the first decade of the 21st century, and for both
decades combined.
Demographic Characteristics
Counties with larger populations have significantly higher rates of terrorism in the 1990s, the first
decade of the 21st century, and for both decades combined. Counties with a higher proportion of young
men aged 15-24 had higher rates of terrorism in the 1990s and the first decade of the 21st century;
however, this variable was not significant when included in the multivariate models.
While our data lend evidence to the assertion that the terrorist events of September 11, 2001
dramatically altered the landscape of terrorism both nationally and globally, we are limited in making
inferences about what motivated or initiated these changes. For example, the findings of this research
tell us that certain counties experienced greater reductions in terrorism after September 11, 2001;
however the extent to which these changes are the result of the development of focused policing tactics
and directed counter-terrorism strategies or instead the result of the evolution and changing nature of
terrorist strategies is unknown. Moreover, we do not yet know whether the altered geographic
distribution of terrorism is a short-term change or marks a new trend in terrorist activity.

National Consortium for the Study of Terrorism and Responses to Terrorism
A Department of Homeland Security Science and Technology Center of Excellence
County-level Correlates of Terrorism in the United States, 1990-2010 5
Introduction
This report builds on an earlier one that analyzed hot spots of terrorism and other crimes in the United
States from 1970 to 2008 (LaFree and Bersani, 2012). This earlier study examined the geographic
concentration of terrorist attacks across the United States and the connection between the distribution of
terrorism and the distribution of ordinary crimes as measured by standardized police data collected by
the Federal Bureau of Investigation. We also provided results from a multivariate analysis of both
county-level terrorism and ordinary crime for the years 2000 to 2008. A key theme emerging was the
importance of place in understanding patterns of terrorism. That is, we found substantial evidence that
over nearly four decades, terrorist attacks clustered within certain U.S. counties. Using ideas gleaned
from the criminological literature, we conducted an analysis to examine whether county characteristics
could explain this clustering of terrorism in the most recent decade. Results demonstrated that increased
residential instability and ethnic heterogeneity (language diversity and percent foreign-born) were
associated with higher concentrations of terrorism in the United States.
In the current report, we build on the earlier research in a number of key respects. First, we broaden the
time horizon of the descriptive and multivariate analysis going back in time one decade to 1990 and
forward two years to include data through 2010. This expanded time period allows us to replicate our
original study with considerably more data. Second, with the additional data, we also investigate
potential changes in the average profile of counties that experienced terrorism before and after the
September 11, 2001 attacks on the U.S. to examine whether targets of attacks have altered following this
pivotal historical event. Finally, and based on a finding in the previous report, we expand our analysis of
the relationship between immigration, language diversity, and terrorism with a particular focus on
examining whether the influence of predictors of terrorist attacks in the United States changed after the
September 11, 2001 attacks. To do so, we employ a statistical strategy that models the annual frequency
of terrorist attacks over the two-decade period while also accounting for the fact that many terrorist
attacks cluster in the same counties.
All terrorism data analyzed in this report are from the Global Terrorism Database (GTD). We begin by
presenting descriptive information on the geographic concentration of terrorism by examining county-
level trends in terrorist attacks in the United States from 1990 to 2010. We then compare the bivariate
differences between counties that did and did not experience terrorist attacks in the 1990s and the first
decade of the 21st century. Finally, using data from the U.S. Census, we examine whether county-level
characteristics (e.g., concentrated disadvantage, residential instability, and population heterogeneity) are
predictive of terrorism and whether any of these relationships differ in the time periods before and after
September 11, 2001. We find that terrorism, like ordinary crime is not randomly distributed but rather
concentrated in time and space. We conclude that the same type of statistical data that are now routinely
used by police departments to help forecast crime hot spots and deploy police officers can also be a
helpful tool for those countering terrorism.

National Consortium for the Study of Terrorism and Responses to Terrorism
A Department of Homeland Security Science and Technology Center of Excellence
County-level Correlates of Terrorism in the United States, 1990-2010 6
Identifying Clusters of Extremist Violence
As we noted in our earlier report, a growing body of research finds that certain areas are “hot spots” of
criminal activity (Sherman, Gartin and Buerger, 1989). That is, ordinary crime is not randomly dispersed
across space, but is instead systematically concentrated in a few areas. In fact, research has shown that
the clustering of ordinary crime in geographic areas is stronger than the clustering of ordinary crime
among individuals. As a result, the prediction of where ordinary crime occurs may be easier than the
prediction of who commits ordinary crime. Specifically, Sherman (1995:36-37) demonstrated that
ordinary crime is “six times more predictable by the address of the occurrence than by the identity of the
offender.” Moreover, while characteristics of geographic areas do change (e.g., changes in population
composition, land use), research has demonstrated that ordinary crime hot spots are relatively stable
over extended periods of time (Weisburd et al. 2004). Consistent with the general crime literature, in our
earlier report (LaFree and Bersani 2012) we also found a good deal of stability in the concentration of
terrorist attacks at the county level over nearly four decades of data for the United States.
Characteristics of Clusters of Violent Extremism
One useful way to examine the distribution of extremist violence is to determine the extent to which the
distribution in time and space of terrorism is correlated with ordinary criminal behavior. There is
currently a debate about this correspondence in criminology. While LaFree and Dugan (2004) point out
that terrorism differs from ordinary crime in several important ways, Clarke and Newman (2006, vii)
argue that “terrorism is a form of crime in all essential respects” and predict that terrorist attacks will
cluster in time and space in the same way as ordinary crimes. Our previous study, which analyzed data
from 1970 to 2008, found that while there was a correlation between terrorist attacks and ordinary
crime, it was moderate (.25).
Social Disorganization Theory
Social disorganization or ecological theories examining connections between community-level measures
such as economic disadvantage or residential instability have been common in the social sciences for
nearly a century. The classic work of Shaw and McKay and their colleagues at the University of Chicago
(1932; Shaw, McKay, and McDonald, 1938) spawned a massive body of research around the theme of
social disorganization. Much of this work was animated by growing concern in the first half of the
twentieth century with the impact of large-scale immigration on the social fabric of the United States and
most particularly its impact on cities. As immigrants from around the world settled disproportionately in
a few large urban centers, they often experienced high rates of poverty, residential instability, and ethnic
heterogeneity. These communities were widely held to be fertile ground for ordinary crime and other
social problems.
After decades of research on ordinary crimes within communities, it is clear that place matters. This
body of research identifies a number of robust structural factors or community-level predictors of crime.
Although many are not directly related to crime, a number of characteristics have been found to be
related to the ability to acquire and mobilize resources that hinder or foster crime. Previous research
finds support for the strong predictive value of socioeconomic status and residential instability on crime

National Consortium for the Study of Terrorism and Responses to Terrorism
A Department of Homeland Security Science and Technology Center of Excellence
County-level Correlates of Terrorism in the United States, 1990-2010 7
(e.g., Krivo and Peterson, 1996; McNulty, 1999; Sampson et al., 1997); however, the evidence concerning
ethnic heterogeneity (e.g., concentrated immigration) runs counter to theoretical expectations (Sampson
et al., 2005). Recent research suggests that ethnic heterogeneity (operationalized as the percentage of
the population that is foreign-born or percentage of the population who migrated to the United States in
the last 10 years in a defined geographic area) is not related to increased crime (Martinez, Stowell, and
Lee, 2010; Ousey and Kubrin, 2009; Reid et al., 2005; Sampson et al., 2005). Rather, concentrated
immigration has been shown to be negatively related to crime (Sampson, 2008; Stowell et al., 2009;
Wadsworth, 2010). Stated simply, ethnic heterogeneity appears to suppress crime in the United States
(Sampson 2005).
Socioeconomic Status. Although Shaw and McKay (1932) originally linked crime to poverty in general,
more recent advancements of this theory aimed at understanding patterns of crime in modern times have
highlighted the role of concentrated disadvantage in explaining variation in crime levels across
communities (Sampson and Wilson, 1995; Krivo and Peterson, 1996). The concentration of disadvantage
(e.g., poverty, joblessness, female-headed households, heightened employment in menial occupations)
results in areas and residents in these areas being socially isolated from mainstream America and
generally lacking an ability to mobilize resources to ward off crime. The relationship between higher
concentrated disadvantage and higher crime has received consistent empirical support (see e.g., Krivo
and Peterson, 1996; Kubrin and Weitzer, 2003; Morenoff, Sampson and Raudenbush, 2001).
There is reason to believe that socioeconomic status, and specifically concentrated disadvantage, may not
exhibit a similar relationship when examining terrorist attacks. Empirically, previous research
examining various types of terrorism finds that the individuals who comprise terrorist groups are often
more educated and skilled than their counterparts (Krueger and Maleckova, 2003; Pape, 2005; Russell
and Miller, 1977; Sageman, 2004) and therefore may be unlikely to reside in areas characterized by
extreme disadvantage. While individuals who commit terrorist attacks may be more advantaged, to our
knowledge, our earlier report (LaFree and Bersani 2012) was among the first to examine directly
whether areas characterized by advantage or disadvantage are associated with terrorism. And in fact,
based on our earlier analysis limited to 2000 through 2008, we found that measures of concentrated
disadvantage had no significant impact on measures of county-level terrorism.
Residential Instability. A substantial body of research has also demonstrated a strong link between
residential instability and higher crime rates. Similar to the relationship described above between
concentrated disadvantage and crime, a heightened level of mobility in a neighborhood destabilizes the
community by weakening social ties, impeding communication, and undermining the ability of residents
of communities to establish and uphold norms in their neighborhoods (Bellair, 1997; Sampson and
Groves, 1989; Sampson, Raudenbush and Earls, 1997). As a result, crime increases in highly transient
neighborhoods. Again, when we undertook this project, we knew of no prior research that specifically
examined the connection between residential instability and terrorism. However, to the extent that weak
social ties with neighbors, limited communication and feelings of isolation or alienation are higher in
communities with greater residential instability, we might expect a positive connection to terrorism.

National Consortium for the Study of Terrorism and Responses to Terrorism
A Department of Homeland Security Science and Technology Center of Excellence
County-level Correlates of Terrorism in the United States, 1990-2010 8
Along these lines, our previous multivariate analysis focused on the period between 2000 and 2008
found that greater residential instability was related to increased terrorism.
Ethnic Heterogeneity. The expectation that the level of ethnic heterogeneity in a community would be
related to crime has historical roots in the dramatically changing urban landscape of the early 20th
century. With massive numbers of immigrants of various European origins flocking to cities, urban
communities were rapidly transformed into centers of diversity, the result of which was not immediately
positive. An inherent byproduct of immigration is that not only do individuals migrate to new areas, but
these individuals bring with them sets of rules, norms, and mores unique to their homelands. These
values are often different from and sometimes in opposition to the dominant values in the host society as
well as the values of other immigrants. As a result, the communities in which concentrations of
immigrants initially settle are characterized by volatility as groups of individuals – each acting in
accordance with its own set of rules – come in contact with one another.
With the United States once again experiencing a surge in the number of individuals migrating to the
country, emphasis has again been placed on understanding the link between ethnic heterogeneity and
crime. Researchers have operationalized ethnic heterogeneity as the percentage of immigrants
(percentage of the population that is foreign-born) residing in specified geographic areas. Contrary to
theoretical expectations, this body of work has demonstrated that higher concentrations of immigrants in
geographic areas (cities, census tracts, neighborhoods) are not associated with increased crime (see e.g.,
Martinez, Stowell, and Lee, 2010; Ousey and Kubrin, 2009; Reid et al., 2005; Sampson et al., 2005) and
may instead function to suppress crime (Sampson, 2008; Stowell et al., 2009; Wadsworth, 2010). This
unexpected finding may be due to the use of the percentage of the population that is foreign-born as the
measure of ethnic heterogeneity. This measure presumably taps into the spatial concentration of
immigrants. Graif and Sampson (2010) have argued that a more valid measure of the heterogeneity
construct is the diversity of language use by the immigrant population in the community. That is, a
community could have a high concentration of foreign-born people, yet if they are all from the same
country, then the community would not be ethnically heterogeneous. A more accurate characterization
of the social disorganization theory concept of ethnic heterogeneity is a measure of the diversity of the
composition of the population residing in the same geographic locale. Looking at variation in homicide
rates across Chicago city census tracts, Graif and Sampson find that their measure of ethnic heterogeneity
(i.e., language diversity) is negatively related to homicide even in models controlling for the percentage of
the population that is foreign-born.
Though Graif and Sampson (2010) find that population diversity is negatively related to homicide, there
is debate in the literature about the potential impact of diversity in a community. Some argue that
diversity adversely affects community relations. For instance, Putnam (2007) has argued that at least in
the short term, neighborhood ethnic diversity reduces social solidarity and social capital thereby
reducing social trust and increasing feelings of isolation. In support of his argument, Putnam finds that in
the United States, higher levels of ethnic diversity in a neighborhood are related to lower levels of trust.
Shihadeh and Barranco (2010) also find negative consequences of diversity and particularly linguistic
isolation. Specifically, they found that counties characterized by a greater proportion of linguistically
National Consortium for the Study of Terrorism and Responses to Terrorism
A Department of Homeland Security Science and Technology Center of Excellence
County-level Correlates of Terrorism in the United States, 1990-2010 9
isolated households (i.e., English non-fluency) experienced more homicide. On the other hand, others
have argued (see, e.g., Lazear, 1999; Fischer, 1975) that diversity is advantageous for immigrants and
communities more generally. The idea is that greater diversity encourages the learning of the dominant
group’s language/culture, promoting assimilation whereas less diverse areas (with perhaps strong ethnic
enclaves) encourage the maintenance of traditional language and culture, hindering communication with
the dominant group and potentially promoting the maintenance of alternate norms.
Despite the long-standing interest of researchers in potential connections between population
heterogeneity and crime, few researchers to date have examined if these variables are related to
extremist crime or terrorism in the United States. If Clarke and Newman’s (2006: vii; see also LaFree and
Dugan, 2004; Rosenfeld, 2004) recent argument that “terrorism is a form of crime in all essential
respects” is correct, then the theoretical underpinnings used to explain the occurrence of crime should
apply to the occurrence of terrorist acts as well. Perhaps of greatest interest here is an understanding of
the relationship between ethnic heterogeneity (percent foreign-born and language diversity) and
terrorist attacks. In our earlier report (LaFree and Bersani 2012) we reasoned that if terrorism functions
similarly to ordinary crime, then diversity should not be related to terrorist attacks. And indeed in the
analysis we did for that report, we found that in our multivariate analysis of data from 2000 to 2008, the
percentage of the population that was recent foreign-born had no significant impact on terrorism rates.
At the same time, we found that increased language diversity did predict increased rates of terrorism at
the county level.
Data and Methodology
Data
The data for this report come from the Global Terrorism Database (GTD) and the 1990 and 2000 U.S.
Census. The Global Terrorism Database (GTD) has been maintained since 2005 by the National
Consortium for the Study of Terrorism and Responses to Terrorism (START; LaFree & Dugan, 2009). It
currently includes data on the characteristics of more than 104,000 terrorist attacks that occurred
worldwide between 1970 and 2011. The construction of the GTD began in 2002 when a team of
researchers digitized data originally collected by the Pinkerton Global Intelligence Service (PGIS), a
private company that recorded terrorism incidents from 1970 to 1997 from wire services (including
Reuters and the Foreign Broadcast Information Service [FBIS]), U.S. State Department reports, other U.S.
and foreign government reporting, U.S. and foreign newspapers (including the New York Times, British
Financial Times, Christian Science Monitor, Washington Post, Washington Times, and Wall Street Journal),
and information provided by PGIS offices around the world. In June 2011, START released GTD data
through 2010 with the expectation of annual spring releases of updated, new event data going forward.1
1 START released GTD data for 2011 in October 2012. Please note that GTD data for 1993 were lost by the original collectors in an office move and have never been successfully recovered. We therefore exclude 1993 from the analysis.

National Consortium for the Study of Terrorism and Responses to Terrorism
A Department of Homeland Security Science and Technology Center of Excellence
County-level Correlates of Terrorism in the United States, 1990-2010 10
Terrorism
The definition of terrorism used by the GTD is: the threatened or actual use of illegal force and violence by
non-state actors to attain a political, economic, religious or social goal through fear, coercion or
intimidation.2 It is important to note that the classification of an event as terrorism depends as much on
threats as the actual use of violence. For example, the GTD includes instances in which individuals seize
an aircraft and threaten to blow it up unless their demands are met. Note also that by specifying the
threatened or actual use of force the definition of terrorism used by the GTD excludes hoaxes. The
requirement that these events be limited to the actions of “non-state actors” means that considerable
violence and terrorism that is directly attributable to states or their militaries is also excluded. And the
requirement that the act have a direct political, economic, religious or social goal means that ordinary
criminal violence is excluded. Thus, the GTD excludes state terrorism and many types of crime and
genocide, topics that are important and complex enough to warrant their own separate analysis.
The frequency of terrorist acts is recorded for each U.S. county for each year from 1990 through 2010.
Counties with no recorded terrorist attacks are coded “zero.” The vast majority of counties (n = 2901;
92%) did not experience any terrorist attacks during the period of time observed here: 1990 to 2010.
While more than half of the remaining counties experienced just one terrorist attack (n = 140; 57%), the
incidence of terrorist attacks in a county over this 20-year period ranged from 1 to 30 attacks.
Independent Variables
County-level indicators of social disorganization (i.e., socioeconomic status, residential instability, and
ethnic heterogeneity) and demographic characteristics found to be important predictors of ordinary
crime are taken from the 1990 and 2000 U.S. Census.
Socioeconomic Status. Consistent with recent research, our indicator of socioeconomic status captures
the extent of concentrated disadvantage in counties. To construct this measure a factor analysis of the
following variables was conducted: percentage of families below the poverty line, percentage of
unemployed individuals in the civilian labor force, percentage of female-headed households with children
under the age of 18, and the percentage of individuals receiving public assistance. Factor analysis
indicated that all items loaded strongly on one component (alpha = .85). Regression scores were saved
and are used in the analyses below.
2 This was the original PGIS definition of terrorism applied from 1970 to 1997. When data collection was taken over by START in 2005, researchers required that two of the following three criteria also had to be met for inclusion in the database: (1) the violent act was aimed at attaining a political, economic, religious, or social goal; (2) the violent act included evidence of an intention to coerce, intimidate, or convey some other message to a larger audience (or audiences) other than the immediate victims; and (3) the violent act was outside the precepts of International Humanitarian Law. These criteria were constructed to allow analysts and scholars flexibility in applying various definitions of terrorism to meet different operational needs. The data presented in this report include all cases that meet any two of these three criteria.

National Consortium for the Study of Terrorism and Responses to Terrorism
A Department of Homeland Security Science and Technology Center of Excellence
County-level Correlates of Terrorism in the United States, 1990-2010 11
Residential Instability. Two variables are used to measure the level of residential instability in a county:
percentage of 5-year-old or older residents who resided in the same household for five or more years
prior to the survey and the percentage of owner-occupied housing units in the county. These two items
are significantly correlated (r = .20; p = .000). Regression scores were saved and are used in the analyses
below.
Ethnic Heterogeneity. Following Graif and Sampson (2010), we argue that a more valid measure of the
heterogeneity construct is the diversity of language use in a community. For instance, a large portion of
the population of a county may be foreign-born, but if all the foreign-born in the county are from Mexico,
then the county is very ethnically homogeneous. However, if foreign-born in the county are from various
countries, then that county is ethnically heterogeneous.
Our measure of language diversity refers to the language spoken at home. The language diversity
measures available to us from the Census varied somewhat for the 1990s and the first decade of the 21st
century. For the 1990s, our measure of language diversity captures 29 different languages.3 In 2000, the
U.S. Census increased the number of languages captured by this measure to 40.4 Language diversity is
calculated using the Herfindahl formula:
(∑ )
where t is the county, r is a particular language group in that county, πr is the proportion of the population
speaking that language in the county. Language diversity ranges from 0 to 1, where 0 indicates that the
same language is spoken at home by all residents in the county. As the language diversity measure
increases it indicates an increase in the proportion of the county’s population that speaks different
languages. In these data, language heterogeneity ranges from a high of .65 to a low of 0 (mean = .12). The
top 5 most diverse areas in 1990 include: Queens, NY; San Francisco County, CA; Hudson County, NJ;
Cibola County, NM; and Los Angeles County, CA. There is evidence of both stability and change looking at
the most diverse counties in 2000 which include: Queens, NY; Kings, NY; Hudson County, NJ; Santa Clara
County, CA; and San Francisco County, CA.
In addition, we use the traditional measure of ethnic heterogeneity – percentage of the population that is
foreign-born – in our analytic models. Counties range from a high of 45% of the population reporting
being born outside the United States to a low of 0% (mean = 2%). The five counties with the highest
proportion of foreign-born in 1990 include: Miami-Dade County, FL; Santa Cruz County, AZ; Queens, NY; 3 These languages include English, Spanish or Spanish Creole, French, (including Patios and Cajun), French Creole, Italian,
Portuguese or Portuguese Creole, German, Yiddish, other West Germanic languages, Scandinavian, Greek, Russian, Polish,
other Slavic languages, Indo-European languages, Chinese, Japanese, Korean, Mon-Khmer and Cambodian, Vietnamese,
Tagalog, Hungarian, and Arabic. 4 These languages include English, Spanish or Spanish Creole, French, (including Patios and Cajun), French Creole, Italian,
Portuguese or Portuguese Creole, German, Yiddish, other West Germanic languages, Scandinavian, Greek, Russian, Polish,
Serbo-Croatian, other Slavic languages, Armenian, Persian, Gujarathi, Hindi, Urdu, other Indic languages, Indo-European
languages, Chinese, Japanese, Korean, Mon-Khmer and Cambodian, Miao and Hmong, Thai, Laotian, Vietnamese, other Asian
languages, Tagalog, other Asian Pacific Island languages, Navajo, other native North American languages, Hungarian, Arabic,
Hebrew, and African languages.

National Consortium for the Study of Terrorism and Responses to Terrorism
A Department of Homeland Security Science and Technology Center of Excellence
County-level Correlates of Terrorism in the United States, 1990-2010 12
Maverick County, TX; and Starr County, TX. In 2000, the five counties with the highest proportion of
foreign-born residents include: Miami-Dade County, FL; Queens, NY; Hudson County, NJ; Kings, NY; and
Maverick County, TX.
Demographic Variables. The racial and ethnic composition of each county was measured using variables
capturing the proportion of the population that is non-Hispanic black, non-Hispanic Asian, non-Hispanic
white, and Hispanic in a county. We also include the percentage of the population that is male, age 15 to
24 years.
Time. We include two measures reflecting dimensions of time. The first is a measure capturing the 21
years of data examined in these models (‘year’). The second variable, post-2001, is coded 0 in years 1990
to 2000 and coded 1 in years 2001 to 2010 and is used to examine differences in the 1990-2000 time
period compared to the 2001-2010 time period.
Controls. We control for a number of general county-level characteristics including the total population
(lagged due to extreme values), the geographic size or land area of each county, and if the county was the
borough of Manhattan, NY. This final variable is important to include as a large portion of terrorist
attacks occur in Manhattan, and we wanted to ensure that our findings were not driven by the attacks in
this one location.
Methodology
Research Question 1: To what extent is terrorism concentrated across U.S. counties?
As noted above, we provided detailed information about the distribution of terrorism by county in the
United States between 1970 to 2008 in LaFree and Bersani (2012). In this report we focus on the data
that will be used for the multivariate analysis, covering 1990 to 2010. To examine patterns of terrorism
across U.S. counties from 1990 to 2010, yearly data on the frequency of events in each county were used
to create proportional symbol maps using ESRI ArcGIS v9.3 software.
Research Question 2: What is the geographic profile of the ‘typical’ U.S. county that experienced a
terrorist attack between 1990 and 2010?
While previous research demonstrated that place matters when thinking about terrorism in that certain
counties can be identified as hot spots of terrorism between 1970 and 2008, research also finds that
terrorism is widely dispersed with no U.S. state immune to terrorist attacks. Using information on county
characteristics, we describe the characteristics of an average county that experienced at least one
terrorist attack between 1990 and 2010. We also disaggregate by decade to investigate whether the
typical profile of a targeted county has significantly changed over this time period by conducting mean
difference tests comparing the two decades included in the analysis (i.e., 1991 to 2000 and 2001 to
2010). The selection of the two time periods of comparison was chosen for two main reasons. First,

National Consortium for the Study of Terrorism and Responses to Terrorism
A Department of Homeland Security Science and Technology Center of Excellence
County-level Correlates of Terrorism in the United States, 1990-2010 13
because the census predictors come from 1990 and 2000, we used years following those data collection
points to ensure correct temporal ordering between our county-level variables and terrorism. Second,
this cut point strategy works well in our comparison of the average characteristics of counties that were
targets of terrorist attacks before and after September 11, 2001 with an equitable distribution of years
preceding and following these events.
Research Question 3: Do traditional predictors of crime (e.g., concentrated disadvantage,
residential instability, demographic composition) also predict geographic concentrations of
terrorist attacks?
During the past year, we were able to locate and code complete data for the key theoretical measures
described above for an additional decade, which allowed us to extend our analysis of the correlates of
terrorism from 1990 to 2010. We examine the relationship between these county-level predictors and
terrorism in two steps. For the first part of the analysis we sum all terrorism in the United States during
the two periods of interest (1991 to 2000; 2001 to 2010) into a single indicator measuring the total
number of terrorist attacks per period and assess the bivariate relationships between these indicators
and each predictor taken separately. Next, we conduct a series of longitudinal regression models to more
accurately test whether ecological characteristics measured at the U.S. county-level are predictive of
terrorist attacks that occurred each year. To do so we employ Poisson-based regression models because
of the count nature of the dependent variable (frequency of attacks in each county) and the high
frequency of zeros (no terrorist attacks in a county) in these data (Osgood 2000). Additionally, because of
the structure of the data, where counties have 21 years of observations, the data are considered nested or
clustered. Clustered data negatively influence statistical models by resulting in incorrect (smaller)
estimates of the standard errors and an increase in the likelihood of concluding that a relationship exists
that really doesn’t (a type 1 error or a false positive). We employ a hierarchical modeling strategy that
can accommodate the clustered nature of these data and allow us to examine trends in terrorism at the
county level over time. For these analyses, the county-level independent variables were all measured in
1990.
Results
Before proceeding to the findings for the research questions posed above, we first present basic
descriptive information regarding the number of terrorist attacks in the United States from 1990 to 2010.
It is clear from the pattern shown in Figure 1 that the total number of terrorist attacks in general has
decreased significantly from 1990 to 2010. Whereas nearly 350 attacks took place in the 1990s (n =
348), this number dropped by nearly half in the following decade (from 2000 to 2010, n = 233). While
the absolute number of attacks has clearly dropped, questions remain as to the source of the reduction
and to what extent the profile of terrorism has changed in the recent decade compared to the previous
decade.

National Consortium for the Study of Terrorism and Responses to Terrorism
A Department of Homeland Security Science and Technology Center of Excellence
County-level Correlates of Terrorism in the United States, 1990-2010 14
Figure 1. Number of Terrorist Attacks in the U.S., 1990 - 2010
Research Question 1: To what extent is terrorism concentrated across U.S. counties?
Proportional symbol maps were created to visually display the concentration of terrorist attacks across
U.S. counties in the 48 contiguous states (the GTD included no terrorist attacks for either Alaska or
Hawaii during the 1990 through 2010 time period). The findings shown in Figure 2 span the period from
1990 through to 2010. The size of the dots is proportional to the number of events taking place in an
area (larger dots representing a higher frequency of events). Two patterns are clear from Figure 2: (1) a
small number of counties account for a large portion of U.S. terrorist attacks, and (2) the impact of
terrorist attacks is felt across the entire United States as terrorist attacks have occurred in each state.
0
10
20
30
40
50
60
70
Nu
mb
er
of
Terr
ori
st A
ttac
ks
Calendar Year
Frequency of Terrorist Activity in the United States, 1990-2010

National Consortium for the Study of Terrorism and Responses to Terrorism
A Department of Homeland Security Science and Technology Center of Excellence
County-level Correlates of Terrorism in the United States, 1990-2010 15
Figure 2. Geographic Concentration of Terrorist Attacks in the U.S., 1990 – 2010
Out of the 581 attacks experienced from 1990 to 2010, a quarter of all attacks took place in just 10
counties. The largest number of attacks occurred in New York County, NY (Manhattan) (n = 30), followed
by Los Angeles County, CA (n = 19), San Diego County, CA (n = 16), Washington, D.C. (n = 15), Miami-Dade
County, FL (n = 14), Bernalillo County, NM (n = 13), Maricopa County, AZ (n = 12), King County, WA (n =
9), Lane County, OR (n = 8), and Tulsa County, OK (n = 8).
Research Question 2: What is the geographic profile of the ‘typical’ U.S. county that experienced a
terrorist attack from 1990 to 2010?
We leverage information garnered from criminological work examining the ecological distribution of
crime to explore variables that may help explain the similarities and differences in the geographic
profiles of counties that experienced terrorist attacks between 1990 and 2010. We report the means and
standard deviation values for the characteristics of counties that were and were not targeted by
terrorism in between 1990 and 2000 in Table 1 and between 2001 and 2010 in Table 2. Significant
differences in the characteristics of counties that did and did not report a terrorist attack during these
years are indicated in the final column of Tables 1 and 2. According to Table 1, in the 1990s larger
counties, counties with a higher proportion of Asians, Hispanics, and foreign-born residents, counties

National Consortium for the Study of Terrorism and Responses to Terrorism
A Department of Homeland Security Science and Technology Center of Excellence
County-level Correlates of Terrorism in the United States, 1990-2010 16
with more residential instability, and counties with greater language diversity were significantly more
likely to have experienced a terrorist attack. Conversely, counties with a higher proportion of white
residents and counties with higher levels of concentrated disadvantage were less likely on average to
experience a terrorist attack.
Table 1. Means Differences in Characteristics Comparing U.S. Counties that Experienced a
Terrorist Attack with Counties that did not Experience a Terrorist Attack, 1990 - 2000
Mean SD Mean SD
Total Population 51936.91 1.13E-05 534209.70 8.90E-05 ***
Percent Male Ages 15 to 24 21.87 3.13 21.81 3.56
Percent White, Non-Hispanic 85.11 18.21 77.42 17.96 ***
Percent Black, Non-Hispanic 8.40 14.35 10.46 13.88
Percent Asian, Non-Hispanic 0.58 2.79 2.86 3.81 ***
Percent Hispanic 4.21 11.01 8.63 12.37 ***
Concentrated Disadvantage 0.01 1.01 -0.20 0.71 **
Residential Instability -0.08 0.95 1.22 0.98 ***
Percent Foreign-born 1.96 3.06 6.77 7.28 ***
Language Diversity 0.11 0.11 0.20 0.14 ***
No Terrorist Attack Terrorist AttackMeans
Difference
Test
*** p < .001.
A similar pattern of results is observed when we compare counties with no incidents of terrorism in the
first decade of the 21st century with counties experiencing at least one attack in that time period;
however two new results emerge in the more recent decade. First, counties with a higher proportion of
young males ages 15 to 24 years were more likely to experience a terrorist attack. Second, we find no
significant difference comparing counties by level of concentrated disadvantage.
Table 2. Means Differences in Characteristics Comparing U.S. Counties that Experienced a
Terrorist Attack with Counties that did not Experience a Terrorist Attack, 2001 - 2010
Mean SD Mean SD
Total Population 69126.28 1.66E-05 653344.77 1.17E-06 ***
Percent Male Ages 15 to 24 14.22 3.44 15.35 4.48 ***
Percent White, Non-Hispanic 81.73 19.01 73.68 18.83 ***
Percent Black, Non-Hispanic 8.67 14.51 9.92 12.82
Percent Asian, Non-Hispanic 0.79 2.04 3.29 4.06 ***
Percent Hispanic 6.01 11.94 10.94 12.69 ***
Concentrated Disadvantage 0.00 1.01 -0.04 0.84
Residential Instability -0.04 0.97 1.14 1.18 ***
Percent Foreign-born 3.25 4.45 9.63 9.59 ***
Language Diversity 0.13 0.12 0.25 0.16 ***
No Terrorist Attack Terrorist AttackMeans
Difference
Test
*** p < .001.
National Consortium for the Study of Terrorism and Responses to Terrorism
A Department of Homeland Security Science and Technology Center of Excellence
County-level Correlates of Terrorism in the United States, 1990-2010 17
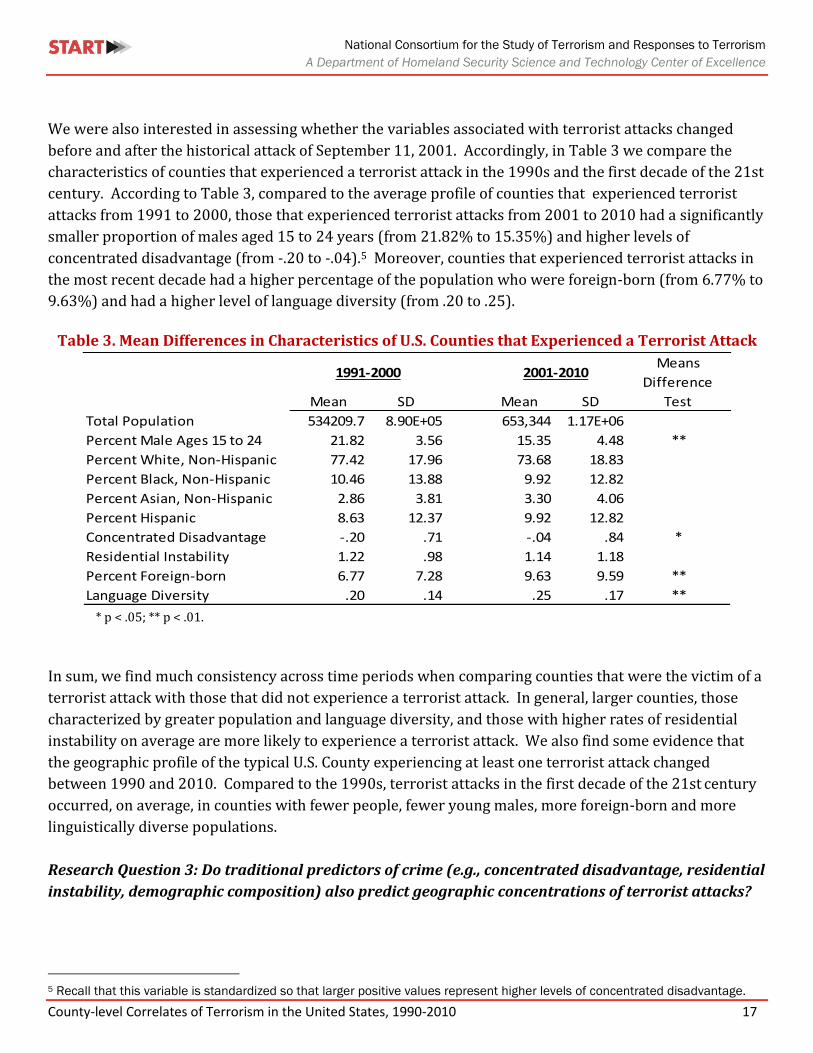
We were also interested in assessing whether the variables associated with terrorist attacks changed
before and after the historical attack of September 11, 2001. Accordingly, in Table 3 we compare the
characteristics of counties that experienced a terrorist attack in the 1990s and the first decade of the 21st
century. According to Table 3, compared to the average profile of counties that experienced terrorist
attacks from 1991 to 2000, those that experienced terrorist attacks from 2001 to 2010 had a significantly
smaller proportion of males aged 15 to 24 years (from 21.82% to 15.35%) and higher levels of
concentrated disadvantage (from -.20 to -.04).5 Moreover, counties that experienced terrorist attacks in
the most recent decade had a higher percentage of the population who were foreign-born (from 6.77% to
9.63%) and had a higher level of language diversity (from .20 to .25).
Table 3. Mean Differences in Characteristics of U.S. Counties that Experienced a Terrorist Attack
Mean SD Mean SD
Total Population 534209.7 8.90E+05 653,344 1.17E+06
Percent Male Ages 15 to 24 21.82 3.56 15.35 4.48 **
Percent White, Non-Hispanic 77.42 17.96 73.68 18.83
Percent Black, Non-Hispanic 10.46 13.88 9.92 12.82
Percent Asian, Non-Hispanic 2.86 3.81 3.30 4.06
Percent Hispanic 8.63 12.37 9.92 12.82
Concentrated Disadvantage -.20 .71 -.04 .84 *
Residential Instability 1.22 .98 1.14 1.18
Percent Foreign-born 6.77 7.28 9.63 9.59 **
Language Diversity .20 .14 .25 .17 **
1991-2000 2001-2010Means
Difference
Test
* p < .05; ** p < .01.
In sum, we find much consistency across time periods when comparing counties that were the victim of a
terrorist attack with those that did not experience a terrorist attack. In general, larger counties, those
characterized by greater population and language diversity, and those with higher rates of residential
instability on average are more likely to experience a terrorist attack. We also find some evidence that
the geographic profile of the typical U.S. County experiencing at least one terrorist attack changed
between 1990 and 2010. Compared to the 1990s, terrorist attacks in the first decade of the 21st century
occurred, on average, in counties with fewer people, fewer young males, more foreign-born and more
linguistically diverse populations.
Research Question 3: Do traditional predictors of crime (e.g., concentrated disadvantage, residential
instability, demographic composition) also predict geographic concentrations of terrorist attacks?
5 Recall that this variable is standardized so that larger positive values represent higher levels of concentrated disadvantage.
National Consortium for the Study of Terrorism and Responses to Terrorism
A Department of Homeland Security Science and Technology Center of Excellence
County-level Correlates of Terrorism in the United States, 1990-2010 18
The final question we addressed in this research was whether traditional aggregate-level predictors of
ordinary crime (e.g., concentrated disadvantage, residential instability, population heterogeneity, and
demographic composition) also predict terrorist attacks. We examined the relationship between the
independent variables and the frequency (count) of terrorist attacks in a multivariate framework. A
multivariate framework allows for the simultaneous observation of relationships between sets of
independent variables and the outcome of interest, terrorist attacks. This form of analysis is more
rigorous than examining associations between variables because it controls for the effects of a set of
alternative explanations. Because we examine the frequency or count of terrorist attacks in each county-
year, we estimated Poisson regression models (Allison 1999).6 In addition, we utilize a statistical
strategy that models annual county-year trends (i.e., trends by county by year) in the frequency of
terrorist attacks over the two-decade period while also accounting for the fact that many terrorist events
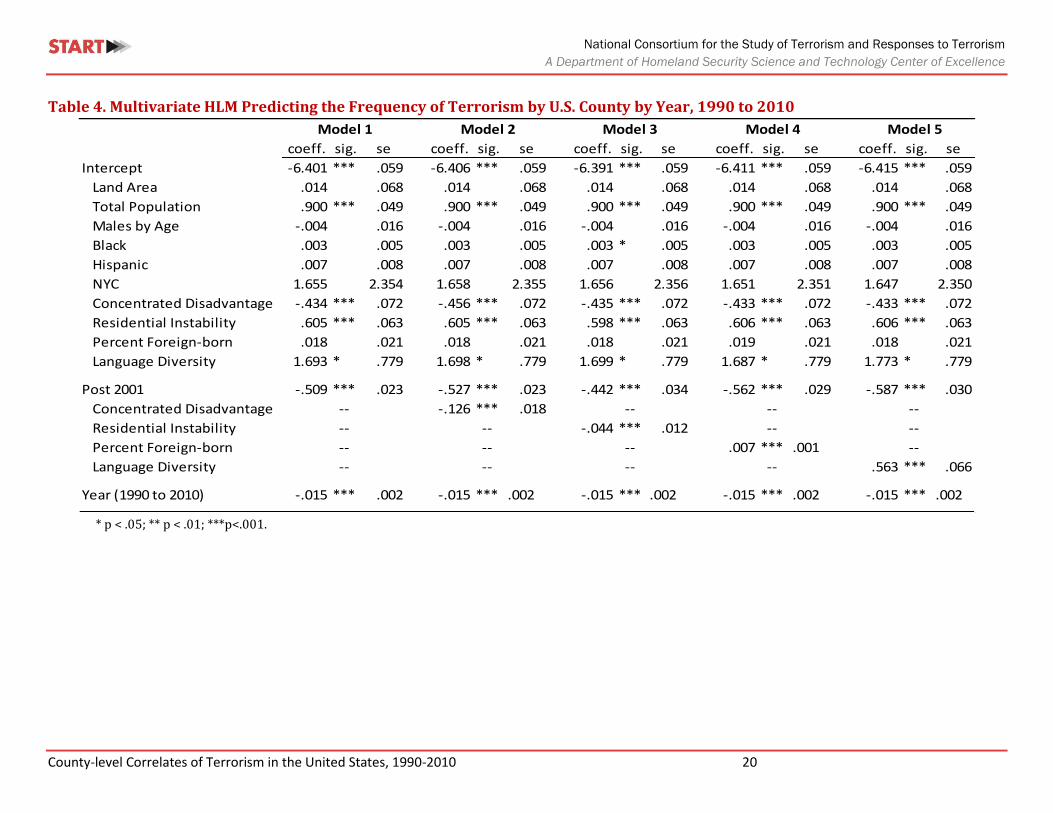
cluster in the same counties. We present the results of the longitudinal multivariate analyses in Table 4.
In Model 1 in Table 4 we first present the results examining the relationship between traditional social
disorganization variables and the frequency of terrorism across county-years from 1990 to 2010. The
findings demonstrate a significant statistical relationship between the frequency of terrorism in U.S.
counties and measures of total population, concentrated disadvantage, residential instability, and
language diversity. Compared to counties with smaller total populations, counties with larger total
populations have a higher rate of terrorism, holding all other variables in the model constant. According
to Table 4, counties with higher levels of concentrated disadvantage have a lower expected rate of
terrorism. While the negative finding for concentrated disadvantage is counter to what we would expect
based on theories drawn from the ordinary crime literature, this finding is consistent with other research
examining community correlates of terrorism (Krueger and Maleckova, 2003; for a review, see LaFree
and Ackerman, 2009). Moreover, it is worth pointing out that whereas most of the previous research
examining the relationship between concentrated disadvantage and ordinary crime is conducted at a
neighborhood or city level, the current research was conducted at a higher level of aggregation (i.e.,
county level) which may account in part or in total for the disparate findings.
The results also demonstrate that compared to counties with less residential instability, counties with
greater residential instability have a higher rate of terrorism. These results are consistent with our
theoretical expectations and track previous findings from the criminology literature for ordinary crime.
Additionally, compared to counties with less language diversity, counties with greater language diversity
have a higher rate of terrorism.
Model 1, Table 4 also shows a statistically significant change in the expected rate of terrorism in the
period from 2001 to 2010. Specifically, post-2001 the rate of terrorism declined compared to the 1990 to
6 A Poisson distribution is appropriate in this case because many U.S. counties never experience a terrorist attack during the period spanned by these data. Additionally, while there are a sizeable number of counties that experience one attack, a rapidly declining number experience successively higher numbers of attacks. The high rate of zero cases combined with a rapid decline in the number of attacks can complicate the interpretation of statistical analyses when using ordinary least squares regression methods. The Poisson regression models used here are better suited for handling this particular type of distribution (see Allison 1999).

National Consortium for the Study of Terrorism and Responses to Terrorism
A Department of Homeland Security Science and Technology Center of Excellence
County-level Correlates of Terrorism in the United States, 1990-2010 19
2000 time period. While we look at annual rates, this finding does support arguments suggesting a
change in the dynamics of terrorism following the September 11, 2001 attacks. In the series of analyses
that follow, we further investigated this change by examining whether the expected reduction in
terrorism was felt similarly across all U.S. counties or whether certain counties differentially benefitted
from this reduction. To do so, we examine a series of interactions between our key theoretical constructs
of interest (i.e., concentrated disadvantage, residential instability, percent foreign-born, and language
diversity) and the post-2001 dummy variable. The results of these analyses are presented in Table 4,
Models 2 through 5, beginning on the next page.
National Consortium for the Study of Terrorism and Responses to Terrorism
A Department of Homeland Security Science and Technology Center of Excellence
County-level Correlates of Terrorism in the United States, 1990-2010 20
Table 4. Multivariate HLM Predicting the Frequency of Terrorism by U.S. County by Year, 1990 to 2010
coeff. sig. se coeff. sig. se coeff. sig. se coeff. sig. se coeff. sig. se
Intercept -6.401 *** .059 -6.406 *** .059 -6.391 *** .059 -6.411 *** .059 -6.415 *** .059
Land Area .014 .068 .014 .068 .014 .068 .014 .068 .014 .068
Total Population .900 *** .049 .900 *** .049 .900 *** .049 .900 *** .049 .900 *** .049
Males by Age -.004 .016 -.004 .016 -.004 .016 -.004 .016 -.004 .016
Black .003 .005 .003 .005 .003 * .005 .003 .005 .003 .005
Hispanic .007 .008 .007 .008 .007 .008 .007 .008 .007 .008
NYC 1.655 2.354 1.658 2.355 1.656 2.356 1.651 2.351 1.647 2.350
Concentrated Disadvantage -.434 *** .072 -.456 *** .072 -.435 *** .072 -.433 *** .072 -.433 *** .072
Residential Instability .605 *** .063 .605 *** .063 .598 *** .063 .606 *** .063 .606 *** .063
Percent Foreign-born .018 .021 .018 .021 .018 .021 .019 .021 .018 .021
Language Diversity 1.693 * .779 1.698 * .779 1.699 * .779 1.687 * .779 1.773 * .779
Post 2001 -.509 *** .023 -.527 *** .023 -.442 *** .034 -.562 *** .029 -.587 *** .030
Concentrated Disadvantage -.126 *** .018
Residential Instability -.044 *** .012
Percent Foreign-born .007 *** .001
Language Diversity .563 *** .066
Year (1990 to 2010) -.015 *** .002 -.015 *** .002 -.015 *** .002 -.015 *** .002 -.015 *** .002
Model 1 Model 5Model 2 Model 3 Model 4
--
--
--
--
--
----
--
--
--
--
--
--
-- --
--
* p < .05; ** p < .01; ***p<.001.
National Consortium for the Study of Terrorism and Responses to Terrorism
A Department of Homeland Security Science and Technology Center of Excellence
County-level Correlates of Terrorism in the United States, 1990-2010 21
In Model 2, we first add the post-2001 dummy variable and interact it with the concentrated
disadvantage measure. The results show that this interaction is significant and in the negative direction.
The negative effect of concentrated disadvantage along with the negative effect of post-2001 suggests
that the post-2001 reduction in the frequency of terrorism was greatest in areas defined by higher levels
of concentrated disadvantage. More specifically, in areas of average level disadvantage, there was a 41%
reduction (1 – exponentiation (-.527)) in the rate of terrorism after 2001. A one unit increase in
concentrated disadvantage increases the reduction in the rate of terrorism after 2001 to 48% (1 –
exponentiation (-.527 + -.126)). In other words, although in general concentrated disadvantage was
associated with a lower frequency of terrorism, the relationship between concentrated disadvantage and
the frequency of terrorism was stronger between 2001 and 2010.
A similar pattern is observed in Model 3 when we look at the interaction between residential instability
and the post-2001 dummy variable. The interaction is significant and in the negative direction
suggesting that the reduction in the frequency of terrorism was greatest in areas defined by higher levels
of residential instability. Counties characterized by an average level of instability saw a 36% reduction
(1 – exponentiation (-.442)) in the frequency of terrorism post-2001. A one unit increase in residential
instability is associated with a 39% reduction (1 – exponentiation (-.442 + -.044)) in the frequency of
terrorism in the post-2001 time period. In other words, in general residential instability is associated
with a higher frequency of terrorism. However, this effect is weaker between 2001 and 2010.
The interactions of percent foreign-born (Model 4) and language diversity (Model 5) with post-2001 are
both significant and in the positive direction. The positive direction of the effect indicates that counties
characterized by higher levels of foreign-born population and/or language diversity had a smaller
reduction in the frequency of terrorism in the post-2001 time period. Counties characterized by average
levels of foreign-born population saw a 43% reduction (1 – exponentiation (-.562)) in the frequency of
terrorism post-2001. A one unit increase in the percentage of foreign-born population is associated with
a 42% reduction (1 – exponentiation (-.562 + .007)) in the frequency of terrorism. This difference, though
statistically significant, is relatively modest. In general, percent foreign-born did not have a significant
effect on the frequency of terrorism, but its effect was significantly greater between 2001 and 2010.
Conversely, the differences observed when looking at the influence of language diversity are more
substantial. Counties characterized by average levels of language diversity saw a 44% reduction (1 –
exponentiation (-.587)) in the rate of terrorism in the post-2001 time period. Compare this to counties
characterized by a one unit increase in language diversity which saw only a 2% reduction (1 –
exponentiation (-.587 + .563)) in the rate of terrorism post-2001. In other words, greater language
diversity was associated overall with higher frequencies of terrorism, and this relationship was
significantly stronger between 2001 and 2010.
In sum, the results from the interaction analyses indicate that the reduction in the expected count of
terrorist attacks was not equally felt across all U.S. counties. Rather, certain counties, specifically those
characterized by higher levels of concentrated disadvantage and residential instability saw a larger
reduction in the rate of terrorism between 2001 and 2010 whereas counties characterized by higher

National Consortium for the Study of Terrorism and Responses to Terrorism
A Department of Homeland Security Science and Technology Center of Excellence
County-level Correlates of Terrorism in the United States, 1990-2010 22
proportions of foreign-born population and language diversity saw a smaller reduction in the rate of
terrorism between 2001 and 2010.
Conclusions
The goal of this research was to build on our previous work (LaFree and Bersani, 2012) by extending our
multivariate analysis of terrorism from eight years (2000 to 2007) to 21 years (1990 to 2010). We began
by examining descriptive patterns in terrorism over time and across counties. While terrorism has
received much public attention, the patterns documented here show that U.S. terrorist attacks have been
relatively infrequent in the last decade. While it is encouraging to find that terrorist attacks are down
from the highs experienced in the 1970s and have maintained a low level for some time, as observed in
our earlier report (LaFree and Bersani 2012), the rise in the likelihood of fatalities among recent terrorist
attacks warrants continued attention (in 2001 and 2007 a quarter of all terrorist attacks were fatal).
One of the main strategies we used in this report was to examine the extent to which rates of county-level
terrorist attacks could be accurately predicted by using variables commonly used to predict ordinary
crime rates. In general, we found both similarities and differences in terms of the best predictors of
terrorism and more ordinary crime. Similar to ordinary crime, terrorist attacks have been concentrated
in large metropolitan areas such as Los Angeles County, CA, Miami-Dade County, FL, and New York
County, NY (Manhattan). The clustering of terrorist attacks in large urban areas was consistently
documented across the entire 1990 to 2010 time period. A long history of criminological research has
documented a strong relationship between ecological variables and ordinary crime. Specifically, drawing
upon the preeminent theoretical work of Shaw and McKay and contemporary extensions of their
ecological theory, we examined whether differences in socio-economic status, residential stability, and
population heterogeneity distinguished counties that experienced terrorism.
Consistent with findings related to ordinary crime, areas characterized by higher rates of residential
instability face larger numbers of terrorist attacks. This effect is significant for the full period between
1990 and 2010 and for the first decade of the 21st century. It is in the same direction and nearly
significant for the 1990s. Compared to less residentially stable areas, those that are more residentially
stable may benefit from stronger social ties and more consistent norms.
For both the 1990s and the first decade of the 21st century, counties with a higher proportion of foreign-
born citizens have higher rates of terrorism. However, when included in the multivariate analysis,
percent foreign-born is not a statistically significant indicator of terrorism rates. This is most likely due
to the fact that percent foreign-born is highly correlated with both residential instability and language
diversity. This finding is also similar to other findings in the criminological literature where the evidence
of a link between percent foreign-born and crime disappears when other variables are controlled.
The demographic results were also somewhat in line with results from the analysis of ordinary crimes.
Thus, as with county-level analysis of crime, counties with larger populations have significantly higher

National Consortium for the Study of Terrorism and Responses to Terrorism
A Department of Homeland Security Science and Technology Center of Excellence
County-level Correlates of Terrorism in the United States, 1990-2010 23
rates of terrorism in the 1990s, in the first decade of the 21st century, and for the full period between
1990 and 2010. Also, consistent with the analysis of ordinary crime, counties with a higher proportion of
young men aged 15-24 had higher rates of terrorism in the 1990s and the first decade of the 21st century.
However, this variable was not significant when included in the multivariate models.
We also found important differences between terrorism and ordinary crime. To begin with, and counter
to traditional ecological theory in criminology, whereas socioeconomic status, and specifically
concentrated disadvantage, evidences a robust positive relationship with ordinary crime, our measure of
concentrated disadvantage had a very different relationship with terrorism. Overall, more economically
disadvantaged counties had lower than expected rates of terrorism. Further analysis showed that this
relationship is being driven especially by terrorism in the 1990s. Generally, concentrated disadvantage is
associated with lower rates of terrorism in the 1990s and has no significant relationship to terrorism in
the first decade of the 21st century.
One of the innovations of this research is that we were able to include a county-level measure of language
diversity in the analysis—which has been rare in criminology research. Most prior research has used
percent foreign-born as a measure of ethnic heterogeneity. In our analysis, we find that compared to
percent foreign-born, language diversity has a more consistent effect on the terrorism measure. While
counties with a higher percent foreign-born had higher rates of terrorism for both the 1990s and 2000s,
percent foreign-born was not statistically significant when we controlled for the other variables in our
models. Our language diversity measure includes 29 different languages in the 1990s analysis and 40
different languages in the analysis of the first decade of the 21st century. In contrast to percent foreign-
born, language diversity has a very consistent effect on terrorism rates: greater county-level language
diversity is associated with higher rates of terrorism in the 1990s, the first decade of the 21st century,
and for both decades combined.
Finally, the results of our research demonstrate that while there was a significant reduction in the
frequency of terrorism in the first decade of the 21st century, the reduction was differentially felt across
U.S. counties. Counties characterized by high levels of concentrated disadvantage and residential
instability saw the greatest reduction in the rate of terrorism in the last decade. Counties characterized
by high levels of foreign-born population and language diversity saw less reduction in the rate of
terrorism between 2001 and 2010. We find these last findings intriguing and are very interested in
exploring them further in future research.
National Consortium for the Study of Terrorism and Responses to Terrorism
A Department of Homeland Security Science and Technology Center of Excellence
County-level Correlates of Terrorism in the United States, 1990-2010 24
References
Allison, P. Logistic Regression Using the SAS System: Theory and Application. 1999. New York: SAS.
Bellair, P. E. 1997. Social interaction and community crime: Examining the importance of neighbor
networks. Criminology, 35: 677-703.
Clarke R.V, and G.R. Newman 2006. Outsmarting the Terrorists. New York: Praeger.
Dahl, E. 2011. "The Plots That Failed: Intelligence Lessons Learned from Unsuccessful Terrorist Attacks
against the United States." Studies in Conflict and Terrorism , 34: 621-648.Fischer, C. 1975. Toward a
Subcultural Theory of Urbanism. American Journal of Sociology 80: 1319-1341.
Graif, C. and R. J. Sampson. 2010. Spatial Heterogeneity in the Effects of Immigration and Diversity on
Neighborhood Homicide Rates. Homicide Studies 13:242-260.
Krivo, L. J. and R. D. Peterson. 1996. Extremely disadvantaged neighborhoods and urban crime. Social
Forces 75 2: 619-648.
Krueger, A.B. and J. Maleckova. 2003. Education, Poverty, and Terrorism: Is there a Causal Connection?
Journal of Economic Perspectives 17:119-44.
Kubrin, C. E. and R. Weitzer 2003. Retaliatory Homicide: Concentrated Disadvantage and Neighborhood
Crime. Social Problems 50:157-180.
Gary LaFree and Bianca Bersani, Hot Spots of Terrorism and Other Crimes in the United States, 1970 to
2008. Project report to Human Factors/Behavioral Science Division, US Department of Homeland
Security, January 24, 2012.
LaFree, G. and G. Ackerman. 2009. The Empirical Study of Terrorism: Social and Legal Research. Annual
Review of Law and Social Science 5:12.1-12.28.
LaFree, G. and L. Dugan. 2009. Research on Terrorism and Countering Terrorism. In Crime and Justice: A
Review of Research, M. Tonry (ed.) Chicago: University of Chicago Press 38: 413-477.
LaFree, G. and L. Dugan. 2004. How Does Studying Terrorism Compare to Studying Crime? In M. DeFlem
(ed.), Criminology and Terrorism. Elsevier.
Lazear, E.P. 1999. Culture and Language. Journal of Political Economy 107(suppl. 6):95-125.

National Consortium for the Study of Terrorism and Responses to Terrorism
A Department of Homeland Security Science and Technology Center of Excellence
County-level Correlates of Terrorism in the United States, 1990-2010 25
Martinez, R, Jr., J.I. Stowell, and M.T. Lee. 2010. Immigration and Crime in an Era of Transformation: A
Longitudinal Analysis of Homicides in San Diego Neighborhoods, 1980-2000. Criminology 48:797-829.
McNulty, T. L. 1999. The Residential Process and the Ecological Concentration of Race, Poverty, and
Violent Crime in New York City. Sociological Focus 32:25-42.
Morenoff, J.D., R.J. Sampson and S.W. Raudenbush 2001. Neighborhood Inequality, Collective Efficacy, and
the Spatial Dynamics of Urban Violence. Criminology 39:517-560.
Osgood, D.W. 2000. Poisson-Based Regression Analysis of Aggregate Crime Rates.
Journal of Quantitative Criminology 16:21-43.
Ousey, G.C. and C.E Kubrin. 2009. Exploring the Connection between Immigration and Violent Crime
Rates in U.S. Cities, 1980-2000. Social Problems 56:447-473.
Pape, R. A. 2005. Dying to Win. New York: Random House.
Putnam, R.D. 2007. E Pluribus Unum: Diversity and Community in the Twenty-first Century: The 2006
Johan Skytte Prize Lecture. Scandinavian Political Studies 30:137–174.
Reid, L., H.E.Weiss, R.M. Adelman, & C. Jaret. 2005. The Immigration-Crime Relationship: Evidence across
U.S. Metropolitan Areas. Social Science Research 34:757-780.
Rosenfeld, R. 2004. Terrorism and Criminology. In M. Deflem (ed.) Terrorism and Counter-Terrorism:
Criminological Perspectives. Amsterdam: Elsevier, 19-32.
Russell, C.A. and B.H. Miller. 1977. Profile of a terrorist. Military Review 57:21-34.
Sageman, M. 2004. Understanding Terror Networks. Philadelphia: University of Pennsylvania Press.
Sampson, R. J. 2008. Rethinking Immigration and Crime. Contexts 7:28-33.
Sampson, R. J. and W. B. Groves. 1989. Community Structure and Crime: Testing
Social-Disorganization Theory. American Journal of Sociology 94:774-802.
Sampson, R.J. and W.J. Wilson 1995. Toward a Theory of Race, Crime and Inequality. In J. Hagan R.
Peterson (eds.) Crime and Inequality. Stanford CA: Stanford Press.
Sampson, R.J., S.W. Raudenbush and F.Earls. 1997. Neighborhoods and Violent Crime: A
Multilevel Study of Collective Efficacy. Science 277:918-924.

National Consortium for the Study of Terrorism and Responses to Terrorism
A Department of Homeland Security Science and Technology Center of Excellence
County-level Correlates of Terrorism in the United States, 1990-2010 26
Sampson, R.J., J.D. Morenoff, and S. Raudenbush. 2005. Social Anatomy of Racial and Ethnic Disparities in
Violence. Public Health Matters 95:224-232.
Shaw, C.R., H.D. McKay and J.F. McDonald. 1938. Brothers in Crime. Chicago: University of Chicago Press.
Sherman, L. W. 1995. Hot Spots of Crime and Criminal Careers of Places. In R.V. Clarke (ed.). Crime and
Place: Crime Prevention Studies 4. Monsey, NY: Willow Tress Press.
Sherman L., P. Gartin, and M. Buerger. 1989. Hot Spots of Predatory Crime: Routine
Activities and the Criminology of Place. Criminology 27:27–55.
Shihadeh, E.S. and R.E. Barranco. 2010. Latino Immigration, Economic Deprivation, and Violence:
Regional Differences in the Effect of Linguistic Isolation. Homicide Studies 14:336-355.
Smith, B.L., C. Shields, and K. Damphousse. 2011. Patterns of Interventions in Federal Terrorism Cases.
Interim Report to Human Factors/Behavioral Sciences Division. College Park, MD: START Center.
Stowell, J. I., S. F. Messner, K. F. McGeever, and L. E. Raffalovich. 2009. Immigration and the Recent Violent
Crime Drop in the United States: A Pooled, Cross-Sectional Time-Series Analysis of Metropolitan Areas.
Criminology 47: 889-928.
Wadsworth, T. 2010. Is immigration responsible for the crime drop? An assessment of the
influence of immigration on changes in violent crime between 1990 and 2000. Social
Science Quarterly 91: 531-55.
Weisburd, D., S. Bushway, C. Lum, and S.M. Yang. 2004. Invariability and Variability of Crime at Place: A
Longitudinal Study of Street Segments in the City of Seattle. Criminology 42: 283-321.