country report - wikileaks india... · madgaon ... r. n a r m a d a r . r m a tapir. ... country...
TRANSCRIPT

Country Report
India
November 2011
Economist Intelligence Unit 26 Red Lion Square London WC1R 4HQ United Kingdom

Economist Intelligence Unit
The Economist Intelligence Unit is a specialist publisher serving companies establishing and managing operations across national borders. For 60 years it has been a source of information on business developments, economic and political trends, government regulations and corporate practice worldwide.
The Economist Intelligence Unit delivers its information in four ways: through its digital portfolio, where the latest analysis is updated daily; through printed subscription products ranging from newsletters to annual reference works; through research reports; and by organising seminars and presentations. The firm is a member of The Economist Group.
London Economist Intelligence Unit 26 Red Lion Square London WC1R 4HQ United Kingdom Tel: (44.20) 7576 8000 Fax: (44.20) 7576 8500 E-mail: [email protected]
New York Economist Intelligence Unit The Economist Group 750 Third Avenue 5th Floor New York, NY 10017, US Tel: (1.212) 554 0600 Fax: (1.212) 586 0248 E-mail: [email protected]
Hong Kong Economist Intelligence Unit 60/F, Central Plaza 18 Harbour Road Wanchai Hong Kong Tel: (852) 2585 3888 Fax: (852) 2802 7638 E-mail: [email protected]
Geneva Economist Intelligence Unit Boulevard des Tranchées 16 1206 Geneva Switzerland Tel: (41) 22 566 2470 Fax: (41) 22 346 93 47 E-mail: [email protected]
This report can be accessed electronically as soon as it is published by visiting store.eiu.com or by contacting a local sales representative.
The whole report may be viewed in PDF format, or can be navigated section-by-section by using the HTML links. In addition, the full archive of previous reports can be accessed in HTML or PDF format, and our search engine can be used to find content of interest quickly. Our automatic alerting service will send a notification via e-mail when new reports become available.
Copyright © 2011 The Economist Intelligence Unit Limited. All rights reserved. Neither this publication nor any part of it may be reproduced, stored in a retrieval system, or transmitted in any form or by any means, electronic, mechanical, by photocopy, recording or otherwise, without the prior permission of The Economist Intelligence Unit Limited.
All information in this report is verified to the best of the author's and the publisher's ability. However, the Economist Intelligence Unit does not accept responsibility for any loss arising from reliance on it.
ISSN 1473-8953
Symbols for tables �0 or 0.0� means nil or negligible; �n/a� means not available; ��� means not applicable
Printed and distributed by IntypeLibra, Units 3/4, Elm Grove Industrial Estate, Wimbledon, SW19 4HE

India 1
Country Report November 2011 www.eiu.com © The Economist Intelligence Unit Limited 2011
India
Executive summary 3 Highlights
Outlook for 2012-16 4 Political outlook 6 Economic policy outlook 7 Economic forecast
Monthly review: November 2011 12 The political scene 14 Economic policy 15 Economic performance
Data and charts 18 Annual data and forecast 19 Quarterly data 20 Monthly data 22 Annual trends charts 23 Quarterly trends charts 24 Monthly trends charts 25 Comparative economic indicators
Country snapshot 26 Basic data 27 Political structure
Editors: Anjalika Bardalai (editor); Ananda Guha (consulting editor)
Editorial closing date: October 25th 2011
All queries: Tel: (44.20) 7576 8000 E-mail: [email protected] Next report: To request the latest schedule, e-mail [email protected]

2 India
Country Report November 2011 www.eiu.com © The Economist Intelligence Unit Limited 2011
DarjilingDarjilingDarjeeling
PAKISTAN
CHINA
MYANMAR
SRILANKA
BANGLADESH
NEPAL
INDIAINDIAINDIA
ANDHRAANDHRAPRADESHPRADESHANDHRAPRADESH
ANDAMANAND NICOBAR
ISLANDSLAKSHADWEEP
KARNATAKAKARNATAKAKARNATAKA
MAHARASHTRAMAHARASHTRAMAHARASHTRA
GUJARATGUJARATGUJARAT
RAJASTHANRAJASTHANRAJASTHAN
PUNJABPUNJABPUNJAB
MADHYA PRADESHMADHYA PRADESHMADHYA PRADESH
CHHATTISGARHCHHATTISGARHCHHATTISGARH
ORISSA
BIHARBIHARBIHAR
JHARKHANDJHARKHANDJHARKHAND
UTTAR PRADESHUTTAR PRADESHUTTAR PRADESH
RALARALAKERALA
GOA
TAMILTAMILNADUNADUTAMILNADU
NEW DELHINEW DELHINEW DELHI
KoKolkatalkata(Ca(Calcutta)lcutta)Kolkata(Calcutta)
Chennai(Madras)
BengalooruBengalooru(Bangalore)(Bangalore)Bengalooru
(Bangalore)
HyderabadHyderabadHyderabad
NagpurNagpurNagpur
BhopalBhopalBhopalIndoreIndoreIndore
AhmadabadAhmadabadAhmadabad
JaipurJaipurJaipur
KanpurKanpurKanpur
Mumbai(Bombay)
SuratSuratSurat
NasikNasikNasik AurangabadAurangabadAurangabad
NandedNandedNanded
AkolaAkolaAkola
PunePunePune
HubliHubliHubli
BelgaumBelgaumBelgaum
Gandhidham
BhavnagarBhavnagarBhavnagar
Rann of Kachchh
Cuttack
Port Blair
Puri
CoimbatoreCoimbatoreCoimbatoreNagappattinam
Vizagapatam (Vishakhapatnam)
Cocanada (Kakinada)
MachilipatnamKurnoolKurnoolKurnool
NizamabadNizamabadNizamabad
ChandrapurChandrapurChandrapur
Nellore
Vizianagaram
Brahmapur
MysoreMysoreMysore
SalemSalemSalem
Mangalore
hitradurgahitradurgaChitradurga
VijayawadaVijayawadaVijayawada
KhandwaKhandwaKhandwa
RaichurRaichurRaichur
Kochi (Cochin)
Kollam (Quilon)
Kozhikode(Calicut)
Thiruvananthapuram(Trivandrum) Nagercoil
MaMaMadurai
TuticTuticTuticorin
SolapurSolapurSolapurGulbargaGulbargaGulbarga
purpurKolhapur
Madgaon
SambalpurSambalpurSambalpur
KharagpurKharagpurKharagpur
Agartala
GoalparaGoalparaGoalparaSiliguriSiliguriSiliguri
JamshedpurJamshedpurJamshedpur
BilaspurBilaspurBilaspur
RanchiRanchiRanchi
RaipurRaipurRaipur
JhansiJhansiJhansi
JabalpurJabalpurJabalpur
MurwaraMurwaraMurwara
PatnaPatnaPatna
GayaGayaGaya
GorakhpurGorakhpurGorakhpur
BhagalpurBhagalpurBhagalpurVaranasi Varanasi Varanasi AllahabadAllahabadAllahabad
DhanbadDhanbadDhanbad
Baleshwar
BardBarddhamandhamanBarddhaman
BaharampuraharampurBaharampur
Imphal
Aizawl
KargilSrinagSrinagararSrinagar
JammuJammuJammu
AmritsarAmritsarAmritsar
LudLudhianahianaLudhianaJalandharJalandharJalandhar
AgraAgraAgra
BikanerBikanerBikaner
Jodhpur
UdaipurUdaipurUdaipur
Ajmer
Sikar AligarhAligarhAligarh
KotaKotaKota
GwaliorGwaliorGwaliorEtawahEtawahEtawah LucknowLucknowLucknow
ShahjahanpurShahjahanpurShahjahanpur
Leh
UnderChinesecontrol
ChandigarhChandigarhChandigarhDehra DunDehra DunDehra Dun
SaharanpurSaharanpurSaharanpur
MeerutMeerutMeerutMoraMoraMoradabad
ShillongShillongShillong
GuwahatiGuwahatiGuwahati
DibrugarhDibrugarhDibrugarhNorthNorthNorth Lakhimpur
KoKoKohima
RajkotRajkotRajkot VadodaraVadodaraVadodaraPorbandar
Veraval
Bhuj
Bay of Bengal
AndamanIslands
NicobarIslands
I N D I A N O C E A N
LaccadiveIslands
Arabian Sea
Line of Control
Gulf of Kachch h
Gulf ofKhambhat
Gulf ofMannar
Palk Strait
Brahmaputra R.
Brahmaputra R.
Yamuna R.
Yamuna R.
Ghaghara R.
Ghaghara R.
Son R.Son R.
Mahanadi R.
Kris hn a R.Kris hn a R.
Godav ari R.
Narmada R.
Narmada R.
Tapi R.Tapi R.
D e c c a nD e c c a n
Ea
ste
rnE
as
tern
Gh
ats
We
ste
rnW
es
tern
Gh
ats
Gh
ats
Gan
ga
R. BHUTAN ItItanagaranagarItanagar
TAJIKISTAN
AFGHANISTA
N
Puducherry (Pondicherry)
0 km 200 400 600 800
0 miles 200 400
© The Economist Intelligence Unit Limited 2011
Main railway
Main road
International boundary
Province boundary
Main airport
Capital
Major town
Other town
ARUNACHAL PRADESH1
1
2
1515
2
33
44
ASSAM2
CHANDIGARH3
DADRA AND NAGAR HAVELI4
DAMAN AND DIU5
5
6
HIMACHAL PRADESH7
JAMMU AND KASHMIR8
MANIPUR9
9
MEGHALAYA10
10
MIZORAM11
11
NAGALAND12
12
PUDUCHERRY13
13
13
13
SIKKIM14
14
15
TRIPURA15
17
17
HARYANA
6
7
8
UTTARAKHAND
WEST BENGAL
16
16

India 3
Country Report November 2011 www.eiu.com © The Economist Intelligence Unit Limited 2011
Executive summary
Highlights
November 2011
• The Indian National Congress-led United Progressive Alliance coalition government is likely to complete its five-year term, which ends in 2014, but its political standing is low, owing to corruption scandals and high inflation.
• High-profile anti-corruption protests have highlighted the graft issue, but also the government's mishandling of the situation. Nevertheless, the issue is not currently expected to have a direct impact on political stability.
• The government will make only lacklustre efforts at structural economic reform, partly because it lacks a reliable parliamentary majority.
• The Economist Intelligence Unit does not expect the government's fiscal deficit target of 4.6% for 2011/12 (April-March) to be met. We forecast a deficit of 4.9% in 2011/12, falling to 3.8% by the end of the forecast period.
• Real GDP on an expenditure basis is forecast to expand by 7.9% in 2011/12, and 7.8% in 2012/13, compared with growth of 8.8% in 2010/11. Growth will then average 8.4% a year between 2013/14 and 2016/17.
• We forecast a deceleration in the rate of inflation in 2012-16 from an estimated 8.3% in 2011, although we still expect consumer price inflation to average a relatively high rate of 7.7% a year over the forecast period.
• A hitherto private spat between the two most senior ministers in the government�the finance minister, Pranab Mukherjee, and the home minister, P Chidambaram�became public in September.
• India and Afghanistan signed a number of bilateral agreements during the two-day visit of the Afghan president, Hamid Karzai, to the Indian capital, New Delhi, in early October. This has irked Pakistan.
• The government has announced a new draft policy for the telecommun-ications sector in a bid to increase transparency in the industry.
• Moody's Investor Service, a US-based credit rating agency, has downgraded its rating of the government-owned State Bank of India (SBI), India�s largest bank.
• Wholesale price inflation remained almost unchanged in September, falling to 9.7% year on year, from 9.8% in August.
• A strong monsoon has supported growth in the agricultural sector. The Ministry of Agriculture estimates that wheat production will exceed 86m tonnes in 2011/12�a new record.
Outlook for 2012-16
Monthly review

4 India
Country Report November 2011 www.eiu.com © The Economist Intelligence Unit Limited 2011
Outlook for 2012-16 Political outlook
The government's standing continues to be undermined by a raft of corruption scandals and the perception that its response to graft has been inadequate. In addition, the government looks increasingly tired, directionless and unable to tackle other pressing issues such as high inflation. The Economist Intelligence Unit's central forecast remains that the United Progressive Alliance (UPA) coalition government will survive until the end of its five-year term in 2014, but this is mostly because the opposition is weak, divided and plagued by scandals of its own. Were the opposition in a position to mount a credible challenge, the government's prospects would look considerably dimmer.
Making more demonstrable progress on fighting corruption has long been a challenge for the government. However, the current spate of scandals, which has persisted for a full year and includes a scam relating to the sale of second-generation (2G) telecommunications licences in 2008 that is reported to have cost the government around US$40bn in lost revenue, has put a renewed spotlight on the challenge of reducing graft. Public discontent had been rising for months, fuelled by relentless coverage of the issue in the media, but the high-profile actions of one activist, Anna Hazare, have galvanised public opinion to the extent that anti-government, anti-corruption demonstrations and rallies occurred throughout India in August. Recent events called into question not only politicians' corrupt practices, but also the government's handling of the situation; the authorities appeared heavy-handed and even anti-democratic by trying to prevent peaceful protests in the capital, New Delhi. Nevertheless, at present we do not expect the issue to have a direct impact on political stability.
Corruption in India is not just the preserve of the government or of the Indian National Congress, which leads the UPA; a corruption scandal in July has also tarred the reputation of the main opposition party, the Bharatiya Janata Party (BJP). The protests were widely covered in the domestic and international media, and in some cases drew large numbers of people, but it is students and professionals in urban areas who have been the most vocal. For a much larger proportion of the population, which remains rural, undereducated and relatively poor, economic necessity will preclude participation in sustained protests about corruption, and other, more immediate concerns, such as high inflation, will remain of greater importance.
The government's procrastination in investigating the telecoms licence auction suggests that the administration of the prime minister, Manmohan Singh, is primarily concerned with keeping the ruling coalition together. This is not a new phenomenon; the need to focus on maintaining government stability, potentially at the expense of policy and even ideology, is directly related to the rise of regional and caste-based parties, and the relative lessening of Congress's influence both in New Delhi and in state capitals over the past three decades. Alliance-building on the basis of political opportunism rather than shared policy objectives results in fragile governing coalitions, and this factor will
Political stability
India 5
Country Report November 2011 www.eiu.com © The Economist Intelligence Unit Limited 2011
persist as a potential source of instability in 2012-16, as the UPA will remain unable to rule without the support of regional parties and those based on caste. The risks associated with this trend will increase as a result of the strong performance by some of Congress's regional allies in local elections in May. But the country's democratic institutions are firmly entrenched and resilient, with orderly and generally accepted transfers of power. The risk of political collapse is thus much lower in India than in many other developing countries in Asia.
The next general election is due in 2014. Although the government's waning popularity and its lack of a working majority have raised the possibility of an early poll, we still expect the government to survive its full term. This is in large part because the opposition, led by the BJP, is weak and divided and is therefore in no position to mount a strong challenge. Speculation about who will succeed Mr Singh as prime minister continues, but there is no obvious choice. Rahul Gandhi, the son of the powerful Congress president, Sonia Gandhi, is still seen as being inexperienced, although he is becoming an increasingly prominent political figure.
Crossborder terrorism and the unresolved dispute over Kashmir (which both India and Pakistan administer in part but claim in full) remain central issues in India's relations with Pakistan. The risk of a further deterioration in relations is high for a number of reasons. The Indian government is much weaker now than it was in previous years, giving it less scope to be seen to be conciliatory towards Pakistan. There is now more support for the idea that there has been official Pakistani complicity in terrorist attacks on India (following the discovery that the terrorist leader, Osama bin Laden, had been living in Pakistan prior to his death in May), which means that India might have to take a harder line than previously in the event of another terrorist attack that is traced back to Pakistan. Another reason is that the strengthening of ties between India and Afghanistan is perceived by many in Pakistan as a threat to that country, raising the possibility that some elements in Pakistan might seek to try to destabilise India. However, our central forecast is that relations will remain broadly stable, with no outbreak of hostilities, but no breakthrough in relations either. Supporting this central forecast is the fact that domestic political problems will continue to preoccupy leaders in both India and Pakistan, and that the bilateral dialogue that has resumed following a temporary collapse in November 2008 after the terrorist attack on Mumbai in that year will continue.
Relations between India and China will remain problematic. Economic and commercial ties are strengthening, but ongoing tensions stand in the way of significantly warmer relations between Asia's two aspiring great powers. Among the sources of tension are competition for natural resources, attempts to increase strategic influence in neighbouring countries and long-running un-resolved border disputes between the two countries. These issues are likely to overshadow attempts to build mutual confidence and expand bilateral trade in 2012-16.
Common strategic concerns will remain at the heart of India's improving relationship with the US. Foremost among these is the fear of a power vacuum in Afghanistan following the pull-out of US troops from that country, which is
Election watch
International relations

6 India
Country Report November 2011 www.eiu.com © The Economist Intelligence Unit Limited 2011
scheduled for 2014. Indo-Afghan ties have strengthened considerably in recent months, encouraged by the US, and are likely to continue to improve.
Economic policy outlook
Hopes that the government would be more effective in its second term (2009-14) than during its first (2004-09) have not been borne out. The UPA has been hindered in this regard by the fact that it lacks a reliable working majority in the Lok Sabha (the lower house of parliament) and is in a minority in the Rajya Sabha (the upper house). The direction of macroeconomic policy is unlikely to change much in the remainder of the current government's term. Priority will continue to be given to populist measures designed to help what the government calls the "common man". The concept of inclusive growth will remain central to policy, as will the stabilisation of the public finances. Efforts at structural economic reform will be hindered by the fact that the authorities are focused on tackling immediate problems, such as high inflation, as well as by the government's lack of a reliable parliamentary majority, disagreements among the members of the UPA and even resistance to reform within the Congress party. For the most part, the UPA administration is therefore likely to restrict its focus to targeted spending and piecemeal changes, rather than attempting to implement structural reforms that would unlock more of India's vast economic potential.
Even in the event that a coalition led by the opposition BJP wins the next general poll, the direction of policy would remain relatively stable in 2014-16. The main difference that would arise from a change of government is that a government led by the BJP�which is less beholden to rural voters than Congress, and which has traditionally been seen as more business-friendly than the leading party�might accelerate the pace of economic reform.
The government has set itself a target of progressively reducing the budget deficit from an estimated 5% of GDP in fiscal year 2010/11 (April-March) to 3.7% in 2016/17. The target for 2011/12 is 4.6%, but given that in the first five months of the fiscal year the deficit was equivalent to two-thirds of the budget estimate for the full fiscal year, we do not expect this target to be met. We forecast a deficit of 4.9% in 2011/12 on the back of lower than expected tax revenue and higher than expected subsidy payments resulting from high global prices for oil and fertiliser. Public expenditure is expected to remain high in the forecast period, as the government has announced substantial increases in spending on health, education and rural infrastructure. We expect rapid nominal GDP growth to cause the budget deficit to continue to contract as a percentage of GDP during 2012/13-2016/17, to stand at 3.8% by the end of the forecast period.
There have been 13 increases in the repurchase (repo) rate�the interest rate at which the Reserve Bank of India (RBI, the central bank) supplies funds to the banking system�since January 2010, and the rate now stands at 8.5%. According to the RBI in its monetary policy statement on October 25th, its policy stance is designed to combat high inflation and to anchor inflationary expectations. "Changing the policy stance when inflation is still far above the tolerance level
Monetary policy
Fiscal policy
Policy trends
India 7
Country Report November 2011 www.eiu.com © The Economist Intelligence Unit Limited 2011
entails risks to the credibility of the [RBI's] commitment to low and stable inflation," it noted. However, the central bank remains mindful that raising interest rates at a time of slowing economic growth is risky. In addition to the potential direct effect on real GDP growth, high interest rates will complicate the government's plans for fiscal consolidation and could also encourage vola-tile capital inflows, thereby putting upward pressure on the external value of the rupee. We therefore expect the RBI to keep interest rates on hold at its next meeting on December 16th. Interest rates will be relatively stable in 2012 as in-flation moderates, and will fall slightly in the latter years of the forecast period.
Economic forecast
2011 2012 2013 2014 2015 2016
Economic growth (%) US GDP 1.6 1.3 1.9 2.2 2.4 2.3
OECD GDP 1.7 0.9 1.9 2.1 2.3 2.3
World GDP 2.5 2.1 2.8 2.9 3.1 3.1
World trade 6.8 5.2 6.1 6.4 6.6 6.6
Inflation indicators (% unless otherwise indicated) US CPI 3.1 2.1 2.3 2.1 2.2 2.2
OECD CPI 2.8 1.9 2.1 2.1 2.1 2.2
Manufactures (measured in US$) 7.0 0.4 -0.7 0.3 2.0 2.1
Oil (Brent; US$/b) 110.0 90.0 95.0 100.0 104.0 110.0
Non-oil commodities (measured in US$) 27.9 -10.9 -4.0 -1.3 2.0 2.6
Financial variables US$ 3-month commercial paper
rate (av; %) 0.2 0.2 0.4 1.2 2.2 2.9
¥ 3-month money market rate (av; %) 0.1 0.2 0.3 0.7 1.1 1.2
Exchange rate: ¥:US$ (av) 79.6 76.8 80.0 82.0 84.0 82.0
Exchange rate:Rs:US$ (av) 46.0 48.1 47.6 47.5 45.8 44.8
Exchange rate: US$:� (av) 1.39 1.33 1.28 1.23 1.28 1.27
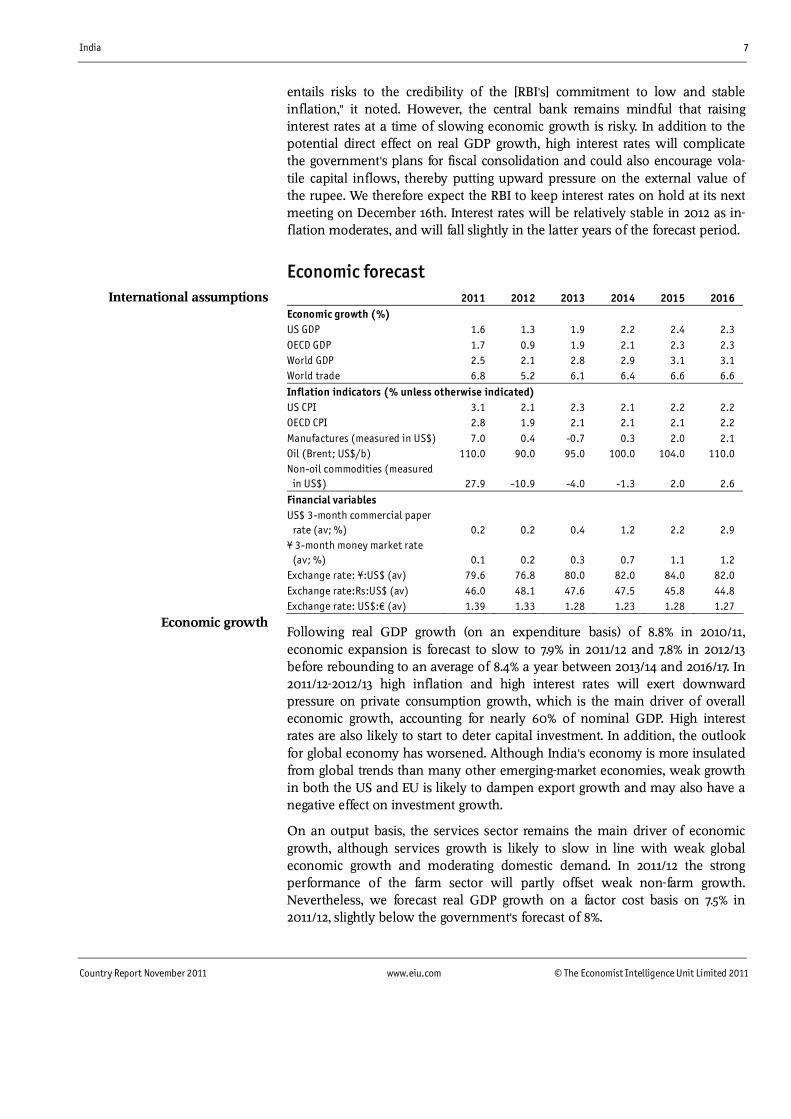
Following real GDP growth (on an expenditure basis) of 8.8% in 2010/11, economic expansion is forecast to slow to 7.9% in 2011/12 and 7.8% in 2012/13 before rebounding to an average of 8.4% a year between 2013/14 and 2016/17. In 2011/12-2012/13 high inflation and high interest rates will exert downward pressure on private consumption growth, which is the main driver of overall economic growth, accounting for nearly 60% of nominal GDP. High interest rates are also likely to start to deter capital investment. In addition, the outlook for global economy has worsened. Although India's economy is more insulated from global trends than many other emerging-market economies, weak growth in both the US and EU is likely to dampen export growth and may also have a negative effect on investment growth.
On an output basis, the services sector remains the main driver of economic growth, although services growth is likely to slow in line with weak global economic growth and moderating domestic demand. In 2011/12 the strong performance of the farm sector will partly offset weak non-farm growth. Nevertheless, we forecast real GDP growth on a factor cost basis on 7.5% in 2011/12, slightly below the government's forecast of 8%.
Economic growth
International assumptions

8 India
Country Report November 2011 www.eiu.com © The Economist Intelligence Unit Limited 2011
India's strong growth fundamentals�high saving and investment rates, fast labour force growth and a rapidly expanding middle class�will ensure a steady economic performance throughout the forecast period, with little volatility in GDP growth rates from year to year. However, economic growth will continue to be constrained by infrastructure bottlenecks, shortages of skilled labour and the difficulties involved in shifting resources from low-productivity agriculture to higher-productivity manufacturing. It is for these reasons that we do not expect the government's medium-term target of double-digit annual GDP growth to be achieved.
Economic growth (%; fiscal years beginning Apr 1st) 2011a 2012a 2013 a 2014 a 2015a 2016a
GDP 7.9 7.8 8.3 8.4 8.4 8.5
Private consumption 8.2 7.8 7.7 7.8 7.8 8.1
Government consumption 6.9 8.5 8.7 9.7 8.4 8.0
Gross fixed investment 9.3 11.1 11.4 10.5 10.7 11.5
Exports of goods & services 14.9 11.5 10.2 11.0 11.7 12.0
Imports of goods & services 12.1 9.8 11.7 11.1 12.0 13.2
Domestic demand 7.5 8.7 8.8 8.7 8.7 9.1
Agriculture 4.9 3.5 3.0 4.0 3.5 3.0
Industry 5.4 7.0 8.0 7.9 7.9 7.9
Services 8.6 9.3 9.2 9.0 9.0 9.0
a Economist Intelligence Unit forecasts.
Year-on-year consumer price inflation stood at 9% in August, up from 8.4% in July but down from 10.1% in August 2010. A sustained campaign of monetary tightening has had an impact in terms of reducing aggregate demand, but a slowdown in food price inflation has played a more important role in miti-gating price pressures. Together, food articles and manufactured food products have a 24.3% weighting in the wholesale price index, and this means that food price inflation will remain a crucial determinant of overall inflation. In its mid-quarter review of monetary policy in October, the RBI mentioned high oil prices and domestic "structural imbalances" in food supply among the persist-ent inflationary pressures. This means that although we forecast that the rate of inflation will decelerate from an estimated average of 8.3% in 2011, we expect consumer price inflation to average a still relatively high 7.7% a year in 2012-16. The possibility of shocks such as an unexpectedly sharp rise in global com-modity prices or a failure of the monsoon in any given year (which would have an adverse effect on food prices by constraining supplies) represent risks to this forecast (meaning that inflation could be higher than we currently forecast).
The rupee is forecast to appreciate slightly during the forecast period, from an estimated average of Rs46:US$1 in 2011 to Rs44.8:US$1 in 2016. The rise in the currency's value will be driven primarily by strong inflows of foreign investment, attracted by India's bright economic prospects. The current-account deficit is not expected to pose a threat to the rupee, as it is forecast to average a manageable 2.8% of GDP in 2012-16. Given India's high inflation at present and the fairly rapid rate of price increases forecast for 2012-16, the rupee's nominal strengthening will represent a substantial appreciation in real terms, amounting to around 30% over the next five years. The rupee could be vulnerable to
Exchange rates
Inflation

India 9
Country Report November 2011 www.eiu.com © The Economist Intelligence Unit Limited 2011
downward pressure on its value if inflation runs out of control or if the government allows the fiscal deficit to surge.
The current-account deficit is forecast to narrow to the equivalent of 2.1% of GDP in 2016, from an estimated 3.7% in 2011. Substantial capital inflows will ensure that the shortfall on the current account poses little risk to the economy, and India will continue to accumulate foreign-exchange reserves. Merchandise exports will grow by 17.3% a year on average in 2012-16, slightly faster than annual average growth in imports of 16% over the same period. However, import growth will occur from a much higher base, and as a result the trade deficit will widen from an estimated US$159.1bn in 2011 to US$297.3bn in 2016. Strong growth in merchandise exports and imports in the five-year period will reflect not only robust growth in domestic demand but also the further opening of the Indian economy to international trade and global production systems. The expansion of the country's manufacturing capacity will boost its export performance and will cause volume demand for raw materials to strengthen at a time when global commodity prices are high, while booming domestic demand will underpin sustained rapid growth in imports of consumer goods.
Services exports will continue to play a vital role in the country's external trade as information technology (IT) and business-process outsourcing continue to lure Western firms to India. Having built up supplier relationships, India's IT companies are expected to carry on growing rapidly, and the most sophisticated of them will continue to move quickly up the value added chain. After falling sharply to an average of 8.5% in 2011-12 as the renewed economic downturn in the developed world takes a toll on India's IT exports, services export growth is forecast to rebound to 20.6% a year on average in 2013-16, enabling the services surplus to increase to US$124.8bn by 2016. The income deficit, which is small at present, will widen steadily and will stand at US$27.7bn in 2016, reflecting an increase in the repatriated profits of foreign companies operating in India. The current transfers balance will stay in positive territory, rising to US$103bn in 2016, owing to strong growth in remittances from Indian workers overseas.
The possibility of a reversal of capital inflows, which have been financing India's persistent current-account deficit, also constitutes a downside risk�one that has increased in prominence as the sovereign debt crisis in the euro zone deepens.
Forecast summary (% unless otherwise indicated)
2011a 2012b 2013 b 2014 b 2015b 2016b
Real GDP growthc 7.9b 7.8 8.3 8.4 8.4 8.5
Industrial production growth 4.3 6.0 7.5 7.9 7.9 7.9
Unemployment rate (av) 9.8 9.8 9.6 9.3 8.9 8.9
Consumer price inflation (av) 8.3 8.0 8.3 8.0 7.5 6.7
Consumer price inflation (end-period) 7.3 8.2 8.2 7.8 7.1 6.6
Short-term interbank rate 9.6 9.6 8.9 12.0 11.8 11.8
Government balance (% of GDP)c -4.9b -4.8 -4.6 -4.9 -4.2 -3.8
Exports of goods fob (US$ bn) 306.1 353.1 401.0 470.4 569.7 680.1
Imports of goods fob (US$ bn) -465.2 -530.0 -606.6 -697.3 -818.6 -977.4
External sector

10 India
Country Report November 2011 www.eiu.com © The Economist Intelligence Unit Limited 2011
Forecast summary (% unless otherwise indicated)
2011a 2012b 2013 b 2014 b 2015b 2016b
Current-account balance (US$ bn) -73.5 -83.6 -90.2 -85.6 -69.7 -97.0
Current-account balance (% of GDP) -3.7 -3.7 -3.4 -2.8 -1.9 -2.1
Total foreign debt (US$ bn; year-end) 272.7 283.5 297.9 313.0 334.2 363.9
Exchange rate Rs:US$ (av) 45.99 48.07 47.61 47.50 45.75 44.75
Exchange rate Rs:US$ (end-period) 47.03 47.84 47.55 46.62 45.25 44.25
Exchange rate Rs:¥100 (av) 52.33 58.98 58.78 58.64 55.71 53.59
Exchange rate Rs:� (av) 60.97 62.85 59.51 57.12 56.16 57.06
a Economist Intelligence Unit estimates. b Economist Intelligence Unit forecasts. c Fiscal years (beginning April 1st of year indicated).

India 11
Country Report November 2011 www.eiu.com © The Economist Intelligence Unit Limited 2011
Quarterly forecasts 2010 2011 2012
1 Qtr 2 Qtr 3 Qtr 4 Qtr 1 Qtr 2 Qtr 3 Qtr 4 Qtr 1 Qtr 2 Qtr 3 Qtr 4 Qtr
GDP
% change, quarter on quarter 0.1 2.5 2.4 2.3 1.1 1.6 2.4 2.2 1.8 1.8 1.6 1.6
% change, year on year 9.2 9.1 9.4 7.4 8.5 7.6 7.7 7.6 8.3 8.4 7.6 7.0
Private consumption
% change, quarter on quarter 2.8 2.0 1.4 1.8 0.7 4.3 2.5 1.1 1.9 1.9 1.7 1.5
% change, year on year 9.2 8.6 8.8 8.4 6.1 8.4 9.5 8.7 10.0 7.5 6.8 7.2
Government consumption
% change, quarter on quarter 6.2 5.1 -3.7 0.7 -0.5 7.3 2.1 3.7 1.1 1.1 1.1 1.1
% change, year on year 6.9 3.7 0.8 8.3 1.4 3.5 9.7 13.0 14.9 8.3 7.1 4.4
Gross fixed investment
% change, quarter on quarter -5.9 3.5 1.3 1.2 1.7 3.6 2.7 3.0 2.5 2.5 2.4 2.4
% change, year on year 11.4 12.1 8.1 -0.1 8.0 8.0 9.6 11.5 12.4 11.2 10.8 10.1
Exports of goods & services
% change, quarter on quarter 4.9 3.6 10.2 3.6 5.5 -3.0 4.3 2.0 3.3 3.3 3.1 3.1
% change, year on year 9.6 12.2 23.8 24.2 24.9 16.9 10.7 9.0 6.7 13.6 12.3 13.5
Imports of goods & services
% change, quarter on quarter -0.1 -0.8 -0.3 11.4 12.5 -12.1 4.0 -1.7 5.1 4.9 4.6 4.4
% change, year on year 15.4 11.5 0.5 10.0 23.9 9.8 14.6 1.1 -5.6 12.7 13.3 20.3
Domestic demand
% change, quarter on quarter 0.0 2.8 0.9 1.6 0.6 3.7 2.3 1.7 2.1 2.1 2.0 1.8
% change, year on year 9.6 9.1 7.6 5.5 6.1 7.0 8.4 8.4 10.1 8.5 8.1 8.3
Consumer prices
% change, quarter on quarter 3.3 1.3 2.0 2.4 3.0 1.1 1.1 2.0 2.3 1.8 2.4 1.9
% change, year on year 15.0 13.7 10.5 9.3 9.0 8.9 7.9 7.5 6.8 7.5 8.8 8.7
Producer prices
% change, quarter on quarter 2.8 1.7 1.4 2.7 3.3 1.8 1.5 1.5 2.3 2.1 1.8 1.7
% change, year on year 9.4 10.5 9.4 8.9 9.4 9.6 9.8 8.4 7.4 7.7 7.9 8.2
Exchange rate Rs:US$
Average 45.93 45.63 46.49 44.86 45.27 44.71 45.22 48.76 49.12 48.00 47.79 47.36
End-period 45.14 46.60 44.92 44.81 44.65 44.72 46.99 48.94 48.56 47.90 47.58 47.22
Interest rates (%; av)
Money market rate 5.0 5.3 6.0 6.3 6.8 7.5 8.3 8.3 8.3 8.1 8.1 7.7

12 India
Country Report November 2011 www.eiu.com © The Economist Intelligence Unit Limited 2011
Monthly review: November 2011
The political scene
A spat between the two most senior ministers in the government�the finance minister, Pranab Mukherjee, and the home affairs minister, P Chidambaram�became public in September. The clash centred on a leaked note from Mr Mukherjee�s office to the office of the prime minister, Manmohan Singh, which suggested that Mr Chidambaram could have stopped the scam involving the second-generation (2G) telecommunications licence that came to light in 2010 during his tenure as finance minister in the United Progressive Alliance (UPA) government's first term, from 2005 to 2009. (Mr Chidambaram was finance minister in 2004-08, and the scandal relates to the sale of telecoms licences in 2008.) Mr Chidambaram has denied any wrongdoing. He offered to resign from his post, but the offer was rejected. Mr Chidambaam and Mr Mukherjee have since made a public appearance replete with conciliatory statements.
However, many observers believe that the debacle was a reflection of rivalry in the context of the fact that the Indian National Congress, which leads the UPA government, has not named a prime ministerial candidate ahead of the next general election (which is due by May 2014) and that the presumed favourite for the slot, Rahul Gandhi, is still seen as relatively young and lacklustre and so is not a guaranteed shoe-in. Mr Gandhi�s leadership bid continues to be tied to Congress�s fortunes in the state of Uttar Pradesh, where crucial state elections are due in April 2012. Some of Congress�s problems�its apparent inability to tackle corruption and high inflation, and the lack of credible local leadership, for example�appear to have led to an erosion of Congress�s popularity in Uttar Pradesh. Mr Gandhi appears to be acutely aware of this and has announced that he will spend much of November campaigning in Uttar Pradesh.
The 79-year-old Mr Singh has had health problems in the recent past and may therefore step down as prime minister even before the next poll. Many analysts think that Mr Chidambaram and Mr Mukherjee will continue to jockey for political prominence. However, the leader of the Congress party, Sonia Gandhi (and Mr Gandhi's mother), is said not to trust either politician because they have their own political constituencies�unlike Mr Singh, who is more a technocrat than a career politician.
Since its drubbing in the 2009 general election, the Bharatiya Janata Party (BJP), the main national opposition party, has largely been preoccupied with reorganising itself. The BJP has yet to nominate a prime ministerial candidate ahead of the next general election. Nitin Gadkari, the BJP�s president, has said that, in keeping with past practice, the party would nominate its candidate only after the election.
In reality, the race for the slot of prime ministerial candidate has intensified in recent weeks. The octogenarian Lal Krishna Advani, one of the BJP's most senior figures, has embarked on a journey through 23 Indian states. The themes
The BJP considers its prime ministerial options
A ministerial spat points to pre-election jockeying

India 13
Country Report November 2011 www.eiu.com © The Economist Intelligence Unit Limited 2011
of Mr Advani�s journey, or yatra, are �good governance� and �anti-graft�. Pointedly, the yatra started in Bihar, a state whose chief minister, Nitish Kumar, is a member of the Janata Dal (United), or JD (U), which is a member of the National Democratic Alliance (NDA), an alliance led by the BJP. Mr Kumar has already said that he would pull the JD (U) out of the NDA if the BJP nominates Narendra Modi, the chief minister of Gujarat, as its prime ministerial candidate. (The JD (U) governs Bihar in a coalition with the BJP.)
Mr Kumar has received credit for the vast improvement in governance in Bihar in recent years; the state used to be a by-word for violent crime and economic mid-management, but is now growing faster than the Indian economy as a whole. Mr Modi, meanwhile, has long been praised for fostering economic development and industrial growth in Gujarat; the state has been one of India's strongest performers for a number of years. For example, Mukesh Ambani, the chairman of Reliance Industries, India's largest conglomerate, recently lauded Mr Modi for having put Gujarat "on the global map". However, Mr Modi remains tainted in some quarters by accusations of having abetted�or at least acquiesced in�communal violence in 2002. He is nevertheless a strong contender for prime ministerial candidate, and the fact that a Supreme Court verdict on his involvement in the communal riots in 2002 was deferred in September may strengthen his position further. Meanwhile, Mr Advani has said that he will not run for prime minister again, but few doubt that he still thinks the job should be his. Another potential candidate is Sushma Swaraj, the opposition leader in the Lok Sabha (the lower house of parliament.
India and Afghanistan signed a number of bilateral agreements during the two-day visit of the Afghan president, Hamid Karzai, to the Indian capital, New Delhi, in early October. The agreements focus on the provision of military training and arms by India to Afghan security forces, and on more Indian development aid to Afghanistan. They merely represent a formalisation of bilateral ties that have been progressively strengthening in recent years. The �strategic partnership� agreements come three years ahead of a planned US troop withdrawal from Afghanistan, and amid increasingly frosty relations between the US and Pakistan (and between Afghanistan and Pakistan). India�s main regional security concern is the possibility of the establishment of a pro-Pakistan regime in Afghanistan once the US withdraws its troops. Pakistan, meanwhile, fears that India�s rising influence in Afghanistan could deprive it of an area that Pakistan�s military leaders tend to view as a buffer zone in the event of a full-out war with India. Moreover, Pakistan resents the presence in Afghanistan of its long-standing rival India; at about US$2bn in disbursed funds, India's aid programme in Afghanistan is its biggest anywhere. Indian aid has helped to fund, among other things, the building of a road towards its border with Iran, to weaken Pakistan�s grip over Afghanistan�s trade.
While in New Delhi, Mr Karzai sought to allay Pakistan's fears of being encircled by its traditional foe by declaring that Pakistan was �a twin brother� while India was a �great friend�. In another development, Pakistan announced in mid-October in-principle granting of �most-favoured nation (MFN) status� to India, along with the easing of business visas. Once Pakistan grants MFN status to India, it will have to treat India on a par with its other favoured trading
India formalises a �strategic partnership�

14 India
Country Report November 2011 www.eiu.com © The Economist Intelligence Unit Limited 2011
partners. India granted MFN status to Pakistan in 1996. The move is seen as a major concession by Pakistan�s government, which had long insisted that improved trade ties were conditional on progress in the resolution of the territorial dispute over Kashmir (the region claimed in full by both India and Pakistan but administered by each of them only in part). This could potentially mark the beginning of an end to relative economic segregation of South Asia�s two biggest economies, whose bilateral trade is a paltry US$3bn a year.
Economic policy
The government has announced a new draft policy for the telecommunications sector in a bid to increase transparency in an industry that has almost become synonymous with the corruption scandal surrounding the sale of second-generation (2G) spectrum that came to light nearly a year ago and that is estimated to have cost the government around U$40bn in lost revenue. The draft legislation proposes that mobile spectrum should be priced on a market basis and separated from the allocation of telecoms licences. Under the new proposals, 2G mobile spectrum that currently comes bundled with a telecoms licence will be disaggregated and priced on a market basis, which means that operators will have to pay for additional radio airwaves. (The 2G scam involved the alleged allotment of spectrum on below-market prices to certain telecoms firms, so the proposals are clearly aimed at avoiding a repeat of that particular scandal.) The plans also call for 300 megahertz of additional spectrum to be released by 2017, and a further 200 megahertz to be released by 2020. The new policy will allow telecoms operators to share and trade airwaves and will enable carriers to exit the industry. (Under current licensing norms, an operator cannot sell its licence back to the government or to other operators. In other words, an operator wishing to exit the industry would lose its initial investment.)
The government aims to raise landline teledensity in rural areas from 35 per 100 people currently to 60 per 100 by 2017 and to 100% by 2020. One of the most important immediate changes is the scrapping of roaming fees in India�s 22 zone boundaries, effectively creating a single market. The draft policy favours domestic producers of technology equipment with proposals aiming for domestic manufacturers to meet 80% of the industry's demand by 2020.
The policy also proposes providing high-speed broadband through fibre-optic networks to panchayats (the most local level of government) across India by 2014. The government has proposed adding 175m high-speed connections by 2017 and 600m by 2020. Kapil Sibal, the minister for communications and information technology, has also proposed that the government pass a bill mandating the �right to broadband�, much like laws passed by the UPA guaranteeing the right to information, the right to education and the right to food. The government has invited comments and suggestions from industry representatives, which is certain to be the beginning of a lengthy consultative process. It is unlikely that the bill will be introduced in the winter session of parliament that starts in November.
The government reveals a new draft telecoms policy

India 15
Country Report November 2011 www.eiu.com © The Economist Intelligence Unit Limited 2011
Moody's Investor Service, a US-based credit rating agency, has downgraded its rating of the government-owned State Bank of India (SBI), India�s largest bank. Moody's lowered SBI's credit rating by one notch, to D+, because of the bank's low Tier-I capital ratio and deteriorating asset quality. (A 'D' rating suggests "modest intrinsic financial strength, potentially requiring some outside support at times", while a 'C' rating denotes "adequate intrinsic financial strength".) SBI reported a Tier-I capital ratio of 7.6% on June 30th, lower than the 8% ratio that the government has committed to maintaining in public-sector banks. The government has since vowed to inject Rs30bn-45bn (US$615m-930m) in SBI during the remainder of 2011/12 to shore up the bank�s capital base. The development has been closely watched because of the sheer size of SBI, as well as broader concerns about the health of India�s banking sector. Duvvuri Subbarao, the governor of the Reserve Bank of India (the central bank), said in mid-October that the Indian banking system does �not have an inherent problem�. Cumulatively, the government plans to inject Rs160bn-180bn by March 2012 in five state-run banks (SBI, Bank of India, Bank of Baroda, Syndicate Bank and Indian Bank).
Economic performance
High interest rates, high inflation and a generally uncertain economic outlook are weighing on consumer sentiment. One obvious manifestation of this has been a marked moderation in the demand for cars. The Society of Indian Automobile Manufacturers now expects car sales to grow by just 2-4% year on year in 2011/12, compared with earlier estimates of 10-12% and actual year-on-year growth of 35% in 2010/11. The industry body cited high interest rates and rising fuel costs among the main reasons for the expected slowdown. Passenger car sales fell by 1.8% year on year to 165,925 units in September. During the April-September period as a whole, passenger car sales fell by 1.4%. However, sales of trucks and buses, which are often seen as a proxy for investment activity, rose by 18.1% in September and by 17.9% in April-September.
Labour unrest at Maruti Suzuki, India�s largest car manufacturer, has also had a negative effect on the sector. (The company is a joint-venture partner of Suzuki Motor of Japan.) A recent strike at Maruti, in which workers at a plant in the northern state of Haryana have been protesting against poor pay and working conditions, as well as for their right to unionise, is the third this year. According to Maruti Suzuki, workers have already formed a union, but workers counter that the union is in fact a management-supported "puppet" union. Maruti Suzuki estimates that it has suffered US$330m in lost revenue as a result of the strike. Meanwhile, the federal government has urged the Haryana state govern-ment to intervene in the dispute amid rumours that the company may relocate production to the western state of Gujarat. The dispute is important because the outcome could have an effect on general working conditions and pay in the automotive industry, and possibly even in the wider manufacturing sector. (Maruti Suzuki is the most prominent but by no means the only manufacturing firm that has experienced strained labour relations in recent years.)
Moody�s downgrades India�s largest bank
Automotive sales slow sharply
16 India
Country Report November 2011 www.eiu.com © The Economist Intelligence Unit Limited 2011
Industrial output rose by a slower than expected 4.1% year on year in August. Industrial production growth has moderated markedly in the current fiscal year, rising by 5.6% in the April-August period compared with 8.7% in the same period in 2010/11. Manufacturing output, which accounts for about 76% of industrial production, rose by 4.5% year on year in August. Mining production fell by 3.4% year on year, and electricity output rose by 9.5%. The data imply that consumer spending has moderated: output growth of consumer durables fell from 16.3% in April-August 2010 to 4.3% in the same period in 2011. Capital goods production also slowed from 18.9% to 7.2% during the same period.
Meanwhile, there are signs that the slowdown has become more broad-based and has affected the crucial services sector. The HSBC Markit India services purchasing managers� index (PMI) slipped from 53.4 in August to 49.8 in September�the first time since 2009 that the index indicated a contraction in the services sector. (According to the index, a reading under 50 represents a contraction in activity.)
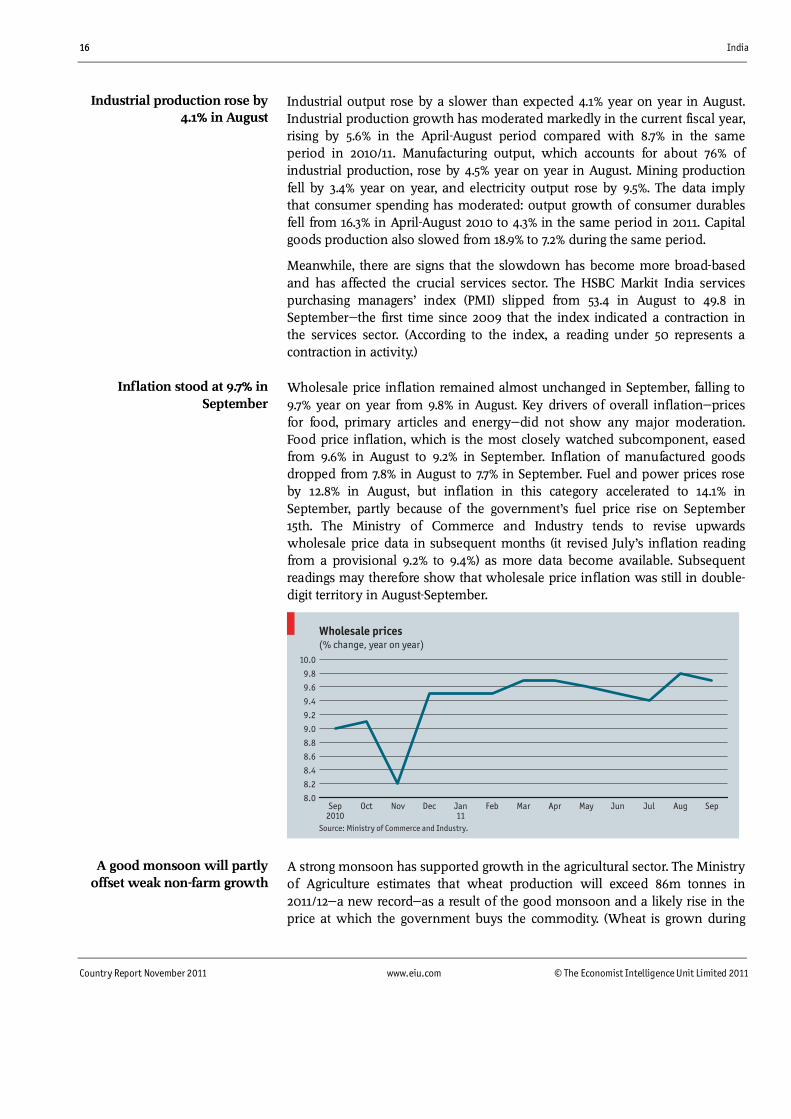
Wholesale price inflation remained almost unchanged in September, falling to 9.7% year on year from 9.8% in August. Key drivers of overall inflation�prices for food, primary articles and energy�did not show any major moderation. Food price inflation, which is the most closely watched subcomponent, eased from 9.6% in August to 9.2% in September. Inflation of manufactured goods dropped from 7.8% in August to 7.7% in September. Fuel and power prices rose by 12.8% in August, but inflation in this category accelerated to 14.1% in September, partly because of the government�s fuel price rise on September 15th. The Ministry of Commerce and Industry tends to revise upwards wholesale price data in subsequent months (it revised July�s inflation reading from a provisional 9.2% to 9.4%) as more data become available. Subsequent readings may therefore show that wholesale price inflation was still in double-digit territory in August-September.
Wholesale prices(% change, year on year)
Source: Ministry of Commerce and Industry.
8.0
8.2
8.4
8.6
8.8
9.0
9.2
9.4
9.6
9.8
10.0
SepAugJulJunMayAprMarFebJan11
DecNovOctSep2010
A strong monsoon has supported growth in the agricultural sector. The Ministry of Agriculture estimates that wheat production will exceed 86m tonnes in 2011/12�a new record�as a result of the good monsoon and a likely rise in the price at which the government buys the commodity. (Wheat is grown during
Industrial production rose by 4.1% in August
Inflation stood at 9.7% in September
A good monsoon will partly offset weak non-farm growth

India 17
Country Report November 2011 www.eiu.com © The Economist Intelligence Unit Limited 2011
winter and farmers tend to devote more land to growing wheat when the government-mandated minimum support price is high.) India, the world's second-largest producer of wheat, produced a record 85.9m tonnes of the crop in 2010/11. A favourable monsoon is also likely to help India to produce record volumes of other crops. The government has projected 87.1m tonnes of rice production in the 2011 kharif season (June-October)�rice output last season stood at 80.7m tonnes. Meanwhile, the area of land under cotton cultivation rose by 9% year on year this year to around 12m hectares. India produced 32.5m bales of cotton in 2010/11, and is on track to produce 35.5m bales, according to India�s Cotton Advisory Board. In 2011/12 India�s cotton exports are expected to rise to 8m-9m bales, compared with 7m bales in 2010/11, supported by a weaker currency as well rising output.

18 India
Country Report November 2011 www.eiu.com © The Economist Intelligence Unit Limited 2011
Data and charts Annual data and forecast
Pl ea se se e g ra p hi c b el ow
2007a 2008a 2009a 2010a 2011 b 2012c 2013c
GDPd
Nominal GDP (US$ bn) 1,187.3 1,261.9 1,364.5 1,720.9 1,996.3 c 2,231.2 2,628.0
Nominal GDP (Rs bn) 49,479 55,826 65,503 78,756 92,432 c 107,099 125,077
Real GDP growth (%) 9.6 5.1 9.1 8.8 7.9 c 7.8 8.3
Expenditure on GDP (% real change)d
Private consumption 9.8 6.6 7.3 8.7 8.2 c 7.8 7.7
Government consumption 8.9 11.7 16.0 4.8 6.9 c 8.5 8.7
Gross fixed investment 15.3 2.7 7.4 7.6 9.3 c 11.1 11.4
Exports of goods & services 5.2 15.2 -7.1 17.5 14.9 c 11.5 10.2
Imports of goods & services 10.0 22.5 -2.1 9.1 12.1 c 9.8 11.7
Origin of GDP (% real change)d
Agriculture 5.8 -0.1 0.4 6.6 4.9 c 3.5 3.0
Industry 9.7 4.4 8.0 7.9 5.4 c 7.0 8.0
Services 10.2 10.3 10.1 9.4 8.6 c 9.3 9.2
Population and income
Population (m) 1,129.9 1,148.0b 1,166.1b 1,184.1b 1,202.1 1,220.0 1,237.9
GDP per head (US$ at PPP) 2,850 3,013b 3,270b 3,544b 3,836 c 4,176 4,562
Fiscal indicators (% of GDP)d
Central government revenue 11.8 9.8 10.5b 10.7b 10.8 c 10.9 10.9
Central government expenditure 14.4 15.8 16.6b 15.7b 15.7 c 15.7 15.4
Central government balance -2.6 -6.0 -6.1b -5.0b -4.9 c -4.8 -4.6
Net public debt 57.3 56.2 53.4b 50.7b 49.2 c 48.2 46.6
Prices and financial indicators
Exchange rate Rs:US$ (av) 41.35 43.51 48.41 45.73 45.99 48.07 47.61
Consumer prices (end-period; %) 6.4 8.3 10.8 12.0 8.3 8.0 8.3
Producer prices (av; %) 4.9 8.7 2.4 9.5 9.3 7.8 6.6
Stock of money M1 (% change) 15.0 11.5 17.8 17.3 17.4 15.9 16.8
Stock of money M2 (% change) 22.3 20.5 18.0 17.8 20.6 19.4 18.3
Lending interest rate (av; %) 13.1 13.3 12.2 10.2 9.6 9.6 8.9
Current account (US$ m)
Trade balance -77,846 -125,319 -106,982 -132,204 -159,100 -176,929 -205,662
Goods: exports fob 153,784 198,599 168,218 225,647 306,100 353,100 400,958
Goods: imports fob -231,629 -323,051 -274,566 -357,746 -465,200 -530,029 -606,620
Services balance 39,142 50,959 39,304 41,618 45,600 48,452 61,610
Income balance -6,136 -3,542 -6,851 -13,141 -18,515 -18,301 -20,583
Current transfers balance 37,143 48,751 49,293 52,156 58,511 63,166 74,403
Current-account balance -8,077 -30,972 -25,922 -51,718 -73,504 -83,612 -90,233
External debt (US$ m)
Debt stock 202,793 224,712 237,691 251,614b 272,707 283,486 297,890
Debt service paid 39,365 30,936 16,150 36,583b 36,052 37,234 38,375
Principal repayments 32,097 23,667 10,728 29,805b 28,977 29,616 30,119
Interest 7,268 7,269 5,422 6,778b 7,075 7,618 8,257
International reserves (US$ m)
Total international reserves 273,859 254,024 274,668 287,051 324,330 374,503 390,640
a Actual. b Economist Intelligence Unit estimates. c Economist Intelligence Unit forecasts. d Fiscal years (beginning April 1st of year indicated).
Source: IMF, International Financial Statistics.

India 19
Country Report November 2011 www.eiu.com © The Economist Intelligence Unit Limited 2011
Quarterly data Pl ea se se e g ra p hi c b el ow
2009 2010 2011
3 Qtr 4 Qtr 1 Qtr 2 Qtr 3 Qtr 4 Qtr 1 Qtr 2 Qtr
Central government finance (Rs m)
Revenue 1,784 1,465 2,084 2,020 2,027 2,109 2,143 986
Expenditure 2,519 2,587 3,110 2,422 2,958 2,489 4,121 2,612
Balance -735 -1,122 -1,085 -402 -931 -380 -1,978 -1,627
Output
GDP at constant 1999/2000 prices (Rs bn)a 12,217 12,734 12,743 13,061 13,370 13,675 13,832 14,058
Real GDP (% change, year on year) 9.6 12.8 9.2 9.1 9.4 7.4 8.5 7.6
Industrial production index (1993/94=100) 149.1 153.5 165.9 157.0 159.2 166.7 179.0 167.5
Industrial production (% change, year on year) 2.8 6.1 14.0 9.6 6.8 8.6 7.9 6.7
Prices
Consumer prices, industrial workers (2001=100) 160.3 166.0 171.4 173.6 177.1 181.4 186.9 189.0
Consumer prices (% change, year on year) 11.6 13.2 15.0 13.7 10.5 9.3 9.0 8.9
Wholesale prices (1993/94=100)
General index 128.6 132.7 136.5 138.7 140.7 144.5 149.3 152.1
Fuel 131.6 134.4 137.5 142.4 147.8 149.0 154.1 160.5
Manufactured goods 121.9 123.6 126.1 127.9 128.4 130.0 134.1 137.3
Financial indicators
Exchange rate Rs:US$ (av) 48.4 46.6 45.9 45.6 46.5 44.9 45.3 44.7
Exchange rate Rs:US$ (end-period) 48.0 46.7 45.1 46.6 44.9 44.8 44.7 44.7
Deposit rate (av; %) 7.8 7.5 7.5 7.5 7.6 8.2 9.3 9.3
Lending rate (av; %) 12.0 12.0 12.0 12.0 8.0 8.7 9.3 9.8
3-month money market rate (av; %) 4.8 4.8 5.0 5.3 6.0 6.3 6.8 7.5
M1 (end-period; Rs bn)b 13,103 13,268 14,946 14,867 15,166 15,914 16,356 15,907
M1 (% change, year on year) 15.1 17.9 19.3 19.2 15.7 19.9 9.4 7.0
M3 (end-period; Rs bn)b 50,944 52,093 55,998 57,106 58,910 62,251 64,995 66,860
M3 (% change, year on year) 19.4 17.4 17.5 15.7 15.6 19.5 16.1 17.1
BSE Sensex (end-period; 1978/79=100) 17,127 17,465 17,528 17,701 20,069 20,509 19,445 18,846
BSE Sensex (% change, year on year) 33.2 81.0 80.5 22.1 17.2 17.4 10.9 6.5
Sectoral trends
Production index (1993/94=100)
Manufacturing 158.1 162.0 175.1 165.4 169.8 176.9 190.7 177.6
Mining 113.7 127.1 139.9 126.8 120.9 135.1 141.4 127.5
Electricity 238.8 232.0 243.4 247.9 243.9 247.1 263.2 268.3
Foreign trade (US$ m)
Exports fob 42,551 46,232 51,496 54,221 50,907 59,355 73,337 79,003
Imports cif -65,691 -79,184 -80,822 -81,203 -85,990 -80,615 -95,031 -110,614
Trade balance -23,140 -32,952 -29,326 -26,982 -35,083 -21,260 -21,694 -31,611
Foreign payments (US$ m)b
Merchandise trade balance fob-fob -29,582 -30,927 -31,492 -31,859 -37,284 -31,464 -29,705 -35,413
Services balance 7,663 8,166 8,052 9,588 11,674 11,894 14,510 12,068
Income balance -1,072 -2,481 -2,132 -2,859 -4,165 -3,985 -3,854 -4,343
Net transfer payments 13,817 13,039 12,574 13,027 12,977 13,578 13,802 13,607
Current-account balance -9,174 -12,203 -12,841 -12,102 -16,798 -9,977 -5,355 -14,105
Reserves excl gold (end-period) 270,855 265,182 261,393 256,334 272,490 275,277 282,517 291,724
a At market prices. b Reserve Bank of India.
Sources: IMF, International Financial Statistics; Centre for Monitoring Indian Economy, Monthly Review of the Indian Economy; Financial Times; Reserve Bank of India.

20 India
Country Report November 2011 www.eiu.com © The Economist Intelligence Unit Limited 2011
Monthly data Pl ea se se e g ra p hi c b el ow
Jan Feb Mar Apr May Jun Jul Aug Sep Oct Nov Dec
Exchange rate Rs:US$ (av) 2009 48.8 49.3 51.2 50.1 48.5 47.8 48.5 48.3 48.4 46.7 46.6 46.6
2010 46.0 46.3 45.5 44.5 45.8 46.6 46.8 46.6 46.1 44.4 45.0 45.2
2011 45.4 45.4 45.0 44.4 44.9 44.9 44.4 45.3 n/a n/a n/a n/a
Exchange rate Rs:US$ (end-period) 2009 49.0 50.7 50.9 50.2 47.3 47.9 48.2 48.9 48.0 47.0 46.5 46.7
2010 46.4 46.2 45.1 44.4 46.4 46.6 46.5 47.1 44.9 44.5 46.0 44.8
2011 46.0 45.2 44.7 44.4 45.0 44.7 44.2 46.0 n/a n/a n/a n/a
Money supply M1 (% change, year on year) 2009 9.8 11.4 9.6 13.6 14.4 13.0 15.0 15.5 15.1 16.2 17.1 17.9
2010 18.9 17.5 19.3 15.7 15.7 19.2 19.4 17.3 15.7 19.8 21.1 19.9
2011 14.1 13.9 9.4 11.0 9.1 7.0 4.5 5.3 n/a n/a n/a n/a
Money supply M3 (% change, year on year) 2009 20.1 19.9 19.0 21.3 21.0 20.5 21.5 19.7 19.4 18.8 18.5 17.4
2010 17.5 17.0 17.5 15.6 14.9 15.7 16.3 15.9 15.6 17.8 17.0 19.5
2011 16.7 16.9 16.1 18.0 17.4 17.1 16.4 16.9 n/a n/a n/a n/a
Money market rate (end-period; %) 2009 5.50 5.50 5.00 4.75 4.75 4.75 4.75 4.75 4.75 4.75 4.75 4.75
2010 4.75 4.75 5.00 5.25 5.25 5.25 5.75 5.75 6.00 6.00 6.25 6.25
2011 6.50 6.50 6.75 6.75 7.25 7.50 8.00 8.00 8.25 n/a n/a n/a
Lending rate (av; %) 2009 12.5 12.5 12.5 12.3 12.3 12.3 12.0 12.0 12.0 12.0 12.0 12.0
2010 12.0 12.0 12.0 12.0 12.0 12.0 8.0 8.0 8.0 8.5 8.5 9.0
2011 9.0 9.5 9.5 9.5 10.0 10.0 10.8 n/a n/a n/a n/a n/a
Industrial production (% change, year on year) 2009 -5.3 -7.2 -5.2 -1.9 -1.7 -1.8 1.7 5.3 1.6 2.4 6.3 9.5
2010 13.3 13.7 14.9 13.1 8.5 7.4 9.9 4.5 6.1 11.3 6.4 8.2
2011 7.5 6.7 9.4 5.3 5.9 8.8 3.3 n/a n/a n/a n/a n/a
BSE Sensex stockmarket index (end-period; 1978/79=100) 2009 9,424 8,892 9,709 11,403 14,625 14,494 15,670 15,667 17,127 15,896 16,926 17,465
2010 16,358 16,430 17,528 17,559 16,945 17,701 17,868 17,971 20,069 20,032 19,521 20,509
2011 18,328 17,823 19,445 19,136 18,503 18,846 18,197 16,677 16,454 n/a n/a n/a
Consumer prices, industrial workers (% change, year on year; av) 2009 10.4 9.7 8.4 8.7 9.0 9.2 11.8 11.5 11.4 11.4 13.4 14.8
2010 16.0 14.8 14.3 13.8 13.5 13.8 11.3 10.2 10.1 9.9 8.3 9.6
2011 9.3 8.9 9.0 9.1 9.0 8.5 8.4 9.1 n/a n/a n/a n/a
Wholesale prices (% change, year on year; av) 2009 5.8 3.6 1.5 1.1 1.5 -0.4 -0.3 0.6 1.5 1.9 4.8 7.1
2010 8.6 9.6 10.2 10.8 10.4 10.3 10.1 8.9 9.1 9.2 8.2 9.3
2011 9.3 9.4 9.6 9.6 9.6 9.6 9.4 9.9 n/a n/a n/a n/a
Total exports fob (US$ m) 2009 12,869 11,941 12,916 12,475 12,316 13,606 14,341 13,586 14,624 14,806 14,933 16,493
2010 15,557 15,758 20,181 17,742 16,531 19,948 16,240 16,644 18,023 17,960 18,895 22,500
2011 20,605 23,597 29,135 23,849 25,941 29,213 29,344 24,313 n/a n/a n/a n/a
Total imports cif (US$ m) 2009 18,228 15,062 16,597 19,323 20,037 23,013 21,724 22,440 21,527 25,936 24,997 28,251
2010 25,267 26,164 29,391 28,770 26,550 25,883 29,170 29,679 27,141 27,689 27,796 25,130
2011 28,587 31,701 34,743 32,834 40,907 36,873 40,426 38,354 n/a n/a n/a n/a

India 21
Country Report November 2011 www.eiu.com © The Economist Intelligence Unit Limited 2011
Jan Feb Mar Apr May Jun Jul Aug Sep Oct Nov Dec
Trade balance fob-cif (US$ m) 2009 -5,359 -3,121 -3,681 -6,848 -7,721 -9,407 -7,383 -8,854 -6,903 -11,130 -10,064 -11,758
2010 -9,710 -10,406 -9,210 -11,028 -10,019 -5,935 -12,930 -13,035 -9,118 -9,729 -8,901 -2,630
2011 -7,982 -8,104 -5,608 -8,985 -14,966 -7,660 -11,082 -14,041 n/a n/a n/a n/a
Foreign-exchange reserves excl gold (US$ m) 2009 239,692 239,491 242,345 242,658 252,608 255,248 261,865 267,318 270,855 273,460 269,969 265,182
2010 262,904 260,442 261,393 261,414 254,636 256,334 265,513 263,145 272,490 276,457 270,430 275,277
2011 277,726 279,878 282,517 290,408 287,805 291,724 294,419 294,348 n/a n/a n/a n/a
Sources: IMF, International Financial Statistics; Haver Analytics.

22 India
Country Report November 2011 www.eiu.com © The Economist Intelligence Unit Limited 2011
Annual trends charts Pl ea se se e g ra p hi c b el ow

India 23
Country Report November 2011 www.eiu.com © The Economist Intelligence Unit Limited 2011
Quarterly trends charts Pl ea se se e g ra p hi c b el ow
Quarterly trends charts
Real GDP growth(% change, year on year)
Consumer price inflation(av; %)
Imports and domestic demand(% change, year on year)
Exports of goods and services(% change, year on year)
Interest rates(av; %)
Exchange rate(Rs:US$; av; inverted scale)
Source: Economist Intelligence Unit.Source: Economist Intelligence Unit.
Source: Economist Intelligence Unit.Source: Economist Intelligence Unit.
Source: Economist Intelligence Unit.Source: Economist Intelligence Unit.
-2.0
0.0
2.0
4.0
6.0
8.0
10.0
12.0
14.0
16.0Quarter on quarter Year on year
Q112
Q111
Q110
Q109
Q108
Q107
Q106
Q105
Q104
Q12003
-20.0
-10.0
0.0
10.0
20.0
30.0
40.0
50.0
60.0Domestic demandImports of goods & services
Q112
Q111
Q110
Q109
Q108
Q107
Q106
Q105
Q104
Q12003
4.0
5.0
6.0
7.0
8.0
9.0
10.0
11.0
12.0
13.0
14.0Money market interest rateLending interest rate
Q112
Q111
Q110
Q109
Q108
Q107
Q106
Q105
Q104
Q12003
0.0
2.0
4.0
6.0
8.0
10.0
12.0
14.0
Q112
Q111
Q110
Q109
Q108
Q107
Q106
Q105
Q104
Q12003
52.0
50.0
48.0
46.0
44.0
42.0
40.0
38.0
Q112
Q111
Q110
Q109
Q108
Q107
Q106
Q105
Q104
Q12003
-20.0
-10.0
0.0
10.0
20.0
30.0
40.0
50.0
60.0
70.0
Q112
Q111
Q110
Q109
Q108
Q107
Q106
Q105
Q104
Q12003

24 India
Country Report November 2011 www.eiu.com © The Economist Intelligence Unit Limited 2011
Monthly trends charts Pl ea se se e g ra p hi c b el ow
Monthly trends charts
Price inflation (% change, year on year)
Oil: Brent crude price (US$/b; av)
Foreign trade (US$ m; goods only)
Index of industrial activity (av; 1996=100)
Exchange rate (Rs:US$; av; inverted scale)
Foreign-exchange reserves(US$ m)
Source: Economist Intelligence Unit.Source: Economist Intelligence Unit.
Source: Economist Intelligence Unit.Source: Economist Intelligence Unit.
Source: Economist Intelligence Unit.Source: Economist Intelligence Unit.
52.0
50.0
48.0
46.0
44.0
42.0
40.0
38.0
JulAprJan11
OctJulAprJan10
OctJulAprJan09
OctJulAprJan2008
230,000
240,000
250,000
260,000
270,000
280,000
290,000
300,000
310,000
JulAprJan11
OctJulAprJan10
OctJulAprJan09
OctJulAprJan2008
130
140
150
160
170
180
190
JulAprJan11
OctJulAprJan10
OctJulAprJan09
OctJulAprJan2008
20
40
60
80
100
120
140
JulAprJan11
OctJulAprJan10
OctJulAprJan09
OctJulAprJan2008
-2.0
0.0
2.0
4.0
6.0
8.0
10.0
12.0
14.0
16.0
18.0 Producer prices Consumer prices
JulAprJan11
OctJulAprJan10
OctJulAprJan09
OctJulAprJan2008
-20,000
-10,000
0
10,000
20,000
30,000
40,000
50,000 Balance Imports Exports
JulAprJan11
OctJulAprJan10
OctJulAprJan09
OctJulAprJan2008

India 25
Country Report November 2011 www.eiu.com © The Economist Intelligence Unit Limited 2011
Comparative economic indicators Pl ea se se e g ra p hi c b el ow
Comparative economic indicators, 2010
Gross domestic product(US$ bn; market exchange rates)
Gross domestic product(% change, year on year)
Consumer prices(% change, year on year)
Sources: Economist Intelligence Unit estimates; national sources.
Sources: Economist Intelligence Unit estimates; national sources.Sources: Economist Intelligence Unit estimates; national sources.
Sources: Economist Intelligence Unit estimates; national sources.
Gross domestic product per head(US$ '000; market exchange rates)
0 500 1,000 1,500 2,000
Laos
Papua New Guinea
Cambodia
Myanmar
Sri Lanka
Bangladesh
Vietnam
New Zealand
Pakistan
Philippines
Singapore
Hong Kong
Malaysia
Thailand
Taiwan
Indonesia
South Korea
Australia
India
Japan
China
0.0 10.0 20.0 30.0 40.0 50.0 60.0
Bangladesh
Myanmar
Cambodia
Pakistan
Laos
Vietnam
Papua New Guinea
India
Philippines
Sri Lanka
Indonesia
China
Thailand
Malaysia
Taiwan
South Korea
Hong Kong
New Zealand
Japan
Singapore
Australia
-2.0 0.0 2.0 4.0 6.0 8.0 10.0 12.0 14.0
Japan
Taiwan
Malaysia
New Zealand
Hong Kong
Singapore
Australia
South Korea
China
Thailand
Philippines
Cambodia
Indonesia
Laos
Sri Lanka
Papua New Guinea
Myanmar
Bangladesh
Vietnam
India
Pakistan
0.0 2.0 4.0 6.0 8.0 10.0 12.0 14.0 16.0
New Zealand
Australia
Myanmar
Japan
Pakistan
Cambodia
Bangladesh
Indonesia
South Korea
Vietnam
Hong Kong
Papua New Guinea
Malaysia
Philippines
Thailand
Laos
Sri Lanka
India
China
Taiwan
Singapore
5,926.0
5,460.2

26 India
Country Report November 2011 www.eiu.com © The Economist Intelligence Unit Limited 2011
Country snapshot
Basic data
3,287,263 sq km (including Indian-administered Kashmir); of the total, 57% is agricultural land and 16% is forest area
1.13bn (mid-2007 estimate)
Population in millions, 2001 census
Mumbai (Bombay) 16.4 Kolkata (Calcutta) 13.2 New Delhi 12.8 Chennai (Madras) 6.4 Bangalore 5.7 Hyderabad 5.5
Varied; humid subtropical in Ganges basin, semi-arid in the north-west, tropical humid in north-east and most of the peninsula, tundra in the Himalayas; all areas receive rain from the south-west monsoon in June-September; the south is also served by the north-east monsoon in January-March
Hottest month, May, 26-41°C (average daily minimum and maximum); coldest month, January, 7-21°C; driest month, November, 4 mm average rainfall; wettest month, July, 180 mm average rainfall
Hindi is the national language and the primary tongue of 30% of the population. There are 14 other official languages: Bengali, Telugu, Marathi, Tamil, Urdu, Gujarati, Malayalam, Kannada, Oriya, Punjabi, Assamese, Kashmiri, Sindhi and Sanskrit. English is widespread in business circles and as a second language
Hindu (80.5% in 2001 census); Muslim (13.4%); Christian (2.3%); Sikh (1.9%); Buddhist (0.8%); Jain (0.4%)
Metric system. Numbers are often written in lakhs (100,000) and crores (10m)
Rupee (Rs); Rs1 = 100 paisa. Average exchange rate in 2010: Rs45.7:US$1
April 1st-March 31st
5 hours 30 minutes ahead of GMT
Republic Day (January 26th); Independence Day (August 15th); Mahatma Gandhi's birthday (October 2nd); also major Hindu, Muslim, Christian and other religious holidays
Population
Main towns
Climate
Weather in New Delhi (altitude 218 metres)
Languages
Measures
Currency
Fiscal year
Time
Public holidays
Religions
Land area

India 27
Country Report November 2011 www.eiu.com © The Economist Intelligence Unit Limited 2011
Political structure
Republic of India
Federal republic, with 28 states and seven union territories
The president, Pratibha Patil, was elected in July 2007 for a five-year term by the members of the central and state legislatures
The prime minister presides over a Council of Ministers chosen from the elected members of parliament
Bicameral. The Rajya Sabha (the upper house) has 245 members�233 elected by weighted votes of the elected members of parliament and the legislative assemblies of states and union territories, and 12 appointed by the president. The Lok Sabha (the lower house) has 545 members�543 elected from single-member constituencies (79 seats are reserved for "scheduled castes" and 40 for "scheduled tribes"), and two representatives of Anglo-Indians appointed by the president
Unicameral or bicameral, with elected members; state governors are appointed by the president
Based on the 1950 constitution and English common law
The United Progressive Alliance (UPA), a coalition led by the Indian National Congress, won the largest number of seats in the April-May 2009 general election and formed a government
The most recent Lok Sabha election was held in April-May 2009; the next is due by May 2014
Indian National Congress; Bharatiya Janata Party (BJP); All India Trinamool Congress (TMC); Dravida Munnetra Kazhagam (DMK); Samajwadi Party (SP); Rashtriya Janata Dal (RJD); Janata Dal (United); Bahujan Samaj Party (BSP); All India Dravida Munnetra Kazhagam (AIADMK); Bijou Janata Dal (BJD); Nationalist Congress Party (NCP); Communist Party of India (Marxist), or CPI (M)
Prime minister Manmohan Singh (Congress)
Agriculture, consumer affairs, food & public distribution Sharad Pawar (NCP) Commerce & industry Anand Sharma (Congress) Communications & information technology Kapil Sibal (Congress) Defence A K Antony (Congress) External affairs S M Krishna (Congress) Finance Pranab Mukherjee (Congress) Heavy industries & public enterprises Praful Patel (NCP) Home affairs P Chidambaram (Congress) Information & broadcasting Ambika Soni (Congress) Law & justice M Veerappa Moily (Congress) Petroleum & natural gas Jaipal Reddy (Congress) Power Sushilkumar Shinde (Congress) Railways Dinesh Trivedi (TMC) Steel Beni Prasad Verma (Congress) Urban development Kamal Nath (Congress)
Duvvuri Subbarao
Official name
Form of state
Head of state
The executive
National legislature
State legislatures
Legal system
National government
National election
Main political organisations
Central bank governor
Key ministers