country report france 2016 including an in-depth review on the prevention and correction of...
TRANSCRIPT
EN EN
EUROPEAN COMMISSION
Brussels, 26.2.2016
SWD(2016) 79 final
COMMISSION STAFF WORKING DOCUMENT
Country Report France 2016
Including an In-Depth Review on the prevention
and correction of macroeconomic imbalances
This document is a European Commission staff working document. It does not
constitute the official position of the Commission, nor does it prejudge any such position.
Executive summary 1
1. Scene setter: Economic situation and outlook 4
2. Imbalances, risks, and adjustment issues 13
2.1. Potential growth 13
2.2. Recent developments in French export performance 17
2.3. Cost competitiveness and labour market rigidities 23
2.4. Profit margin, investment and non-cost competitiveness 31
2.5. Private and public indebtedness 37
2.6. Evolution of public expenditure 41
2.7. Quality of public expenditure 46
2.8. Euro area spillovers 53
2.9. MIP assessment matrix 59
3. Additional structural issues 61
3.1. Business environment and competition in product markets 61
3.2. Labour market, education and social situation 67
3.3. Innovation 73
3.4. Taxation 76
A. Overview Table 81
B. MIP scoreboard indicators 88
C. Standard Tables 89
LIST OF TABLES
1.1. Key economic, financial and social indicators — France 12
2.2.1. Revealed comparative advantages (RCA) index 18
2.7.1. Public expenditure (as % of GDP) 46
2.7.2. Pensions expenditure (as % of total public expenditure) 46
2.9.1. MIP Assessment Matrix (*) - France 59
3.1.1. Productivity level in manufacturing by enterprise size class, 2013 63
B.1. The MIP scoreboard for France 88
C.1. Financial market indicators 89
C.2. Labour market and social indicators 90
C.3. Labour market and social indicators (cont.) 91
C.4. Structural policy and business environment indicators 92
CONTENTS

C.5. Green growth 93
LIST OF GRAPHS
1.1. Contribution to GDP growth (2007-2017) 4
1.2. GDP in volume (2008=100) 5
1.3. Composition of the external position 7
1.4. Composition of the net international investment position 7
2.1.1. Potential GDP growth in selected countries 13
2.1.2. Potential GDP growth breakdown in France 13
2.1.3. Potential TFP growth in selected countries 14
2.2.1. Export market shares in value 17
2.2.2. Differences in evolution of export market shares in value and in volume (% and pp.) 17
2.2.3. Trade in goods and services (growth rate in volume, %) 18
2.2.4. Export growth (%) and exchange rate elasticity 20
2.2.5. Exports of selected sectors (in value) 21
2.2.6. Trade balance breakdown 22
2.3.1. The moderation of nominal wage growth has been very gradual in France 23
2.3.2. Real base wage Phillips curve 23
2.3.3. Labour productivity and real compensation per employee: France and rest of the euro
area (whole economy, 2000=100) 24
2.3.4. Effect on wage growth of a 1 % increase in inflation and the Smic for different categories 25
2.3.5. Impact on the distribution of wages of a 1 % increase in the minimum wage (%) 25
2.3.6. Smic and variables used for its update (% change with respect to same quarter in the
previous year) 26
2.3.7. Minimum wage as a share of the median wage in EU Member States 26
2.3.8. Employers’ social security contributions for minimum and median wage earners 27
2.4.1. Profit margins of corporations 31
2.4.2. Change in profit margins of corporations, 2000-2014 32
2.4.3. Investment rate developments, non-financial corporations, France, 2000-2015 33
2.4.4. Investment motivation, manufacturing industry, France, 1991-2015 34
2.4.5. Investment rate by firm size, non-financial corporations, France, 2014 35
2.5.1. Household and NFC indebtedness 37
2.5.2. Valuation levels and latest house price growth (2014) 38
2.5.3. Difference in debt dynamics between France and the euro area 39
2.5.4. Gross public debt as % of GDP in 2026 - France 40
2.5.5. Gross public debt as % of GDP 40
2.6.1. Evolution of government expenditure to GDP 41
2.6.2. Composition of government expenditure in France 43
2.6.3. Comparison of government expenditure with the euro area and Scandinavian Member
States and over time 43

2.6.4. Composition of local authorities’ expenditure in France in 2013 44
2.7.1. Efficiency of public pension expenditure 47
2.7.2. Healthy life expectancy at birth versus public spending (2013) 48
2.7.3. Housing expenditure in 2013 (% of GDP) 51
2.7.4. Number of dwellings authorized and started 51
2.8.1. Exports to France in value added as a percentage of exporters’ GDP (in %; top 15 EU
countries) 53
2.8.2. French exports in value added as a percentage of French GDP (in %) 53
2.8.3. Partners’ exposures to French liabilities (top EU 15, excl. LU) 54
2.8.4. France — EU bank claims, by sector 55
3.1.1. World Bank Doing Business 2016 indicator - distance to the frontier of best performance 61
3.1.2. Break-down of firms by employee number 62
3.1.3. Barriers to competition in the business services sector* (2014, lhs) and Domestic services
value added, share of gross exports in total manufacturing (2011, rhs) 64
3.2.1. Beveridge curve, France 67
3.2.2. Share of up to one month length contracts in all new hires by sector, 2000-2015 68
3.2.3. Youth unemployment rate by education compared to unemployment in France 70
3.2.4. Evolution of number of apprenticeships by level 1996-2014 71
3.3.1. French R&D intensity (% of GDP) 73
3.3.2. R&D intensity by source (2014) (% of GDP) 73
3.3.3. Public support to private R&D 75
3.4.1. Overall tax burden (receipts from taxes, excluding imputed social security contributions) 76
3.4.2. Total taxes on corporations, % of GDP 76
3.4.3. Total taxes on consumption 77
3.4.4. Factors impacting the loss of revenue as compared to an ideal VAT system 78
3.4.5. Debt-equity bias in EU Member States - 2015 79
LIST OF BOXES
1.1. Investment challenges 9
1.2. Contribution of the EU Budget to structural change 11
2.1.1. Macroeconomic impact of selected structural reforms 16
2.2.1. Concentration of French exports 19
2.3.1. Collective bargaining and labour law in France and selected EU countries 30
2.6.1. Completing the picture: Tax expenditure 45
2.7.1. ONDAM (Objectif National de Dépenses d’Assurance Maladie) 49
2.8.1. Specific monitoring report 57

1
This country report assesses France’s economy in
the light of the European Commission’s Annual
Growth Survey published on 26 November 2015.
The survey recommends three priorities for the
EU’s economic and social policy in 2016: re-
launching investment, pursuing structural reforms
to modernise Member States’ economies, and
responsible fiscal policies. At the same time, the
Commission published the Alert Mechanism
Report that initiated the fifth annual round of the
macroeconomic imbalance procedure. The Alert
Mechanism Report identified France as warranting
a further in-depth review.
In France, growth is expected to remain
moderate, as investment is projected to pick up
only gradually and net exports to remain a drag
on growth. After three years of weak activity,
GDP growth improved to 1.1 % in 2015, supported
by favourable external factors. In particular,
growth benefited from reduced oil prices, the
euro’s depreciation and policy measures to reduce
the cost of labour and strengthen competitiveness.
France’s economy is expected to gradually further
accelerate, driven by private consumption on the
back of a dynamic households’ purchasing power.
However, France’s growth rate remains below the
euro-area average. In recent years, GDP growth
has been held back by investment. The recovery in
investment is expected to only take hold in 2017,
as policy measures to reduce the cost of labour and
strengthen competitiveness are expected to foster
business confidence with a lag. Inflation has fallen
to 0.1 % in 2015 and is expected to increase only
moderately to 0.6 % in 2016. Moreover, the
slowdown in emerging markets and the recent
financial market turmoil might weigh on the
economic outlook.
While France’s current account balance has
recently improved, its competitiveness remains
a source of concern. The contribution of net
exports to GDP has been negative in the past few
years and is expected to remain so until 2017.
External debt sustainability is less a concern for
France. Weak competitiveness reflects both cost
factors, in part due to accumulated real wage
increases in a context of low productivity growth,
and non-cost factors, in particular linked to past
depressed profit margins and their effects on
investment strategies.
Since the beginning of the crisis, France has
reduced its deficit more slowly than the rest of
the euro area which results in diverging debt
developments. The general government deficit
and debt, expected at 3.7 % and 96.2 % of GDP
respectively in 2015, remain high. The public debt-
to-GDP ratio continues increasing while it declines
in the euro area. Moreover, the economic
environment, characterised by a decline in
potential growth and low inflation, complicates the
reduction in public debt.
In the long term, growth is expected to remain
weak, as French potential growth has slowed
down since the 2008 financial crisis. While
averaging 1.8 % from 2000 to 2008, French
potential GDP growth is estimated at 1.0 % on
average from 2009 to 2017. Labour and product
market rigidities, slow resource reallocation and
technology adoption limit total factor productivity
growth. Productivity growth has also been
hampered by the regulatory burden facing French
firms and by size-related thresholds. The overall
tax burden on the economy continues to increase
and its composition is not growth-friendly.
Potential growth also crucially depends on the
labour force’s skills and on the innovation capacity
of the French economy, which is lower than that of
some of its main competitors.
The unemployment rate, at 10.5 % in 2015, is
not expected to decline in the short term. The
high unemployment rate is an indirect result of
France’s imbalances. With the recovery underway
still being gradual and a dynamic growth rate of
the labour force, the measures to reduce the costs
of labour are likely to have only a limited impact
on employment up to 2017. Moreover, the
structure of the labour market appears more and
more segmented and educational inequalities are
widening. Jobseekers have only limited access to
training, the access of the low-qualified to
apprenticeships is decreasing and the educational
results of low achievers are dropping.
Overall, France has made some progress in
addressing the 2015 country-specific
recommendations. In the past year, an agreement
among social partners has enhanced the long-term
sustainability of complementary pension schemes
and the fiscal framework for local authorities has
been strengthened. The measures to reduce the cost
of labour are ongoing as planned, although they
EXECUTIVE SUMMARY
Executive summary
2
may only have a one-off effect on the
competitiveness of the French economy if not
accompanied by a package of labour market
measures aimed in particular at reforming the
wage-setting process and containing minimum
wage developments. Limited progress has been
made in improving the tax system, alleviating size-
related thresholds for firms, increasing incentives
to hire on open-ended contracts, making the annual
process of spending reviews linked to the
budgetary procedure more effective and removing
unjustified restrictions to the access to and exercise
of regulated professions. The budgetary strategy
has not been reinforced and the expenditure cuts
planned until 2017 have not been fully specified
yet. Finally, the adoption and implementation of
the announced reform of the labour code remains
key to facilitate the take-up of derogations from
general legal provisions as well the planned reform
of the unemployment benefit system to enhance its
financial sustainability and to provide more
incentives to reinsert unemployed workers back
into the labour market.
Regarding the progress in reaching the national
targets under the Europe 2020 Strategy, France is
performing well in reducing greenhouse gas
emissions, improving energy efficiency and
decreasing early school leaving, while more effort
is needed in increasing the employment rate, the
R&D intensity, the use of renewable energy, the
tertiary education and in reducing poverty.
The main findings of the in-depth review
contained in this report, and the related policy
challenges, are as follows:
France’s potential GDP growth has declined
since the onset of the crisis, despite having
strong demographic dynamics. Both capital
accumulation and total factor productivity
growth have declined significantly. The decline
in productivity growth is contributing to a
further deterioration in France’s
competitiveness and is exacerbating the
challenges posed by the high public debt.
The recent improvement in French export
performance is not a sign of structural
improvement but mainly driven by the
euro’s depreciation. Since the end of 2014,
exports have accelerated sharply in France.
However, this improvement is concentrated in
a few key sectors, in particular transport
equipment. The sum of the contributions from
transport equipment and energy, whose
improvement is mainly due to lower oil prices,
is larger than the overall improvement of the
French trade deficit since 2011.
The recent wage moderation, in a context of
low inflation and high unemployment,
remains insufficient to regain
competitiveness given the slowdown in
productivity growth. Real wage growth was
lower than productivity growth only in 2015.
The minimum wage indexation mechanism is
contributing to a delay in average wage
adjustments. The wage-setting process also
contributes to the increase in wage pressures
and the working time limits weigh on labour
costs.
The improvement in profit margins
observed since the end of 2014 is not
projected to translate into a higher
investment rate before 2017. Profit margins
have recently been supported by the
depreciation of the euro, the decrease in the oil
price and the measures to decrease the cost of
labour. Despite this increase in profit margins,
the investment growth rate declined in 2014
due to a lower growth of economic activity.
Moreover, companies’ expenditure remains
targeted towards less productive investments.
Specific challenges remain regarding private
R&D activities and in the energy sector.
Barriers to private investment are moderate.
The high regulatory burden and high corporate
tax rates are among the main obstacles to
investment.
High and growing public debt coupled with
deteriorated competitiveness and
productivity growth could be a source of
significant risks looking forward. There are
no immediate short-term risks, as interest rates
are low and the management of public debt is
sound. Nonetheless, there are significant
consolidation needs in the coming years to
bring down the deficit and the high public debt.
In the long term, risks are more contained due
to favourable demographic developments
Executive summary
3
compared to the rest of the EU. However,
under more adverse circumstances, such as a
lower productivity growth than currently
envisaged, fiscal risks would be increased.
While the debt burden for the private sector is
low and the profitability of companies has
improved, the combination of high public and
private debt is an additional risk factor.
The efficiency of public spending remains
limited. Public expenditure in France is one of
the highest in the euro area and has decreased
more slowly since 2010. Spending is high as is
the level of services provided, e.g. for pensions
and health care. Nonetheless, other Member
States achieve the same or better outcomes
with fewer resources.
The consolidation strategy is more focused
on across-the-board than selective measures.
France’s consolidation strategy is expenditure-
based. However, the focus is more on across-
the-board expenditure cuts and less on a
selective strategy to reap efficiency gains, in
particular on housing and local authorities
spending.
Given its central position in the euro area,
France is the source of potential spillovers to
other Member States while external
conditions affect its recovery. Its modest
recovery and structural weaknesses adversely
impact the European recovery and growth
potential. Conversely, the recovery of the
French economy is dependent on favourable
external conditions. The inflation environment
in the euro area is also crucial to reducing the
debt-to-GDP ratio and helping competitiveness
recover.
Other key economic issues analysed in this report
which point to particular challenges facing
France’s economy are the following:
The French business environment continues
to be middle-ranking in comparison to
major competitors. Despite ongoing
simplification efforts, a high regulatory burden
and fast-changing legislation are an issue and
size-related thresholds continue to weigh on
firms’ growth. Competition in services has
improved for some professions, but barriers
remain in place, with a significant number of
professions unaffected by recent reforms and
bottlenecks are preventing the development of
the digital economy.
The labour market performance remains
unsatisfactory and educational inequalities
have been widening during the last decade.
In 2015, the unemployment rate increased and
the labour market remained segmented, in
terms of both the education of the employed
labour force and contract length. The deficit
and the debt of the unemployment benefit
system are planned to further increase. In
addition the strict legislation of dismissal for
open-ended contracts increases their
complexity and uncertainty. Educational
inequalities linked to the socio-economic
background are among the highest in the
OECD countries. The link between education
and the labour market is still weak and the
access to apprenticeships is decreasing,
especially for the low-qualified. Although the
social situation remained generally stable since
2008, some population groups are now more
exposed to the risk of poverty, social exclusion
and poor housing conditions.
Despite strong government support,
innovation capacity is middle-ranking.
Private R&D remains relatively weak
compared to the best innovation performers in
Europe and structural changes in the French
economy are weighing on its growth prospects.
The proliferation of support schemes raises
concerns about their overall coordination and
consistency and may compromise their
effective take-up by SMEs.
The overall tax burden continues to increase
and its composition is not conducive to
economic growth as it weighs significantly
on production factors. Taxes on corporations
have started decreasing modestly in 2014 but
taxes on consumption, including VAT, remain
low as compared to the rest of the EU. The tax
system remains very complex, with a limited
tax base. Finally, the bias towards debt
financing induced by the corporate tax system
remains high.

4
Growth drivers and outlook
According to the 2016 winter forecast, GDP
growth is expected to gain momentum after
having stagnated over the last three years. The
expected gradual economic recovery in 2016 and
2017 (1.3 % and 1.7 % GDP growth) is set to be
mainly driven by private consumption (Graph 1.1),
as low inflation and sustained wage growth should
support consumer spending. The steep fall in oil
prices should improve the financial position of
households and businesses, hence stimulating
activity growth in 2016 and 2017.
Acceleration in investment is projected from
2017 onwards. Investment will mainly be
supported by the gradual recovery of aggregate
demand, against a background of favourable credit
conditions, reinforced by the European Central
Bank (ECB) monetary policy. Measures to reduce
labour costs and improve firms’ profit margins, i.e.
the EUR 20 billion ‘Crédit d'Impôt pour la
Compétitivité et l'Emploi' (CICE) (tax credit for
competitiveness and employment) and the
EUR 10 billion additional cuts in employers’
social contributions planned under the
‘responsibility and solidarity pact’ (RSP), are
expected to further boost investment only from
2017 onwards. However, equipment investment is
not expected to return to its pre-crisis level in the
medium term, so the extent of the recovery will be
limited.
Despite a rebound in external demand, net
exports are set to dampen growth in the
medium term. The expected increase in foreign
demand is projected to boost exports slightly from
2015, while the continued depreciation of the euro,
together with the CICE and the RSP, is expected to
push up somewhat export market shares. However,
net exports will continue to weigh on GDP growth,
as the rise in domestic demand leads to more
imports.
In a time of weak job creation, unemployment
remains high. The slow recovery and the
measures to reduce labour costs referred to above
are likely to have only a limited positive impact in
the short term, while the package of measures to
reduce unemployment announced in January 2016
was not taken into account in the winter forecast
published on 4 February 2016. The employment
gains would not be large enough to absorb the
growth of the labour force, and unemployment is
therefore expected to remain high (see
Section 3.2). This long-lasting deterioration in the
labour market has put into question the
sustainability of the unemployment benefit system,
as new negotiations between social partners are set
to start in the first quarter of 2016 and a new
agreement is planned for the first half of 2016. The
link between education and the labour market is
still weak with the low qualified experiencing
difficult transition, which might be explained by
the inefficient governance of the vocational
education and training and of the apprenticeship
systems. In that respect, the future personal
activity account (compte personnel d’activité), due
to enter into force in January 2017, may help
reduce disparities by attaching training rights
directly to workers.
Recent price developments in France reflect
external factors and weak aggregate demand.
Inflation has fallen since the end of 2012 to reach
0.1 % for the year 2015 as a whole. Inflation is
then projected to rebound moderately to 0.6 % in
2016 and 1.3 % in 2017, as the rebound in
domestic demand puts upward pressure on
consumer prices. These price developments are
thus unlikely to represent an immediate
deflationary risk, but they make it more difficult to
achieve the deleveraging necessary to ensure the
sustainability of public and private finances.
Graph 1.1: Contribution to GDP growth (2007-2017)
Source: Commission 2016 winter forecast
Growth prospects and potential growth
A growth model mainly driven by resilient
consumption helped the French economy
weather the global economic crisis relatively
well, but may now appear fragile, as a lack of
investment has weakened the supply side of the
economy to the benefit of imports. The absence
-4-3-2-101234
07 08 09 10 11 12 13 14 15(f) 16(f) 17(f)
%, pps
Inventories investment Investment (GFCF) Final consumption
Net exports Real GDP growth
1. SCENE SETTER: ECONOMIC SITUATION AND OUTLOOK

1. Scene setter: Economic situation and outlook
5
of a credit boom and the relatively limited weight
of exports in nominal GDP (27 % in 2007
compared with 46 % in Germany and 33 % in
Spain) helped to limit the impact of the credit
crunch and of the sharp slowdown in international
trade on the French economy. Consumption
(public and private) increased steadily from 2007
to 2010 at an average rate of 0.8 % and acted as an
automatic stabiliser. As a result, the fall in French
GDP was more modest and it rebounded above its
2008 level as early as 2011 (Graph 1.2). However,
economic growth has come to a standstill since the
second quarter of 2011 while the share of imports
to GDP has increased from 28 % in 2010 to 31 %
in 2014. As a result, unemployment has soared to
three million in early 2013, business and
household confidence declined while public and
private debt increased rapidly to 96 % and 143 %
of GDP respectively by 2014, on the back of large
general government deficits and a weak financial
situation for corporations.
Graph 1.2: GDP in volume (2008=100)
Source: European Commission
In the long term, growth is expected to remain
weak, as France’s potential growth has slowed
down since the 2008 financial crisis (see
Section 2.1). While averaging 1.8 % from 2000 to
2008, France’s potential GDP growth is expected
to remain at 1.0 % on average from 2009 to 2017.
This decline is observed in all major euro-area
economies, except Germany. However, in the case
of France, the trend is blurred by the dynamic
demographics, which explains much of the
potential GDP growth. The non-demographic
determinants of French potential GDP growth
depict a different picture. If the decrease in the
contribution of capital accumulation remains
relatively limited from an international
perspective, growth in total factor productivity has
significantly declined since 2000 (from 1.3 % in
2000 to 0.2 % in 2015). As a result, potential total
factor productivity growth in France has decoupled
from Germany. Labour and product market
rigidities limit total factor productivity growth.
France’s efforts to reduce rigidities have yielded
relatively modest results, as they have mostly
focused on product markets without addressing
labour market rigidities.
Productivity developments have also been
hampered by the regulatory burden facing
French firms and by size-related thresholds.
The French business environment continues to be
middle-ranking according to the World Bank and
the World Economic Forum surveys, pointing in
particular to the regulatory burden as a major area
of concern (see Section 3.1). Notably, the relative
slowness and cost of property registration, together
with frequent changes in legislation, continue to
negatively affect the perception of the French
business environment. The simplification
programme (‘choc de simplification’) launched in
2013 is being implemented as planned, but there
are still major bottlenecks for firms’ growth,
including size-related thresholds, in particular at
the levels of 10 and 50 employees, in spite of the
recent relaxation of these thresholds. Moreover,
SMEs are found less prone to invest in innovation
and adopt new technologies, thereby hampering
productivity growth.
Competition in the services market has
improved, but the benefits of the digital
economy have not been fully exploited.
Addressing barriers to competition that have been
traditionally higher in France than among some of
its main competitors, the Macron law of 6 August
2015 is easing the burden of anti-competitive
regulations in several sectors, such as legal
services. However, the impact of the legal
professions reform, in particular as regards tariffs,
will crucially depend on pending decrees, and
regulation remains strict in some other services
sectors, such as the healthcare sector. In addition,
the take-up of digital technologies by the overall
economy is weak, and France is lagging behind in
terms of digitisation and internationalisation of
existing firms, notably SMEs.
The overall tax burden on the economy
continues to increase and its composition is not
growth-friendly. Rising year-on-year since 2009,
it reached 45.9 % of GDP in 2014, the second
biggest tax burden in the EU (see Section 3.4).
Taxes weighing on corporations have started to
decrease modestly in 2014, but divergences remain
90
95
100
105
110
115
08 09 10 11 12 13 14 15(f) 16(f) 17(f)
Index, 2008=100
France Euro area Germany Spain Italy

1. Scene setter: Economic situation and outlook
6
with France’s main competitors. On the other
hand, taxes on consumption, including VAT, are
low as compared to the rest of the EU and
increasing at a very low pace. Besides, the tax
system remains extremely complex and little effort
has been made to simplify it or to broaden the tax
base.
Drivers of growth are not diversified enough in
particular towards investment. In a globally
competitive environment, consumption alone
cannot support long-term growth, if not
accompanied by a stronger supply side of the
economy. Manufacturing industry, the main
tradable sector contributing to exports, has seen its
share of total value added fall from 16 % in 2000
to 11 % in 2014, compared with a steady 20 %-
23 % over the same period in Germany. This
shows the fragility of French manufacturing firms
and their decreasing ability to capture aggregate
demand for goods, in spite of the recent turnaround
following the depreciation of the euro. Productive
investment in France is too low to support
productivity, competitiveness and growth.
The weakness of equipment investment points
to the fragility of the recovery. Equipment
investment remains 8 % below its pre-crisis level
and lower than in other Member States. Several
studies highlight the structural weakness of
equipment investment, which declined as a
percentage of total gross fixed capital formation
from 28.5 % in 2000 to 21.5 % in 2013. Weak
profit margins of firms, particularly in
manufacturing, have weighed on investment. The
ongoing measures to lower labour costs, namely
the ‘tax credit for competitiveness and
employment’ (CICE) and the ‘responsibility and
solidarity pact’ (RSP), together with lower oil
prices and the depreciation of the euro, have
recently improved the financial position of
companies, without having yet triggered any
turnaround in investment.
French export performance
The recent improvement in France’s export
market shares is fragile. Since 1999, France has
suffered severe export market share losses, which
have somewhat recently stabilised (see
Section 2.2). However, this recent stabilisation
relies on three well performing sectors — ‘air,
spacecraft and related machinery’, ‘motor
vehicles’, and ‘jewellery, bijouterie and related
articles’ — characterised by the leadership of a
few firms with a strong brand image. Excluding
these three sectors, exports of goods have been
broadly flat since 2012, at a level close to their
pre-crisis peak. Besides, the stabilisation in export
performance is not expected to prevent net exports
to continue to weigh on economic activity.
Cost competitiveness and labour market
rigidities
The losses in market shares over the last decade
have coincided with a weakening in cost
competitiveness that may partly be explained by
labour market rigidities (see Section 2.3). The
difference between unit labour cost developments,
which also take into account productivity, in
France and in Germany since 2000 shows a
weakening in France’s cost competitiveness vis-à-
vis Germany, equivalent to 17 % of France’s unit
labour costs. While this gap has been closing over
recent years, France remains one of the euro-area
countries with the highest hourly cost of labour
mainly due to the high labour tax wedge and
resilient wage growth. In a context of low
inflation, real wages have only slightly
decelerated, and the gap between real labour costs
and falling productivity growth has not been
bridged, in spite of ongoing measures to reduce the
tax burden on labour, notably the CICE and the
RSP.
Non-cost competitiveness and profit margins
Non-cost factors are also important in
explaining the weakening of France’s export
performance since 2000. Non-cost
competitiveness encompasses a variety of micro-
economic factors such as product quality,
innovation, design, after-sale service and
distribution networks (see Section 2.4). In France,
companies’ ability to perform well in these areas
was hampered by their low profit margins, which
continued to decline to 30.2 % of their value added
in 2014, the lowest level in the euro area, before
starting to improve again since end 2014.
Despite major public support, R&D intensity is
not sufficient to keep up with best performers.
It remains below the standards of EU innovation
leaders, notably Germany, Austria and the Nordic
European countries (see Section 3.3). This
1. Scene setter: Economic situation and outlook
7
performance is modest given the massive public
support to private R&D activities, mainly through
the stabilisation of the research tax credit (Credit
d’Impôt Recherche) that is relatively effective in
providing incentives for companies to invest in
R&D. However, the overall coordination and
consistency of innovation policy tools remain
weak and the evolution of the French economy is
structurally unfavourable to R&D spending, as the
share of the most R&D intensive sectors is
shrinking in the total value added of the economy.
As a consequence, the country is an innovation
follower and it is ranked tenth, just above the EU
average, according to the 2015 Commission’s
Innovation Union Scoreboard.
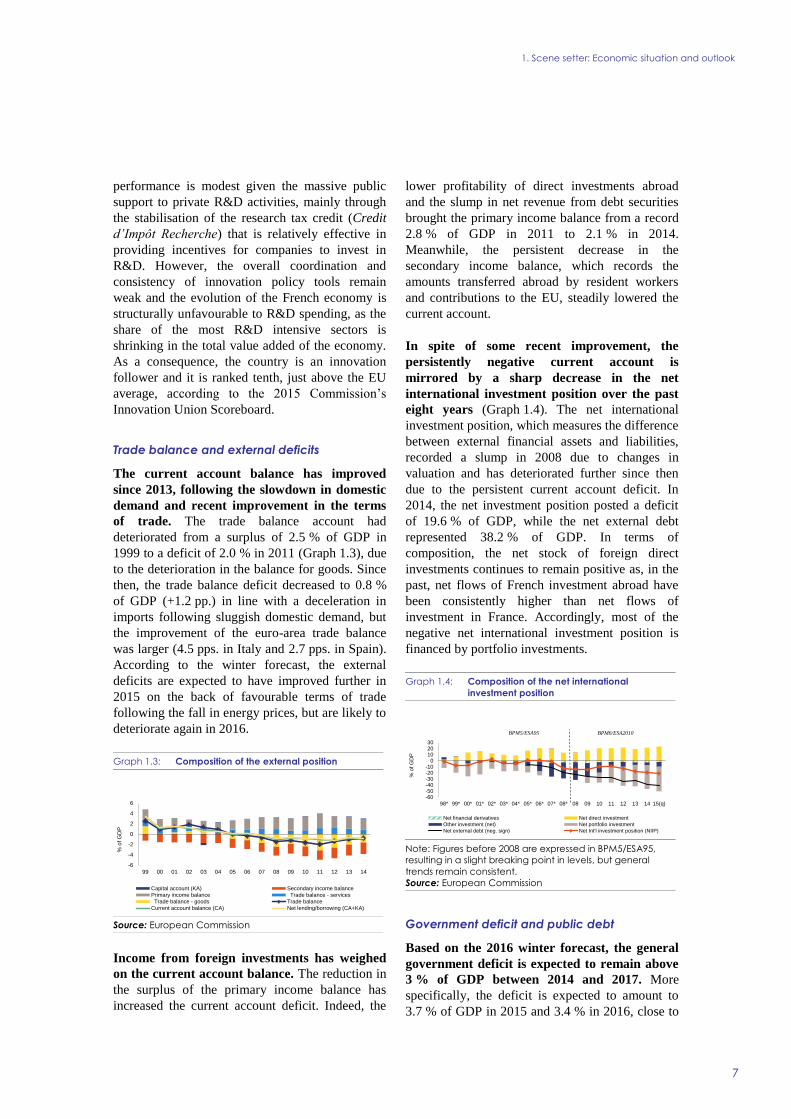
Trade balance and external deficits
The current account balance has improved
since 2013, following the slowdown in domestic
demand and recent improvement in the terms
of trade. The trade balance account had
deteriorated from a surplus of 2.5 % of GDP in
1999 to a deficit of 2.0 % in 2011 (Graph 1.3), due
to the deterioration in the balance for goods. Since
then, the trade balance deficit decreased to 0.8 %
of GDP (+1.2 pp.) in line with a deceleration in
imports following sluggish domestic demand, but
the improvement of the euro-area trade balance
was larger (4.5 pps. in Italy and 2.7 pps. in Spain).
According to the winter forecast, the external
deficits are expected to have improved further in
2015 on the back of favourable terms of trade
following the fall in energy prices, but are likely to
deteriorate again in 2016.
Graph 1.3: Composition of the external position
Source: European Commission
Income from foreign investments has weighed
on the current account balance. The reduction in
the surplus of the primary income balance has
increased the current account deficit. Indeed, the
lower profitability of direct investments abroad
and the slump in net revenue from debt securities
brought the primary income balance from a record
2.8 % of GDP in 2011 to 2.1 % in 2014.
Meanwhile, the persistent decrease in the
secondary income balance, which records the
amounts transferred abroad by resident workers
and contributions to the EU, steadily lowered the
current account.
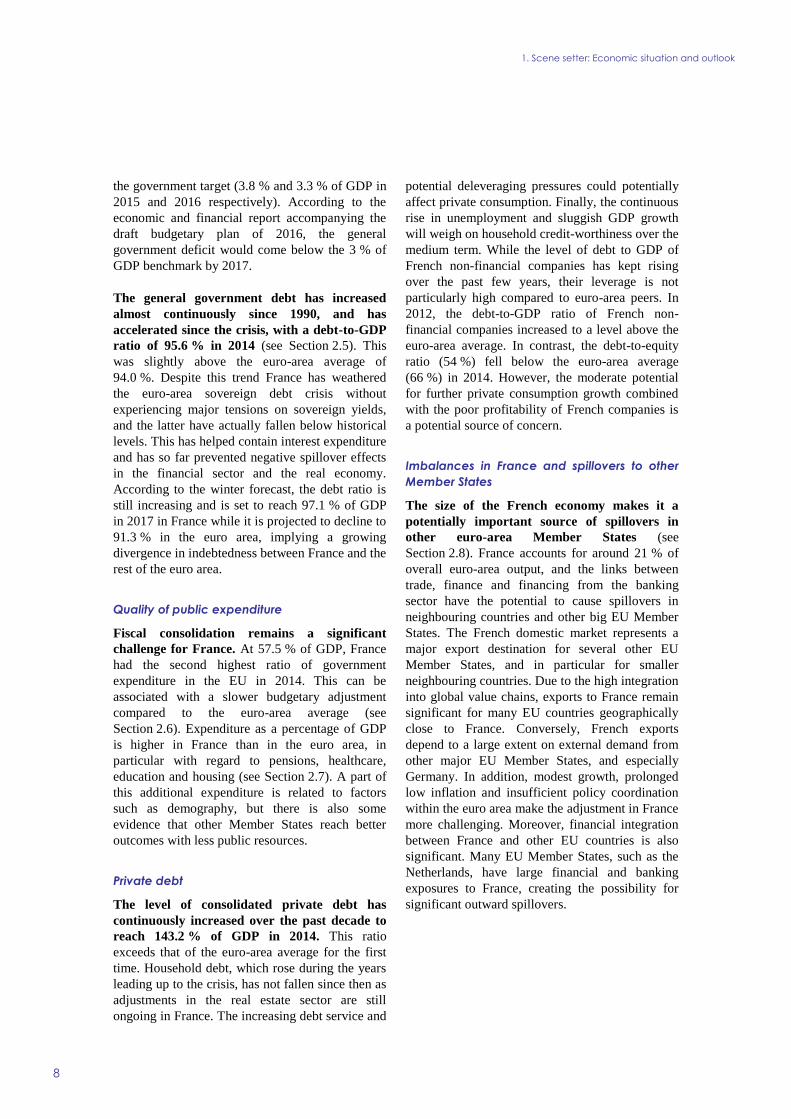
In spite of some recent improvement, the
persistently negative current account is
mirrored by a sharp decrease in the net
international investment position over the past
eight years (Graph 1.4). The net international
investment position, which measures the difference
between external financial assets and liabilities,
recorded a slump in 2008 due to changes in
valuation and has deteriorated further since then
due to the persistent current account deficit. In
2014, the net investment position posted a deficit
of 19.6 % of GDP, while the net external debt
represented 38.2 % of GDP. In terms of
composition, the net stock of foreign direct
investments continues to remain positive as, in the
past, net flows of French investment abroad have
been consistently higher than net flows of
investment in France. Accordingly, most of the
negative net international investment position is
financed by portfolio investments.
Graph 1.4: Composition of the net international
investment position
Note: Figures before 2008 are expressed in BPM5/ESA95,
resulting in a slight breaking point in levels, but general
trends remain consistent.
Source: European Commission
Government deficit and public debt
Based on the 2016 winter forecast, the general
government deficit is expected to remain above
3 % of GDP between 2014 and 2017. More
specifically, the deficit is expected to amount to
3.7 % of GDP in 2015 and 3.4 % in 2016, close to
-6
-4
-2
0
2
4
6
99 00 01 02 03 04 05 06 07 08 09 10 11 12 13 14
% o
f G
DP
Capital account (KA) Secondary income balance
Primary income balance Trade balance - services
Trade balance - goods Trade balance
Current account balance (CA) Net lending/borrowing (CA+KA)
-60-50-40-30-20-10
0102030
98* 99* 00* 01* 02* 03* 04* 05* 06* 07* 08* 08 09 10 11 12 13 14 15(q)
% o
f G
DP
Net financial derivatives Net direct investment
Other investment (net) Net portfolio investment
Net external debt (neg. sign) Net Int'l investment position (NIIP)
BPM6/ESA2010BPM5/ESA95
1. Scene setter: Economic situation and outlook
8
the government target (3.8 % and 3.3 % of GDP in
2015 and 2016 respectively). According to the
economic and financial report accompanying the
draft budgetary plan of 2016, the general
government deficit would come below the 3 % of
GDP benchmark by 2017.
The general government debt has increased
almost continuously since 1990, and has
accelerated since the crisis, with a debt-to-GDP
ratio of 95.6 % in 2014 (see Section 2.5). This
was slightly above the euro-area average of
94.0 %. Despite this trend France has weathered
the euro-area sovereign debt crisis without
experiencing major tensions on sovereign yields,
and the latter have actually fallen below historical
levels. This has helped contain interest expenditure
and has so far prevented negative spillover effects
in the financial sector and the real economy.
According to the winter forecast, the debt ratio is
still increasing and is set to reach 97.1 % of GDP
in 2017 in France while it is projected to decline to
91.3 % in the euro area, implying a growing
divergence in indebtedness between France and the
rest of the euro area.
Quality of public expenditure
Fiscal consolidation remains a significant
challenge for France. At 57.5 % of GDP, France
had the second highest ratio of government
expenditure in the EU in 2014. This can be
associated with a slower budgetary adjustment
compared to the euro-area average (see
Section 2.6). Expenditure as a percentage of GDP
is higher in France than in the euro area, in
particular with regard to pensions, healthcare,
education and housing (see Section 2.7). A part of
this additional expenditure is related to factors
such as demography, but there is also some
evidence that other Member States reach better
outcomes with less public resources.
Private debt
The level of consolidated private debt has
continuously increased over the past decade to
reach 143.2 % of GDP in 2014. This ratio
exceeds that of the euro-area average for the first
time. Household debt, which rose during the years
leading up to the crisis, has not fallen since then as
adjustments in the real estate sector are still
ongoing in France. The increasing debt service and
potential deleveraging pressures could potentially
affect private consumption. Finally, the continuous
rise in unemployment and sluggish GDP growth
will weigh on household credit-worthiness over the
medium term. While the level of debt to GDP of
French non-financial companies has kept rising
over the past few years, their leverage is not
particularly high compared to euro-area peers. In
2012, the debt-to-GDP ratio of French non-
financial companies increased to a level above the
euro-area average. In contrast, the debt-to-equity
ratio (54 %) fell below the euro-area average
(66 %) in 2014. However, the moderate potential
for further private consumption growth combined
with the poor profitability of French companies is
a potential source of concern.
Imbalances in France and spillovers to other
Member States
The size of the French economy makes it a
potentially important source of spillovers in
other euro-area Member States (see
Section 2.8). France accounts for around 21 % of
overall euro-area output, and the links between
trade, finance and financing from the banking
sector have the potential to cause spillovers in
neighbouring countries and other big EU Member
States. The French domestic market represents a
major export destination for several other EU
Member States, and in particular for smaller
neighbouring countries. Due to the high integration
into global value chains, exports to France remain
significant for many EU countries geographically
close to France. Conversely, French exports
depend to a large extent on external demand from
other major EU Member States, and especially
Germany. In addition, modest growth, prolonged
low inflation and insufficient policy coordination
within the euro area make the adjustment in France
more challenging. Moreover, financial integration
between France and other EU countries is also
significant. Many EU Member States, such as the
Netherlands, have large financial and banking
exposures to France, creating the possibility for
significant outward spillovers.

1. Scene setter: Economic situation and outlook
9
(Continued on the next page)
Box 1.1: Investment challenges
Section 1: Macroeconomic perspective
Total investment in France (measured as gross fixed capital formation) proved to be fairly resilient to
the crisis. As a percentage of GDP, total investment in France increased at an average annual growth rate of
1.1 % over the period 2000-2007. This growth rate was above both the euro-area and the EU average,
respectively being 0.3 % and 0.4 %. Between 2008 and 2014, total investment continued to increase, but
more slowly than during the period 2000-2007, so that the share of total investment in GDP slightly
decreased from 23.6 % in 2008 to 21.7 % in 2014. For the period 2015-2017, the share of investment in
GDP is projected to remain stable until 2016 and to start to increase again in 2017.
In 2014, both private and public investment stood above the EU average. In particular, Graph 1 breaks
down total investment by sector and by component. Between 2000 and 2008, the share of private investment
in GDP increased more rapidly in France than in the EU, catching up the EU threshold by the end of this
period. At the onset of the crisis, private investment dropped less in France than in the EU and since then has
remained above the EU average. As for public investment, its ratio over GDP was above the EU average
over the whole period 2000-2014. However, after having slowly increased between 2000 and 2009, public
investment started to progressively decrease after 2009.
Graph 1: Public and private investment and investment by component, % of GDP, 2000-2017, FR and EU average
(1) Forecasts for 2015-2017 based on a no-policy-change assumption
Source: European Commission
Due to the stabilisation of investment in equipment and the relative deceleration of investment in
construction, the differences among investment components are shrinking over time. At the beginning
of the 2000s, investment in dwellings and other construction tended to increase faster than GDP, while the
share of investment in equipment in GDP decreased. However, from 2009 these trends reversed and a
process of convergence among different investment components was observed. On the one hand, the growth
rate of investments in dwellings and other construction decelerated, similarly to what happened in the EU as
a whole. On the other hand, investment in equipment stabilised. As a result, in 2014, the level of each
investment component was about 5 % of GDP. As for the upcoming years, all investment components are
expected to contribute in 2017 to the acceleration of the share of investment in GDP growth rate, with a
slightly stronger role played by investment in equipment.
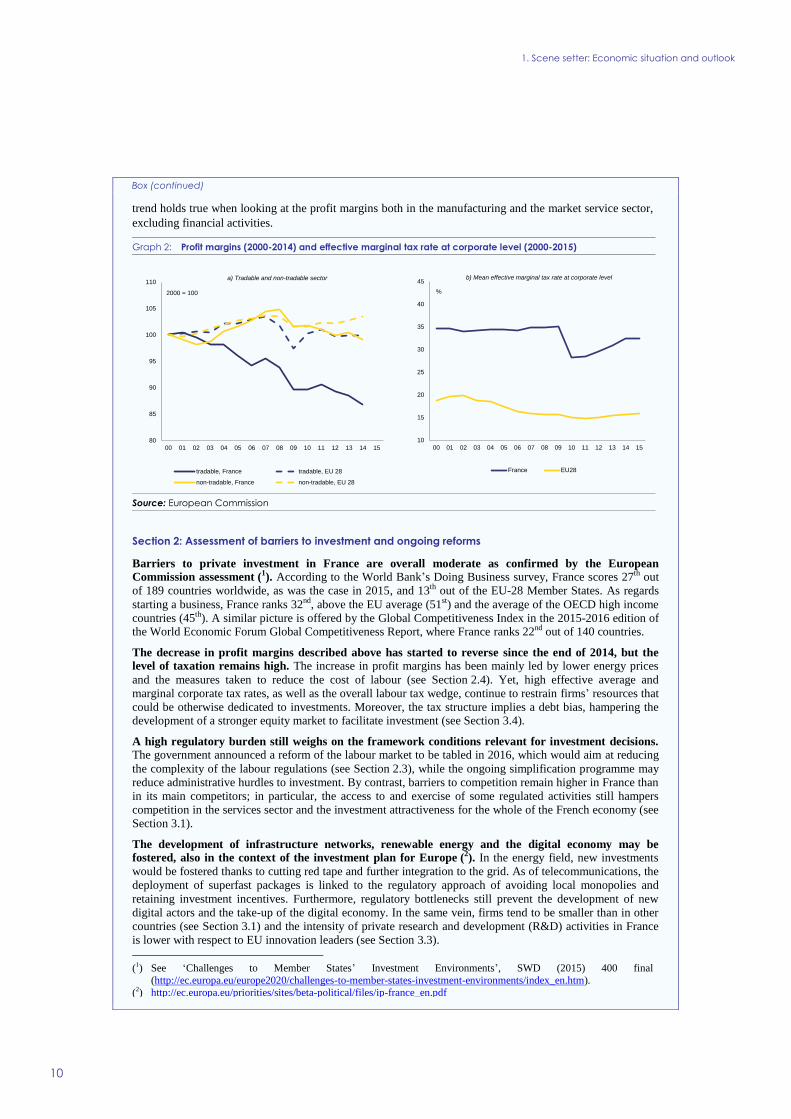
The relative good investment performance in France is in contrast with the decrease in profit margins
observed over the last 15 years. This fall does not concern equally all the sectors of the French economy.
Distinguishing between the tradable and non-tradable sectors, Graph 2 shows that profit margins in the non-
tradable sector have remained almost constant since 2000 and have evolved similarly to what was observed
in the euro-area countries as a whole. By contrast, profit margins have decreased in the tradable sector,
mainly due to the downward pressure exerted by increasing competition on prices. The same downward
0
5
10
15
20
25
00 01 02 03 04 05 06 07 08 09 10 11 12 13 14 15 16 17
% of GDP
France, public investment EU 28, public investment
France, private investement EU 28, private investment
a) Public and private investment
forecast
0.0
2.0
4.0
6.0
8.0
10.0
00 01 02 03 04 05 06 07 08 09 10 11 12 13 14 15 16 17
% of GDP
France, inv. in dwellingEU 28, inv. in dwellingFrance, inv. in other constructionEU 28, inv. in other constructionFrance, inv. in equipmentEU 28, inv. in equipmentFrance, inv. in other than in construction or equipmentEU 28, inv. in other than in construction or equipment
b) Investment by components
forecast
1. Scene setter: Economic situation and outlook
10
Box (continued)
trend holds true when looking at the profit margins both in the manufacturing and the market service sector,
excluding financial activities.
Graph 2: Profit margins (2000-2014) and effective marginal tax rate at corporate level (2000-2015)
Source: European Commission
Section 2: Assessment of barriers to investment and ongoing reforms
Barriers to private investment in France are overall moderate as confirmed by the European
Commission assessment (1). According to the World Bank’s Doing Business survey, France scores 27th out
of 189 countries worldwide, as was the case in 2015, and 13th out of the EU-28 Member States. As regards
starting a business, France ranks 32nd, above the EU average (51st) and the average of the OECD high income
countries (45th). A similar picture is offered by the Global Competitiveness Index in the 2015-2016 edition of the World Economic Forum Global Competitiveness Report, where France ranks 22nd out of 140 countries.
The decrease in profit margins described above has started to reverse since the end of 2014, but the
level of taxation remains high. The increase in profit margins has been mainly led by lower energy prices
and the measures taken to reduce the cost of labour (see Section 2.4). Yet, high effective average and
marginal corporate tax rates, as well as the overall labour tax wedge, continue to restrain firms’ resources that
could be otherwise dedicated to investments. Moreover, the tax structure implies a debt bias, hampering the development of a stronger equity market to facilitate investment (see Section 3.4).
A high regulatory burden still weighs on the framework conditions relevant for investment decisions.
The government announced a reform of the labour market to be tabled in 2016, which would aim at reducing
the complexity of the labour regulations (see Section 2.3), while the ongoing simplification programme may
reduce administrative hurdles to investment. By contrast, barriers to competition remain higher in France than
in its main competitors; in particular, the access to and exercise of some regulated activities still hampers
competition in the services sector and the investment attractiveness for the whole of the French economy (see
Section 3.1).
The development of infrastructure networks, renewable energy and the digital economy may be
fostered, also in the context of the investment plan for Europe (2). In the energy field, new investments
would be fostered thanks to cutting red tape and further integration to the grid. As of telecommunications, the
deployment of superfast packages is linked to the regulatory approach of avoiding local monopolies and
retaining investment incentives. Furthermore, regulatory bottlenecks still prevent the development of new
digital actors and the take-up of the digital economy. In the same vein, firms tend to be smaller than in other
countries (see Section 3.1) and the intensity of private research and development (R&D) activities in France
is lower with respect to EU innovation leaders (see Section 3.3).
(1) See ‘Challenges to Member States’ Investment Environments’, SWD (2015) 400 final
(http://ec.europa.eu/europe2020/challenges-to-member-states-investment-environments/index_en.htm).
(2) http://ec.europa.eu/priorities/sites/beta-political/files/ip-france_en.pdf
10
15
20
25
30
35
40
45
00 01 02 03 04 05 06 07 08 09 10 11 12 13 14 15
France EU28
%
b) Mean effective marginal tax rate at corporate level
80
85
90
95
100
105
110
00 01 02 03 04 05 06 07 08 09 10 11 12 13 14 15
tradable, France tradable, EU 28
non-tradable, France non-tradable, EU 28
a) Tradable and non-tradable sector
2000 = 100

1. Scene setter: Economic situation and outlook
11
Box 1.2: Contribution of the EU Budget to structural change
France is a beneficiary of the European Structural and Investment Funds (ESIF) and can receive up to EUR 26.7
billion for the period 2014-2020. This is equivalent to 4.5% of the expected national public investment in areas
supported by the ESI funds.
A number of reforms were passed as ex-ante conditionalities in areas to benefit from the Funds to ensure successful
investments. In the metropolitan regions, actions plans will assure the completion of the smart specialisation
strategies in the area of research and innovation. In the ultra-peripheral regions, waste management and the water
sector actions plans have also to be completed by end-2016 to fulfil the rest of the ex-ante conditionalities. Where ex-
ante conditionalities are not fulfilled by end 2016, the Commission may suspend interim payment to the priorities of
the programme concerned.
The programming of the Funds includes a focus on priorities and challenges identified in recent years in the context
of the European Semester, notably reinforcing active labour market policies for the most vulnerable, reinforce initial
and continuous education and training. Regular monitoring of implementation includes reporting in mid-2017 on the
contribution of the funds to Europe 2020 objectives and progress in addressing relevant structural reforms to
maximise the use of EU financing, notably on progresses made on early-school leaving, reducing poverty and social
exclusion, improving access and quality of training and increasing the investments in research and innovation. France
also benefits from EUR 310 million under the Youth Employment Initiative (matched by the same amount from the
European Social Fund) to support young people to find their way to the labour market, get involved into traineeship
projects or continue their education.
Financing under the new European Fund for Strategic Investments (EFSI), Horizon 2020, the Connecting Europe
Facility and other directly managed EU funds would be additional to the ESI Funds. Following the first rounds of
calls for projects under the Connecting Europe Facility, France has signed agreements for EUR 6 million in the
energy field and EUR 2 billion for transport projects. For more information on the use of ESIF in France, see:
https://cohesiondata.ec.europa.eu/countries/FR.

1. Scene setter: Economic situation and outlook
12
Table 1.1: Key economic, financial and social indicators — France
(1) Sum of portfolio debt instruments, other investment and reserve assets
(2,3) domestic banking groups and stand-alone banks.
(4) domestic banking groups and stand alone banks, foreign (EU and non-EU) controlled subsidiaries and foreign (EU and
non-EU) controlled branches.
(*) Indicates BPM5 and/or ESA95
Source: European Commission 2016 winter forecast; ECB
2003-2007 2008 2009 2010 2011 2012 2013 2014 2015 2016 2017
Real GDP (y-o-y) 2.0 0.2 -2.9 2.0 2.1 0.2 0.7 0.2 1.1 1.3 1.7
Private consumption (y-o-y) 2.5 0.4 0.2 1.8 0.5 -0.2 0.4 0.6 1.4 1.3 1.3
Public consumption (y-o-y) 1.7 1.1 2.4 1.3 1.0 1.6 1.7 1.5 1.1 0.7 0.6
Gross fixed capital formation (y-o-y) 3.5 0.9 -9.1 2.1 2.1 0.2 -0.6 -1.2 -0.6 1.6 4.6
Exports of goods and services (y-o-y) 3.2 0.4 -11.3 9.0 6.9 2.5 1.7 2.4 5.7 4.6 5.7
Imports of goods and services (y-o-y) 4.9 1.3 -9.4 8.9 6.3 0.7 1.7 3.8 5.7 4.9 5.8
Output gap 1.8 1.6 -2.3 -1.3 -0.3 -1.0 -1.2 -1.8 -1.7 -1.5 -1.0
Potential growth (y-o-y) 1.8 1.5 0.9 1.0 1.0 0.9 0.9 0.9 0.9 1.1 1.2
Contribution to GDP growth:
Domestic demand (y-o-y) 2.3 0.7 -1.5 1.8 1.0 0.3 0.5 0.5 0.9 1.2 1.8
Inventories (y-o-y) 0.1 -0.2 -1.1 0.3 1.1 -0.6 0.2 0.2 0.2 0.2 0.0
Net exports (y-o-y) -0.5 -0.3 -0.3 -0.1 0.0 0.5 0.0 -0.5 -0.1 -0.1 -0.1
Contribution to potential GDP growth:
Total Labour (hours) (y-o-y) 0.3 0.3 0.0 0.2 0.2 0.1 0.1 0.2 0.3 0.4 0.4
Capital accumulation (y-o-y) 0.7 0.8 0.5 0.5 0.5 0.5 0.5 0.4 0.4 0.4 0.5
Total factor productivity (y-o-y) 0.7 0.4 0.3 0.3 0.3 0.3 0.3 0.2 0.2 0.2 0.3
Current account balance (% of GDP), balance of payments 0.2 -1.0 -0.8 -0.8 -1.0 -1.2 -0.8 -0.9 . . .
Trade balance (% of GDP), balance of payments 0.2 -1.4 -1.2 -1.6 -2.0 -1.4 -1.0 -0.8 . . .
Terms of trade of goods and services (y-o-y) -0.5 -0.6 2.6 -1.4 -2.4 -0.3 1.0 1.5 3.0 0.2 -1.3
Capital account balance (% of GDP) 0.0 0.1 0.1 0.1 0.1 0.0 0.1 0.1 . . .
Net international investment position (% of GDP) -1.5* -13.8 -14.8 -9.3 -8.7 -12.9 -17.5 -19.6 . . .
Net marketable external debt (% of GDP) (1) -6.4* -17.4* -20.2* -23.5* -23.1* . . . . . .
Gross marketable external debt (% of GDP) (1) 129.3* 169.9 181.6 190.5 182.9 179.4* 174.3* . . . .
Export performance vs. advanced countries (% change over 5
years)-4.8 -9.6 -7.2 -10.7 -7.8 -8.9 -6.4 -7.19
. . .
Export market share, goods and services (y-o-y) -3.6 -2.8 0.4 -10.2 -2.2 -4.6 2.4 1.3 . . .
Net FDI flows (% of GDP) 1.5 2.2 2.6 1.3 0.7 0.5 -0.6 1.0 . . .
Savings rate of households (net saving as percentage of net
disposable income)10.1 9.5 10.8 10.4 10.0 9.5 9.1 9.5 . . .
Private credit flow (consolidated, % of GDP) 7.7 9.8 3.3 4.6 6.4 4.4 2.5 3.3 . . .
Private sector debt, consolidated (% of GDP) 109.1 122.2 130.4 131.9 135.3 138.6 138.0 143.2 . . .
of which household debt, consolidated (% of GDP) 41.6 48.5 52.5 53.7 54.8 55.2 55.6 56.1 . . .
of which non-financial corporate debt, consolidated (% of GDP) 67.5 73.7 77.9 78.2 80.5 83.4 82.4 87.1 . . .
Corporations, net lending (+) or net borrowing (-) (% of GDP) -0.1 -0.9 1.0 0.9 -1.0 -1.8 -1.9 -2.2 -1.6 -1.8 -2.3
Corporations, gross operating surplus (% of GDP) 18.0 18.2 17.0 17.8 17.5 16.8 16.7 16.5 17.3 17.6 17.9
Households, net lending (+) or net borrowing (-) (% of GDP) 3.0 2.7 4.6 4.2 3.9 3.5 3.3 3.8 4.1 4.1 3.9
Deflated house price index (y-o-y) 9.9 -1.8 -4.8 3.6 3.9 -1.9 -2.7 -1.5 . . .
Residential investment (% of GDP) 6.1 6.8 6.3 6.3 6.4 6.2 6.1 5.9 . . .
GDP deflator (y-o-y) 2.0 2.4 0.1 1.1 0.9 1.2 0.8 0.6 1.0 1.0 1.0
Harmonised index of consumer prices (HICP, y-o-y) 2.0 3.2 0.1 1.7 2.3 2.2 1.0 0.6 0.1 0.6 1.3
Nominal compensation per employee (y-o-y) 3.0 2.6 1.8 3.1 2.5 2.4 1.6 1.4 0.8 1.3 1.7
Labour productivity (real, person employed, y-o-y) 1.3 -0.3 -1.8 1.8 1.3 -0.1 0.7 -0.1 . . .
Unit labour costs (ULC, whole economy, y-o-y) 1.7 2.9 3.5 1.0 1.0 2.3 0.9 1.5 0.1 0.6 0.8
Real unit labour costs (y-o-y) -0.4 0.5 3.4 -0.1 0.0 1.1 0.2 0.9 -0.9 -0.4 -0.2
Real effective exchange rate (ULC, y-o-y) 1.7 1.3 0.5 -1.6 0.5 -1.9 2.9 1.3 -4.6 -0.4 .
Real effective exchange rate (HICP, y-o-y) 1.2 1.5 0.4 -4.1 -0.7 -3.2 1.6 0.4 -4.4 0.9 -0.8
Tax wedge on labour for a single person earning the average wage
(%)28.7 27.8 27.7 27.8 28.0 28.2 28.4 28.7 . . .
Taxe wedge on labour for a single person earning 50% of the
average wage (%)18.6* 17.5 17.5 18.4 20.1 20.3 20.8 19.5 . . .
Total Financial Sector Liabilities, non-consolidated (y-o-y) 12.3 -0.1 1.6 5.7 0.7 2.1 1.1 7.0 . . .
Tier 1 ratio (%) (2) . 8.4 10.1 10.7 10.9 13.3 13.1 13.1 . . .
Return on equity (%) (3) . 2.2 4.6 8.3 5.6 3.4 6.0 4.6 . . .
Gross non-performing debt (% of total debt instruments and total
loans and advances) (4). 3.1 4.3 4.5 4.6 4.5 4.6 3.6 . . .
Unemployment rate 8.6 7.4 9.1 9.3 9.2 9.8 10.3 10.3 10.5 10.5 10.3
Long-term unemployment rate (% of active population) 3.5 2.8 3.2 3.7 3.8 3.9 4.2 4.4 . . .
Youth unemployment rate (% of active population in the same age
group)20.3 19.0 23.6 23.3 22.7 24.4 24.9 24.2
25.1 . .
Activity rate (15-64 year-olds) 69.7 69.9 70.3 70.3 70.1 70.7 71.1 71.1 . . .
People at-risk poverty or social exclusion (% total population) 19.1 18.5 18.5 19.2 19.3 19.1 18.1 18.5 . . .
Persons living in households with very low work intensity (% of
total population aged below 60)9.4 8.8 8.4 9.9 9.4 8.4 8.1 9.6 . . .
General government balance (% of GDP) -3.1 -3.2 -7.2 -6.8 -5.1 -4.8 -4.1 -3.9 -3.7 -3.4 -3.2
Tax-to-GDP ratio (%) 44.3 44.3 43.9 44.1 45.2 46.5 47.4 47.9 47.8 47.6 47.4
Structural budget balance (% of GDP) . . . -5.8 -5.1 -4.3 -3.6 -2.9 -2.7 -2.3 -2.5
General government gross debt (% of GDP) 65.2 68.1 79.0 81.7 85.2 89.6 92.3 95.6 96.2 96.8 97.1
forecast

13
Graph 2.1.1: Potential GDP growth in selected countries
Source: European Commission 2016 winter forecast
French potential growth (2) has declined since
the onset of the 2008 financial crisis. It is
expected to remain at 1.0 % on average from 2009
to 2017, while averaging 1.8 % from 2000 to 2008
(Graph 2.1.1). This decline in potential growth is
generalised to all major euro-area economies, as
(1) Article 5 of Regulation (EU) No 1176/2011.
(2) Potential GDP is defined as the maximum level of output that an economy can produce at a constant inflation rate.
Although an economy can temporarily produce more than
its potential level of output, that comes at the cost of rising inflation. Potential GDP depends on the potential labour
force (which depends on demographic factors and on
participation rates), the non-accelerating wage rate of unemployment (NAWRU), the potential level of hours per
employee, the capital stock, and the potential level of total
factor productivity (TFP).
well as the United Kingdom and the United States.
However, the extent of the slackening varies
considerably among countries. It is more
pronounced in Italy, in the United Kingdom, and
especially in Spain. The decrease in French
potential growth has also been less important than
in the United States up to 2009, but there has been
a marked rebound in the United States since then.
Only Germany has had its potential growth
relatively unaffected by the financial crisis.
Graph 2.1.2: Potential GDP growth breakdown in France
Source: European Commission 2016 winter forecast
An important part of French potential growth
results from its dynamic demographics. The
potential labour force growth has remained quite
buoyant in France recently, at around 0.6 %, and
contributes as much as one third to the French
-2%
-1%
0%
1%
2%
3%
4%
00 01 02 03 04 05 06 07 08 09 10 11 12 13 14 15 16 17
DE FR IT ES UK US
-1.0%
-0.5%
0.0%
0.5%
1.0%
1.5%
2.0%
2.5%
3.0%
00 01 02 03 04 05 06 07 08 09 10 11 12 13 14 15 16 17
Labour force contribution
NAWRU contribution
Hours per employee contribution
Capital accumulation contribution
TFP contribution
Potential GDP growth
2. IMBALANCES, RISKS, AND ADJUSTMENT ISSUES
This section provides the in-depth review foreseen under the macroeconomic imbalances procedure
(MIP) (1). It focuses on the risks and vulnerabilities flagged in the Alert Mechanism Report 2016. The
section analyses the reasons behind the deteriorated competitiveness and the high and rising public debt.
It first focuses on productivity developments, which affect both competitiveness and the public debt
trajectory. The analysis then focuses on competitiveness issues. First, the most recent improvement in
exports is investigated to assess its sustainability. Cost competitiveness is then analysed, focusing on
wage developments and labour market rigidities. Finally, non-cost competitiveness is examined in
relation to the quality of investment. The section is then devoted to debt issues. Private and public debt
sustainability is first assessed. Then, public expenditure is analysed from both a quantitative and a
qualitative perspective. Finally, the section examines the cross-border relevance of the vulnerabilities
associated with France’s risks of imbalances. The section concludes with the MIP assessment matrix
which summarises the main findings.
2.1. POTENTIAL GROWTH

2.1. Potential growth
14
potential growth (Graph 2.1.2). The decline in
potential growth is largely explained by the decline
in the capital accumulation contribution, and by
the decline in the potential total factor productivity
(TFP) (3) growth rate.
Graph 2.1.3: Potential TFP growth in selected countries
Source: European Commission 2016 winter forecast
Excluding demographic factors, other
determinants of French potential growth depict
a much more negative picture. Capital
accumulation is contributing less to the potential
growth of the economy since the crisis, but is
relatively strong from an international perspective.
France’s capital accumulation was relatively
robust before the crisis and has since come down.
Yet the current contribution of capital
accumulation remained higher in France than in
Germany, Spain and Italy in 2015. TFP growth has
however significantly declined since 2000
(Graph 2.1.3). French potential TFP growth has
declined from 1.3 % in 2000 to 0.2 % in 2015. As
a result, potential TFP growth in France has
decoupled from Germany. In 2015, potential TFP
(3) Total factor productivity measures the capacity to produce
more with the same amount of labour and capital inputs. As
there are limits to augmenting the capital and labour
intensity of the economy, the endogenous growth theory argues that in the long run total factor productivity is the
main determinant of the growth potential of an economy.
TFP growth depends not only on the capacity to innovate and use new technologies, to improve the quality of
products and to enter new markets, but also on the capacity
of the most productive firms to attract workers and investment from less productive firms.
growth was somewhat identical in France, Spain
and the United Kingdom.
The decline in productivity growth contributes
to a further deterioration of French
competitiveness and exacerbates the challenges
associated with the high public debt. Although
the wage dynamics has moderated in recent years,
the decline in productivity growth has more than
offset the competitiveness gains stemming from
this wage moderation (see Section 2.3). The trend
decline in productivity is also at the core of the
deterioration in French non-cost competitiveness
(see Section 2.4). The decline in potential GDP
makes it also more difficult for France to bring
down its public debt (see Section 2.5).
Labour and product market rigidities and slow
resource reallocation and technology adoption
limit total factor productivity growth. At the
aggregate level, the high overall level of rigidities
in France weighs on productivity growth. In
particular, the interaction and combined effect of
product and labour market rigidities have a very
significant negative effect on total factor
productivity growth. France has made some
progress to reduce rigidities. However, this
progress remains relatively modest and mostly
focused on reducing rigidities in product markets
rather than on labour markets (see Section 3.1),
thereby limiting the resource reallocation towards
higher productive sectors and regions.
Potential growth is also linked to labour force’s
skills. In France, the link between education and
the labour market is still weak with the low
qualified experiencing difficult transition. The
governance of the vocational education and
training and of the apprenticeship systems is not
optimal (see Section 3.2). The quality of the
training provided is decisive, notably as regards
the matching between vocational training and
firms’ needs.
Moreover, potential growth crucially depends
on the innovation capacity of the French
economy. Despite major government support,
R&D intensity is not sufficient to keep up with
best performers and structural changes in the
French economy risk weighing on R&D spending
in the long term (see Section 3.3). Also, France
ranks average among European countries, despite a
wealth of publicly funded instruments.
-0.5%
0.0%
0.5%
1.0%
1.5%
2.0%
2.5%
00 01 02 03 04 05 06 07 08 09 10 11 12 13 14 15 16 17
DE FR IT ES UK US

2.1. Potential growth
15
Finally, the tax structure is not favourable to
potential growth. The overall tax burden
continues to increase in France and weighs
importantly on production factors (see
Section 3.4). Recently, households have borne the
brunt of tax increases, whereas the burden of
corporate taxation is stabilising. The tax system
remains extremely complex and the tax base
relatively narrow.
Social partners and the national Parliament
play a crucial role in adopting reforms in line
with national practices. Structural reforms are
key to address the economic challenges associated
with the declining French potential growth. This
has important implications in terms of
competitiveness and the French public debt
trajectory.

2.1. Potential growth
16
Box 2.1.1: Macroeconomic impact of selected structural reforms
Structural reforms can boost potential GDP, both through higher productivity and higher
employment. Notwithstanding the usual caveats on the uncertainty of these estimates, recent simulations of
the actual reforms point to their sizeable potential macroeconomic impact (European Commission (2016,
forthcoming)). By 2020, the quantified reform measures from the 2015 National reform programme are
estimated to raise GDP by 0.4 % in France, implying on average a 0.1 pp. higher GDP growth over a 5 year
period. The GDP effects become larger over the long run. Reforms also improve employment, though to a
lesser extent than GDP growth, and government balances, as higher growth boosts tax revenues.
An important share of the total impact stems from the tax credit for competitiveness and employment
(CICE) and the Responsibility and solidarity pact. These measures would boost GDP by 0.11 % in 2020
and employment by 0.17 %. In calculating these estimates, the reductions in the tax wedge on labour and
capital were compensated by increases in other taxes, so as to report only the impact of the reform on the
structure of the tax system. However, these tax measures are in fact financed through VAT increases and
public expenditure cuts. Simulations taking into account this actual funding scheme provide higher results
(DG ECFIN Economic Brief, ‘Recent reforms on the cost of labour in France — An assessment of the
Crédit d’impôt pour la compétitivité et l’emploi and the Pacte de responsabilité et solidarité’, forthcoming).
Product market reforms also explain a large share of the results. The quantification includes the partial
privatisation in the gas and telecom sectors, the reform of Sunday and evening opening times, the reform of
the regulated professions included in the Macron law, and the reform of regulated electricity tariffs. These
product market reforms were translated into a reduction in the final goods price mark-up and an increase in
labour productivity, which would boost GDP by 0.11 % in 2020 and employment by 0.06 %.
R&D subsidies and public investments have the potential to foster innovation and increase
productivity. The authorities have launched the innovation tax credit for SMEs, exemptions for innovative
start-ups to stimulate research and development activity, as well as the extension of the Investment for future
programme (PIA2), which finances strategic projects in research, energy transition and manufacturing.
These measures would increase GDP by 0.08 % in 2020 but have a negligible effect on employment.
Active labour market policies have a strong effect on employment. Actions to foster the employment of
young and low-skilled workers include the emplois d’avenir programme and the Youth guarantee scheme.
These measures were introduced as an additional increase in active labour market policies spending, which
would have a positive impact both on employment (+0.07 %) and GDP (+0.06 % in 2020).
Education reforms have a major effect on both employment and productivity, although their effects
would take longer to be felt. The French authorities, through a series of measures, have announced the
creation of 60,000 additional posts in education. These measures would contribute to increasing the skills of
the labour force, and boost productivity in the long run. However, their effects would be negligible by 2020,
as the skill structure of the labour force would only be affected in the longer term.
Only a selection of the reforms included in the 2015 National reform programme have been translated
and assessed quantitatively in this report. There is a clear trade-off between the number of reforms
quantified and the quality and reliability of the estimates. Many reforms fostering competition in the goods
and services market were not quantified (e.g. coach travel, further reforms in the legal, health and retail
sectors etc.), as appropriate methodologies to translate these reforms into model shocks were lacking. Also,
many labour market reforms were not quantified, but this does not mean that the effects of these reforms are
negligible. Finally, the territorial reform, not considered in this report, has the potential to significantly
improve the efficiency of French territorial organisation. This suggests that the estimated GDP impact
reported here may underestimate the total impact of the reform effort undertaken in France.

17
French export market shares
Since 1999, France has suffered severe export
market share losses (Graph 2.2.1): out of the 15
countries (4) for which export market shares in
value (5) are available since 1999, France ranks
first in terms of cumulated export market share
losses. The cumulated market share losses since
1999 amount to 35.6 % in 2014.
Graph 2.2.1: Export market shares in value
Source: Eurostat
However, export market shares have somewhat
stabilised in recent years. French export market
shares in value have even registered small positive
year-on-year gains in 2013 and 2014 (6).
Export market shares in value are affected by
valuation effects. An appreciation of the euro
against other currencies will lead to a mechanical
increase in the short run in the share of French
exports in total world exports in value, since the
price of euro-denominated exports from France to
other euro-area Member States will increase when
(4) Czech Republic, Germany, Estonia, Spain, France, Italy,
Luxembourg, Hungary, Portugal, Romania, Slovenia,
Finland, Sweden, United Kingdom, and Iceland.
(5) Export market shares in value are defined as the ratio of exports of goods and services in value over global exports
of goods and services in value. This indicator is computed
by Eurostat. Data for French exports of goods and services in value are from the balance of payments statistics, while
data for global exports of goods and services in value are
computed by the IMF. (6) Note from the French authorities of 5 February 2016.
expressed in foreign currencies. Similarly, a
decline in the price of oil decreases world total
exports in value, but will affect French exports to a
lesser extent, since French exports of oil products
are relatively limited. A simple way of addressing
this issue is to compute export market shares in
volume (7). A different narrative then appears:
French export market shares in volume
deteriorated in both 2013 and 2014.
Graph 2.2.2: Differences in evolution of export market
shares in value and in volume (% and pp.)
Source: Eurostat, AMECO, IMF
The breakdown of the differences in the
evolution of the two indicators allows a better
understanding of the differences between the
evolution of export market shares in value and
in volume. This difference is strongly linked to
both nominal effective exchange rate (NEER)
variations and oil price variations (Graph 2.2.2).
For instance, in 2010 the decline in export market
shares in value is far more pronounced than in
volume. This coincides with a strong depreciation
of the euro and with a sharp increase in oil prices.
On the contrary, the fact that export market shares
increased slightly in value in 2013 and 2014, while
they declined in volume, is to be linked with the
appreciation of the euro and the decline in oil
prices observed in those two years. This suggests
(7) Ratio of French exports of goods and services in volume
from national accounts (source: ESA 2010, ESTAT) over
global exports of goods and services in volume (source: IMF).
60
65
70
75
80
85
90
95
100
105
110
99 00 01 02 03 04 05 06 07 08 09 10 11 12 13 14
DE FR IT ES UK
1999 = 100 -50%
-25%
0%
25%
50%
75%-15%
-10%
-5%
0%
5%
10%
00 01 02 03 04 05 06 07 08 09 10 11 12 13 14
Difference between value and volume
NEER variation
Oil price variation, rhs (reversed scale)
Export market shares yoy change (in value)
Export market shares yoy change (in volume)
2.2. RECENT DEVELOPMENTS IN FRENCH EXPORT
PERFORMANCE
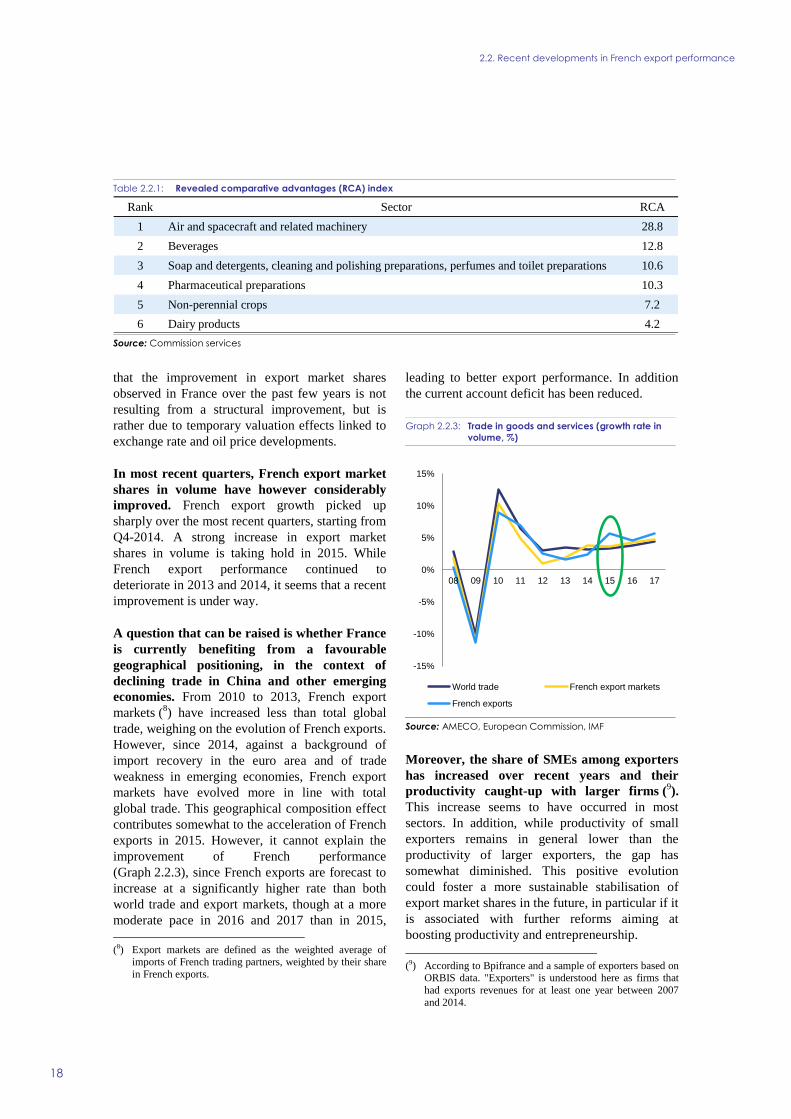
2.2. Recent developments in French export performance
18
that the improvement in export market shares
observed in France over the past few years is not
resulting from a structural improvement, but is
rather due to temporary valuation effects linked to
exchange rate and oil price developments.
In most recent quarters, French export market
shares in volume have however considerably
improved. French export growth picked up
sharply over the most recent quarters, starting from
Q4-2014. A strong increase in export market
shares in volume is taking hold in 2015. While
French export performance continued to
deteriorate in 2013 and 2014, it seems that a recent
improvement is under way.
A question that can be raised is whether France
is currently benefiting from a favourable
geographical positioning, in the context of
declining trade in China and other emerging
economies. From 2010 to 2013, French export
markets (8) have increased less than total global
trade, weighing on the evolution of French exports.
However, since 2014, against a background of
import recovery in the euro area and of trade
weakness in emerging economies, French export
markets have evolved more in line with total
global trade. This geographical composition effect
contributes somewhat to the acceleration of French
exports in 2015. However, it cannot explain the
improvement of French performance
(Graph 2.2.3), since French exports are forecast to
increase at a significantly higher rate than both
world trade and export markets, though at a more
moderate pace in 2016 and 2017 than in 2015,
(8) Export markets are defined as the weighted average of
imports of French trading partners, weighted by their share
in French exports.
leading to better export performance. In addition
the current account deficit has been reduced.
Graph 2.2.3: Trade in goods and services (growth rate in
volume, %)
Source: AMECO, European Commission, IMF
Moreover, the share of SMEs among exporters
has increased over recent years and their
productivity caught-up with larger firms (9).
This increase seems to have occurred in most
sectors. In addition, while productivity of small
exporters remains in general lower than the
productivity of larger exporters, the gap has
somewhat diminished. This positive evolution
could foster a more sustainable stabilisation of
export market shares in the future, in particular if it
is associated with further reforms aiming at
boosting productivity and entrepreneurship.
(9) According to Bpifrance and a sample of exporters based on
ORBIS data. "Exporters" is understood here as firms that
had exports revenues for at least one year between 2007
and 2014.
-15%
-10%
-5%
0%
5%
10%
15%
08 09 10 11 12 13 14 15 16 17
World trade French export markets
French exports
Table 2.2.1: Revealed comparative advantages (RCA) index
Source: Commission services
Rank Sector RCA
1 Air and spacecraft and related machinery 28.8
2 Beverages 12.8
3 Soap and detergents, cleaning and polishing preparations, perfumes and toilet preparations 10.6
4 Pharmaceutical preparations 10.3
5 Non-perennial crops 7.2
6 Dairy products 4.2

2.2. Recent developments in French export performance
19
French export performance has thus improved
significantly over recent quarters, reversing the
declining trend observed in the last decade. To
assess whether this improvement in export
performance is temporary or if it is related to a
sustained stabilisation of French export market
shares, the export performance is further
investigated at a sectoral level.
A sectoral analysis of French exports in goods
Although French export performance has been
overall deteriorating, some specific sectors have
still been successful in foreign markets. First, an
overview of the French historical comparative
advantages are presented, using the revealed
comparative advantage index developed by
Balassa (1966). This index indicates the France’s
relative advantages or disadvantages in exports of
goods by sector. It corresponds to the contribution
to the trade balance of each sector, scaled by total
trade in goods in value, and corrected by the
overall trade balance. A comparative advantage is
‘revealed’ if the index is positive. Table 2.2.1
gives the corresponding index of the six best
performing sectors.
Box 2.2.1: Concentration of French exports
French exports have been further concentrated around an increasingly stable pool of firms. In 1994,
the 100 largest exporters (representing less than 0.1 % of all exporting firms) represented 36 % of all exports
in value. In 2014, they represented 39 %. The trend since the 1990’s has been that there are fewer new
exporters, but also that fewer firms exit the exporting business at least until 2012. The share of first-time
exporters among all exporters has decreased from around 20 % in 1999 to slightly more than 15 % in 2014.
The concentration of exporting firms is particularly high in the area of services.
The overall decrease reflects a decrease in the number of exporting firms in the industrial sector. It
decreased by 21 % since 2002, while the number of exporters grew in the retail and services sectors. The
share of micro-, small, and medium enterprises in the total value of all exports is also decreasing. While the
number of exporting SMEs is substantial and continues to increase, notably in the area of business services
where size effects seem less important than in manufacturing, particular difficulties remain for SMEs to
identify and access export markets, or once active abroad, to diversify export destinations. Furthermore,
their export activity may depend on the (changing) degree of servitisation of manufacturing. Medium-sized
companies (1) are important players in French exports, and although they represent only 4 % of exporting
firms, their sales abroad represent a third of all French exports. Yet, it should be noted that 58 % of their
exports are made by affiliates of foreign groups.
The concentration of exports is very strong in many key exporting sectors that contribute a lot to the
trade balance. In 2014, the 10 largest exporters in the aerospace industry were responsible for 99 % of all
exports in that sector. The sales of Airbus aircraft contributed EUR 25 bn to the French trade balance,
representing alone 15 % of all exports. Similarly high concentration rates are also found in other sectors like
automotive (98 %), cosmetics (90 %), leather (85 %) and other transport equipment (85 %). In the leather
and aerospace industries, concentration increased by respectively 17.8 pps. and 5.6 pps. since 2004. The
pharmaceutical exports are less concentrated (65 %) thanks to the presence of several foreign groups in
France (8 out of the 10 largest pharmaceutical exporters are foreign groups).
The concentration of exports among a few players exposes the trade balance to the outcome of
strategic decisions made by them. The French car industry’s specialisation in small cars, in part due to tax
incentives, resulted in the partial relocation of large parts of their production facilities to other Member
States such as Spain, Romania, Slovenia, and Slovakia, where production costs are lower. Similarly,
important players like Airbus have been opening new aircraft plants in China and the US to tap into those
markets. However, rules of origin and the prestige of the ‘Made in France’ give better prospects to the
continuous presence of the leather and cosmetic industries in France. This question remains central as
transport equipment industries are undergoing important technological changes such as digitalisation and
transition to sustainable sources of energy which may impact on their business models.
(1) The medium-sized companies (‘entreprises de taille intermédiaire’ or ETIs) have between 250 and 4,999 employees,
and a turnover below EUR 1.5 bn or assets below EUR 2 bn.

2.2. Recent developments in French export performance
20
The well-performing sectors identified are
primarily ‘air and spacecraft and related
machinery’, ‘beverages’, and cosmetics. These
results are broadly in line with the findings of Bas,
Fontagné, Martin and Mayer (2015), whom
identify aeronautics, leather goods, and wine as the
three best-ranking exporting sectors for
France (10
). While a different classification of
goods is used, the strong comparative advantage in
aircraft and beverages is confirmed.
These sectors are characterised by the
leadership of a few firms with a strong brand
image (Box 2.2.1). These findings are in line with
those of a recent study by the economic analysis
(10) Bas M., Fontagné L., Martin P. and Mayer T. (2015): ‘La
France en mal de qualité ?’, La Lettre du CEPII, n° 355 — July 2015.
council (11
), which concludes that, except for the
luxury, aeronautical and electrical distribution
goods sectors, French exports continue to suffer
from their poor quality/price ratio.
The sectoral analysis in this report is consistent
with the findings of last year’s report, namely,
that France had specialised in the high-tech
sector. During the 2008-2013 period, France
experienced large product-market losses in low-
and medium-tech against a small increase in the
high-tech sector due to the aircraft industry.
According to Stehrer et al. (2015), the global
market share of France in high unit value export
segments is the second highest in the EU and
exceeds the global market export share in total
(11) Bas M., Fontagné L., Martin P. and Mayer T. (2015): ‘In
Search of Lost Market Shares’, Les notes du conseil d’analyse économique, n° 23 — May 2015.
Graph 2.2.4: Export growth (%) and exchange rate elasticity
Note: The size of the bubbles reflects the share of the sectoral exports in total exports of goods.
Source: Comext, Commission services
Non-perennial crops
Dairy products
Beverages
Perfumes and toilet preparations
Pharmaceutical preparations
Motor vehicles
Air and spacecraft and related machinery
Jewellery, bijouterie and related articles
-20%
-10%
0%
10%
20%
30%
40%
0 0.5 1 1.5 2 2.5 3
Exp
ort
gro
wth
sin
ce 2
013
Exchange rate elasticity
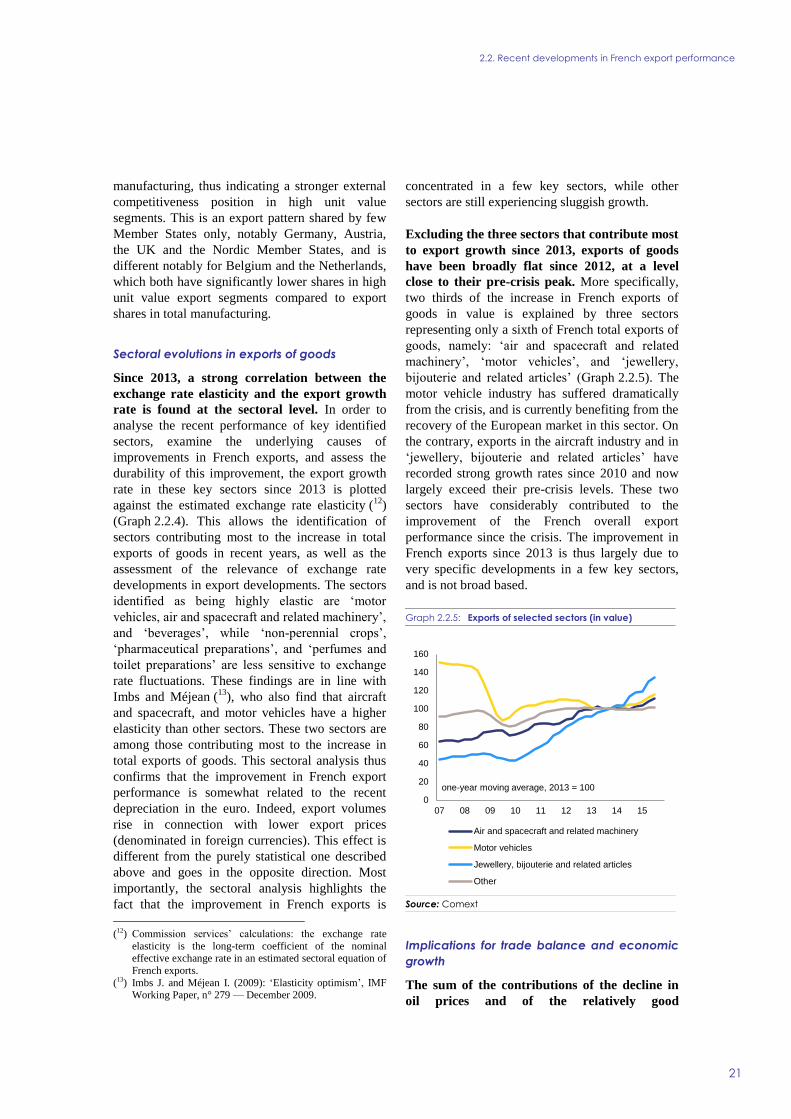
2.2. Recent developments in French export performance
21
manufacturing, thus indicating a stronger external
competitiveness position in high unit value
segments. This is an export pattern shared by few
Member States only, notably Germany, Austria,
the UK and the Nordic Member States, and is
different notably for Belgium and the Netherlands,
which both have significantly lower shares in high
unit value export segments compared to export
shares in total manufacturing.
Sectoral evolutions in exports of goods
Since 2013, a strong correlation between the
exchange rate elasticity and the export growth
rate is found at the sectoral level. In order to
analyse the recent performance of key identified
sectors, examine the underlying causes of
improvements in French exports, and assess the
durability of this improvement, the export growth
rate in these key sectors since 2013 is plotted
against the estimated exchange rate elasticity (12
)
(Graph 2.2.4). This allows the identification of
sectors contributing most to the increase in total
exports of goods in recent years, as well as the
assessment of the relevance of exchange rate
developments in export developments. The sectors
identified as being highly elastic are ‘motor
vehicles, air and spacecraft and related machinery’,
and ‘beverages’, while ‘non-perennial crops’,
‘pharmaceutical preparations’, and ‘perfumes and
toilet preparations’ are less sensitive to exchange
rate fluctuations. These findings are in line with
Imbs and Méjean (13
), who also find that aircraft
and spacecraft, and motor vehicles have a higher
elasticity than other sectors. These two sectors are
among those contributing most to the increase in
total exports of goods. This sectoral analysis thus
confirms that the improvement in French export
performance is somewhat related to the recent
depreciation in the euro. Indeed, export volumes
rise in connection with lower export prices
(denominated in foreign currencies). This effect is
different from the purely statistical one described
above and goes in the opposite direction. Most
importantly, the sectoral analysis highlights the
fact that the improvement in French exports is
(12) Commission services’ calculations: the exchange rate
elasticity is the long-term coefficient of the nominal effective exchange rate in an estimated sectoral equation of
French exports.
(13) Imbs J. and Méjean I. (2009): ‘Elasticity optimism’, IMF Working Paper, n° 279 — December 2009.
concentrated in a few key sectors, while other
sectors are still experiencing sluggish growth.
Excluding the three sectors that contribute most
to export growth since 2013, exports of goods
have been broadly flat since 2012, at a level
close to their pre-crisis peak. More specifically,
two thirds of the increase in French exports of
goods in value is explained by three sectors
representing only a sixth of French total exports of
goods, namely: ‘air and spacecraft and related
machinery’, ‘motor vehicles’, and ‘jewellery,
bijouterie and related articles’ (Graph 2.2.5). The
motor vehicle industry has suffered dramatically
from the crisis, and is currently benefiting from the
recovery of the European market in this sector. On
the contrary, exports in the aircraft industry and in
‘jewellery, bijouterie and related articles’ have
recorded strong growth rates since 2010 and now
largely exceed their pre-crisis levels. These two
sectors have considerably contributed to the
improvement of the French overall export
performance since the crisis. The improvement in
French exports since 2013 is thus largely due to
very specific developments in a few key sectors,
and is not broad based.
Graph 2.2.5: Exports of selected sectors (in value)
Source: Comext
Implications for trade balance and economic
growth
The sum of the contributions of the decline in
oil prices and of the relatively good
0
20
40
60
80
100
120
140
160
07 08 09 10 11 12 13 14 15
Air and spacecraft and related machinery
Motor vehicles
Jewellery, bijouterie and related articles
Other
one-year moving average, 2013 = 100

2.2. Recent developments in French export performance
22
performance in the transport equipment sector,
identified above, is larger than the overall
improvement of the French trade balance in
goods and services. As seen above, French
transport equipment exports have improved
significantly, in particular in the aircraft and the
motor vehicle sectors, benefiting most strongly
from the depreciation of the euro. In terms of trade
balance, the sectoral trade balance in transport
equipment has historically been positive in France.
It has somewhat increased in recent years,
contributing to the improvement of the French
trade balance in goods and services since 2011.
Another factor that has largely contributed to the
improvement of the French trade balance in goods
and services is the sharp decline in oil prices. The
trade balance for energy, water and waste and
manufacture of coke and refined petroleum is
negative in France, and is closely related to oil
price developments. This sectoral trade deficit has
been largely reduced in recent years, owing to the
sharp decline in oil prices. Excluding energy,
water, waste, manufacture of coke and refined
petroleum products, and transport equipment, the
trade balance of remaining sectors has continued
its trend deterioration (Graph 2.2.6).
Graph 2.2.6: Trade balance breakdown
Source: Insee
Last but not least, net exports continue to be a
drag on economic activity. The contribution of
net exports of goods and services has been
negative in 2013 and 2014, and remained negative
in 2015, despite the sharp depreciation of the euro.
The acceleration of exports in transport equipment
has been more than offset by the acceleration of
total imports of goods and services, following the
pick-up in internal demand.
The recent improvement in export performance
remains insufficient so far to allow for a
sustainable reduction in the French trade
deficit. The increase in export market shares in
2013 and 2014 is due to valuation effects.
However, since 2015, the French export
performance has improved. Yet, this improvement
is concentrated in a few key sectors and is not
broad based. France still faces stiff competition
from Germany in higher quality products and from
Spain and Italy in terms of price (14
). It also
remains insufficient to allow for a sustained
improvement in the French trade balance and to
foster higher GDP growth.
(14) COE Rexecode: ‘Bilan en demi-teinte pour la compétitivité
française en 2015’.
-25
-20
-15
-10
-5
0
5
10
15
99 00 01 02 03 04 05 06 07 08 09 10 11 12 13 14 15
Energy, water, waste
Manufacture of coke and refined petroleum products
Transport equipment
Others
Trade balance
EUR billion

23
Recent wage and productivity developments
Since 2008, the weakness of the labour market
has been gradually reflected by a moderation of
nominal wage growth. In spite of the high and
rising unemployment rate, expectations about the
2010 recovery were initially accompanied by more
dynamic developments of compensation per
employee relative to the base wage (15
). The
increase in unemployment was thus only to a
minor extent reflected in the compensation per
employee. Since 2011, both measures show
moderation in nominal terms (Graph 2.3.1).
Graph 2.3.1: The moderation of nominal wage growth has
been very gradual in France
Source: Insee, Dares
However, in a context of low inflation, real
wages have only slightly decelerated. The
Phillips curve, which exhibits the historical inverse
relationship between wage growth and
unemployment, provides an indication of the
responsiveness of wages to labour market
conditions. Graph 2.3.2 suggests that the dynamics
of base wages has been consistent with a standard
Phillips curve which, however, appears relatively
flat — i.e. implying a low responsiveness of wages
to unemployment. The increase in unemployment
following the 2008 crisis was matched by a decline
in real base wage growth, especially since 2014.
(15) The base wage (salaire mensuel de base de l’ensemble des
salariés) does not include flexible components of pay (eg
bonuses or supplementary hours); it refers to a constant
level of qualification and is not affected by changes in the composition of the workforce. The composition effect
explains ¼ of the increase in wages (Askenazy, 2013).
The higher unemployment rate has led to more
intense competition for vacancies among suitable
workers and more moderate wage claims, which
suggests an insufficient labour demand.
Graph 2.3.2: Real base wage Phillips curve
Note: 2015q2: year-on-year growth rate for real base
wages.
Source: Eurostat
The recent deceleration of real wages remains
nonetheless insufficient to fill the gap between
real labour costs and falling productivity
growth. Between 2008 and 2012, compensation
per employee increased by about 2.5 % per year
while GDP deflator inflation hovered around 1 %.
These developments implied a growth of real
compensation per employee of 1.5 % per year,
while labour productivity slowed down markedly,
with negative implications in terms of employment
and profit share. Only from 2015, the dynamics of
wages adjusted for inflation has been consistent
with productivity growth. Unit labour costs have
been on average less dynamic than in the rest of
the euro area since 2012 (16
). However, the
competitiveness losses accumulated in previous
years remain. Overall, since 2000, wage
developments have been more moderate in other
euro-area countries than in France (Graph 2.3.3).
French labour costs remain among the highest
in the euro area, mainly owing to high
employers’ social security contributions. In
2014, the hourly labour cost, at EUR 35.20, was
well above the EU average of EUR 29.20. In 2014,
(16) Note of the French authorities of 5 February 2016.
0%
1%
2%
3%
4%
5%
01 02 03 04 05 06 07 08 09 10 11 12 13 14 15
Compensation per employee
Basic hourly wage
Workers' basic hourly wage
2001-2007 Compensation per employee growth average
2011-2015 Compensation per employee growth average
year-on-year growth rate
20002001
2002
2003
2004
2005
2006
20072008
2009
2010
2011
2012
2013
2014
2015q3
0.0%
0.2%
0.4%
0.6%
0.8%
1.0%
1.2%
1.4%
1.6%
7 8 9 10 11
Real b
ase w
ag
es (
co
re i
nfl
ati
on
)
Unemployment rate
2000-2007 2008-2015 Linear (2000-2015)
2.3. COST COMPETITIVENESS AND LABOUR MARKET RIGIDITIES

2.3. Cost competitiveness and labour market rigidities
24
France’s total hourly labour costs are among the
highest in the EU, after Belgium, Denmark,
Sweden and Luxembourg. There were no major
changes from the ranking observed 10 years
earlier, despite the deceleration in labour costs in
France since 2012 (17
). Labour costs are high
mainly because of the high fiscal contribution,
accounting for more than 30 % of total hourly
labour costs, compared to an EU average of 24 %.
Graph 2.3.3: Labour productivity and real compensation
per employee: France and rest of the euro
area (whole economy, 2000=100)
Source: Eurostat
Measures have recently been introduced to
reduce the tax burden on labour. The
government has taken measures to reduce labour
costs, notably through the tax rebate for
competitiveness and employment (CICE) of
December 2012 (which entered into force from
2013) and the cut of employers’ social security
contributions announced as part of the
Responsibility and Solidarity Pact (RSP) of
January 2014 (implemented in 2015 and 2016). All
in all, these measures will result in a cut in the tax
wedge of 1.5 % of GDP — EUR 30 billion —
between 2013 and 2017 (18
). The CICE is a tax
credit linked to payroll excluding wages above 2.5
times the minimum wage (4 % of payroll in 2013
and 6 % for subsequent years, accounting for 1 %
of GDP). The Responsibility and Solidarity Pact
includes a 1.8 pp. reduction in family contributions
targeting wage earners up to 3.5 times the
minimum wage. The effectiveness of these
(17) Note of the French authorities of 5 February 2016.
(18) They will top up the Fillon reductions of social security contributions paid by employers (allègements généraux des
cotisations sociales patronales) for workers paid up to 1.6
Smic.
measures on competitiveness and employment is
higher with moderate wage developments.
The minimum wage indexation mechanism
The recent deceleration of wages mirrors more
moderate minimum wage developments. The
deceleration in nominal wages is to some extent
related to the limited increases in the minimum
wage (salaire minimum interprofessionnel de
croissance or Smic) and in wages at the branch
level (19
), to some extent also driven by the Smic.
Between 2003 and 2008, the Smic rose by about
5 % annually, well above the CPI inflation of 2 %.
It gradually decelerated between 2008 and 2012 to
reach a yearly growth rate of 2 %, above the
growth rate of consumer prices (1.6 %). Since
2012, the Smic further decelerated, while inflation
fell further. The deceleration of the Smic
contributed to moderating the increase of wages at
branch level. The Smic indeed plays an important
role in wage bargaining, setting a floor for
subsequent negotiations at branch or firm level.
Increases in the Smic induce wage increases for
all categories of workers, particularly for blue
collars and clerks. Minimum wage changes
influence the structure of wages, with the impact
being lower at higher levels of wages. The effect
of minimum wage hikes on wage growth is high
for blue collars and clerks and low for
professionals and managers (Graph 2.3.4). The
significant effect on the basic hourly wage for blue
collars (salaire horaire de base des ouvriers or
SHBO) — one of the former components of the
Smic indexation rule — hints at the risk that an
increase in the minimum wage is reinforced
through feedbacks on subsequent minimum wages
setting (20
). The effect of inflation also differs
across groups, with wages being more responsive
to variations in the consumer price index for
intermediate professions and clerks. Thus,
although the impact on wage growth is lower at
higher income levels, an increase of the Smic may
(19) For the 2009-2012 period, an increase by 1 % of negotiated
wages (salaires conventionnels) leads to an increase of the base salary by 0.12 %, low but twice as much as the effect
over the period 2003-2008 (Dares, May 2015, N. 33).
(20) The effect of the Smic on the growth of the nominal SHBO is higher than the effect on the average wage; as concerns
the components of the Smic indexation rule, the impact of
the change in the growth of the real SHBO is higher than that of inflation in the long-term (Verdugo, 2011).
100
105
110
115
2000 2005 2010 2015 2000 2005 2010 2015
Productivity
Real compensation per employee (GDP deflated)
excluding Responsibility and solidarity pact
including CICE
France Other euro area countries
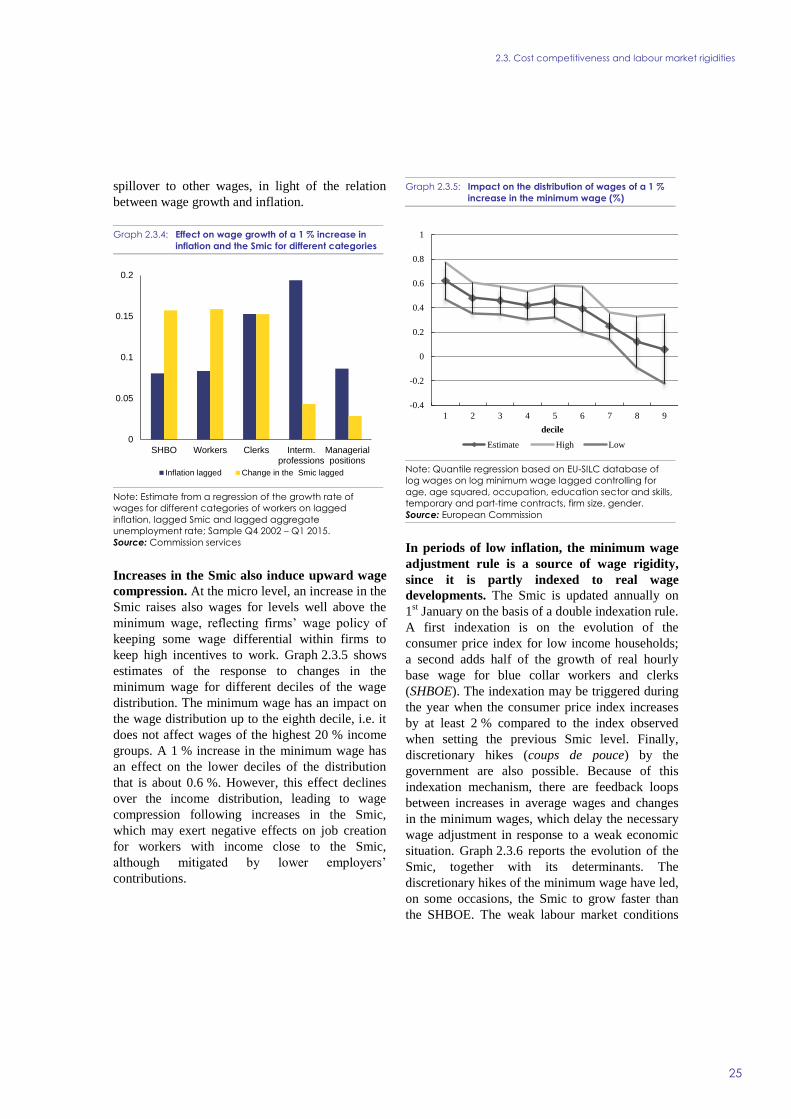
2.3. Cost competitiveness and labour market rigidities
25
spillover to other wages, in light of the relation
between wage growth and inflation.
Graph 2.3.4: Effect on wage growth of a 1 % increase in
inflation and the Smic for different categories
Note: Estimate from a regression of the growth rate of
wages for different categories of workers on lagged
inflation, lagged Smic and lagged aggregate
unemployment rate; Sample Q4 2002 – Q1 2015.
Source: Commission services
Increases in the Smic also induce upward wage
compression. At the micro level, an increase in the
Smic raises also wages for levels well above the
minimum wage, reflecting firms’ wage policy of
keeping some wage differential within firms to
keep high incentives to work. Graph 2.3.5 shows
estimates of the response to changes in the
minimum wage for different deciles of the wage
distribution. The minimum wage has an impact on
the wage distribution up to the eighth decile, i.e. it
does not affect wages of the highest 20 % income
groups. A 1 % increase in the minimum wage has
an effect on the lower deciles of the distribution
that is about 0.6 %. However, this effect declines
over the income distribution, leading to wage
compression following increases in the Smic,
which may exert negative effects on job creation
for workers with income close to the Smic,
although mitigated by lower employers’
contributions.
Graph 2.3.5: Impact on the distribution of wages of a 1 %
increase in the minimum wage (%)
Note: Quantile regression based on EU-SILC database of
log wages on log minimum wage lagged controlling for
age, age squared, occupation, education sector and skills,
temporary and part-time contracts, firm size, gender.
Source: European Commission
In periods of low inflation, the minimum wage
adjustment rule is a source of wage rigidity,
since it is partly indexed to real wage
developments. The Smic is updated annually on
1st January on the basis of a double indexation rule.
A first indexation is on the evolution of the
consumer price index for low income households;
a second adds half of the growth of real hourly
base wage for blue collar workers and clerks
(SHBOE). The indexation may be triggered during
the year when the consumer price index increases
by at least 2 % compared to the index observed
when setting the previous Smic level. Finally,
discretionary hikes (coups de pouce) by the
government are also possible. Because of this
indexation mechanism, there are feedback loops
between increases in average wages and changes
in the minimum wages, which delay the necessary
wage adjustment in response to a weak economic
situation. Graph 2.3.6 reports the evolution of the
Smic, together with its determinants. The
discretionary hikes of the minimum wage have led,
on some occasions, the Smic to grow faster than
the SHBOE. The weak labour market conditions
0
0.05
0.1
0.15
0.2
SHBO Workers Clerks Interm.professions
Managerialpositions
Inflation lagged Change in the Smic lagged
-0.4
-0.2
0
0.2
0.4
0.6
0.8
1
1 2 3 4 5 6 7 8 9
decile
Estimate High Low
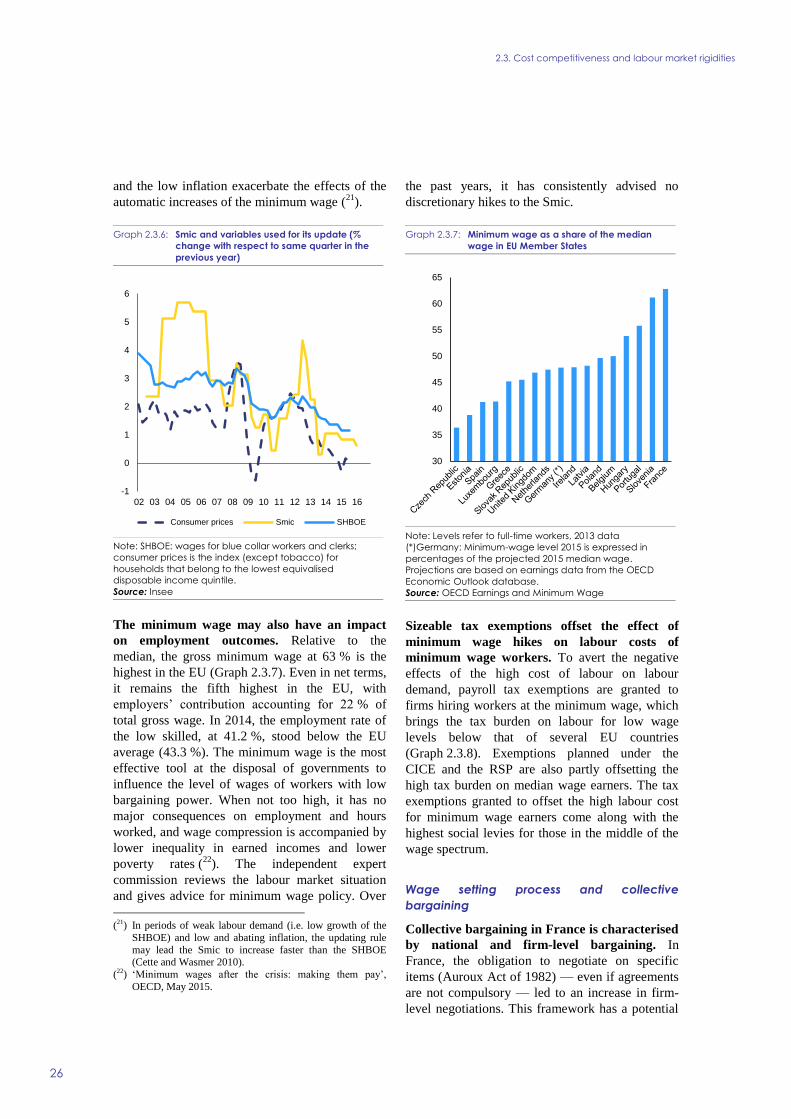
2.3. Cost competitiveness and labour market rigidities
26
and the low inflation exacerbate the effects of the
automatic increases of the minimum wage (21
).
Graph 2.3.6: Smic and variables used for its update (%
change with respect to same quarter in the
previous year)
Note: SHBOE: wages for blue collar workers and clerks;
consumer prices is the index (except tobacco) for
households that belong to the lowest equivalised
disposable income quintile.
Source: Insee
The minimum wage may also have an impact
on employment outcomes. Relative to the
median, the gross minimum wage at 63 % is the
highest in the EU (Graph 2.3.7). Even in net terms,
it remains the fifth highest in the EU, with
employers’ contribution accounting for 22 % of
total gross wage. In 2014, the employment rate of
the low skilled, at 41.2 %, stood below the EU
average (43.3 %). The minimum wage is the most
effective tool at the disposal of governments to
influence the level of wages of workers with low
bargaining power. When not too high, it has no
major consequences on employment and hours
worked, and wage compression is accompanied by
lower inequality in earned incomes and lower
poverty rates (22
). The independent expert
commission reviews the labour market situation
and gives advice for minimum wage policy. Over
(21) In periods of weak labour demand (i.e. low growth of the
SHBOE) and low and abating inflation, the updating rule
may lead the Smic to increase faster than the SHBOE (Cette and Wasmer 2010).
(22) ‘Minimum wages after the crisis: making them pay’,
OECD, May 2015.
the past years, it has consistently advised no
discretionary hikes to the Smic.
Graph 2.3.7: Minimum wage as a share of the median
wage in EU Member States
Note: Levels refer to full-time workers, 2013 data
(*)Germany: Minimum-wage level 2015 is expressed in
percentages of the projected 2015 median wage.
Projections are based on earnings data from the OECD
Economic Outlook database.
Source: OECD Earnings and Minimum Wage
Sizeable tax exemptions offset the effect of
minimum wage hikes on labour costs of
minimum wage workers. To avert the negative
effects of the high cost of labour on labour
demand, payroll tax exemptions are granted to
firms hiring workers at the minimum wage, which
brings the tax burden on labour for low wage
levels below that of several EU countries
(Graph 2.3.8). Exemptions planned under the
CICE and the RSP are also partly offsetting the
high tax burden on median wage earners. The tax
exemptions granted to offset the high labour cost
for minimum wage earners come along with the
highest social levies for those in the middle of the
wage spectrum.
Wage setting process and collective
bargaining
Collective bargaining in France is characterised
by national and firm-level bargaining. In
France, the obligation to negotiate on specific
items (Auroux Act of 1982) — even if agreements
are not compulsory — led to an increase in firm-
level negotiations. This framework has a potential
-1
0
1
2
3
4
5
6
02 03 04 05 06 07 08 09 10 11 12 13 14 15 16
Consumer prices Smic SHBOE
30
35
40
45
50
55
60
65

2.3. Cost competitiveness and labour market rigidities
27
to foster collective agreements at firm or branch
level (Box 2.3.1). However, firms with a high
percentage of minimum wage workers negotiate
less (23
).
There has been a gradual shift towards a
decentralisation of collective bargaining. The
framework introduced in 2004 (Fillon law on
social dialogue) extended the scope for firm-level
negotiation. Firm-level or sectoral agreement were
allowed to deviate from sectoral or inter-sectoral
agreement even in pejus (i.e. temporary conditions
less favourable to the worker). Nonetheless, the
favourability principle, which states that no
downward revision of employment conditions can
occur, remained valid for minimum wages (Smic
or sectoral), job classifications, supplementary
social protection measures and multi-company and
cross-sectoral vocational training funds. Since only
derogations provided in higher level agreements
may be used in lower level agreement, this has
seriously limited the use of derogation clauses (24
).
In 2013, following a social partners inter-
(23) Avouyi-Dovi et al (2011) and Aghion, P., Y. Algan and P.
Cahuc, ‘Civil Society and the State: the Interplay between
Cooperation and Minimum Wage’, Journal of the European Economic Association 9 (2011), 3-42.
(24) Meriaux, O. Kerbourc’h J. and Seiler, C. (2008):
Evaluation de la Loi du 4 Mai 2004 sur la Négociacion d’accords dérogatoires dans les entreprises, DARES
Documents d’études N. 140; Eurofund (2009) ‘Sector-level
bargaining and possibilities for deviations at company level: France’.
professional agreement, firm-level collective
agreements (accords de maintien dans l’emploi) —
approved by unions representing together at least
50 % of expressed ballots in latest professional
elections — were allowed to modify wages and
working time for a maximum of 2 years, in
exchange for a guarantee of employment for
signing employees. Should an employee refuse, he
is subject to individual economic dismissal. This
framework upheld the favourability principle.
However, it allowed reducing wages up to a level
of 20 % higher than the Smic (i.e. accounting for
about 2/3 of the median wage) and/or modifying
working time without authorisation of higher
bargaining levels; it is not allowed to re-assign
workers to different tasks if justified by technical,
organisational or economic reasons as in Spain.
The number of firm-level agreements to
support employment so far remains limited.
Since 2013, only 10 firm-level collective
agreements (accords de mantien de l’emploi) have
been signed covering less than 2000
employees (25
). To address these limitations, which
are apparent in the lack in up-take of firm-level
collective agreements (accords de mantien de
l’emploi), the Macron law modified the conditions
for their use. The Macron law extended the life of
the agreement to 5 years and introduced the ‘real
(25) Bilan de la loi de sécurisation de l’emploi du 14 juin 2013
au 3 avril 2015.
Graph 2.3.8: Employers’ social security contributions for minimum and median wage earners
Source: Commission Services, OECD (2015)
0%
5%
10%
15%
20%
25%
30%
35%
40%
45%
Minimum-wage earner Median-wage earner
2.3. Cost competitiveness and labour market rigidities
28
serious cause’ as a reason to dismiss employees
refusing the terms of the agreement, thereby
reducing uncertainty in litigation cases. In
addition, the agreements can define clauses for
their suspension in view of the evolution of the
economic activity. The effectiveness of the
adjustment of wages is constrained in sectors
where a large share of employees is working for
wages close to the Smic, in particular catering,
hotels and SMEs. In addition, it is not possible to
derogate from sectoral agreements to trade-off at
company level wage cuts with other innovative
solutions to improve competitiveness and
employment.
The Combrexelle report, published in
September 2015, paves the way for developing
more efficient bargaining outcomes. It proposes
a bargaining framework where employers and
trade unions negotiate simultaneously on
employment, wages, and working conditions —
the so-called efficient bargaining model, shown to
allow for higher employment than a framework
where bargaining is only on wages (Mcdonald and
Solow, 1981). Developing further the autonomy of
the firm-level bargaining would allow wages and
other elements of compensation and employment
(hiring and hours) to be negotiated consistently at
the firm level, while confirming the necessity of a
common national minimum wage as a basis. This
orientation towards a reinforcement of decisions
made through collective bargaining requires a
strengthening of the social dialogue, which would
be obtained through generalising majority
agreements signed at branch and company level
and through limiting the duration of agreements to
4 years. The stability of agreements would also be
increased, by limiting the timespan allowed to
introduce recourse against newly signed decisions.
Following the Combrexelle report, the
government expressed its intention to gradually
reform the labour code to increase the
autonomy of firm-level bargaining. The French
government announced that a bill should be tabled
in that regard covering inter alia working time. A
group of legal experts chaired by former Justice
Minister Robert Badinter has published a report on
25 January 2016 determining the fundamental
principles that should be included in the labour
law.
The laws establishing the 35-hour working
week have been made more flexible enabling
the organisation of work to better reflect firms’
needs. By law, firms must remunerate employees
working beyond 35 hours per week with a
negotiable extra payment equal at least to 25 % of
the normal salary (26
). In addition, overtime work
exceeding 8 hours per week (from the 44th
hour
worked) is paid 50 % above the normal salary.
Yet, firms can derogate through a company-level
agreement from working time provisions even
when this is less favourable to the workers.
However, branch agreements regarding bonus rate
of pay for extra hours worked can prevent firm-
level derogations. Hence, derogations have been
seldom used, as the average additional cost per
extra-hour of work, at about 26 % is slightly higher
than the one established by law (25 %) for
additional costs from 36 to 43 of extra hours,
despite the average working time per employee
working full time in France being at 39 hours in
2014. Equally, firms can modify the time frame of
the working week so that working time may be
measured in terms of days per year or hours per
month instead of hours per week. However, the 35
hour working week still weighs on labour costs.
Employment protection
Recent reforms have started to tackle the
rigidities in the dismissal procedure for open-
ended contracts and reduce their complexity
and uncertainty. Strict, complex, and
unpredictable employment protection legislation
has negative implication for the capacity of the
economy to reallocate resources and to respond
smoothly to shocks. Early resolution of labour
disputes reduces the cost of dismissal, leaving
judges the possibility of focusing on the most
difficult cases. Globally, France ranks among the
countries with the strictest legislation of dismissal
for open-ended and temporary contracts (27
).
Reforms implemented since 2008 have gradually
simplified and reduced the uncertainty in the
(26) The premium for extra hours is 50 % in Belgium,
Denmark, Austria and Finland, but with longer standard duration of working week. In Germany, Italy, the
Netherland and Spain, the premium is defined by collective
agreements. (27) For a critical review of OECD EPL indicators, see
Dalmasso R. (2014). ‘Les indicateurs de législation
protectrice de l’emploi au crible de l’analyse juridique.’, IRES, n 82.

2.3. Cost competitiveness and labour market rigidities
29
dismissal procedure. The mutual agreement for
termination of open-ended contracts (rupture
conventionnelle) has represented an increasing
share of termination cases, reducing the overall
number and costs of litigation cases brought before
employment tribunals, and associated uncertainties
for companies.
Successive laws have improved the framework
for both collective and individual dismissal. The
2013 law on securing employment simplified the
procedures, reduced the limitation period (délai de
prescription) from 5 to 2 years and gave more
certainty to the amounts to be paid by the
employer to the employee in case of conciliation.
The dispute is now pleaded before the
administrative court whereas it was previously the
competence of the commercial court. Over 60 % of
plans are now signed by a union majority securing
legally the system, improving the negotiation
within firms and reducing uncertainties. Yet, in
2013 only 5.5 % of litigation cases ended up in
conciliation (Yazidi and Darmaillacq, 2014), while
the duration of the cases brought before the court
of first instance (Conseil des Prud’hommes)
increased continuously up to 15.4 months in 2014,
according to judicial statistics. The measures taken
by the Macron law aim at reducing the length and
uncertainty of the litigation procedure, thereby
improving the effectiveness of employment
dispute settlement and increasing workers’
security.
The recent wage moderation, in a context of
high unemployment, remains insufficient in
view of the slowdown in productivity growth.
Wage growth is declining in France, both in
nominal and in real terms. However, the decline in
productivity growth has more than offset the
competitiveness gains stemming from this wage
moderation. In periods of low inflation, the
minimum wage adjustment rule is a source of
wage rigidity, since it is partly indexed to real
wage developments. The wage setting process also
contributes to wage pressures.
2.3. Cost competitiveness and labour market rigidities
30
Box 2.3.1: Collective bargaining and labour law in France and selected EU
countries
Collective bargaining in France is a mix of industry (branche) and firm-level bargaining with a specific
role played by the minimum wage, as a reference for negotiation for each category of employee in
professional branches agreements. Minima at the branch level set the floor for collective wage bargaining at
company level. Union density is low (about 8 % of total employees in 2014) but coverage high (98 % for the
whole economy), due to automatic extensions of collective agreements. Legislation also plays an important
role in setting the parameters for collective agreements (e.g. as compared to Germany and Italy).
In France, decentralisation has been accompanied by firm level derogations within a framework
where labour law prevails over social partner agreements Collective bargaining varies strongly across
EU countries in terms of rules establishing the scope of the agreements, the conditions for renewals, and the
hierarchy between different bargaining levels. Bargaining may take place at different levels.
Decentralisation differs across countries with regard to the type of industrial relations systems and the
relation between law and agreements. For instance, in Italy it refers to geographical relocation of bargaining
from national to lower levels; in Germany it denotes an increasing influence of work councils relative to
industry-level collective bargaining.
In France and many EU Member States, the industry level plays an important role. In France, the
definition of industry is narrower than in Italy, implying a more decentralised bargaining. Industry level
bargaining is associated to different modes of coordination across sectors. In France, the minimum wage sets
the context for wage bargaining. In other countries, coordination is more formal through interaction between
different bargaining units (e.g. Germany or Austria, where agreement in one sector acts as a reference for
negotiations in other sectors) or via guidelines set by peak associations (Spain). In Germany and Spain,
sectoral contracts are signed at regional level. Coordination has been shown to be a key determinant of
economic outcomes and resilience to shocks.
In France, higher level agreements establish the issues that can be derogated by lower bargaining
levels. The hierarchy between different bargaining levels differs across EU Member States. According to the
‘favourability principle’ lower levels of bargaining can only improve the conditions established at higher
level. In Germany, collective bargaining is mainly conducted at industry-level between trade unions; work
councils are not entitled to negotiate collective agreements. In Italy, the relationship between different
bargaining structures is set by inter-sectoral framework agreements and the same subjects cannot be
negotiated at different bargaining levels.
Mandatory extension of collective agreements to non-signatory parties is rarely automatic. Through
extension, a sector-level agreement becomes legally binding for employers who are not a member of the
association that has signed the agreement. Extension of a collective agreement can be requested by one
(France), both parties (Germany) that signed the agreement, or derive through administrative notice (the
Netherlands, Portugal or Spain). It is based on the representativeness of the parties that signed the collective
agreement (inter alia Belgium, Spain, France) or mainly automatic (Belgium, France and, only if the parts
agree, Spain). Otherwise, the extension needs to be justified on the basis of public interest (Portugal or
Poland). Extension is usually associated to high coverage but, when automatic, reduces the adjustment of the
labour costs to intra-sectoral shocks.
The duration of collective agreements and the conditions for their validity on expiry influence the
incentives to revise agreements. In France and Spain, the duration of a contract is one year; in Germany
and Italy about two to three years. The conditions that regulate the validity of an expired contract influence
the speed at which contracts are renewed and the scope of bargaining. An expired but not renewed contract
could last indefinitely (Austria, Germany, Italy) or be applicable for a limited time period (in France up to 5
years after expiration).
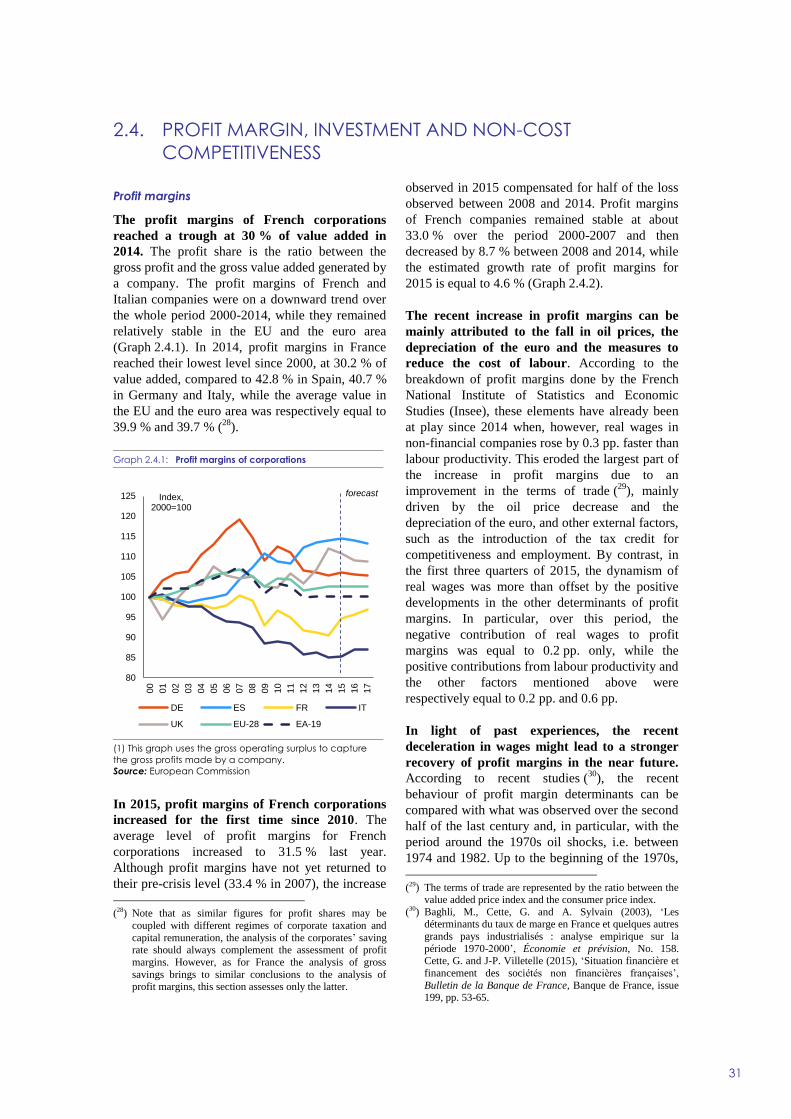
31
Profit margins
The profit margins of French corporations
reached a trough at 30 % of value added in
2014. The profit share is the ratio between the
gross profit and the gross value added generated by
a company. The profit margins of French and
Italian companies were on a downward trend over
the whole period 2000-2014, while they remained
relatively stable in the EU and the euro area
(Graph 2.4.1). In 2014, profit margins in France
reached their lowest level since 2000, at 30.2 % of
value added, compared to 42.8 % in Spain, 40.7 %
in Germany and Italy, while the average value in
the EU and the euro area was respectively equal to
39.9 % and 39.7 % (28
).
Graph 2.4.1: Profit margins of corporations
(1) This graph uses the gross operating surplus to capture
the gross profits made by a company.
Source: European Commission
In 2015, profit margins of French corporations
increased for the first time since 2010. The
average level of profit margins for French
corporations increased to 31.5 % last year.
Although profit margins have not yet returned to
their pre-crisis level (33.4 % in 2007), the increase
(28) Note that as similar figures for profit shares may be
coupled with different regimes of corporate taxation and
capital remuneration, the analysis of the corporates’ saving rate should always complement the assessment of profit
margins. However, as for France the analysis of gross
savings brings to similar conclusions to the analysis of profit margins, this section assesses only the latter.
observed in 2015 compensated for half of the loss
observed between 2008 and 2014. Profit margins
of French companies remained stable at about
33.0 % over the period 2000-2007 and then
decreased by 8.7 % between 2008 and 2014, while
the estimated growth rate of profit margins for
2015 is equal to 4.6 % (Graph 2.4.2).
The recent increase in profit margins can be
mainly attributed to the fall in oil prices, the
depreciation of the euro and the measures to
reduce the cost of labour. According to the
breakdown of profit margins done by the French
National Institute of Statistics and Economic
Studies (Insee), these elements have already been
at play since 2014 when, however, real wages in
non-financial companies rose by 0.3 pp. faster than
labour productivity. This eroded the largest part of
the increase in profit margins due to an
improvement in the terms of trade (29
), mainly
driven by the oil price decrease and the
depreciation of the euro, and other external factors,
such as the introduction of the tax credit for
competitiveness and employment. By contrast, in
the first three quarters of 2015, the dynamism of
real wages was more than offset by the positive
developments in the other determinants of profit
margins. In particular, over this period, the
negative contribution of real wages to profit
margins was equal to 0.2 pp. only, while the
positive contributions from labour productivity and
the other factors mentioned above were
respectively equal to 0.2 pp. and 0.6 pp.
In light of past experiences, the recent
deceleration in wages might lead to a stronger
recovery of profit margins in the near future.
According to recent studies (30
), the recent
behaviour of profit margin determinants can be
compared with what was observed over the second
half of the last century and, in particular, with the
period around the 1970s oil shocks, i.e. between
1974 and 1982. Up to the beginning of the 1970s,
(29) The terms of trade are represented by the ratio between the
value added price index and the consumer price index.
(30) Baghli, M., Cette, G. and A. Sylvain (2003), ‘Les déterminants du taux de marge en France et quelques autres
grands pays industrialisés : analyse empirique sur la
période 1970-2000’, Économie et prévision, No. 158. Cette, G. and J-P. Villetelle (2015), ‘Situation financière et
financement des sociétés non financières françaises’,
Bulletin de la Banque de France, Banque de France, issue 199, pp. 53-65.
80
85
90
95
100
105
110
115
120
125
00
01
02
03
04
05
06
07
08
09
10
11
12
13
14
15
16
17
Index, 2000=100
DE ES FR IT
UK EU-28 EA-19
forecast
2.4. PROFIT MARGIN, INVESTMENT AND NON-COST
COMPETITIVENESS

2.4. Profit margin, investment and non-cost competitiveness
32
the contribution of real wages and labour
productivity to profit margins was symmetrically
opposed and far more significant than that of other
elements. As a result, no significant change in the
level of profit margins was observed for about 20
years. Between 1974 and 1982, the sudden rise in
the oil price deteriorated the terms of trade for
French non-financial corporations and caused a
drop in their profit margins. After that period, the
positive contribution from labour productivity
outweighed the negative contribution from labour
costs, leading to the recovery in profit margins
over the 1980s. Finally, since the 1990s
developments in real wages and productivity
balanced each other up to 2008, when the former
began dominating the latter. Therefore, the recent
deceleration in real wages and increase in
productivity would imply a recovery of profit
margins after the 2008 crisis.
Investment and non-cost competitiveness
Notwithstanding relatively low profit margins,
the investment rate in France was among the
highest in the EU in 2014. France has the highest
ratio between profit margins and the investment
rate in the EU. In particular, in 2014, investment
stood at 23.4 % of the value added produced by
French corporations and represented 77.5 % of
their profit margins. Moreover, the investment rate
in France was higher than the EU or euro-area
aggregates, respectively equal to 20.9 % and
20.7 %. In particular, the investment rate in France
was even higher than in peer EU countries. For
example, the investment rate was 17.9 % in
Germany, 17.0 % in Italy and 16.6 % in the United
Kingdom, while Spain presented a rate higher than
France, at 26.2 %.
The relatively high level of investment in
France has been accompanied by a relatively
high degree of resilience to the last crisis. The
persistent downward trend in profit margins has
not been followed by an equally strong and
persistent fall in the investment rate (Graph 2.4.3).
Rather, the investment rate of non-financial
corporations in France decreased in the course of
2009, reaching 21.3 % in the last quarter of 2009
compared to 22.8 % at the end of 2008. It then
slowly regained the lost ground over the following
years, hitting 23.2 % of value added at the end of
2013. Such increase was made possible mainly by
a compression in the net interests and dividends
paid out by firms, whose net amount decreased
respectively by 2.5 pps. and 2.1 pps. between the
beginning of 2009 and the end of 2013.
Graph 2.4.2: Change in profit margins of corporations,
2000-2014
Source: European Commission
However, a slowdown in the investment growth
rate can be observed over the most recent
quarters and a new acceleration is not projected
to take place before 2017. Since 2014, the
investment rate first stabilised around 23 % and
then slightly diminished (up to 22.9 %), mainly
due to the lower growth rate of economic
activity (31
). Indeed, firms keep indicating the
presence of a constraint on the number of orders
they receive. As a result, the indicator representing
the difficulties perceived by a firm on the demand
side, already above normal in 2014, has continued
to increase in 2015. This may explain why, while
the production capacity utilisation rate (‘taux
d’utilisation des capacités de production’, TUC)
(31) Insee (2015), ‘Note de conjoncture’, December 2015. See
also Insee (2015), ‘Note de conjoncture’, June 2015;
Barkbu et al. (2015), ‘Investment in the euro area: why has it been weak?’, IMF Working Paper, WP/15/32; Bussière
et al. (2015), ‘Explaining the recent slump in investment:
the role of expected demand and uncertainty’, Banque de France, Working Paper No. 571.
-30%
-20%
-10%
0%
10%
20%
30%
PL
HR
DE SI
LU
SK
RO
BG
BE
HU
NL
AT
PT
UK
ES
EE
LT
SE FI
CZ
FR
MT IE EL IT LV
DK
CY
EA
-19
EU
-28
a) 2000-2007
-20%
-15%
-10%
-5%
0%
5%
10%
15%
20%
25%
RO IE LV
PL
EE
LT
CY
HU
UK
ES
PT
DK
BE
EL
MT
CZ
BG
NL SI
SE
LU
SK
DE IT FR
AT FI
HR
EA
-19
EU
-28
b) 2008-2014

2.4. Profit margin, investment and non-cost competitiveness
33
increased from 81.0 % in 2014 to 81.9 % in 2015,
production facilities in the manufacturing industry
continue to be used less than in the period 1994-
2007 average (84.5 %).
Graph 2.4.3: Investment rate developments, non-financial
corporations, France, 2000-2015
(1)Investment rate and profit margins data series are
available up to Q3-2015, while net interest and net
dividend data series are available up to Q2-2015. Net
interest and net dividend are defined as the difference
between paid and received interest or dividend. They are
both divided by the value added produced by non-
financial corporations.
Source: Insee
French companies’ expenditure remains
targeted towards less productive investments.
Investment of the French industry in equipment
has been relatively dynamic over the past years. At
11.1 % of the value added produced by the
industrial sector in 2014, it is higher than in
Germany (9.2 %). Investment in intellectual
property of the industry is also more dynamic than
in Germany. However, a large part of companies’
investments remains oriented towards the
construction sector, while only a low share of
companies’ investments is used for the purchase of
machinery and capital goods, including robotics
and information and communication technology-
intensive products. Equally, expenditures for
intangible investments are mainly directed towards
software and databases than research and
development activities. Moreover, when
considering tangible productive investments,
expenses related to intangible innovative goods
would represent 25 % of the total investment
envelope. This percentage is twice as important as
the observed share of intangible investments in the
total investment of French companies, excluding
the real estate sector.
The main motivation to invest remains the
replacement of outdated equipment. In 2014,
29 % of the investments planned by French non-
financial corporations for that year were devoted to
the renewal of the old equipment (Graph 2.4.4).
The need to modernise and streamline production
processes explained 23 % of firms’ total
investment need. By contrast, the extension of the
productive capacity and the introduction of new
products appeared among the least cited reasons,
explaining 15 % and 13 % of the total investment
need. Moreover, over the last 15 years, a positive
trend can be observed in firms’ investment made
for replacing the existing equipment. This trend
may be explained by the decrease in the average
lifespan of capital assets, which may have led to an
increase in the cost of capital and ultimately
exerted a downward pressure on the investment
rate (32
).
(32) Eudeline, J.-F., Gorin, Y., Sklénard, G. and A.
Zakhartchouk (2013), ‘Will corporate investment take off again in France in 2014?’, Insee, Départment de
conjuncture, December 2013.
0%
1%
2%
3%
4%
5%
6%
7%
15%
17%
19%
21%
23%
25%
27%
29%
31%
33%
35%
00
01
02
03
04
05
06
07
08
09
10
11
12
13
14
15
investment rate profit margin
net interest rate (rhs) net dividend rate (rhs)

2.4. Profit margin, investment and non-cost competitiveness
34
Graph 2.4.4: Investment motivation, manufacturing
industry, France, 1991-2015
(1) Data refer to the manufacturing industry. They represent
the forecast of the investment need made by firms each
October for the current year.
Source: Insee
The preference for replacing existing
equipment instead of investing to improve the
range of produced goods and services is linked
to the overall average non-cost competitiveness
performance of French exports. The non-cost
dimension of the French external competitiveness
issue is linked to the variety and quality of
products, which in turn depend on the resources
invested by a company into both the development
of new products and the improvement of the
existing ones. While France has maintained a high
global market share in trade of high unit value
segments (33
), the absence of an increasing trend in
investments for introducing new products is
correlated with the average poor quality/price ratio
of French exports (34
). This has been indicated as
one of the main reasons behind the loss of
(33) Stehrer, R., Leitner, S., Marcias, M., Mirza, D. and R.
Stöllinger (2015), ‘The future development of EU industry in a global context’, study for the European Commission,
September 2015. This is an export pattern shared by few
Member States only, notably Germany, Austria, the UK and Nordic countries. See also European Commission
(2015), Macroeconomic imbalances - Country Report –
France 2015, European Economy, Occasional Papers No. 217, June 2015.
(34) Bas M., Fontagné L., Martin P. and T. Mayer (2015), ‘La
France en mal de qualité ?’, La Lettre du CEPII, No. 355, July 2015. Bas M., Fontagné L., Martin P. and T. Mayer
(2015), ‘In search of lost market shares’, Les notes du
conseil d’analyse économique, No. 23, May 2015.
competitiveness shown by French exporters in the
2000s (35
).
Differences in the rate of investment related to
the size of a firm have widened. The share of
investment within the value added produced by a
firm is positively correlated with the dimension of
non-financial corporations (Graph 2.4.5). In other
words, the larger the firm, the bigger is the part of
value added dedicated to investment and the more
considerable the advantage in terms of non-cost
competitiveness. In 2014, small and medium-sized
enterprises (SMEs) were able to spend 16.0 % of
their value added in investment, contrary to 24.6 %
for large enterprises. In particular, the low
investment rate of SMEs seems to derive from the
difficulties to invest faced by smaller companies,
as medium-sized enterprises alone could assign
25.0 % of their value added to investment that is
0.4 pp. more than large firms. Moreover, these
differences seem to have increased after 2011,
when medium-sized enterprises were dedicating to
investment 3.0 pps. more than large enterprises
and only 6.6 pps. was separating the investment
share of SMEs from that of medium enterprises.
This ultimately leads to a situation where
investment is highly concentrated around a limited
number of firms (1 % of firms account for 75 % of
investment) (36
).
(35) Bas M., Martin P. and T. Mayer (2014), Report on main
directions od research towards better assessment of competitiveness, Work Package 5 of the Mapcompete
project, http://mapcompete.eu/main-directions-of-research-
towards-better-assessment-of-competitiveness. (36) Bacheré H. (2014), ‘2012 : une année difficile pour les
entreprises, particulièrement pour les plus petites’, Les
entreprises en France, Insee Références, November 2014.
0%
10%
20%
30%
40%
50%
60%
70%
80%
90%
100%
Modernization, streamlining
Equipment replacement
Extension of productive capacity
Introduction of new products
Other purposes (safety, environment, working conditions, etc.)

2.4. Profit margin, investment and non-cost competitiveness
35
Graph 2.4.5: Investment rate by firm size, non-financial
corporations, France, 2014
Source: Banque de France
Investment policy
A French investment plan was presented in
April 2015 by the French Prime Minister. The
main measures in this package are the exceptional
capital depreciation for equipment investments, the
strengthening of the public investment bank
(‘Banque Publique d’Investissement’, BPI France),
France’s actions to sustain investment, and some
measures to better link investment funds to the
capital market.
The effect of the exceptional capital
depreciation may be lessened by the temporary
nature of the measure. The investment plan has
given firms the possibility to absorb an additional
40 % for equipment investments in the period
included between mid-April 2015 and mid-April
2016. In the second and third quarter of 2015, the
wholesale trade indices in capital goods suggest
that the purchases of equipment most affected by
the exceptional capital depreciation were the most
dynamic. At the same time, the restricted field of
coverage of this measure may have distorted
investment decisions, introducing disincentives to
invest in goods not subject to the exceptional
capital depreciation. Moreover, although the
exceptional capital depreciation is currently
supporting manufacturing and in particular some
equipment investment, the effect of this measure is
likely to fade away due to its temporary nature and
the uncertainty surrounding its follow-up (37
).
The strengthening of the public investment
bank’s co-financing actions for tangible and
intangible investment projects might help the
modernisation of French companies. The
investment plan has also reinforced the BPI France
budget by EUR 2.1 bn in order to increase from
EUR 5.9 bn to EUR 8 bn the amount of resources
available for the ‘development loans’ over the
period 2015-2017. These loans are granted for
seven years, without requiring collateral from the
company applying for financing. The scope of
these loans is to facilitate the modernisation of
companies, for example by encouraging energy
saving investments in traditional industries,
companies developing green growth or even
projects to make the transition towards a digital
economy.
Actions to reinforce firms’ access to equity for
the financing of longer-term projects have been
taken. While the share of shareholders’ equity out
of total resources is fairly similar for all categories
of companies, SMEs tend to be more reliant on
financial debt, using loans rather than securities,
and are less able to retain financial reserves. These
disparities have increased between 2007 and 2013,
so that in 2013 SMEs appeared to rely almost
exclusively on banking borrowing (38
), although
smaller companies do not seem to be financially
constrained (39
). For longer-term projects, instead,
the other measures contained in the investment
plan would guarantee further access to equity.
Indeed, the measures to reinforce the orientation of
savings collected by private funds, such as pension
and life insurance funds, towards investment in the
private sector would better link such funds to the
capital market.
Moreover, the implementation of the European
investment plan is advancing rather smoothly
in France. The government has rapidly endorsed
the Juncker plan initiative and set up a general
(37) Insee (2015), ‘Note de conjoncture’, December 2015.
(38) See Cette, G. and J-P. Villetelle (2015), ‘Situation financière et financement des sociétés non financières
françaises’, Bulletin de la Banque de France, Banque de
France, issue 199, pp. 53-65. (39) Villeroy de Galhau (2015), ‘Financing Business
Investment’, Final Report, September 2015.
0%
5%
10%
15%
20%
25%
30%
SMEs mediumenterprises
largeenterprises
all sizes
2.4. Profit margin, investment and non-cost competitiveness
36
investment commission (‘Commissariat Général
de l’Investissement’) to identify possible projects
for the European Fund for Strategic Investments
(EFSI). Moreover, there is strong stakeholder
involvement from both the public and private
sectors. Several public sector actors have been
mobilised: National Promotional Banks (BPI
France and ‘Caisse des Dépôts et Consignations’),
general investment commission, and the
Association of French Regions (‘Association des
Régions de France’). Stakeholders’ awareness of
the plan has been steadily increasing since the
signature of the first projects. This holds
particularly true for trade unions and French
companies that are stock market indexed (CAC
40).
Notwithstanding the aforementioned actions
undertaken to stimulate investments, specific
challenges remain regarding private research
and development activities and in the energy
sector. Private sector performance in terms of
research and development (R&D) activities is
modest compared with EU innovation leaders (see
Section 3.3). Moreover, subdued investment in
renewable energy put the country at risk of missing
its EU2020 target (see Section 3.1).

37
Private indebtedness
The level of consolidated private debt, which
exceeded in 2011 the threshold set in the Alert
Mechanism Report of 133 % of GDP, continued
rising to reach 143.2 % of GDP in 2014, which is
above the level for the euro area as a whole for the
first time. While a number of European economies
have experienced significant deleveraging since
2009, private indebtedness in France has continued
to grow at a relatively rapid pace throughout the
crisis and beyond.
Graph 2.5.1: Household and NFC indebtedness
Source: Eurostat
The French banking sector is very concentrated
with well-capitalised institutions that remain
dependent on wholesale funding. Large domestic
banks in France hold 98 % of the total assets
compared to 67 % in the euro area. The four
largest French banking institutions are considered
of global systemic importance by the Financial
Stability Board. Overall, French banks appear
somewhat more profitable than their counterparts
in the euro area, with a return on equity which
amounted to 4.5 % in 2014 compared to 2.3 % on
average in the euro area. With a Tier 1 ratio of
13.1 %, the capitalisation of French banks appears
in line with that of their euro-area counterparts
(13.3 %). Their loan portfolio is also slightly less
risky, with non-performing loans representing
3.6 % of the total portfolio in 2014. However,
while progress has been made, French banks
continue to rely on short-term wholesale funding
as their loan-to-deposit ratio was 118 % end 2014
(versus 140 % in the beginning of 2009). Such
dependence can prove a weakness when interbank
markets experience difficulties.
The indebtedness of French households has
continued to increase, but at a reduced pace
since 2010. Household debt represented 56.1 % of
GDP in 2014. The increase in the household debt
ratio has been slowing down in recent years, with
an increase of 0.4 pp. per year on average between
2010 and 2014, compared with 2.1 pps. between
2007 and 2010. By contrast, the household debt
ratio in the euro area peaked in 2009, and has been
falling since then, to 59.6 % of GDP in 2014.
The increasing household indebtedness should
be seen in the context of a relatively sound net
financial asset position and low interest burden
on households. In 2014, net financial assets,
which comprise financial assets and liabilities,
have reached 152.6 % of GDP, more than 10 pps.
above their pre-crisis level and above the level in
the euro area (144.3 %). Moreover, the interest
burden, measuring the affordability of household
debt, represented 1.1 % of gross disposable income
on average, which is less than that in the euro area
(1.5 %). Overall, the credit worthiness of French
households remains unproblematic at this stage
when compared to European peers.
The real estate market is cooling off and the
expected correction of real estate prices is
sizeable. The driving force behind household
indebtedness dynamics over the last 10 years has
been the growth in real estate credit sustained by
rising house prices and low interest rates. Prices in
France rose by about 120 % from 1997 to 2007.
Since then, prices have corrected by a mere -8 %,
whereas in the previous house price cycle the
correction was of 30 %. Consequently, the
outstanding volume of loans for house purchase
(41.7 % of GDP in 2014) has gradually decelerated
from a growth rate of +12.8 % in 2007 to -2.7 % in
2014. The real estate price correction is expected
to proceed smoothly (Graph 2.5.2) and the risks for
household deleveraging are relatively contained, in
the absence of excess housing supply, while
positive demographic trends still support strong
demand for housing and banking institutions have
conservative criteria in providing credit to
households (83 % at fixed interest rate,
indebtedness rate limited to a third of revenues).
However, a more active deleveraging of
0
20
40
60
80
100
120
140
160
04 05 06 07 08 09 10 11 12 13 14
% o
f G
DP
Non financial corporations Household
Private sector EA18 Private sector
MIP Threshold
2.5. PRIVATE AND PUBLIC INDEBTEDNESS

2.5. Private and public indebtedness
38
households cannot be excluded should the overall
economic conditions worsen in France, for
instance because of a change in market perception
of the sustainability of public finances.
Graph 2.5.2: Valuation levels and latest house price
growth (2014)
Source: Eurostat, ECB, BIS, OECD, European Commission
Although limited and passive, household
deleveraging weighs on economic growth and
residential investment, already hampered by
regulation and distorted incentives. The
correction in housing market weighs on residential
investment, which is projected to further decrease
in 2015 after three years of contraction, and holds
back economic recovery. Besides, distortions
caused by rent control regulation, tax breaks and
subsidies are found to limit the responsiveness of
house supply to measures targeting it and may tend
to hinder a fluid and transparent market
development (40
). In this context, French housing
policies seem too demand-oriented and tend to
exacerbate unnecessarily the consolidation in
residential investment and the impact on growth.
The non-consolidated debt of non-financial
corporations increased in 2014 to reach 124.8 %
of GDP, above the euro-area average (96.2 %).
(40) Boulhol H. (2011) ‘Making the French Housing Market
Work Better,’ OECD Economics Department Working
Papers 861, OECD Publishing. A similar analysis is made by Enderlein, H. and Pisani-Ferry J (2014) ‘Reforms,
investment and growth: An agenda for France, Germany
and Europe’, 27 November 2014.
After netting out intercompany loans, the
consolidated debt level of non-financial
corporations reached a peak of 87.1 % of GDP in
2014 (compared to 79.4 % in the euro area).
Despite the somewhat higher level of debt, the
leverage of companies, measured through the debt-
to-equity ratio (54 %) remains below the euro-area
average (68.9 %). The leverage of companies
spiked in 2008 as a result of a sharp decrease in
equity but has decreased in recent years despite the
continuously growing debt. In 2014, net assets of
non-financial corporations represented 102.4 % of
GDP in France and 92.6 % of GDP in the euro
area.
The recent developments in the profitability of
non-financial companies may also improve
companies’ ability to service their debt. The
turnaround in profitability of French non-financial
corporations observed in 2015, consequence of the
ongoing measures in their favour such as the
competitiveness and employment tax credit (Crédit
d’Impôt pour la Compétitivité et l’Emploi - CICE)
and the Responsibility and Solidarity Pact and of
the reduced energy bill, points to a reduction in
potential vulnerabilities if this evolution continues.
Public indebtedness
While the combination of high public and
private debt is a factor of risk, France does not
appear to face considerable sustainability
challenges in the short term. Risks of fiscal stress
are low but some fiscal variables such as the
primary balance and gross financing needs (14.5 %
of GDP) point to possible short-term challenges.
The structure of public debt financing, both in
terms of maturity and diversification, does not give
rise to short-term risks. Indeed, France is currently
able to issue long-term debt at very low rates, in
line with favourable funding conditions and
investor appetite. According to the latest data
released by the French treasury agency (Agence
France Trésor), the average maturity of French
debt has increased slightly to 7.1 years, reflecting
the increase in issuance of medium to long-term
debt as well as a decrease in short-term debt
(10.4 % in November 2015 from 18.6 % in 2009).
Inflation-linked bonds represent around 10 % of
total French debt and allow for savings on the debt
charge in the current low inflation and low rates
environment, diversify the debt instruments issued
by France and widen its investor base. However,
BE
DE
IE
EL
ES
FR
IT
CY
LU
MTNL
ATPT SI
SK
FI
BGCZ
DK
EE
LV
LT
HU
PL
RO
SE
UK
HR
-20
-15
-10
-5
0
5
10
15
20
-30 -20 -10 0 10 20 30
House p
rice y
-o-y
real gro
wth
, 2015Q
2 (
%)
Estimated valuation gap, 2014 (%)
Correcting from overvalued levels
Overvalued and still growingRecovering from
undervalued levels
Undervalued and falling
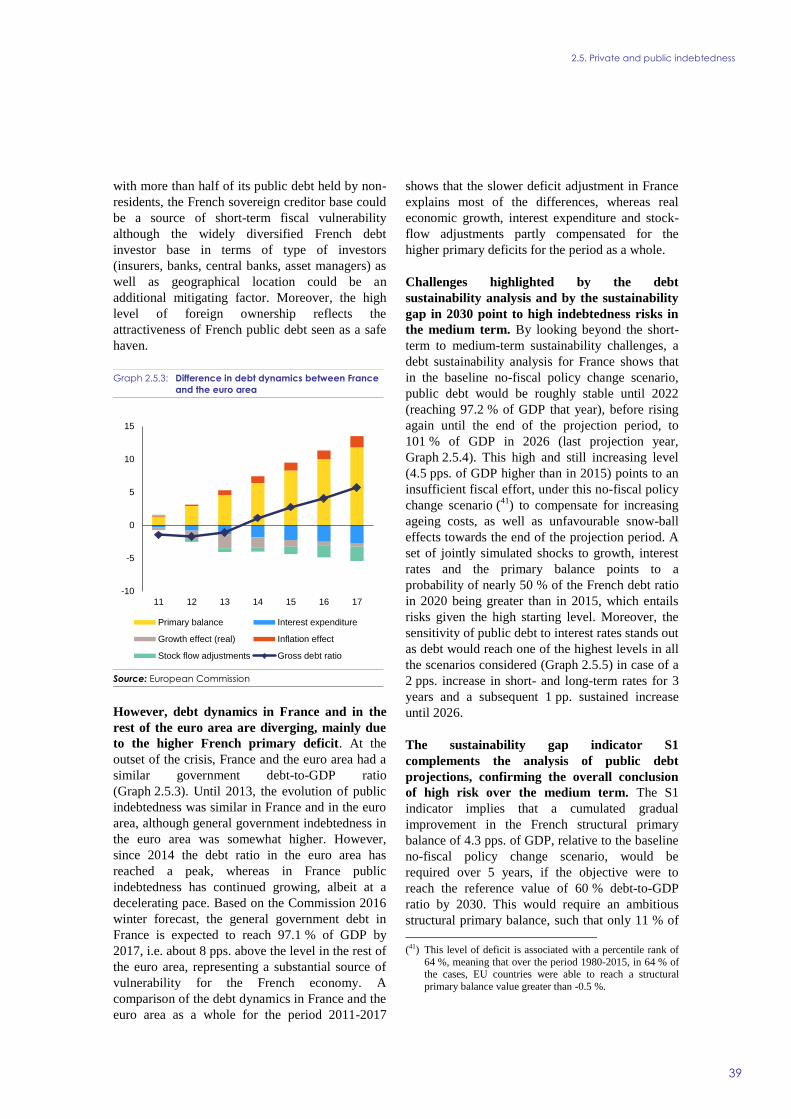
2.5. Private and public indebtedness
39
with more than half of its public debt held by non-
residents, the French sovereign creditor base could
be a source of short-term fiscal vulnerability
although the widely diversified French debt
investor base in terms of type of investors
(insurers, banks, central banks, asset managers) as
well as geographical location could be an
additional mitigating factor. Moreover, the high
level of foreign ownership reflects the
attractiveness of French public debt seen as a safe
haven.
Graph 2.5.3: Difference in debt dynamics between France
and the euro area
Source: European Commission
However, debt dynamics in France and in the
rest of the euro area are diverging, mainly due
to the higher French primary deficit. At the
outset of the crisis, France and the euro area had a
similar government debt-to-GDP ratio
(Graph 2.5.3). Until 2013, the evolution of public
indebtedness was similar in France and in the euro
area, although general government indebtedness in
the euro area was somewhat higher. However,
since 2014 the debt ratio in the euro area has
reached a peak, whereas in France public
indebtedness has continued growing, albeit at a
decelerating pace. Based on the Commission 2016
winter forecast, the general government debt in
France is expected to reach 97.1 % of GDP by
2017, i.e. about 8 pps. above the level in the rest of
the euro area, representing a substantial source of
vulnerability for the French economy. A
comparison of the debt dynamics in France and the
euro area as a whole for the period 2011-2017
shows that the slower deficit adjustment in France
explains most of the differences, whereas real
economic growth, interest expenditure and stock-
flow adjustments partly compensated for the
higher primary deficits for the period as a whole.
Challenges highlighted by the debt
sustainability analysis and by the sustainability
gap in 2030 point to high indebtedness risks in
the medium term. By looking beyond the short-
term to medium-term sustainability challenges, a
debt sustainability analysis for France shows that
in the baseline no-fiscal policy change scenario,
public debt would be roughly stable until 2022
(reaching 97.2 % of GDP that year), before rising
again until the end of the projection period, to
101 % of GDP in 2026 (last projection year,
Graph 2.5.4). This high and still increasing level
(4.5 pps. of GDP higher than in 2015) points to an
insufficient fiscal effort, under this no-fiscal policy
change scenario (41
) to compensate for increasing
ageing costs, as well as unfavourable snow-ball
effects towards the end of the projection period. A
set of jointly simulated shocks to growth, interest
rates and the primary balance points to a
probability of nearly 50 % of the French debt ratio
in 2020 being greater than in 2015, which entails
risks given the high starting level. Moreover, the
sensitivity of public debt to interest rates stands out
as debt would reach one of the highest levels in all
the scenarios considered (Graph 2.5.5) in case of a
2 pps. increase in short- and long-term rates for 3
years and a subsequent 1 pp. sustained increase
until 2026.
The sustainability gap indicator S1
complements the analysis of public debt
projections, confirming the overall conclusion
of high risk over the medium term. The S1
indicator implies that a cumulated gradual
improvement in the French structural primary
balance of 4.3 pps. of GDP, relative to the baseline
no-fiscal policy change scenario, would be
required over 5 years, if the objective were to
reach the reference value of 60 % debt-to-GDP
ratio by 2030. This would require an ambitious
structural primary balance, such that only 11 % of
(41) This level of deficit is associated with a percentile rank of
64 %, meaning that over the period 1980-2015, in 64 % of the cases, EU countries were able to reach a structural
primary balance value greater than -0.5 %.
-10
-5
0
5
10
15
11 12 13 14 15 16 17
Primary balance Interest expenditure
Growth effect (real) Inflation effect
Stock flow adjustments Gross debt ratio

2.5. Private and public indebtedness
40
the structural primary balances recorded for the
EU-28 countries between 1980 and 2015 would be
greater than that. There is therefore a high risk
according to the S1 indicator. The very significant
required fiscal adjustment for France is mainly due
to the distance of the debt ratio to the 60 %
reference value (2.8 pps. of GDP required fiscal
adjustment due to this), and, to a lesser extent, to
the unfavourable initial budgetary position defined
as the gap to the debt-stabilising primary balance
(responsible for 1.2 pp. of GDP required fiscal
adjustment) and projected age-related public
spending (42
) (0.3 pp. of GDP).
In the long run, France is at low risk as the
long-term sustainability gap indicator S2
measured at horizon 2060 has a relatively low
value. The S2 indicator, calculated under a
baseline no-fiscal policy change scenario, indeed
points to a relatively small required fiscal
adjustment (0.6 pp. of GDP), to ensure that the
debt ratio remains on a sustainable path over the
long run horizon. This is primarily due to the
projected decrease of age-related spending
(contribution of -1.0 pp. of GDP to S2), mitigated
by the unfavourable initial budgetary position
(1.5 pp. of GDP). It is in particular the projected
decrease of public pension expenditure that drives
down ageing costs (-1.7 pp. of GDP), given the
(42) See European Commission (2015) Fiscal Sustainability
Report 2015.
reforms implemented in this area in the past.
However, long-term risks could arise under more
adverse scenarios, such as in the lower total factor
productivity growth scenario for pension
expenditures, or the Ageing Working Group risk
scenario for health-care and long-term care
expenditures (43
).
Graph 2.5.5: Gross public debt as % of GDP
Source: European Commission
(43) European Commission (2015) Ageing Report 2015.
70
75
80
85
90
95
100
105
110
115
120
11 12 13 14 15 16 17 18 19 20 21 22 23 24 25 26
Baseline no-policy change scenario
Standardized negative shock on newly issued and rolled over debt
Enhanced positive shock on newly issued and rolled over debt
Graph 2.5.4: Gross public debt as % of GDP in 2026 - France
Source: European Commission
100.898.7
109.7 110.6
76.7
87.5
95.6
106.5 106.2
95.8
106.2
95.8
101.9
100.8
108.8106.1
95.9
50
60
70
80
90
100
110
120
Ba
selin
e n
o-p
olic
y c
hange s
cenario
No-p
olic
y c
hange s
cen
ario w
ithout
agein
g c
osts
His
torical S
PB
scenario
Com
bin
ed h
isto
rical scenario
Sta
bili
ty a
nd G
row
th P
act (S
GP
)in
stitu
tional scenario
Sta
bili
ty a
nd C
onverg
ence
Pro
gra
mm
e (
SC
P)
scenario
Sta
ndard
ized n
egative
sh
ock on
new
ly issu
ed a
nd r
olle
d o
ver
debt
Sta
ndard
ized (
perm
anent)
positiv
esho
ck (
+1p.p
.) to
the s
hort
- an
d long-
term
inte
rest ra
tes o
n n
ew
ly issued…
Sta
ndard
ized (
perm
anent)
nega
tive
sho
ck (
-0.5
p.p
.) o
n G
DP
gro
wth
Sta
ndard
ized (
perm
anent)
positiv
esho
ck (
+0.5
p.p
.) o
n G
DP
gro
wth
Sta
ndard
ized (
perm
anent)
nega
tive
sho
ck (
-0.5
p.p
.) o
n inflation
Sta
ndard
ized (
perm
anent)
positiv
esho
ck (
+0.5
p.p
.) o
n infla
tion
Sta
ndard
ized (
perm
anent)
nega
tive
sho
ck o
n the P
B e
qual to
50%
of th
efo
recaste
d c
um
ula
tive c
hange o
ver…
Se
nsitiv
ity test on the e
xcha
nge r
ate
En
hanced p
ositiv
e s
hock o
n n
ew
lyis
su
ed a
nd
rolle
d o
ver
debt
En
hanced (
perm
anent)
negative
sho
ck (
-std
ev(1
1-1
3)/
-0.5
p.p
.) o
nG
DP
gro
wth
En
hanced (
perm
anent)
positiv
e s
hock
(+std
ev(1
1-1
3)/
+0.5
p.p
.) o
n G
DP
gro
wth
2026 scenarios 2026 baseline scenario 2015
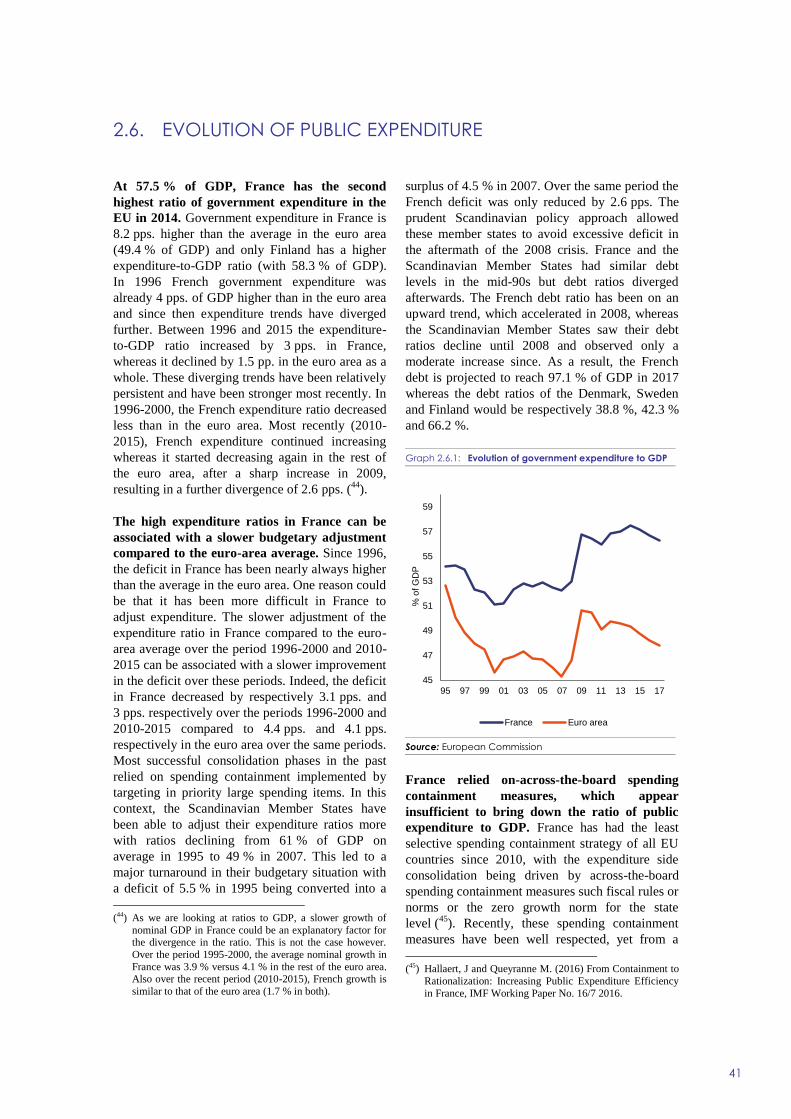
41
At 57.5 % of GDP, France has the second
highest ratio of government expenditure in the
EU in 2014. Government expenditure in France is
8.2 pps. higher than the average in the euro area
(49.4 % of GDP) and only Finland has a higher
expenditure-to-GDP ratio (with 58.3 % of GDP).
In 1996 French government expenditure was
already 4 pps. of GDP higher than in the euro area
and since then expenditure trends have diverged
further. Between 1996 and 2015 the expenditure-
to-GDP ratio increased by 3 pps. in France,
whereas it declined by 1.5 pp. in the euro area as a
whole. These diverging trends have been relatively
persistent and have been stronger most recently. In
1996-2000, the French expenditure ratio decreased
less than in the euro area. Most recently (2010-
2015), French expenditure continued increasing
whereas it started decreasing again in the rest of
the euro area, after a sharp increase in 2009,
resulting in a further divergence of 2.6 pps. (44
).
The high expenditure ratios in France can be
associated with a slower budgetary adjustment
compared to the euro-area average. Since 1996,
the deficit in France has been nearly always higher
than the average in the euro area. One reason could
be that it has been more difficult in France to
adjust expenditure. The slower adjustment of the
expenditure ratio in France compared to the euro-
area average over the period 1996-2000 and 2010-
2015 can be associated with a slower improvement
in the deficit over these periods. Indeed, the deficit
in France decreased by respectively 3.1 pps. and
3 pps. respectively over the periods 1996-2000 and
2010-2015 compared to 4.4 pps. and 4.1 pps.
respectively in the euro area over the same periods.
Most successful consolidation phases in the past
relied on spending containment implemented by
targeting in priority large spending items. In this
context, the Scandinavian Member States have
been able to adjust their expenditure ratios more
with ratios declining from 61 % of GDP on
average in 1995 to 49 % in 2007. This led to a
major turnaround in their budgetary situation with
a deficit of 5.5 % in 1995 being converted into a
(44) As we are looking at ratios to GDP, a slower growth of
nominal GDP in France could be an explanatory factor for the divergence in the ratio. This is not the case however.
Over the period 1995-2000, the average nominal growth in
France was 3.9 % versus 4.1 % in the rest of the euro area. Also over the recent period (2010-2015), French growth is
similar to that of the euro area (1.7 % in both).
surplus of 4.5 % in 2007. Over the same period the
French deficit was only reduced by 2.6 pps. The
prudent Scandinavian policy approach allowed
these member states to avoid excessive deficit in
the aftermath of the 2008 crisis. France and the
Scandinavian Member States had similar debt
levels in the mid-90s but debt ratios diverged
afterwards. The French debt ratio has been on an
upward trend, which accelerated in 2008, whereas
the Scandinavian Member States saw their debt
ratios decline until 2008 and observed only a
moderate increase since. As a result, the French
debt is projected to reach 97.1 % of GDP in 2017
whereas the debt ratios of the Denmark, Sweden
and Finland would be respectively 38.8 %, 42.3 %
and 66.2 %.
Graph 2.6.1: Evolution of government expenditure to GDP
Source: European Commission
France relied on-across-the-board spending
containment measures, which appear
insufficient to bring down the ratio of public
expenditure to GDP. France has had the least
selective spending containment strategy of all EU
countries since 2010, with the expenditure side
consolidation being driven by across-the-board
spending containment measures such fiscal rules or
norms or the zero growth norm for the state
level (45
). Recently, these spending containment
measures have been well respected, yet from a
(45) Hallaert, J and Queyranne M. (2016) From Containment to
Rationalization: Increasing Public Expenditure Efficiency
in France, IMF Working Paper No. 16/7 2016.
45
47
49
51
53
55
57
59
95 97 99 01 03 05 07 09 11 13 15 17
% o
f G
DP
France Euro area
2.6. EVOLUTION OF PUBLIC EXPENDITURE
2.6. Evolution of public expenditure
42
fiscal governance perspective the level of strictness
in terms of respecting the plans set out in the
medium-term planning documents is relatively
weak as ceilings and targets can be changed at the
discretion of the government (although it needs to
explain the changes). The across-the-board
spending cuts employed by the French authorities
seem insufficient to achieve a significant reduction
in public expenditure. The multi-annual plan aims
to reduce public spending compared to the trend
growth of expenditure by EUR 50 bn (2.2 % of
GDP) between 2015 and 2017 on all levels of the
French administration. However, since the
reduction in public spending is computed against a
conventional trend, the ratio of public expenditure
to GDP would still remain high compared to other
EU countries.
The process of identifying specific expenditure
cuts has not been effective until now. The
government launched its general review of public
expenditure in 2007. This approach was followed
in 2012 by the Modernisation de l’Action Publique
(MAP) which sought to increase efficiency in all
subsectors of public administration. The MAP was
strengthened at the end of 2013 and saving targets
were set. However, the MAP process does not
deliver clear, operational recommendations and
has not generated much savings. Equally, the
existing committees and councils do not
sufficiently support a more systematic approach to
spending containment (46
). In addition to the MAP,
the programming law for public finances of 2015
introduced spending reviews as part of the
budgetary cycle.
The spending reviews have a number of positive
features compared to previous processes but
start with low budgetary yields. The first round
of spending reviews conducted in 2015 with a
view to underpinning the spending targets of the
budget for 2016 eventually resulted in the
identification of about EUR 500 million savings.
This amount is small compared to the overall
expenditure savings target of EUR 16 bn for 2016
as part of the multi-annual plan to reduce public
(46) Comité de Suivi des Retraites and Conseil d’Orientation
des Retraites for pensions, Haut Conseil pour l’Avenir de l’Assurance Maladie for health, Haut Conseil de la Famille
for family, Haut Conseil du Financement de la Protection
Sociale for social protection, Conseil des Finances Locales for local governments
spending, but also in light of the savings potential
in the domains that were analysed. The spending
reviews have a number of positive features
compared to the previous processes. They are fully
embedded in the budgetary cycle, concern all the
sub-sectors of the general government and have a
stronger focus on generating savings but remain
relatively non-transparent making their assessment
difficult.
The transparency of fiscal policy is hampered
by revisions in potential growth estimates and
the non-availability of timely in-year budgetary
execution data for some government sectors.
The creation of the High Council for Public
Finances (HCPF) has increased the credibility of
the fiscal framework. The task of this Council is to
assess the plausibility of the macroeconomic
scenario underlying the various budgetary plans
and check that draft budgets are consistent with the
structural deficit reduction path set in the current
multiannual programming law for public finances.
Nonetheless, the government has revised its
potential growth estimate in April 2015, which
makes it harder for the Council to analyse the
evolution of the structural component of the
general government balance and hampers the
transparency of the fiscal policy. Fiscal policy is
also harder to monitor as timely in-year budgetary
execution data for the social security sub-sector
and the local government sector is not publicly
available.
Social protection and healthcare expenditure
are the most important spending items in
France. Social protection expenditure amounts to
24.5 % of GDP (Graph 2.6.2) and accounts for
more than 40 % of total government spending,
while health expenditure at 8.1 % of GDP is the
second biggest expenditure item. Other important
expenditure items are general public services,
education and economic affairs. In 2013, the latest
year of available data, French government
expenditure was about 8 pps. of GDP higher than
the euro area (Graph 2.6.3). Expenditure on social
protection and healthcare accounted for two thirds
of this difference (Graph 2.6.4) and ‘other’
expenditure – which includes expenditure on
housing and community amenities, environment
and culture – is also 1.3 pp. of GDP higher in
France than in the euro area. Over the last 10
years, the dynamics of the government expenditure
ratio has been mainly driven by social protection

2.6. Evolution of public expenditure
43
and healthcare expenditure and to a lesser extent
by ‘other’ expenditure, mainly due to housing,
whereas expenditure on general public services
and education has decreased in percent of
GDP (47
).
Graph 2.6.2: Composition of government expenditure in
France
Source: European Commission
Local authorities play a relatively important
role in expenditure on economic affairs, housing
and recreation & culture expenditure. Local
authorities’ expenditure amounts to 11.9 % of
GDP in France in 2013. Over the period 2003-
2013, expenditure at local level increased by
1.8 pp. of GDP, of which half was due to an
increase in social protection spending. Compared
to the euro area, local government expenditure in
France is about 1.5 pp. of GDP higher, but is
comparable with the average share of total public
spending in the euro area (20 %). Nevertheless, the
responsibilities of local authorities can differ
widely from country to country. In France, the
main expenditure functions are economic affairs,
social protection and general public services
(Graph 2.6.4). French local authorities spend more
than the euro area on economic affairs, on housing
and community amenities and on recreation and
culture but considerably less on health.
(47) 2006 is the earliest year for which the disaggregate
statistics on expenditure by function for the euro area are
available.
Graph 2.6.3: Comparison of government expenditure with
the euro area and Scandinavian Member
States and over time
Source: European Commission
The increase in local government spending is
partly explained by the 1980 decentralisation
and partly by the structure of the French local
administration. The increase by 3.3 pps. of GDP
in local government spending between 1983 and
2013 can be explained (48
) up to 60 % by the
transfer of responsibilities from the State to the
local level such as social protection. The remaining
40 % are due to the local governments, as the
number of civil servants increased, unrelated to
transfers of responsibility. The number and variety
of layers of sub-national governments (State, 22
regions until 2015, 101 departments, more than
36 000 municipalities) is however higher than in
other EU countries and creates the risk of building
inefficiencies by duplicating functions.
(48) OECD (2012) Public Governance Reviews: France: An
international perspective on the General Review of Public Policies, OECD Publishing 2012.
social protection;
24.5
Health; 8.1
General public
services; 6.8
Education; 5.5
Economic affairs ; 4.9
Other; 3.9
Defence, public order and safety;
3.4
% of GDP; total 57.1%
-2
0
2
4
6
8
10Defence, public orderand safety
Other
Economic affairs
Education
General publicservices
Health
Social protection
Total
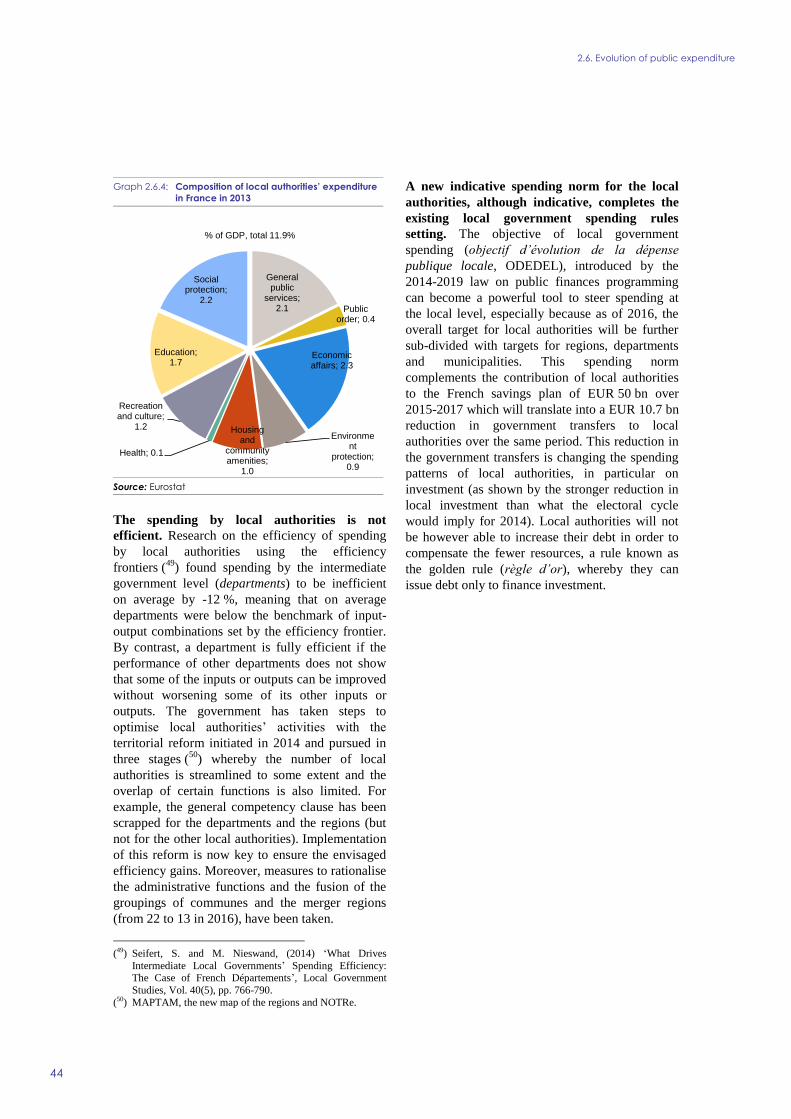
2.6. Evolution of public expenditure
44
Graph 2.6.4: Composition of local authorities’ expenditure
in France in 2013
Source: Eurostat
The spending by local authorities is not
efficient. Research on the efficiency of spending
by local authorities using the efficiency
frontiers (49
) found spending by the intermediate
government level (departments) to be inefficient
on average by -12 %, meaning that on average
departments were below the benchmark of input-
output combinations set by the efficiency frontier.
By contrast, a department is fully efficient if the
performance of other departments does not show
that some of the inputs or outputs can be improved
without worsening some of its other inputs or
outputs. The government has taken steps to
optimise local authorities’ activities with the
territorial reform initiated in 2014 and pursued in
three stages (50
) whereby the number of local
authorities is streamlined to some extent and the
overlap of certain functions is also limited. For
example, the general competency clause has been
scrapped for the departments and the regions (but
not for the other local authorities). Implementation
of this reform is now key to ensure the envisaged
efficiency gains. Moreover, measures to rationalise
the administrative functions and the fusion of the
groupings of communes and the merger regions
(from 22 to 13 in 2016), have been taken.
(49) Seifert, S. and M. Nieswand, (2014) ‘What Drives
Intermediate Local Governments’ Spending Efficiency: The Case of French Départements’, Local Government
Studies, Vol. 40(5), pp. 766-790.
(50) MAPTAM, the new map of the regions and NOTRe.
A new indicative spending norm for the local
authorities, although indicative, completes the
existing local government spending rules
setting. The objective of local government
spending (objectif d’évolution de la dépense
publique locale, ODEDEL), introduced by the
2014-2019 law on public finances programming
can become a powerful tool to steer spending at
the local level, especially because as of 2016, the
overall target for local authorities will be further
sub-divided with targets for regions, departments
and municipalities. This spending norm
complements the contribution of local authorities
to the French savings plan of EUR 50 bn over
2015-2017 which will translate into a EUR 10.7 bn
reduction in government transfers to local
authorities over the same period. This reduction in
the government transfers is changing the spending
patterns of local authorities, in particular on
investment (as shown by the stronger reduction in
local investment than what the electoral cycle
would imply for 2014). Local authorities will not
be however able to increase their debt in order to
compensate the fewer resources, a rule known as
the golden rule (règle d’or), whereby they can
issue debt only to finance investment.
General public
services; 2.1 Public
order; 0.4
Economic affairs; 2.3
Environment
protection; 0.9
Housing and
community amenities;
1.0
Health; 0.1
Recreation and culture;
1.2
Education; 1.7
Social protection;
2.2
% of GDP, total 11.9%

2.6. Evolution of public expenditure
45
Box 2.6.1: Completing the picture: Tax expenditure
Like other EU Member States, France also resorts to tax expenditure to complete its already high
direct spending to achieve certain public policy objectives. Reported tax and social expenditures
(including tax exemptions, tax deductions, tax credits and preferential tax rates) in France added up to a
share of 8 % of public expenditure in 2013 (RESF 2016). This share is higher in some areas of public policy,
like those related to family (9 %), the cultural sector (10 %) and the housing sector (83 %). For public
spending related to economic affairs, the amount of tax expenditure exceeded the amount of direct
expenditure in 2013 (118 %).
Although some tax expenditures may follow a useful goal, they are often budgetary costly and
inefficient. Tax expenditures may be justified by market failures, for example R&D related tax expenditure
generates knowledge spillovers. However, tax and social expenditure are often insufficiently targeted and
they may therefore turn out to be inefficient and budgetary costly. Moreover, they can give rise to rent
seeking behaviour, which distorts investment and consumption choices and can lead to tax avoidance and
evasion. Finally, tax expenditures weigh on the complexity of the tax system, increasing taxpayers’
compliance costs and collection costs for public administration. The 2014-2019 public finance programming
bill highlighted the need for a regular assessment and monitoring of tax expenditures and a comparison of
their efficiency with other public support measures.
Graph 1: Trend of tax expenditures, 2009-16
Source: For France, Projet de loi des Finances; for Germany, Subventionsbericht; for Spain, Memoria de Beneficios
fiscales; for Italy, Allegato technico.
As compared to its large neighbouring countries, the trend of using tax expenditure in France is overall
on the rise (1). Taking 2009 as index year, a tax expenditure trend is computed for France, Germany, Spain
and Italy, based on national tax expenditure data (in % of GDP). While Graph 1 shows a slightly decreasing
level of tax expenditure for France from 2009 to 2013, the level increases in 2014 to decrease again as of
2016. This temporary trend to a wider application of tax expenditures is explained by the aim of the French
Government to encourage investment, employment and growth in a period of economic downturn, although
further constraining public finances. A similar trend is seen for Italy over the period 2009-16. Constrained
public finances in Spain, however, pushed the country to lower its level of tax expenditure over this period.
Germany follows a similar decreasing trend.
(1) A caveat of cross-country analysis of tax expenditures is the lack of a commonly defined benchmark tax system
which substantially affects the tax expenditure reporting.
0
20
40
60
80
100
120
140
2009 2010 2011 2012 2013 2014 (2015) (2016)
Index
FR DE ES IT

46
Pensions
Pension spending in France is among the
highest in the world. Based on Eurostat COFOG
data, public pension expenditure in France appears
high both as a share of GDP (14.7 % over the
period 2009-2013 compared to the euro-area
average of 12.4 % of GDP, Table 2.7.1), and as a
share of total public expenditure (close to 26 %
over the period 2009-2013 compared to the euro-
area average of 24.8 %, Table 2.7.2). Its weight
has increased more rapidly than in the euro area
since the 2009 financial crisis and this
development can be related to the relatively high
sensitivity of French public pension expenditure to
macroeconomic conditions. Indeed, the price-
indexation of pensions implies that the dynamic of
pension expenditure to GDP ratio depends strongly
on the prevailing macroeconomic conditions (51
).
Table 2.7.1: Public expenditure (as % of GDP)
Source: European Commission
Table 2.7.2: Pensions expenditure (as % of total public
expenditure)
Source: European Commission
The low effective legal retirement age and
structural factors, such as the length of the life
expectancy, explain part of the differences with
other European countries. The share of the
population aged 65 or above in France is relatively
low by European standards and lower than in
Germany, but the public pension spending in
France (14.7 % of GDP) is higher than in Germany
(11.3 % of GDP). For generations born after 1955,
the legal retirement age in France is 62, among the
lowest in OECD countries, but the automatic full
(51) Conseil d’Orientation des Retraites Document No4,
December 2014.
State pension rights (base and complementary) are
achieved only at 67 years. The average effective
exit age from the labour market of 61 in France in
2014 is still among the lowest of the European
countries (euro-area average of 63) (52
) but the
successive reforms and the recent bonus-malus
scheme introduced by the October 2015 Agirc-
Arrco agreement on complementary pensions seek
to increase it progressively to 63 in 2060 (against
an euro-area average of 65). This latter measure
implies that from 2019 onwards and in the general
case, a full complementary pension could only be
taken at the age of 63 instead of 62, an earlier
retirement meaning a penalty of up to 10 % for 3
years and a delayed retirement leading to a bonus
of 10 % to 30 % during one year. Moreover, life
expectancy after retirement (22.1 years for men
and 26.5 years for women) is higher than the
OECD average.
The French pension system is relatively
generous. The benefit ratio, which is defined as
the average pension benefits as a share of the
economy-wide average wage, and the at-risk-of
poverty or social exclusion rate for people aged 65
and above are both favourable in France. The
benefit ratio is at 51 % in 2013 against an EU
average of less than 44 % and the at-risk-of-
poverty or social exclusion rate is at 10.1 %
against the EU average of more than 17.8 % in
2014. However, France performs less well in terms
of income distribution for the elderly based on the
ratio of total income received by the 20 % of the
population aged 65 and above with the highest
income to that received by the 20 % of the
population aged 65 and above who have the lowest
income. Moreover, the gender gap in pensions
reached 38 %, with only limited prospects for
improvements (53
). According to the adequacy
ratio which is a composite indicator taking into
account the benefit ratio, the at-risk-of-poverty rate
and the income distribution discussed above,
France is relatively well positioned. However, the
comparison with other European countries and
when taking into account the level of pension
expenditure in 2013 suggests France has a relative
(52) European Commission, 2015, Ageing Report 2015.
(53) European Commission and Social Protection Committee, (2015), Pension Adequacy Report
http://www.gouvernement.fr/sites/default/files/document/d
ocument/2015/07/2e_avis_du_comite_de_suivi_des_retraites_v14_vdef.pdf.
Pensions (old-age and survivors) 2004-2008 2009-2013 Change
FR 12.9 14.7 1.8
EA 11.2 12.4 1.2
DE 11.5 11.3 -0.2
ES 7.9 10 2.1
IT 14.3 16.1 1.8
SE 10.8 11.3 0.5
Pensions (old-age and survivors) 2004-2008 2009-2013 Change
FR 24.5 25.9 1.4
EA 24.3 24.8 0.5
DE 25.8 24.8 -1
ES 20.3 22 1.7
IT 30.3 32.1 1.8
SE 21 21.8 0.8
2.7. QUALITY OF PUBLIC EXPENDITURE
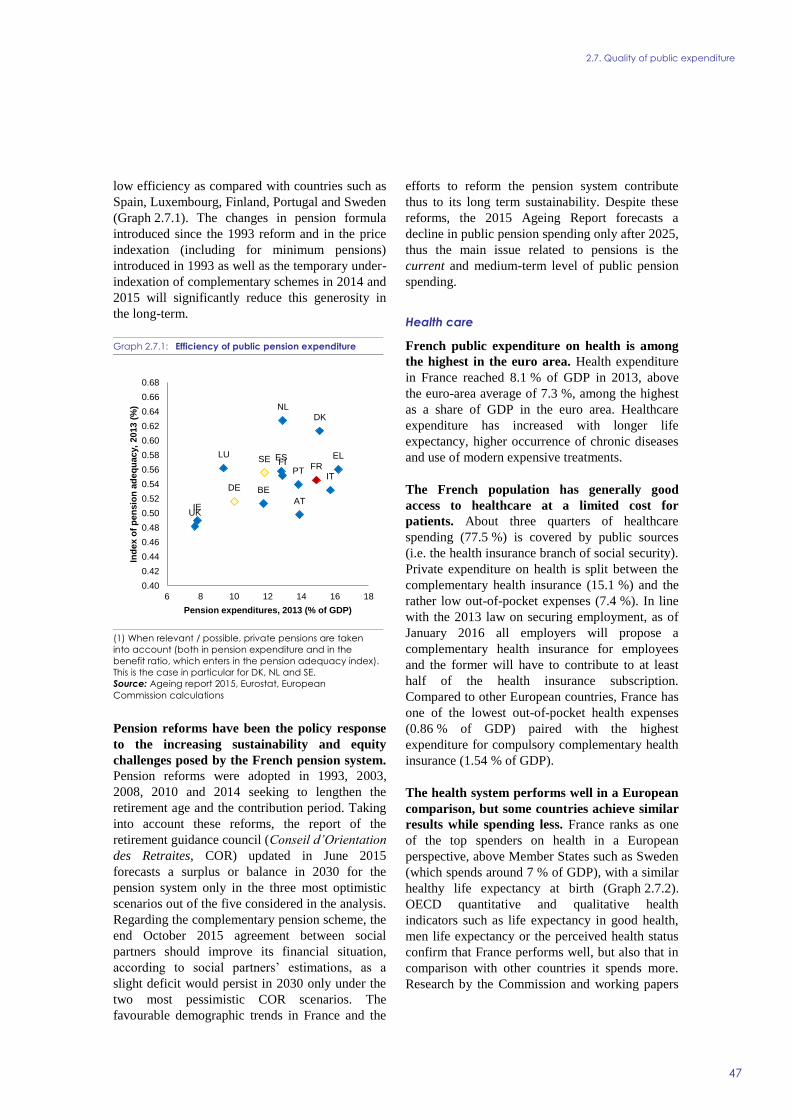
2.7. Quality of public expenditure
47
low efficiency as compared with countries such as
Spain, Luxembourg, Finland, Portugal and Sweden
(Graph 2.7.1). The changes in pension formula
introduced since the 1993 reform and in the price
indexation (including for minimum pensions)
introduced in 1993 as well as the temporary under-
indexation of complementary schemes in 2014 and
2015 will significantly reduce this generosity in
the long-term.
Graph 2.7.1: Efficiency of public pension expenditure
(1) When relevant / possible, private pensions are taken
into account (both in pension expenditure and in the
benefit ratio, which enters in the pension adequacy index).
This is the case in particular for DK, NL and SE.
Source: Ageing report 2015, Eurostat, European
Commission calculations
Pension reforms have been the policy response
to the increasing sustainability and equity
challenges posed by the French pension system.
Pension reforms were adopted in 1993, 2003,
2008, 2010 and 2014 seeking to lengthen the
retirement age and the contribution period. Taking
into account these reforms, the report of the
retirement guidance council (Conseil d’Orientation
des Retraites, COR) updated in June 2015
forecasts a surplus or balance in 2030 for the
pension system only in the three most optimistic
scenarios out of the five considered in the analysis.
Regarding the complementary pension scheme, the
end October 2015 agreement between social
partners should improve its financial situation,
according to social partners’ estimations, as a
slight deficit would persist in 2030 only under the
two most pessimistic COR scenarios. The
favourable demographic trends in France and the
efforts to reform the pension system contribute
thus to its long term sustainability. Despite these
reforms, the 2015 Ageing Report forecasts a
decline in public pension spending only after 2025,
thus the main issue related to pensions is the
current and medium-term level of public pension
spending.
Health care
French public expenditure on health is among
the highest in the euro area. Health expenditure
in France reached 8.1 % of GDP in 2013, above
the euro-area average of 7.3 %, among the highest
as a share of GDP in the euro area. Healthcare
expenditure has increased with longer life
expectancy, higher occurrence of chronic diseases
and use of modern expensive treatments.
The French population has generally good
access to healthcare at a limited cost for
patients. About three quarters of healthcare
spending (77.5 %) is covered by public sources
(i.e. the health insurance branch of social security).
Private expenditure on health is split between the
complementary health insurance (15.1 %) and the
rather low out-of-pocket expenses (7.4 %). In line
with the 2013 law on securing employment, as of
January 2016 all employers will propose a
complementary health insurance for employees
and the former will have to contribute to at least
half of the health insurance subscription.
Compared to other European countries, France has
one of the lowest out-of-pocket health expenses
(0.86 % of GDP) paired with the highest
expenditure for compulsory complementary health
insurance (1.54 % of GDP).
The health system performs well in a European
comparison, but some countries achieve similar
results while spending less. France ranks as one
of the top spenders on health in a European
perspective, above Member States such as Sweden
(which spends around 7 % of GDP), with a similar
healthy life expectancy at birth (Graph 2.7.2).
OECD quantitative and qualitative health
indicators such as life expectancy in good health,
men life expectancy or the perceived health status
confirm that France performs well, but also that in
comparison with other countries it spends more.
Research by the Commission and working papers
BE
DK
DE
IE
ELESFR
IT
LU
NL
AT
PTFISE
UK
0.40
0.42
0.44
0.46
0.48
0.50
0.52
0.54
0.56
0.58
0.60
0.62
0.64
0.66
0.68
6 8 10 12 14 16 18
Ind
ex o
f p
en
sio
n a
deq
uacy,
2013 (
%)
Pension expenditures, 2013 (% of GDP)
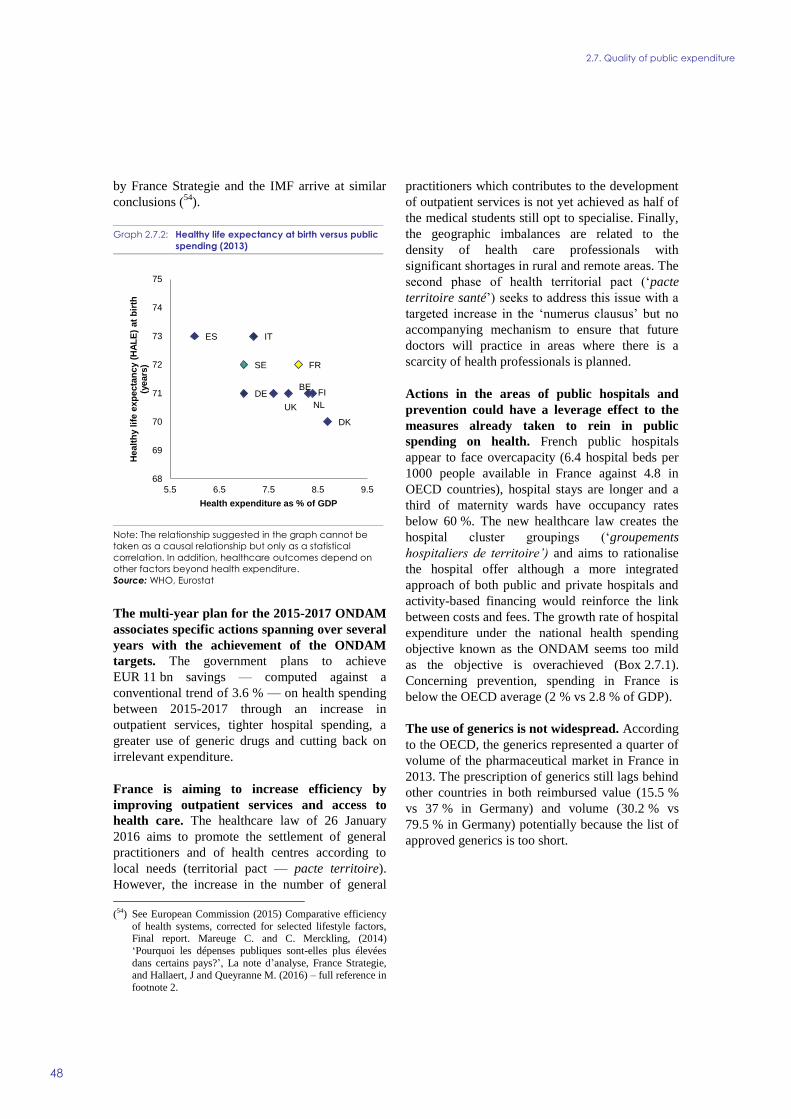
2.7. Quality of public expenditure
48
by France Strategie and the IMF arrive at similar
conclusions (54
).
Graph 2.7.2: Healthy life expectancy at birth versus public
spending (2013)
Note: The relationship suggested in the graph cannot be
taken as a causal relationship but only as a statistical
correlation. In addition, healthcare outcomes depend on
other factors beyond health expenditure.
Source: WHO, Eurostat
The multi-year plan for the 2015-2017 ONDAM
associates specific actions spanning over several
years with the achievement of the ONDAM
targets. The government plans to achieve
EUR 11 bn savings — computed against a
conventional trend of 3.6 % — on health spending
between 2015-2017 through an increase in
outpatient services, tighter hospital spending, a
greater use of generic drugs and cutting back on
irrelevant expenditure.
France is aiming to increase efficiency by
improving outpatient services and access to
health care. The healthcare law of 26 January
2016 aims to promote the settlement of general
practitioners and of health centres according to
local needs (territorial pact — pacte territoire).
However, the increase in the number of general
(54) See European Commission (2015) Comparative efficiency
of health systems, corrected for selected lifestyle factors, Final report. Mareuge C. and C. Merckling, (2014)
‘Pourquoi les dépenses publiques sont-elles plus élevées
dans certains pays?’, La note d’analyse, France Strategie, and Hallaert, J and Queyranne M. (2016) – full reference in
footnote 2.
practitioners which contributes to the development
of outpatient services is not yet achieved as half of
the medical students still opt to specialise. Finally,
the geographic imbalances are related to the
density of health care professionals with
significant shortages in rural and remote areas. The
second phase of health territorial pact (‘pacte
territoire santé’) seeks to address this issue with a
targeted increase in the ‘numerus clausus’ but no
accompanying mechanism to ensure that future
doctors will practice in areas where there is a
scarcity of health professionals is planned.
Actions in the areas of public hospitals and
prevention could have a leverage effect to the
measures already taken to rein in public
spending on health. French public hospitals
appear to face overcapacity (6.4 hospital beds per
1000 people available in France against 4.8 in
OECD countries), hospital stays are longer and a
third of maternity wards have occupancy rates
below 60 %. The new healthcare law creates the
hospital cluster groupings (‘groupements
hospitaliers de territoire’) and aims to rationalise
the hospital offer although a more integrated
approach of both public and private hospitals and
activity-based financing would reinforce the link
between costs and fees. The growth rate of hospital
expenditure under the national health spending
objective known as the ONDAM seems too mild
as the objective is overachieved (Box 2.7.1).
Concerning prevention, spending in France is
below the OECD average (2 % vs 2.8 % of GDP).
The use of generics is not widespread. According
to the OECD, the generics represented a quarter of
volume of the pharmaceutical market in France in
2013. The prescription of generics still lags behind
other countries in both reimbursed value (15.5 %
vs 37 % in Germany) and volume (30.2 % vs
79.5 % in Germany) potentially because the list of
approved generics is too short.
BE
DK
FI
FR
DE
IT
NL
ES
SE
UK
68
69
70
71
72
73
74
75
5.5 6.5 7.5 8.5 9.5
Healt
hy l
ife e
xp
ecta
nc
y (
HA
LE
) at
bir
th
(years
)
Health expenditure as % of GDP
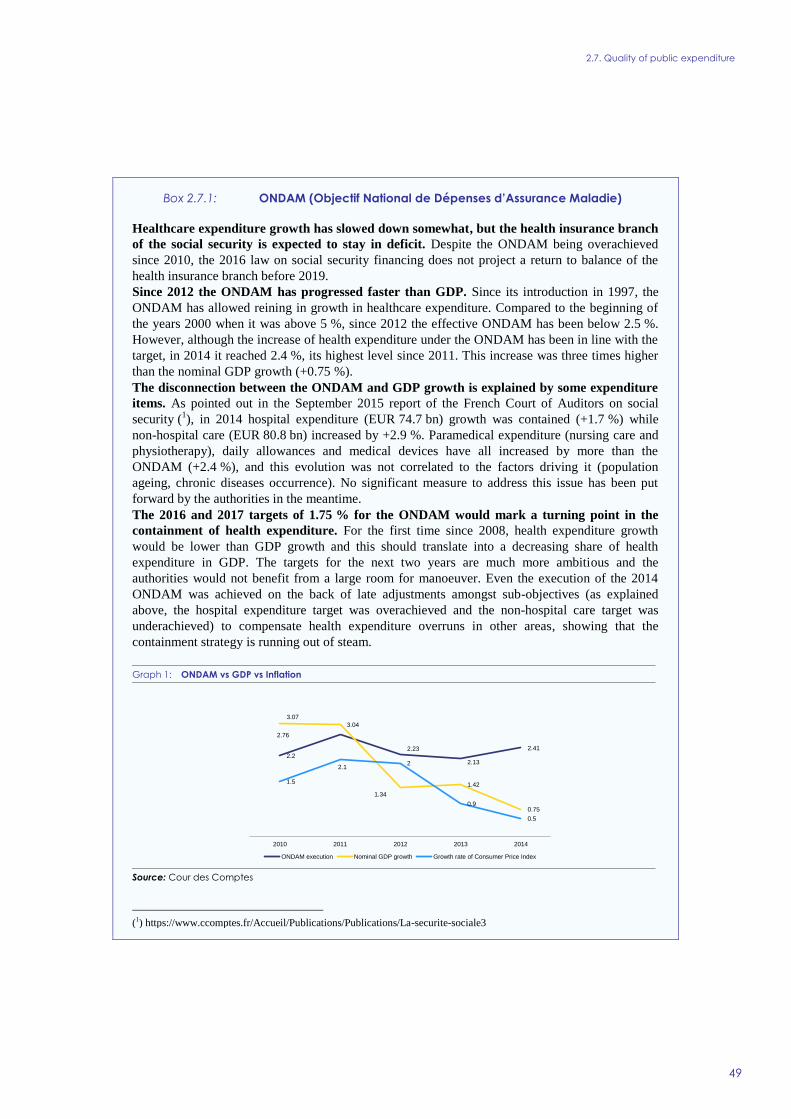
2.7. Quality of public expenditure
49
Box 2.7.1: ONDAM (Objectif National de Dépenses d’Assurance Maladie)
Healthcare expenditure growth has slowed down somewhat, but the health insurance branch
of the social security is expected to stay in deficit. Despite the ONDAM being overachieved
since 2010, the 2016 law on social security financing does not project a return to balance of the
health insurance branch before 2019.
Since 2012 the ONDAM has progressed faster than GDP. Since its introduction in 1997, the
ONDAM has allowed reining in growth in healthcare expenditure. Compared to the beginning of
the years 2000 when it was above 5 %, since 2012 the effective ONDAM has been below 2.5 %.
However, although the increase of health expenditure under the ONDAM has been in line with the
target, in 2014 it reached 2.4 %, its highest level since 2011. This increase was three times higher
than the nominal GDP growth (+0.75 %).
The disconnection between the ONDAM and GDP growth is explained by some expenditure
items. As pointed out in the September 2015 report of the French Court of Auditors on social
security (1), in 2014 hospital expenditure (EUR 74.7 bn) growth was contained (+1.7 %) while
non-hospital care (EUR 80.8 bn) increased by +2.9 %. Paramedical expenditure (nursing care and
physiotherapy), daily allowances and medical devices have all increased by more than the
ONDAM (+2.4 %), and this evolution was not correlated to the factors driving it (population
ageing, chronic diseases occurrence). No significant measure to address this issue has been put
forward by the authorities in the meantime.
The 2016 and 2017 targets of 1.75 % for the ONDAM would mark a turning point in the
containment of health expenditure. For the first time since 2008, health expenditure growth
would be lower than GDP growth and this should translate into a decreasing share of health
expenditure in GDP. The targets for the next two years are much more ambitious and the
authorities would not benefit from a large room for manoeuver. Even the execution of the 2014
ONDAM was achieved on the back of late adjustments amongst sub-objectives (as explained
above, the hospital expenditure target was overachieved and the non-hospital care target was
underachieved) to compensate health expenditure overruns in other areas, showing that the
containment strategy is running out of steam.
Graph 1: ONDAM vs GDP vs Inflation
Source: Cour des Comptes
(1) https://www.ccomptes.fr/Accueil/Publications/Publications/La-securite-sociale3
2.2
2.76
2.23
2.13
2.41
3.07
3.04
1.34
1.42
0.75
1.5
2.12
0.9
0.5
2010 2011 2012 2013 2014
ONDAM execution Nominal GDP growth Growth rate of Consumer Price Index
2.7. Quality of public expenditure
50
Education
Spending in education is uneven between the
different education stages. Expenditure on
education as a proportion of GDP is above the
euro-area average (5.5 % in 2013 compared to
4.8 %). In comparison to the OECD average,
spending per student in France is slightly higher
(2 % above the OECD average) suggesting that
most of the extra expenditure in percentage of
GDP compared to the euro area is due to the
number of students. However, there are important
differences in spending per student across the
different stages of education compared to the
OECD average. Spending per student is low in
early childhood education, primary education
(15 % below), average for higher education (2 %
above) and significantly higher for upper
secondary education (35 % above).
France scores average on the PISA scores but
inequalities linked to socio-economic
background have risen. In the 2012 OECD
Programme for International Student Assessment
(PISA), French students had a score in line with
the OECD average. In some fields, such as
mathematics, this is a deterioration compared to a
decade ago. At the same time, educational
inequalities linked to socioeconomic background
have been widening for more than a decade, results
of low achievers worsened and their proportion is
somewhat higher than the EU average. In addition,
national and other analysis suggest that
competences differentials are also highly
pronounced, depending on the diploma obtained
during one’s schooling. Finally, Mareuge and
Merckling (2014) demonstrate that the higher
spending on upper secondary education is not due
to a higher number of students in France and
conclude based on a composed quality indicator
for secondary education - based on the share of
early school leavers, the share of students with a
secondary education degree and the PISA scores -
that other Member States spend less on secondary
education while achieving a better quality. Against
this background, the September 2015 report of the
Court of Auditors on the cost of secondary schools
(‘lycées’) recommends to lower expenditure on
upper secondary education expenditure and
improve its governance.
The ongoing reform of compulsory education
aims to invest more and better at an early stage
starting with preschool education. Many surveys
highlight that prevention contributes to more
efficient spending. According to PISA, France is
one of the four OECD countries where
participation in early childhood education benefits
the most to pupils with a migrant background. The
objectives to fight educational inequalities and to
reduce the number of young people leaving
education without qualification is supported on one
hand by the provision of additional means and on
the other hand by a comprehensive reform ranging
from early childhood education to lower secondary
education (college). In addition, great attention is
paid to specific measures to address inequalities
with a new ‘Priority Education’ policy and the
action plan against early school leavers. The latter
is in line with the evaluation results of past
measures which called for improving efficiency
through a stronger focus on prevention and greater
coordination between actors.
According to the first November 2015
report (55
) of the follow-up committee of the
reform, whilst most of the decrees have been
issued, a key challenge is to ensure an effective
and coherent implementation. Past experiences
have shown that systematic follow-up is important
for the success of the reform and the set-up of a
committee tasked with the overall follow-up of this
education reform is a positive step. The report calls
for a strong appropriation of the reform by the
teachers and for national authorities to continue to
support the teachers. According to the report,
implementation in three key areas analysed —
(pre)primary education, initial teacher training, the
involvement of the parents — is far from being
achieved on the ground.
The reform is expected to improve the
efficiency of public spending in the medium
term but this might be more challenging than
expected. Despite a strong priority given to the
creation of 54 000 teaching posts between 2013-
2017, the increase in resources per student may
also be lower than anticipated due to higher than
expected growth of the school population and to
unfilled posts. Moreover, the priority given by the
(55) Comité de suivi (2015) de la Loi de refondation de l’école,
Rapport annuel au parlement, 13 novembre 2015.

2.7. Quality of public expenditure
51
reform to primary education is currently not
reflected in the effective increase in posts (56
).
Housing
France spends significantly more on housing
than its European peers. After two decades of
sustained growth (4.6 % on year average), total
public spending for housing in France reached
2.3 % of GDP in 2013, significantly above the
euro-area average of 1.1 % and only comparable to
the United Kingdom (2.1 % of GDP)
(Graph 2.7.3). More specifically, the 2.3 % of
GDP expenditure on housing are split between
housing benefits seeking to improve access to
housing rental or ownership and targeting housing
demand and representing 40 % of public spending
for housing (0.9 % of GDP) and subsidies to
housing supply and renovation as well as to the
social rental sector (1.4 %). In comparison with
other European countries, France allocates
significantly more resources to community
development (0.5 % of GDP more) reflecting the
importance of social housing in France (17 % of
total rental market), twice the European average
(8.6 %) and only slightly less than the United
Kingdom (18 %).
Graph 2.7.3: Housing expenditure in 2013 (% of GDP)
Source: European Commission
(56) Comité de suivi (2015) de la Loi de refondation de l’école,
Rapport annuel au parlement, 13 novembre 2015.
Graph 2.7.4: Number of dwellings authorized and started
Source: Insee
Despite higher spending than other European
countries the housing market situation in
France has not improved significantly since the
years 2000. New housing projects have hit a new
low in 2014 (Graph 2.7.4) and the housing offer
has not improved (530 dwellings per 1000
inhabitants in 2014 against 501 in 2004).
Moreover, the housing supply is not adapted to the
geography of demand as 2.6 million dwellings
were empty all over France in 2014 (+37 % in a
decade based on 2005 statistics). Institutional and
regulatory rigidities hamper housing investment
and the spin-off benefits of tax incentives for
housing investment are high (85 % of beneficiaries
would have made the same decision in the absence
of such incentives). The average individual
housing benefit amount has increased from the
equivalent of EUR 110 in the 1980s to EUR 212 in
2012 according to the latest data available, but it
has been more than compensated by the increase in
rents and house prices. Indeed, existing
research (57
) on housing benefits concludes they
have an inflationary effect on rents. Overall, the
households’ net average effort rate, expressed as
housing expenditure net of housing allowances
divided by net household income, has increased for
the low income households from 12.9 % in 1988 to
(57) Laferrère and le Blanc (2012), G. Fack (2005), Grislain-
Letrémy and Trévien (2014).
0
0.5
1
1.5
2
2.5 % of GDP
Housing expenditure Community development
50
60
70
80
90
100
110
120
07Q
1
07Q
3
08Q
1
08Q
3
09Q
1
09Q
3
10Q
1
10Q
3
11Q
1
11Q
3
12Q
1
12Q
3
13Q
1
13Q
3
14Q
1
14Q
3
15Q
1
15Q
3
Index, 07Q1=100
Dwellings started Dwellings authorized
2.7. Quality of public expenditure
52
16.1 % in 2002 (58
) and even more for tenants in
the private sector (from 19 % to 25.7 %).
The objective of the housing policy in France to
ensure decent housing to all according to their
means is only partially achieved. The French
housing policy is not progressive as well-off
families can benefit both from social transfers for
working-age dependent children (students) and tax
deductions. Not all the housing benefits are means-
tested and this creates a bias in the redistribution
role of the housing policy in France. Moreover, the
housing supply issue remains unsolved and is
aggravated by the definition of the housing policy
objectives at the national level, while their
implementation is delegated to the lowest
administrative level (commune), which grants
building permits and takes the decisions to build.
Recently, the decision to build has been moved to
the higher level of administration (inter-
municipality) which has a better overview on the
ongoing projects and future local needs for
housing. It is difficult at this stage to assess
whether this initiative contributes to alleviating
housing tensions though.
Family and childcare
Spending on family and childcare accounted for
4.4 % of total expenditure in 2013. At 2.5 % of
GDP, spending was 0.9 pp. higher than in the euro
area. Even controlling for the number of children
(2 children in France vs 1.55 in the EU),
expenditure is higher than in the euro area. France
performs well in a number of important
dimensions of work-life balance (OECD,
2011) (59
): the employment rate of women aged 25
to 54 is above the OECD average and despite a
recent slight increase, the at-risk-of-poverty rate of
17.7 % for children aged 0 to 17 is well below the
euro-area average (20.3 %). These positive
outcomes go hand-in-hand with high investment in
family policies across the different stages of
childhood.
(58) Rapport 2003-2004 de l’Observatoire national de la
pauvreté et de l’exclusion sociale, à partir des enquêtes Logement de l’Insee.
(59) OECD (2011), Doing Better for Families; OECD (2012),
Closing the gender gap: act now, European Commission (2015), Report on equality between women and men in
2014.
Like most Member States, France provides tax
allowances and reductions for family and
childcare via the personal income tax system.
This support may take the form of a tax credit (e.g.
in Germany), a tax reduction (e.g. in Spain) or a
special tax feature, like the quotient familial in
France. Moreover, France provides a tax
exemption for services related to family and
childcare, which is ranked among the most costly
tax expenditures, amounting to EUR 2.2 billion in
2014 (2016 budget). In addition, the French
personal income tax system provides a tax credit
for low-age childcare (EUR 1.1 billion). In total,
tax breaks for families account for 0.7 % of GDP
which is the second highest in the OECD, after
Germany (OECD, 2011).
The ongoing reforms of the family policy seek to
improve the efficiency of family and childcare
benefits. The French family policy has partly
succeeded in meeting its objectives – to reduce
poverty, to compensate for family charges and to
improve work-life balance for French families.
Investment in childcare facilities has contributed to
ease the work-life balance and to improve
women’s position in the economy although the
employment rate of women is still well below
men’s and 29.2 % of women aged 25-54 years old
work part-time (compared to 5.6 % for men).
Motherhood still has an impact on lifelong
earnings, and the gender pay gap stands at 15.3 %.
The government has taken measures to improve
the cost efficiency of the family policy with the
introduction of means testing for family benefits, a
modulation which will produce EUR 800 million
savings each year. The outcome of the family
benefits modulation will be however compensated
by the increase of other means tested allowances.
The reform of the revaluation of family benefits
has been introduced in the 2016 social security
financing law and aligns the indexation date for all
benefits except for pensions to April 1st while
changing the reference index from expected
inflation to actual inflation.

53
Trade linkages between France and other EU
countries
The French domestic market represents an
important export destination for several other
EU Member States, and in particular for
smaller neighbouring countries. French-bound
exports are of major significance to the
neighbouring countries of Luxembourg and
Belgium, accounting for approximately 13 % of
their respective GDPs. France is also a big market
for Ireland and Malta, with exports amounting to
over 5 % of national GDP. The larger euro-area
Member States — Germany, Italy, Spain and the
Netherlands — all show export linkages in the
range of 3 % to 5 % of GDP.
Graph 2.8.1: Exports to France in value added as a
percentage of exporters’ GDP (in %; top 15 EU
countries)
Source: World Input-Output database (2011). International
Monetary Fund, World Economic Outlook database.
European Commission based on the methodology of
Koopman, Wang and Wei (2014), ‘Tracing Value-Added
and Double Counting in Gross Exports’, American
Economic Review 104:2, pp. 459-494.
When measured in exported value added (60
),
exports to France remain significant for many
EU countries geographically close to France,
reflecting the high integration of France into
global value chains. In value-added terms, exports
to France represent approximately 4 % of GDP for
Luxembourg and Belgium, while for six other EU
(60) Exports in value added exclude the value of imports
embedded in gross exports. Exports in value added refer to
the value of exports that is added by the respective country.
Member States (61
) exports in terms of value added
account for more than 2 % of their GDP
(Graph 2.8.1).
Graph 2.8.2: French exports in value added as a
percentage of French GDP (in %)
Source: World Input-Output database (2011). International
Monetary Fund, World Economic Outlook database.
European Commission based on the methodology of
Koopman, Wang and Wei (2014), ‘Tracing Value-Added
and Double Counting in Gross Exports’, American
Economic Review 104:2, pp. 459-494. ROW denotes the
residual trading partner from a dataset comprising 39
trading partners.
Conversely, French exports depend to a large
extent on external demand from other major
EU Member States, and especially Germany.
Total exports of goods and services account for
approximately 29 % of French GDP, with exports
to Germany alone representing 4.5 % of French
GDP. In terms of exports in value added, total
exports of goods and services in value added still
represent 17 % of French GDP, while exports in
value added to Germany account for 1.8 %.
Exports in value added to the United Kingdom,
Italy and Spain are worth approximately 1 % of
French GDP. Outside the EU, the United States
(1.7 %) and China (1.1 %) are also sizeable export
markets (Graph 2.8.2).
(61) The Netherlands, Spain, Germany, the Czech Republic,
Slovakia, and Hungary.
0.0%
0.5%
1.0%
1.5%
2.0%
2.5%
3.0%
3.5%
4.0%
4.5%
LU BE
NL
ES
DE
CZ
SK
HU SI
IE PL
PT IT MT
AT
% o
f t
radin
g p
art
ner
GD
P
0.0%
0.5%
1.0%
1.5%
2.0%
2.5%
3.0%
3.5%
4.0%
4.5%
RO
W DE
US
A
CH
N
UK IT ES
BE
JPN
RU
S
BR
A
NL
CA
N
TU
R PL
% o
f F
R G
DP
2.8. EURO AREA SPILLOVERS

2.8. Euro area spillovers
54
Financial integration between France and
other EU countries
Other EU Member States have large financial
and banking exposures to France creating the
possibility for significant outward spillovers. In
2012, gross financial exposures to France via
equity and debt instruments accounted for over
50 % of their respective GDP for Ireland, Belgium,
the Netherlands and Malta (Graph 2.8.3). Gross
financial exposure to France is also large for the
United Kingdom (32 %) and Germany (19 %). EU
Member States’ financial exposure to France
mostly takes the form of debt instruments, rather
than foreign direct investment or portfolio
investment in equity. As regards the exposures of
the banking sectors of EU Member States to
France, Belgium, followed by the Czech Republic,
Ireland, Italy, and the Netherlands recorded the
largest exposures to France (over 10 % of their
GDP).
Graph 2.8.3: Partners’ exposures to French liabilities (top
EU 15, excl. LU)
Source: European Commission calculations based on
Hobza, A., Zeugner, S., ‘Current accounts and financial
flows in the euro area’, Journal of International Money and
Finance, 2014.
Debt excluding official equals other investment (e.g. loans)
plus portfolio investment in debt securities, minus official
amounts linked to TARGET2, the European Central Bank’s
Securities Markets Programme and euro-area financial
assistance programmes. 2012 data.
France is also a major funding partner and
investor in several Member States. France is
significantly financially exposed to the United
Kingdom (approximately 25 % of French GDP in
2012), the Netherlands, the United States, Italy,
and Germany (over 15 % of French GDP each).
Data on banks’ cross-border exposure show
France’s crucial importance for the Dutch
banking sector. Dutch banks’ exposure to the
French economy (62
) amounted to approximately
10 % of Dutch GDP in the second quarter of 2015.
Four other EU Member States had exposures to
France higher than 3 % of their respective GDP,
namely the United Kingdom, Belgium, Germany,
and Spain (Graph 2.8.4). As for France’s exposure
to other countries, in the second quarter of 2015,
the French banking sector was significantly
exposed to the United States, with claims worth
approximately 17 % of French GDP, mainly in the
American non-bank private sector. French banks
are also significantly exposed to Italy (10 %), the
United Kingdom (8 %), Belgium, and Japan (both
around 6 %).
(62) Data on bank claims differs from data on gross financial
exposures as the latter covers the claims of the entire economy, whereas the former covers the banking sector
specifically. Furthermore, the two data sources may not be
entirely consistent as i) gross financial exposures are based on 2012 data while bank claims are based on data for the
second quarter of 2015, ii) the countries in sample differ
across datasets and iii) data on bank claims is based on the
country of ultimate risk (the country where the guarantor of
a claim resides) and includes claims of banks’ own foreign
affiliates, while gross financial exposures are based on a locational notion of counterpart that is consistent with
balance of payments statistics.
0
10
20
30
40
50
60
70
80
90
% o
f c
ounte
rpart
GD
P
Equity Debt (excluding official)

2.8. Euro area spillovers
55
Graph 2.8.4: France — EU bank claims, by sector
(1) Based on a EU sample of 12 countries; sum of sectors
may not add to total due to unallocated claims.
Source: BIS consolidated banking statistics (ultimate risk
basis, 2015Q2), IMF, European Commission’s calculations
France’s high public indebtedness could have
adverse effects on other euro-area countries.
The transmission channel here is financial
markets’ sentiment and risk perception. The high
debt level and the challenge the government faces
in getting it onto a downward path in a context of
low growth and low inflation could create market
uncertainty if fiscal adjustment fatigue set in
and/or reform action was delayed. Changes in
French sovereign CDS spreads appear to carry a
significant potential to negatively impact on
spreads of periphery and southern Member
States (63
).
Economic spillovers and euro-area
macroeconomic policy prospects
In a context of low growth, nearly zero inflation
and very accommodative monetary policy in the
euro area, tackling imbalances is challenging.
Low inflation, much below the 2 % target for price
stability, makes reducing France’s debt-to-GDP
ratio more challenging. It also reduces the room
for using price adjustment to recover
competitiveness and makes the rebalancing within
the euro area more difficult. The European Central
Bank has launched a quantitative easing
programme, which helps anchor inflation
expectations while keeping the cost of sovereign
financing low. This accommodative monetary
(63) ‘Cross-border spill-overs in the euro area’, Quarterly
Report on the Euro Area Vol 13 No 4, 2014.
policy provides a favourable context to forcefully
implement structural reforms in order to increase
potential growth and enhance the adjustment
capacity of the economy to shocks. The product
market rigidities remain high in France, despite
recent efforts to address them (see Section 3.1).
Given the potential beneficial effect of those
reforms on the functioning of the Single Market,
they could contribute to growth and rebalancing in
other euro-area partners. It is also to be noted that
for France to implement reforms that enhance
productivity, foster job creation, raise
competitiveness and improve the business
environment, would be in line with the current
Council Recommendation on the economic policy
of the euro area.
Addressing existing economic challenges would
primarily benefit France, but is also in the
interest of the euro area as a whole. It would
help maintain a coordinated stance to boost output
and employment at the euro-area level. The
ongoing moderate recovery in the euro area is
projected to continue but it remains fragile and
subject to increased external risks, making
structural reforms all the more vital. Strengthening
the French potential growth would contribute to
making the recovery more self-sustainable.
Given the strong trade linkages analysed above,
French import demand has a potentially large
impact on growth and employment in other
Member States. Concerned EU partners would
thus benefit from an increase in France’s potential
growth. Model simulations show a non-negligible
impact of structural reforms in France on the euro-
area demand.
In turn, improved economic conditions in the
EU are crucial for France. As discussed, euro-
area and EU economies remain key export
destinations for France. Contributing to a boost to
euro-area growth would in turn imply positive
spillovers for growth in France.
Simulations show significant spillover effects of
structural reforms in France. The Commission’s
simulations based on the QUEST model show that
a 1 pp. reduction in mark-ups in the services sector
would boost French GDP by 0.41 % and
employment by 0.16 % after 5 years, compared to
the baseline, after a negative initial impact.
Structural reforms to enhance competition would
0
2
4
6
8
10
12
% o
f co
un
terp
art
GD
P
Banks Official sector Non-bank private sector All sectors

2.8. Euro area spillovers
56
raise productivity and potential employment,
shifting the French economy to a more dynamic
growth path. At the same time, spillovers to the
rest of the euro area would be positive, even in the
short run. In particular, GDP in the rest of the euro
area would increase by 0.04 % relative to the
baseline after two years, while employment would
increase by 0.03 %. These positive spillover
effects would remain in the longer run.

2.8. Euro area spillovers
57
(Continued on the next page)
Box 2.8.1: Specific monitoring report
In the 2015 European semester cycle, France was found to experience excessive imbalances which require
decisive policy action and specific monitoring. To this end, the Commission published a specific monitoring
report in December 2015 (1). This box concludes the 2015 specific monitoring cycle by summarising the
findings of the latter report and the latest policy developments relevant to the correction of macroeconomic
imbalances.
All the Council country-specific recommendations (CSRs) addressed to France on 14 July 2015 (2) are
considered as relevant under the Macroeconomic Imbalances Procedure. These CSRs concern the following
policy areas:
Ensuring stable public finances. In October 2015, an agreement between social partners improved
significantly the sustainability of the complementary pension schemes, while enhancing incentives to work
longer. Also, the completion of the legislative process related to the territorial reform and the improvements
in the indicative spending norm for local governments introduced in the draft budgetary plan for 2016
improved the fiscal framework for local authorities. The first round of spending reviews linked to the
budgetary procedure has shown that these reviews can potentially lead to substantial savings, although the
savings generated so far have been limited. By contrast, the budgetary strategy has only been marginally
reinforced in the draft budget for 2016 through the further specification of the additional measures for 2016
announced in the Stability Programme.
Enhancing competitiveness. The tax credit for competitiveness and employment (CICE) and the reductions
in social security contributions included in the Responsibility and Solidarity Pact were confirmed by the
2016 budget. Moreover, while the law to reform the labour code, whose draft is announced for 9 March
2016, could impact the wage-setting process, no action to reform the minimum wage indexation mechanism
seems envisaged beyond the avoidance of ad-hoc increases in the minimum wage index (‘coups de pouce’).
Improving the business environment. The Macron law of 6 August 2015 reduces the regulatory barriers to
the exercise of and access to some regulated legal professions, although unjustified regulatory restrictions
remain in place for a large number of regulated professions despite on-going simplification efforts.
Similarly, some measures have been adopted with a view to reducing regulatory barriers to companies’
growth, but they have a limited degree of ambition (9 and 10 employee thresholds raised to 11) or a
temporary nature (additional fiscal and social levies linked to reaching thresholds up to 50 employees frozen
for 3 years).
Improving the tax structure. The 2016 budget implements the planned reduction in corporate taxation. By
contrast, little effort has been made to simplify the tax system beyond technical measures to implement a
withholding tax system for the personal income tax by 2018. Tax expenditures are not significantly being
removed, neither are inefficient taxes. As a result, the tax system continues to suffer from a lack of clarity
and predictability weighing on the effectiveness of fiscal measures.
Fostering the functioning of the labour market. The Macron law modified the employment conservation
agreements (‘accords de maintien de l’emploi’), but no new agreement has been concluded since the
adoption of the law. As regards labour market segmentation, higher social contributions for very short-term
contracts have failed to provide more incentives for employers to hire on longer-term contracts. Also, the
overall effect of the measures contained in the French small business act presented by Prime Minister
Manuel Valls on 9 June 2015 and adopted as part of the 2016 budget is a priori unclear, while the recent
(1) European Commission (2015), France – Review of progress on policy measures relevant for the correction of
macroeconomic imbalances, December 2015.
http://ec.europa.eu/economy_finance/economic_governance/documents/201512_fr_imbalances_epc_report_en.pdf
(2) European Council (2015), Council recommendation of 14 July 2015 on the 2015 National Reform Programme of France and delivering a Council opinion on the 2015 Stability Programme of France (2015/C 272/14).
http://ec.europa.eu/europe2020/pdf/csr2015/csr2015_council_france_en.pdf

2.8. Euro area spillovers
58
Box (continued)
bonus of EUR 2,000 per year for two years, introduced for all firms with fewer than 250 employees,
concerns not only permanent contracts but also fixed-term contracts of more than six months. Concerning
company-level derogations, the French authorities have announced the presentation of a draft law in March
2016. The draft law follows the publication of the September 2015 report of the working group chaired by
Jean-Denis Combrexelle, the so-called ‘Combrexelle report’, which proposed a new architecture of the
labour code articulated over three levels (public social order regulated by law, fields of the employment
relationships that can be defined through a firm or a branch agreement, and provisions that can be used to
regulate the employment relationship in the absence of a firm or a branch agreement) and provided the
government with a set of proposals to improve the functioning of the collective bargaining system, by giving
priority to company-level agreements in establishing the rules governing working time, wages, working
conditions and employment. In turn, the ‘Combrexelle report’ was followed on 26 January 2016 by the
report of the Badinter Commission, nominated by the Minister of Labour on 24 November 2015. This report
lists the fundamental principles of the new labour code, i.e. it defines the first set of norms (the public social
order regulated by law) of the new code. Finally, concerning the unemployment benefit system, its reform is
planned for mid-2016 and negotiations among social partners are planned to start in the first quarter of 2016,
but the content of this reform is not known yet.
Overall, France has made some progress in addressing the 2015 country-specific recommendations.
Substantial progress has been recorded as regards the reform of complementary pension schemes and the
implementation of the measures to reduce the cost of labour. Some progress has been made as regards the
implementation of the annual spending reviews, the control of the rise in local authorities’ administrative
expenditure, the reform of the wage-setting system, the removal of unjustified restrictions on the access to
and exercise of regulated professions, the reduction of taxes on production, and the revision of the ‘accords
de maintien de l’emploi’. Limited progress has been instead achieved in reinforcing the budgetary strategy
and specifying the expenditure cuts planned up to 2017, ensuring that minimum wage developments are
consistent with the objectives of promoting employment and competitiveness, removing regulatory
impediments to companies’ growth, reducing the segmentation of the labour market, facilitating the take-up
of derogations from general legal provisions and reforming the unemployment benefit system. Limited
progress has also been made in simplifying and improving the efficiency of the tax system and in
broadening the tax base on consumption, with no progress made in abolishing inefficient taxes.
This is broadly consistent with the findings of the December 2015 specific monitoring report. Since
then, on 18 January 2016 the main features of a plan to fight unemployment, including training initiatives
for jobseekers, a reinforcement of the apprenticeship system and incentives for SMEs hiring with contracts
longer than six months, were announced (see Section 3.2) and the commitment to fully undertake and then
implement all announced reforms reiterated. By contrast, and contrary to the announced schedule, limited
progress was made in adopting the decrees implementing the Macron law of 6 August 2015 (see
Section 3.1), while some crucial aspects of the reform remain to be set up by decree. The measures
announced in the context of the ongoing simplification programme (‘choc de simplification’) are promising,
but their implementation remains to be completed. The healthcare law of 26 January 2016 somewhat eases
access to healthcare professions and relaxes shareholding requirements for pharmacies. Shareholding
requirements for medical test laboratories have also been relaxed through a recent decree (decree n°2016-44
of 26 January 2016).

59
This MIP assessment matrix summarises the main findings of the in-depth review in this report. It focuses
on imbalances and adjustment issues relevant for the MIP.
Table 2.9.1: MIP Assessment Matrix (*) - France
(Continued on the next page)
Gravity of the challenge Evolution and prospects Policy response
Imbalances (unsustainable trends, vulnerabilities and associated risks)
Competitiveness France lost export market shares by 26 %
between 2000 and 2014 (see Section 2.2).
External sustainability is not a concern for
France in the near term as its NIIP is
relatively contained (-19 % of GDP in
2015Q3). However, the persistence of a
current account deficit reflects a
deteriorated competitiveness.
ULC increased at a slightly higher pace in
France relative to other EA countries over
the past ten years (see Section 2.3).
Potential TFP growth amounted to 0.2 %
in 2015 while it was 1.3 % in 2000 (see
Section 2.1). This trend decline in
productivity growth reinforces the
challenges associated with a deteriorated
competitiveness.
The low profitability of non-financial
corporations also weighs on French
exporters (see Section 2.4). The corporate
profit share of the French non-financial
companies reached a trough at below 30 %
of value added in 2014. This ratio has
worsened since 2007 due to an increase in
the price of intermediate consumption of
goods and services, which companies have
accommodated through a reduction of
profit margins, not being able to pass it
onto the final price.
Similarly to other EU economies,
export market shares gains were
recorded since 2013 (+3.7 % in
cumulated terms), the durability of
this improvement being unclear at this
stage.
The annual current account balance is
expected to remain negative in the
near future. The NIIP recently
deteriorated at a faster pace than the
current account deficit. Net external
debt has contributed to this
aggravation with a worsening by
5 pps.
Annual ULC growth accelerated
slightly in 2014 (1.5 %), on the back
of negative labour productivity
growth. In 2015, the depreciation of
the euro, combined with subdued
HICP inflation developments, will
lead to a renewed decrease of the
REER headline indicator.
Despite a recent pick-up in firms’
profitability, past weak profit margins
may have curbed entrepreneurs’
confidence and appetite to invest,
especially in riskier activities or more
technology intense sectors. This
development may have dented French
businesses’ ability to increase the
quality of their products.
The French authorities implemented the
CICE and the Responsibility and
Solidarity Pact (RSP). Both measures
should lower labour taxes by EUR 30 bn
by 2017 and corporate taxes by
EUR 10 bn.
The CICE and the RSP could contribute
to an improvement in NFCs’ profitability,
if nominal wage growth and the cost of
intermediate inputs remain contained,
ultimately allowing a deleveraging of the
private sector.
Real wage growth remains rather
dynamic and reacts only to some extent
to higher unemployment or lower
inflation. The real wage increases erased
part of the gains in cost-competitiveness
stemming from the implementation of the
CICE and the RSP.
France has not yet taken measures to
address the rigidity of the wage setting
process. The Government has
commissioned two reports, the
Combrexelle and Badinter reports, which
propose some measures to address this
issue. No measures have been taken to
align the minimum wage to productivity
developments, beyond a stop to the ad-
hoc increases observed in the past.
2.9. MIP ASSESSMENT MATRIX

2.9. MIP assessment matrix
60
Table (continued)
(*) The first column summarises "gravity" issues which aim at providing an order of magnitude of the level of imbalances. The
second column reports findings concerning the "evolution and prospects" of imbalances. The third column reports recent
and planned relevant measures. Findings are reported for each source of imbalance and adjustment issue. The final three
paragraphs of the matrix summarise the overall challenges, in terms of their gravity, developments and prospects, policy
response.
Source: European Commission
Public debt Already at a very high level, government
debt continued to increase to 95.6 % of
GDP in 2014. Such a high debt level and
the upward trend constitute a major
vulnerability which reduces the fiscal
space available to respond to future shocks
(see Section 2.5). It also weighs on growth
prospects by crowding out productive
public expenditure and requiring a higher
tax burden. The combination of high
public and high private debt is an
aggravating risk factor.
The government has used low government
bond yields to lengthen the maturity of
sovereign bonds, which is a mitigating
factor for refinancing problems. The
widely diversified French debt investor
base in terms of type of investors as well
as geographically could be a mitigating
factor.
Public debt is projected to increase to
97.1 % by 2017. The structure of
public debt financing, both in terms of
maturity and diversification, does not
give rise to short-term risks. France is
able to issue long-term debt at very
low rates, in line with favourable
funding conditions and investor
appetite.
However, in a somewhat longer
perspective, debt dynamics between
France and the rest of the euro area
are diverging, mainly due to the
higher French primary deficit. The
debt trajectory and the sustainability
gap at horizon 2030 point to high
indebtedness risks in the medium
term.
The Commission 2016 winter forecast
projects the headline deficit targets to
be met both in 2015 and 2016.
However, under the usual no-policy-
change assumption, the headline
deficit in 2017 is projected to be
above the 3 % of GDP threshold.
The French authorities have announced a
multi-annual plan to reduce public
expenditure by EUR 50 billion over
2015-2017 on all the levels of the general
government. However, the reduction in
public spending is computed against a
conventional trend and the ratio of public
expenditure to GDP would still remain
high compared to other EU countries.
Moreover, the impact of the expenditure
plan on the deficit is attenuated as most
of the plan serves to finance the social
contribution and tax cuts of the CICE and
the Responsibility and Solidarity Pact
(EUR 41 bn in total).
As the consolidation strategy pursued by
France relies primarily on the better-than-
expected deficit outcome for 2014, the
improving cyclical conditions and a
continuation of the low interest rate
environment, it is therefore subject to
risks.
The consolidation strategy is not selective
enough. France consolidation strategy is
expenditure-based. However, in a
European perspective, the focus is more
on across-the-board expenditure cuts and
less on a selective strategy to reap
efficiency gains. The spending reviews
are a positive development in the process
of identifying specific expenditure cuts,
although they lack transparency.
Conclusions from IDR analysis
France is characterised by a high and increasing public debt coupled with a deteriorated competitiveness, in a context of low productivity
growth. Associated vulnerabilities have cross-border relevance.
The recent improvement in export market shares may not be durable, being concentrated in a few sectors benefitting from the euro depreciation.
The recent wage moderation is insufficient given the declining productivity growth. Although profit margins have recently increased, no
recovery in investment is projected before 2017, weighing on non-cost competitiveness. Besides, public debt is projected to reach 97.1 % of
GDP in 2017. The spending reviews have not contributed so far to significantly improve public spending efficiency, necessary to alleviate tax
burden and improve the efficiency of the rest of the economy.
Policy measures have been taken in recent years, in particular to reduce the labour tax wedge and policy commitments have recently been
stepped up. However, decisive reform implementation remains key regarding structural reforms on product and labour market. Policy challenges
remain, in particular as regards the collective bargaining system, the minimum wage setting process or the regulatory impediments to firms’
growth. In addition, the spending review has not delivered the expected results to address the growing public debt-to-GDP ratio.

61
Business environment
The French business environment continues to
be middle-ranking, with regulatory burden an
important area of concern. According to the
World Bank’s 2016 Doing Business survey,
France ranks 27th
out of 189 economies and 13th
among the EU Member States, unchanged from
2015 (64
). France’s good performance in trading
across borders (1st) or contract enforcement (14
th)
is counterbalanced by poor performance in getting
credit (79th
), paying taxes (87th
), or registering
property (see below) (Graph 3.1.1). In addition, the
2015-2016 Global Competitiveness Report of the
World Economic Forum ranks France 22nd
of 140
countries overall, but 115th
only as regards the
burden of government regulation. In this area,
France ranks much lower than some of its main
competitors such as Germany or the UK.
Registering property is comparatively slow and
expensive. It takes 49 days in France (EU average
25.6) and costs 6.1 % of the property value (EU
average 4.5 %). Moreover, it requires eight
procedures against an EU average of five. In 2013,
France made the transfer of property easier by
speeding up the registration of the deed of sale at
the land registry, but since then no further actions
have been planned to speed up the process and
decrease the costs further.
Legislative instability linked to frequent
changes in legislation continues to negatively
affect the French business environment
including through negative perception. 90 % of
SMEs responding to a 2015 Commission survey
(rank: 3rd
in the EU, EU average: 70 %) believed
that fast-changing legislation and policies were a
(64) World Bank (2016), Doing Business 2016: Measuring
Regulatory Quality and Efficiency, Washington, DC.
problem for doing business in France (65
). An
example is the obligation to inform employees in
the event of a business transfer, first introduced in
the consumption law of 17 March 2014 and
subsequently relaxed in the Macron law of 6
August 2015.
Graph 3.1.1: World Bank Doing Business 2016 indicator -
distance to the frontier of best performance
Note: a score of 0 indicates the lowest performance
among all countries in the sample, whereas 100 indicates
the frontier of best practice.
Source: European Commission, World Bank
The simplification programme (‘choc de
simplification’) in place since 2013 is being
implemented as planned. The scrapping of
burdensome regulations is continuing, with new
batches of measures being adopted on a regular
basis, usually every six months. The most recent
reform package was published on 3 February 2016
(65) European Commission (2015), Small Business Act Fact
Sheet for France 2015.
0
20
40
60
80
100
Starting abusiness
Dealing withconstruction
permits
Gettingelectricity
Registeringproperty
Gettingcredit
Protectingminorityinvestors
Payingtaxes
Tradingacrossborders
Enforcingcontracts
Resolvinginsolvency
EU28 (simple average) FR
3. ADDITIONAL STRUCTURAL ISSUES
In addition to the macroeconomic imbalances and adjustments issues addressed in Section 2, this section
provides an analysis of other structural economic and social challenges for France. Focusing on the
policy areas covered in the 2015 country-specific recommendations, this section analyses issues related
to the business environment, the labour market, social and education policies, as well as innovation and
taxation.
3.1. BUSINESS ENVIRONMENT AND COMPETITION IN PRODUCT
MARKETS

3.1. Improving business environment and enhancing competition in service and product markets
62
and includes 170 actions, of which 90 target
companies. Progress with implementation is
uneven, with only 56 % of the 325 measures
targeting companies already in effect at this stage.
While measures simplifying the creation of new
firms have been almost fully implemented, the
easing of sectoral regulations is slower. As regards
building permits, simplification efforts have been
made to reconcile environmental and business
concerns but, there still appear to be substantial
difficulties as regards industrial plants.
Policy evaluation is not systematically and
consistently performed. Although impact
assessments are a constitutional requirement,
different requirements apply to project laws and to
decrees or by-laws and there is no standard rule
and methodology ensuring stakeholder
involvement (66
). Moreover, ex-post policy
evaluations are not widespread (67
). Impact
assessments making use of ‘SME panel’ to assess
the impact of legislative proposals on SMEs are
not yet widely used.
Public administration governance is not
optimal. According to the World Bank 2015
Worldwide Governance Indicator, France scores
modestly (1.09, compared to an EU average of
1.17 in 2014, well below Germany (1.70)) as
regards the regulatory quality indicator. This
indicator captures the perception of the quality of
public services, the capacity and independence of
the civil service and the quality of policy
formulation (68
). Governance is weakened by the
coexistence of multiple layers of sub-central
administration which reduce the effectiveness of
public policies. The government has recently taken
steps to improve the situation (see Section 2.6).
Efforts to make contacts with the administration
more efficient by introducing the rule that no reply
means acceptance (silence vaut accord) (extended
(66) Bertelsmann Stiftung (2015), Sustainability Governance
indicator 2015. France scores 4 out of 10 as regards
application and quality of regulatory impact assessments,
much below the UK (9) and Germany (8).
(67) OECD (2015), Regulatory Policy Outlook 2015, France, OECD Publishing, Paris, 28 October.
(68) World Bank (2015), Worldwide Governance Indicator. The
governance score denotes the governance measure on a scale from approximately -2.5 to 2.5. Higher values
correspond to better governance. The percentile ranks
locate the respective country among all 215 countries covered by the Worldwide Governance Indicators.
to local authorities in 2015) are being undermined
by the high number of exemptions (69
).
Firm growth and size-related thresholds
The French economy has a disproportionately
high share of smaller businesses with fewer than
10 or fewer than 50 employees (Graph 3.1.2),
much higher than Germany and the UK.
Consequently, France has a relatively small share
of medium-sized companies with 50-249
employees in total employment, especially
compared with Germany and the UK, while being
on a par with Spain.
Graph 3.1.2: Break-down of firms by employee number
Source: Eurostat
The predominance of small-sized firms is
problematic as they typically have lower
productivity levels (Table 3.1.1), which in turn
affects internationalisation and competitiveness. In
addition, smaller firms also tend to have lower
profit margins, especially in the manufacturing
sector, and consequently have more difficulty
investing. It is also harder for smaller firms to
apply to and meet administrative criteria for public
support schemes to innovation (see Section 3.4).
While the number of companies created is
relatively high, the survival rate of new firms
(69) Portelli, H. and Sueur, J-P. (2015), Le silence de
l’administration vaut acceptation : rapport d’évaluation de la loi du 12 novembre 2013, Rapport d’évaluation fait au
nom de la commission des lois n°629, July.
0%
10%
20%
30%
40%
50%
60%
70%
80%
90%
100%
FR ES EU-28 UK DE
0 to 9 10 to 19 20 to 49 50 to 249 250 or more

3.1. Improving business environment and enhancing competition in service and product markets
63
remains subdued and their growth rate constrained.
The fact that it is hard for French companies to
survive and grow thus limits the potential
productivity gains that could be generated by
newly created and fast growing firms.
Table 3.1.1: Productivity level in manufacturing by
enterprise size class, 2013
Source: OECD entrepreneurship at a glance, 2015
Size-related thresholds continue to weigh on
firms’ growth. The 10 and 50 employee
thresholds are particularly costly. The latter is
estimated to represent an additional cost equivalent
to 4 % of the wage bill at firm-level (70
), and an
aggregated cost of between 0.5 % and 4.5 % of
GDP depending on the degree of downward wage
rigidity (71
). The existence of different size-related
thresholds can be particularly disruptive for young
innovative high-growth firms which pass through
several size-related ceilings in a short period of
time.
Two initiatives have been taken to smooth the
impact of size-related requirements, but no
significant effect is expected. The law on social
dialogue of 17 August 2015 reduces the number of
annual information, consultation and negotiation
obligations on employee representatives in
companies with over 50 employees, extends the
‘single staff delegation’ (Delegation Unique du
Personnel) to firms employing up to 300
employees (from 200) and above (subject to a
majority agreement in the latter case). This will
contribute to streamlining social dialogue in
companies. Crucially, however, the impact of the
single staff delegation will depend on how it is
applied, including the number of its members and
the number of hours to be devoted to it which
remains to be set by decree. The law also
introduces new social dialogue arrangements for
smaller businesses with fewer than 11 employees
(70) Attali J. (dir), Rapport de la Commission pour la libération
de la croissance française, 2008.
(71) See for example Garicano et al. (2013), Firm Size Distortions and the Productivity Distribution: Evidence
from France, NBER Working Paper No. 18841, February.
through the creation of the Commissions Paritaires
Régionales Interprofessionnelles (CPRI).
Smaller businesses will benefit from a modest
relaxation of size-related thresholds introduced
in the 2016 budget. The budget for 2016 provides
for a permanent increase of the 9 and 10 employee
thresholds to 11. Moreover, the additional fiscal
and social levies linked to reaching thresholds up
to 50 employees included are temporarily frozen
until 2018. While a grace period may smooth the
transition for companies reaching a threshold, its
temporary nature creates uncertainties for them.
More generally, the permanent or temporary
increase in the 9, 10 and 50 employee thresholds
show that the authorities recognise the burden
associated with reaching these thresholds, but does
not address the core issue, i.e. to reassess all the
requirements linked with exceeding these
thresholds with a view to simplifying them where
possible.
Competition in the services markets
Barriers to competition in business services in
France are relatively high in comparison with
other EU Member States (Graph 3.1.3). As a
result, service providers are prevented from
entering the market, which leads to higher mark-
ups, with negative effects on prices and possibly
on the quality of services. This is problematic
given the high share of domestic services inputs in
the value added of French manufacturing exports
(Graph 3.1.3), and is therefore an additional factor
weighing on France’s competitiveness. Further
improving the performance of business services
would therefore also help industry as well.
According to 2014 case studies by the European
Commission, positive effects from service sectors
liberalisation have been seen in Germany, Greece
or Italy (72
).
The Macron law is a step towards easing the
burden of anti-competitive regulations for
certain legal professions but its impact will
depend on pending decrees. The professions
covered by the law have an annual turnover of
EUR 8 billion (0.4 % of GDP). Most importantly,
the law aims to reduce tariffs in seven legal
(72) European Commission (2015), A Single Market Strategy
for Europe – Analysis and Evidence, SWD(2015) 202.
Size class 1-9 10-19 20-49 50-249 250+
FR 39.3 44.9 55.0 60.1 80.0
EA 32.1 42.8 51.2 61.1 85.0
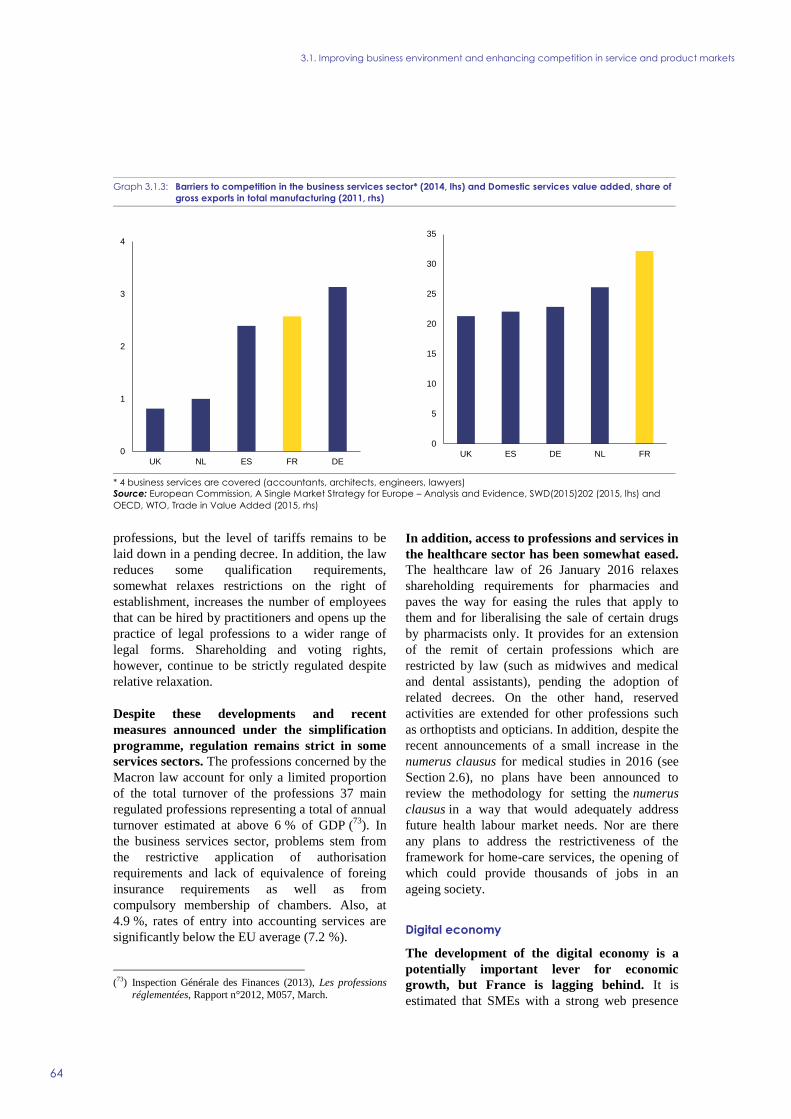
3.1. Improving business environment and enhancing competition in service and product markets
64
professions, but the level of tariffs remains to be
laid down in a pending decree. In addition, the law
reduces some qualification requirements,
somewhat relaxes restrictions on the right of
establishment, increases the number of employees
that can be hired by practitioners and opens up the
practice of legal professions to a wider range of
legal forms. Shareholding and voting rights,
however, continue to be strictly regulated despite
relative relaxation.
Despite these developments and recent
measures announced under the simplification
programme, regulation remains strict in some
services sectors. The professions concerned by the
Macron law account for only a limited proportion
of the total turnover of the professions 37 main
regulated professions representing a total of annual
turnover estimated at above 6 % of GDP (73
). In
the business services sector, problems stem from
the restrictive application of authorisation
requirements and lack of equivalence of foreing
insurance requirements as well as from
compulsory membership of chambers. Also, at
4.9 %, rates of entry into accounting services are
significantly below the EU average (7.2 %).
(73) Inspection Générale des Finances (2013), Les professions
réglementées, Rapport n°2012, M057, March.
In addition, access to professions and services in
the healthcare sector has been somewhat eased.
The healthcare law of 26 January 2016 relaxes
shareholding requirements for pharmacies and
paves the way for easing the rules that apply to
them and for liberalising the sale of certain drugs
by pharmacists only. It provides for an extension
of the remit of certain professions which are
restricted by law (such as midwives and medical
and dental assistants), pending the adoption of
related decrees. On the other hand, reserved
activities are extended for other professions such
as orthoptists and opticians. In addition, despite the
recent announcements of a small increase in the
numerus clausus for medical studies in 2016 (see
Section 2.6), no plans have been announced to
review the methodology for setting the numerus
clausus in a way that would adequately address
future health labour market needs. Nor are there
any plans to address the restrictiveness of the
framework for home-care services, the opening of
which could provide thousands of jobs in an
ageing society.
Digital economy
The development of the digital economy is a
potentially important lever for economic
growth, but France is lagging behind. It is
estimated that SMEs with a strong web presence
Graph 3.1.3: Barriers to competition in the business services sector* (2014, lhs) and Domestic services value added, share of
gross exports in total manufacturing (2011, rhs)
* 4 business services are covered (accountants, architects, engineers, lawyers)
Source: European Commission, A Single Market Strategy for Europe – Analysis and Evidence, SWD(2015)202 (2015, lhs) and
OECD, WTO, Trade in Value Added (2015, rhs)
0
1
2
3
4
UK NL ES FR DE
0
5
10
15
20
25
30
35
UK ES DE NL FR

3.1. Improving business environment and enhancing competition in service and product markets
65
grow more than twice as quickly as those with a
modest one, or none at all (74
). However, the
adoption of big data technologies in France
remains low, with the ICT sector representing only
4.3 % of French GDP, against an average of 5.5 %
in OECD countries. Only a minority of French
firms have a website and use social media in their
dealings with customers. These shortcomings are
particularly pronounced for SMEs. According to
the EU Digital Economy and Society Index,
French SMEs seem to lag behind in many respects:
only 15.8 % of SMEs sell online (ranked 13th in
the EU; EU average: 16.28 %) and only 7.9 % of
SMEs sell cross-border online (ranked 15th
in the
EU; EU average: 7.5 %).
Regulatory bottlenecks are preventing the entry
of new digital market players, slowing down the
digitisation of the French economy. For example,
the development of online driving schools is
hampered by the legal requirement for driving
schools to have dedicated premises. Healthcare is
another sector where bottlenecks limit the
development of online services.
On the other hand, the opening up of data flows
is beginning. Data collection and analysis can
create value by refining firms’ understanding of
customer behaviour. This knowledge is used to
develop next generation products or services. The
Macron law has opened up transport data and data
from the Infogreffe business registry (through the
reform of the profession of greffiers). The draft
digital law (loi numérique) further proposes to
extend open data to most of the government data,
while the healthcare law opens the access to
specific health data.
In addition, the development of self-
employment is being hindered by the barriers
to entering certain professions, while there is a
high potential for creating low- or middle-skilled
self-employed jobs as shown by the easing of
restrictions on real-estate agents.
The development of high-speed broadband
plays an important role in the take-up of digital
innovation by companies. Next generation access
(74) Dr. Bughin, J., and Dr. Manyika, J., (2012) Internet
Matters, Essays in Digital Transformation, McKinsey, March.
(NGA) broadband, which enables high-speed
downloads, was only available to 45 % of French
households in 2015 (up from 23 % in 2011), well
below the EU average of 71 %. Mobile broadband
take-up, at 73 subscriptions per 100 people in 2015
is also below the EU average (75 %). To improve
the coverage of high-speed broadband, the French
government is implementing its ‘Plan Très Haut
Débit’ and has set up the ‘Mission France Très
Haut Débit’ with a view to ensuring nationwide
NGA coverage by 2022.
Competition in the retail market
Steps have been taken to improve the
functioning of the retail sector through the
Macron law and the simplification programme.
In particular, the Macron law provides for an
extension of Sunday trading options, subject to an
agreement between the social partners. However,
provisions included in the draft law to allow the
Competition Authority to be consulted before the
adoption of planning documents did not make it
into the final text. There are major economic
benefits to be reaped from retail sector
deregulation, a sector which represented 4.3 % of
total added value in 2013 and featuring rather high
mark-ups compared to the rest of the EU (for
instance, 3 pps. higher than in the UK (75
)).
Transport policy
Barriers for intercity coach services have been
relaxed, and to some extent also for hired
vehicle with driver. The deregulation of coach
services provided for by the Macron law has so far
led to the creation of 150 lines, according to
estimates by the French government. A complex
legal framework still regulates taxis and hired
vehicles with driver, in a context where on-line
platforms are boosting the latter. Although entry
requirements to obtain a hired vehicle with driver
licence have been relaxed, this activity still faces
restrictive rules on types of vehicles and routes.
Barriers remain in the area of passenger
railway services. In spite of some efforts in terms
(75) Thum-Thysen, A. , Canton E. (2015), Estimation of service
sector mark-ups determined by structural reforms indicators, European Commission, Economic Papers 547,
April.

3.1. Improving business environment and enhancing competition in service and product markets
66
of transparency, the contracts for regional rail
public services are still awarded directly to the
incumbent without any public tendering. Although
major investment is still taking place in the area of
high-speed lines, these infrastructures remain
closed to other railway undertakings wishing to
provide competing domestic rail services.
Energy policy
While the electricity market remains highly
concentrated, in gas the market is more
dynamic. The market share of alternative suppliers
was 9 % at the end of 2014 for electricity, and the
switching rate is extremely low, despite a slight
increase at the end of 2014 when it reached 1.2 %
of both household and non-household consumers.
The three largest electricity producers maintained a
market share of 98 % of the number of sites and
switching costs are high. In gas, competition is
more advanced with new entrants reaching a share
of 17.5 % of customers and 44.2 % of total
consumption volume (76
). This indicates significant
competition for larger customers.
Some regulated tariffs (77
) are being phased out,
but a tariff deficit legacy remains. Regulated
prices for large commercial customers were
abolished at the end of 2015 following the
application of the 2010 law on the new
organisation of market in electricity (loi NOME)
and the 2014 consumption law for the gas sector.
This measure, along with new methodologies for
setting the remaining regulated electricity prices to
ensure full cost coverage should prevent the
accumulation of a new deficit. However, in 2015
the value of the deficit previously accumulated
stood at EUR 6.5 billion.
The framework is not entirely favourable to
investment in next generation energy (including
renewables). While the phasing-out of regulated
prices for large commercial customers is
improving incentives, the remaining regulated
tariffs will continue to deter investment and the
development of competition. This may conflict
with the introduction of a capacity remuneration
(76) Commission de Régulation de l’Energie (2014),
Observatoire des marchés de détail du 4eme trimestre. (77) Regulated tariffs have been traditionally set at levels that
cover neither distribution costs nor the costs of Public
Service Obligation.
mechanism (78
). France is not on track to meet its
renewable energy target by 2020. Administrative
complexity contributes to limiting investment in
this sector, despite recent simplification efforts
introduced by the energy transition law of 17
August 2015. In particular, projects are delayed
due to long procedures for granting permits (up to
3 years) and various technical barriers.
France’s interconnection capacity for electricity
is not on track to meet its energy efficiency
target (79
). At 11 % in 2014, the interconnection
capacity for electricity was above the Energy
Union 2020 target (10 %). However, the
interconnections with Spain in both electricity and
gas are below their potential. The Commission has
identified two key infrastructure projects for
electricity and one for gas to eliminate existing
bottlenecks. As regards energy intensity, its rate of
improvement is below the EU average. Without
additional efforts and accelerated policy
implementation, France could fail to further reduce
its current level of primary energy consumption.
By reinforcing its framework for the energy
transition, France is addressing these
weaknesses. The energy transition law aims to
reduce the share of nuclear generation and increase
the share of production from renewable energy
sources to 40 % by 2040. The law also reforms the
support framework for renewable energy to better
integrate renewables into the market and create
market-based incentives for allocating new
generation capacity. The law also complements the
energy efficiency policy framework, including
through the renovation of 500 000 houses from
2017. The successful implementation of the law,
which depends on the practicalities to be laid down
in pending decrees, will be decisive in meeting
these objectives.
(78) Capacity remuneration mechanisms provide stimulus to
invest in energy infrastructure to ensure that a sufficient
amount of capacity is available at all times.
(79) European Commission (2015), Assessment of the progress
made by Member States towards the national energy efficiency targets for 2020 and towards the implementation
of the Energy Efficiency Directive 2012/27/EU,
COM(2015) 574 final, 18 November.

67
Labour market performance
In a time of weak job creation, unemployment
remains high. The overall unemployment rate
rose to 10.5 % in 2015 against 10.3 % in 2014.
Unemployment is higher among young people,
non-EU nationals and lower-qualified workers. In
particular, the unemployment rate for workers
under the age of 25 years reached 25.1 % in 2015.
Also, non-EU nationals have particular difficulty
accessing the labour market; for them the
unemployment rate was 24.9 %, above the EU
average of 18.1 %. Similarly, the unemployment
rate for low qualified workers, with a level of
education corresponding to ISCED (80
) levels 0-2,
i.e. below ‘baccalauréat’, reached 16.8 % at the
end of 2015.
Long-term unemployment has increased
recently. The average duration of unemployment
has been rising steadily since 2008. It rose from
270 days in 2013 to 290 days in 2014 (81
).
Moreover, as a percentage of total unemployment,
long-term unemployment rose from 40.5 % in
2013 to 44.2 % in 2014. Despite this increase, the
figure for France was still below both the EU and
the euro-area average, at 49.6 % and 52.7 %
respectively, in 2014. Older workers and those
with the lowest levels of education were most
affected by long-term unemployment. Six out of
ten unemployed workers aged over 50 were
unemployed for at least a year, compared with four
out of ten workers aged 25-49, and three out of ten
workers under the age of 25. Moreover, 56 % of
unemployed workers with at most a lower
secondary education diploma were unemployed for
a year or more, compared with less than one in
three workers with a higher school certificate or a
university degree (82
).
The increase in the unemployment rate was
accompanied by weak labour demand, with no
signs of deterioration in matching efficiency.
The Beveridge curve, which represents the relation
between unemployment and job vacancies,
provides a broad assessment of whether the
(80) International Standard Classification of Education,
developed by UNESCO. (81) Dares (2015), ‘Demandeurs d’emploi inscrits et offres
collectées par Pôle Emploi en Novembre 2015’, Dares
Indicateurs, No. 96, Décembre 2015. (82) Insee (2015), ‘Une photographie du marché du travail en
2014’, Insee Première, No. 1569, October 2015.
efficiency of the matching process has changed
over the crisis (Graph 3.2.1). In the third quarter of
2015, vacancies remain low, but the combination
of unemployment and vacancies lies along the pre-
crisis segment of the curve highlighted in yellow.
This suggests that the decrease is mainly due to
weak demand for labour and not to major
difficulties in matching.
Graph 3.2.1: Beveridge curve, France
Source: Eurostat and Dares.
The situation of people with a migrant
background is especially challenging. Overall
the employment rate of non-EU born, at 55.4 % in
2014, is well below the average among people
born in France (71.1 %) aged 20-64. The gap is
wider among women, as only 47.5 % of women
born outside the EU have a job compared to
67.9 % of women born in France. The
disadvantaged position of non-EU born on the
labour market can be partly attributed to language
difficulties, lack of recognition of foreign
qualifications, and a lower level of education as
40 % of non-EU born aged 25-64 have not
completed higher secondary education level
compared to 20.7 % of French-born people. In
2015, discrimination on the grounds of ethnic
origin was the most frequent type of complaint
received by the Defender of Rights (83
). Children
born to migrant parents were less likely to be
employed than other children by 15.7 pps. – one of
(83) The Defender of Rights is the main equality body in
France.
2008Q1
2008Q4
2009Q1
2012Q12010Q4
2003Q1
2005Q4
2011Q3
2007Q4
2012Q4
2014Q4
2015Q1
2015Q3
0.6
0.7
0.8
0.9
1
1.1
1.2
6 7 8 9 10 11
job o
ffers
as (
% o
f la
bour
forc
e)
unemployment rate (%)
3.2. LABOUR MARKET, EDUCATION AND SOCIAL SITUATION

3.2. Labour market, education and social situation
68
the most pronounced gaps in the EU countries –
even after adjusting for individual
characteristics (84
). An estimated number of 75,020
asylum requests were filed in France in 2015. The
final number of refugees will only become clear
later in 2016 and in 2017.
Labour market segmentation
The structure of the labour market appears
more and more polarised, with highly educated
workers hired on open-ended contracts and a
constant share of low-skilled jobs becoming more
and more precarious in some tertiary sectors. The
duality of the French labour market is reflected by
a growing share of less than one month fixed-term
contracts in total hires. This share has risen to
close to 70 % in the three first quarters of 2015,
from 48 % in 2000. This trend is fuelled by the
tertiary sector (Graph 3.2.2) and notably by those
sectors entitled to use more flexible labour
contracts (‘contrats d’usage’). While the share of
open-ended contracts has remained roughly stable
since 2003 (around 87 % all wage earners), the
transition rate from a fixed-term contract to an
open-ended contract is very low, at 11.1 % in 2013
compared with 22.7 % across the EU.
Incentives to persuade employers to hire on
longer short-term or open-ended contracts have
not reduced the labour market segmentation.
The law on securing employment of June 2013
provides for an increase in social security
contributions of 0.5 points for the ‘contrats
d’usage’ of less than three months. The very low
premium paid by the ‘contrats d’usage’ is not a
deterrent from using them extensively. Moreover
as seasonal and replacement jobs are totally
exempted from the increase in contributions, firms
may be tempted to declare new short-term
contracts as seasonal employment or temporary
replacement to avoid the extra burden. Since this
law was implemented, there has been no reduction
in the ratio of very short-term contracts to total
(84) The individual characteristics refer to age, literacy, gender
and education level. Evidence from situation testing also shows that native-born children from North African and
sub-Saharan African parents have to send out twice as
many applications before they secure to a job interview (than others with exactly the same profile). See OECD,
International Migration Outlook, 2014. See also the results
of the survey INED (2015), ‘Trajectoires et origins. Enquête sur la diversité des populations en France’.
short-term contracts. The new employment plan
announced on 18 January 2016 strengthens
incentives for SMEs to hire, on permanent or
fixed-term contract longer than six months,
employees paid up to 1.3 times the minimum
wage, replacing the premium to encourage first
hires introduced in July 2015.
Graph 3.2.2: Share of up to one month length contracts in
all new hires by sector, 2000-2015
Source: Acoss
Unemployment benefit system
The long-lasting deterioration in the labour
market has put a strain on the sustainability of
the unemployment benefit system. A new
convention regulating the unemployment benefit
system entered into force on 1 July 2014 but is
insufficient to reduce the system’s deficit. Indeed,
in October 2015 the deficit was still projected to
rise from EUR 3.7 billion in 2014 to 4.4 billion in
2015. This would further increase in the system’s
debt from EUR 21.3 billion in 2014 to 25.8 billion
in 2015 and 29.4 billion in 2016.
The unemployment benefit system is
characterised by the duality between the
economically balanced general arrangement for
open-ended contracts and the deficit-prone
specific arrangements (short-term contracts,
temping and the specific arrangements for the
entertainment sector). The system also makes it to
add revenues from partial activity and benefits.
However, the benefit calculation favours a
succession of short-term full time jobs over a long-
term part-time job, particularly in ‘contrats
0
10
20
30
40
50
60
70
80
00 01 02 03 04 05 06 07 08 09 10 11 12 13 14 15
%
All sectors Tertiary Industry Construction
3.2. Labour market, education and social situation
69
d’usages’ sectors. This creates perverse incentives
for employers to offer short-term employment to
be complemented by in-work benefits.
The design of the unemployment benefit system
during the unemployment spell may weaken the
incentives to return to work. The net replacement
rate declines only marginally over the
unemployment spell. For example, in 2013, the net
replacement rate for a single parent with two
children who earned 67 % of the average wage in a
previous job was comparable to the EU average
(68 % against an EU average of 71 %) over the
first two months of unemployment. However, this
is not the case after a year, when the net
replacement rate in France remains unchanged,
while for the EU average it drops to 41 %. The
contribution period to be eligible for
unemployment benefits is also shorter than in other
Member States, while the maximum duration of
the benefits is comparatively high.
The mechanism of ‘rechargeable rights’ (‘droits
rechargeables’) introduced in 2014 strengthened
the activation component of the unemployment
benefit system. The introduction of such rights
translates into both an increase in the potential
total length of unemployment rights and a greater
incentive to return to work. Also, it may boost the
efficiency of the matching process since it: helps
unemployed workers find jobs matching their
skills; stabilises their income over the transition
period from unemployment to work; and allows
second earners not to lose benefits if they
temporarily leave the labour force, hence
maintaining their incentive to re-enter the labour
market.
New negotiations between social partners are
set to start in the first quarter of 2016 and a
new agreement is planned in 2016. Besides the
issues concerning the incentives to return to work
discussed above, in July 2015 the French Court of
Auditors questioned the efficiency of Pôle Emploi,
the public employment service (PES), in particular
concerning the reinsertion of unemployed workers
into the labour market (85
).
(85) Cour des Comptes (2015), ‘Pôle emploi à l’épreuve du
chômage de masse’, Thematic Public Report, July 2015.
Active labour market policies
Individual monitoring of jobseekers has been
scaled up in recent years and policy initiatives
to encourage businesses to hire unemployed
workers have been extended. The different
strategies for the PES introduced since 2012 aim at
reinforcing the focus of PES counsellors on the
most vulnerable groups. France launched a long-
term unemployment plan in early 2015, which
introduced two new ‘professionalisation contracts’
to address the specific needs of long-term
unemployed workers. In particular, the range of
support for the long-term unemployed returning to
work has been widened, including childcare and
rental support. Moreover, a new PES offer called
‘supervision in job’ encourages employers to
recruit long-term unemployed workers by offering
social and professional expertise to accompany the
recruitment. A post-placement support service has
also been initiated. Finally, a parliamentary
initiative, currently under discussion, enables 10
voluntary municipalities to offer a job in the field
of social economy to long-term unemployed
workers.
The strengthening of targeted active labour
market policy measures has contributed to
stabilising youth unemployment. The youth
unemployment rate increased from 24.5 % in the
third quarter of 2014 to 25.2 % in the third quarter
of 2015, above the 20.2 % EU average. Young
people with a low level of qualification are
particularly hit by unemployment (Graph 3.2.3).
At ISCED 0-2 level, they face a 39.6 %
unemployment rate (above the EU average of
27.1 %). To address the difficulty of integrating
them into the labour market, the number of youth-
targeted subsidised contracts for the low qualified
(‘emplois d’avenir’) has been increased to reach
125 500. More than 75 % are in the non-market
sector (+ 19 % between August 2014 and March
2015). Although these contracts have a positive
short-term effect on employment, there are
concerns about whether they lead to lasting
inclusion in the labour market, notably due to the
lack of training elements.

3.2. Labour market, education and social situation
70
Graph 3.2.3: Youth unemployment rate by education
compared to unemployment in France
(1) International Standard Classification of Education
Developed (ISCED). ISCED 0-2 corresponds to pre-primary,
primary and lower secondary education, ISCED 3-4 to
upper secondary and post-secondary non-tertiary
education, ISCED 5-6 to tertiary education.
Source: Eurostat
Counselling is also being stepped up, but
integrating young people into the labour
market remains problematic. France has
developed a wide range of measures for the ‘Youth
Guarantee’ (86
). However, there is a lack of a
comprehensive monitoring system and the
visibility is generally low with no coordinated
communication strategy. To help young people
facing multiple obstacles in finding work, the
experimental scheme youth guarantee (‘garantie
jeunes’), launched in October 2013 and managed
by the Missions locales, has been extended to
50,000 young people in 2015 and is projected to
reach 60,000 in 2016 and 100,000 in 2017. The
PES has also developed a special individual and
group counselling offer for young people
(‘accompagnement intensif jeunes’) with 740
counsellors at the end of 2015. An agreement
between the State and the regions also aims to
better coordinate regional efforts targeted at early
school leavers. This agreement is part of the broad
action plan to fight early school leaving, launched
under the ongoing education reform.
(86) Council recommendation of 22 April 2013 by which all
young NEET (Not in Education, Employment, or Training)
below 25 years of age should be proposed within 4 months of becoming unemployed or leaving education a good
quality offer for a job, a traineeship, an apprenticeship or a
training.
Education and training
Educational inequalities in France have been
widening for more than a decade due to a sharp
decline in the results of low achievers. The 2012
PISA results were average in comparison to other
countries but inequalities linked to the socio-
economic background are among the highest in
OECD countries. At 9 % in 2014, the French
national target for the early-school leaving rate has
been reached but masks large disparities between
regions and sub-groups. Moreover, despite a
decreasing trend, between 2010 and 2012, 15 % of
young people left education with at most a lower
secondary education qualification. Male students,
initial vocational education and training (IVET)
pupils and students having a migrant background
are overrepresented. The latters face a higher risk
of prematurely leaving education or to be oriented
towards educational pathways which are less
valued. They also experience a more difficult
transition from education to work. This
particularly applies to women.
The ongoing reform of compulsory education
aims to address those challenges, focusing on
their prevention, but the full implementation is
yet to come. The November 2015 report (87
) on the
follow-up to the reform calls to pursue efforts to
reach the expected benefits and to ensure an
effective implementation (see also Section 2.7).
Moreover, the implementation of the middle
school reform to come into force in September
2016 is challenging. The reform entails new
programmes, new pedagogical approaches and a
reorganisation of instruction time with greater
school autonomy.
Teacher training and support are key levers for
delivering the expected results. In France, the
proportion of teachers undertaking professional
development activities is below the EU average
and the average duration was shorter (88
). In
particular, collaborative teaching and peer
mentoring are not well developed and a limited
proportion of teachers seems to participate in
training for teaching in a multicultural or
multilingual setting (3.6 %). The initial teacher
(87) Comité de suivi de la Loi de refondation de l’école,
‘Rapport annuel au Parlement’, November 2015. (88) OECD (2013), Teaching and Learning International
Survey, TALIS.
0
5
10
15
20
25
30
35
40
45
00 01 02 03 04 05 06 07 08 09 10 11 12 13 14
%
15-24 years, all 15-24 years, ISCED 0-2
15-24 years, ISCED 3-4 15-24 years, ISCED 5-6
unemployment rate, all ages

3.2. Labour market, education and social situation
71
education reform requires further improvements
and measures taken to ameliorate continuous
professional training are still at an early stage. In
this respect, the key challenges relate to the
adaptation of teacher training programmes in terms
of relevance to a school needs and context, in
terms of quantity, and link with research (89
).
A recent evaluation (90
) pleads for significantly
upscaling the link between education and
labour market needs. Some recent measures for
secondary education pupils aim to help them
define their education and professional path,
namely with a new (‘parcours avenir’) as from
September 2015. Moreover, a set of 12 measures
to strengthen the link between education and
enterprises was announced in December 2015.
These measures encompass the development of
existing initiatives such as the centre for careers
and qualifications (‘campus des métiers et des
qualifications’) as well as new measures aiming to
support work experiences for students (‘stages’)
and training activities for school leaders.
The recourse to apprenticeship is decreasing,
especially for low-qualified categories, while the
governance of the apprenticeship system
remains fragmented. On 18 January 2016, an
extension of apprenticeship to new qualifications
was announced, enabling access throughout the
year, accompanied by increased cooperation
between apprenticeship and vocational education
structures. The number of registered apprentices
during the school year 2014-2015 was slightly
above 400,000, far away from the national
objective of 500,000 contracts for 2017 despite the
first signs of improvement observed at the end of
2015. The trend is more negative for ISCED 0-2
level (below ‘baccalauréat’), with a decline in the
entry rate of 7.1 %. Among the reasons that could
explain this declining trend are competition with
newly created schemes such as the ‘emplois
d’avenir’ signed in the market sector, as well as
the complex governance of the apprenticeship
system. While the Sapin law of 5 March 2014
improved the governance of the system by
(89) Cour des Comptes (2015), ‘La formation continue des
enseignants’, April 2015. (90) Demontès, C. (2015), ‘Evaluation du partenariat de
l’éducation nationale et de l’enseignement supérieur avec
le monde économique pour l’insertion professionnelle des jeunes’, Final Report, October 2015.
substantially reducing the number of actors
collecting the apprenticeship tax (‘taxe
d’apprentissage’), such number is still high.
Moreover, the coordination of different regional
strategies remains insufficient. There is also no
specific financial incentive to take low-qualified
apprentices, while studies show that recourse to
apprenticeship by firms depend on cost and benefit
analyses (91
).
Graph 3.2.4: Evolution of number of apprenticeships by
level 1996-2014
Source: French Ministry for National Education
Jobseekers access to training remains limited,
although new supporting measures have been
taken since 2013. The access rate to training of
jobseekers stood at 9.5 % in 2013, roughly stable
since 2011, despite two main initiatives under
implementation. First, the scheme priority
trainings for employment (‘formations prioritaires
pour l’emploi’) was launched in 2013, with the
aim to provide training to jobseekers in sectors
presenting specific needs in terms of workforce.
This scheme involved 100,000 people in 2015 and
new announcements made on 18 January would
increase it to 500,000 in 2016, bringing the total
number of jobseekers training over one million.
The first results for 2014 are positive, with 57 % of
the jobseekers trained being employed six months
after the end of the training. Second, since January
(91) Mühlemann, S., Schweri, J., Winkelmann R. and S.C.
Wolter (2007), ‘An empirical analysis of the decision to train apprentices’, Labour, Review of Labour Economics
and Industrial Relations, Vol. 21, No. 3.
0
50,000
100,000
150,000
200,000
250,000
300,000
350,000
400,000
450,000
500,000
96 97 98 99 00 01 02 03 04 05 06 07 08 09 10 11 12 13 14
French Level II & I (ISCED 6-8) French Level III (ISCED 5)
French Level IV (ISCED 4) French Level V (ISCED 3)

3.2. Labour market, education and social situation
72
2015 jobseekers and employed workers can create
a personal training account (‘compte personnel de
formation’), where training activities may be co-
financed by the PES or by firms. Its take-up
increased during the year, with more than 2 million
personal training accounts opened and 126,000
training projects validated before the end of 2015.
The quality of the training provided remains
key to improve the matching between
vocational training and firms’ needs. With only
40 % of workers having a job in line with their
professional qualification, training is essential to
give workers more job-specific and organisational
knowledge. The law of 5 March 2014 also granted
to the organisms financing vocational training
activities (‘organismes paritaires collecteurs
agrées’) the power to verify that training activities
correspond to trainees’ needs, although not setting
a national quality evaluation and a certification
system for proposed trainings. No special attention
is devoted to some emerging sectors, such as the
digital economy, where the demand seems higher
than the supply of trained workers (92
).
Social policies
France fares better than the EU average on
poverty, social exclusion and inequalities.
France’s figures stand above the EU average, with
18.6 % of the population at risk of poverty or
social exclusion in 2014 against 24.4 % for the EU
and for the three EU 2020 poverty and social
exclusion indicators. The impact of social transfers
on poverty reduction remains high, at 44.6 %,
compared with the EU average of 34.4 %. The
intensity of poverty, as calculated by national
figures, has seen a decrease from a peak of 21.2 %
in 2012 to 19.8 % in 2013.
However, some more vulnerable categories still
need special attention. While the poverty rate
among unemployed people decreased significantly
in 2014 (from 35.6 % in 2013 to 31.2 % in 2014,
against the EU average of 47.4 % in 2014), the
increasing proportion of part-time workers,
particularly those who earn close to the statutory
(92) Rouzier-Deroubaix, A. and C. Ville (2015), ‘Les besoins
de formation non satisfaits au regard des besoins de l’économie: la problématique des formations émergentes
ou rares’, Inspection générale des affaires sociales, Final
Report, July 2015.
minimum wage, translated into an increase of in-
work poverty risk since 2010 (7.8 % in 2013 and
8 % in 2014, compared to 6.5 % in 2010), reaching
13.4 % in 2014 for part-time workers. Moreover,
the situation for the most vulnerable categories,
including children, young people and single-parent
families, remains of concern, with poverty rates of
17.6 %, 21.6 % and 35.0 % respectively in 2014.
The problem of social segregation in some
suburban zones (93
) of cities concerns socially
disadvantaged people and in particular non-EU
nationals (aged 18 or more), who are more affected
by poverty and social exclusion (50.5 % in 2014)
than French nationals (16.5 %).
The implementation of the multiannual
antipoverty plan adopted in January 2013 is
progressing. The law on social dialogue of August
2015 merged two wage support schemes (‘revenu
de solidarité active activité’ and the ‘prime pour
l’emploi’), into a single bonus (‘prime d’activité’),
accessible also to less than 25 years old, contrarily
to the previous ‘revenu de solidarité active
activité’. Merging the two wage support schemes
as of 1 January 2016 aims at reinforcing the
activation component of the new bonus and at
increasing its take-up by the households at the
bottom of the wage scale. The amount of the
minimum income for non-working people (‘revenu
de solidarité active socle’) was raised by 2 % in
real terms for the third time in September 2015.
These measures complemented the other actions
taken to reduce the tax burden on low incomes,
through a tax credit in 2014 and the withdrawal of
the bottom layer of income tax in 2015, further
extended to benefit 12 million fiscal households in
2016. A second assessment of the government’s
action plan against poverty recommends to
strengthen and to better manage emergency shelter
solutions, to increase the supply of affordable
social housing for very low income households
and to better target single parent families through
childcare facilities.
(93) Insee (2015), ‘Une pauvreté très présente dans les villes-
centres des grands pôles urbains’, Insee Première, No. 1552, Juin 2015. See also Bertelsmann Stiftung (2015),
Social justice in the EU, Report 2015.

73
Innovation capacity
According to the European Commission’s
Innovation Union Scoreboard (2015), France is
an innovation follower and is ranked 10th
, just
above the EU average. Limited progress has been
made over the past years and French innovation
performance is still lower than the EU average in
some indicators measuring firm’s innovation
activities and the economic impact of these
activities (non-R&D innovation expenditure,
Community designs and trademarks, exports of
knowledge-intensive services) (94
). In addition, the
take-up of digital technologies by the overall
economy, in particular businesses, is weak (see
Section 3.2). France ranks 15th
among Member
States as regards the EU Digital Economy and
Society Index and its performance is just above EU
average.
Graph 3.3.1: French R&D intensity (% of GDP)
Source: Eurostat
R&D intensity, an important indicator of
innovation efforts, has been on an increasing
trend during the last decade. Total R&D
intensity (R&D expenditure over GDP) of the
French economy stood at 2.3 % of GDP in 2014,
showing a steady but slow increase from its 2008
level (2.06 %), including throughout the crisis
years. Business R&D expenditure has increased
from the pre-crisis period and it stood at 1.5 % of
(94) European Commission (2015), Innovation Union
Scoreboard 2015.
GDP in 2014, compared to 1.3 % in 2008 and
2000. Public investment in R&D has been stable
since 2009 and has amounted to 0.8 % of GDP in
2014 (Graph 3.3.1).
However, R&D intensity is lagging behind EU
innovation leaders, in particular private R&D.
France scores notably below Germany (2.8 %),
and Austria and the Nordic countries (3 % and
above) (Graph 3.3.2). The lower private R&D
intensity in France compared with the four main
leaders accounts for a large part of this gap. France
is also lagging behind in terms of higher education
expenditure on R&D. As a result, France is not on
track to meet its national EU2020 target of 3 % of
GDP devoted to R&D.
Graph 3.3.2: R&D intensity by source (2014) (% of GDP)
Source: European Commission
The structural evolution of the economy is not
favourable to private R&D-intensive activities.
R&D intensity is particularly high in the
manufacturing sector (it amounted to 7.1 % in
2012), but the share of this sector in the total
business value added of the economy is shrinking
(11.3 % in 2012, down from 12.7 % in 2007 for a
negative average annual growth rate of -2.2 % over
the period). This trend has been more significant in
R&D intensive subsectors such as motor vehicles
(-5.9 % per year), computers, electronics and
optical (-5 %) and pharmaceuticals (-3.6 %). In
addition, most of the R&D intensive
manufacturing subsectors have been reducing
0.0
0.5
1.0
1.5
2.0
2.5
05 06 07 08 09 10 11 12 13 14
R&
D inte
nsity
Total R&D Intensity Business R&D Intensity
Public R&D Intensity
0.0
0.5
1.0
1.5
2.0
2.5
3.0
3.5
SE FI DK AT DE FR IT ES
Business R&D Government R&D Higher Education
3.3. INNOVATION

3.3. Innovation
74
R&D intensity on average, with the exception of
machinery & equipment (+7.4 %).
Compared to other EU countries, the quality of
France’s public research is average. Several
reforms have been introduced, such as the creation
of the high council for evaluation of research and
higher education in 2013, the higher education
institutions and university communities (COMUE)
aiming to improve the coordination of education
offer and research strategies the same year, and the
adoption of the national research strategy in 2015.
However, France keeps lagging behind the EU best
performers, as suggested by the average impact
factor of scientific publications and their share in
the most 10 % cited worldwide (France ranks 11th
and 13th
respectively).
Public support to innovation
Public support to innovation has increased
twofold over the past 10 years to reach 0.5 % of
GDP in 2014 (95
). Public support to private R&D
activities enjoys the largest part of French
innovation policy. It amounted to 0.4 % of GDP in
2011, making France the country with the third
largest public transfers to business R&D
worldwide (96
). This support is primarily indirect
through tax incentives (Graph 3.3.3). In particular,
the research tax credit ‘crédit d’impôt recherche’
(CIR) has increased massively since the 2008
reform and accounted for EUR 5.3 billion of
foregone revenue (0.3 % of GDP) in 2015 (97
),
making it the second largest tax expenditure after
the CICE. In addition, the innovative start-ups
scheme (‘jeunes entreprises innovantes’ (JEI))
reduces the cost of hiring R&D staff through tax
incentives in SMEs less than 8 years of age. It
represented a total amount of EUR 175 million in
2015 (98
).
The CIR is effective in supporting private R&D,
but its impact on innovation remains to be
demonstrated. The results of a recent
counterfactual evaluation show that firms which
(95) Pisani-Ferry, J. et al., (2016), Quinze ans de politiques
d’innovation en France, Rapport de la Commission nationale d’évaluation des politiques d’innovation, January.
(96) OCED (2013), Science, technology and Industry
Scoreboard. (97) Annexes to the 2016 Draft Budgetary Plan.
(98) 2015 National Reform Programme, estimation.
benefited from the CIR significantly increased
their R&D expenditures after the 2008 reform of
the instrument as compared to firms that did not
apply for it. Overall, figures show a substantial
increase of private R&D in 2009 (Graph 3.3.1) and
a positive trend afterwards, reversing the negative
path since 2002. However, the same study finds a
very modest impact of the CIR in terms of
innovation since the 2008 reform when comparing
innovation outcome for similar firms which
benefited from this instrument and for those which
did not (99
). However, results need to be refined at
a later stage, as data included in this study stops in
2010 and innovation is measured by the number of
patents at firm level which may take time to
materialise. In addition, the CIR has only been
extended to non-R&D innovation expenditure in
2013, through the creation of the innovation tax
credit (‘crédit d’impôt innovation’), a tool
dedicated to SMEs. It scope remains modest in
comparison to the R&D component of the CIR
(EUR 190 million in 2015, as estimated by the
2015 National Reform Programme).
(99) Bozio A., Irac D., Py L. (2014), Impact of research tax
credit on R&D and innovation: evidence from the 2008 French reform, Banque de France, Document de travail
n°532, December.

3.3. Innovation
75
Graph 3.3.3: Public support to private R&D
Source: Ministry of higher education and research and
Base GECIR juin 2015, MENESR-DGRI-C1
Note: *Data on public financing in 2013 is provisional, Data
on CIR for 2013 includes CIR and CII (EUR 0.069 billion)
Stability of the CIR has been preferred over the
correction of imperfections in its design. The
instrument has been for the most part unchanged
since the major 2008 reform, which increases its
business friendliness. However, its design is not
well suited to the needs and characteristics of
digital SMEs and start-ups (100
). In addition,
uncertainties related to its scope create recovery
risks, since the eligibility of expenditure is only
established by the administration ex post, and
recovery may take place up to three years
following the tax statement. Recent clarification
and simplification measures adopted in the context
of the simplification shock (such as the ‘rescrit
roulant’) are steps in addressing these issues.
There has been an inflation and instability of
public schemes supporting innovation, raising
concerns as regards overall coordination and
consistency. The number of such schemes has
increased from 30 in 2000 to 62 in 2015, as
recently mapped out by the national commission
for the assessment of innovation policies. The
recently created public investment bank BPI
France dedicated EUR 1.1 billion to financing
innovation in 2014, 8 % of its total budget
(100) Conseil d’Analyse Economique (2015), Economie
numérique, November.
available for business support (101
). Other recent
initiatives include new industrial France (‘nouvelle
France industrielle’) and ‘French Tech’
(introduced in 2013) or the second phase of the
programme for future investment (‘programme
d’investissement d'avenir’) launched in 2014
(EUR 12 billion over 10 years). As a result, the
support system is complex, targets an overly
ambitious number of policy goals, and lacks clarity
for companies. In addition, the subnational level is
playing an increasing role (5.4 % of total public
support in 2014, and 15.2 % excluding tax
incentives (102
), but there is no sufficient
confluence between R&D national policy and the
regional specialisation strategies developed
locally. There is also little involvement of private
actors in the design of innovation policy and its
governance.
Policy commitments have been taken to
strengthen and improve the efficiency of
innovation policies. This is the goal of the plan
‘Nouvelle donne pour l’innovation’ adopted in
2013 but which has not so far delivered tangible
results. The national commission for the
assessment of innovation policies created in June
2014 is currently evaluating existing policy tools,
but it is not clear how and if the findings of the
Commission will be translated into policy
measures.
Furthermore, innovation performance is
hindered by the framework conditions and the
business environment. High and complex
corporate taxation (see Section 3.4), but also
product market rigidities limit corporate capacity
to finance investments and mobilise the human
resources required for innovation (103
). Finally, the
small size of firms and lack of midcaps (see
Section 3.2) may also be an obstacle to innovation.
(101) BPI France (2015), Bilan d’Activité 2014.
(102) Pisani-Ferry, J. et al, (2016), op. cit.
(103) OECD (2014), OECD Reviews of Innovation Policy:
France 2014, OECD Publishing, Paris.
0.0
0.1
0.2
0.3
0.4
0.5
00 01 02 03 04 05 06 07 08 09 10 11 12 13*
% of real GDP
Direct financing CIR
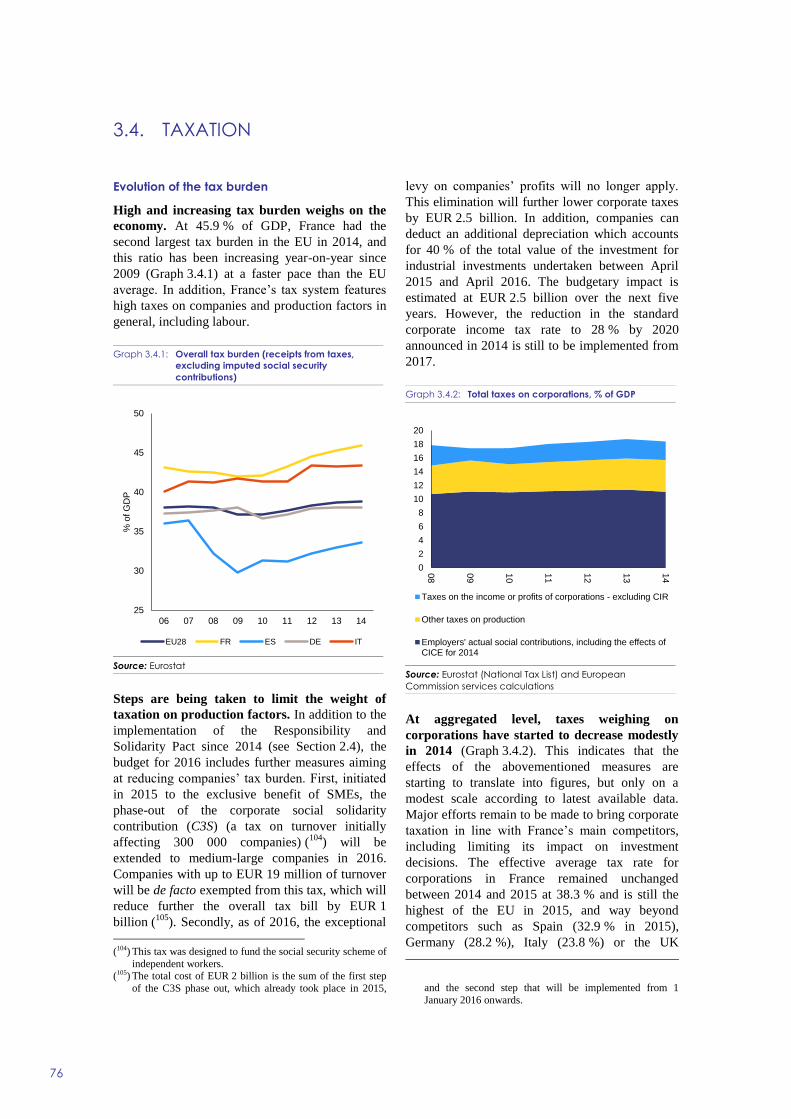
76
Evolution of the tax burden
High and increasing tax burden weighs on the
economy. At 45.9 % of GDP, France had the
second largest tax burden in the EU in 2014, and
this ratio has been increasing year-on-year since
2009 (Graph 3.4.1) at a faster pace than the EU
average. In addition, France’s tax system features
high taxes on companies and production factors in
general, including labour.
Graph 3.4.1: Overall tax burden (receipts from taxes,
excluding imputed social security
contributions)
Source: Eurostat
Steps are being taken to limit the weight of
taxation on production factors. In addition to the
implementation of the Responsibility and
Solidarity Pact since 2014 (see Section 2.4), the
budget for 2016 includes further measures aiming
at reducing companies’ tax burden. First, initiated
in 2015 to the exclusive benefit of SMEs, the
phase-out of the corporate social solidarity
contribution (C3S) (a tax on turnover initially
affecting 300 000 companies) (104
) will be
extended to medium-large companies in 2016.
Companies with up to EUR 19 million of turnover
will be de facto exempted from this tax, which will
reduce further the overall tax bill by EUR 1
billion (105
). Secondly, as of 2016, the exceptional
(104) This tax was designed to fund the social security scheme of
independent workers. (105) The total cost of EUR 2 billion is the sum of the first step
of the C3S phase out, which already took place in 2015,
levy on companies’ profits will no longer apply.
This elimination will further lower corporate taxes
by EUR 2.5 billion. In addition, companies can
deduct an additional depreciation which accounts
for 40 % of the total value of the investment for
industrial investments undertaken between April
2015 and April 2016. The budgetary impact is
estimated at EUR 2.5 billion over the next five
years. However, the reduction in the standard
corporate income tax rate to 28 % by 2020
announced in 2014 is still to be implemented from
2017.
Graph 3.4.2: Total taxes on corporations, % of GDP
Source: Eurostat (National Tax List) and European
Commission services calculations
At aggregated level, taxes weighing on
corporations have started to decrease modestly
in 2014 (Graph 3.4.2). This indicates that the
effects of the abovementioned measures are
starting to translate into figures, but only on a
modest scale according to latest available data.
Major efforts remain to be made to bring corporate
taxation in line with France’s main competitors,
including limiting its impact on investment
decisions. The effective average tax rate for
corporations in France remained unchanged
between 2014 and 2015 at 38.3 % and is still the
highest of the EU in 2015, and way beyond
competitors such as Spain (32.9 % in 2015),
Germany (28.2 %), Italy (23.8 %) or the UK
and the second step that will be implemented from 1
January 2016 onwards.
25
30
35
40
45
50
06 07 08 09 10 11 12 13 14
% o
f G
DP
EU28 FR ES DE IT
0
2
4
6
8
10
12
14
16
18
20
08
09
10
11
12
13
14
Taxes on the income or profits of corporations - excluding CIR
Other taxes on production
Employers' actual social contributions, including the effects ofCICE for 2014
3.4. TAXATION

3.4. Taxation
77
(21.5 %). This is particularly worrying as high
corporate income taxation increases the cost of
capital and deters investment.
Complexity of the tax system
Little effort has been made to simplify the tax
system. In 2014, the general inspection of finances
(inspection générale des finances) identified more
than one hundred inefficient taxes, which have no
or only a low yield. The 2016 budget provides for
deleting only two (for a total amount of EUR 10
million), which is less than in 2015, but also
creates five new taxes assigned to the funding of
industrial research centres and the monitoring of
transport activities.
Personal income taxation is particularly
complex. Two distinct tools for taxing income
with different logics coexist: one proportional,
individual-based, with a rather high yield
(‘contribution sociale généralisée’), the other one
progressive, family-based and subject to many
derogations limiting considerably its yield and
concentrated on slightly less than 50 % of the
households (‘impôt sur le revenu’). In addition,
France is the only EU Member State where
personal income tax (‘impôt sur le revenu’) is not
paid in the year when the income is earned.
Levying this tax therefore comes at a significant
administrative cost for the tax administration (106
).
In addition, the absence of real-time labour income
taxation limits the impact of automatic stabilisers
and the efficiency of tax policy. It is a source of
uncertainty for households, leading them to set
aside precautionary savings (107
) which could
otherwise be pumped into the economy.
Steps are being taken towards the possible
introduction of a withholding tax on income
payments. The 2016 budget law includes a set of
technical measures to implement in 2018 a
withholding tax system for the personal income
tax, as announced by the government in June 2015.
The potential for achieving efficiency gains is high
(106) Wolf, M. (2015), Retenue à la source : le choc de
simplification à l’épreuve du conservatisme administratif, Terra Nova, 12 May. The share of the tax administration
resources devoted to collecting the impôt sur le revenu is
estimated at 20 % or EUR 1.7 billion in 2013. (107) Conseil des Prélèvements Obligatoires (2012),
Prélèvements à la source et impôts sur le revenu, February.
but will depend on the practicalities of the reform.
Importantly, in a context of an already burdensome
business environment, there is a need to minimise
the potential cost of this reform for employers.
Tax base and taxes on consumption
In 2015, tax expenditures, CICE excluded,
reached EUR 72 billion (2.5 % of GDP) and are
overall on the rise (Box 2.5.2). The 2016 budget
provides for a modest decrease of 1.2 %. Despite
the commitment in the 2014-2019 public finance
programming bills to regularly assess tax
expenditures, their elimination is slow: only three
were phased out in 2015, and the 2016 budget
eradicates only another one (for a total amount of
EUR 3 million). It creates a new tax expenditure
for performing arts businesses without a time limit
and extends some existing ones, such as the tax
expenditure for the cinema industry.
Graph 3.4.3: Total taxes on consumption
Source: Eurostat
Taxes on consumption, including VAT, are low
as compared to the rest of the EU and
increasing at a very low pace. Total taxes on
consumption increased slightly year-on-year since
2008 when they amounted to 10.4 % to reach 11 %
of GDP in 2014 (Graph 3.4.3). A major component
of consumption taxes, VAT yields relatively low
revenues: Despite the 2014 reform of the VAT
system, revenues from VAT remain relatively low
as a share of GDP (6.9 % in 2014, EU average:
7 % - rank 21st), and as percentage of total taxation
0
2
4
6
8
10
12
08 09 10 11 12 13 14
% of GDP
Taxes on consumption Value added tax
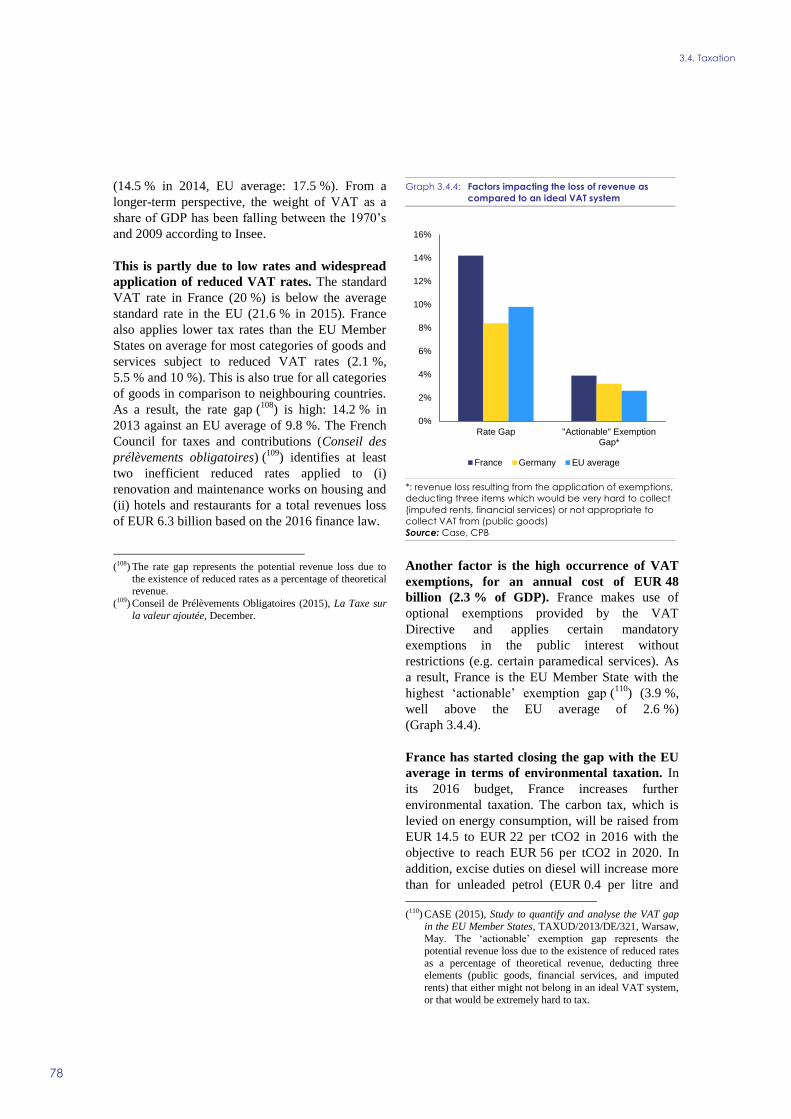
3.4. Taxation
78
(14.5 % in 2014, EU average: 17.5 %). From a
longer-term perspective, the weight of VAT as a
share of GDP has been falling between the 1970’s
and 2009 according to Insee.
This is partly due to low rates and widespread
application of reduced VAT rates. The standard
VAT rate in France (20 %) is below the average
standard rate in the EU (21.6 % in 2015). France
also applies lower tax rates than the EU Member
States on average for most categories of goods and
services subject to reduced VAT rates (2.1 %,
5.5 % and 10 %). This is also true for all categories
of goods in comparison to neighbouring countries.
As a result, the rate gap (108
) is high: 14.2 % in
2013 against an EU average of 9.8 %. The French
Council for taxes and contributions (Conseil des
prélèvements obligatoires) (109
) identifies at least
two inefficient reduced rates applied to (i)
renovation and maintenance works on housing and
(ii) hotels and restaurants for a total revenues loss
of EUR 6.3 billion based on the 2016 finance law.
(108) The rate gap represents the potential revenue loss due to
the existence of reduced rates as a percentage of theoretical revenue.
(109) Conseil de Prélèvements Obligatoires (2015), La Taxe sur
la valeur ajoutée, December.
Graph 3.4.4: Factors impacting the loss of revenue as
compared to an ideal VAT system
*: revenue loss resulting from the application of exemptions,
deducting three items which would be very hard to collect
(imputed rents, financial services) or not appropriate to
collect VAT from (public goods)
Source: Case, CPB
Another factor is the high occurrence of VAT
exemptions, for an annual cost of EUR 48
billion (2.3 % of GDP). France makes use of
optional exemptions provided by the VAT
Directive and applies certain mandatory
exemptions in the public interest without
restrictions (e.g. certain paramedical services). As
a result, France is the EU Member State with the
highest ‘actionable’ exemption gap (110
) (3.9 %,
well above the EU average of 2.6 %)
(Graph 3.4.4).
France has started closing the gap with the EU
average in terms of environmental taxation. In
its 2016 budget, France increases further
environmental taxation. The carbon tax, which is
levied on energy consumption, will be raised from
EUR 14.5 to EUR 22 per tCO2 in 2016 with the
objective to reach EUR 56 per tCO2 in 2020. In
addition, excise duties on diesel will increase more
than for unleaded petrol (EUR 0.4 per litre and
(110) CASE (2015), Study to quantify and analyse the VAT gap
in the EU Member States, TAXUD/2013/DE/321, Warsaw, May. The ‘actionable’ exemption gap represents the
potential revenue loss due to the existence of reduced rates
as a percentage of theoretical revenue, deducting three elements (public goods, financial services, and imputed
rents) that either might not belong in an ideal VAT system,
or that would be extremely hard to tax.
0%
2%
4%
6%
8%
10%
12%
14%
16%
Rate Gap "Actionable" ExemptionGap*
France Germany EU average

3.4. Taxation
79
EUR 0.071 per litre respectively), impacting the
diesel/petrol tax ratio currently standing at 65 %.
Vehicle taxation in France comes exclusively in
the shape of a registration tax, which is higher for
high CO2 emission cars, but not for diesel cars.
Also, the current system of water charging and
nitrogen/pesticide taxation provides little incentive
to improve farming practices and decrease
pesticide and nitrate contaminations, which are
major sources of water pollution and increase the
cost of water treatment.
Debt-equity bias
The difference between the costs of capital for
new equity and debt-funded investments
remains the highest in the EU in 2015
(Graph 3.4.5). This debt to equity bias results from
a favourable treatment of debt financing cost. 75 %
of net financial charges can be deducted from the
corporate tax base, but up to 100 % if such charges
do not exceed EUR 3 million, which is the case for
the large majority of businesses. As a result,
financing investment through debt remains largely
subsidised.
Such a favourable treatment of debt may not be
conducive to growth. Empirical analysis suggests
that in France, more debt is associated with slower
growth while more stock market financing
generates a positive growth effect (111
). In addition,
over-leveraged companies might aggravate
negative externalities, such as the probability of
default, the systemic risk and the social costs of
business cycle fluctuations. First and foremost, the
debt bias indirectly penalises SMEs, innovative
companies and start-ups which must often be
financed through equity-raising given their
difficulties to obtain bank loans (e.g. due to a lack
of collaterals or a lack of established reputation).
As a result, SMEs face higher financing costs due
to the asymmetric treatment between debt and
equity.
The equity market for younger and innovative
undertakings remains underdeveloped, despite
existing tax incentive schemes. The ISF PME, a
tax scheme reducing solidarity tax on wealth (ISF)
with a view to promoting investment in SME
equity is budgeted at a cost of EUR 620 million in
the 2016 finance law, making it the largest support
scheme for equity financing. As an upfront
incentive rewarding investors at the time of the
investment decision, regardless of the investment
performance, it seems well suited to finance higher
risk profiles companies. The PEA-PME, a savings
plan in shares exempting capital gains from
investment in SMEs and midcaps may be less
efficient in reaching companies with a high risk
(111) Cournède, B. and Denk, O. (2015), Finance and Economic
Gorwth in OECD and G20 countries, OECD Economics
Department Working Papers, No 1223, OECD publishing.
Graph 3.4.5: Debt-equity bias in EU Member States - 2015
Source: European Commission services’ calculations based on ZEW (2015)
-1
0
1
2
3
4
5
6
FR MT ES LU PT BE EL DE AT NL DK SK SE HR EE UK CZ FI PL HU SI CY RO LT IE LV IT BG
Percentage difference between the pre- and post tax cost of capital for new equity investment
Percentage difference between the pre- and post tax of capital for debt-funded investment
Debt Bias 2015

3.4. Taxation
80
profile. As a back-end instrument, it rewards
exclusively successful investments, which in turn
may also come at a lower budgetary cost. It has
failed to attract considerable savings since its
creation in 2014 (about EUR 230 million
according to PME Finance), leading to a
clarification and broadening of eligibility criteria
in the 2016 finance law.

81
2015 Country-Specific recommendations (CSRs)
CSR 1: Ensure effective action under the excessive
deficit procedure and a durable correction of the
excessive deficit by 2017 by reinforcing the
budgetary strategy, taking the necessary measures for
all years and using all windfall gains for deficit and
debt reduction. Specify the expenditure cuts planned
for these years and provide an independent evaluation
of the impact of key measures.
France has made limited progress in
addressing CSR 1 (this overall assessment of
CSR 1 does not include an assessment of
compliance with the Stability and Growth
Pact):
Limited progress has been made in
specifying the expenditure cuts planned up
to 2017. The latest draft budgetary plan
specified the expenditure cuts planned for
2016, but not for 2017. Moreover, no
independent evaluation of the impact of
the key measures included in the draft
budgetary plan for 2016 was provided, due
to the existence of many evaluations.
CSR 2: Step up efforts to make the spending review
effective, continue public policy evaluations and
identify savings opportunities across all sub-sectors
of general government, including on social security
and local government. Take steps to limit the rise in
local authorities’ administrative expenditure. Take
additional measures to bring the pension system into
balance, in particular ensuring by March 2016 that
the financial situation of complementary pension
schemes is sustainable over the long term.
France has made some progress in addressing
CSR 2:
Some progress has been made in making
the spending review effective. The
spending reviews may become an
important tool to identify efficiency gains
in public expenditure, despite the limited
amount of savings generated by the first
round of reviews that were considered in
the draft budget for 2016.
Some progress has been made on limiting
the rise in local authorities’ administrative
expenditure. The spending norm
(ODEDEL) for local authorities has been
further specified in the draft budgetary
plan for 2016, but is indicative rather than
binding, while its in-year execution has not
been monitored yet.
Substantial progress has been made for
the long-term sustainability of
complementary pension schemes. On 30
(112) The following categories are used to assess progress in implementing the 2015 country-specific recommendations:
No progress: The Member State has neither announced nor adopted any measures to address the CSR. This category also
applies if a Member State has commissioned a study group to evaluate possible measures. Limited progress: The Member State has announced some measures to address the CSR, but these measures appear insufficient
and/or their adoption/implementation is at risk.
Some progress: The Member State has announced or adopted measures to address the CSR. These measures are promising, but not all of them have been implemented yet and implementation is not certain in all cases.
Substantial progress: The Member State has adopted measures, most of which have been implemented. These measures go a
long way in addressing the CSR. Fully addressed: The Member State has adopted and implemented measures that address the CSR appropriately.
ANNEX A
Overview Table
Commitments Summary assessment (112
)
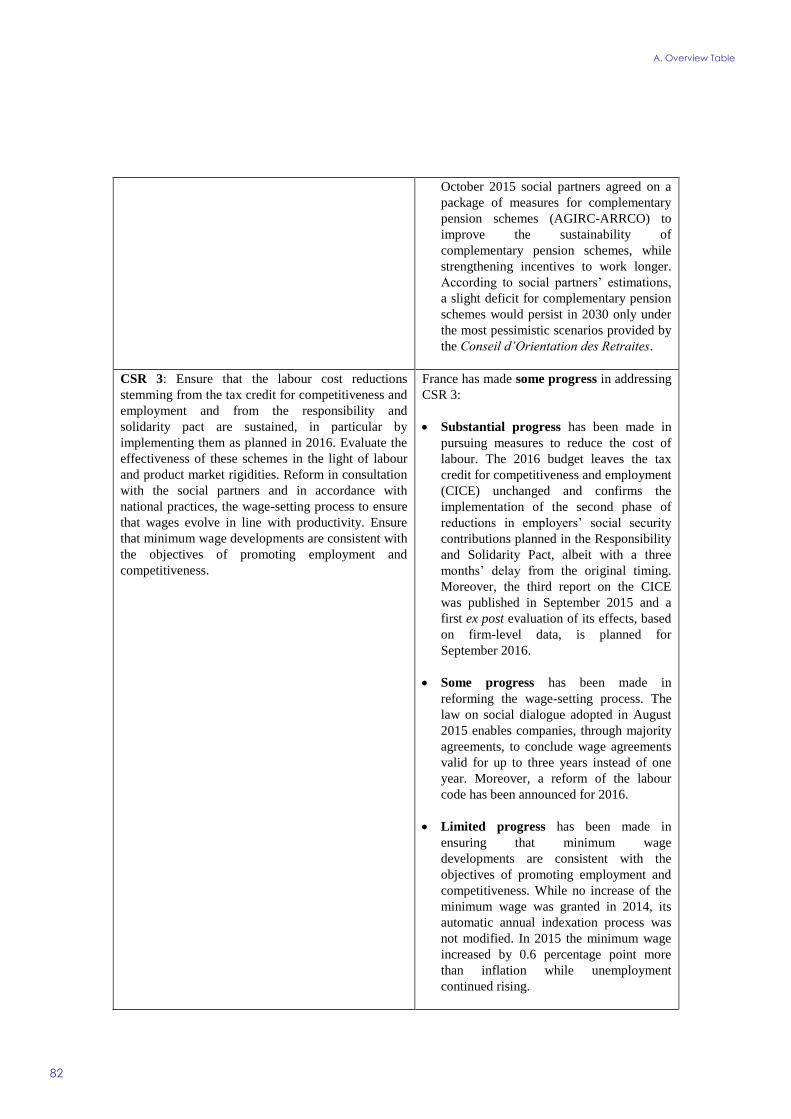
A. Overview Table
82
October 2015 social partners agreed on a
package of measures for complementary
pension schemes (AGIRC-ARRCO) to
improve the sustainability of
complementary pension schemes, while
strengthening incentives to work longer.
According to social partners’ estimations,
a slight deficit for complementary pension
schemes would persist in 2030 only under
the most pessimistic scenarios provided by
the Conseil d’Orientation des Retraites.
CSR 3: Ensure that the labour cost reductions
stemming from the tax credit for competitiveness and
employment and from the responsibility and
solidarity pact are sustained, in particular by
implementing them as planned in 2016. Evaluate the
effectiveness of these schemes in the light of labour
and product market rigidities. Reform in consultation
with the social partners and in accordance with
national practices, the wage-setting process to ensure
that wages evolve in line with productivity. Ensure
that minimum wage developments are consistent with
the objectives of promoting employment and
competitiveness.
France has made some progress in addressing
CSR 3:
Substantial progress has been made in
pursuing measures to reduce the cost of
labour. The 2016 budget leaves the tax
credit for competitiveness and employment
(CICE) unchanged and confirms the
implementation of the second phase of
reductions in employers’ social security
contributions planned in the Responsibility
and Solidarity Pact, albeit with a three
months’ delay from the original timing.
Moreover, the third report on the CICE
was published in September 2015 and a
first ex post evaluation of its effects, based
on firm-level data, is planned for
September 2016.
Some progress has been made in
reforming the wage-setting process. The
law on social dialogue adopted in August
2015 enables companies, through majority
agreements, to conclude wage agreements
valid for up to three years instead of one
year. Moreover, a reform of the labour
code has been announced for 2016.
Limited progress has been made in
ensuring that minimum wage
developments are consistent with the
objectives of promoting employment and
competitiveness. While no increase of the
minimum wage was granted in 2014, its
automatic annual indexation process was
not modified. In 2015 the minimum wage
increased by 0.6 percentage point more
than inflation while unemployment
continued rising.

A. Overview Table
83
CSR 4: By the end of 2015, reduce regulatory
impediments to companies’ growth, in particular by
reviewing the size-related criteria in regulations to
avoid threshold effects. Remove the restrictions on
access to and the exercise of regulated professions,
beyond the legal professions, in particular as regards
the health professions as from 2015.
France has made some progress in addressing
CSR 4:
Limited progress has been made in
reducing regulatory barriers to companies’
growth. The measures taken or proposed to
reduce barriers have limited impact (9 and
10 employee thresholds raised to 11) or are
temporary (additional fiscal and social
levies linked to reaching thresholds up to
50 employees have been frozen for 3
years).
Some progress has been made in
removing unjustified restrictions on access
to and the exercise of regulated
professions, notably the legal professions.
For health professions, the healthcare law
somewhat eases such restrictions and
relaxes shareholding requirements for
pharmacies. Shareholding requirements for
medical test laboratories have also been
relaxed through a recent decree. Overall, in
regulated professions authorisation
schemes persist and generally there is a
lack of transparency and comparability.
Recently measures have been announced
in the context of the simplification
programme (‘choc de simplification’) but
implementation remains to be completed.
CSR 5: Simplify and improve the efficiency of the
tax system, in particular by removing inefficient tax
expenditure. To promote investment, take action to
reduce the taxes on production and the corporate
income statutory rate, while broadening the tax base
on consumption. Take measures as from 2015 to
abolish inefficient taxes that are yielding little or no
revenue.
France has made limited progress in
addressing CSR 5:
Limited progress has been made to
simplify and improve the efficiency of the
tax system. The 2016 budget phases out
one tax expenditure (for an amount of
EUR 3 million from 2018), extends some
existing ones, and creates a new one. At
EUR 83.3 billion, their total amount is
expected to remain globally stable in 2016
(minus 1.2 % on 2015). The government
has taken a first set of technical measures
to implement a withholding tax system for
personal income tax by 2018.
Some progress has been made to reduce
the taxes on production (phasing out of
C3S) but the effective average tax rate on
corporations remains stable.

A. Overview Table
84
Limited progress has been made to raise
the tax base on consumption, indirectly
through the increase in environmental
taxation. The 2016 budget increases the
carbon tax levied on energy consumption,
from EUR 14.5 to EUR 22 per tCO2. In
addition, excise duties on fuels have
increased.
No progress has been made in abolishing
inefficient taxes. Out of the more than 100
identified by the Inspectorate-General of
Finances (‘Inspection Générale des
Finances’) in 2014, the 2016 budget
deletes two, for a total amount of EUR 10
million, and creates five new ones.
CSR 6: Reform the labour law to provide more
incentives for employers to hire on open-ended
contracts. Facilitate take up of derogations at
company and branch level from general legal
provisions, in particular as regards working time
arrangements. Reform the law creating the accords
de maintien de l’emploi by the end of 2015 in order
to increase their take-up by companies. Take action
in consultation with the social partners and in
accordance with national practices to reform the
unemployment benefit system in order to bring the
system back to budgetary sustainability and provide
more incentives to return to work.
France has made limited progress in
addressing CSR 6:
Limited progress has been made in
reducing labour market segmentation.
Higher social contributions for very short-
term contracts have failed to provide more
incentives for employers to hire on longer-
term contracts, while the overall effect of
the measures contained in the French
Small Business Act announced by Prime
Minister Manuel Valls on 9 June 2015 and
adopted as part of the 2016 budget is
unclear. A bonus of EUR 2 000 per year
for two years was recently introduced for
firms with fewer than 250 employees. This
premium, however, concerns both
permanent and fixed-term contracts of
more than six months. Finally, the reform
of the ‘justice prud’homale’ introduced by
the Macron law (‘loi Macron’) could have
reduced employers’ costs associated to
hiring an employee on a permanent rather
than a fixed-term contract but it was
overturned by the French constitutional
court.
Limited progress has been made in
facilitating the take-up of derogations at
company and branch level from general
legal provisions. The reform of the labour
regulation could grant more scope to
company and branch level agreements to
derogate from general legal provisions, but
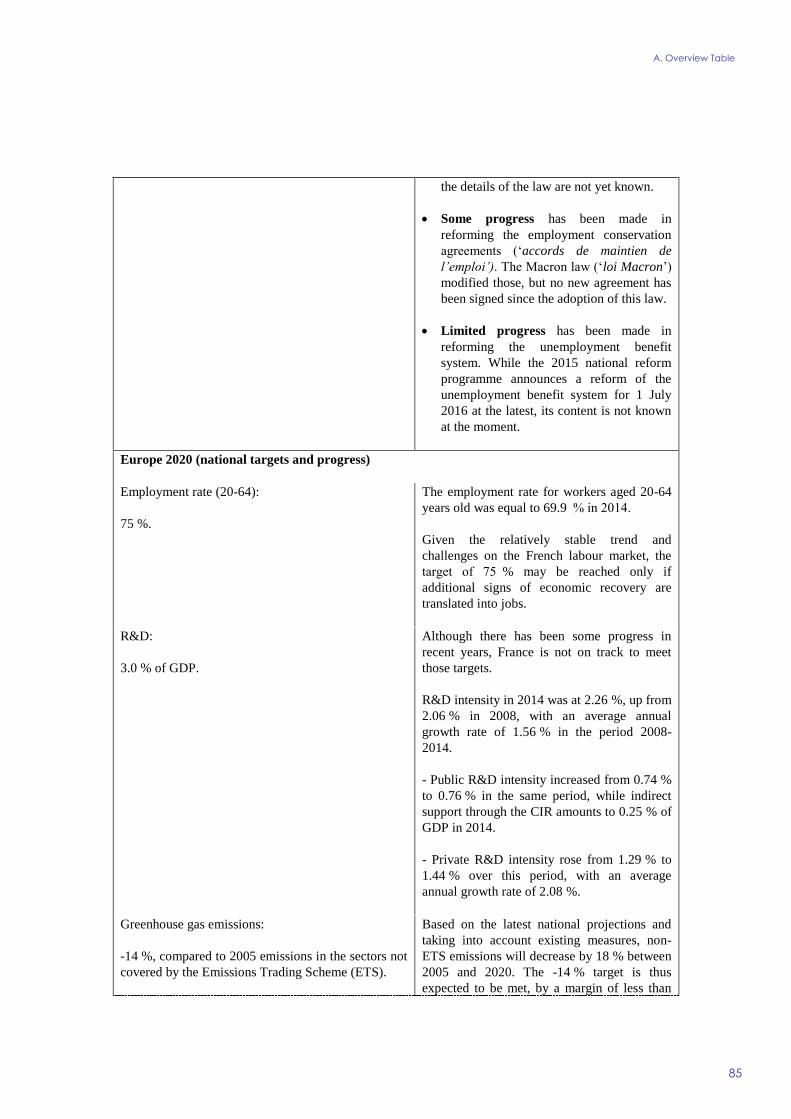
A. Overview Table
85
the details of the law are not yet known.
Some progress has been made in
reforming the employment conservation
agreements (‘accords de maintien de
l’emploi’). The Macron law (‘loi Macron’)
modified those, but no new agreement has
been signed since the adoption of this law.
Limited progress has been made in
reforming the unemployment benefit
system. While the 2015 national reform
programme announces a reform of the
unemployment benefit system for 1 July
2016 at the latest, its content is not known
at the moment.
Europe 2020 (national targets and progress)
Employment rate (20-64):
75 %.
The employment rate for workers aged 20-64
years old was equal to 69.9 % in 2014.
Given the relatively stable trend and
challenges on the French labour market, the
target of 75 % may be reached only if
additional signs of economic recovery are
translated into jobs.
R&D:
3.0 % of GDP.
Although there has been some progress in
recent years, France is not on track to meet
those targets.
R&D intensity in 2014 was at 2.26 %, up from
2.06 % in 2008, with an average annual
growth rate of 1.56 % in the period 2008-
2014.
- Public R&D intensity increased from 0.74 %
to 0.76 % in the same period, while indirect
support through the CIR amounts to 0.25 % of
GDP in 2014.
- Private R&D intensity rose from 1.29 % to
1.44 % over this period, with an average
annual growth rate of 2.08 %.
Greenhouse gas emissions:
-14 %, compared to 2005 emissions in the sectors not
covered by the Emissions Trading Scheme (ETS).
Based on the latest national projections and
taking into account existing measures, non-
ETS emissions will decrease by 18 % between
2005 and 2020. The -14 % target is thus
expected to be met, by a margin of less than
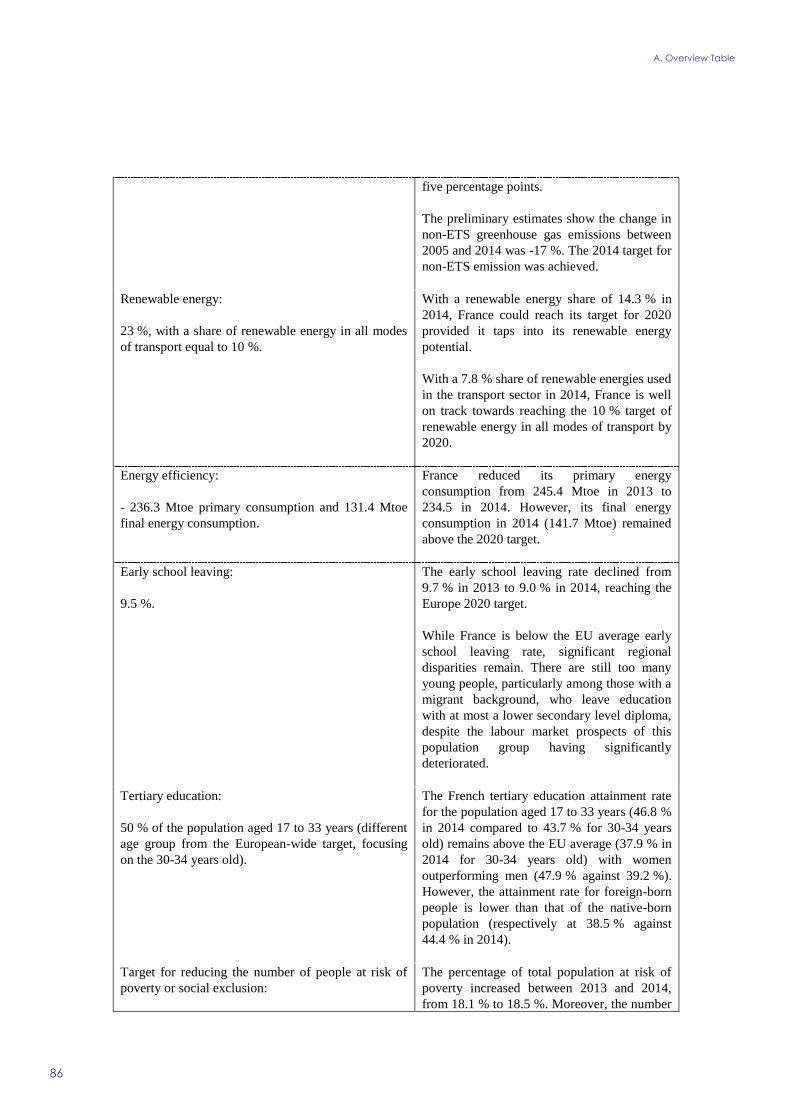
A. Overview Table
86
five percentage points.
The preliminary estimates show the change in
non-ETS greenhouse gas emissions between
2005 and 2014 was -17 %. The 2014 target for
non-ETS emission was achieved.
Renewable energy:
23 %, with a share of renewable energy in all modes
of transport equal to 10 %.
With a renewable energy share of 14.3 % in
2014, France could reach its target for 2020
provided it taps into its renewable energy
potential.
With a 7.8 % share of renewable energies used
in the transport sector in 2014, France is well
on track towards reaching the 10 % target of
renewable energy in all modes of transport by
2020.
Energy efficiency:
- 236.3 Mtoe primary consumption and 131.4 Mtoe
final energy consumption.
France reduced its primary energy
consumption from 245.4 Mtoe in 2013 to
234.5 in 2014. However, its final energy
consumption in 2014 (141.7 Mtoe) remained
above the 2020 target.
Early school leaving:
9.5 %.
The early school leaving rate declined from
9.7 % in 2013 to 9.0 % in 2014, reaching the
Europe 2020 target.
While France is below the EU average early
school leaving rate, significant regional
disparities remain. There are still too many
young people, particularly among those with a
migrant background, who leave education
with at most a lower secondary level diploma,
despite the labour market prospects of this
population group having significantly
deteriorated.
Tertiary education:
50 % of the population aged 17 to 33 years (different
age group from the European-wide target, focusing
on the 30-34 years old).
The French tertiary education attainment rate
for the population aged 17 to 33 years (46.8 %
in 2014 compared to 43.7 % for 30-34 years
old) remains above the EU average (37.9 % in
2014 for 30-34 years old) with women
outperforming men (47.9 % against 39.2 %).
However, the attainment rate for foreign-born
people is lower than that of the native-born
population (respectively at 38.5 % against
44.4 % in 2014).
Target for reducing the number of people at risk of
poverty or social exclusion:
The percentage of total population at risk of
poverty increased between 2013 and 2014,
from 18.1 % to 18.5 %. Moreover, the number

A. Overview Table
87
- 20 000 in cumulative terms since 2008. of people at risk of poverty increased by
389 000 in cumulative terms since 2008.
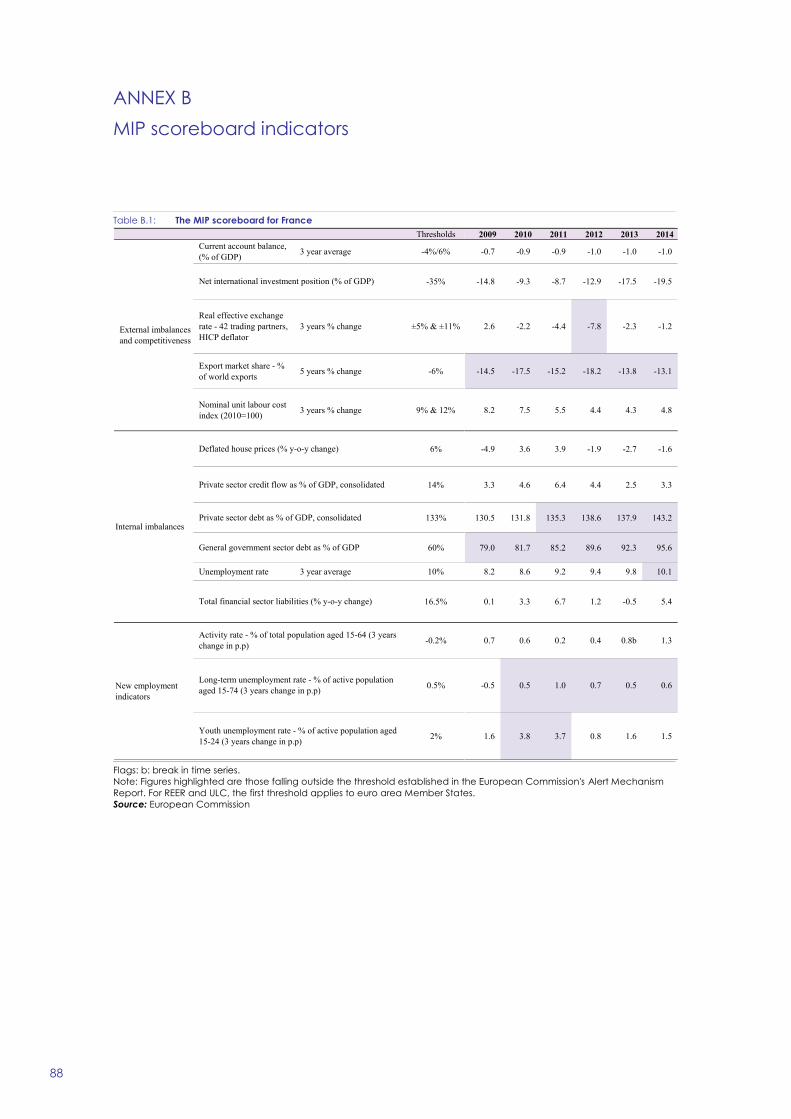
88
Table B.1: The MIP scoreboard for France
Flags: b: break in time series.
Note: Figures highlighted are those falling outside the threshold established in the European Commission's Alert Mechanism
Report. For REER and ULC, the first threshold applies to euro area Member States.
Source: European Commission
Thresholds 2009 2010 2011 2012 2013 2014
Current account balance,
(% of GDP) 3 year average -4%/6%-7.8* -0.7 -0.9 -0.9 -1.0 -1.0 -1.0
-35%-44.1* -14.8 -9.3 -8.7 -12.9 -17.5 -19.5
Real effective exchange
rate - 42 trading partners,
HICP deflator
3 years % change ±5% & ±11% 2.6 -2.2 -4.4 -7.8 -2.3 -1.2
Export market share - %
of world exports5 years % change -6% 41.0* -14.5 -17.5 -15.2 -18.2 -13.8 -13.1
Nominal unit labour cost
index (2010=100)3 years % change 9% & 12% 8.2 7.5 5.5 4.4 4.3 4.8
6% 27.9e -4.9 3.6 3.9 -1.9 -2.7 -1.6
14% 3.3 4.6 6.4 4.4 2.5 3.3
133% 130.5 131.8 135.3 138.6 137.9 143.2
60% 79.0 81.7 85.2 89.6 92.3 95.6
Unemployment rate 3 year average 10% 8.2 8.6 9.2 9.4 9.8 10.1
16.5% 0.1 3.3 6.7 1.2 -0.5 5.4
-0.2% 0.7 0.6 0.2 0.4 0.8b 1.3
0.5% -0.5 0.5 1.0 0.7 0.5 0.6
2% 1.6 3.8 3.7 0.8 1.6 1.5
External imbalances
and competitiveness
New employment
indicators
Net international investment position (% of GDP)
Deflated house prices (% y-o-y change)
Total financial sector liabilities (% y-o-y change)
Private sector credit flow as % of GDP, consolidated
Private sector debt as % of GDP, consolidated
General government sector debt as % of GDP
Activity rate - % of total population aged 15-64 (3 years
change in p.p)
Long-term unemployment rate - % of active population
aged 15-74 (3 years change in p.p)
Youth unemployment rate - % of active population aged
15-24 (3 years change in p.p)
Internal imbalances
ANNEX B
MIP scoreboard indicators
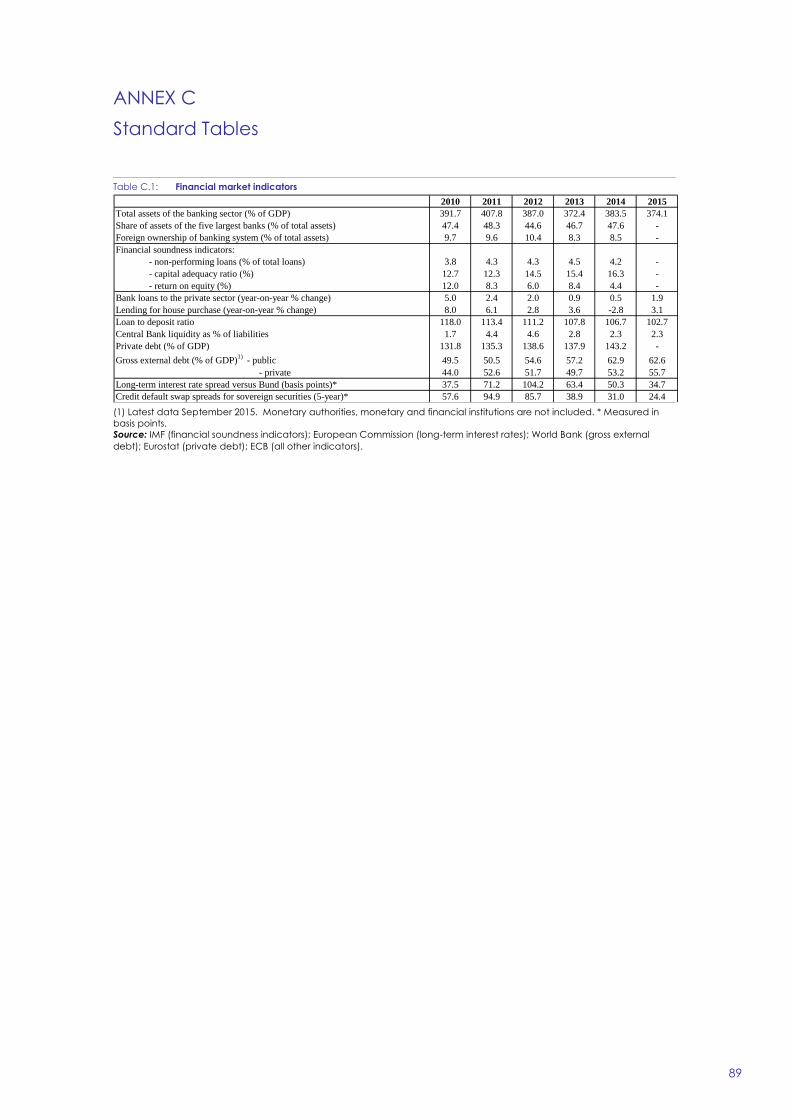
89
Table C.1: Financial market indicators
(1) Latest data September 2015. Monetary authorities, monetary and financial institutions are not included. * Measured in
basis points.
Source: IMF (financial soundness indicators); European Commission (long-term interest rates); World Bank (gross external
debt); Eurostat (private debt); ECB (all other indicators).
2010 2011 2012 2013 2014 2015
Total assets of the banking sector (% of GDP) 391.7 407.8 387.0 372.4 383.5 374.1
Share of assets of the five largest banks (% of total assets) 47.4 48.3 44.6 46.7 47.6 -
Foreign ownership of banking system (% of total assets) 9.7 9.6 10.4 8.3 8.5 -
Financial soundness indicators:
- non-performing loans (% of total loans) 3.8 4.3 4.3 4.5 4.2 -
- capital adequacy ratio (%) 12.7 12.3 14.5 15.4 16.3 -
- return on equity (%) 12.0 8.3 6.0 8.4 4.4 -
Bank loans to the private sector (year-on-year % change) 5.0 2.4 2.0 0.9 0.5 1.9
Lending for house purchase (year-on-year % change) 8.0 6.1 2.8 3.6 -2.8 3.1
Loan to deposit ratio 118.0 113.4 111.2 107.8 106.7 102.7
Central Bank liquidity as % of liabilities 1.7 4.4 4.6 2.8 2.3 2.3
Private debt (% of GDP) 131.8 135.3 138.6 137.9 143.2 -
Gross external debt (% of GDP)1)
- public 49.5 50.5 54.6 57.2 62.9 62.6
- private 44.0 52.6 51.7 49.7 53.2 55.7
Long-term interest rate spread versus Bund (basis points)* 37.5 71.2 104.2 63.4 50.3 34.7
Credit default swap spreads for sovereign securities (5-year)* 57.6 94.9 85.7 38.9 31.0 24.4
ANNEX C
Standard Tables

C. Standard Tables
90
Table C.2: Labour market and social indicators
(1) Unemployed persons are all those who were not employed but had actively sought work and were ready to begin
working immediately or within two weeks.
(2) Long-term unemployed are peoples who have been unemployed for at least 12 months.
(3) Not in Education Employment or Training.
(4) Average of first three quarters of 2015. Data for total unemployment and youth unemployment rates are seasonally
adjusted.
Source: European Commission (EU Labour Force Survey).
2010 2011 2012 2013 2014 2015 (4)
Employment rate
(% of population aged 20-64)69.3 69.2 69.4 69.5 69.4 69.5
Employment growth
(% change from previous year)0.1 0.8 0.3 0.0 0.4 0.3
Employment rate of women
(% of female population aged 20-64)64.9 64.7 65.1 65.5 65.7 66.0
Employment rate of men
(% of male population aged 20-64)74.0 74.0 73.9 73.7 73.3 73.2
Employment rate of older workers
(% of population aged 55-64)39.7 41.4 44.5 45.6 46.9 48.6
Part-time employment (% of total employment,
aged 15 years and over)17.8 17.9 18.0 18.4 18.9 18.8
Fixed term employment (% of employees with a fixed term
contract, aged 15 years and over)15.1 15.4 15.3 16.0 15.8 16.6
Transitions from temporary to permanent employment 10.6 11.6 10.9 11.1 7.9 -
Unemployment rate(1)
(% active population,
age group 15-74)9.3 9.2 9.8 10.3 10.3 10.4
Long-term unemployment rate(2)
(% of labour force) 3.7 3.8 3.9 4.2 4.4 4.4
Youth unemployment rate
(% active population aged 15-24)23.3 22.7 24.4 24.9 24.2 24.8
Youth NEET(3)
rate (% of population aged 15-24) 12.7 12.3 12.5 11.2 11.4 -
Early leavers from education and training (% of pop. aged 18-24
with at most lower sec. educ. and not in further education or
training)
12.7 12.3 11.8 9.7 9.0 -
Tertiary educational attainment (% of population aged 30-34
having successfully completed tertiary education)43.2 43.1 43.3 44.0 43.7 -
Formal childcare (30 hours or over; % of population aged less
than 3 years)26.0 26.0 23.0 26.0 - -
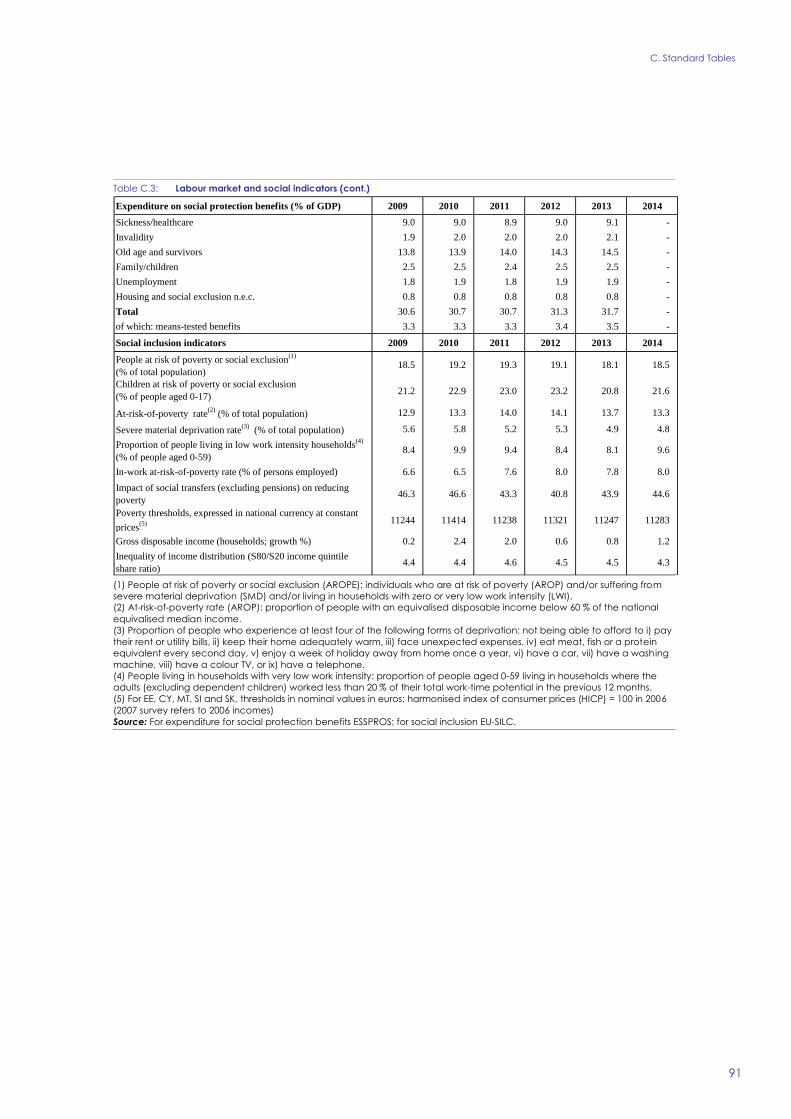
C. Standard Tables
91
Table C.3: Labour market and social indicators (cont.)
(1) People at risk of poverty or social exclusion (AROPE): individuals who are at risk of poverty (AROP) and/or suffering from
severe material deprivation (SMD) and/or living in households with zero or very low work intensity (LWI).
(2) At-risk-of-poverty rate (AROP): proportion of people with an equivalised disposable income below 60 % of the national
equivalised median income.
(3) Proportion of people who experience at least four of the following forms of deprivation: not being able to afford to i) pay
their rent or utility bills, ii) keep their home adequately warm, iii) face unexpected expenses, iv) eat meat, fish or a protein
equivalent every second day, v) enjoy a week of holiday away from home once a year, vi) have a car, vii) have a washing
machine, viii) have a colour TV, or ix) have a telephone.
(4) People living in households with very low work intensity: proportion of people aged 0-59 living in households where the
adults (excluding dependent children) worked less than 20 % of their total work-time potential in the previous 12 months.
(5) For EE, CY, MT, SI and SK, thresholds in nominal values in euros; harmonised index of consumer prices (HICP) = 100 in 2006
(2007 survey refers to 2006 incomes)
Source: For expenditure for social protection benefits ESSPROS; for social inclusion EU-SILC.
Expenditure on social protection benefits (% of GDP) 2009 2010 2011 2012 2013 2014
Sickness/healthcare 9.0 9.0 8.9 9.0 9.1 -
Invalidity 1.9 2.0 2.0 2.0 2.1 -
Old age and survivors 13.8 13.9 14.0 14.3 14.5 -
Family/children 2.5 2.5 2.4 2.5 2.5 -
Unemployment 1.8 1.9 1.8 1.9 1.9 -
Housing and social exclusion n.e.c. 0.8 0.8 0.8 0.8 0.8 -
Total 30.6 30.7 30.7 31.3 31.7 -
of which: means-tested benefits 3.3 3.3 3.3 3.4 3.5 -
Social inclusion indicators 2009 2010 2011 2012 2013 2014
People at risk of poverty or social exclusion(1)
(% of total population)18.5 19.2 19.3 19.1 18.1 18.5
Children at risk of poverty or social exclusion
(% of people aged 0-17)21.2 22.9 23.0 23.2 20.8 21.6
At-risk-of-poverty rate(2)
(% of total population) 12.9 13.3 14.0 14.1 13.7 13.3
Severe material deprivation rate(3)
(% of total population) 5.6 5.8 5.2 5.3 4.9 4.8
Proportion of people living in low work intensity households(4)
(% of people aged 0-59)8.4 9.9 9.4 8.4 8.1 9.6
In-work at-risk-of-poverty rate (% of persons employed) 6.6 6.5 7.6 8.0 7.8 8.0
Impact of social transfers (excluding pensions) on reducing
poverty46.3 46.6 43.3 40.8 43.9 44.6
Poverty thresholds, expressed in national currency at constant
prices(5) 11244 11414 11238 11321 11247 11283
Gross disposable income (households; growth %) 0.2 2.4 2.0 0.6 0.8 1.2
Inequality of income distribution (S80/S20 income quintile
share ratio)4.4 4.4 4.6 4.5 4.5 4.3
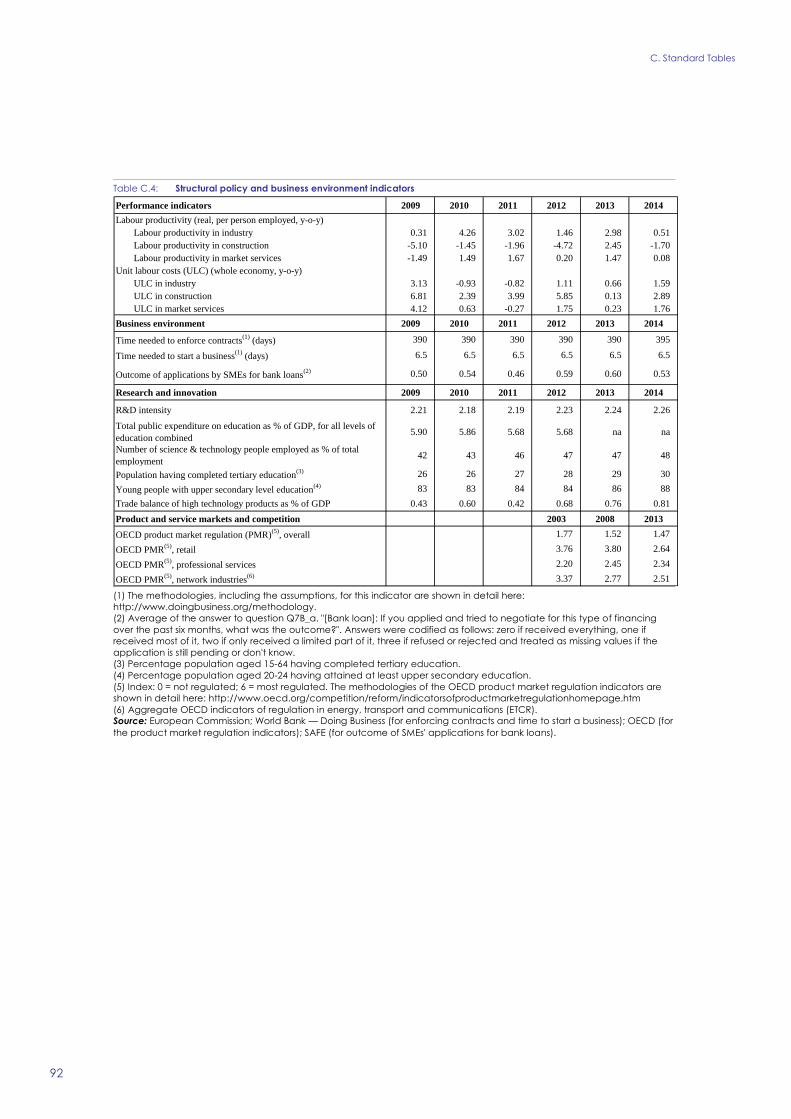
C. Standard Tables
92
Table C.4: Structural policy and business environment indicators
(1) The methodologies, including the assumptions, for this indicator are shown in detail here:
http://www.doingbusiness.org/methodology.
(2) Average of the answer to question Q7B_a. "[Bank loan]: If you applied and tried to negotiate for this type of financing
over the past six months, what was the outcome?". Answers were codified as follows: zero if received everything, one if
received most of it, two if only received a limited part of it, three if refused or rejected and treated as missing values if the
application is still pending or don't know.
(3) Percentage population aged 15-64 having completed tertiary education.
(4) Percentage population aged 20-24 having attained at least upper secondary education.
(5) Index: 0 = not regulated; 6 = most regulated. The methodologies of the OECD product market regulation indicators are
shown in detail here: http://www.oecd.org/competition/reform/indicatorsofproductmarketregulationhomepage.htm
(6) Aggregate OECD indicators of regulation in energy, transport and communications (ETCR).
Source: European Commission; World Bank — Doing Business (for enforcing contracts and time to start a business); OECD (for
the product market regulation indicators); SAFE (for outcome of SMEs' applications for bank loans).
Performance indicators 2009 2010 2011 2012 2013 2014
Labour productivity (real, per person employed, y-o-y)
Labour productivity in industry 0.31 4.26 3.02 1.46 2.98 0.51
Labour productivity in construction -5.10 -1.45 -1.96 -4.72 2.45 -1.70
Labour productivity in market services -1.49 1.49 1.67 0.20 1.47 0.08
Unit labour costs (ULC) (whole economy, y-o-y)
ULC in industry 3.13 -0.93 -0.82 1.11 0.66 1.59
ULC in construction 6.81 2.39 3.99 5.85 0.13 2.89
ULC in market services 4.12 0.63 -0.27 1.75 0.23 1.76
Business environment 2009 2010 2011 2012 2013 2014
Time needed to enforce contracts(1)
(days) 390 390 390 390 390 395
Time needed to start a business(1)
(days) 6.5 6.5 6.5 6.5 6.5 6.5
Outcome of applications by SMEs for bank loans(2) 0.50 0.54 0.46 0.59 0.60 0.53
Research and innovation 2009 2010 2011 2012 2013 2014
R&D intensity 2.21 2.18 2.19 2.23 2.24 2.26
Total public expenditure on education as % of GDP, for all levels of
education combined5.90 5.86 5.68 5.68 na na
Number of science & technology people employed as % of total
employment42 43 46 47 47 48
Population having completed tertiary education(3) 26 26 27 28 29 30
Young people with upper secondary level education(4) 83 83 84 84 86 88
Trade balance of high technology products as % of GDP 0.43 0.60 0.42 0.68 0.76 0.81
Product and service markets and competition 2003 2008 2013
OECD product market regulation (PMR)(5)
, overall 1.77 1.52 1.47
OECD PMR(5)
, retail 3.76 3.80 2.64
OECD PMR(5)
, professional services 2.20 2.45 2.34
OECD PMR(5)
, network industries(6) 3.37 2.77 2.51
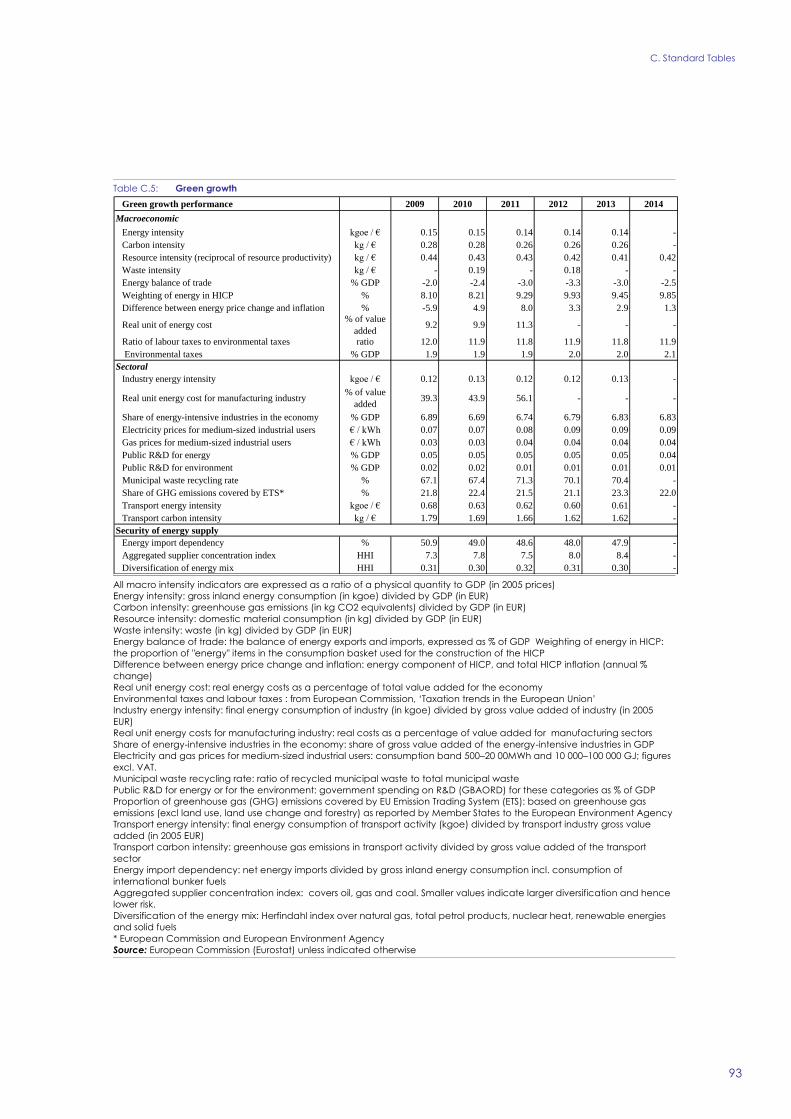
C. Standard Tables
93
Table C.5: Green growth
All macro intensity indicators are expressed as a ratio of a physical quantity to GDP (in 2005 prices)
Energy intensity: gross inland energy consumption (in kgoe) divided by GDP (in EUR)
Carbon intensity: greenhouse gas emissions (in kg CO2 equivalents) divided by GDP (in EUR)
Resource intensity: domestic material consumption (in kg) divided by GDP (in EUR)
Waste intensity: waste (in kg) divided by GDP (in EUR)
Energy balance of trade: the balance of energy exports and imports, expressed as % of GDP Weighting of energy in HICP:
the proportion of "energy" items in the consumption basket used for the construction of the HICP
Difference between energy price change and inflation: energy component of HICP, and total HICP inflation (annual %
change)
Real unit energy cost: real energy costs as a percentage of total value added for the economy
Environmental taxes and labour taxes : from European Commission, ‘Taxation trends in the European Union’
Industry energy intensity: final energy consumption of industry (in kgoe) divided by gross value added of industry (in 2005
EUR)
Real unit energy costs for manufacturing industry: real costs as a percentage of value added for manufacturing sectors
Share of energy-intensive industries in the economy: share of gross value added of the energy-intensive industries in GDP
Electricity and gas prices for medium-sized industrial users: consumption band 500–20 00MWh and 10 000–100 000 GJ; figures
excl. VAT.
Municipal waste recycling rate: ratio of recycled municipal waste to total municipal waste
Public R&D for energy or for the environment: government spending on R&D (GBAORD) for these categories as % of GDP
Proportion of greenhouse gas (GHG) emissions covered by EU Emission Trading System (ETS): based on greenhouse gas
emissions (excl land use, land use change and forestry) as reported by Member States to the European Environment Agency
Transport energy intensity: final energy consumption of transport activity (kgoe) divided by transport industry gross value
added (in 2005 EUR)
Transport carbon intensity: greenhouse gas emissions in transport activity divided by gross value added of the transport
sector
Energy import dependency: net energy imports divided by gross inland energy consumption incl. consumption of
international bunker fuels
Aggregated supplier concentration index: covers oil, gas and coal. Smaller values indicate larger diversification and hence
lower risk.
Diversification of the energy mix: Herfindahl index over natural gas, total petrol products, nuclear heat, renewable energies
and solid fuels
* European Commission and European Environment Agency
Source: European Commission (Eurostat) unless indicated otherwise
Green growth performance 2009 2010 2011 2012 2013 2014
Macroeconomic
Energy intensity kgoe / € 0.15 0.15 0.14 0.14 0.14 -
Carbon intensity kg / € 0.28 0.28 0.26 0.26 0.26 -
Resource intensity (reciprocal of resource productivity) kg / € 0.44 0.43 0.43 0.42 0.41 0.42
Waste intensity kg / € - 0.19 - 0.18 - -
Energy balance of trade % GDP -2.0 -2.4 -3.0 -3.3 -3.0 -2.5
Weighting of energy in HICP % 8.10 8.21 9.29 9.93 9.45 9.85
Difference between energy price change and inflation % -5.9 4.9 8.0 3.3 2.9 1.3
Real unit of energy cost% of value
added9.2 9.9 11.3 - - -
Ratio of labour taxes to environmental taxes ratio 12.0 11.9 11.8 11.9 11.8 11.9
Environmental taxes % GDP 1.9 1.9 1.9 2.0 2.0 2.1
Sectoral
Industry energy intensity kgoe / € 0.12 0.13 0.12 0.12 0.13 -
Real unit energy cost for manufacturing industry% of value
added39.3 43.9 56.1 - - -
Share of energy-intensive industries in the economy % GDP 6.89 6.69 6.74 6.79 6.83 6.83
Electricity prices for medium-sized industrial users € / kWh 0.07 0.07 0.08 0.09 0.09 0.09
Gas prices for medium-sized industrial users € / kWh 0.03 0.03 0.04 0.04 0.04 0.04
Public R&D for energy % GDP 0.05 0.05 0.05 0.05 0.05 0.04
Public R&D for environment % GDP 0.02 0.02 0.01 0.01 0.01 0.01
Municipal waste recycling rate % 67.1 67.4 71.3 70.1 70.4 -
Share of GHG emissions covered by ETS* % 21.8 22.4 21.5 21.1 23.3 22.0
Transport energy intensity kgoe / € 0.68 0.63 0.62 0.60 0.61 -
Transport carbon intensity kg / € 1.79 1.69 1.66 1.62 1.62 -
Security of energy supply
Energy import dependency % 50.9 49.0 48.6 48.0 47.9 -
Aggregated supplier concentration index HHI 7.3 7.8 7.5 8.0 8.4 -
Diversification of energy mix HHI 0.31 0.30 0.32 0.31 0.30 -