country progress towards the millennium development …€¦ · country progress towards the...
TRANSCRIPT

Cohen et al. Globalization and Health 2014, 10:67http://www.globalizationandhealth.com/content/10/1/67
RESEARCH Open Access
Country progress towards the MillenniumDevelopment Goals: adjusting for socioeconomicfactors reveals greater progress and newchallengesRobert L Cohen1, Yira Natalia Alfonso1, Taghreed Adam2, Shyama Kuruvilla3, Julian Schweitzer4 and David Bishai1*
Abstract
Background: The health Millennium Development Goals (4, 5, 6) impose the same ambitious 2015 targets on everycountry. Few low-income countries are on track to reach them. Some authors have proposed country-specific targetsas a more informative method by which countries can measure their progress against their potential.
Methods: This paper demonstrates a supplementary approach to assess individual country progress that complementsthe global goals by adjusting for socioeconomic resources and prior time trends. A minimum performance targetadjusts for time and national GDP. Fast-track targets, based on best-performing countries’ progress within regional andincome groups, adjust for health and non-health sector factors known to affect maternal and child health.
Results: Measuring by the minimum performance target, 74% and 59% of low- and middle-income countries areon track for reducing child mortality and maternal mortality, respectively, compared with 69% and 22% usingglobal MDGs. Only 20% and 7% of low- and middle-income countries are on track for the child and maternalmortality fast-track targets.
Conclusions: Supplementary targets in maternal and child health, adjusted for each country's resources andpolicy performance can help countries know if they are truly underperforming relative to their potential. Adjustedtargets can also flag countries that have surpassed their potential, and open opportunities for learning fromsuccess.
Funding: Partnership for Maternal, Newborn & Child Health and the Alliance for Health Policy and SystemsResearch, as part of the Success Factors Study on reducing maternal and child mortality.
IntroductionThe Millennium Development Goals (MDGs) originatefrom the 2000 United Nation (UN) Millennium Declarationadopted by 189 UN member states during the MillenniumSummit [1]. Health MDGs 4 and 5a had respective targetsto reduce the under-5 mortality rate (U5MR, the numberof deaths of children under 5 per 1,000 live births) by twothirds and the maternal mortality ratio (MMR, the numberof maternal deaths per 100,000 live births) by three quartersby 2015 and to achieve universal access to reproductive
* Correspondence: [email protected] Hopkins Bloomberg School of Public Health, 615 N. Wolfe Street SuiteE4622, Baltimore, MD 21205, USAFull list of author information is available at the end of the article
© 2014 Cohen et al.; licensee BioMed CentralCommons Attribution License (http://creativecreproduction in any medium, provided the orDedication waiver (http://creativecommons.orunless otherwise stated.
health [1]. MDG 4 was partially based on observations ofreductions in child mortality in three countries thatachieved high rates of progress between 1960 and 1990(China, Sri Lanka and Vietnam) [2]. This targeted improve-ment was then applied as a global goal to achieve similarprogress worldwide from 1990–2015. The MillenniumDeclaration uses the collective pronoun, “We” and refers toduties to the “world’s people”, leading many to concludethat the goals and indicators were intended as motivationalaspirations for the aggregate world population. Whateverthe General Assembly’s original intentions, numerous re-ports and studies have reinterpreted the MDGs as goals ap-plying to each individual country [3-5]. Many of thesereports have noted that the vast majority of low- and
Ltd. This is an Open Access article distributed under the terms of the Creativeommons.org/licenses/by/4.0), which permits unrestricted use, distribution, andiginal work is properly credited. The Creative Commons Public Domaing/publicdomain/zero/1.0/) applies to the data made available in this article,
Cohen et al. Globalization and Health 2014, 10:67 Page 2 of 19http://www.globalizationandhealth.com/content/10/1/67
middle-income countries, especially in Africa, are “offtrack” for meeting the MDGs despite rapid progress insome places against considerable concurrent challenges.This has led some to suggest that applying a global stand-ard to every country may be inappropriate [6]. Country-specific targets could allow people of a given country tobetter assess whether they are truly underperforming giventheir resources and potential.The High Level Panel on the Post-2015 development
agenda and the Open Working Group on SustainableDevelopment reports indicate that assessment of countryprogress towards maternal and child health goals willcontinue to be part of the post-2015 landscape [7,8]. Be-cause assessment of country progress will continue to beimportant after 2015, assessment tools designed specific-ally to compare a country’s progress to its own specificpotential should be considered. Despite the great meritof the MDGs as global aspirations, global targets do notadjust for local factors that might inhibit or enhanceprogress. Very few sub-Saharan countries have a realisticchance to meet proposed 2030 targets for ending pre-ventable newborn and child mortality or achieving aU5MR of 25 and a MMR of less than 70 [9,10]. Thispaper explores methods to supplement a single globaltarget to demonstrate what can be learned when ac-counting for country factors.
What global and country-specific targets can and can’t doWhen the health MDGs are used as country-specificperformance targets, the latest reports show that veryfew countries are on track to meet MDGs 4 and 5a, asmeasured by average annual percent reduction in mor-tality. Out of the 75 Countdown to 2015 countries (aninitiative that monitors progress in the 75 countries thataccount for more than 95% of preventable maternal andchild mortality worldwide), only 28 are on track forMDG 4 [5]. Of these, only nine are from Sub-SaharanAfrica (SSA) [11]. For MDG 5a, only 20 out of the same75 are on track, and only 6 in SSA [11]. Only 13 are ontrack for both goals, 3 from SSA. (Kuruvilla S, Franz-Vasdeki J, Chowdhury S et al.: “Strategies that 'High-Performing' countries used in their efforts to reducematernal and child mortality: a multi-country, multi-method study of 'Success' factors for MDGs 4 and 5a”,forthcoming)Using the MDGs to monitor progress and classify
countries as on or off track, while understandable, canbe misleading because the numerical targets were basedon time trends of a few countries without attention towhat could be reasonably achieved by each particularcountry given their available resources [12]. Off trackcountries can realistically be excused from attaining tar-gets that were unachievable in the first place and LMICpolicy makers can question the relevance of targets that
were set without regard to local resources and chal-lenges. The best proof of unattainability is that over 80%of low-income African countries currently appear as “offtrack” for both MDG 4 and 5, despite having made sub-stantial progress. Additionally, no Latin American coun-tries are on track for MDG5a. In settings such as these,while acknowledging the clear value of global goals, itwill also be instructive to assess country performanceusing country-specific indicators that adjust for a country’ssocioeconomic and epidemiological potential. Commenta-tors note a harmful sense of futility when a country that isactually making acceptable progress in improving health ismisclassified as off track [12,13].Focusing on percentage reductions requires an unwar-
ranted assumption that it is just as easy for a countrywith under-five mortality rate (U5MR) of 240 to bringtheir rate down by 160 points as it is for a country withU5MR of 120 to bring the rate down by 80 points. Easterlyexamined the historical record of cases where a countrybrought U5MR down by 66% in 25 years and found thatonly 11% of cases could achieve this degree of health im-provement starting from a U5MR that was higher thanthe average for all countries in Africa in 1990 [13]. Morefeasible and context-specific targets are needed goingforward.
FrameworkThis study adjusts targets for maternal and child healthfor socioeconomic and policy factors that can improveand impair progress. This is an analogous approachoverall to a separate analysis by Walker et al. that ad-justed expectations of progress for the year 2035 basedon each country’s trajectory in implementing differentpublic practices between 1990 and 2011. Based on amodel of how many lives can be saved through interven-tions like vaccinations, oral rehydration, and attendeddelivery, this approach forecasted future lives savedbased on expectations of better coverage with interven-tions. It found that even in a best-case scenario of in-creased coverage of key interventions, there is only amarginal increase in the percent of countries on trackfor proposed 2035 targets. Our study proposes a supple-mental approach that relies on the correlation betweenmortality and socioeconomic factors, rather than modelsof improvements in the coverage of specific interven-tions. The impacts of health intervention programs aredetermined by enabling factors such as a country’s eco-nomic resources and factors such as governance and ac-countability [14,15].In order to explore the implications of supplementing
a single global target with country-specific targets, thisstudy develops two versions for country-specific per-formance targets. Countries are rated on what their per-formance might have looked like if work towards
Cohen et al. Globalization and Health 2014, 10:67 Page 3 of 19http://www.globalizationandhealth.com/content/10/1/67
implementing the targets started in 2000 and wasassessed in 2010. First, a minimum performance targetadjusts expected performance based on each country’sprior health trajectory and each country’s projected eco-nomic growth. Per capita GDP growth yields resourcesthat can be used to improve health. The relationship isimperfect—economic growth has been known to occurwithout the improvement of health and vice versa. It al-ways depends on how GDP resources are deployed [16].However, for the majority of low income countries, thereis an empirical correlation between GDP growth andhealth improvements. GDP growth is a surrogate markerfor a wide array of physical, social and institutional im-provements that can support better health, so we use italong with time trends as a summary statistic to producethe minimum performance target. Meeting the mini-mum performance target means a country is maintain-ing past momentum and taking advantage of neweconomic resources as they become available for use inimproving women’s and child’s health. Failing to meetthis minimum performance target would indicate a de-celeration of progress. Second, a fast-track target adjustsfor a complete set of best policy practices that theirbest-performing regional neighbors were able to imple-ment between 2000 and 2010. This fast-track adjustedtarget will be difficult to attain and countries that haveachieved it should be closely examined to identify suc-cess factors.
MethodsTarget 1—the minimum performance target—was basedon a model of how each country’s time trend and GDPgrowth affected mortality from 1990 to 2000. The modelwas used to project the respective mortality rates foreach country to 2010, based on their expected rates ofeconomic growth and yearly improvements. The statis-tical method fit a log-linear regression of the health indi-cator against a time trend and GDP per capita thenapplied the estimated coefficients to each country’s GDPgrowth to adjust each country’s expected degree ofhealth improvement. The statistical method also adjustedfor country specific fixed effects. To meet the target, acountry had to simply achieve mortality improvementsper dollar of their own GDP growth at the average rate ofmortality improvement per dollar of growth observed inthe sample of countries. Countries that did not reach theminimum performance target for U5MR and MMR by2010 must have been achieving less health improvementper dollar of their GDP growth than the average perform-ance for countries at similar GDP levels. In theory, if themodel fit the data perfectly, half of all countries should befound to be below the average of all the countries in thesample and half would be above this average. In practice,country fixed effects and omitted factors could cause more
countries to perform better than average. Countries wereconsidered on track in 2010 for each target if their re-ported U5MR and MMR were lower than the respectivetargets, or below 40/1,000 live births for U5MR. Tests ofrobustness and sensitivity and other technical details arepresented in the Additional file 1: Appendix.Target 2—the fast-track target—was based on a model
of how a set of key socioeconomic and policy factorsthat have been established in the scientific literature ascontributing to improvements in maternal and childhealth, as well as how past time trends and GDP affectedmortality rates. The factors used to adjust the model areshown in Table 1 and their derivation is discussed in theAdditional file 1: Appendix and in a prior paper [8]. Thelist of independent variables is highly correlated becausemost are correlated with overall development. Hence ananalysis of robustness found that shifting this list of vari-ables by excluding one or adding another had a negli-gible impact on the country specific target and thedetermination of which countries were meeting theirfast-track targets (Additional file 1: Appendix). The modelprojected mortality to 2010, but assumed that each coun-try had maximal rates of improvement on the key socio-economic determinants of mortality from 2000 to 2010.Maximal rates were established by the best rates of im-provement in socioeconomic factors observed anywherein the country’s UN sub-region from 2000 to 2010. Tomeet the fast-track target, a country’s 2000–2010 actualhealth improvement had to achieve the health improve-ment that would have occurred had it accomplished themaximum improvement rate in each of the policy vari-ables that was observed by high-performing countries inits sub-region between 2000 and 2010.Multivariate regression adjusting for country-specific
trends and fixed effects was used to make country-specific projections of the minimum and fast-track per-formance targets. The dependent variables were logtransformations of U5MR and MMR corresponding toMDGs 4 and 5. For the minimum target the independ-ent variables were GDP per capita and a time trend. Forthe fast-track target, independent variables were basedon the United Nations Development Programme pro-posal that plans designed to meet the MDGs should in-clude investments in seven “clusters” of public policy[17]. We use these clusters as a guide to group variablesinto priority areas that could represent a complete set ofresources, together with health and socioeconomic pub-lic practices that impact child and maternal health.Our final model included the following variables, all
of which have statistical as well as theoretical and em-pirical support: percent of the population with accessto clean water, [11,18-20] percent of children under 2who received the measles vaccine, [11,21-23] a controlof corruption index reported by the World Bank,
Table 1 Summary statistics for U5MR and MMR models
Under 5 Mortality rate model Original data from 144 countries Imputed data from 144 countries Year
Obs. Mean Std. Dev Obs. Mean Std. Dev
Under 5 mortality rate (U5MR) 3001 68.6 58.8 3001 68.6 58.8 1990-2011
GDP per capita 3001 1955.5 2046.6 3001 1955-5 2046-6 1990-2011
Log kilowatt hours per capita 1878 6.6 1.4 3001 6.3 1.4 1990-2011
Percent urban 3001 46.0 20.4 3001 46.0 20.4 1990-2011
Log 5 year lag gov. health expenditure 1990-2011
Per capita 1678 4.2 1.2 3001 3.9 1.2
Log odds girls primary school enrollment 1266 1.9 1.4 3001 1.8 1.3 1990-2011
Log odds of having clean water 2701 1.8 1.5 3001 1.8 1.5 1990-2011
Log odds of measles vaccine 2946 1.8 1.4 3001 1.8 1.4 1990-2011
Doctors per 100,000 sq. root 1146 10.2 6.2 3001 8.6 5.5 1990-2011
Control of corruption score 1812 −0.4 0.6 3001 −0.4 0.5 1996-2011*
Maternal mortality rate model Original data from 116 countries Imputed data from 116 countries Years
Obs. Mean Std. Dev Obs. Mean Std. Dev
Maternal mortality ratio (MMR) 339 235.6 287.0 339 235.6 287.0 1990-2011
GDP per capita 339 2067.1 2135.6 339 2067.1 2135.6 1990-2011
Control of corruption score 289 −0.4 0.6 339 −0.4 0.6 1996-2011*
Log odd skill birth attendant (SBA) 200 1.9 2.1 339 2.0 1.9 1990-2011
Total fertility rate (TFR) sq. root 339 1.8 0.4 339 1.8 0.4 1990-2011
Gini coefficient 114 45.8 9.0 339 44.7 7.9 1990-2011
*Data available every 2 years between ’96-’02 and every year between ’03-’11.
Cohen et al. Globalization and Health 2014, 10:67 Page 4 of 19http://www.globalizationandhealth.com/content/10/1/67
[11,24] power consumption per capita, [20] urbanization,[18,23-26] percent of girls enrolled in primary school,[26-28] total fertility rate, [11,18,29,30] physicians percapita, [11,20,26,27,31-33] percent of births attendedby a skilled birth attendant, [11,21,34] health spendingper capita lagged by five years (since health spendingin a given year may be endogenous to our model)[15,26,32,35,36], and Gini coefficient [21,34,37].We excluded all countries classified as high-income by
their 2000 GDP per capita (defined as $9,266 [38] in2000 US dollars) from both analyses. We additionally ex-cluded all European countries from the MMR analysis,since MMR in those countries is comparable to high-income countries. These criteria left 144 countries eli-gible for the U5MR analysis and 116 countries in theMMR analysis.Data for outcome and independent variables of inter-
est was extracted and compared between the followingsources: WHO Global Health Observatory, [39] WHONational Health Accounts (NHA), [40] UNdata, [41]UNDP, [42] UNICEF’s Childinfo, [43] the World BankDataBank, [44] and Demographic and Health Surveys(DHS). [45] Completeness of the dataset varied by indi-cator, see Table 1. For MMR data, our analysis uses thenational estimates from UNICEF’s Child Info [43]. ForU5MR, estimates are developed by the UN Inter-agencyGroup for Child Mortality Estimation (UNICEF, WHO,
World Bank, UN DESA, UNDP). For those independentvariables lacking complete data, simple regression im-putation was used. The inclusion of imputed data had lit-tle effect on the targets for countries that had completedata. Since complete vital registration is uncommon inlow income countries, the official measures of mortalityare derived by supplementing household survey dataabout deaths in a household with demographic models.As noted by Deaton, the health experiences of low incomecountries are so different in composition and in the waymortality data are acquired that the analysis should notcombine low and high income countries [46]. The data onmortality that we used are the exact same official mea-sures that are used to track MDG progress by the UN. Wereplicated our results with Institute of Health Metricsmeasures and found results that were very similar. Untilvital registration systems improve, there will be no otherrecourse but to use the mortality indicators that areon hand.
ResultsTable 2 shows that poverty and a higher starting initialmortality make it harder to reach the 66% mortality re-duction target. Absolute point reductions in U5MR aver-aged 74 points in the lowest income countries and 16points in the highest income countries across four GDPper capita quartiles (Table 2). However, expressed as

Table 2 MDG 4 & 5 progress observed from 1990 to 2010 by income quartile
Lowest GDPpc quartile Second GDPpc quartile Third GDPpc quartile Highest GDPpc quartile LMICs
Under-5 mortality rate (U5MR)
144 countries (2000 GDPpcrange: $87 to $393)
(2000 GDPpcrange: $402 to $1200)
(2000 GDPpcrange: $1208 to $2512)
(2000 GDPpcrange: $2753 to $8775)
(2000 GDPpcrange: $87-$8775)
Mean absolute reduction in U5MR (per 1,000) 74 (−6 to 183) 33 (−18 to 82) 27 (−26 to 93) 16 (3 to 56) 38 (−26 to 183)
Mean percent reduction in U5MR (non-weighted) 42% (−6 to 70) 42% (−12 to 74) 52% (−31 to 88) 51% (16 to 80) 46.8% (−31 to 88)
Population weighted mean percent reduction in U5MR 46% 54% 59% 61% 55%
Birth cohort weighted mean percent reduction in U5MR* 41% 42% 60% 61% 40%
Maternal mortality rate (MMR)
116 countries (wealth quartiles redrawn to exclude Europe) (2000 GDPpcrange: $87 to $359)
(2000 GDPpcrange: $362 to $949)
(2000 GDPpcrange: $972 to $2178)
(2000 GDPpcrange: $2211 to $8775)
(2000 GDPpcrange: $87-8775)
Mean absolute reduction in MMR (per 100,000) 386 (−180 to 1130) 219 (−120 to 820) 62 (−140 to 260) 50 (−51 to 770) 179 (−180 to 1130)
Mean non-weighted percent reduction in MMR 43% (−20 to 78) 41% (−27 to 82) 30% (−64 to 83) 27% (−86 to 93) 35% (−86 to 93)
Population weighted percent reduction in MMR 48% 64% 50% 38% 51%
Birth cohort weighted percent reduction in MMR* 48% 53% 49% 31% 48%
*Excludes Kiribati, Marshall Islands, Palua, Serbia, and Tuvalu for lack of birth cohort information.
Cohen
etal.G
lobalizationand
Health
2014,10:67Page
5of
19http://w
ww.globalizationandhealth.com
/content/10/1/67
Cohen et al. Globalization and Health 2014, 10:67 Page 6 of 19http://www.globalizationandhealth.com/content/10/1/67
percent reductions, the countries with the lowest incomereduced U5MR by 42%, while LMIC counties with thehighest incomes lowered U5MR by 51%. The populationweighted percent reduction in U5MR for these 144LMIC countries was 55% between 1990 and 2010.The population weighted percent reduction in MMR
for the world is 51%, during the same period. Likewise,MMR progress across the four GDP per capita quartilesshows that absolute point reductions averaged 386points in the lowest income countries and 50 points inthe highest income countries. Expressed as percent re-ductions, the lowest income countries lowered MMR by43%, while the highest income countries lowered MMRby 27%.Figure 1 shows that the number of countries on track
to achieve MDGs 4 and 5 is much lower in the lowest-growth LMICs compared to the highest-growth group.Table 3 shows the reported U5MR of each country in
our dataset in 1990 and 2010. These can be compared toan MDG target showing what a country’s U5MR wouldbe in 2010 if it were on a linear path to achieve a 67%reduction in the 1990 U5MR by 2015. Of 144 countriesavailable for analysis, we find that 99 (69%) are on trackby the MDG 4 target including 12 (27%) in sub-SaharanAfrica. In contrast, under our U5MR minimum perform-ance target 107 countries of 144 (74%) would be consid-ered on track and 18 of 45 (40%) of sub-Saharan Africancountries would be considered on track (Figure 2A-B).According to our fast-track U5MR target, only 29
countries out of 144 (20%) are on the fast track. Of thesetop performers, 4 are in Africa (Botswana, Liberia, Nigerand Rwanda). On average across countries the minimumperformance target requires achieving a U5MR in 2010that is 25% higher than the MDG 4 target for 2010. Thefast-track target on average requires a U5MR that is 5%lower in 2010 than the MDG target, although in SSA the
36%
78%
6% 6%
0%
10%
20%
30%
40%
50%
60%
70%
80%
90%
Bottom Quartile(-3.2% - 0.8%)
Second Quartile(0.8% - 2%)
Per
cen
tag
e o
f Q
uar
tile
on
Tra
ck
Quartile of 36 (144/4) countries by (range of annual g
Figure 1 Progress toward current MDGs 4 & 5 by annual GDP growth
average fast-track target is actually 5% higher (i.e. lessambitious) than the average MDG target.Likewise, Table 4 shows the original starting MMR of
each country in our dataset in 1990, the latest estimatefor 2010, and what a country’s MMR would have been in2010 if it were on a linear path to achieve a 75% reduc-tion in the 1990 MMR by 2015. Of 116 countries avail-able for analysis, 25 (22%) are on track by the MDG 5target. Of the 42 sub Saharan African countries studied,5 (12%) are on track by the MDG 5 target. In contrast,under the MMR minimum performance target, 69 coun-tries of 116 (59%) would be considered on track and 25of 42 (60%) sub Saharan African countries would beconsidered on track. On the other hand, for the MMRfast-track target, eight countries of 116 (7%) would be con-sidered on track and 0 of 42 (0%) of sub-Saharan Africancountries would be considered on track (Figure 2C-D).On average, the minimum performance target requires anMMR for 2010 that is 67% higher than the MDG targetwould require. The fast-track target requires a 2010 MMRthat is 30% lower than the MDG target for 2010.
DiscussionIf one interprets the intent of the Millennium Declar-ation as an aspiration for the entire human population,the world as a whole is on track to achieve MDG 4 by2015. As of 2010, the population weighted average re-duction in U5MR since 1990 was 55 percent (Table 2).Extrapolating past performance, where U5MR drops2.75 (=55/20) percentage points per year for five moreyears towards 2015 yields the projection that the worldwill have attained a 68.75% (=55 + (2.75 × 5)) reductionin U5MR by 2015—meeting the 2015 goal. However, ifweighted by number of births, rather than population,progress would be less. The 144 LMIC countries in oursample as a whole have only reduced a birth-cohort-
81% 81%
25%
33%
Third Quartile(2.1% - 3.1%)
Top Quartile (3.1% -14.7%)
annual growth rate, 1990-2011 rowth rate)
MDG4on track
MDG5on track
rate.
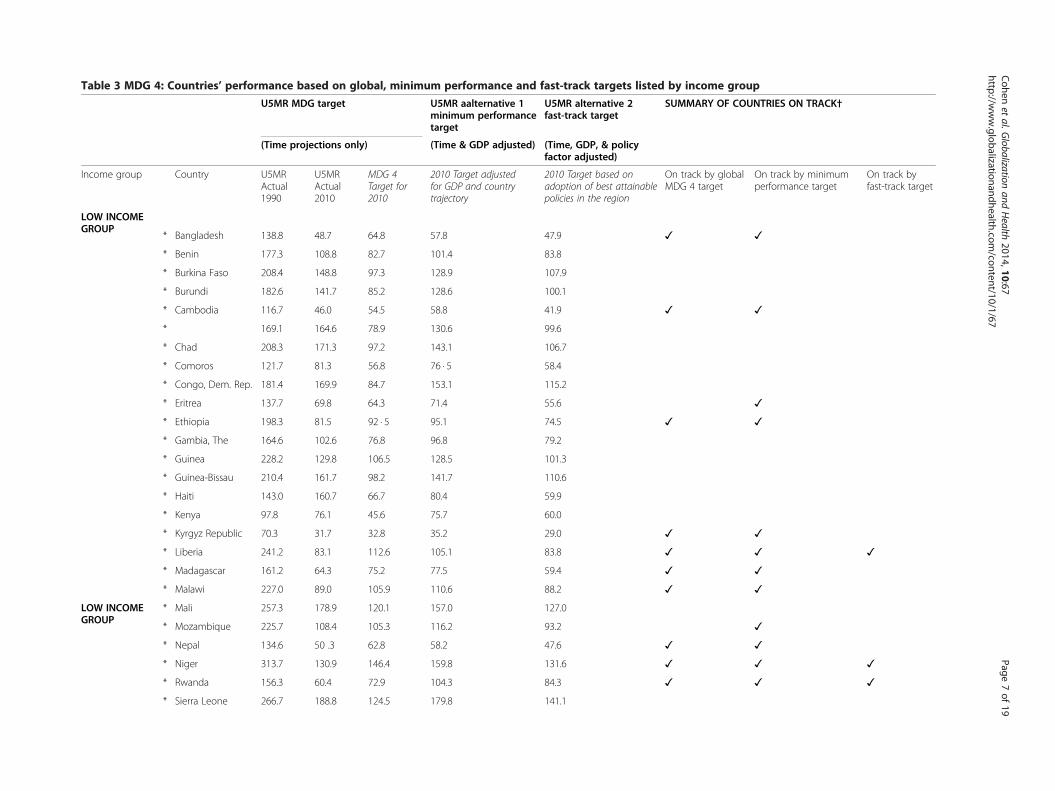
Table 3 MDG 4: Countries’ performance based on global, minimum performance and fast-track targets listed by income group
U5MR MDG target U5MR aalternative 1minimum performancetarget
U5MR alternative 2fast-track target
SUMMARY OF COUNTRIES ON TRACK†
(Time projections only) (Time & GDP adjusted) (Time, GDP, & policyfactor adjusted)
Income group Country U5MRActual1990
U5MRActual2010
MDG 4Target for2010
2010 Target adjustedfor GDP and countrytrajectory
2010 Target based onadoption of best attainablepolicies in the region
On track by globalMDG 4 target
On track by minimumperformance target
On track byfast-track target
LOW INCOMEGROUP
* Bangladesh 138.8 48.7 64.8 57.8 47.9 ✓ ✓
* Benin 177.3 108.8 82.7 101.4 83.8
* Burkina Faso 208.4 148.8 97.3 128.9 107.9
* Burundi 182.6 141.7 85.2 128.6 100.1
* Cambodia 116.7 46.0 54.5 58.8 41.9 ✓ ✓
* 169.1 164.6 78.9 130.6 99.6
* Chad 208.3 171.3 97.2 143.1 106.7
* Comoros 121.7 81.3 56.8 76 · 5 58.4
* Congo, Dem. Rep. 181.4 169.9 84.7 153.1 115.2
* Eritrea 137.7 69.8 64.3 71.4 55.6 ✓
* Ethiopia 198.3 81.5 92 · 5 95.1 74.5 ✓ ✓
* Gambia, The 164.6 102.6 76.8 96.8 79.2
* Guinea 228.2 129.8 106.5 128.5 101.3
* Guinea-Bissau 210.4 161.7 98.2 141.7 110.6
* Haiti 143.0 160.7 66.7 80.4 59.9
* Kenya 97.8 76.1 45.6 75.7 60.0
* Kyrgyz Republic 70.3 31.7 32.8 35.2 29.0 ✓ ✓
* Liberia 241.2 83.1 112.6 105.1 83.8 ✓ ✓ ✓
* Madagascar 161.2 64.3 75.2 77.5 59.4 ✓ ✓
* Malawi 227.0 89.0 105.9 110.6 88.2 ✓ ✓
LOW INCOMEGROUP
* Mali 257.3 178.9 120.1 157.0 127.0
* Mozambique 225.7 108.4 105.3 116.2 93.2 ✓
* Nepal 134.6 50 .3 62.8 58.2 47.6 ✓ ✓
* Niger 313.7 130.9 146.4 159.8 131.6 ✓ ✓ ✓
* Rwanda 156.3 60.4 72.9 104.3 84.3 ✓ ✓ ✓
* Sierra Leone 266.7 188.8 124.5 179.8 141.1
Cohen
etal.G
lobalizationand
Health
2014,10:67Page
7of
19http://w
ww.globalizationandhealth.com
/content/10/1/67

Table 3 MDG 4: Countries’ performance based on global, minimum performance and fast-track targets listed by income group (Continued)
* Tajikistan 114.3 66.1 53.3 74.6 63.6 ✓
* Tanzania 157.9 72.5 73.7 85.7 71.4 ✓ ✓
* Togo 147.0 111.7 68.6 96.0 76.5
* Uganda 178.0 94.2 83.1 94.8 74.4 ✓
* Zimbabwe 79.2 72.4 37.0 67.9 49.0
LOW-MIDDLEINCOME GROUP
Armenia 47.2 18.3 22.0 21.3 17.3 ✓ ✓
Bhutan 138.4 55.9 64.6 58.9 50.7 ✓ ✓
* Bolivia 119.5 52.9 55.8 57.4 42.0 ✓ ✓
* Cameroon 145.2 128.9 67.8 105.7 81.1
Cape Verde 58.0 22.5 27.1 25.4 21.3 ✓ ✓
* Congo, Rep. 118.8 99.6 55.4 82.6 65.9
* Cote d'Ivoire 151.4 116.7 70.7 104.0 82.5
* Djibouti 121.6 91.2 56.7 82.8 60.1
* Egypt, Arab Rep. 85.7 22.5 40.0 30.7 25.2 ✓ ✓ ✓
El Salvador 60.2 16.3 28.1 22.8 19.2 ✓ ✓ ✓
Georgia 46.9 21.5 21.9 25.4 19.6 ✓ ✓
* Ghana 120.9 79.6 56.4 70.1 55.1
* Guatemala 78.0 31.6 36.4 34.9 29.4 ✓ ✓
Guyana 63.0 37.0 29.4 33.6 25.7 ✓ ✓
Honduras 55.0 22.2 25.7 25.6 22.1 ✓ ✓
* India 114.2 63.4 53.3 59.2 48.7
* Indonesia 81.6 33.3 38.1 36.4 26.2 ✓ ✓
Kiribati 87.6 48.7 40.9 47.2 41.8
* Lao PDR 147.7 43.9 68.9 54.5 36.7 ✓ ✓
* Lesotho 87.5 93.0 40.8 74.2 65.9
* Mauritania 124.7 112.9 58.2 88.5 69.8
Micronesia, Fed.Sts.
56.4 42.0 26.3 35.8 31.5 ✓
Moldova 34.9 16.6 16.3 18.9 15.1 ✓ ✓
Mongolia 106.5 33.0 49.7 44.1 38.7 ✓ ✓ ✓
* Morocco 81.3 34.3 37.9 37.9 31.0 ✓ ✓
Nicaragua 66.1 27.0 30.8 30.3 25.5 ✓ ✓
LOW-MIDDLEINCOME GROUP
* Nigeria 213.6 129.2 99.7 129.2 100.7 ✓
* Pakistan 122.2 73.7 57.0 69.3 55.4
Cohen
etal.G
lobalizationand
Health
2014,10:67Page
8of
19http://w
ww.globalizationandhealth.com
/content/10/1/67
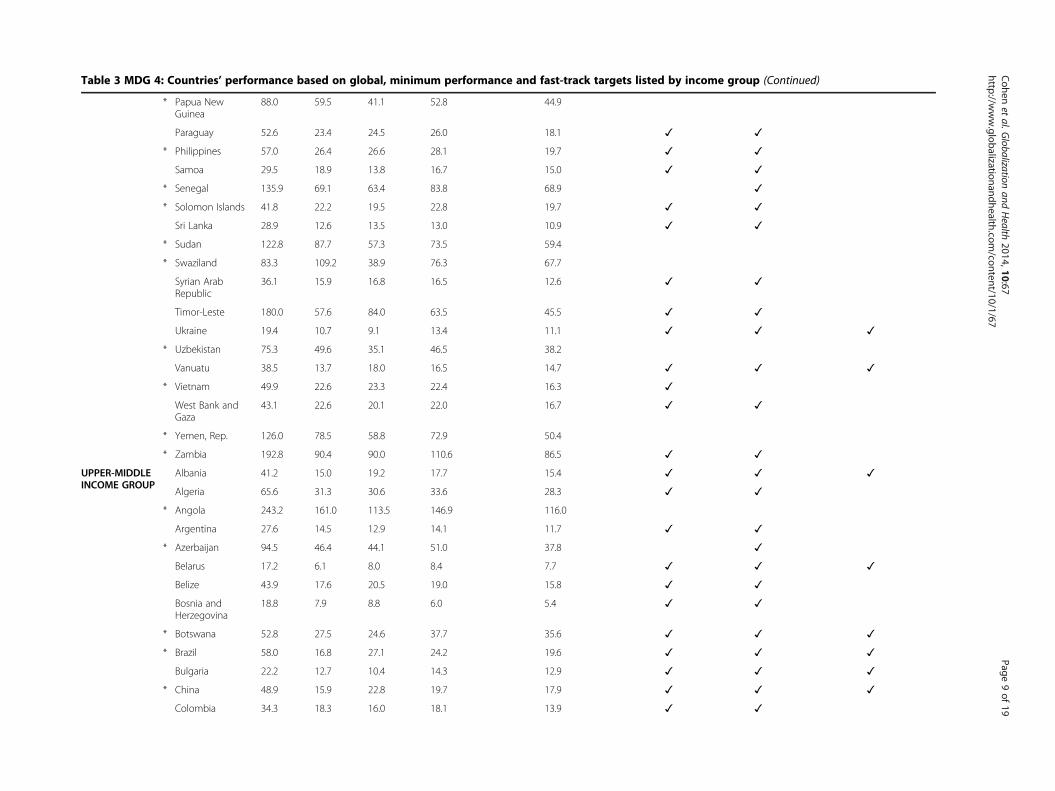
Table 3 MDG 4: Countries’ performance based on global, minimum performance and fast-track targets listed by income group (Continued)
* Papua NewGuinea
88.0 59.5 41.1 52.8 44.9
Paraguay 52.6 23.4 24.5 26.0 18.1 ✓ ✓
* Philippines 57.0 26.4 26.6 28.1 19.7 ✓ ✓
Samoa 29.5 18.9 13.8 16.7 15.0 ✓ ✓
* Senegal 135.9 69.1 63.4 83.8 68.9 ✓
* Solomon Islands 41.8 22.2 19.5 22.8 19.7 ✓ ✓
Sri Lanka 28.9 12.6 13.5 13.0 10.9 ✓ ✓
* Sudan 122.8 87.7 57.3 73.5 59.4
* Swaziland 83.3 109.2 38.9 76.3 67.7
Syrian ArabRepublic
36.1 15.9 16.8 16.5 12.6 ✓ ✓
Timor-Leste 180.0 57.6 84.0 63.5 45.5 ✓ ✓
Ukraine 19.4 10.7 9.1 13.4 11.1 ✓ ✓ ✓
* Uzbekistan 75.3 49.6 35.1 46.5 38.2
Vanuatu 38.5 13.7 18.0 16.5 14.7 ✓ ✓ ✓
* Vietnam 49.9 22.6 23.3 22.4 16.3 ✓
West Bank andGaza
43.1 22.6 20.1 22.0 16.7 ✓ ✓
* Yemen, Rep. 126.0 78.5 58.8 72.9 50.4
* Zambia 192.8 90.4 90.0 110.6 86.5 ✓ ✓
UPPER-MIDDLEINCOME GROUP
Albania 41.2 15.0 19.2 17.7 15.4 ✓ ✓ ✓
Algeria 65.6 31.3 30.6 33.6 28.3 ✓ ✓
* Angola 243.2 161.0 113.5 146.9 116.0
Argentina 27.6 14.5 12.9 14.1 11.7 ✓ ✓
* Azerbaijan 94.5 46.4 44.1 51.0 37.8 ✓
Belarus 17.2 6.1 8.0 8.4 7.7 ✓ ✓ ✓
Belize 43.9 17.6 20.5 19.0 15.8 ✓ ✓
Bosnia andHerzegovina
18.8 7.9 8.8 6.0 5.4 ✓ ✓
* Botswana 52.8 27.5 24.6 37.7 35.6 ✓ ✓ ✓
* Brazil 58.0 16.8 27.1 24.2 19.6 ✓ ✓ ✓
Bulgaria 22.2 12.7 10.4 14.3 12.9 ✓ ✓ ✓
* China 48.9 15.9 22.8 19.7 17.9 ✓ ✓ ✓
Colombia 34.3 18.3 16.0 18.1 13.9 ✓ ✓
Cohen
etal.G
lobalizationand
Health
2014,10:67Page
9of
19http://w
ww.globalizationandhealth.com
/content/10/1/67
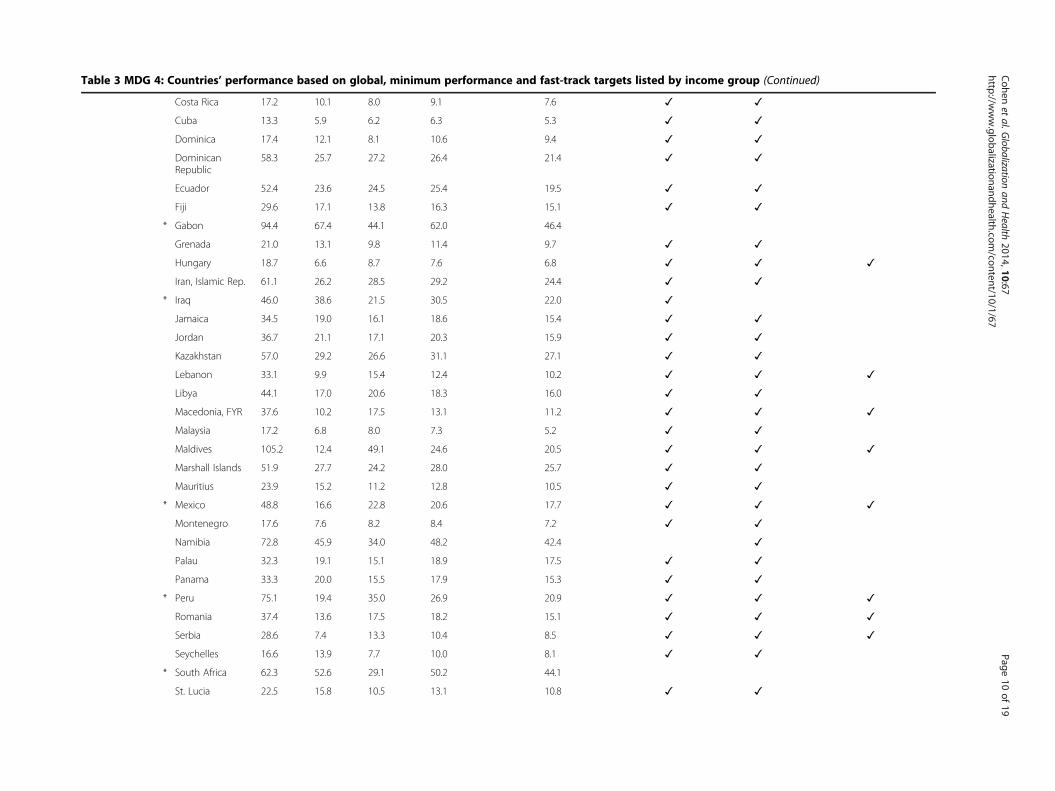
Table 3 MDG 4: Countries’ performance based on global, minimum performance and fast-track targets listed by income group (Continued)
Costa Rica 17.2 10.1 8.0 9.1 7.6 ✓ ✓
Cuba 13.3 5.9 6.2 6.3 5.3 ✓ ✓
Dominica 17.4 12.1 8.1 10.6 9.4 ✓ ✓
DominicanRepublic
58.3 25.7 27.2 26.4 21.4 ✓ ✓
Ecuador 52.4 23.6 24.5 25.4 19.5 ✓ ✓
Fiji 29.6 17.1 13.8 16.3 15.1 ✓ ✓
* Gabon 94.4 67.4 44.1 62.0 46.4
Grenada 21.0 13.1 9.8 11.4 9.7 ✓ ✓
Hungary 18.7 6.6 8.7 7.6 6.8 ✓ ✓ ✓
Iran, Islamic Rep. 61.1 26.2 28.5 29.2 24.4 ✓ ✓
* Iraq 46.0 38.6 21.5 30.5 22.0 ✓
Jamaica 34.5 19.0 16.1 18.6 15.4 ✓ ✓
Jordan 36.7 21.1 17.1 20.3 15.9 ✓ ✓
Kazakhstan 57.0 29.2 26.6 31.1 27.1 ✓ ✓
Lebanon 33.1 9.9 15.4 12.4 10.2 ✓ ✓ ✓
Libya 44.1 17.0 20.6 18.3 16.0 ✓ ✓
Macedonia, FYR 37.6 10.2 17.5 13.1 11.2 ✓ ✓ ✓
Malaysia 17.2 6.8 8.0 7.3 5.2 ✓ ✓
Maldives 105.2 12.4 49.1 24.6 20.5 ✓ ✓ ✓
Marshall Islands 51.9 27.7 24.2 28.0 25.7 ✓ ✓
Mauritius 23.9 15.2 11.2 12.8 10.5 ✓ ✓
* Mexico 48.8 16.6 22.8 20.6 17.7 ✓ ✓ ✓
Montenegro 17.6 7.6 8.2 8.4 7.2 ✓ ✓
Namibia 72.8 45.9 34.0 48.2 42.4 ✓
Palau 32.3 19.1 15.1 18.9 17.5 ✓ ✓
Panama 33.3 20.0 15.5 17.9 15.3 ✓ ✓
* Peru 75.1 19.4 35.0 26.9 20.9 ✓ ✓ ✓
Romania 37.4 13.6 17.5 18.2 15.1 ✓ ✓ ✓
Serbia 28.6 7.4 13.3 10.4 8.5 ✓ ✓ ✓
Seychelles 16.6 13.9 7.7 10.0 8.1 ✓ ✓
* South Africa 62.3 52.6 29.1 50.2 44.1
St. Lucia 22.5 15.8 10.5 13.1 10.8 ✓ ✓
Cohen
etal.G
lobalizationand
Health
2014,10:67Page
10of
19http://w
ww.globalizationandhealth.com
/content/10/1/67
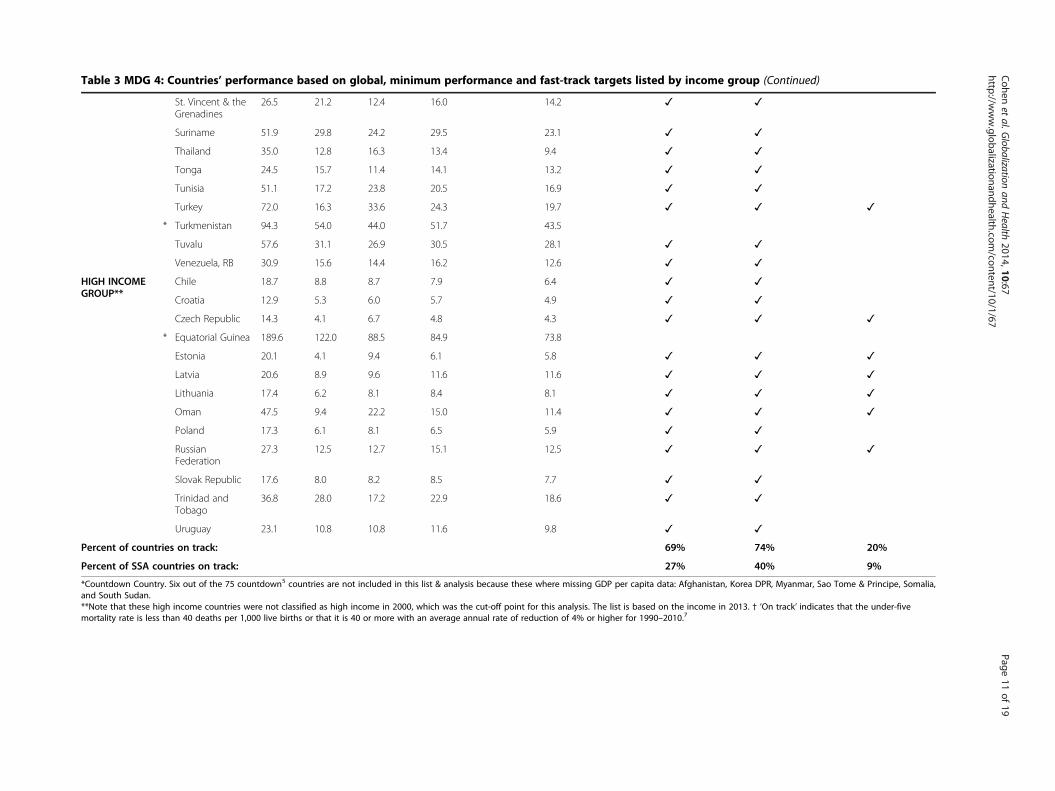
Table 3 MDG 4: Countries’ performance based on global, minimum performance and fast-track targets listed by income group (Continued)
St. Vincent & theGrenadines
26.5 21.2 12.4 16.0 14.2 ✓ ✓
Suriname 51.9 29.8 24.2 29.5 23.1 ✓ ✓
Thailand 35.0 12.8 16.3 13.4 9.4 ✓ ✓
Tonga 24.5 15.7 11.4 14.1 13.2 ✓ ✓
Tunisia 51.1 17.2 23.8 20.5 16.9 ✓ ✓
Turkey 72.0 16.3 33.6 24.3 19.7 ✓ ✓ ✓
* Turkmenistan 94.3 54.0 44.0 51.7 43.5
Tuvalu 57.6 31.1 26.9 30.5 28.1 ✓ ✓
Venezuela, RB 30.9 15.6 14.4 16.2 12.6 ✓ ✓
HIGH INCOMEGROUP**
Chile 18.7 8.8 8.7 7.9 6.4 ✓ ✓
Croatia 12.9 5.3 6.0 5.7 4.9 ✓ ✓
Czech Republic 14.3 4.1 6.7 4.8 4.3 ✓ ✓ ✓
* Equatorial Guinea 189.6 122.0 88.5 84.9 73.8
Estonia 20.1 4.1 9.4 6.1 5.8 ✓ ✓ ✓
Latvia 20.6 8.9 9.6 11.6 11.6 ✓ ✓ ✓
Lithuania 17.4 6.2 8.1 8.4 8.1 ✓ ✓ ✓
Oman 47.5 9.4 22.2 15.0 11.4 ✓ ✓ ✓
Poland 17.3 6.1 8.1 6.5 5.9 ✓ ✓
RussianFederation
27.3 12.5 12.7 15.1 12.5 ✓ ✓ ✓
Slovak Republic 17.6 8.0 8.2 8.5 7.7 ✓ ✓
Trinidad andTobago
36.8 28.0 17.2 22.9 18.6 ✓ ✓
Uruguay 23.1 10.8 10.8 11.6 9.8 ✓ ✓
Percent of countries on track: 69% 74% 20%
Percent of SSA countries on track: 27% 40% 9%
*Countdown Country. Six out of the 75 countdown5 countries are not included in this list & analysis because these where missing GDP per capita data: Afghanistan, Korea DPR, Myanmar, Sao Tome & Principe, Somalia,and South Sudan.**Note that these high income countries were not classified as high income in 2000, which was the cut-off point for this analysis. The list is based on the income in 2013. † ‘On track’ indicates that the under-fivemortality rate is less than 40 deaths per 1,000 live births or that it is 40 or more with an average annual rate of reduction of 4% or higher for 1990–2010.7
Cohen
etal.G
lobalizationand
Health
2014,10:67Page
11of
19http://w
ww.globalizationandhealth.com
/content/10/1/67
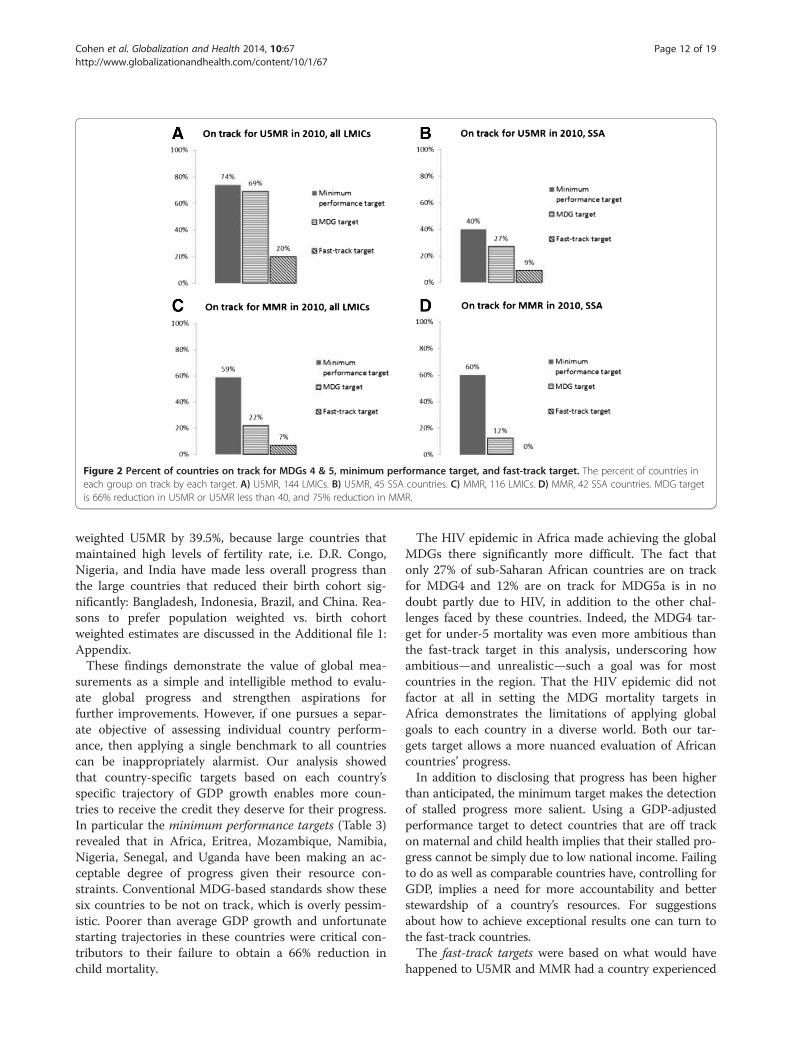
Figure 2 Percent of countries on track for MDGs 4 & 5, minimum performance target, and fast-track target. The percent of countries ineach group on track by each target. A) U5MR, 144 LMICs. B) U5MR, 45 SSA countries. C) MMR, 116 LMICs. D) MMR, 42 SSA countries. MDG targetis 66% reduction in U5MR or U5MR less than 40, and 75% reduction in MMR.
Cohen et al. Globalization and Health 2014, 10:67 Page 12 of 19http://www.globalizationandhealth.com/content/10/1/67
weighted U5MR by 39.5%, because large countries thatmaintained high levels of fertility rate, i.e. D.R. Congo,Nigeria, and India have made less overall progress thanthe large countries that reduced their birth cohort sig-nificantly: Bangladesh, Indonesia, Brazil, and China. Rea-sons to prefer population weighted vs. birth cohortweighted estimates are discussed in the Additional file 1:Appendix.These findings demonstrate the value of global mea-
surements as a simple and intelligible method to evalu-ate global progress and strengthen aspirations forfurther improvements. However, if one pursues a separ-ate objective of assessing individual country perform-ance, then applying a single benchmark to all countriescan be inappropriately alarmist. Our analysis showedthat country-specific targets based on each country’sspecific trajectory of GDP growth enables more coun-tries to receive the credit they deserve for their progress.In particular the minimum performance targets (Table 3)revealed that in Africa, Eritrea, Mozambique, Namibia,Nigeria, Senegal, and Uganda have been making an ac-ceptable degree of progress given their resource con-straints. Conventional MDG-based standards show thesesix countries to be not on track, which is overly pessim-istic. Poorer than average GDP growth and unfortunatestarting trajectories in these countries were critical con-tributors to their failure to obtain a 66% reduction inchild mortality.
The HIV epidemic in Africa made achieving the globalMDGs there significantly more difficult. The fact thatonly 27% of sub-Saharan African countries are on trackfor MDG4 and 12% are on track for MDG5a is in nodoubt partly due to HIV, in addition to the other chal-lenges faced by these countries. Indeed, the MDG4 tar-get for under-5 mortality was even more ambitious thanthe fast-track target in this analysis, underscoring howambitious—and unrealistic—such a goal was for mostcountries in the region. That the HIV epidemic did notfactor at all in setting the MDG mortality targets inAfrica demonstrates the limitations of applying globalgoals to each country in a diverse world. Both our tar-gets target allows a more nuanced evaluation of Africancountries’ progress.In addition to disclosing that progress has been higher
than anticipated, the minimum target makes the detectionof stalled progress more salient. Using a GDP-adjustedperformance target to detect countries that are off trackon maternal and child health implies that their stalled pro-gress cannot be simply due to low national income. Failingto do as well as comparable countries have, controlling forGDP, implies a need for more accountability and betterstewardship of a country’s resources. For suggestionsabout how to achieve exceptional results one can turn tothe fast-track countries.The fast-track targets were based on what would have
happened to U5MR and MMR had a country experienced

Table 4 MDG 5a: Countries’ performance based on global, minimum performance and fast-track targets listed by income group
MMR MDG target MMR alternative 1minimum performancetarget
MMR alternative 2fast-track target
SUMMARY OF COUNTRIES ON TRACK†
(Time projections only) (Time & GDP adjusted) (Time, GDP, & X-factor adjusted)
Income group Country MMRActual1990
MMRActual2010
MDG 5aTarget for2010
2010 Target adjustedfor GDP and countrytrajectory
2010 Target based onadoption of best attainablepolicies in the region
On track byglobal MDG 5atarget
On track by minimumperformance target
On track byfast-tracktarget
LOW INCOMEGROUP
* Bangladesh 800.0 240.0 320.0 392.7 216.4 ✓ ✓
* Benin 770.0 350.0 308.0 488.0 166.8 ✓
Burkina Faso 700.0 300.0 280.0 379.2 122.9 ✓
Burundi 1100.0 800.0 440.0 1137.4 308.3 ✓
* Cambodia 830.0 250.0 332.0 346.4 207.8 ✓ ✓
* Central AfricanRepublic
930.0 890.0 372.0 820.8 411.0
Chad 920.0 1100.0 368.0 635.3 298.4
Comoros 440.0 280.0 176.0 391.0 160.9 ✓
Congo, Dem.Rep.
930.0 540.0 372.0 1667.5 504.7 ✓
* Eritrea 880.0 240.0 352.0 450.1 97.0 ✓ ✓
* Ethiopia 950.0 350.0 380.0 604.3 173.2 ✓ ✓
* Gambia, The 700.0 360.0 280.0 512.2 198.3 ✓
Guinea 1200.0 610.0 480.0 873.0 298.6 ✓
* Guinea-Bissau 1100.0 790.0 440.0 921.8 267.8 ✓
Haiti 620.0 350.0 248.0 490.4 78.1 ✓
Kenya 400.0 360.0 160.0 319.2 115.4
* Kyrgyz Republic 73.0 71.0 29.2 72.0 45.6 ✓
* Liberia 1200.0 770.0 480.0 791.2 282.4 ✓
* Madagascar 640.0 240.0 256.0 566.2 154.7 ✓ ✓
Malawi 1100.0 460.0 440.0 661.1 169.0 ✓
Mali 1100.0 540.0 440.0 681.0 241.5 ✓
* Mozambique 910.0 490.0 364.0 453.0 182.5
* Nepal 770.0 170.0 308.0 424.1 160.3 ✓ ✓
Niger 1200.0 590.0 480.0 1062.5 282.5 ✓
Rwanda 910.0 340.0 364.0 593.1 197.5 ✓ ✓
Sierra Leone 1300.0 890.0 520.0 1191.9 419.9 ✓
Tajikistan 94.0 65.0 37.6 147.5 70.0 ✓ ✓
Cohen
etal.G
lobalizationand
Health
2014,10:67Page
13of
19http://w
ww.globalizationandhealth.com
/content/10/1/67
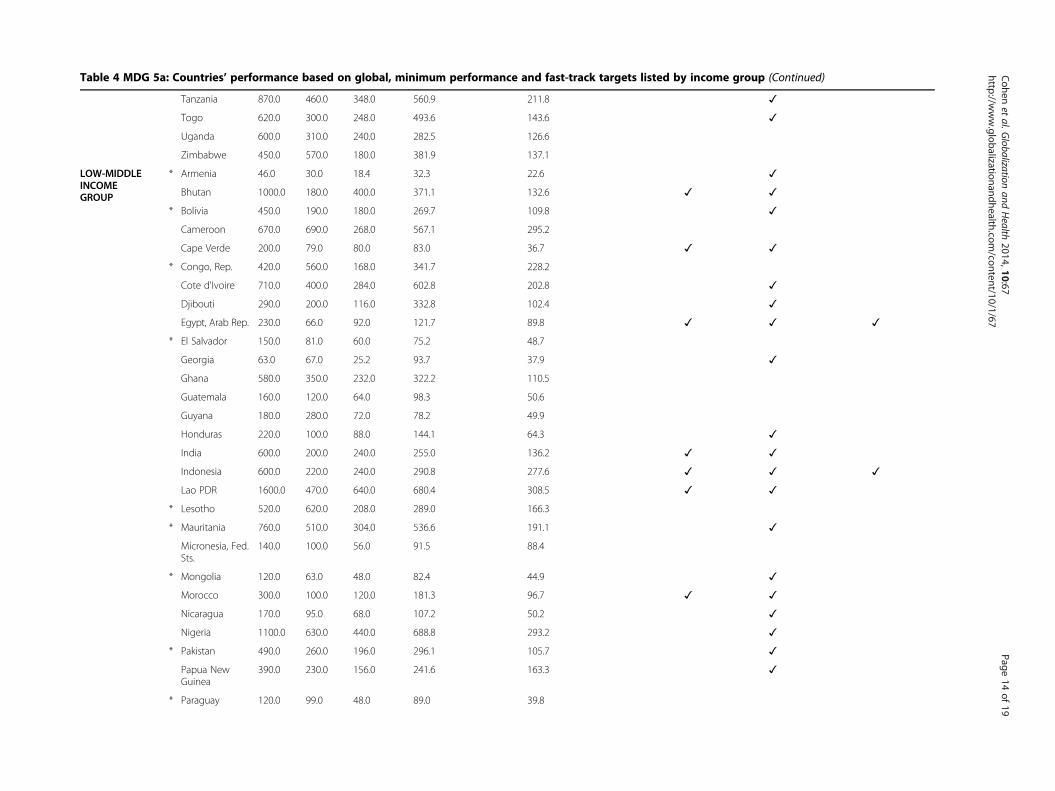
Table 4 MDG 5a: Countries’ performance based on global, minimum performance and fast-track targets listed by income group (Continued)
Tanzania 870.0 460.0 348.0 560.9 211.8 ✓
Togo 620.0 300.0 248.0 493.6 143.6 ✓
Uganda 600.0 310.0 240.0 282.5 126.6
Zimbabwe 450.0 570.0 180.0 381.9 137.1
LOW-MIDDLEINCOMEGROUP
* Armenia 46.0 30.0 18.4 32.3 22.6 ✓
Bhutan 1000.0 180.0 400.0 371.1 132.6 ✓ ✓
* Bolivia 450.0 190.0 180.0 269.7 109.8 ✓
Cameroon 670.0 690.0 268.0 567.1 295.2
Cape Verde 200.0 79.0 80.0 83.0 36.7 ✓ ✓
* Congo, Rep. 420.0 560.0 168.0 341.7 228.2
Cote d'Ivoire 710.0 400.0 284.0 602.8 202.8 ✓
Djibouti 290.0 200.0 116.0 332.8 102.4 ✓
Egypt, Arab Rep. 230.0 66.0 92.0 121.7 89.8 ✓ ✓ ✓
* El Salvador 150.0 81.0 60.0 75.2 48.7
Georgia 63.0 67.0 25.2 93.7 37.9 ✓
Ghana 580.0 350.0 232.0 322.2 110.5
Guatemala 160.0 120.0 64.0 98.3 50.6
Guyana 180.0 280.0 72.0 78.2 49.9
Honduras 220.0 100.0 88.0 144.1 64.3 ✓
India 600.0 200.0 240.0 255.0 136.2 ✓ ✓
Indonesia 600.0 220.0 240.0 290.8 277.6 ✓ ✓ ✓
Lao PDR 1600.0 470.0 640.0 680.4 308.5 ✓ ✓
* Lesotho 520.0 620.0 208.0 289.0 166.3
* Mauritania 760.0 510.0 304.0 536.6 191.1 ✓
Micronesia, Fed.Sts.
140.0 100.0 56.0 91.5 88.4
* Mongolia 120.0 63.0 48.0 82.4 44.9 ✓
Morocco 300.0 100.0 120.0 181.3 96.7 ✓ ✓
Nicaragua 170.0 95.0 68.0 107.2 50.2 ✓
Nigeria 1100.0 630.0 440.0 688.8 293.2 ✓
* Pakistan 490.0 260.0 196.0 296.1 105.7 ✓
Papua NewGuinea
390.0 230.0 156.0 241.6 163.3 ✓
* Paraguay 120.0 99.0 48.0 89.0 39.8
Cohen
etal.G
lobalizationand
Health
2014,10:67Page
14of
19http://w
ww.globalizationandhealth.com
/content/10/1/67
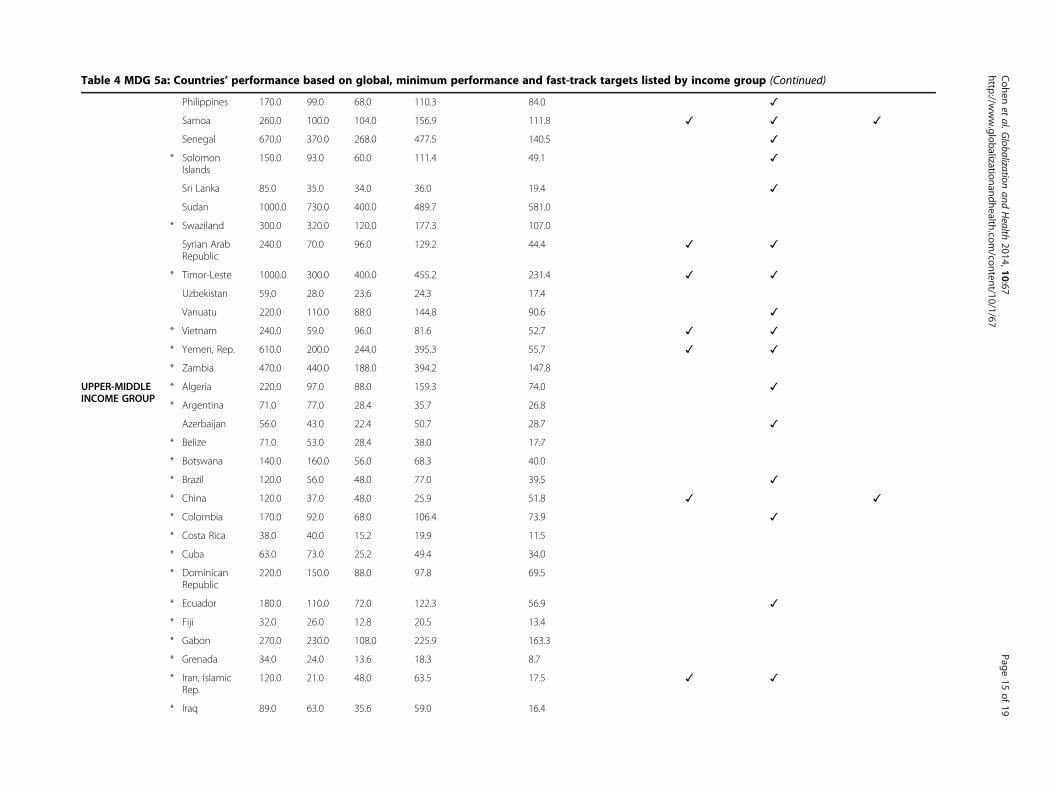
Table 4 MDG 5a: Countries’ performance based on global, minimum performance and fast-track targets listed by income group (Continued)
Philippines 170.0 99.0 68.0 110.3 84.0 ✓
Samoa 260.0 100.0 104.0 156.9 111.8 ✓ ✓ ✓
Senegal 670.0 370.0 268.0 477.5 140.5 ✓
* SolomonIslands
150.0 93.0 60.0 111.4 49.1 ✓
Sri Lanka 85.0 35.0 34.0 36.0 19.4 ✓
Sudan 1000.0 730.0 400.0 489.7 581.0
* Swaziland 300.0 320.0 120.0 177.3 107.0
Syrian ArabRepublic
240.0 70.0 96.0 129.2 44.4 ✓ ✓
* Timor-Leste 1000.0 300.0 400.0 455.2 231.4 ✓ ✓
Uzbekistan 59.0 28.0 23.6 24.3 17.4
Vanuatu 220.0 110.0 88.0 144.8 90.6 ✓
* Vietnam 240.0 59.0 96.0 81.6 52.7 ✓ ✓
* Yemen, Rep. 610.0 200.0 244.0 395.3 55.7 ✓ ✓
* Zambia 470.0 440.0 188.0 394.2 147.8
UPPER-MIDDLEINCOME GROUP
* Algeria 220.0 97.0 88.0 159.3 74.0 ✓
* Argentina 71.0 77.0 28.4 35.7 26.8
Azerbaijan 56.0 43.0 22.4 50.7 28.7 ✓
* Belize 71.0 53.0 28.4 38.0 17.7
* Botswana 140.0 160.0 56.0 68.3 40.0
* Brazil 120.0 56.0 48.0 77.0 39.5 ✓
* China 120.0 37.0 48.0 25.9 51.8 ✓ ✓
* Colombia 170.0 92.0 68.0 106.4 73.9 ✓
* Costa Rica 38.0 40.0 15.2 19.9 11.5
* Cuba 63.0 73.0 25.2 49.4 34.0
* DominicanRepublic
220.0 150.0 88.0 97.8 69.5
* Ecuador 180.0 110.0 72.0 122.3 56.9 ✓
* Fiji 32.0 26.0 12.8 20.5 13.4
* Gabon 270.0 230.0 108.0 225.9 163.3
* Grenada 34.0 24.0 13.6 18.3 8.7
* Iran, IslamicRep.
120.0 21.0 48.0 63.5 17.5 ✓ ✓
* Iraq 89.0 63.0 35.6 59.0 16.4
Cohen
etal.G
lobalizationand
Health
2014,10:67Page
15of
19http://w
ww.globalizationandhealth.com
/content/10/1/67
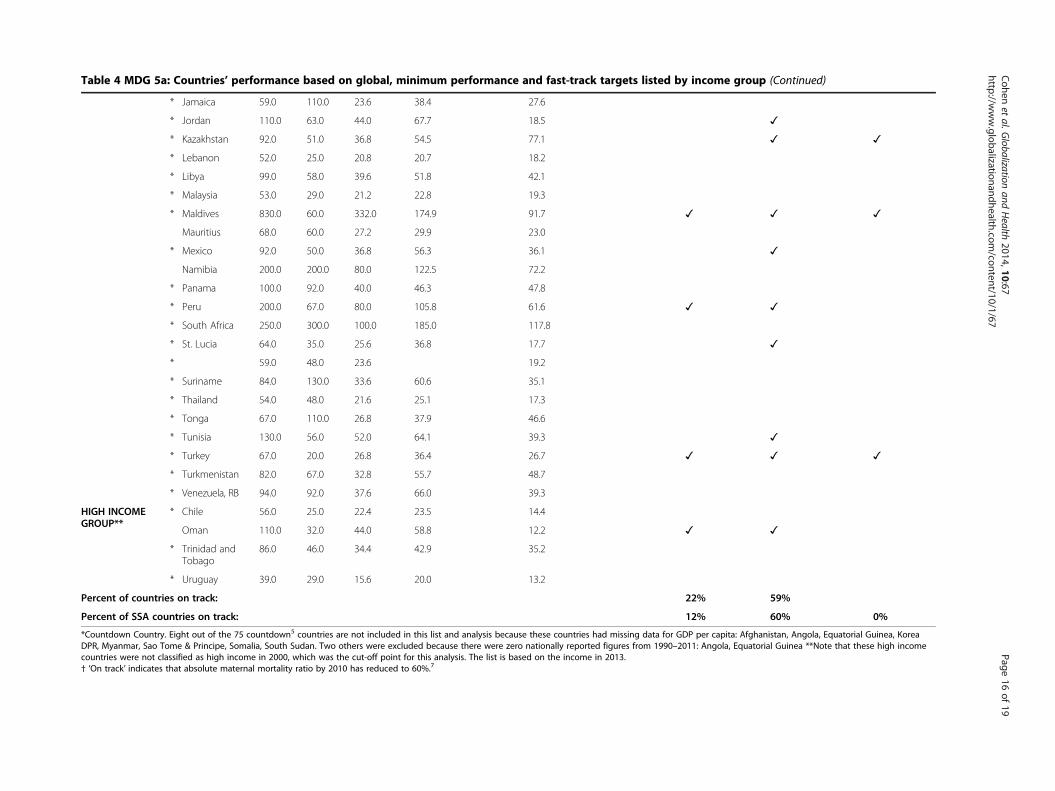
Table 4 MDG 5a: Countries’ performance based on global, minimum performance and fast-track targets listed by income group (Continued)
* Jamaica 59.0 110.0 23.6 38.4 27.6
* Jordan 110.0 63.0 44.0 67.7 18.5 ✓
* Kazakhstan 92.0 51.0 36.8 54.5 77.1 ✓ ✓
* Lebanon 52.0 25.0 20.8 20.7 18.2
* Libya 99.0 58.0 39.6 51.8 42.1
* Malaysia 53.0 29.0 21.2 22.8 19.3
* Maldives 830.0 60.0 332.0 174.9 91.7 ✓ ✓ ✓
Mauritius 68.0 60.0 27.2 29.9 23.0
* Mexico 92.0 50.0 36.8 56.3 36.1 ✓
Namibia 200.0 200.0 80.0 122.5 72.2
* Panama 100.0 92.0 40.0 46.3 47.8
* Peru 200.0 67.0 80.0 105.8 61.6 ✓ ✓
* South Africa 250.0 300.0 100.0 185.0 117.8
* St. Lucia 64.0 35.0 25.6 36.8 17.7 ✓
* 59.0 48.0 23.6 19.2
* Suriname 84.0 130.0 33.6 60.6 35.1
* Thailand 54.0 48.0 21.6 25.1 17.3
* Tonga 67.0 110.0 26.8 37.9 46.6
* Tunisia 130.0 56.0 52.0 64.1 39.3 ✓
* Turkey 67.0 20.0 26.8 36.4 26.7 ✓ ✓ ✓
* Turkmenistan 82.0 67.0 32.8 55.7 48.7
* Venezuela, RB 94.0 92.0 37.6 66.0 39.3
HIGH INCOMEGROUP**
* Chile 56.0 25.0 22.4 23.5 14.4
Oman 110.0 32.0 44.0 58.8 12.2 ✓ ✓
* Trinidad andTobago
86.0 46.0 34.4 42.9 35.2
* Uruguay 39.0 29.0 15.6 20.0 13.2
Percent of countries on track: 22% 59%
Percent of SSA countries on track: 12% 60% 0%
*Countdown Country. Eight out of the 75 countdown5 countries are not included in this list and analysis because these countries had missing data for GDP per capita: Afghanistan, Angola, Equatorial Guinea, KoreaDPR, Myanmar, Sao Tome & Principe, Somalia, South Sudan. Two others were excluded because there were zero nationally reported figures from 1990–2011: Angola, Equatorial Guinea **Note that these high incomecountries were not classified as high income in 2000, which was the cut-off point for this analysis. The list is based on the income in 2013.† ‘On track’ indicates that absolute maternal mortality ratio by 2010 has reduced to 60%.7
Cohen
etal.G
lobalizationand
Health
2014,10:67Page
16of
19http://w
ww.globalizationandhealth.com
/content/10/1/67
Table 5 Different country-specific targets available forpolicy-makers to consider
1) Global targets
2) GDP-adjusted minimum performance targets
3) ‘Success-factor’ adjusted fast-track targets [10,54]
4) Regional best performance targets [9]
5) Targets based on assumptions of new technologies and improvedperformance [55]
Cohen et al. Globalization and Health 2014, 10:67 Page 17 of 19http://www.globalizationandhealth.com/content/10/1/67
the regionally best possible improvements in ten knowndeterminants of child survival. These more stringenttargets highlight the success in lowering U5MR ofBotswana, Liberia, Niger, and Rwanda in sub-SaharanAfrica. Other top performers are Brazil, China, Egypt,El Salvador, Lebanon, Maldives, Mexico, Mongolia, Oman,Peru, Turkey, Vanuatu, and most LMIC European coun-tries. Case studies of these high performers are provingtheir value in showing how these countries are achievingresults beyond what would be expected [47-51].Our study revealed that many African countries are
actually meeting the minimum performance target anddo not deserve to be unfairly labeled as “off track”. Manyso called “off track” countries have actually achievedwhat was reasonably achievable given their available re-sources. Yet still, more than half of sub-Saharan Africahas not met a minimum standard, even adjusting fortheir economic circumstances. Failing to meet the mini-mum performance target suggests that the chief problemis not low GDP growth, but below-average capacity totransform economic growth into better health. The rem-edy for countries that are not achieving GDP adjustedtargets will not lie in economic growth, but rather inbetter use of existing resources to improve health. Exam-ining success factors for the superior performers on thefast-track standard for the region can indicate how coun-tries have achieved better value for money. Botswana,Liberia, Niger, and Rwanda are distinguished in this cat-egory. Botswana has a relatively high GDP, but some of itssuccess can be attributed to having the best control of cor-ruption in all of sub-Saharan Africa and the second bestaccess to clean water (after Mauritius). Botswana also hasnearly complete vaccine coverage. Rwanda’s superb per-formance in maternal and child health has been well doc-umented, especially lower financial barriers for healthservices [47] and dramatic improvements in coverage forrural attended deliveries [48]. Rwanda also had the fourthbest control of corruption score in sub-Saharan Africa in2010. Niger started out with the worst U5MR in the worldin 1990, and has now improved to about average in itssub-region, by improving to average its control of corrup-tion, measles immunization rates, and female primaryschooling, despite still performing poorly on the other in-dicators in the model [51]. Liberia’s recent successes andchallenges were detailed in a case study [52].Four countries—China, Egypt, Maldives, and Turkey—
all MICs, meet the fast-track target for both MDG4 and5. China’s success is well known, [53] and we predictthat case studies of Egypt, Turkey and Maldives publichealth policies will be particularly instructive.
LimitationsThis study is limited by some uncertainty in the meas-urement of U5MR and MMR given that many countries
that lack vital registration systems and the available dataare based on modelled estimates. The statistical modelused in this analysis is more complex than a single glo-bal target that can perhaps be more easily understood bythe general public. The need for statistical techniques todevelop country-specific targets may reduce political in-telligibility. Additionally, the minimum performance targetcould lead some countries to be unnecessarily restrainedin their ambition, and careful framing would be necessaryto avoid this. It is important to note that this study doesnot attempt to provide new evidence on the factors or setof factors that most impact child/maternal health.
Policy implicationsContrary to a common prevalent discourse that therehas been a pervasive failure to meet MDG-based expec-tations for progress in in maternal and child health, ouranalysis implies a less dire and more nuanced situation.The remarkable outpouring of attention to reducing pre-ventable maternal and child deaths has revealed manysuccess stories in places that had been overlookedbefore.The recent history of how the MDGs were used as
country performance targets should alert policy makersthat any global goals announced for the post-2015 erawill be similarly treated. It is also a forewarning of theurgent need for the development community to applytargets that correctly flag both high performers and lowperformers. This paper demonstrates two illustrative pro-totypes for the creation of evidence-informed, country-specific targets that can help take forward the post-2015agenda. Our approach uses primarily a best statistical fitmodel within a set of known success factors, but stake-holders could consider alternative local adjustments, suchas the best observed rate of progress of another country intheir region or income group [9].While global goals have clear value for inducing
shared commitments and simplicity for a broad audi-ence, targets that are informed by specific country situa-tions can supplement global targets. Global targets donot take account of special circumstances in each coun-try. National policymakers typically know their specialcircumstances and justify making allowances if they arenot meeting global targets. The absence of appropriate
Cohen et al. Globalization and Health 2014, 10:67 Page 18 of 19http://www.globalizationandhealth.com/content/10/1/67
country-specific targets can actually impede the abilityof civil society to hold national governments accountablefor achievable progress. When countries correctly iden-tify that they have not made progress relative to theirown potential, it can help organize their own efforts.Having an additional set of customized performance mea-sures would help local decision-makers monitor their ownprogress rather than deferring to global experts and globalcriteria. Recent scholarship has documented several caseswhere policy domination by outside experts has inhibitedthe growth of accountable local systems of governance [6].An approach that builds on our demonstration would in-volve additional stakeholders in developing politically in-telligible, country-specific targets to help national policymakers and stakeholders accurately assess their perform-ance relative to their potential. Table 5 displays severalprominent options for country-specific targets, and showsthat there are a variety of options that can be used to sup-plement global goals when assessing country performancein mortality reduction.
Additional file
Additional file 1: Appendix.
Competing interestsAll authors declare that there is no conflict of interest. This paper reflects thework of the individual authors and should not be interpreted as reflectingthe policies or positions of the institutions with which they are affiliated.
Authors’ contributionsDB, TA and SK conceived the idea. RC, YNA, and DB conducted the study,acquired data, and performed literature review, and data analysis. All authorswere involved in data interpretation and drafting of the paper. All authorsread and approved the final manuscript.
Funding sourcesThis analysis was funded by the Partnership for Maternal, Newborn & ChildHealth, World Health Organization and the Alliance for Health Policy andSystems Research, World Health Organization – as part of the SuccessFactors Study on reducing maternal and child mortality. Role of the fundingsource: the funding sources as agencies had no role in the design, datacollection, data analysis, data interpretation, and writing of the report.Taghreed Adam and Shyama Kuruvilla as technical staff of these agencieswere part of the study team and contributed as technical experts in the area.The corresponding authors had full access to all data in the study and finalresponsibility to submit for publication.This study did not require human subjects research.
Author details1Johns Hopkins Bloomberg School of Public Health, 615 N. Wolfe Street SuiteE4622, Baltimore, MD 21205, USA. 2Alliance for Health Policy and SystemsResearch, World Health Organization, 20 Avenue Appia, 1211 Geneva,Switzerland. 3Partnership for Maternal, Newborn & Child Health, World HealthOrganization, 20 Avenue Appia, 1211 Geneva, Switzerland. 4Results forDevelopment, Washington, DC, USA.
Received: 30 June 2014 Accepted: 25 August 2014
References1. United Nations General Assembly: United Nations Millenium Declaration,
Volume 55. New York: United Nations; 2000.
2. International Monetary Fund (IMF), Organisation for Economic Co-operationand Development (OECD), United Nations (UN), World Bank Group: 2000 abetter world for All; progress toward the international developmentgoals. 2000. http://www.imf.org/external/pubs/ft/jointpub/world/2000/eng/bwae.pdf.
3. Lozano R, Wang H, Foreman KJ, Rajaratnam JK, Naghavi M, Marcus JR,Dwyer-Lindgren L, Lofgren KT, Phillips D, Atkinson C, Lopez AD, Murray CJ:Progress towards millennium development goals 4 and 5 on maternaland child mortality: an updated systematic analysis. Lancet 2011,378:1139–1165.
4. Rajaratnam JK, Marcus JR, Flaxman AD, Wang H, Levin-Rector A, Dwyer L,Costa M, Lopez AD, Murray CJ: Neonatal, postneonatal, childhood, andunder-5 mortality for 187 countries, 1970–2010: a systematic analysis ofprogress towards millennium development goal 4. Lancet 2010,375:1988–2008.
5. World Health Organization and UNICEF: Countdown to 2015: Maternal,Newborn and Child Survival. Washington, DC: World Health Organization andUNICEF; 2012.
6. Easterly W, Vásquez I: The Tyranny of Experts: Economists, Dictators, and theForgotten Rights of the Poor. 2014.
7. Open Working Group on Sustainable Development Goals: OutcomeDocument - Open Working Group on Sustainable Development Goals. NewYork: United Nations; 2014. http://sustainabledevelopment.un.org/content/documents/4518SDGs_FINAL_Proposal%20of%20OWG_19%20July%20at%201320hrsver3.pdf.
8. Kuruvilla S, Schweitzer J, Bishai D, Chowdhury S, Caramani D, Frost L, Cortez R,Daelmans B, de Francisco A, Adam T, Cohen R, Alfonso YA, Franz-Vasdeki J,Saadat S, Pratt BA, Eugster B, Bandali S, Venkatachalam P, Hinton R, Murray J,Arscott-Mills S, Axelson H, Maliqi B, Sarker I, Lakshminarayanan R, Jacobs T, JacksS, Mason E, Ghaffar A, et al: Success factors for reducing maternal and childmortality. Bull World Health Organ 2014. http://dx.doi.org/10.2471/BLT.14.138131.
9. Cohen RL, Bishai DM, Alfonso YN, Kuruvilla S, Schweitzer J: Post-2015health goals: could country-specific targets supplement global ones?The Lancet Global Health 2014, 2:e373–e374.
10. Walker N, Yenokyan G, Friberg IK, Bryce J: Patterns in coverage ofmaternal, newborn, and child health interventions: projections ofneonatal and under-5 mortality to 2035. Lancet 2013, 382:1029–1038.
11. Muldoon K, Galway L, Nakajima M, Kanters S, Hogg R, Bendavid E, Mills E:Health system determinants of infant, child and maternal mortality: across-sectional study of UN member countries. Glob Health 2011, 7:42.
12. Vandemoortle J: The MDG conundrum: meeting the targets withoutmissing the point. Dev Pol Rev 2009, 27:355–371.
13. Easterly W: How the millenium development goals are unfair to Africa.World Dev 2009, 37:26–35.
14. Farag M, Nandakumar AK, Wallack S, Hodgkin D, Gaumer G, Erbil C:The income elasticity of health care spending in developing anddeveloped countries. Int J Health Care Finance Econ 2012, 12:145–162.
15. Farag M, Nandakumar AK, Wallack S, Hodgkin D, Gaumer G, Erbil C: Healthexpenditures, health outcomes and the role of good governance. Int JHealth Care Finance Econ 2013, 13:33–52.
16. Mosley P: Two Africas? Why Africa's `Growth Miracle' is barely reducingpoverty. Manchester, UK: Brooks World Poverty Institute Working PaperSeries 19113; 2013.
17. UN Millennium Project: Investing in Development: A Practical Plan to Achievethe Millennium Development Goals. New York: United Nations DevelopmentProgramme; 2005.
18. Sattler C, Shandra JM: Do health nongovernmental organizations improvechild mortality? Int J Sociol 2012, 42:28–46.
19. Gakidou E, Oza S, Fuertes CV, Li AY, Lee DK, Sousa A, Hogan MC, Hoorn SV,Ezzati M: Improving child survival through environmental and nutritionalinterventions: the importance of targeting interventions toward thepoor. JAMA 2007, 298(16):1876–1887.
20. Günther I, Fink G: Water and Sanitation to Reduce Child Mortality: The Impactand Cost of Water and Sanitation Infrastructure. http://elibrary.worldbank.org/doi/book/10.1596/1813-9450-5618. The World Bank DevelopmentEconomics Prospects Group: Zurich; 2011.
21. Mcguire JW: Basic health care provision and under-5 mortality: a cross-national study of developing countries. World Dev 2006, 34:405–425.
22. Dharmasena S, Capps O Jr: Intended and unintended consequences of aproposed national tax on sugar-sweetened beverages to combat the U.S.obesity problem. Health Econ 2012, 21:669–694.
Cohen et al. Globalization and Health 2014, 10:67 Page 19 of 19http://www.globalizationandhealth.com/content/10/1/67
23. Goldhaber-Fiebert JD, Lipsitch M, Mahal AJ, Zaslavsky AM, Salomon JA:Quantifying child mortality reductions related to measles vaccination.PLoS ONE 2010, 5(11):e13842.
24. Rajkumar AS, Swaroop V: Public spending and outcomes: doesgovernance matter? J Dev Econ 2004, 86:96–111.
25. Nishiyama A: Economic growth and infant mortality in developingcountries. Eur J Dev Res 2011, 23:630–647.
26. Anyanwu JC, Erhijakpor AEO: Health expenditures and health outcomes inAfrica. Afr Dev Rev 2009, 21(2):401–434.
27. El-Jardali F, Jamal D, Abdallah A, Kassak K: Human resources for healthplanning and management in the Eastern Mediterranean Region: facts.gaps and forward thinking for research and policy. Hum Resour Health2007, 5:9.
28. Anand S, Bärnighausen T: Human Resources and Health Outcomes:Cross-Country Econometric Study. Lancet 2004, 364:1603–1609.
29. Shandra CL, Shandra JM, London B: World Bank Structural Adjustment,Water, and Sanitation: A Cross-National Analysis of Child Mortality inSub-Saharan Africa. Organ Environ 2011, 24:107–29.
30. Mukherjee N: Party Systems and Human Well-Being. Party Politics 2011,19(4):601–23.
31. Chauvet L, Gubert F, Mesplé-Somps S: Aid, Remittances, Medical BrainDrain and Child Mortality: Evidence Using Inter and Intra-Country Data.J Dev Stud 2012, 1–18.
32. Stuckler D, Basu S, McKee M: Drivers of Inequality in MillenniumDevelopment Goal Progress: A Statistical Analysis. PLoS Med 2010,7(3):e1000241.
33. Farahani M, Subramanian SV, Canning D: The effect of changes in healthsector resources on infant mortality in the short-run and the long-run: alongitudinal econometric analysis. Soc Sci Med 2009, 68:1918–1925.
34. Castillo-Laborde C: Human resources for health and burden of disease: aneconometric approach. Hum Resour Health 2011, 9:4.
35. Issa H, Ouattara B: The effect of private and public health expenditure oninfant mortality rates: does the level of development matter?Damascus Univ. J 2005, 28(1):21–37.
36. Gottret P, Schieber G: Health Financing Revisited: A Practioner's Guide.Washington DC: The World Bank; 2006.
37. Powell-Jackson T, Basu S, Balabanova D, McKee M, Stuckler D: Democracyand growth in divided societies: A health-inequality trap? Soc Sci Med2011, 73:33–41.
38. The World Bank: World Development Report 2002: Building Institutions forMarkets. Washington DC: Oxford University Press; 2001.
39. World Health Organization (WHO): Global Health Observatory DataRepository, Volume 2013. Geneva; 2013.
40. Global Health Expenditure Database: National Health Accounts (NHA).[http://apps.who.int/nha/database]
41. UN Data: A World of Information. [http://data.un.org/Default.aspx]42. International Human Development Indicators. [http://hdr.undp.org/en/
data]43. Childinfo Monitoring the Situation of Children and Women. [http://www.
unicef.org/statistics/index_step1.php]44. World Bank Data: World Development Indicators. [http://databank.
worldbank.org/data/home.aspx]45. STAT Compiler Building Tables with DHS Data. [http://statcompiler.com/]46. Deaton A: The Great Escape: Health, Wealth, and the Origins of Inequality.
Princeton, NJ: Princeton University Press; 2013.47. Sekabaraga C, Diop F, Soucat A: Can innovative health financing policies
increase access to MDG-related services? Evidence from Rwanda.Health Policy Plan 2011, 26(Suppl 2):ii52–ii62.
48. Bucagu M, Kagubare JM, Basinga P, Ngabo F, Timmons BK, Lee AC: Impactof health systems strengthening on coverage of maternal healthservices in Rwanda, 2000–2010: a systematic review. Reprod HealthMatters 2012, 20:50–61.
49. Cheng MH: Reviving health care in Liberia. Lancet 2009, 373:1239–1240.50. Baleta A: Botswana reduces mother-to-child transmission of HIV.
Lancet 2010, 375:1954.51. Amouzou A, Habi O, Bensaid K, Niger Countdown Case Study Working G:
Reduction in child mortality in Niger: a Countdown to 2015 country casestudy. Lancet 2012, 380:1169–1178.
52. Lee PT, Kruse GR, Chan BT, Massaquoi MB, Panjabi RR, Dahn BT, GwenigaleWT: An analysis of Liberia's 2007 national health policy: lessons for
health systems strengthening and chronic disease care in poor,post-conflict countries. Glob Health 2011, 7:37.
53. Meng Q, Xu L, Zhang Y, Qian J, Cai M, Xin Y, Gao J, Xu K, Boerma J, BarberSL: Trends in access to health services and financial protection in Chinabetween 2003 and 2011: a cross-sectional study. Lancet 2012,379:805–814.
54. US Agency for International Development: Acting on the Call: EndingPreventable Child and Maternal Deaths Report. City: USAID; 2014.
55. Wang H, Liddell CA, Coates MM, Mooney MD, Levitz CE, Schumacher AE,Apfel H, Iannarone M, Phillips B, Lofgren KT, Sandar L, Dorrington RE,Rakovac I, Jacobs TA, Liang X, Zhou M, Zhu J, Yang G, Wang Y, Liu S, Li Y,Ozgoren AA, Abera SF, Abubakar I, Achoki T, Adelekan A, Ademi Z, AlemuZA, Allen PJ, Almazroa MA, et al: Global, regional, and national levels ofneonatal, infant, and under-5 mortality during 1990–2013: a systematicanalysis for the Global Burden of Disease Study 2013. Lancet 2014.10.1016/S0140-6736(14)60497-9.
doi:10.1186/s12992-014-0067-7Cite this article as: Cohen et al.: Country progress towards theMillennium Development Goals: adjusting for socioeconomic factorsreveals greater progress and new challenges. Globalization and Health2014 10:67.
Submit your next manuscript to BioMed Centraland take full advantage of:
• Convenient online submission
• Thorough peer review
• No space constraints or color figure charges
• Immediate publication on acceptance
• Inclusion in PubMed, CAS, Scopus and Google Scholar
• Research which is freely available for redistribution
Submit your manuscript at www.biomedcentral.com/submit