country profile libya · libya 3 climate the climatic conditions are influenced by the...
TRANSCRIPT

0 [Type here] Irrigation in Africa in figures - AQUASTAT Survey - 2016
Country profile – Libya
Version 2016


Recommended citation: FAO. 2016. AQUASTAT Country Profile – Libya.
Food and Agriculture Organization of the United Nations (FAO). Rome, Italy
The designations employed and the presentation of material in this information product do not imply the expression of any opinion whatsoever on the part of the Food and Agriculture Organization of the United Nations (FAO) concerning the legal or development status of any country, territory, city or area or of its authorities, or concerning the delimitation of its frontiers or boundaries. The mention of specific companies or products of manufacturers, whether or not these have been patented, does not imply that these have been endorsed or recommended by FAO in preference to others of a similar nature that are not mentioned. The views expressed in this information product are those of the author(s) and do not necessarily reflect the views or policies of FAO. FAO encourages the use, reproduction and dissemination of material in this information product. Except where otherwise indicated, material may be copied, downloaded and printed for private study, research and teaching purposes, or for use in non-commercial products or services, provided that appropriate acknowledgement of FAO as the source and copyright holder is given and that FAO’s endorsement of users’ views, products or services is not implied in any way. All requests for translation and adaptation rights, and for resale and other commercial use rights should be made via www.fao.org/contact-us/licencerequest or addressed to [email protected]. FAO information products are available on the FAO website (www.fao.org/ publications) and can be purchased through [email protected]. © FAO 2016
1
Libya
GEOGRAPHY, CLIMATE AND POPULATION
Geography
Libya has a total area of about 1.76 million km². It is bordered in the north by the Mediterranean Sea, in
the east by Egypt, in the southeast by Sudan, in the south by Chad and Niger, and in the west by Algeria
and Tunisia. Four physiographic regions can be distinguished:
The coastal plains that run along the Libyan coast and vary in width;
The northern mountains that run close to the coastal plains and include the Jabal Nafusah in the
west and the Jabal al Akhdar in the east;
The internal depressions that cover the centre of Libya and include several oases;
The southern and western mountains.
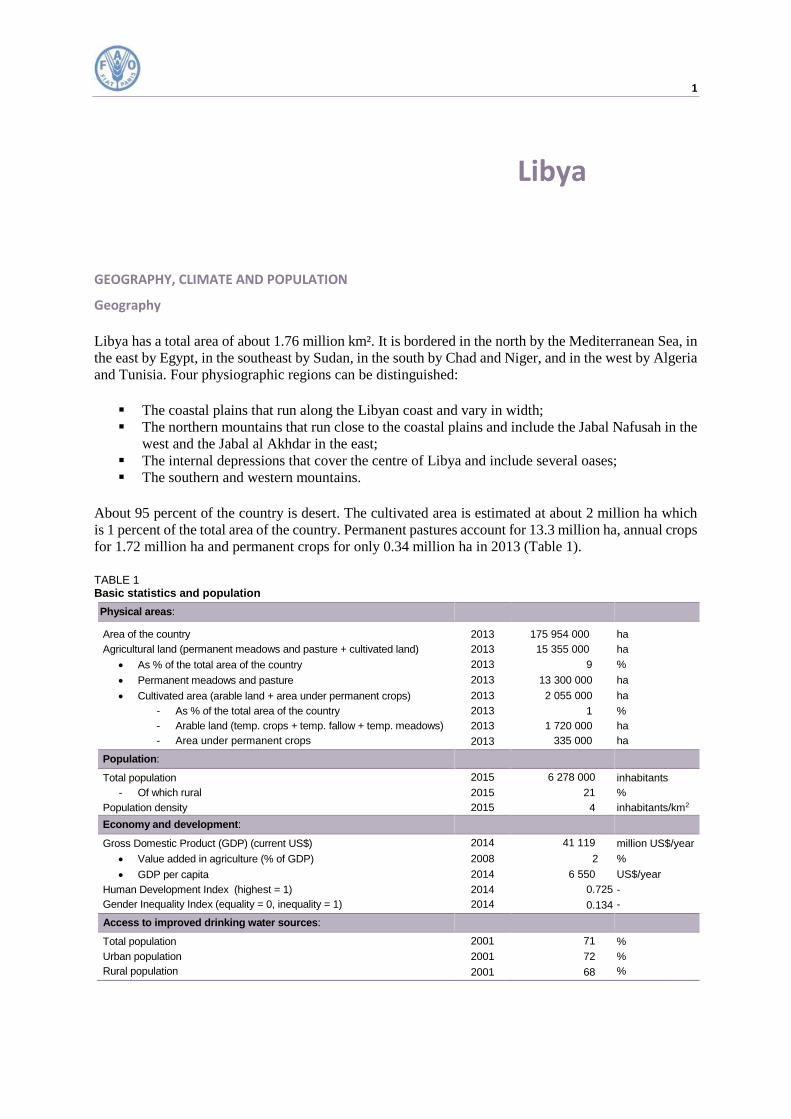
About 95 percent of the country is desert. The cultivated area is estimated at about 2 million ha which
is 1 percent of the total area of the country. Permanent pastures account for 13.3 million ha, annual crops
for 1.72 million ha and permanent crops for only 0.34 million ha in 2013 (Table 1).
TABLE 1 Basic statistics and population
Physical areas:
Area of the country 2013 175 954 000 ha
Agricultural land (permanent meadows and pasture + cultivated land) 2013 15 355 000 ha
As % of the total area of the country 2013 9 %
Permanent meadows and pasture 2013 13 300 000 ha
Cultivated area (arable land + area under permanent crops) 2013 2 055 000 ha
- As % of the total area of the country 2013 1 %
- Arable land (temp. crops + temp. fallow + temp. meadows) 2013 1 720 000 ha
- Area under permanent crops 2013 335 000 ha
Population:
Total population 2015 6 278 000 inhabitants
- Of which rural 2015 21 %
Population density 2015 4 inhabitants/km2
Economy and development:
Gross Domestic Product (GDP) (current US$) 2014 41 119 million US$/year
Value added in agriculture (% of GDP) 2008 2 %
GDP per capita 2014 6 550 US$/year
Human Development Index (highest = 1) 2014 0.725 - Gender Inequality Index (equality = 0, inequality = 1) 2014 0.134 -
Access to improved drinking water sources:
Total population 2001 71 %
Urban population 2001 72 %
Rural population 2001 68 %

2 Irrigation in Africa in figures - AQUASTAT Survey - 2016
FIGURE 1
Map of Libya

Libya 3
Climate
The climatic conditions are influenced by the Mediterranean Sea to the north and the Sahara desert to
the south, resulting in an abrupt transition from one kind of weather to another. The following broad
climatic divisions can be made:
The Mediterranean coastal strip has dry summers and relatively wet winters;
The Jabal Natusah and Jabal al Akhdar highlands experience a steppe climate with higher
rainfall and humidity and low winter temperatures, including snow on the hills;
Moving southwards to the interior, pre-desert and desert climatic conditions prevail, with torrid
temperatures and large daily thermal variations; rain is rare and irregular and diminishes
progressively towards zero.
Annual rainfall is extremely low, with about 93 percent of the land surface receiving less than 100
mm/year. The highest rainfall occurs in the northern Tripoli region (Jabal Nafusah and Jifarah plains)
and in the northern Benghazi region (Jabal al Akhdar), these two areas being the only ones where the
average annual rainfall exceeds the minimum value (250-300 mm) considered necessary to sustain
rainfed agriculture. Rainfall occurs during the winter months (October-March), but great variability is
observed from place to place and from year to year. Average annual rainfall for the country as a whole
is 56 mm. Temperatures vary between over 40ËšC in summer to below zero in winter.
Population
Total population was about 6.3 million in 2015, of which only 21 percent is rural. The annual population
growth rate for the period 2005-2015 was estimated at 0.8 percent in sharp decline since the 1980s and
1990s, when it was 4.2 and 2.8 percent respectively (GIA and UNDP, 2008). Immigrants from Arab
states–especially Egypt–and from Sub-Saharan Africa reached over 2 million in the 2000s,
representing over one third of the population. One third of the immigrants were female. Half a million
had left the country after three months of conflict in 2011. The average population density of about 4
inhabitants/km² varies between 300 inhabitants/km² in the northern coastal regions, being one of the
highest population density on arable land, to less than 1 inhabitant/km² in the south. An estimated 85
percent of the population lives in or around the coastal cities, especially the capital Tripoli and Benghazi.
In 2014, the Human Development Index considers Libya as a country with high human development
ranking 94 among 188 countries, while the Gender Inequality Index (GII) ranks it 27 among 155
countries, for which information was available (UNDP, 2016). Life expectancy in Libya is almost 72
years in 2013 and the under-five mortality is 13 per 1000 births in 2015, both progressing from 70 years
and 32 per 1000 in the 1990s. With no significant distinction between boys and girls, almost all children
in 2007 are enrolled in primary education (GIA and UNDP, 2008). Adult literacy is 90 percent in 2013,
with a significant difference between female and male (84 versus 96 percent respectively; WB, 2016).
Poverty concerns 13 percent of the population in 2003 (GIA and UNDP, 2008). Data about access to
safe water and appropriate sewage in the country are conflicting, depending on the sources due to the
fact that the definition used for the monitoring of these millennium development goals (MDGs) was
different at national level and thus not recognized globally. The only figure recognized dates back to
1992 with 71 percent of the total population having access to safe water, with little difference between
rural (68 percent) and urban population (72 percent; JMP, 2015). The share of households relying on
public taps from drinking water decreased from 58 percent in 2003 to 44 percent in 2007, probably due
to water pollution. There was a corresponding increase in the uptake of wells/boreholes and bottled
water as main sources of drinking water. Using this figure of the total population connected to public
networks and private wells in 2005, and assuming that well water is protected, the JMP estimated the
access to safe water at 88 percent in 2005 (90 and 82 percent respectively for urban and rural population;
UNDP, 2010). Access to appropriate sewage network is more largely spread with 95 percent of the
population having it in 1995 and 98 percent in 2007 (GIA and UNDP, 2008). According to the 2007 Pan
Arab Population and Family Health Project, only 63 percent of households in Libya are connected to a

4 Irrigation in Africa in figures - AQUASTAT Survey - 2016
waste liquid disposal network, and 40 percent are using septic tanks. Living conditions and amenities
are rudimentary in the south outside oil-exploitation areas (WFP and FAO, 2011).
ECONOMY, AGRICULTURE AND FOOD SECURITY
Libya enjoys large natural geological resources, in particular oil and gas, as well as minerals such as
iron, silicate and limestone. The Libyan economy is one of the most oil-dependent in the world. The
political changes in 2011 incurred a collapse in political and economic governance with two rival
parliaments and some militias controlling the oil production. Hence in 2011, the GDP declined by over
60 percent, but recovered the following year to decline again progressively since then. In 2014, the GDP
was US$ 41 119 million (current US$) but was very variable from year to year even before the 2011
events depending on the oil prices. Unemployment affected 26 percent of the active population by 2010
and is unlikely to improve with the dual government as a large share of the population was employed in
the public sector (FAO, 2015). Oil rents account generally for half of the GDP, almost 57 percent in
2012 and 44 percent in 2013, and are completed by gas rents, accounting for 6 percent of the GDP in
2008. Services account for almost 20 percent and manufacturing for 4.5 percent in 2008 (GIA and
UNDP, 2008). The oil fields are mostly in the desert, with few being offshore.
Agriculture contributed 1.9 percent to the GDP in 2008 (WB, 2016) and was similar in 2010 (WFP and
FAO, 2011). It has declined over time as the importance of the oil rose. The sector employs around 6
percent of the active population (GIA and UNDP, 2008). Most agriculturally productive land is limited
to a strip along the Mediterranean Sea, where most rain falls. The two main areas of natural farmland
are the high coastal plateau of Jabal al Akhdar in the north-east and the fertile coastal plain of
Tripolitania and Cyrenaica in the north-west, where irrigation is still vital. There are some oases in the
desert where water is available from shallow wells. Wheat and barley are the major cereals grown in the
country. Other important crops include olives, grapes, dates, almonds and oranges. The main agricultural
products exported are groundnuts, which represented about 50 percent of all agricultural exports.
Livestock is also important with poultry (24.8 million estimated in 2008), small ruminants (5.1 million
sheep, 1.9 million goats) and cattle (210 000). Only small amounts of meat and dry milk are imported,
but the sector relies heavily on subsidized imports of animal feed. There are currently about 170 000
farm holders of which almost 40 percent are full-time farmers. Close to 90 percent of the farms are less
than 20 ha and only 1 percent greater than 100 ha (WFP and FAO, 2011).
Pre-2011, the country usually imported 80 percent of its food consumption requirement, and up to 90
percent of its cereals requirements. The main agricultural products imported are wheat flour, maize oil
and milk, corresponding to about 40 percent of all agricultural products imported (WFP and FAO, 2011).
The civil conflict deteriorated the food security due to destruction of public infrastructure, disruption of
social services, internally displaced persons and labour shortage resulting from the massive departure of
foreign workers since the conflict, that were working in large part in agricultural activities (FAO, 2015).
The Libyan government had an extensive social protection and price subsidies including for food staples,
housing and energy (WFP and FAO, 2011).
WATER RESOURCES
With very limited perennial water resources, Libya relies almost completely on non-renewable, fossil,
groundwater resources (MWR and CEDARE, 2014). There are no permanent rivers in Libya, only
ephemeral rivers or wadis. The main natural lakes are the Ubari lakes in the Ubari Sand Sea in the south,
including the Gaberoun, Mandara and Mafo akes–, the protected Ouau en Namu lakes and the 23rd of
July or Benghazi lake, which is actually a lagoon. There are two Ramsar sites since 2000: Ain Elshakika
and Ain Elzarga totalling 83 ha. The Qattara Depression in the north-west of Libya lies under the sea
level and is covered with temporary lakes, salt pans and salt marshes. Other large salt pans include
Sabkhat al Hayshah close to the coast near the gulf of Sidra, and Sabkhat Shunayn and Ghuzayyil in the
north-east.

Libya 5
Libya has a large number of natural springs in particular in the northern parts of the country, many of
which are of good quality water. Some of the larger sources are Ayn Zayana, Ayn Kaam, Ayn Dabbousia
and Ayn Tawargha (CEDARE, 2014).
Five major aquifers underlie Libya (Table 2). The first two aquifers are interconnected and form the
Western Aquifer. Only the coastal aquifers, the Al Jefara in the north-west and the Al Jabal al Akhdar
in the north east are shallow and naturally recharged from the rainfall, as well as part of the Al Hamada
aquifer. Part of the Al Hamada, the Murzuq and the Al Sarir-Kufra aquifers, south of 29° North latitude,
belong to the great sedimentary basins and are fossil water reserves where the water was stored during
the Quaternary. The Al Sarir-Kufra aquifer is part of the Nubian Sandstone Aquifer System (NSAS),
the largest aquifer in the world covering an area of about 2 million km² in Libya, Chad, Sudan and Egypt.
The Al Hamada aquifer is part of the North Western Saharan Aquifer System (NWSAS) shared with
Algeria and Tunisia and consisting of the shallow Terminal Complex sandstone and limestone aquifers
and the deeper Continental Interlayer sandstone aquifer.
TABLE 2 Major aquifers in Libya (Abdudayem and Scott, 2014)
Aquifers Areas within Libya (km2)
1. Al Hamada: Jabal Nafusah, Ghadamis and Al Hamada al Hamra sub-basins 215 000 2. Al Jefara Plain 18 000 3. Al Jabal al Akhdar 145 000 4. Murzuq 350 000 5. Al Sarir-Kufra 700 000
Before the 1960s, water from the shallow coastal aquifers could be extracted through wells and
traditional tools thanks to shallow water table. From the 1960s onwards, however, pumps were necessary
due to falling water table coinciding with the oil boom (CEDARE, 2014). During the oil exploration in
the 1950s and 1960s, the deep fossil aquifers were discovered. Their water was first used on site, to
develop agricultural projects in the desert close to the wells, but water scarcity and the intense population
concentration in the north coast triggered the need to their transfer, initiating the Great Man-made River
Project (GMRP) in 1984. Despite an estimated cost of over US$ 30 000 million, Libya relied only on
national funding, especially from the oil sector. The final objective, after completion of the five phases,
is to transfer 5-6 million m³/day to the northern cities through over 500 wells of 500 m deep and about
4 000 km of pipelines. Phase 1 finalized in 1991, being able to convey up to 2 million m³/day of water
for 1 600 km to two reservoirs in the Benghazi and Sirte areas. Phase 2 brought up to 2.5 million m³/day
along 1 227 km to Tripoli from 1997. Phase 3 enabled to transfer an additional 1.68 million m³/day of
water from the Al Sarir aquifer to Tobruk through 621 km of pipeline. Phase 4 will extend the
distribution network from Gadamis (Jabal Nafusah and Al Jefara aquifers) to the coast west of Tripoli,
and phase 5 is intended to join both the eastern and western systems into a single network. However,
the civil unrest stopped further works and some NATO bombings destroyed some reservoirs. Initially
allocated to irrigation, transferred water from the GMRP is used at 98 percent by municipalities (EGA,
2013). Estimations of the availability of fossil water for this transfer vary greatly: between 50 years and
over 4 000 years, depending on actual abstraction of water and sources.
Internal renewable surface water resources are estimated at 200 million m³/year and renewable
groundwater resources at around 600 million m³/year, but 100 million m³/year is considered to overlap
between surface water and groundwater, which gives a value of total internal renewable water resources
(IRWR) of 700 million m³/year (Table 3). No surface water or groundwater is entering the country. The
total renewable water resources are 700 million m³/year, or 111.5 m³/year per capita in 2015, Libya
being thus well under the absolute water scarcity threshold of 500 m³/year per capita. Fossil groundwater
water leaving the country to neighbouring countries is estimated at 700 million m³/year.
Currently 19 dams are in operation, including a secondary dam on Wadi Qattara, for a total storage
capacity of about 390 million m³ (Table 3). However, their average annual storage capacity is only about
61 million m³ and in fact, due to lower flow records or damage to some dams, it is estimated to even not

6 Irrigation in Africa in figures - AQUASTAT Survey - 2016
exceed 30 to 40 million m³/year. Some 20 dams are planned for construction representing an additional
136.6 million m³ of storage and 45 million m³ of additional average annual storage.
TABLE 3 Water resources
Renewable freshwater resources:
Precipitation (long-term average) - 56 mm/yr
- 98 530 million m3/yr
Internal renewable water resources (Long-term average) - 700 million m3/yr
Total renewable water resources - 700 million m3/yr
Dependency ratio - 0 %
Total renewable water resources per inhabitant 2015 112 m3/yr
Total dam capacity 2015 389.89 million m3
Desalination started in Libya in the early 1960s and installed capacity reached 226.3 million m³/year in
2006 for a total of more than 400 desalination plants, including 17 large ones (GEC, 2006). In 2012, the
total desalinated water produced in Libya is estimated at 70 million m³/year aimed at municipal and
industrial water demands and using both thermal and membrane technologies. Thermal desalination
plants are located directly at electricity generation facilities.
Libya also has 79 wastewater treatment plants in 2010 for a total capacity of 74 million m³, all of which
were designed to produce effluents suitable for irrigation. However, out of the 504 million m³ municipal
wastewater produced in 2012, only 40 million m³ were treated and directly used in irrigation on 2 900
ha.
INTERNATIONAL WATER ISSUES
Libya does not share any surface water with other neighbouring countries, but a most of its groundwater
is shared (Table 4).
TABLE 4 Transboundary aquifers (Source: IGRAC, 2014; EGA, 2013)
Aquifer name Total aquifer area (km2)
Sharing countries and respective share (%)
Nubian Sandstone Aquifer System (NSAS) 2 607 9995 Chad (11), Egypt (38), Libya (34), Sudan (17)
Murzuq-Djado basin 450 000 Algeria, Libya, Niger
Northwest Sahara Aquifer System (NWSAS) 1 189 533 Algeria (68), Libya (24), Tunisia (8)
The Joint Authority for Study Development of the NSAS was established in 1992 with its headquarters
in Tripoli, Libya, initially between Egypt and Libya, and then joined by Sudan in 1996 and Chad in
2000. It coordinates the activities of the countries related to the NSAS and enhance cooperation for its
management, in particular through two agreements to exchange updated data.
The Sahara and Sahel Observatory (OSS) hosts a light structure for the management of the NWSAS
since 2002. In 2008, a consulting mechanism was formulated to sustainably manage the groundwater
resource. It includes a permanent Technical Committee composed of the respective national water
authorities, alternatively presided over for one year by the three countries, operating since 2008.
WATER USE
In 2000, the total water withdrawal was estimated at 4 268 million m³, of which 83 percent was
withdrawn for agricultural purposes, 14 percent for municipal purposes and 3 percent for industrial
purposes. More than 30 percent of the municipal water demand was supplied by the Great Manmade
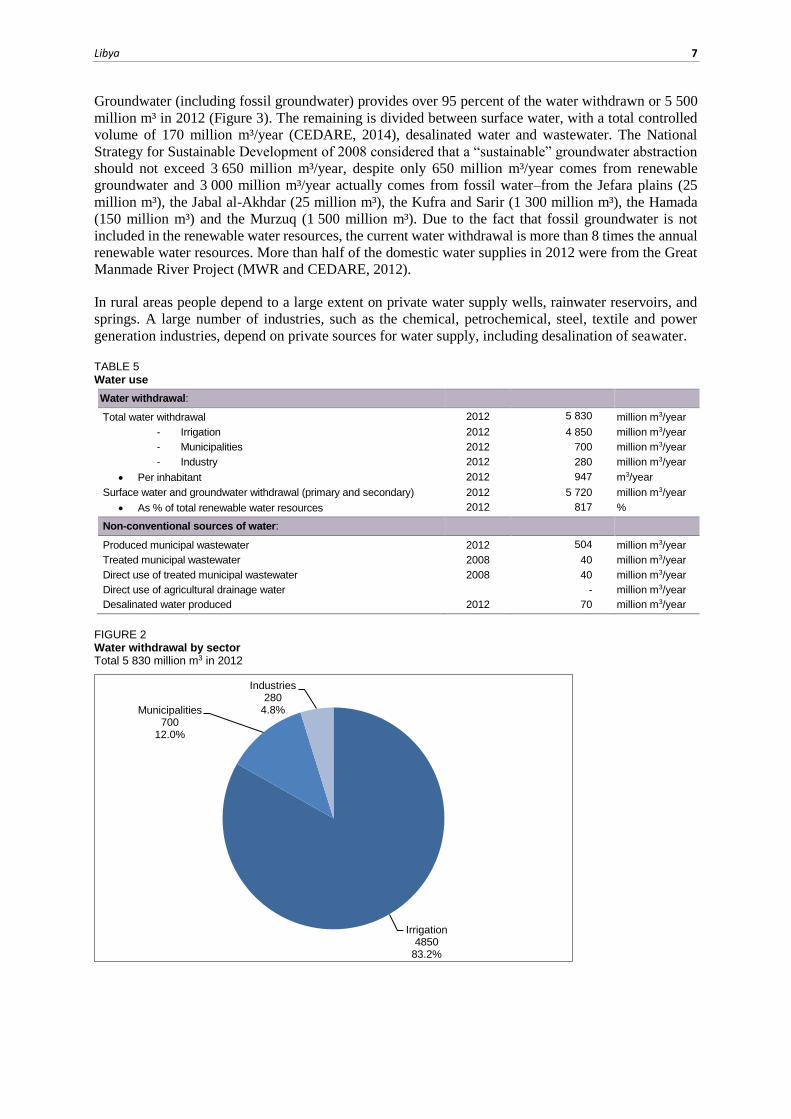
River Project (GMRP). In 2012, the total water withdrawal is estimated at 5 830 million m³, including
4 850 million m³ or 83 percent for agriculture, 700 million m³ or 12 percent for municipalities and 280
million m³ or 5 percent for industries (Table 5 and Figure 2).
Libya 7
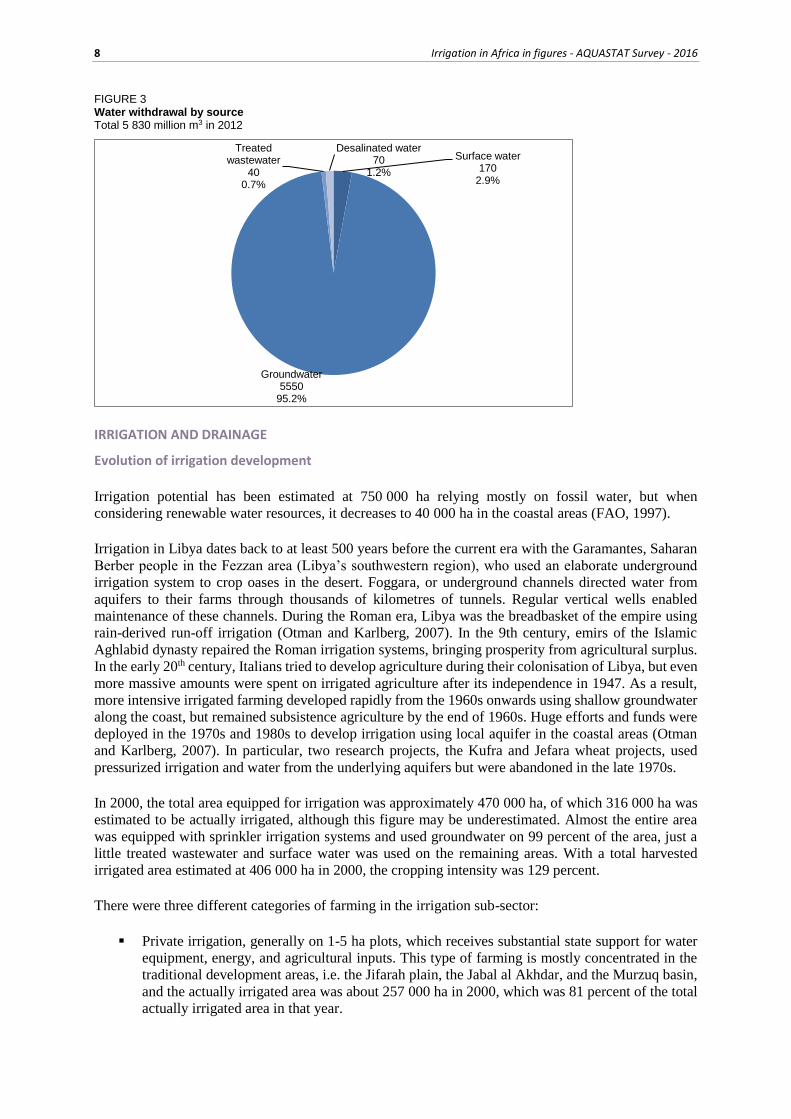
Groundwater (including fossil groundwater) provides over 95 percent of the water withdrawn or 5 500
million m³ in 2012 (Figure 3). The remaining is divided between surface water, with a total controlled
volume of 170 million m³/year (CEDARE, 2014), desalinated water and wastewater. The National
Strategy for Sustainable Development of 2008 considered that a “sustainable” groundwater abstraction
should not exceed 3 650 million m³/year, despite only 650 million m³/year comes from renewable
groundwater and 3 000 million m³/year actually comes from fossil water–from the Jefara plains (25
million m³), the Jabal al-Akhdar (25 million m³), the Kufra and Sarir (1 300 million m³), the Hamada
(150 million m³) and the Murzuq (1 500 million m³). Due to the fact that fossil groundwater is not
included in the renewable water resources, the current water withdrawal is more than 8 times the annual
renewable water resources. More than half of the domestic water supplies in 2012 were from the Great
Manmade River Project (MWR and CEDARE, 2012).
In rural areas people depend to a large extent on private water supply wells, rainwater reservoirs, and
springs. A large number of industries, such as the chemical, petrochemical, steel, textile and power
generation industries, depend on private sources for water supply, including desalination of seawater.
TABLE 5 Water use
Water withdrawal:
Total water withdrawal 2012 5 830 million m3/year
- Irrigation 2012 4 850 million m3/year
- Municipalities 2012 700 million m3/year
- Industry 2012 280 million m3/year
Per inhabitant 2012 947 m3/year
Surface water and groundwater withdrawal (primary and secondary) 2012 5 720 million m3/year
As % of total renewable water resources 2012 817 %
Non-conventional sources of water:
Produced municipal wastewater 2012 504 million m3/year
Treated municipal wastewater 2008 40 million m3/year
Direct use of treated municipal wastewater 2008 40 million m3/year
Direct use of agricultural drainage water - million m3/year
Desalinated water produced 2012 70 million m3/year
FIGURE 2 Water withdrawal by sector Total 5 830 million m3 in 2012
Irrigation4850
83.2%
Municipalities700
12.0%
Industries280
4.8%
8 Irrigation in Africa in figures - AQUASTAT Survey - 2016
FIGURE 3 Water withdrawal by source Total 5 830 million m3 in 2012
IRRIGATION AND DRAINAGE
Evolution of irrigation development
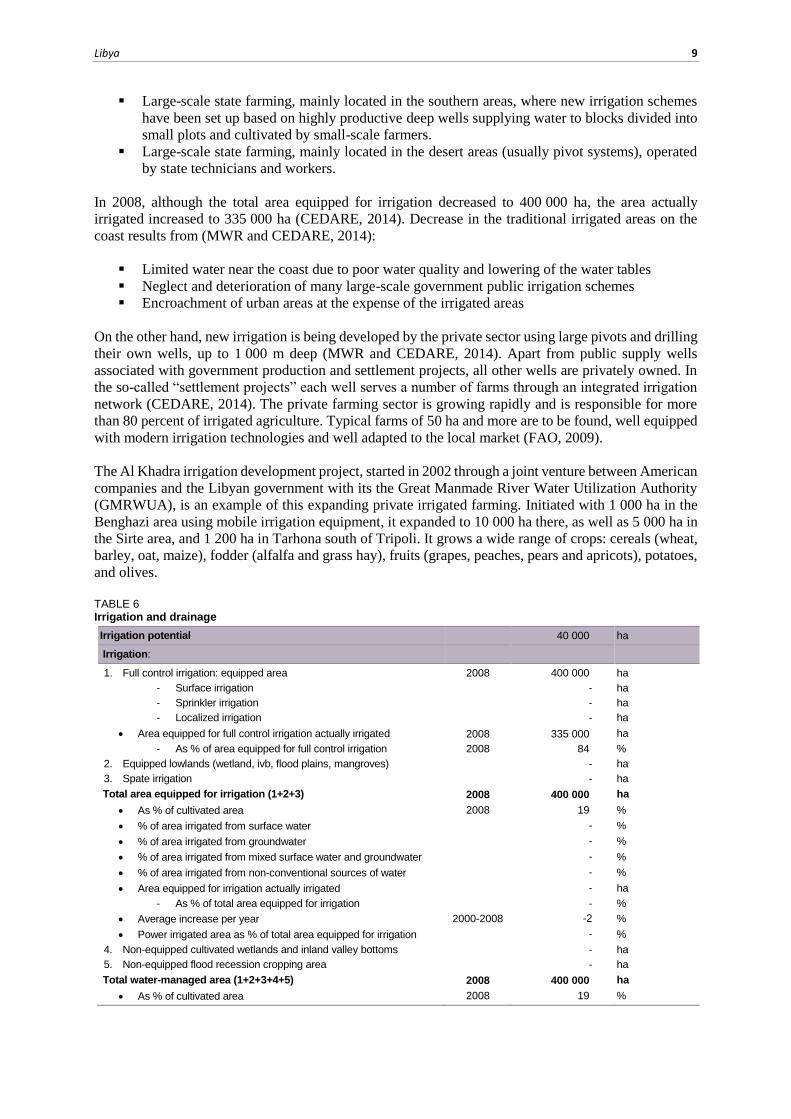
Irrigation potential has been estimated at 750 000 ha relying mostly on fossil water, but when
considering renewable water resources, it decreases to 40 000 ha in the coastal areas (FAO, 1997).
Irrigation in Libya dates back to at least 500 years before the current era with the Garamantes, Saharan
Berber people in the Fezzan area (Libya’s southwestern region), who used an elaborate underground
irrigation system to crop oases in the desert. Foggara, or underground channels directed water from
aquifers to their farms through thousands of kilometres of tunnels. Regular vertical wells enabled
maintenance of these channels. During the Roman era, Libya was the breadbasket of the empire using
rain-derived run-off irrigation (Otman and Karlberg, 2007). In the 9th century, emirs of the Islamic
Aghlabid dynasty repaired the Roman irrigation systems, bringing prosperity from agricultural surplus.
In the early 20th century, Italians tried to develop agriculture during their colonisation of Libya, but even
more massive amounts were spent on irrigated agriculture after its independence in 1947. As a result,
more intensive irrigated farming developed rapidly from the 1960s onwards using shallow groundwater
along the coast, but remained subsistence agriculture by the end of 1960s. Huge efforts and funds were
deployed in the 1970s and 1980s to develop irrigation using local aquifer in the coastal areas (Otman
and Karlberg, 2007). In particular, two research projects, the Kufra and Jefara wheat projects, used
pressurized irrigation and water from the underlying aquifers but were abandoned in the late 1970s.
In 2000, the total area equipped for irrigation was approximately 470 000 ha, of which 316 000 ha was
estimated to be actually irrigated, although this figure may be underestimated. Almost the entire area
was equipped with sprinkler irrigation systems and used groundwater on 99 percent of the area, just a
little treated wastewater and surface water was used on the remaining areas. With a total harvested
irrigated area estimated at 406 000 ha in 2000, the cropping intensity was 129 percent.
There were three different categories of farming in the irrigation sub-sector:
Private irrigation, generally on 1-5 ha plots, which receives substantial state support for water
equipment, energy, and agricultural inputs. This type of farming is mostly concentrated in the
traditional development areas, i.e. the Jifarah plain, the Jabal al Akhdar, and the Murzuq basin,
and the actually irrigated area was about 257 000 ha in 2000, which was 81 percent of the total
actually irrigated area in that year.
Surface water170
2.9%
Groundwater5550
95.2%
Treated wastewater
400.7%
Desalinated water70
1.2%
Libya 9
Large-scale state farming, mainly located in the southern areas, where new irrigation schemes
have been set up based on highly productive deep wells supplying water to blocks divided into
small plots and cultivated by small-scale farmers.
Large-scale state farming, mainly located in the desert areas (usually pivot systems), operated
by state technicians and workers.
In 2008, although the total area equipped for irrigation decreased to 400 000 ha, the area actually
irrigated increased to 335 000 ha (CEDARE, 2014). Decrease in the traditional irrigated areas on the
coast results from (MWR and CEDARE, 2014):
Limited water near the coast due to poor water quality and lowering of the water tables
Neglect and deterioration of many large-scale government public irrigation schemes
Encroachment of urban areas at the expense of the irrigated areas
On the other hand, new irrigation is being developed by the private sector using large pivots and drilling
their own wells, up to 1 000 m deep (MWR and CEDARE, 2014). Apart from public supply wells
associated with government production and settlement projects, all other wells are privately owned. In
the so-called “settlement projects” each well serves a number of farms through an integrated irrigation
network (CEDARE, 2014). The private farming sector is growing rapidly and is responsible for more
than 80 percent of irrigated agriculture. Typical farms of 50 ha and more are to be found, well equipped
with modern irrigation technologies and well adapted to the local market (FAO, 2009).
The Al Khadra irrigation development project, started in 2002 through a joint venture between American
companies and the Libyan government with its the Great Manmade River Water Utilization Authority
(GMRWUA), is an example of this expanding private irrigated farming. Initiated with 1 000 ha in the
Benghazi area using mobile irrigation equipment, it expanded to 10 000 ha there, as well as 5 000 ha in
the Sirte area, and 1 200 ha in Tarhona south of Tripoli. It grows a wide range of crops: cereals (wheat,
barley, oat, maize), fodder (alfalfa and grass hay), fruits (grapes, peaches, pears and apricots), potatoes,
and olives.
TABLE 6 Irrigation and drainage
Irrigation potential 40 000 ha
Irrigation:
1. Full control irrigation: equipped area 2008 400 000 ha
- Surface irrigation - ha
- Sprinkler irrigation - ha
- Localized irrigation - ha
Area equipped for full control irrigation actually irrigated 2008 335 000 ha
- As % of area equipped for full control irrigation 2008 84 %
2. Equipped lowlands (wetland, ivb, flood plains, mangroves) - ha
3. Spate irrigation - ha
Total area equipped for irrigation (1+2+3) 2008 400 000 ha
As % of cultivated area 2008 19 %
% of area irrigated from surface water - %
% of area irrigated from groundwater - %
% of area irrigated from mixed surface water and groundwater - %
% of area irrigated from non-conventional sources of water - %
Area equipped for irrigation actually irrigated - ha
- As % of total area equipped for irrigation - %
Average increase per year 2000-2008 -2 %
Power irrigated area as % of total area equipped for irrigation - %
4. Non-equipped cultivated wetlands and inland valley bottoms - ha
5. Non-equipped flood recession cropping area - ha
Total water-managed area (1+2+3+4+5) 2008 400 000 ha
As % of cultivated area 2008 19 %

10 Irrigation in Africa in figures - AQUASTAT Survey - 2016
TABLE 6 (Continued) Irrigation and drainage
Size of full control irrigation schemes: Criteria:
Small schemes < - ha - ha
Medium schemes > - ha and < - ha - ha
large schemes > - ha - ha
Total number of households in irrigation -
Irrigated crops in full control irrigation schemes:
Total irrigated grain production - metric tons
As % of total grain production - %
Harvested crops: - Total harvested irrigated cropped area - ha
Temporary crops: total - ha
Permanent crops: total - ha
Irrigated cropping intensity (on full control area actually irrigated) - %
Drainage - Environment:
Total cultivated area drained 2000 9 000 ha
Non-irrigated cultivated area drained - ha
Area equipped for irrigation drained - ha
- As % of total area equipped for irrigation 2000 1.9 %
Area salinized by irrigation 1998 190 000 ha
Area waterlogged by irrigation - ha
Role of irrigation in agricultural production, the economy and society
Yields from rainfed as well as irrigated agriculture are generally low. Apart from the aridity of the
climate which reduces rainfed yields, this is due to prevailing shallow, coarse soils with limited natural
fertility and high erosion risks. The average yield of irrigated wheat and barley is much lower than the
yields obtained in other Mediterranean countries. The yields for irrigated fruits, vegetables and oil crops
are generally also lower than in the surrounding countries but for these crops the differences are smaller.
The main irrigated crops are cereals (wheat and barley), olives, fodder (mainly berseem cultivated in
winter) and vegetables.
Given the arid nature of much of Libya, irrigated farming systems have always been of crucial
importance in generating much of the country’s agricultural output. About 50 percent of the cereal
production and about 90 percent of the fruit and vegetable production originate from irrigated
agriculture.
Food security is felt as a moral imperative for the Libyan leaders and huge efforts were made in the
1970s and 1980s to develop irrigated agriculture based on local water resources, and in the 1990s to
create the conditions for the rehabilitation and development of the coastal agriculture through water
transport from the south to the north. However, food security is distinctly different from food self-
sufficiency which is now impossible and will be more and more difficult to achieve in Libya. A debated
question is whether irrigation, mostly the one based on costly water transfer, remains justified in a
situation of water scarcity where the only source of water is non-renewable groundwater and where
economic returns from other sectors (oil industry) would allow an easy access to the international food
market.
Women and irrigation
In 2005-2007, about two thirds of the agricultural workforce were women (WFP, FAO, 2011). However,
due to the lack of community involvement in irrigation and water management, there is no detailed
information available about irrigators in general and about how many women may actually practice
irrigation in particular. Workers on the large-scale private and state farming are traditionally in large
part male migrants, but the situation might have evolved recently after the departure of many migrants
since the 2011 events.
Libya 11
Status and evolution of drainage systems
In Libya, only about 9 000 ha is estimated to be equipped with some form of drainage in 2000. This is
mainly due to the lack of experience in the country and the resulting high cost of drainage installation.
Despite the fact that most of the area under irrigation uses sprinkler irrigation, the extent of the
salinization issue, 190 000 ha in 1998 and probably higher with the increasing groundwater salinity
level, would require more widespread drainage systems.
WATER MANAGEMENT, POLICIES AND LEGISLATION RELATED TO WATER USE IN AGRICULTURE
Institutions
The General Water Authority (GWA) was responsible for water resources management since its
establishment in 1972. In 2012 a ministry was created, the Ministry of Water Resources (MWR), which
combines all institutions dealing with water at national level, including the GWA:
The GWA is responsible for the management of conventional water, both surface water and
groundwater, but not desalinated water, wastewater or water from the GMRP. It is in charge of
water resource assessment and monitoring, and supervision of irrigation and drainage projects
within Libya. It comprises six General Directorates: Planning; Follow-up and Statistics; Water
Resources; Dams, Irrigation and Drainage; Soils; and Finance and Administration. At regional
level the GWA has five branches.
The Great Manmade River Authority (GMRA), established in 1983, deals with the execution of
the GMRP and management of its water.
The Great Manmade River Water Utilization Authority (GMRWUA), established in 1994,
oversees the use of water transported by the GMRP for agricultural purposes.
The General Company for Water and Wastewater (GCWW) was established in 2008 for
operation and maintenance of the water supply and sanitation systems. At regional level the
GCWW has fifteen branches.
The General Company for Water Desalination (GCWD), supplying desalinated water, was
established in 2007 and was previously under the Ministry of Electricity. It oversees desalination
plants that are not thermal, i.e. non-thermal and non-power desalination plants.
In addition, there are several other ministries:
The Environment General Authority is a semi-autonomous organ, reporting directly to the office
of the Prime Minister and setting the limits for contamination level in both drinking water and
effluents. It also monitors water quality.
The Ministry of Housing and Utilities implements water supply and sanitation plans, through
its Housing and Infrastructures Board (HIB).
The Ministry of Agriculture, Animal and Marine Wealth oversees agricultural activities and
land use. According to its land use projections and corresponding water requirements, water
shares for the sector are negotiated with the MWR.
The Ministry of Energy and Electricity manages all power stations employing thermal
desalination plants.
Water management
In the 1990s, a strategy for irrigation management transfer was proposed. However, it also highlighted
that the complex water distribution system (through the GMRP) requires significant operation and
maintenance skills that are lacking locally. The institutional structures of the Libyan society also
required a complete change to allow for community-based institutions. However, this strategy was never
implemented.
12 Irrigation in Africa in figures - AQUASTAT Survey - 2016
Finances
The water pricing strategy is based on the fact that water is a common good and that all citizens share it
for different uses. As a result, tariffs differ according the uses and are subsidized by the state, in
particular for the most vulnerable users. Despite the fact that water tariffs cover only a third of the total
cost of water production, the recovery rate is low, also due to an irregular and not always existent billing
system. Since independence the state also finances all infrastructure projects, both construction and
operation and maintenance (MWR and CEDARE, 2014).
The 1994 resolution n.218 set the water pricing for the first phase of the GMRP with high subsidies for
agriculture and municipalities: 0.048 Libyan dinar (LYD)/m3 for agricultural use, 0.080 LYD/m3 for
urban use, and 0.796 LYD/m3 for industrial use. The total cost of the GMRP water in 2011 is 0.235
LYD/m3 (0.194 US$/m3), including 0.089 LYD/m3 (0.073 US$/m3) for operational cost and 0.146
LYD/m3 (0.12 US$/m3) of capital cost (Abdudayem and Scott, 2014).
At present, farmers are only charged for the cost of energy used for water production and energy is also
subsidized (CEDARE, 2014).
Policies and legislation
The first Water Law of Libya dates back to 1965 and aimed to regulate the exploitation of water
resources. It declares water as a common good. It was superseded by the more comprehensive 1982
Water Law (Law n.3), which designated water as a public property that should be protected by all.
However, shallow and deep wells are considered private and their ownership is attached to the
corresponding land. This 1982 Water Law was further complemented then by laws, decrees and
regulations in all domains, such as water ownership, usage, licensing for drilling, quality and
management. In particular, decree n.790 in 1982 sets aquifer protection from overexploitation and
pollution, and memo n.612 in 1993 regulates the water allocations from the GMRP. Practically, very
little of this legislation has been implemented yet (FAO, 2009). Law n. 15 of 2003 on environmental
protection and enhancement reinforces water quality protection and drinking standards.
The National Strategy for Integrated Water Resources Management (2000-2025) is the main guide on
water management in Libya. It was formulated in 1999 and approved in May 2005 with the aim to stop
water deficits and water quality deterioration in order to set a base for sustainable development.
Operationalization is still to be formulated, but led to the National Program for Water Supply and
Sanitation, aiming to provide access to safe water supply and sanitation to all Libyans through
identification of all communities in need of reticulated systems, enhancement or upgrade of such
systems. Finally, the National Strategy for Sustainable Development was formulated in 2008.
ENVIRONMENT AND HEALTH
Groundwater over-exploitation and use of fossil aquifers
Before the 1960s, large-diameter wells could easily extract shallow aquifers. Since the 1960s and the
rapid development of oil production, groundwater extraction rate accelerated to such level that pumps
became necessary to cope with the falling water tables (CEDARE, 2014). The coastal aquifers, Jefara
plains and the Jabal al Akhdar aquifers, are now seriously overexploited and this is the main reason for
the exploitation of the much deeper and non-renewable aquifers in the south of the country (FAO, 2009).
Water quality
Deterioration of the water quality due to untreated municipal wastewater exists, however the main
concern regarding water quality is related to saline intrusion in the coastal aquifers, where both
population and agricultural activities are concentrated. The uncontrolled mining of groundwater for
agriculture and falling water tables of the coastal aquifers, result in seawater intrusion, with an interface
Libya 13
progressing up to two kilometres inlands in the Jefara plains and salinity levels increasing from 150 ppm
to over 5000 ppm during the period 1950-1990.
Salinization
Irrigation with increasing saline groundwater has led to soil salinization in some locations. For example
in the Jefara plains, two irrigation schemes built in the 1970s with artesian wells, have now converted
to pumped wells and have some waterlogged and salinized soils (CEDARE, 2014). Salinization
increases irrigation water demands while crop yields decrease. Other examples exist in the southwestern
part of Libya, as well as in the Murzuq basin due to inadequate drainage.
PROSPECTS FOR AGRICULTURAL WATER MANAGEMENT
In the short term, low water and energy costs are still likely to encourage development of private
irrigation from private wells in the southern parts of the Libya.
In 2025, the water demand is estimated between 8 200 and 12 500 million m3 depending on the sources
(Tinmore Institute, 2012; Lagwali, 2008). To fulfil these demands, phases 4 and 5 of the Great Manmade
River Project (GMRP) are still to be implemented. However, considering the population growth, the
amount of water transferred from the south to the coastal areas will certainly be used almost entirely for
domestic use, despite the fact that the GMRP was originally intended for irrigated agriculture.
Any increase in irrigated agriculture will have to come from an increase of production and use of non-
conventional water, either:
directly in agriculture with increase in the collection and treatment of wastewater and its use in
agriculture; or
in other sectors that might free some transferred water from the GMRP for agriculture. For
example, increased desalinated water for both municipalities and industries.
Some desalination plants are planned or already under construction for an anticipated production
capacity of 86.5 million m3/year in 2025 (CEDARE, 2014).
Finally, in response to water scarcity, the Libyan government also made strategic agricultural
investments outside the country in areas where water for irrigation is still available. The largest of these
investments is the Malibya fund in Mali which obtained a 50-year renewable lease for 100 000 ha in the
Office du Niger in exchange of the construction of an irrigation canal. The land comes with unlimited
access to water for a small user fee. By 2009, a 40-km irrigation canal, using the same water irrigating
the rice fields of small farmers in the Office du Niger, was completed. The project was suspended after
the 2011 Libyan crisis, but in 2012 the new government confirm that it will maintain their investments
in Mali (GRAIN, 2016).
MAIN SOURCES OF INFORMATION
Abdudayem, A and Scott, A.H.S. 2014. Water infrastructure in Libya and the water situation in agriculture in
the Jefara region of Libya. African Journal of Economic and Sustainable Development 3(1): 33-64.
CEDARE. 2014. Libya Water Sector M&E Rapid Assessment Report. Monitoring & evaluation for water in North
Africa (MEWINA) Project.
EGA. 2013. Libya, the urgent transition to environmental sustainability. Environment General Authority. Tripoli.
FAO. 1997. Irrigation potential in Africa: a basin approach. Land and Water Bulletin n.4. Food and Agriculture
Organization of the United Nations. Rome.

14 Irrigation in Africa in figures - AQUASTAT Survey - 2016
FAO. 2009. Groundwater management in Libya. Food and Agriculture Organization of the United Nations. Rome.
FAO. 2015. GIEWS Country Brief-Libya. Food and Agriculture Organization of the United Nations. Rome.
GEC. 2006. Desalination in Jamahiriya, Libya. General Electricity Company. Tripoli.
GIA, UNDP. 2008. The Millennium Development Goals in the Great Socialist People’s Libyan Arab Jamahiriya.
Towards 2015: Achievements and Potentials. General Information Authority, United Nations Development
Programme.
GRAIN. 2016. Squeezing Africa dry: behind every land grab is a water grab. GRAIN website, accessed in March
2016.
JMP. 2015. Progress on drinking water and sanitation – 2014 update. WHO/UNICEF Joint Monitoring
Programme for Water Supply and Sanitation.
Lagwali F. 2008. Forecasting water demand for Agricultural, Industrial and Domestic Use in Libya. International
Review of Business Research Papers 4(5): 231-248.
MWR, CEDARE. 2014. Libya 2012 state of the water report, Monitoring & evaluation for water in North Africa
(MEWINA) Project, Ministry of Water Resources, CEDARE.
Otman, W. and Karlberg, E. 2007. The Libyan economy: economic diversification and international
repositioning. Springer.
Tinmore Institute. 2012. Water security and interconnected challenges in Libya. Tinmore Institute Research
Report WS121027.
UNDP. 2010. Water supply and sanitation in Libya: gap analysis, national needs assessment and UNFP
interventions. United Nations Development Programme. New York.
UNDP. 2016. Human Development Reports: Data. United Nations Development Programme. New York.
WFP, FAO. 2011. Food security in Libya – An overview. World Food Programme and Food and Agriculture
Organization of the United Nations. Rome.
WB. 2016. World Development Indicators. World DataBank. World Bank. Washington.