country assessment report for indonesia · indonesia, the philippines and viet nam - to respond to...
TRANSCRIPT

Strengthening ofHydrometeorological Servicesin Southeast Asia
COUNTRY ASSESSMENT REPORT FOR INDONESIA

ACKNOWLEDGMENTS
This Country Assessment Report for Indonesia is part of a study that aimed to strengthen the hydro-meteorological services in South East Asia. The production was a collaborative effort of the World Bank, the United Nations Office for Disaster Risk Reduction (UNISDR), the National Hydrological and Meteorological Services (NHMS) and the World Meteorological Organization (WMO) with financial support from the Global Facility for Disaster Reduction and Recovery (GFDRR).
The study investigated the capacity of the NHMS of five ASEAN Member States, namely Lao PDR, Cambodia, Indonesia, the Philippines and Viet Nam - to respond to the increasing demands for improved meteorological and hydrological information by various socio-economic sectors. Taking a regional approach, it recommended investment plans to improve the NHMS with the ultimate goal for reducing losses due to natural hazard-induced disasters, sustainable economic growth and abilities of the countries to respond to climate change.
The Indonesian Meteorological, Climatological and Geophysical Agency National (BKMG) supported the country assessment and coordinated the participation of various ministries and departments, including the Ministry of Agriculture, Ministry of Transportation, Department of Public Works, National Disaster Management Agency (BNBP), the Central Bureau of Statistics, academia as well as Civil Society Organizations.
The Disaster Risk Reduction Division of the World Meteorological Organization (WMO) has provide technical inputs and facilitated peer review of the draft country assessment report, which have resulted in significant quality improvements.
Relevant departments of BKMG reviewed the final draft country assessment report for its finalization.

EXECUTIVE SUMMARY 41 INDONESIA IN A NUTSHELL 12
2 SOCIO-ECONOMIC BENEFITS OF HYDROMETEOROLOGICAL SERVICES 17 2.1 Methodology for computing socio-economic benefits 17 2.2 Data 18 2.3 Results and analysis 19
3 NEEDS ASSESSMENT OF HYDROMETEOROLOGICAL SERVICES AND INFORMATION 25 3.1 Agriculture and food production 25 3.2 Fishery 26 3.3 Water resource management 27 3.4 Energy 29 3.5 Transportation 31 3.5.1 Land transportation 32 3.5.2 Water Transportation 32 3.5.3 Air transportation 33 3.6 Construction 33 3.7 Land use and planning 34 3.8 Tourism 34 3.9 Insurance 34 3.10 Health 35 3.11 Environment 35 3.11.1 Water quality 35 3.11.2 Air quality 36 3.12 Disaster risk reduction 37 3.13 Climate change 39 3.14 Media 39
4 THE METEOROLOGICAL AND HYDROLOGICAL SERVICES OF INDONESIA 40 4.1 Brief History 40 4.2 General Information 42 4.3 Budget 42 4.4 Accounting system 42 4.5 Human resources 43 4.6 Training programmes 44 4.7 Premises 44 4.8 Partnerships with national agencies/institutions 45 4.9 Annual report and publications 45 4.10 Visibility of BMKG 45 4.11 International memberships 45
5 CURRENT SERVICES OF BMKG 46 5.1 Weather services 46 5.1.1 Processing and visualization tools 47 5.1.2 Accuracy of weather forecasts 47 5.1.3 Users of weather, flood and climate information and forecasts 47 5.1.4 Needs for weather forecasts and real-time meteorological data 47 5.2 Early warning system 47 5.3 Hydrological services 49 5.4 Climatological services 49
CONTENTS

5.5 Agro-meteorological services 49 5.6 Marine services 50 5.7 Environmental services 51 5.7.1 Water quality 51 5.7.2 Air quality 51 5.8 UV radiation: None 52 5.9 Climate Change related services 52 5.10 R&D based Expert Services 53 5.11 Information services 53
6 BMKG’s NETWORK OF MONITORING STATIONS 54 6.1 Surface network 54 6.1.1 Synoptic stations 54 6.1.2 Marine observations 55 6.1.3 Hydrological stations 56 6.1.4 Ozone observations 56 6.1.5 Seismological observations 56 6.2 Remote sensing 57 6.2.1 Upper-air observations 57 6.2.2 Radars 57 6.2.3 Lightning stations 59 6.2.4 Satellite 59
7 MAINTENANCE, CALIBRATION AND MANUFACTURING OF MONITORING FACILITIES 61 7.1 Meteorological observations 61 7.2 Hydrological observations 61
8 NUMERICAL WEATHER PREDICTION (NWP) 64 8.1 Operational models 64 8.2 Verification of NWPs 64
9 INFORMATION AND COMMUNICATION TECHNOLOGY (ICT) 65 9.1 Communication facilities 65 9.2 Data management 67 9.3 IT Personnel 67 9.4 Needs to improve communication system and data management 67
10 NATIONAL AND INTERNATIONAL COOPERATION AND DATA SHARING 68 10.1 National 68 10.2 International 69
11 RECENT DEVELOPMENT PLANS PROPOSED/BEING IMPLEMENTED BY BMKG 71
12 SUMMARY 74
13 RECOMMENDATIONS TO STRENGTHEN THE SERVICES OF BMKG 78
14 PROJECT PROPOSAL 81
People Met During The Mission 82
References 83
A systematic Framework for Presentation of the Analysis of Meteorological and Hydrological Services 85

FIGURES
Figure 1. Schematic of linkages of Meteorological Services with EWS stakeholders Figure 1.1 Geographical location of IndonesiaFigure 3.1 Role of hydromet data and information in IWRMFigure 3.2 Impact of climate and catchment changes in reservoir operation Figure 3.3 Average growth rate of primary energy consumption for 1970-2007 (Ministry of Energy & Mineral Resources, Indonesia)Figure 3.4 Impact of climate change on planning and operation of the hydroelectric powerFigure 3.5 Degree of exposure of Indonesia to natural hazardsFigure 4.1 New Organizational Structure of BMKGFigure 4.2 BMKG new headquarters Figure 5.1 Wave-Height Forecast Product of BMKGFigure 5.2 End-to End Tsunami early warning systemFigure 5.3 End-to End Meteorology and Climatology early warning system Figure 5.4 Schematic of Climate Field School (CFS) activitiesFigure 5.5 Wave height forecast displayed at BMKG websiteFigure 5.6 Adaptive program on climate change involving validation of multi-technique climate models and climate field schoolsFigure 5.7 Five-in-one application or information services of BMKGFigure 6.1 Network of meteorological, climatological and geophysical stationsFigure 6.2 Network of automatic rainfall stationsFigure 6.3 Network of Automatic Weather Stations (AWS)Figure 6.4 IOTWS and Ina-TEWS Tsunameter ArrayFigure 6.5 Distribution of river gauging stations in IndonesiaFigure 6.6 Distribution of broad band seismic and accelerometer stationsFigure 6.7 Existing radar networkFigure 6.8 Existing and proposed radar networkFigure 6.9 Network of satellite receiversFigure 7.1 Facilities for calibrating meteorological observation instrumentsFigure 7.2 Location of the Research Centre for Water Resources, Experimental Stations and Sub Experimental StationsFigure 7.3 Facilities at the Laboratory of Hydrology Calibration in Bandung and CiparayFigure 8.1 Output of the ARPEGE model displayed in the BMKG websiteFigure 9.1 IT infrastructure of BMKGFigure 9.2 Network of radio internet for information dissemination Figure 10.1 BMKG’s Multi-mode Information Dissémination SystemFigure 10.2 Schematic overview of Global Telecommunication SystemFigure 10.3 Multi-protocol Label Switching Figure 10.4 Status of Circuit connectivity between RTHs and NMCs Figure 11.1 Schematic of the main program of BMKG

Table 2.1 Percent share of value added by weather and climate-dependent economic sector to Gross Domestic Product at 1990 constant prices of Indonesia, 2000-2007Table 2.2 Socio-economic sectors and the potential direct damages due to weather and climate-related natural disasters on different economic and social sectorsTable 2.3 Selected statistics related to weather and climate-related disasters in Indonesia, 1990 to 2009Table 2.4 Actual and estimated socio-economic damages due to weather and climate-related natural disasters in Indonesia, 1990-2029 (Million US$)Table 2.5 Estimated 10% reduction in the socio-economic damages (or the socio-economic benefits due to improvements in NMHS, 2010-2029 (Million US$)Table 2.6 Undiscounted and discounted operating and maintenance costs of improvements in NMHS in Indonesia, 2010-2029 (Million US$)Table 2.7 Options, Costs, Discounted Total Benefits, Discounted Net Benefits and Cost-Benefit ratios for improvements in NMHS in the Philippines, 2010-2029Table 3.1 Economic values of agricultural products in Indonesia in 2006Table 3.2 Surface water resource potential and demand by islandTable 9.1 Communication facilities for transmission, reception and exchange of data and productsTable 11.1 Recently completed or existing projects of BMKGTable 12.1 Institutional capacities, gaps and needs of BMKGTable 12.2 Evaluation of level of different skills of BMKGTable 13.1 Ranking of priority areas for global and regional coordinated effortsTable 14.1 Proposal for stand alone (A) scheme and with regional cooperation (B)
TABLES
AADMER ASEAN Agreement on Disaster Management and Emergency ResponseADB Asian Development BankADPC Asian Disaster Preparedness CentreACIAR Australian Center for International Agricultural Research AEIC ASEAN Earthquake Information CentreARPEGE Action de Recherche Petite Echelle Grande Echelle (Research Project on Small and Large Scales)ASCMG ASEAN Sub-Committee on Meteorology and GeophysicsASEAN Association of South East Asian NationsAusAID Australian Agency for International DevelopmentBCA Benefit-Cost AnalysisBKMG Indonesian Meteorological, Climatological and Geophysical Agency BPPT Agency for Assessment and Application of Technology CBDRM Community-Based Disaster Risk Management (CBDRM)CCA Climate change adaptationCEA China Earthquake AdministrationCFS Climate Field SchoolCOST ASEAN Committee on Science and TechnologyCSIRO Australian Commonwealth Scientific Research Organization DGWR Directorate General for Water Resources DRR Disaster Risk ReductionDRRM Disaster risk reduction and management DWD “Deutscher Wetterdienst” (German national meteorological service)ECMWF European Center for Medium Range Weather ForecastingEWS Early Warning SystemFFWS Flood Forecasting and Warning System GDP Gross Domestic ProductGFDRR Global Facility for Disaster Reduction and RecoveryGTS Global Telecommunication SystemHFA Hyogo Framework for Action 2005-2015ICAO International Civil Aviation OrganizationICTP International Center for Theoretical Physics IOC International Oceanographic Commission IPCC Intergovernmental Panel on Climate Change IWRM Integrated Water Resources ManagementJICA Japan International Cooperation AgencyJMA Japan Meteorology Agency Ina-MCEWS Indonesian Meteorological and Climatological Early Warning System Ina-TEWS Indonesian Tsunami Early Warning System KNMI Royal Netherlands Meteorological InstituteLAPAN National Space AgencyMCEWS Meteorological-climatological early warning system MRI Meteorological Research Institute NAPDRR National Action Plan for Disaster Reduction NMHS National Meteorology and Hydrology ServicesNSCCC National Steering Committee on Climate ChangeNWP Numerical Weather PredictionPTWC Pacific Tsunami Warning CentreRBO River basin organizations RCWR Research Centre for Water ResourcesRDC Research and Development Centre RIMES Regional Integrated Multi-Hazard Early Warning System for Africa and AsiaRWS Rainfall Warning System TCWC Tropical Cyclone Warning CentreUNFCCC United Nations Framework Convention on Climate Change UNDP United Nations Development ProgrammeUNESCAP United Nations Economic-Social Commission for Asia PacificUSAID United States Agency for International DevelopmentWB The World BankWIS WMO Information SystemWMO World Meteorological Organization
ACRONYMS

4
EXECUTIVE SUMMARY
The role of hydrometeorological services
Figure 1. Schematic of linkages of Meteorological Services with EWS stakeholders
Practically all human activities are linked to weather and climate. As a matter of fact, various economic sectors have started to appreciate the value of weather forecasts due to worsening impacts of hydrometeorological related hazards as a result of changing weather patterns. The extreme events that were experienced in recent years are precursors of the impacts of a changing climate. With climate change, the impacts will exacerbate and will continuously affect all sectors in unprecedented ways, particularly in many areas where water is a limited resource. On the other hand, tropical cyclones can generate extreme rainfall event resulting to catastrophic flooding. The attendant weather extremes manifested in floods and droughts considerably decrease agricultural productivity and aquaculture.
Accelerated sea level rise will also expose more people to the risk of coastal flooding while increased exposure to vector-borne infectious diseases and heat stress will threaten human health. Moreover, tourism which is an important source of income would be affected by severe disruption from climate change and sea level rise.
As the impacts of climate change continue to unfold and accelerate due to global anthropogenic climate change, the National Meteorological and Hydrological Services (NMHSs) will be faced with the increasing challenges and demands of providing more accurate, timely and useful forecasts, products and information. The core aspects of support that NMHSs provide to disaster risk reduction (DRR) agencies and early warning system (EWS) stakeholders are shown in Figure 1.
Source: Golnaraghi, [email protected]

5
To achieve or address such demand, it is necessary and urgent to put in place or to enhance the very basic requirements for an NMHS to function effectively, as follows: 1) adequate networks to monitor hydrometeorological parameters; 2) a robust communication system for data transmission, dissemination of forecasts and sharing of information; 3) high speed computing system for data assimilation and numerical weather prediction; 4) human resource equipped with appropriate trainings; and 5) more interaction with users of weather and climate information.
The trans-boundary nature of weather-causing phenomena would require collaboration among NMHS in the region. Hence, there is now an urgent need to enhance regional cooperation and data sharing which is currently being undertaken by the World Meteorological Organization (WMO) through its WMO InformationSystem (WIS).
Indonesia, one of the biggest archipelagos in the world, is geographically located over a region prone to natural hazards; such as geological hazards (earthquake, volcano, landslide, tsunami etc.) and hydrometeorological hazards (flood, drought, swell, sea level rise etc.). Hydrometeorological hazards have become a common and recurring disaster in this decade with severe flood occurrences and other hazards that are seen to be related to climate change. For the past few years, excessive rainfall caused extreme floods/flash floods which inundated the low-lying areas in Indonesia. Economic and social losses due to recurrence of these hydrometeorological events have been increasing from year to year.
To alleviate the devastating effects of recurring hydrometeorological hazards, the Indonesian Meteorological, Climatological and Geophysical Agency (Badan Meteorologi, Klimatologi, dan Geofisika or BMKG) continues to work for the improvement of its services throughout the archipelago. BMKG has upgraded its equipment and facilities to world class capability. After the tsunami event in 2004 the BMKG has embarked on an automation program for its tsunami early warning
system (TEWS) and meteorological-climatological early warning system (MCEWS). For the production of weather forecasts, BMKG does not run any numerical weather prediction (NWP) model but it has access to the products of ARPEGE and TXLAPS (from Australia) in GRIB format. The ARPEGE outputs are plotted and visualized using the Synergie System developed from Meteo-France.
For continuing improvement of its services, the BMKG put up the Research and Development Centre (RDC) which is tasked to conduct research and development in meteorology, climatology, air quality and geophysics. The RDC envisions to become “a centre of professional research and development, pre-eminent and can support activities and services in meteorology, climatology, air quality and geophysics”. The RDC in collaboration with the Australian Scientific Research Organization (CSIRO) has also been collaborating on the use of Conformal Atmospheric Model (CCAM), which is expected to be used operationally in 2011.
The lessons learned from the recent tsunami disaster paved the way for the improved dissemination
Assessment in needs for improved hydrometeorological services in Indonesia

6
of warning information and has increased the awareness and preparedness of all sectors in the country against natural hazard-induced disasters. The massive loss of life and property has given strong impetus to improve disaster management and triggered the reevaluation of its existing monitoring and forecasting facilities that lead to establishment of advanced early warning system for various natural hazards. International assistance poured into Indonesia which resulted to unprecedented improvement of the BMKG’s physical resources.
At present, the BMKG has significantly upgraded capabilities to provide services needed for disaster reduction in Indonesia. Compared to other countries in the region, Indonesia’s BMKG is well advanced in terms of its network of monitoring equipment, and forecasting and communication facilities. However, the demand from the different socio-economic sectors for specialized hydrometeorological pro-ducts and services is continuously growing which should be matched not only through the improvement of its facilities, but also by upgrading of its technical capacities as well.
As outlined in its 2010-2014 development plan, the BMKG has formulated major projects for implementation in order to support national safety and economic development under the following programs: • Strengthening weather and climate services capacity especially to improve meteorological early warning system to minimize human casualty and economic losses due to weather and climate related events; • Decentralization of data processing and analysis to enhance BMKG’s regional centres for the provision of weather and climate services and warnings to their respective area of responsibility; • Enhancing weather services for transportation (aviation and marine) through easy and accessible information for transport operators
e.g. web-based information to minimize transportation disasters; and • Establishment ofGreenhouseGases Inventory System and Climate Change Centre to provide national reference for GHGs assessment and provision of scientific basis for climate change assessment. Moreover, development of climate projection modeling for district levels up to year 2025 and provision of climate change vulnerability map by island/region, and climate change mitigation and adaptation measures for 6 major sectors (agriculture, energy, water, forestry, health and environment). During the past 5 years, the BMKG has continuously improved its services through the provision of tailored information based on practical needs of end-users. Some users need more specific information using common public language. In response to this user’s need, the BMKG also plans to implement several public information programs through education, conduct of workshops and seminars, establishment of climate field school, and production of exhibits, pamphlets and other materials. The seminars and workshops on the application of weather and climate information will involve stakeholders who need to gain understanding on synergized inter-sectoral systems and programs.
To cope with more frequent occurrence of hydrometeorological hazards and the increasing severity of disasters attributed to climate change, the BMKG is establishing a robust telecommunication system and automatic data switching system. It will also adopt a user friendly system for common real-time hydrometeorological and environmental data for use by the various socio-economic sectors. Currently, there is shortage of meteorologists to be employed in local meteorological offices, NWP scientists, technical specialists in radar and satellite and IT and database management staff. To strengthen BMKG’s capacity, the number of technical staff should be augmented and appropriate training should also be provided.

7
BMKG has a large number of end-users of its hydrometeorological and environmental products and services. There is a need to increase dialogue and partnership between BMKG and the different socio-economic sectors. This will result to better
National set-up for the production ofhydrometeorological services in Indonesia
products and services and also promote the active involvement of the economic sector and motivate them to invest in the integration of system information from BMKG and for easy access of the various sectors.
The BMKG is the Indonesian government agency responsible for monitoring and providing information and services on weather, climate, air quality, earthquake and tsunami and related environmental information. In addition to its role in disaster risk reduction and management, the BMKG provides weather services to agriculture and agro-industry, fisheries, forestry, tourism, aviation, marine and land transportation. Along with the National Survey and Mapping Agency (Bakosurtanal), Ministry of Mining and Energy, and Ministry of Public Works, the BMKG provides flood-risk area zoning information for several provinces in Java and Sumatra and in the near future will be expanded to cover all provinces in Indonesia. At present BMKG also provides various meteorological information and analysis for insurance claims purposes on demand basis.
To carry out its mandate, the BMKG maintains and operates a number of networks for meteorological, climatological and geophysical monitoring as well as tide gauges. There are also marine buoys in Indonesia but these are maintained by the Agency for Assessment and Application of Technology (BPPT). BMKG also monitors 160 broadband seismic and 220 accelerometer stations for seismological observations, and operates and maintains 20 radars all over the country. For earthquake monitoring BMKG is host to the ASEAN Earthquake Information Centre (AEIC), while for earthquake monitoring and Tsunami Warning System, BMKG has established cooperation with the Pacific Tsunami Warning Centre (PTWC), India Tsunami Early Warning System, joint Australia Tsunami Early Warning System, Malaysia and Thailand Meteorological Department, China Earthquake Administration (CEA), and other organizations.
The BMKG has lightning stations managed by its geophysics department, however, it does not issue lightning advisory and warning.
For hydrology, the responsible agency is the Directorate General for Water Resources (DGWR) which is under the Ministry of Public Works. Under DGWR, the Directorate for Rivers, Lakes and Dams is responsible for issuing flood information and forecast to the public. Currently, DGWR operates and maintains 4,500 rainfall stations, 87 climatological stations, and 700 river gauging stations. The DGWR through its research arm also prepared flood hazard maps for Indonesia. The Experimental Section for Hydrology and Water Management conducts research and development studies on flood, drought, flood warning system, erosion, sedimentation, rainfall-runoff relationship, groundwater instrumentation of hydrology and water management.

8
Before the tsunami in December 2004, the BMKG which was formerly known as the BMG was not even known by most Indonesians. However, in 2005, the BMKG’s popularity has surged especially now that it has the status of a Ministry since 2009. In the international scientific community particularly in the WMO, the BMKG is highly visible since its Director General is presently the President of the WMO Regional Association V.
Currently, the BMKG staff has limited knowledge in computer programming and numerical weather prediction. Another gap is the lack of knowledge in the operation and applications of weather radars such as developing a mosaic of radar images. The C-Band Doppler weather radars in Indonesia were supplied by different manufacturers and integration of these radars has been starting from 2009. From among the 24 radars that are operational, there are 14 radars have been integrated. As an immediate measure, the BMKG contracted the Weather Decision Technologies in the USA to do the integration of those radars.
The BMKG’s database is incomplete since some of the data were lost when BMKG moved to its new office. In addition, some of the data of BMKG are not yet digitized. The data before 1960 are in the possession of the KNMI (Royal Netherlands Meteorological Institute) since the Dutch started meteorological observation in Bogor, Indonesia in 1841. The BMKG has already negotiated with KNMI on the sharing of data, conduct of collaborative research, training and scholarship opportunity for BMKG personnel in the Netherlands.
To sustain the current initiatives towards modernizing the BMKG there is a need to address its capacity gaps in the applications of various data and information in hydrometeorological forecasting, as well as in NWP and IT in order to fully utilize and maintain the newly installed facilities.
State of affairs of the BMKG
The BMKG is a government agency with a ministry status. It is headed by a Director General who reports directly to the President of the Republic of Indonesia. Its primary mission is to conduct governmental tasks in the fields of meteorology, climatology, air quality and geophysics. Its vision is “Provide reliable information for public safety and to support national development”.
Indonesia, represented by BMKG, is a member of the World Meteorological Organization with the Director General as the Permanent Representative. BMKG is a member of the ASEAN Sub-Committee on Meteorology and Geophysics (ASCMG). It is also a member of the Tropical Cyclone Committee in RA V and an observer of the UNESCAP/WMO Typhoon Committee (TC).
International and regional organizations with existing cooperation agreement with BMKG include KNMI Netherlands (climate data exchange and hydrology); Meteo France (forecasting system tools); JMA (technical assistance in satellite meteorology, seismology and tsunami warning); IMD India (agrometeorology and radar meteorology); BoM Australia (Joint Working Group on Meteorology: Communications system, technical training); ADPC (climate field school: along with Indonesian Ministry of Agriculture); For earthquake monitoring and tsunami warning system BMKG has cooperation agreement with the Pacific Tsunami Warning Centre (PTWC), GTZ Germany, China Earthquake Administration (CEA), and other organizations.

9
BMKG is closely working with the Directorate General for Water Resources in providing hydrometeorological services in Indonesia. The Directorate for Rivers, Lakes and Dams is respon-sible for issuing flood information and forecast to the public. BMKG also maintains a good working relationship with the Department of Environment, of Agriculture and Forestry, Ministry of Public Works and the National Disaster Management Agency, National Search and Rescue Agency, etc. in pro-viding hydro-meteorological services to the country.
The BMKG has grown to be one of the more advanced NMHS in the southwest Pacific region in recent years. Through international assistance coupled by
the strong support of the Indonesian Government, the BMKG was able to modernize its monitoring infrastructure. After the tsunami in December 2004, the government provided budget for BMKG as counterpart for the various foreign assisted projects on reconstruction and enhancement of its facilities. Currently, the Indonesian government is providing sufficient budget for BMKG’s operational activities. However, the BMKG will need more budget for the operation and maintenance of its modern observation system and facilities that were put up recently. The maintenance of equipment and facilities i.e. radars (EEC, Gematronik, Vaisala and Baron) are currently being subcontracted to private companies.
Project proposal to strengthen the BMKG
To fully enhance the capability of BMKG as a warning institution for hydrometeorological, climatological and geological hazards in order to meet the needs of the major economic sectors in Indonesia, a project proposal on capacity building is developed to address the training needs of the technical staff of the BMKG. With the ongoing advancement of its observing networks and forecasting facilities, there should be a parallel initiative to upgrade its core capacities in the provision of improved products and services. Currently, there is shortage of
meteorologists, NWP scientists, technical specialists in radar, satellite, IT and database management staff. To ensure the strengthening of BMKG’s capacity, the number of technical staff should be increased. Technical cooperation with more advanced meteorological centres in Japan, China, India and Korea other advanced centres should also be strengthened through data and information exchange, collaborative research, technical training courses or on-the-job training, and workshops.
Investment plan
The project proposal is developed in order to upgrade the capabilities of the BMKG to address the requirements for preparing and producing the products and delivering the services that will cover the national needs of key economic sectors in Indonesia that need such products and services. It is also in line with Indonesia’s 2010-2014 development plan to support national safety and economy, the priorities for action of the Hyogo Framework of Action for 2005 – 2015, the Millennium Development Goals, and the WMO Strategic Plan for the region. Based on the needs and recommendations identified by the various users of weather, flood and climate information, the table below lists the components of the proposal for stand alone (A) scheme and considering regional cooperation (B):

10
Economic value of weather forecastsand hydrometeorological services in Indonesia
The results of the computation show that for the stand-alone system, the undiscounted plus discounted total cost of NMHS improvements is US$1.54 million while the discounted total benefits due to NMHS improvements is US$846.45 million when a 10 percent decrease in damages is considered as benefits. Therefore, the discounted net benefits are D844.91 million while the C/B ratio is 1:549.64. The C/B ratio is much higher than the 1:7 ratio set by WMO.
INDONESIA A (US$) B (US$)
International cooperation of experts 100,000 100,000
IT Centre - IT staff 25,000 25,000
Data management
- Consultation and training 100,000 50,000
- Annual maintenance
Local area model 100,000 50,000
Capacity Building
Media workshop 30,000
Radar & satellite Training Courses 100,000 80,000
Technical writeshop 10,000
IEC around the country 50,000
Climate change 100,000 80,000
BS &Post graduate scholarships 200,000
Research and development
- impacts of climate change 100,000 50,000
- socio economic impacts 100,000 50,000
- national seminar on socio-economic benefits 100,000 50,000
- end-user seminar 30,000 30,000
Project management
- consultant 200,000 100,000
- local project coordinator 100,000 50,000
Total 1,445,000 715,000

11
For a system based on regional cooperation, the total cost of NMHS improvement is US$0.71 million which is lower than the cost of a stand-alone system. Again, the discounted total benefits due to the NMHS improvements are US$845.45 million when a 10 percent decrease in damages is considered as benefits. Therefore, the discounted net benefits are US$845.74 million and the C/B ratio is 1:1,192.18. The C/B ratio is much better than that for the stand-alone system and much more superior compared to the 1:7 ratio provided by WMO.
In retrospect, the following are the main findings of the computations done for Indonesia: •ThediscountedtotalandnetbenefitsduetotheimprovementsintheNMHSofIndonesia,basedevenonly on the decrease in damages due to the improvements, are immense and more than enough to pay for the cost of improvements; •TheC/BratiosbasedontheactualcostsofNMHSimprovementsandthediscountedvaluesofthetotal benefits from the improvements are much more superior to the 1:7 ratio set by the WMO; •TheC/Bratio for thesystemwithregional integration ismuchbetter thantheratio for thestand-alone system which implies that being much more efficient the former system is also more desirable; and •TheC/BratioswouldimprovefurtheriftheindirectbenefitsoftheNMHSimprovements,productivitygains in the economy and the benefits beyond 2029 are included in the computation of benefits.
Financing of the proposed project
Funds for the implementation of the project will be through partnership of the Indonesian Government with foreign donors such as JICA, KOICA and World Bank.
Option Total Costs Discounted Total Benefits Discounted Net Benefits Cost/benefit (Million US$) (Million US$) (Million US$) Ratio (C/B)
Stand-Alone 1.54 846.45 844.91 1:549
Regional Cooperation 0.71 846.45 845.74 1:1192
Options, Costs, Discounted Total Benefits, Discounted Net Benefitsand Cost-Benefit ratios for improvements in NMHS in Indonesia, 2010-2029

12
1 INDONESIA IN A NUTSHELL
Background
Indonesia is an archipelago located in Southeast Asia between the Indian Ocean and the Pacific Ocean. It shares a border with the Philippines to its north. The country has a total area of about 1.9 million km2 and a coastline of 81,000 . The common weather and climate-related disasters in Indonesia include occasional floods, severe droughts and tsunamis while other natural-hazard induced disasters are earthquakes, volcanoes and forest fires. Some of its forest fires, however, are considered man-made.
Indonesia was colonized by the Netherlands beginning in the early 17th century and occupied by Japan during World War II. It then declared independence right after the war and was granted sovereignty by the Dutch in 1949. The country is the world’s third-largest democracy, the world’s largest archipelagic state, and home to the world’s largest Muslim population. Current issues faced by the country include: alleviating poverty, improving education, preventing terrorism, consolidating democracy after four decades of authoritarianism, implementing economic and financial reforms, stemming corruption, holding the military and police accountable for past human rights violations, addressing climate change, and controlling avian influenza. In 2005, Indonesia reached a historic peace agreement with separatists in Aceh, which led to elections in the province in 2006.
Figure 1.1 Geographical location of Indonesia
(www.state.gov/r/pa/ei/bgn/2748.htm)

13
Geography and land use •Location:SoutheastAsia,archipelagobetweentheIndianOceanandthePacificOcean •Totalarea:1,904,569sqkm;landarea:1,811,569km2;waterarea:93,000km2 •Totallandboundaries:2,830km •Coastline:54,716km •Maritimeclaims:measuredfromclaimedarchipelagicstraightbaselines;territorialsea:12nm; exclusive economic zone: 200 n •Climate:tropical;hot,humid;moremoderateinhighlands •Terrain:mostlycoastallowlands;largerislandshaveinteriormountains •Elevationextremes:lowestpoint:IndianOcean0m;highestpoint:PuncakJaya5,030m •Landuse:arableland:11.03%;permanentcrops:7.04%;other:81.93%(2005) •Irrigatedland:45,000km2(2003) •Totalrenewablewaterresources:2,838km3(1999) •Freshwaterwithdrawal(domestic/industrial/agricultural):total:82.78km3/yr(8%/1%/91%); per capita: 372 m3/yr (2000) •Naturalhazards:occasionalfloods;severedroughts;tsunamis;earthquakes;volcanoes;forestfires •Environment-current issues: deforestation; water pollution from industrial wastes, sewage; air pollution in urban areas; smoke and haze from forest fires
ClimateSplit by the equator, the Indonesian archipelago is almost entirely tropical in climate, with the coastal plains averaging 28°C, the inland and mountain areas averaging 26°C, and the higher mountain regions, 23°C. Humidity ranges from 75 to 95%. The temperature in Jakarta averages between 29°C and 35°C with 75 to 90% humidity. Winds are moderate and generally predictable, with monsoons usually blowing in from the south and east in June through September and from the northwest in December through March. Typhoons and large scale storms pose little hazard to mariners in Indonesia waters; the major danger comes from swift currents in channels, such as the Lombok and Scape straits.
Generally speaking, it is dry season from June to September, influenced by the Australian continental air masses, and rainy season from December to March as a result of the mainland Asia and Pacific Ocean air masses. Rainfall varies throughout Indonesia, averaging 706 mm yearly. Annual rainfall is heaviest - up to 2,286 mm - along the equatorial rain belt, which passes through Sumatra, Kalimantan and Sulawesi. It can reach as much as 4,064 mm at the higher elevations of these islands. During rainy season, Jakarta’s average monthly rainfall is around 300 mm per year and 40 mm per month during the dry season.
People •Population:240,271,522 •Lifeexpectancyatbirth,totalpopulation:70.76years

14
•Ethnic groups: Javanese 40.6%, Sundanese 15%, Madurese 3.3%, Minangkabau 2.7%, Betawi 2.4%, Bugis 2.4%, Banten 2%, Banjar 1.7%, other or unspecified 29.9% •Languages:BahasaIndonesia(official,modifiedformofMalay),English,Dutch,localdialects(the most widely spoken of which is Javanese) •Literacy(definition:age15andovercanreadandwrite):totalpopulation,90.4%
Government •Governmenttype: •Capital:Jakarta •Administrativedivisions:30provinces,2specialregions,and1specialcapitalcitydistrict
Transnational issues •SomesectionsofborderalongTimor-Leste’sOecussiexclaveandmaritimeboundarieswithTimor- Leste remain unresolved; many refugees from Timor-Leste who left in 2003 still reside in Indonesia and refuse repatriation; a 1997 treaty between Indonesia and Australia settled some parts of their maritime boundary but outstanding issues remain; ICJ’s award of Sipadan and Ligitan islands to Malay- sia in 2002 left the sovereignty of Unarang rock and the maritime boundary in the Ambalat oil block in the Celebes Sea in dispute; Indonesian secessionists, squatters, and illegal migrants create repatriation problems for Papua New Guinea; piracy remains a problem in the Malacca Strait; maritime delimitation talks continue with Palau; Indonesian groups challenge Australia’s claim to Ashmore Reef; Australia has closed parts of the Ashmore and Cartier Reserve to Indonesian traditional fishing and placed restrictions on certain catches.
Economic overviewDue to the worldwide financial crisis, the economy of Indonesia slowed significantly from the 6% plus growth rate recorded in 2007 and 2008, expanding at 4% in the first half of 2009, Indonesia outperformed its regional neighbours and joined China and India as the only G20 members posting growth during the crisis. The government made economic advances under the first administration of President Yudhoyono, introducing significant reforms in the financial sector, including tax and customs reforms, the use of Treasury bills, and capital market development and supervision. Indonesia still struggles with poverty and unemployment, inadequate infrastructure, corruption, a complex regulatory environment, and unequal resource distribution among regions. Yudhoyono’s re-election suggests broad continuity of economic policy, although the start of their term has been marred by corruption scandals. The government in 2010 faces the ongoing challenge of improving Indonesia’s insufficient infrastructure to remove impediments to economic growth, while addressing climate change mitigation and adaptation needs, particularly with regard to conserving Indonesia’s forests and peatlands.

15
Gross Domestic Product •GDP(purchasingpowerparity):US$968.5billion (2009 est.) •GDP (official exchange rate): US$514.9 billion (2009 est.) •GDP–growth4.4%(2009est.) •GDP-percapita(PPP):US$4,000(2009est.) •GDP-compositionbysector agriculture: 14.4% industry: 47.1% services: 38.5% (2009 est.) •Budget: revenues: US$83.77 billion expenditures: US$97.24 billion (2009 est.)
Labor market •Laborforce:113.3million(2009est.) •Laborforce-byoccupation agriculture: 42.1% industry: 18.6% services: 39.3% (2006 est.) •Unemploymentrate:7.7%(2009est.) •Populationbelowpovertyline:17.8%(2006) •Agriculture -products: rice,cassava(tapioca), peanuts, rubber, cocoa, coffee, palm oil, copra; poultry, beef, pork, eggs •Industries: petroleumandnatural gas, textiles, apparel, footwear, mining, cement, chemical fertilizers, plywood, rubber, food, tourism •Industrialproductiongrowthrate:2%(2009est.)
Energy •Electricity production: 134.4 billion kWh (2007 est.) consumption: 119.3 billion kWh (2007 est.) exports: 0 kWh (2008 est.) imports: 0 kWh (2008 est.) •Oil
production: 1.051 million bbl/day (2008 est.) consumption: 1.564 million bbl/day (2008 est.) proved reserves: 3.99 billion bbl (1 January 2009 est.) •Naturalgas production: 70 billion cu m (2008 est.) consumption: 36.5 billion cu m (2008 est.) exports: 33.5 billion cu m (2008 est.) imports: 0 cu m (2008 est. proved reserves: 3.001 trillion cu m (1 January 2009 est.) •Pipelines: gas: 5,800 km oil: 5,721 km (2009)
Exports and imports •Exports - commodities: oil and gas, electrical appliances, plywood, textiles, rubber •Exports - partners: Japan 20.2%, US 9.5%, Singapore 9.4%, China 8.5%, South Korea 6.7%, India 5.2%, Malaysia 4.7% (2008) •Imports - commodities: machinery and equipment, chemicals, fuels, foodstuffs •Imports - partners: Singapore 16.9%, China 11.8%, Japan 11.7%, Malaysia 6.9%, US 6.1%, South Korea 5.4%, Thailand 4.9% (2008) •Natural resources: petroleum, tin, natural gas, nickel, timber, bauxite, copper, fertile soils, coal, gold, silver
Reserve, Debt, Aid •Reserves of foreign exchange and gold: US$62.59 billion (31 December 2009 est.) •Debt-external:US$150.7billion(31December 2009 est.)
The GDP growth and GDP per capita growth performance of the country has significantly fallen from 2007 to 2008, a fact which is related to the global financial crisis that started in that year. The other economic indicators are as follow:

16
Communications •Telephones -main lines in use: 30.378million (2008) •Telephones - mobile cellular: 140.578 million (2008) •Radio broadcast stations: AM 678, FM 43, shortwave 82 (1998) •Television broadcast stations: 54 local TV stations (11 national TV networks; each with its group of local transmitters) (2006) •Internethosts:865,309(2009) •Internetusers:30million(2008)
Transportation •Airports-withpavedrunways total: 164 over 3,047 m: 4 2,438 to 3,047 m: 18 1,524 to 2,437 m: 51 914 to 1,523 m: 56 under 914 m: 35 (2009) •Airports-withunpavedrunways total: 519 1,524 to 2,437 m: 5 914 to 1,523 m: 25 under 914 m: 489 (2009)
•Heliports:36(2009) •Railways,total:8,529km narrow gauge: 8,529 km 1.067-m gauge (565 km electrified) (2008) •Roadways:437,759km paved: 258,744 km unpaved: 179,015 km (2008) •Waterways:21,579km(2008) •Merchant marine: total – 971; by type: bulk carrier 54, cargo 514, chemical tanker 35, container 80, liquefied gas 7, passenger 44, passenger/cargo 68, petroleum tanker 143, refrigerated cargo 2, roll on/roll off 10, specialized tanker 10, vehicle carrier 4 foreign-owned: 43 (China 2, France 1, Germany 1, Japan 6, Norway 1, Philippines 1, Singapore 27, Taiwan 2, UAE 2); registered in other countries: 114 (Bahamas 2, Cambodia 2, China 1, Hong Kong 7, Liberia 2, Mongolia 1, Panama 31, Singapore 66, unknown 2) (2008) •Ports and terminals: Banjarmasin, Belawan, Ciwandan, Kotabaru, Krueg Geukueh, Palembang, Panjang, Sungai Pakning, Tanjung Perak, Tanjung Priok

17
2 SOCIO-ECONOMIC BENEFITS OF HYDROMETEOROLOGICAL SERVICESOf the weather and climate-dependent economic sectors of Indonesia, manufacturing, agriculture, mining and quarrying have been the most dominant contributors to the national economy. In 2007, these sectors respectively shared 27.4%, 10.8%, and 8.7% to the gross domestic product (Table 2.1). In totality the weather and climate-dependent economic sectors contributed 67.1% to the GDP in the same year. Because of this large contribution, improvements in the NMHS that would reduce the damages due to weather and climate-related disasters will have very significant impacts on the overall economy.
2.1 Methodology for computing socio-economic benefits
The methodology employed here for computing the potential socio-economic benefits from planned improvements in the NMHS of a country is based on secondary data available from institutional sources. These secondary data were enhanced by informed assumptions provided by institutional key informants.
The socio-economic benefits from planned improvements in the NMHS of a country are defined as the decrease in socio-economic damages due to weather and climate-related natural disasters as follows:
b = ∆D – C
Table 2.1 Percent share of value added by weather and climate-dependent economic sectorto Gross Domestic Product at 1990 constant prices of Indonesia, 2000-2007
Sector 2000 2001 2002 2003 2004 2005 2006 2007
Agriculture, hunting and related service activities 12.2 12.2 12.1 12.0 11.7 11.3 11.1 10.8
Forestry, logging and related service activities 1.2 1.2 1.1 1.1 1.1 1.0 0.9 0.8
Fishing 2.2 2.2 2.2 2.2 2.2 2.2 2.2 2.2
Land transport; transport via pipelines, water transport; air transport; Supporting and auxiliary transport activities; activities of travel agencies
3.4 3.5 3.5 3.6 3.8 3.8 3.8 3.7
Post and telecommunications 1.3 1.4 1.6 1.8 2.1 2.4 2.9 3.6
Mining and quarrying 12.1 11.7 11.3 10.6 9.7 9.4 9.1 8.7
Manufacturing 27.7 27.7 27.9 28.0 28.4 28.1 27.8 27.4
Electricity, gas and water supply 0.6 0.6 0.7 0.7 0.7 0.7 0.7 0.7
Construction 5.5 5.6 5.6 5.7 5.8 5.9 6.1 6.2
Hotels and restaurants 2.8 2.9 2.9 2.9 2.9 3.0 3.0 3.0
Total 69.0 68.8 68.8 68.5 68.2 67.8 67.6 67.1
Source: United Nations Statistics Division

18
where b is the discounted net benefits from planned improvements in the NMHS; ∆D is the discounted total decrease in socio-economic damages due to the planned improvements; and C is the discounted total costs of the planned improvements.
2.2 Data
The socio-economic sectors and the potential direct damages due to weather and climate-related disasters on each the sector are outlined in Table 2.2. In addition to these mentioned potential direct damages, there are potential indirect damages on the other sectors that have backward and forward linkages to the mainly affected sectors. For instance, damages in agriculture may impact on the other sectors of the economy through increases in the prices of agricultural goods and services in the market.
The secondary data available from the institutional sources, however, measures only the direct damages due to weather and climate-related disasters. Thus, the damages considered here are only this kind of damages and may be considered as conservative estimates or just a fraction of total damages.
Table 2.2. Socio-economic sectors and the potential direct damages due to weatherand climate-related disasters on different economic and social sectors
Sector Potential Direct Impacts
Economic Sectors
AgricultureLost income, disruption in operations, cost of damaged irrigations, dams and other agricultural infrastructure and facilities, etc.
Transportation and Communication
Lost income, disruption in operations, cost of damaged transportation and communication infrastructure and facilities, cost of accidents, etc.
Energy Lost income, disruption in operations, cost of damaged energy infrastructure and facilities, etc.
TourismLost income, disruption in operations, cost of damaged tourism infrastructure and facilities, tarnished image as a tourist destination, etc.
Social Sectors
Human SettlementsLost and impaired human lives and property, reduction in land and property values in affected areas, etc.
Health Lost income due to death or injury, disruption in operations, psychic costs due to death or injury, cost of rehabilitation, etc.
EducationLost income, disruption in operations, opportunity costs of cancellation of classes, rehabilitation costs of damaged schools and related property, etc.
Water Diminished water access and water availability, water pollution control and management costs, etc.

19
Aside from the decrease in damages as socio-economic benefits, improvements in NMHS may have productivity effects on the national economy of a country. In particular, better forecasting of weather and climate-related events will allow economic sectors to operate better and increase their productivity. This productivity effect is not included in the measurement of socio-economic benefits because of lack of secondary data available for this purpose.
In the case of the costs of NMHS improvements, the total costs include the sum of all expenditures related to the improvements through their project life. If some of these costs occur beyond the first year of the project, these are discounted. If all expenditures occur in the first year, then the actual and undiscounted costs apply.
Based on the discounted benefits and costs, the cost-benefit ratios (C/B) are computed as follows:
C/B = C/∆D
where the variables are defined as before. The computed C/B ratio is then compared to the C/B ratio of at least 1:7 set by the WMO.
2.3 Results and analysis Natural hazard-induced disastersThe data on total number of disasters, number of persons who died, number of persons who were rendered homeless, number of persons who were injured and total number of persons affected by natural hazard-induced disasters in Indonesia for the period 1990-2009 are presented in Table 2.3. For the 1990 to 2009 period, the country had 129 such disasters causing death to more than 5,000 people and injury to more than 250,000 persons. The disasters also affected more than 10 million individuals and rendered homeless approximately 72,000 persons.
In 2009, two consecutive earthquakes also hit the provinces of West Sumatra and Jambi in Indonesia causing widespread damage across the provinces, killing over 1,100 people, destroying livelihoods and disrupting economic activity and social conditions (BNPB, Bappenas, and the Provincial and District/City Governments of West Sumatra and Jambi and international partners 2009). The earthquakes also caused landslides that left scores of houses
and villages buried and disrupted power and communication in the affected areas. The damage and losses in West Sumatra were estimated at Rp21.6 trillion, equivalent to about US$2.3 billion while the damage and losses in Jambi were estimated at Rp100 billion.
In terms of type, the available data show that the disasters consist of floods, mass movement wet and wildfires. From 2005 to 2009, there were a total of 37 floods causing death to 1,486 people, 7 mass movement wet causing death to 395 people 2 wildfires causing no death.
Total socio-economic damagesThe value of direct socio-economic damages caused by weather and climate-related disasters in Indonesia for the 1990-2009 period and the estimated damages for the 2010-2029 period are presented in Table 2.4. The annual estimated socio-economic damages for 2010-2029 were computed as the average of the annual actual damages for

20
the 1990-2009 period adjusted to inflation taken from the World Development Indicators of the World Bank. The average annual actual socio-economic damages for the 1990-2009 period was at US$592 million and in the absence of 2010 data is reflected as the annual estimated damages for that year. For the 1990-2009 period, the total actual damages was US$11,847 million while for the 2010-2029 period,
the total estimated damages was US$42,164 million.
The most prevalent disasters in terms of economic damages were floods and landslide. From 2005 to 2009, floods caused economic damages of about US$1,080 million while landslide resulted to economic damages of US$43 million.
Table 2.3 Selected statistics related to weather and climate-related disasters in Indonesia, 1990 to 2009
YearNumber of
disasters that occurred
Number of persons who died
Number of persons rendered
homeless
Number of persons injured Total number of persons affected
1990 2 191 - - 21,000
1991 4 202 - 8 240,008
1992 2 132 6,845 249,378 302,553
1993 2 131 - - 267,553
1994 7 59 1,000 - 3,328,771
1995 5 140 10,000 472 260,172
1996 6 110 - 32 824,503
1997 2 912 - 70 1,097,070
1998 2 7 - - 102,000
1999 4 101 - 2 16,002
2000 9 399 2,645 40 545,122
2001 8 587 29,600 4 109,604
2002 9 262 - 955 591,775
2003 13 533 - 352 684,756
2004 7 128 - 18 21,733
2005 6 322 - 269 20,800
2006 13 840 8,970 310 710,421
2007 10 481 9,875 134 573,537
2008 13 133 2,920 - 476,195
2009 5 125 - - 22,005
Total 129 5,795 71,855 252,044 10,215,580
Source of data: EM-DAT: The OFDA/CRED International Disaster DatabaseNotes: a) In this table and the succeeding ones, the weather and climate-related natural disasters specifically include drought, extreme temperature, flood, mass movement wet, storm and wildfire. Ground movement includes rockfall, landslide, avalanche and subsidence. b) EM-DAT is a global database on natural and technological disasters that contains essential core data on the occurrence and effects of more than 17,000 disasters in the world from 1900 to present. EM-DAT is maintained by the Centre for Research on the Epidemiology of Disasters (CRED) at the School of Public Health of the Université catholique de Louvain located in Brussels, Belgium. The database is compiled from various sources, including UN agencies, non-governmental organizations, insurance companies, research institutes and press agencies. Priority is given to data from UN agencies, governments and the International Federation of Red Cross and Red Crescent Societies.

21
The reduction in damages (Table 2.5) is assumed to start in 2012, a year after the start of the project, and increases up to 2016. A reduction in the economic damages of 2% annually from 2012 to 2015 and 10% thereafter is further assumed meaning that the effects of the improvement gradually occur in equal increments until it reaches maximum effect by 2016 and onwards. While there are no available previous researches which indicate the right percentage of
damage reduction in damages which should be assumed, the 10% reduction in damages used here is based on informed opinion of key informants and technical people and considered a conservative estimate. From 2010-2029, the estimated reduction in damages or the socio-economic benefits amount to US$3,923.88 million and the annual average reduction is US$196.19 million.
Table 2.4 Actual and estimated socio-economic damages due to weather andclimate-related natural disasters in Indonesia, 1990-2029 (Million US$)
Actual Damages Estimated Damages
Year Value Year Value
1990 5 2010 592
1991 28 2011 662
1992 5 2012 741
1993 19 2013 829
1994 23 2014 928
1995 50 2015 1,039
1996 562 2016 1,162
1997 8,088 2017 1,301
1998 1,300 2018 1,455
1999 2 2019 1,629
2000 168 2020 1,822
2001 20 2021 2,039
2002 352 2022 2,282
2003 5 2023 2,553
2004 64 2024 2,857
2005 5 2025 3,197
2006 159 2026 3,578
2007 971 2027 4,003
2008 2 2028 4,480
2009 19 2029 5,013
Note:There is no explanation from the source on what the specific damages are so it is assumed that these include monetized direct damages. Average annual inflation rate is 11.9 percent from 1990-2009.
Sources of data: EM-DAT: The OFDA/CRED International Disaster Database; World Development Indicators, World Bank

22
Table 2.5 also presents the discounted or net present value of the estimated reductions in the economic damages, or the socio-economic benefits, due to improvements of the NMHS of Indonesia. The social discount rate used is 12% which is within the 10 to 12% used by the Asian Development Bank (ADB) for public projects (Zhuang et al. 2007). The results show that the total discounted socio-economic benefits from 2010 to 2029 are US$846.45 million while the annual average benefits are US$42.32 million. These discounted figures are way lower than the undiscounted figures shown in the same table.
In the case of costs, there are two options for
improvements in NMHS considered. The first, the stand-alone option, is the case where the improvements are separate investments of the country while the second, the regional cooperation option, means that the improvements are done as part of an integrated regional system. Because of the efficiency effects of integration, the costs of the latter are lower than the former. The undiscounted capital costs which will all be spent at the start of the project for the stand alone option is US$1.37 million while that for the regional cooperation option is $0.63 million. The discounted and undiscounted operating and maintenance costs for the two options are provided in Table 2.6.
Table 2.5 Estimated 10% reduction in the socio-economic damages(or the socio-economic benefits due to improvements in NMHS, 2010-2029 (Million US$)
Year Undiscounted Value Discounted Value
2010 0.00 0.00
2011 0.00 0.00
2012 14.82 10.58
2013 33.16 21.15
2014 55.68 31.74
2015 83.12 42.34
2016 116.20 52.89
2017 130.10 52.92
2018 145.50 52.89
2019 162.90 52.92
2020 182.20 52.90
2021 203.90 52.90
2022 228.20 52.91
2023 255.30 52.90
2024 285.70 52.90
2025 319.70 52.90
2026 357.80 52.91
2027 400.30 52.90
2028 448.00 52.91
2029 501.30 52.90
Total 3,923.88 846.45
Average 196.19 42.32
Source of data: Table 2.4

23
Table 2.7 presents the options that can be taken for the NMHS improvements, discounted total costs of the improvements, discounted total benefits from the improvements, discounted net benefits from the improvements and the C/B ratio. The total costs of the NMHS improvements are the capital costs which are assumed to be spent at the beginning of the project and therefore not discounted and the discounted O&M costs. Again, the undiscounted capital costs are US$1.37 million for the stand-alone option and US$0.63 million for the regional cooperation option. The discounted O&M costs of $0.17 million for the stand-alone option and the $0.08 million for the regional cooperation option are taken from Table
2.6. The discounted total benefits are taken from Table 2.5. The discounted net benefits and C/B ratio are as defined earlier.
For the stand-alone system, the undiscounted plus discounted total cost of NMHS improvements is US$1.54 million while the discounted total benefits due to NMHS improvements is US$846.45 million when a 10% decrease in damages is considered as benefits (Table 2.7). Therefore, the discounted net benefits are US$844.91 million while the C/B ratio is 1:549.64. The C/B ratio is very much higher than the 1:7 ratio set by WMO.
Table 2.6 Undiscounted and discounted operating and maintenance costs of improvements in NMHS in Indonesia,2010-2029 (Million US$)
YearUndiscounted Discounted
Stand-Alone With Regional Cooperation Stand-Alone With Regional Cooperation
2010 0.00 0.00 0.00 0.00
2011 0.00 0.00 0.00 0.00
2012 0.01 0.01 0.01 0.00
2013 0.02 0.01 0.01 0.00
2014 0.02 0.01 0.01 0.00
2015 0.02 0.01 0.01 0.00
2016 0.02 0.01 0.01 0.00
2017 0.02 0.01 0.01 0.00
2018 0.03 0.01 0.01 0.00
2019 0.03 0.01 0.01 0.00
2020 0.03 0.02 0.01 0.00
2021 0.04 0.02 0.01 0.00
2022 0.04 0.02 0.01 0.00
2023 0.05 0.02 0.01 0.00
2024 0.05 0.02 0.01 0.00
2025 0.06 0.03 0.01 0.00
2026 0.07 0.03 0.01 0.00
2027 0.07 0.03 0.01 0.00
2028 0.08 0.04 0.01 0.00
2029 0.09 0.04 0.01 0.00
Total 0.75 0.35 0.18 0.00Average 0.04 0.02 0.01 0.00
Note: O&M costs start in year 2012. In that year, O&M costs are estimated at 1% of the capital costs and then increases yearly at the rate of inflation.Note: The O&M costs are discounted using the social discount rate.

24
For a system based on regional cooperation, the total cost of NMHS improvement is US$0.71 million which is lower than the cost of a stand-alone system. Again, the discounted total benefits due to the NMHS improvements are US$845.45 million when a 10% decrease in damages is considered as benefits. Therefore, the discounted net benefits are US$845.74 million and the C/B ratio is 1:1,192.18.
The C/B ratios generated above for both of the systems are much higher than the C/B ratios computed by other studies on benefits of meteorological and hydrological services. The derived C/B ratios are also higher than the WMO ratio of 1:7 (Hautala et al., Tammelin 2007, Leviakangas et al. 2007)
Sectoral economic damagesThere are scant secondary data available on the economic damages caused by weather and climate-
Table 2.7 Options, Costs, Discounted Total Benefits, Discounted Net Benefits andCost-Benefit ratios for improvements in NMHS in the Philippines, 2010-2029
Option Total Costs (Million US$) Discounted Total Benefits(Million US$)
Discounted Net Benefits (Million US$)
Cost/benefit Ratio (C/B)
Stand-Alone 1.54 846.45 844.91 1:549.64Regional Cooperation 0.71 846.45 845.74 1:1192.18
2.4 Summary of findings
In retrospect, the following are the main findings of the computations done for Indonesia: •The discounted total and net benefits due to the improvements in the NMHS of Indonesia, based even only on the decrease in damages due to the improvements, are immense and more than enough to pay for the cost of improvements; •The C/B ratios based on the actual costs of NMHS improvements and the discounted values of the total benefits from the improvements are much more superior to the 1:7 ratio set by the WMO; •The C/B ratio for the system with regional integration is much better than the ratio for
related disasters in Indonesia. In the agriculture sector, based on data provided by key informants the area of agricultural land planted to crops damaged by typhoons was estimated at 845,880 hectares in 2004, 80,384 ha in 2005, 138,227 ha in 2006, 99,039 ha in 2007 and 95,961 ha in 2008 for an annual average of 251,898 ha. On the other hand, the area damaged by drought was estimated at 26,384 ha in 2004, 44,829 ha in 2005, 73,045 ha in 2006, 58,641 ha in 2007 and 103,762 ha in 2008 for a yearly average of 61,332 ha. There are no data on the monetary values of these aforementioned physical damages made available for this work by the key informants. Furthermore, there are no available data on the quantity and value of damages caused by weather and climate-related natural hazards on the other sectors of the Indonesian economy made available for the computations.
Source of data: Tables 2.5 and 2.6
the stand-alone system which implies that being much more efficient the former system is also more desirable; and •TheC/Bratioswouldimprovefurtheriftheindirect benefits of the NMHS improvements, productivity gains in the economy and the benefits beyond 2029 are included in the computation of benefits.
It should be emphasized that the accuracy of the computations is dependent on the veracity of the secondary data on the socio-economic damages caused by weather and climate-related natural disasters from the institutional sources. In the future, a re-computation may be in order if and when the secondary data are revised and these are made available to the users.

25
3 NEEDS ASSESSMENT OF HYDROMETEOROLOGICAL SERVICES AND INFORMATION
For purposes of undertaking user needs assessment of hydrometeorological services and information, a workshop was conducted at the headquarters of BMKG in Jakarta. It was attended by a large number of participants from the different socio-economic sectors in Indonesia.
3.1 Agriculture and food production
In 1998 agriculture accounted for 19.5% of Indonesia’s GDP. The agricultural sector is crucial to the economy not just for its significant contribution to the GDP, but also because it employs almost half the nation’s total work-force. Agriculture was hit hard by drought in 1997-98 but has recovered since then. Although the drop in the value of the rupiah resulted in much higher prices for fertilizer, pesticides, and other inputs, it did benefit some producers of export commodities, who could now get a higher price for their goods in the international markets. In January 2000, Indonesia focused its policy “to maintain food security and promote efficient production, processing, and marketing of agricultural products.” About 45% of Indonesian workers are engaged in agriculture, which accounts for 17% of GDP in 2001. Some 31 million hectares of land (76.6 million acres) are under cultivation, with 35% to 40% of the cultivated land devoted to the production of export crops. About 60% of the country’s cultivated land is in Java.
Badan Pusat Statistik in Indonesia provisionally valued agricultural products in 2006 and estimated its growth rate since 2003. The results are tabulated in Table 3.1.
Table 3.1 Economic values of agricultural products in Indonesia in 2006
Agri products/yields Value in 2006(million rupiah)
Growth Rate (%)since 2003
Food cropyields 213,529,700 35%
Estate crop yields 62,690,900 34%
Livestock and its derivative 51,276,400 37%
Forestry 30,017,000 63%
Fishery 72,979,900 60%
From: http://en.wikipedia.org/wiki/Agriculture_in_Indonesia#Agriculture.2C_livestock.2C_forestry_and_fishery
(From: http://www.nationsencyclopedia.com/economies/Asia-and-the-Pacific/Indonesia-AGRICULTURE.html#ixzz0pxsK6RFm)

26
Rice is by far the most important agricultural commodity in Indonesia. Its production in 2001 totalled at 50,461,000 tons. In 2005, rice made up around 23% of total agricultural output in volume. Cassava and maize are the other two principal food crops accounting for a further 13% of total agricultural output in volume. 1999 productions were as follows: cassava (15,422,000 tons), corn (9,139,000 tons), and sweet potato (1,928,000 tons). Vegetable production in 2000 included 1,366,410 tons of cabbages, 772,818 tons of shallots, and 454,815 tons of mustard greens. important agricultural products include sugar cane, palm oil, and rubber with a total share of 19%. is the world’s second-largest producer of palm oil (after Malaysia); 9.1 million tons were produced in 2001/02. Palm kernels (2.68 million tons in 2001/02) and copra (1.36 million tons in 2001/02) are also important export crops. In 2001/02, Indonesia was the world’s fourth largest producer of coffee (after Brazil, Colombia, and Viet Nam). Products account for about 5% of agricultural output in volume, with poultry being the largest component.
Extreme weather and climate events such as El Nino-related droughts have been seen to largely affect agricultural production in Indonesia, as shown by what happened during the 1997-1998 El Nino. Hence, the agriculture sector needs the following information from BMKG: seasonal weather outlook; site-specific, long-term historical hydrometeorological data for planning; site-specific short-term to medium-term, and long-term weather forecasts; observed and forecast values of evapotranspiration; daily data of soil moisture; and crop-specific forecasts.
3.2 Fishery
Fisheries play a significant role in the economy as well as food supply in Indonesia. As an archipelago with 5.8 million km2 of marine waters, comprising 2.7 million km2 of territorial waters, it greatly contributes to export and foreign exchange earnings, supply fish and aquatic products to improve the nutritional standard of the nation, and provide employment opportunities.
The fisheries industry in Indonesia is more labour intensive than capital intensive. A huge number of people are engaged in the fisheries sector, namely 2.5 million in capture fisheries and 2.2 million in aqua-culture (1996). Approximately 90% of the fisheries industry can be classified as small-scale industry.
The contribution of the fisheries sector to food security, employment, income and foreign exchange earning has played an influential role in the development plan of the country. Investment in the fisheries sector can be estimated from the number of
fishing vessels in the period 1994-1997, when there was an increase from 396,185 to 433,054 units, an increment of 3% per year. In addition, increasing investment is also demonstrated by the growth in area under aquaculture in the same period, which reached 3% per year.
The potential yield of marine fish resources of Indonesia has been estimated to be 6.2 million tons/yr, while total marine fish landings were 3.6 million tons in 1997. Indonesia’s population is currently more than 200 million. If fish consumption per caput is 20 kg/yr, it will need more than 4 million tons. Assuming an annual population growth rate of 2-3%, Indonesia’s population would have doubled after 25 years. The demand for fish for national consumption will be as much as 8 million tons/year, a quantity far beyond the potential yield of marine fish resources in Indonesia.
Fisheries sector is highly sensitive to extreme

27
weather and climate events. Some of the needs of this sector such as 1-5 day weather forecasts, wind speed and direction, wind forecasts including local wind, thunderstorms with gusts, visibility, and wave
Table 3.2 Surface water resource potential and demand by island
Island Area(1000 km2)
Estimated Surface Water Potential
(m3/sec)
Estimated low flow
(m3/sec)
Irrigation + DMI Demand* Water Resources Utilization
in 2015 (%)1990
(m3/sec)2000
(m3/sec)2015
(m3/sec)
Java/Bali 139 6199 786 1074 1777 1878 29.8
Sulawesi 187 2488 561 126 365 529 21.3
Sumatera 470 23660 4704 297 497 693 2.9
Kalimantan 535 32279 6956 73 93 193 0.6
Source: UNDP.FAO Study 1992*Irrigation demand is the range of 87% to 95% of the total demand.
heights are already provided by BMKG. However, the fisheries sector needs user-friendly and site specific areas.
3.3 Water resource management
Indonesia’s surface water potential is provided by over 5,590 large and small rivers. There are many short and steep rivers in Indonesia; wherein 94.1% are less than 50 km long. Only 15 rivers are longer than 400 km. The geographical diversity could be approximated from the size of the river basin that is dominantly small, about 86.6% has an area less than 500 km2. Because of high rainfall intensities and watershed erosion, most rivers carry large quantities of sediment which results in river regime problems. In many river catchments volcanic eruption add to the sediment problems. Except for rivers in Kalimantan and Papua, most rivers have short lengths and are prone to flash floods. The longer rivers experienced flooding in the lower reaches because of flat slopes and inadequate carrying capacities due to encroachment and aggradations.
Indonesia’s average rainfall is over 2,500 mm/year of which 80% falls during the rainy season (October to April). However, large regional variations in the rainfall exist over the country. It varies from 5,000 mm in the West (Sumatera) to 1,000 mm in the East (Maluku, Nusa Tenggara and parts of Sulawesi). The surface water potential and the available low flow for some of more important island groups are indicated in the following table.
The estimated low flows in Java are not adequate to meet the demand, indicating irrigation shortages in the dry season, unless more water storage facilities are made available. In general water tends to become a limiting factor in the socio-economic development of a country when water withdrawals exceed 20% of the total renewable water resources. Looking at water resources availability based on per capita, it is seen that, for fiscal year 2000 population figures, the average annual surface water potential for the whole country is about 15,100 m3per capita, while for individual islands it varies from 1,580 m3per capita for Java and Bali at

28
lower end, to 418,800 m3per capita for Irian. The UNDP/FAO study reported that for Java and Bali (56% of population) nearly 60% of the natural basin discharge is required to meet the demand, while for Kalimantan (1.8% of population) it is only 1% of the natural basin discharge.
Groundwater potential in Indonesia is very limited. There are no extensive groundwater basins. In Java, only the eastern part (East Java) has some groundwater irrigation amounting to about 41,000 ha. Much of the eastern islands such as Nusa Tenggara, Timor and Maluku depend on groundwater because of surface water limitation. Groundwater potential estimates for some islands are: 95m3/s in Java, 44m3/s in Sulawesi, 21m3/s in East Nusa Tenggara and 9m3/s in Maluku.
The major use of surface water is for irrigation. Currently over 5.5 million ha is provided with technical irrigation and another 1.6 million ha as village irrigation. The infrastructure involves over 12,500 diversion structures and more than 236 reservoirs (large dam and medium dam) with a total capacity of about 545m3/s. In addition, 3.3 million ha of swampland has been developed for providing drainage and 18,000 ha of fishpond in Aceh, North Sumatra and Sulawesi is provided with supplemental water supply. Water resources also supports generation of 2,200 MW of hydropower (20% of countries generating capacity) mostly in Java and some parts of Sumatra and Sulawesi.
The Directorate for Water Resources outlined the importance of hydrometeorological data in the implementation of the integrated water resource management (IWRM) as shown in Figure 3.1. With climate change, the operation of reservoirs will likely be impacted which can be attributed to the relationship between changes in weather patterns and hydrological characteristics (Figure 3.2).
Figure 3.1 Role of hydromet data and information in IWRM

29
To enhance the services of the sector, it needs the following information from BMKG and Directorate General for Water Resources: more friendly or tailored weather forecasting and climate prediction, river discharges, rainfall and climate yearbook, flood hazard map for integrated flood management, water availability and water balance for drought management, and real time data for flood early warning system.
3.4 Energy
Indonesia is a large oil and natural gas producing country, and the only Southeast Asian member of the Organization of Petroleum Exporting Countries. At some point, Indonesia was the world’s leading liquefied natural gas and dry gas exporter. In 2004, the country produced 2.8% of the world’s natural gas. Although it is only the 8th producer of hard coal (2.8% of world total), it is the 2nd highest exporter
of hard coal (14.2%) next to Australia (28.9%) (International Energy Agency [IEA] 2005). Indonesia consumed 116.4 million tons of oil equivalent (metric ton) of energy in 2005, which accounts for 1% of the world’s total energy consumption. This energy demand is supplied largely by fossil fuels such as oil, natural gas, and coal. Renewable energy sources supply less than 10% of the energy demand (British Petroleum [BP] 2006).
Figure 3.2 Impact of climate and catchment changes in reservoir operation

30
Efforts are underway in Indonesia to decrease dependence on petroleum and to increase the use of alternative energy sources, especially natural gas and coal to generate electric power. Modernized electric power generation produced 95.78 billion kilowatts in 2001, using fossil fuels (86.9%), hydropower (10.5%), and other sources (2.6%). Indonesia has no nuclear power generation. Rural electrification projects have brought power to more than 14 million village homes since the early 1990s.
•Indonesia’soilproductionhasdeclinedinrecent years. •Indonesia’s largest oil producing fields are mature and declining in output.
Figure 3.3 Average growth rate of primary energy consumption for 1970-2007 (Ministry of Energy & Mineral Resources, Indonesia)
•Naturalgasproductionhasincreasedinrecent years in Indonesia, although the country is facing a declining global LNG market share. •Media reports suggest that Indonesia was surpassed by Qatar in 2006 as the single largest exporter of LNG. •Indonesia’s coal production has increased in recent years, and today the country is one of the world’s chief coal exporters. •Indonesia’s power sector faces shortages in electricity due to underinvestment in new generating capacity. •Indonesia’spercapitacarbonemissionsremain low by regional comparisons, but the country faces severe environmental challenges.

31
The needs of the sector are: more accurate site specific weather forecasts for estimation of energy consumption and optimization of power production, more real-time observations on precipitation and discharge, more observations and modeling of solar radiation, better wind data for assessment of wind
energy potential, 0-24 forecasts for wind power production, lightning monitoring and forecasting, and seasonal forecast.
3.5 Transportation
Figure 3.4 Impact of climate change on planning and operation of the hydroelectric power
Due to its archipelagic setting, Indonesia makes use of all means of transportation: land, air and water. The public transport includes trains, buses, taxis, waterways and airways. Passenger and freight transportation via inter-island and inland waterways is an important form of transportation in Indonesia. Railroads are heavily used in Java (including
Madura) and Sumatra for passengers and cargo but are nonexistent in the other islands. Air transportation has expanded, though unevenly, in the past decade. Sea transport is extremely important for economic integration and for domestic and foreign trade. It is well developed, with each of the major islands having at least one significant port city.

32
3.5.1 Land transportation
Road transport is predominant in Indonesia, with a total system length of 437,759 km in 2008. Public transportation includes trains, buses and taxis. The big cities of Indonesia are connected by trains. Most rail transport is located in the island of Java, which has two major rail lines that run the length of the island as well as several connecting lines. The island of Sumatra has four unconnected railway lines in the northernmost province of Aceh, North Sumatra (the area surrounding Medan, West Sumatra, Padang and its environs), and South Sumatra and Lampung. Indonesia’s railways are operated by the state-owned PT Kereta Api, and the newly-formed PT Kereta Api Jabotabek, operating the commuter lines in the Jakarta metropolitan area. The infrastructure is government-owned and the companies pay a fee for the usage of the railway lines.
To effectively deliver their services, the transport sector needs the following information: weather forecasts especially during rainy season for road hazard warning, mesoscale weather forecasts (convective activities like thunderstorms), accurate and timely rainfall forecasts. For planning purposes, the rainfall intensity duration frequency and flood hazard maps are also needed.
3.5.2 Water Transportation
Indonesia, as a nation of more than 17,000 islands depends largely on water transport. Indonesia’s coastline totals 81,000 km on the Indian Ocean, Strait of Malacca, South China Sea, Java Sea, Sulawesi Sea, Maluku Sea, Pacific Ocean, Arafura Sea, Timor Sea, and other smaller seas.
Indonesia has 379 ports and harbors controlled by the Ministry of Communications for international and interisland trade. The four main ports which are all designated gateways to handle Indonesia’s exports are at Tanjung Priok (near Jakarta), Tanjung Perak
(near Surabaya), Belawan (Medan), and Makassar (South Sulawesi). Other major ports are at Cilacap, Cirebon, and Semarang (all on Java), Kupang (Timor), and Palembang (Sumatra). Some 127 ports are classified as capable of handling international shipping. As a result of port improvements beginning in the mid-1980s, container handling capacity has doubled at both Makassar and Tanjung Perak, and there are future plans to provide much-needed improvements to Tanjung Priok and Belawan. However, no foreign shipping lines call at Makassar because the port does not meet International Ship and Port Security (ISPS) code. Interisland maritime transportation is crucial, supported by a large fleet of traditional and modern boats and ships.
Interisland transportation is critical to domestic commerce. Traditional sailing craft are widely used, but they increasingly are becoming motorized. The merchant fleet is composed of 718 ships of 1,000 gross registered tons or more. These ships include, by type, the following: cargo (398), refrigerated cargo (2), container (57), bulk carrier (47), roll on/roll off (15), petroleum tanker (128), chemical tanker (13), specialized tanker (12), liquefied natural gas (6), passenger (10), passenger/cargo (13), short-sea passenger (9), vehicle carrier (7), and livestock carrier (1). There also are 35 oceangoing vessels, 259 interisland vessels, more than 1,000 modernized local-use vessels, almost 4,000 traditional vessels, and 1,900 special bulk carriers. River transport plays a major role in eastern Sumatra, Kalimantan, and Papua. Most of Indonesia’s major rivers are at least partly navigable, but those in Java are used primarily for irrigation.
In 2003-2007, the number of shipping companies operating in Indonesia tended to increase. According to data at the Sea Communication Directorate General, Indonesia had 1,705 shipping enterprises in 2003 including 1,030 companies serving in inter-island routes, 267 serving special shipping and 408 individually operated shipping
33
firms. In 2007, the number of shipping enterprises rose to 2,326 including 1,432 companies serving national shipping, 334 serving special shipping and 560 individually operated shipping firms.
Indonesia still relies partly on foreign ships both in chartered ships or ships operated by agents to handle the transport of its domestic cargoes. In 2003-2007 the number of chartered foreign ships operated by domestic shipping companies declined from 2,447 units to 1,154 units. The number of foreign ships operated by agents rose from 6,629 units in 2003 to 7,227 units in 2007.
Needs of the sector are: rainfall and wind observations and forecasts for specific areas, water level monitoring and forecast, seasonal forecast (for drought or flood), severe weather bulletins, and typhoon forecast.
3.5.3 Air transportation
The government owns one airline, Garuda Indonesia, and one smaller subsidiary, Merpati Nusantara Airlines. Civil aviation as a private-sector venture has greatly increased from one private airline in 1993 to 27 private domestic airlines in 2004. In 2008, the number of airlines declined sharply to 16 airlines serving scheduled flights. These include Garuda Indonesia,
Merpati Nusantara Airlines, Indonesia Air Asia, Lion Air, Mandala Air, Wings Air, Batavia Air, etc. There are 297 units of aircraft owned by airlines registered with the Air Transport Directorate in December 2007, but only 221 units were in operation. The nation’s flag carrier Garuda Indonesia is still the largest airline in Indonesia in terms of number of aircrafts in operation.
The major air facility is Soekarno-Hatta International Airport, which opened outside Jakarta in 1985, and in 1991 an additional terminal greatly increased airport capacity. There are other major airports in Denpasar, Medan, Surabaya, and Batam Island. In 2009 there were an estimated 683 airports in Indonesia, of which 164 had paved runways (four with more than 3,000-meter runways) and 519 had unpaved runways. Six of the larger airports can accommodate wide-bodied aircraft. Additionally, there were 36 heliports in 2009. Indonesia had a fledgling domestic turboprop airliner industry under development by the government-owned Indonesia Aerospace in the late 1990s, but it reached only a prototype-level of production.
The needs of the sector based on ICAO standards have been addressed by BMKG. As a matter of fact, the BMKG is now generating income from the airline companies with the aviation forecasts it provides.
3.6 Construction
Throughout the 1980s, the construction subsector of Indonesia grew at an average annual rate of 1.1%, surging to 24% in 1989. Vigorous growth continued the following year at a rate of 15%, reflecting a big increase in private demand for new construction. Several sources estimate the construction subsector’s contribution to the gross national product at about 5% throughout the decade. According to one estimate, the construction subsector employed more than one-fourth of all industrial workers in the country in 1986.
The growth in the construction sector will require more meteorological data and information from BMKG in anticipation of the changes in the climate. The needs of the sector include: climatological data of meteorological parameters (wind strength & prevailing direction, temperature, rainfall, humidity, etc.) in specific locations for

34
building design and constructions, accurate site specific weather forecast (precipitation, wind, temperature, forecasts on lightning), meteorological measurement based load factors (wind, rainfall..), intensities of precipitation for planning of drainage system, and improved customer specified dissemination of weather information.
3.7 Land use and planning
According to 2001 estimates, 11.3% (206,753 km2) of Indonesia’s total land area is arable, and land planted in permanent crops, including an irrigated area of 48,150 km2, represents 7.2% of the total (132,051 km2). There are 1,619,687 km2 of non-arable land and land not under permanent crops.
With an estimated loss of up to 20 million ha of forest over the past decade, deforestation in Indonesia has come to the forefront of global environmental concerns. Indonesia is one of the most important areas of tropical forests worldwide. In addition to providing a multitude of benefits locally, including both products and services, these forests are also of global importance because of their biodiversity and the carbon they sequester. Despite the benefits they provide, Indonesia’s forests have been under considerable threat in the past decades, and the extent of its forest cover has declined considerably.
The sector needs climatological data for specific areas, hazard maps showing locations of most vulnerable areas on flooding, strong wind, areas prone to drought, and rainfall intensity duration frequency.
3.8 Tourism
The 1990s, dubbed by the government a “Visit Indonesia Decade,” saw concerted efforts to increase foreign tourism. Travel agencies increased more than 600% to nearly 2,500 and rapid construction of facilities took place. Tourist arrivals quintupled, reaching about 5 million in 1996 and earning in excess of US$6 billion. However, the upheaval and violence associated with the end of the new order brought declines in tourist arrivals. The year 2001 saw about 4.2 million arrivals, and as a result of deflation of the rupiah, estimated receipts was under US$4 billion.
To improve the tourism industry, BMKG should provide weather forecasts tailored for tourist resorts, GIS based meteorological maps for environmental impact and risk assessment, user friendly monthly and seasonal forecasts, and information on extreme weather phenomena.
3.9 Insurance
The insurance business of Indonesia appears limited given the low awareness of the population, limited banking structures, strong government control, and other factors.

35
Currently, BMKG is generating income from insurance claims due to weather disturbances. To further improve its services, the insurance companies will find it useful to have meteorological maps (using GIS) on historical data/ climatological normal for risk assessment, and hazard maps.
3.10 Health
Indonesia had a three-tiered system of community health centres in the late 1990s, with 0.66 hospital beds per 1,000 people, the lowest rate among members of the Association of Southeast Asian Nations (ASEAN). In the mid-1990s, according to the World Health Organization (WHO), there were 16 physicians per 100,000 people in Indonesia, 50 nurses per 100,000, and 26 midwives per 100,000. Both traditional and modern health practices are employed. Government health expenditures are about 3.7% of the GDP. The ratio of public to private health-care expenditures is about 75:25 ratio. Human immunodeficiency virus/acquired immune deficiency syndrome (HIV/AIDS) has posed a major public health threat since the early 1990s. In 2003 Indonesia ranked third among ASEAN nations in Southeast Asia, after Burma (Myanmar) and Thailand, with a 0.1% adult prevalence rate, 130,000 HIV/AIDS cases, and 2,400 deaths. Two other health hazards facing Indonesia in 2004 were dengue fever and dengue hemorrhagic fever (DHF), and avian influenza. All 30 provincial-level units were affected by dengue fever and DHF, according to the WHO. The outbreak of highly pathogenic avian influenza (A/H5N1) in chickens and ducks in Indonesia was said to pose a significant threat to human health.
The health sector is seen to be most affected by the impacts of climate change and as the impacts of extreme weather and climate variability are now being felt in Indonesia, the health sector would be interested on collaborative studies on the impacts of weather changes on water and air borne diseases, etc. It also needs longer lead time of forecast, say 2 weeks before any change in the weather is expected for contingency planning or prepositioning of resources and facilities.
3.11 Environment
Indonesia’s geography leaves the nation vulnerable to severe flooding, unpredictable drought and plant pest attacks, volcanic activity, and earthquakes, which are sometimes associated with tidal waves (tsunami). The most important environmental issues associated with human activities are forest degradation (unregulated cutting, fires, smoke and haze, and erosion); water pollution from industrial wastes and sewage; air pollution from motor vehicles and industry in urban areas, and generally from smoke and haze caused by forest fires; and threats to biodiversity and rare plant and animal species.
3.11.1 Water quality
Even though Indonesia’s water resources accounted for almost 6% of the world’s water resources or about 21% in the Asia Pacific region, clean water is becoming a serious problem in the country. Data shows that water consumption tends to increase significantly. Total water demand in 2000 is approximately 156,000 million m³

36
per annum. It is predicted that the figure will be doubled to 356,575 million m³ per annum by 2015. However the availability of clean water in terms of quantity tends to decrease due to environmental degradation and pollution. The rate of water resources degradation accounted for 15-35 % per capita annually.
In 2004, at least 80% of 250 million Indonesian has no access to piped water. Due to difficulties and limited access to clean water, large number of people are still using river for drinking water, bathing and washing. There was an indication that people in the village using river as drinking water tends to decrease from 22.8% to 22.5% during period 1999-2002. However, during the same period, there was an increasing trend of people using the river for washing and bathing from 65.2 to 66.2%. The main factor that caused degradation of water resources quality in Indonesia is domestic waste. The data show that from 51,372,661 houses in Indonesia, there is only 42.8% that have domestic waste treatment. About 56.15% of household disposes their domestic waste directly to the river. Therefore, six major rivers in West Java do not meet the requirement for drinking raw water due to pollution by domestic and industrial wastes. In addition to domestic activities, water pollution also come from industrial activities such as small scale industries, agriculture, textile, pulp and paper, petrochemical, mining, and oil and gas. For example, water quality near mining area is potentially contaminated by heavy metal such as mercury (Hg). Monitored data show that some level of mercury (Hg) concentration has been detected at nine sampling points from 16 sampling points and the highest level of dissolved mercury in one of mining area could reach 2.78. Attention should also be focused on the decreasing quality of lake water. Similar to rivers, there are a lot of pressures to lake water quality in Indonesia from domestic activities, agriculture, and industrial. Data monitoring in four major lakes in Indonesia such as Toba, Singkarak, Waduk Jatiluhur, and Situ Patenggang show that water quality on the basis of COD and BOD parameters are above water criteria class (Gov-Regulation No. 82/2001).
The Directorate General for Water Resources needs to develop water quality information system in coordination with the sector. It also needs to provide data on rainfall intensity and water level, regular rain water sampling analysis to check if it is polluted or acidic, and more accurate flood forecast.
3.11.2 Air quality
Monitoring of ambient air quality (AQ) in Jakarta started in 1976 by then BMG for parameters SO2, NO2, Ozone (O3) and suspended particulate matter (SPM). The number of monitoring stations that monitor SPM and rainwater increased to 37 stations in large cities throughout the country. In 1995, an international reference station was installed at Kototabang, Bukit Tinggi that monitors SO2, NO2, rainwater, aerosol, surface ozone, black carbon, polyaromatic hydrocarbons (PAH), solar radiation, and meteorological parameters such as wind speed and direction, temperature, and relative humidity (MOE 2005).
Through an Austrian loan, the Indonesian government established a network of ambient AQ monitoring stations in 10 cities between 1999 and 2001. The network consisted of 33 ambient AQ monitoring stations, 9 mobile stations, 8 regional centres, 8 regional calibration centres, 1 main centre, and 1 main calibration centre in 10 cities in Indonesia, as follows: Jakarta,Bandung, Semarang, Surabaya, Denpasar, Medan, Pekanbaru,Palangka Raya, Jambi, and Pontianak. Figure 3.1 shows the location of the stations, a description on the number and type of stations and the capacity to display results publicly.
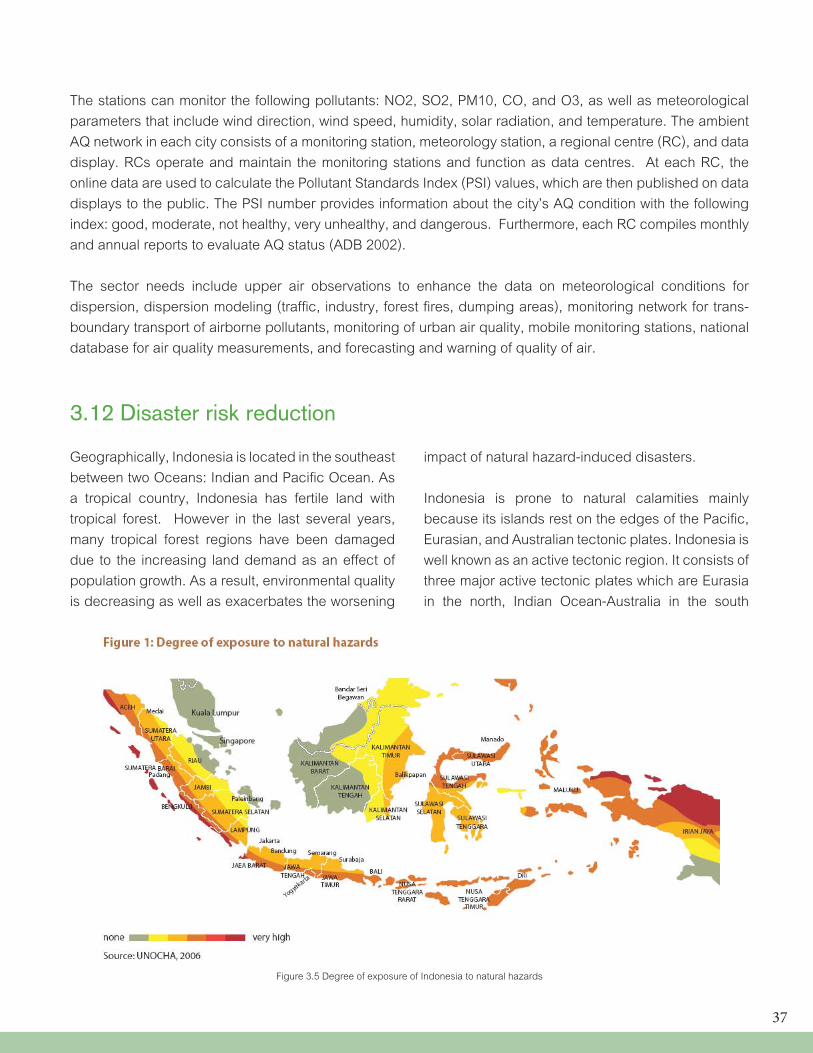
37
The stations can monitor the following pollutants: NO2, SO2, PM10, CO, and O3, as well as meteorological parameters that include wind direction, wind speed, humidity, solar radiation, and temperature. The ambient AQ network in each city consists of a monitoring station, meteorology station, a regional centre (RC), and data display. RCs operate and maintain the monitoring stations and function as data centres. At each RC, the online data are used to calculate the Pollutant Standards Index (PSI) values, which are then published on data displays to the public. The PSI number provides information about the city’s AQ condition with the following index: good, moderate, not healthy, very unhealthy, and dangerous. Furthermore, each RC compiles monthly and annual reports to evaluate AQ status (ADB 2002).
The sector needs include upper air observations to enhance the data on meteorological conditions for dispersion, dispersion modeling (traffic, industry, forest fires, dumping areas), monitoring network for trans-boundary transport of airborne pollutants, monitoring of urban air quality, mobile monitoring stations, national database for air quality measurements, and forecasting and warning of quality of air.
3.12 Disaster risk reduction
Figure 3.5 Degree of exposure of Indonesia to natural hazards
Geographically, Indonesia is located in the southeast between two Oceans: Indian and Pacific Ocean. As a tropical country, Indonesia has fertile land with tropical forest. However in the last several years, many tropical forest regions have been damaged due to the increasing land demand as an effect of population growth. As a result, environmental quality is decreasing as well as exacerbates the worsening
impact of natural hazard-induced disasters.
Indonesia is prone to natural calamities mainly because its islands rest on the edges of the Pacific, Eurasian, and Australian tectonic plates. Indonesia is well known as an active tectonic region. It consists of three major active tectonic plates which are Eurasia in the north, Indian Ocean-Australia in the south

38
and pacific plate in the east. The plate movements generate subduction type of boundary which takes control on volcanic arc building that produced Sumatera Island, Java Island, Nusa Tenggara and Maluku Island. In 2006 alone, two major earthquakes struck the country, killing around 7,300 people and causing an estimated US$ 300 million worth of damages to properties.
Indonesia has more than 500 young volcanoes including 128 active volcanoes. This represents 15% of the active volcanoes in the world. The most active volcano in Indonesia is Merapi which is situated 20 km to the north of Yogyakarta. This volcano is monitored continuously by means of telemetric equipment as well as field investigation. Thus, volcanic eruption disasters can be mitigated very well. Many others have also been monitored quite well in order to minimize volcanic eruption impacts.
Other natural hazard-induced disasters that may be exacerbated by local human activities are floods, drought, and forest fire. During the monsoon season, Indonesia is affected by floods and landslides which caused loss of human lives and property. On the other hand in the dry season, Indonesia faces drought and forest fire as well as urban and building fire. The drought condition also affects the hydro-power supply due to significant lowering of water level in many reservoirs and lead to forest fires. These types of disasters are considered to be generated by environmental degradation due to deforestation. To cope with these disasters, the Indonesian Government launched the National Movement for Environment Rehabilitation Policy in 2004 by conducting land rehabilitation and reforestation.
In April 2007, Indonesia passed its Disaster Management Law (Law No. 24), also known as the DM Law. It is a legal umbrella of the country’s disaster management implementation. Its passage
also paved the way for the launching of the National Action Plan for Disaster Reduction (NAPDRR) 2006-2009, which explicitly addresses the issue of disaster risk management. The DM Law includes Community-Based Disaster Risk Management (CBDRM). There has been a strong commitment and motivation across all sectors of the government and society to develop a robust and effective disaster management system in Indonesia. The government has also appointed a new Board of Disaster Management at the national level. Civil society groups have shown a strong commitment to work as partners in CBDRM and to be actively involved in disaster risk reduction activities. The CBDRM framework and concept in Indonesia remains to be an evolving one, regularly requiring sharing and learning to evaluate experiences in the ground to further sharpen its understanding for policy and project applications. CBDRM is the responsibility of the different societal actors – the media, research institutions, and religious organizations – who each have important roles to play in successfully implementing CBDRM initiatives, and helping communities to reduce their vulnerabilities, as well as empower and better prepare themselves against disasters. Disaster risk reduction is the sector where hydrometeorological services and information are vital. The various needs of the sector include accurate severe weather forecasts with sufficient lead time, all types of hydro-met hazard maps, and strong cooperation of NMHS with agencies involved in disaster risk management, real time hydro-met data, radar images, site specific weather forecasts, operational drifting models for oil spills and ship accidents, a database for the impacts of weather and climate related disasters, improved flood forecasts, operational model for dispersion in forest fires, better information on climate variability, user friendly outlooks for drought, forecast on drought and its duration, improved and more location specific forecast of precipitation, and increased number of automatic on-line stations for monitoring of water level.

39
3.13 Climate change
The government has prepared the National Action Plan on Mitigation and Adaptation to Climate Change (RANMAPI). The RANMAPI recognizes that climate change is a serious threat to Indonesia’s socio-economic development and environment and that climate change impacts are exacerbated by the unsustainable patterns of development in Indonesia. It lays down the strategic principles and also details the short-term, medium-term, and long-term action plans on both mitigation and adaptation to climate change. The action plan aims at supporting the achievement of both national and local development goals.
The sector needs are: risk vulnerability assessments which include analysis of climate variability and trends of extremes, development of climate change scenarios and projections, establishment of national/regional project on impacts of climate change on the different economic sectors; and enhanced regional cooperation on climate change activities.
3.14 Media
Television is Indonesia’s dominant medium. Major national commercial networks compete with public Televisi Republik Indonesia (TVRI). Some provinces operate their own stations. Amid tough competition for advertising, mergers have been mooted.
The radio dial is crowded, with scores of stations on the air in Jakarta alone. Private radio stations may carry their own news bulletins; however radio and TV broadcasters are banned from relaying live news programmes from international stations.
Internet use is on the rise, with users numbering around 25 million by late 2007. Analysts see much potential for growth. The following are the media entities in Indonesia:
The press •TheJakartaPost-English-languagedaily •TheJakartaGlobe-English-languagedaily •Kompas-daily •KoranTempo-daily •PosKota-daily •WartaKota-daily •IndoPos-daily •MediaIndonesia-daily
•SuaraKarya-daily •Republika-daily •SinarHarapan-daily •BisnisIndonesia-daily •Tempo-weekly,English-languagepages
Radio •Radio Republik Indonesia (RRI) - public, operates six national networks, regional and local stations, external service Voice of Indonesia
Television •Televisi Republik Indonesia (TVRI) - public, operates two networks •SuryaCitraTelevisiIndonesia(SCTV)-private •RajawaliCitraTVIndonesia(RCTI)-private •Indosiar-private •TelevisiPendidikanIndonesia(TPI)-private •GlobalTV-private •TVOne-private •TransTV-private •ANTV-private •Trans7-private
News agency •Antara-English-languagepages

40
4 THE METEOROLOGICAL AND HYDROLOGICAL SERVICES OF INDONESIA
4.1 Brief History
The Indonesian Meteorological Climatological and Geophysical Agency - Badan Meteorologi Klimatologi dan Geofisika or BMKG is the government agency responsible for monitoring and providing information and services on weather, climate, air quality, earthquake and tsunami, and related environmental information. Its history began in 1841 with the meteorological observation conducted by Dr. Onnen, the head of hospital in Bogor which was later made a government undertaking in 1866 by the Dutch East Indies government under the name Magnetisch en Meteorologisch Observatorium. Thereafter, the agency’s name changed several times. Before September 2008, the agency was then known as BMG. But the increasing importance of climate change issues prompted the agency to include climatology as a major component and so the current name, BMKG, was adopted.
As a consequence of its current status as a non-departmental governmental agency (with Ministry status), the BMKG’s Director General is directly responsible to the President of the Republic of Indonesia.
4.2 General Information
Name of Organization: Badan Meteorologi Klimatologi dan Geofisika (BMKG) (Indonesian Meteorological Climatological and Geophysical Agency) Office Address: Jl. Angkasa 1 No.2, Kemayoran, Jakarta Pusat - IndonesiaWebsite: http://www.bmkg.go.idOffice hours: 0800H to 1600HWeather service hours and office hours at synoptic stations: 0000 to 2400 (24/7/365)
BMKG’s operation units in headquarters and meteorological stations Class-I (provincial level): conduct 24-hr services with operational staff’s level of Meteorologist class-I (forecasters) and Meteorologist class-II (forecaster coordinator).
Vision: Providing reliable information in meteorology, climatology, air quality, and geophysics to support national safety and development and to have an active role at the international level.
Legal framework and organizational structure:
BMKG’s primary mission is to conduct governmental tasks in the fields of meteorology, climatology, air quality and geophysics in Indonesia with the following functions: •Assessment and establishment of Indonesian national policy in meteorology, climatology, air quality, and geophysics; •Coordinating meteorological, climatological, and geophysical activities in the country;

41
•Facilitateandsuperviseactivitiesinmeteorology, climatology, air quality, and geophysics conducted by other government and private institutions; and •Developing cooperation in meteorological, climatological, air quality monitoring, and geophysics activities among counterparts within the country and overseas.
In line with its responsibilities, BMKG’s organization structure is divided into 4 main subordinates under the Director General, headed by 4 Deputy Director Generals, namely: Deputy Director General for Meteorology, Deputy Director General for Climatology, Deputy Director General for Geophysics, and Deputy Director General for Instrumentation, Calibration, Engineering and Communications.
Under the Director-General are five Regional Centres managing the Class I, II and III meteorological, climatological, and geophysical stations all over the country as follows: •RegionalOfficeIatMedan,Sumatra •RegionalOfficeIIatCiputat,WestJava •RegionalOfficeIIIatDenpasar,Bali •RegionalOfficeIVatMakassar,Sulawesi •RegionalOfficeVatJayapura,Papua
The Directorate General for Water Resources is under the Ministry of Public Works. The institution is headed by a Director General who is directly responsible to the Minister of Public Works. Its primary task is to formulate and implement national policy and technical standardization for water resources management, with the following functions:
Figure 4.1 New Organizational Structure of BMKG

42
•formulatetechnicalpoliciesforwaterresources management, comprising irrigation, river basin, coastal waters, lakes, and dams; •execute regulations on water resources management; •superviseandprovide technicalassistanceon water resources management; •provide manual, guidance and standard and related documents for water resources management; and •develop budgetary and investment system on water resources management and other administrative functions.
The Directorate General for Water Resources has 6 administrative and technical directorates, namely: •Secretariat •Directorate for Water Resources Management Supervision •DirectorateforProgramSupervision •DirectorateforRivers,LakesandDams •DirectorateforIrrigation •DirectorateforSwampandCoastalWaters
The Directorate for Rivers, Lakes and Dams is responsible for issuing flood information and forecast to the public.
4.3 Budget
After the tsunami in December 2004, the government provided sufficient budget for BMKG as counterpart funding for the various foreign assisted projects on reconstruction and enhancement of facilities. Currently, the Indonesian government is providing the necessary budget for the O&M of existing BMKG facilities and operational activities. Since the BMKG is in the process of upgrading its facilities, the agency will require more budget in the future for the operation and maintenance of its modern observation systems and facilities.
In addition to the budgetary allocation from the government, the BMKG also get proceeds (about Rp.30 billion every year) from services provided to the aviation sector.
4.4 Accounting system
The BMKG is supported by an Executive Secretary composed of three (3) Bureaus namely, Bureau of Planning, Bureau of Law and Organization, and Bureau of General Affairs. All financial matters are handled by the Bureau of General Affairs. The Bureau of General Affairs is also responsible for the management of proceeds coming from the commercialization of products for the aviation sector through airport management authorities and state owned companies specialized in airport services. The estimated annual income received from both companies is about US$3.0 million.
4.5 Human resources
As of December 2009, the total number of staff of BMKG is 4,288. In terms of the percentage of age, about 35% are between 46 to 55 years old, 28% are 26 to 35 years old and 17% are between 20 to 25 years old.
The number of staffs of BMKG with professional qualifications is: mathematics and natural sciences - 310, meteorologists - 71, geophysicists - 70, administration – 57, accountants – 76, and the rest are undergraduates.
To improve its work force, BMKG has designed a robust educational system in collaboration with universities to support young students to undergo BS and post graduate studies. Currently, about 250 students are undergoing training and further studies. After completion of their studies, the young graduates will be employed by the BMKG.

43
4.6 Training programmes
The BMKG has an Education and Training Division to train observers and technician. All technical trainings and university degree level are conducted locally. In addition all the staffs have to undertake management training in the Civil Service. Candidates for higher degrees like M.Sc. and Ph.D. are sent abroad. Producing a core staff with M.Sc. and Ph.D. degrees is a major program of the BMKG and for this, assistance is required from WMO and other partners. Efforts are under way to review old syllabus and develop new ones for the training of all classes of staff. The training programmes available for the staff of BMKG are as follows:
Observer training programme (Diploma I) •Trainee: meteorological and geophysical observers •Duration:oneyear •Itisconductedroutinelyeverytwoyears. •This training course is equivalent to WMO Class III. Forecaster training programme (Diploma II) •Trainee:meteorologicalforecastersand geophysical analyst •Duration:twoyears •ThestudentsaretakenfromgraduatedDiploma I staff with higher degree certificate, and also from staff who have been employed as observer for at least four years. •EquivalenttoWMOclassII Instrument’s personnel training programme (Diploma I and II) •Classformeteorologicalandgeophysical instrument technician Duration: 3-6 months Training on maintenance of conventional meteorological instruments •Classforradiooperatorandtechnician Duration: one, two or three years, and dependent on which institute organizes the course.
Training on maintenance of telecommunication and electronic instruments such as: weather radar, radiosonde, satellite receiving system, etc.
Some overseas training courses provided by foreign meteorological services are also availed of: Singapore began to offer the annual training on meteorological services in the ASEAN countries since 1987. Under the ASEAN training programme, the BMKG dispatches one staff annually to take the two-month software training conducted by the Meteorological Service of Singapore.
Currently, there is shortage of meteorologists to be employed in local meteorological offices, NWP scientists, and technical specialists in radar and satellite.
To upgrade the Agency’s human resources for technical/operation (observers, forecasters and seismological analyst), the Education and Training Centre of BMKG through its Meteorological and Geophysical Academy, conducts a 1-year training (observers) and 3-year courses (forecasters) in Meteorology and Geophysics for High-School graduates. The annual number of students varies depending on BMKG’s need. On the average, about 50 to 60 students are enrolled in Meteorology class while about 20-30 students for geophysics. After 3 years of service at BMKG, they are given scholarship to pursue BS degrees either in Meteorology, Physics, Oceanography or Agrometeorology.
Some scholarships are also available for MSc and PhD in collaboration with recognized universities in Indonesia i.e. University of Indonesia, Bogor Agricultural University and Bandung Institute of Technology.
The annual number of scholarship for each degree programme varies depending on the annual budget allocation for BMKG’s Education and Training Centre. In 2009, BMKG provided scholarships for 20 BS degree, 20 for MSc, and 8 for Ph.D.

44
4.7 Premises
The main headquarters of BMKG is located in Jakarta which includes the National Meteorological Centre, Climatological Centre, and Seismological Centre. The new BMKG headquarters which showcases state-of-the-art technology is being constructed and will be fully completed in 2011 (Figure 4.2).
4.8 Partnerships with national agencies/institutions The BMKG has special relationships and responsibilities with several ministries such as the Ministry of Defense, Ministry of Agriculture and Forestry, Ministry of Transportation, of Labor and Social Welfare, of Health, Ministry of Security, Ministry of Finance, Ministry of Foreign Affairs, Ministry of Industry, Ministry of Energy and Mining, Ministry of Education, Ministry of Information and Culture (Mass-Media), and the Indonesian Red Cross.
Figure 4.2 BMKG new headquarters

45
4.9 Annual report and publications
BMKG publishes a Year Book where meteorological-hydrological data and important activities are reported. The annual publications include: Observations made at Secondary Stations in Indonesia, Observations made at Jakarta Observatory, Rainfall Observations in Indonesia, Meteorological data of Indonesian Aerodromes, Earthquakes in Indonesia, Magnetic Observations made at Tangerang, and Statistical Table. Meteorological and Geophysical Report are published monthly. Other publications include the Climate, Weather, Seismic and Pollution Report (issued every 10 days).
4.10 Visibility of BMKG
BMKG air its daily forecast through TV and radio and publish it in newsprint. It maintains a website that posts daily weather forecasts, advisories, climatological data, and other information.
As part of its education campaign, the BMKG office is open to school children for study tour of its facilities and provide lectures in meteorology, seismology, and relevant issues like climate change.
In the international meteorological community, BMKG is very visible considering that its Director General of BMKG is currently the President of WMO Regional Association V.
Before the tsunami in 2004, BMG then was not even known by most of Indonesians. However, in 2005, the BMKG’s popularity has surged especially now that it is under the Office of the President.
4.11 International memberships Indonesia, through BMKG, is a member of the World Meteorological Organization with the Director
General as the Permanent Representative. BMKG is also a member of the ASEAN Sub-Committee on Meteorology and Geophysics (SCMG) and an observer of the Committee.
International/regional organizations which have cooperation with BMKG includes KNMI Netherlands (climate data exchange and hydrology); Meteo-France (forecasting system tools); JMA (technical assistance in satellite meteorology, seismology and tsunami warning); IMD India (agrometeorology and radar meteorology); BoM Australia (Joint Working Group on Meteorology: Communications system, technical training); ADPC (climate field school along with Indonesian Ministry of Agriculture); For earthquake monitoring and tsunami warning system BMKG has cooperation with the Pacific Tsunami Warning Centre (PTWC), GFZ Germany, and CEA (China Earthquake Administration).
4.12 Cooperation with other providers of hydrometeorological services in Indonesia
BMKG is closely working with the Directorate General for Water Resources in providing hydrometeorological services in Indonesia. The Directorate for Rivers, Lakes and Dams is responsible for issuing flood information and forecast to the public. BMKG also maintains good working relationship with the Department of Environment, Ministry of Agriculture and Forestry, of Public Works, the National Disaster Management Agency, National Search and Rescue Agency, etc. in providing hydrometeorological services in the country.

46
5 CURRENT SERVICES OF BMKG
5.1 Weather services
The provision of timely, accurate and relevant weather forecasts, advisories, and warnings is a continuing challenge to national meteorological and hydrological services. The improvement of its weather surveillance radars capable of monitoring severe weather disturbances in real-time will enable the BMKG to improve its forecasting services.
Forecast products which are available at BMKG’s official website include 24-hr forecast, 3-days weather advisory, weekly weather advisory, 1-7 days warning of potential extreme weather, seasonal forecast, tropical cyclone bulletin, marine weather services (24-hr, 48-hr, 72-hr wave and wind forecasts), fire weather (fire danger rating system/
FDRS) information (1-3 days forecasts), and daily flood potential advisory.
The Centre for Public Weather Services of BMKG provides services 24/7 which includes watches, alerts and warnings. Such services are provided by Jakarta Tropical Cyclone Warning Centre, Marine Meteorology Service, Severe Weather Monitoring and Meteorological Information sub-divisions and supported by other units such as remote sensing division and other monitoring units.
Daily weather forecast is aired on TV and radio, published in daily newspapers, and regularly updated at the BMKG website.
Figure 5.1 Wave-Height Forecast Product of BMKG

47
5.1.1 Processing and visualization tools
For visualization NWP and other products, the BMKG is using the latest version of Synergie system from Meteo France. It is used primarily for operational public weather service.
5.1.2 Accuracy of weather forecasts
Weather forecasts for all districts in Indonesia are provided by BMKG’s regional offices. Its average forecast skill is about 70%.
5.1.3 Users of weather, flood and climate information and forecasts
With the public’s awareness of the adverse impacts of climate change there is a high demand for hydrometeorological services. Aviation, marine transportation, fisheries, forestry, tourism, agriculture and agro-industry are the sectors that benefit most from the weather information issued by BMKG.
5.1.4 Needs for weather forecasts and real-time meteorological data
There are various needs for weather forecasts and real-time meteorological data as follows: •Agriculture sector needs timely and accurate seasonal prediction for their farming activities in order to achieve optimum harvest; •Fishery sector can obtain information for
potential fish catching area and fleet safety for their fishing boats by using marine weather information; •Forestry sector will greatly benefit from forest fire potential area information through fire weather bulletin (Fire Danger Rating System information) issued by BMKG on a daily basis; •Transportation (aviation and marine transport) can obtain accurate and timely information and warning for the safety of their operations; •Manufacturingindustryespeciallyagro-industry will derive benefit from seasonal prediction for their supply of raw material coming from the agriculture and fishery sectors; •Community, social and personal sectors can obtain benefit from timely, accurate and effective weather information and warning for their business plans;
BMKG along with the National Survey and Mapping Agency (Bakosurtanal), Ministry of Mining and Energy, and Ministry of Public Works collaborate to develop and provide flood-risk area zoning information for several provinces in Java and Sumatra (for first project) and in the near future will be upscaled in all provinces in Indonesia. These products have been used in various activities since 2006.
Currently, BMKG also provides meteorological information and analysis for insurance claims purposes on demand basis.
5.2 Early warning system
The Indian Ocean tsunami in December 2004 has made great changes in the way disaster should be managed. The lessons learned from the tsunami triggered the improvement in the dissemination of information and has increased the awareness and preparedness of Indonesia against disasters. The catastrophic tsunami underlined the government’s understanding and importance of disaster management.
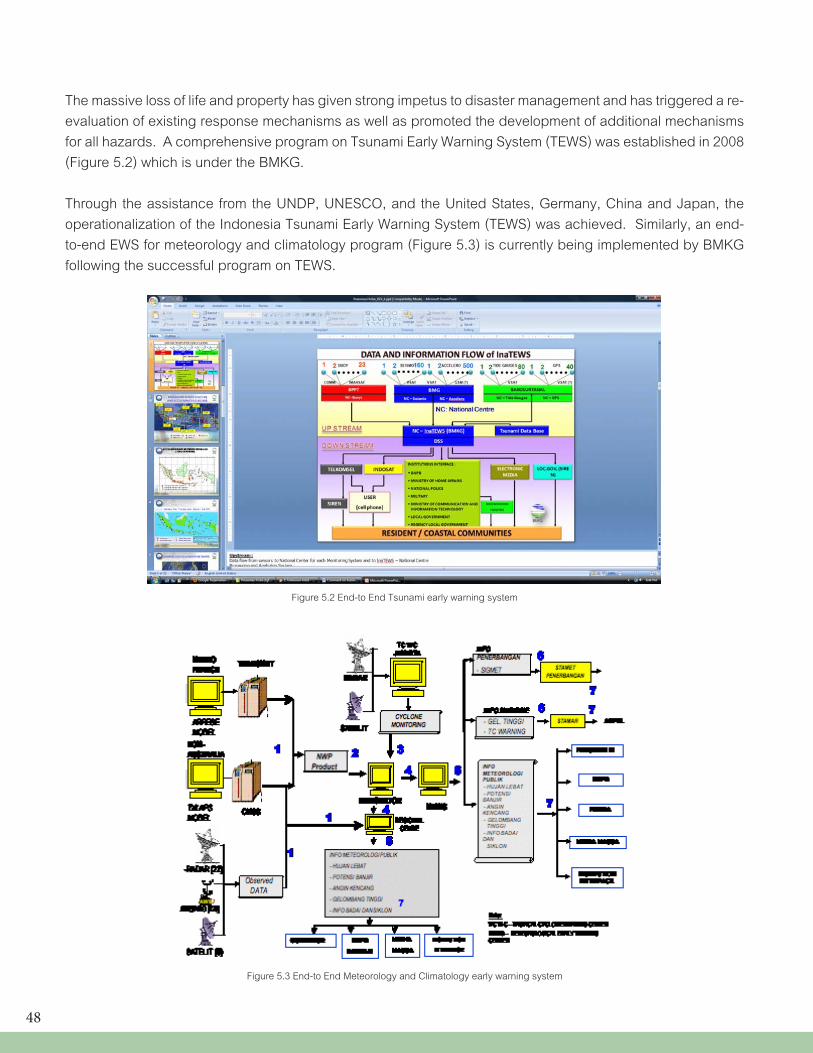
48
The massive loss of life and property has given strong impetus to disaster management and has triggered a re-evaluation of existing response mechanisms as well as promoted the development of additional mechanisms for all hazards. A comprehensive program on Tsunami Early Warning System (TEWS) was established in 2008 (Figure 5.2) which is under the BMKG.
Through the assistance from the UNDP, UNESCO, and the United States, Germany, China and Japan, the operationalization of the Indonesia Tsunami Early Warning System (TEWS) was achieved. Similarly, an end-to-end EWS for meteorology and climatology program (Figure 5.3) is currently being implemented by BMKG following the successful program on TEWS.
Figure 5.3 End-to End Meteorology and Climatology early warning system
Figure 5.2 End-to End Tsunami early warning system

49
5.3 Hydrological services
Most of the floods in Indonesia are due to overflowing or overtopping of river banks inundating low land areas adjacent to the river. The velocity of water overflowing low land areas depends on the terrain and the height of accumulated water in the river. Anything in the low land areas, whether urban centres, commercial districts or agricultural areas can be inundated for a couple hours and even a few days (2 - 5 days). Three determinant conditions influence flood events, these are: 1) the intensity and duration of rainfall, 2) the condition of river channels, and 3) the existence of low land areas.
The Directorate General for Water Resources (DGWR) is responsible for formulating technical policies for water resources management, comprising irrigation, river basin, coastal waters, lakes and dams. Among the five technical directorates of the DGWR, the Directorate for Rivers, Lakes and Dams is responsible for issuing flood information and forecast to the public. It monitors the water level in rivers and dams, river flows, and discharge for use in the issuance of flood warnings and advisories.
The DGWR through its research arm prepared the flood hazard maps for Indonesia. The Experimental Section for Hydrology and Water Management conducts research and development studies on flood, drought, flood warning system, erosion, sedimentation, rainfall-runoff relationship, groundwater instrumentation of hydrology, climate and water management.
5.4 Climatological services
BMKG’s climate monitoring products include monthly to 3-monthly rainfall prediction (maps), seasonal prediction and seasonal climate outlooks every 6 months (maps, monthly total rainfall, means,
anomaly maps and graphs, and text assessment, onset of dry/rainy season maps, anomaly of onset of seasons in the forms of tables and maps).
In seasonal to inter-annual climate modeling, BMKG makes use of statistical models to generate monthly rainfall prediction, monthly flood-risk area prediction, and seasonal climate prediction. The BMKG cooperates with climate centres such as MRI of JMA and CSIRO. BMKG does not work on global models but is focused on regional and local area modeling.
Seasonal predictions are made based on mathematical models with additional consideration of ENSO indices communicated from Australia, US and Japan. Experience indicates that the natural variability of Indonesian climate has some relation to El Nino Southern Oscillation (ENSO) events.
The end-users of BMKG’s climate monitoring information are policy makers and public authorities (government ministries and agencies, local government), state and private companies, research agencies/organizations, universities, mass media, and the general public.
On climate change activities, the BMKG provides background materials and supports the Indonesian Climate Change Board in terms of scientific expertise and climate data for the climate change issues in Indonesia. It also issues climate-related information for specific users and the general public.
5.5 Agro-meteorological services
The BMKG provides observed and forecast meteorological data and information needed for farming activities, such as rainfall, humidity, temperature, evapotranspiration, and seasonal outlook. In addition, the agency established the Climate Field School (CFS) for farmers to learn how to mitigate the impacts of extreme climate events on

50
agriculture (Figure 5.4). The first CFS was conducted in Indramayu District, West Java and replicated in 10 districts in 2006. As end-users of the climate information, the farmers have some difficulties in the interpretation so they could not apply them in their farming activities. The general aim of the CFS is to increase farmers’ knowledge on the application of climate information in decision making at the farm level. Through the CFS, Indonesian farmers are better prepared against climate change and improve their capacity to apply climate forecasts and other agro-meteorological information to help them
Figure 5.4 Schematic of Climate Field School (CFS) activities
improve farm production. The school’s alumni are now practicing multiple dry cropping of rice, corn, cassava, sorghum, tobacco, and vegetables. Rice in Indonesia is planted only during the rainy season.
In 2007, the ASEAN Climate Field School was held in Indramayu, West Java in cooperation with the BMKG, Directorate General of Food Crops of the Ministry of Agriculture (Jakarta), Asian Disaster Preparedness Centre (ADPC, Bangkok), and the University of Agriculture (Bogor).
5.6 Marine services
The BMKG issues shipping bulletins and warnings for waves and storm surges (Figure 5.5) and these are sent to the Port Authority (Department of Transportation). These are also broadcasted through radio for the Department of Fisheries. The information is also published in newspapers daily. The bulletins are prepared according to the IMO standards.
There are only seven (7) marine stations in Indonesia, hence, observations are limited. Also, the current system is not automated so there is a need to upgrade and expand the marine observation stations and promotes voluntary marine meteorology observation by ships/commercial vessels through VOS (Voluntary Observing Ships) program to state-owned/ national and private shipping companies.

51
5.7 Environmental services
5.7.1 Water quality
Under the Ministry of Public Works, the Research Centre for Water Resources (RCWR) through the Experimental Station for Water Resources Environment has conducted a series of measures on water quality management, water pollution control, water quality monitoring development system as well as technical guidance for empowerment of regional and local water quality laboratories. Specific services include laboratory tests on waste water, sedimentation/sludge/soil, bioassay, technical advices on water quality management as well as water quality tests and pollution control; and technical guidance on water quality monitoring, and waste water treatment technology.
5.7.2 Air quality
For air quality modelling, BMKG uses the Air Pollution Model (TAPM® ver 3.0) for observing the regional pollutant trajectory. TAPM output parameters are in numerical form which can also be viewed in graphical mode, either in 2D or 3D. It is shown to have good skill in simulating thermally driven mesoscale systems such as sea and land breeze, and urban heat-island effect.
Figure 5.5 Wave height forecast displayed at BMKG website http://maritim.bmkg.go.id/index.php/main/home

52
5.8 UV radiation: None
5.9 Climate Change related services
As an adaptive program for climate prediction, the RDC of BMKG conducted a project on the development and validation of statistical multi- technique climate model for climate prediction and its sectoral application in mesoscale (district). The research project aims to develop and evaluate a number of hybrid statistical and dynamical climate model in global, regional and local scale to be used as a tool for prediction and simulation of climate scenario, for sectoral application on agriculture, health, fishery, water resource management, disaster preparedness and mitigation.
The methodology involves Principal Component Analysis (PCA) and Clustering Method for climate zoning analysis (Figure 5.6). The three models used for the rainy season forecast for Mesoscale Statistical Multi-technique Climate Development are the ARIMA, ANFIS and Wavelet Transformation. All models are integrated in one stand alone application, built under MATLAB software called HyBMG (Hybrid BMG). The final result of the forecast is a hybrid of the three models considering the last atmospheric and physical conditions. Using the HyBMG, each rainfall type zonation is predicted for the next year.
Figure 5.6 Adaptive program on climate change involving validation of multi-technique climate models and climate field schools

53
5.11 Information services
The hydrometeorological information, forecast products and bulletins provided by BMKG are sent to end-users such as disaster risk management agencies, mass media, and the public through telephone, fax machines, SMS, internet and tri-media (radio, TV, newspaper). BMKG has a dedicated telecommunication line, RANET, which transmits information automatically to the interface institutions. Some meteorological stations provide local weather forecasts and information in their respective areas through local television and radio stations.BMKG also maintains a website where relevant information can be accessed by the public. Figure 5.7 illustrates the 5 in 1 application or information services of BMKG.
To improve its information services, the BMKG needs to upgrade its database, increase its data storage, adopt GIS based products, and automate its process of producing the different types of products on climate services.
5.10 R&D based Expert Services
The Research and Development Centre (RDC) of the BMKG is tasked to conduct research and development in meteorology, climatology, air quality, and geophysics. Its vision is to become “a centre of professional research and development, pre-eminent and can support activities and services in meteorology, climatology, air quality, and geophysics”. The RDC is in charge of the software and hardware development for BMKG operations. The following are the main programs of RDC: •Improvement of forecast accuracy in the fields of meteorology, climatology, air quality and geophysics; •Development and evaluation of sectoral application models in the said fields; •Provides research development and science information services; •Design, engineer and prototype hardware, software, observation and data information system in meteorology, climatology, air quality and geophysics; •Study socio-economic and legal aspect in meteorology, climatology, air quality, and geophysics
Research activities include: •Simulationofweather,climateandgeophysical processes in Indonesia based on statistical, non-linear and/or numerical models •Indonesian climate simulation from 1950-2002 based on reanalysis data •Disastermitigationproceduredesign
Figure. 5.7 Five-in-one application or information services of BMKG

54
6BMKG has 120 meteorological stations and 21 climatological stations (Figure 6.1). After the tsunami in December 2004, BMKG embarked on an automation program for its meteorological-
climatological early warning system (MCEWS). Currently, BMKG has 53 automatic rainfall stations and 26 additional stations will be installed in 2010 (Figure 6.2). The target number of automatic rainfall stations is 220.
Figure 6.1 Network of meteorological, climatological and geophysical stations
Figure 6.2 Network of automatic rainfall stations
BMKG’s NETWORK OF MONITORING STATIONS
6.1 Surface network
6.1.1 Synoptic stations
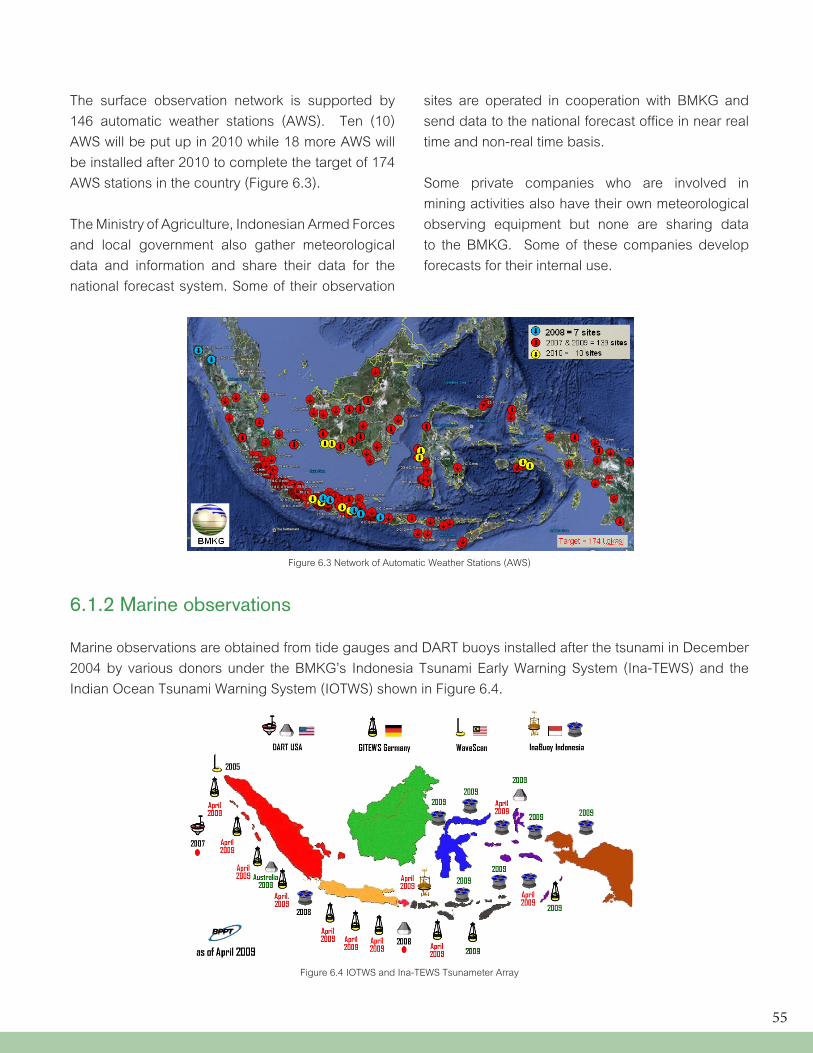
55
The surface observation network is supported by 146 automatic weather stations (AWS). Ten (10) AWS will be put up in 2010 while 18 more AWS will be installed after 2010 to complete the target of 174 AWS stations in the country (Figure 6.3).
The Ministry of Agriculture, Indonesian Armed Forces and local government also gather meteorological data and information and share their data for the national forecast system. Some of their observation
sites are operated in cooperation with BMKG and send data to the national forecast office in near real time and non-real time basis.
Some private companies who are involved in mining activities also have their own meteorological observing equipment but none are sharing data to the BMKG. Some of these companies develop forecasts for their internal use.
6.1.2 Marine observations
Marine observations are obtained from tide gauges and DART buoys installed after the tsunami in December 2004 by various donors under the BMKG’s Indonesia Tsunami Early Warning System (Ina-TEWS) and the Indian Ocean Tsunami Warning System (IOTWS) shown in Figure 6.4.
Figure 6.3 Network of Automatic Weather Stations (AWS)
Figure 6.4 IOTWS and Ina-TEWS Tsunameter Array

56
6.1.3 Hydrological stations
Hydrological stations in Indonesia are managed by the Directorate of Water Resources under the Ministry of Public Works. Monitoring of river basins started in 1864 with the installation of a rain gauge station in Batavia while the first set of river discharge stations were established in Cianten-Karawang and Catur-Giringan from 1942 to 1952 during World War II and the independence war. More developments were noted in 1970 and the highest development was in 1992.
Currently, there are 4,500 rainfall stations, 87 climate stations, 700 river gauging stations. More than 75% of the rainfall stations are in Java; 11.84% in Sumatera; 4.58% in Sulawesi; 2.71% in Kalimantan; and 1.4% in Bali. River discharge stations, climate and groundwater stations have uneven spatial distribution because these were procured through different projects.
Most of the hydrological stations installed are of the manual type. However some of the province had already started with automatic stations, such as DKI Jakarta, East Kalimantan, Central Java, South Sumatera, and Gorontalo.
Some of the hydrological stations are not working properly due to limited operation and maintenance budget and human resource capacities.
Some of the river basin organizations (RBO’s) are improving the hydrological network and equipment by acquiring new ones, and conducting repair and calibration of existing equipment.
6.1.4 Ozone observations
BMKG has 2 ozone observation stations, namely:
Figure 6.5 Distribution of river gauging stations in Indonesia
Global Atmosphere Watch (GAW) Bukit Kototabang, West Sumatra, and BMKG Head Office, Kemayoran, Jakarta
6.1.5 Seismological observations
After the tsunami in December 2004, a large number of seismic stations have been put up through foreign assistance. Currently, there are 152 broadband seismic stations and 112 accelerometer installed. From the existing stations, 15 were provided by Japan, 10 by China, 21 by Germany, 6 by CTBTO while the rest (102) were put up by the national government. The target number of seismic stations is 160 and 500 for accelerometer. The network of seismological stations is shown in Figure 6.6.

57
6.2 Remote sensing
6.2.1 Upper-air observations
Upper air observations provide valuable data on the vertical profile of the atmosphere. Direct in-situ measurements of air temperature, humidity and pressure with height are measured with balloon-borne instrument platform with radio transmitting capabilities called radiosonde, typically to altitudes of approximately 30 km. These data are crucial in the forecast for severe weather and for aviation route forecast as well as in numerical weather prediction.
Currently, BMKG has 12 upper air stations strategically located to have a good coverage of the entire country. Four (4) stations will be installed in 2011. The main problem in operating these stations is the high cost of radiosonde transmitters. These instruments are imported and the annual budgetary requirement for each upper air station amounts to approximately US$220,000.
6.2.2 Radars
Given the nature of damaging storms from convective activities mostly from the northern part of Papua island, Maluku and Sulawesi, and the southern part coming from Indian ocean and northern Australia, the areas that will benefit from radar observation are the West coast of Sumatra island (Bengkulu, North Sumatra, Sulawesi, North Maluku (Ternate), Kupang, Merauke (southern part of Papua province).
Currently, there are 24 C-Band radars in Indonesia and all of these cover the urban areas of Banda Aceh, Medan, Padang, Jambi, Bengkulu, Palembang, Bandar Lampung, Jakarta, Tangerang, Semarang, Surabaya, Pontianak, Balikpapan, Banjarmasin, Manado, Makassar, Gorontalo, Denpasar, Bima, Kupang, Ambon, Biak and Jayapura as shown in Figure 6.7.
Based on its radar program, about 30 radars are envisioned to be installed by 2014 as depicted in Figure 6.8.
Figure 6.6 Distribution of broad band seismic and accelerometer stations

58
Figure 6.7 Existing radar network
Figure 6.8 Existing and proposed radar network

59
6.2.3 Lightning stations
BMKG has lightning stations under its geophysics division but BMKG does not issue lightning forecasts or warnings.
6.2.4 Satellite
The BMKG has 4 meteorological satellite ground receiving systems for both polar orbiting and geostationary satellite (MTSAT, Feng Yun 2-D/E, NOAA and MODIS Aqua-Terra) which are installed in the Head office in Jakarta and MTSAT and NOAA receiving system are installed in 8 major cities, namely, Medan, Lampung, Ciputat, Pontianak, Denpasar, Makassar and Jayapura shown in Figure 6.9.
LAPAN (National Space Agency) and other government agencies in Indonesia operate several satellite remote sensing ground stations to capture data from different satellite such as Landsat, Spot, Terra/Aqua-Modis, NOAA-AVHRR, Feng Yun, and with International collaboration (Acres-Australia, Macres-Malaysia, Crisp-Singapore, Gistda-Thailand, Jaxa-Japan, USGS-USA, etc) LAPAN can provide high resolution satellite data such as Spot-5, Ikonos, Quickbird, ALOS. LAPAN and other agencies operate some small and large size antennas with 2.5 m, 10m and 11m diameters using X band, C-Band, S-Band and L-Band receiver capabilities. Some of them are located in Biak (Papua), Parepare (Sulawesi), Samarinda (Kalimantan), Rumpin (Bogor), and Jakarta. The processing, analysis and image interpretation work is conducted mostly in Jakarta and other sites. The facilities are equipped with a SGI/Irix System, several Work Stations, plotters and scanners for data reproduction. Data/Information archiving and dissemination services are provided at near real time and on- line, through internet services (for high temporal resolution satellite data i.e.: Terra/Aqua, NOAA).
Some research activities related to remote sensing applications, especially for hazard monitoring such as drought, forest fires, and floods have been done for a decade. These activities utilized multi-temporal satellite
Figure 6.9 Network of satellite receivers

60
data such as NOAA-AVHRR and Terra/Aqua MODIS. LAPAN and other agencies such as the Ministry of Forestry have archived NOAA-AVHRR Data for over twenty years, and these have been distributed to other research agencies such as Bogor Agriculture University, University of Udayana, University of Sriwijaya etc.
Related to the tsunami in NAD-Aceh, LAPAN provided satellite data which were utilized for quick response activities, rough vulnerability assessment, and quick evaluation of the impact of the tsunami. Some high resolution satellite data provided by international agencies have been reproduced and submitted to the government coordinating agency (Bappenas), BPN etc. Now, with other National agencies (BMKG, LIPI, BPPT, Bakosurtanal, BNPB etc), LAPAN will provide LUC (land use coverage) data derived from high resolution satellite imagery for Padang City (as the Pilot Project Site), especially for the TEWS preparedness program.
Voice, Text and Image data can be transmitted via National Satellite (Palapa-C, Telkom-1) as a repeater through VSAT provider (CSM, Lintas Arta). The data include seismic data, VSAT IP and VSAT Link to other operation/warning centres. Remote sensing satellite systems (Landsat, Spot, NOAA, Envisat, etc.) have been utilized to provide geo-spatial data with certain sensor capabilities from optical to radar sensors. This data can describe the condition of the tsunami affected area after conducting some processing, analysis, and interpretation. Some satellite technology has been utilized for hazard monitoring and geo-spatial data collection at moderate level. Problems relate mostly to financial and infrastructure limitations, as well as coordination to maximize the use of both telecommunication and remote sensing satellite technologies. In the future, both satellite technologies can be integrated for the benefit of hazard monitoring national program.
61
7 MAINTENANCE, CALIBRATION AND MANUFACTURING OF MONITORING FACILITIES
7.1 Meteorological observations
BMKG has its own calibration facilities. The primary calibration facility is at the BMKG HQ in Jakarta while the secondary calibration facilities are at the 5 BMKG Regional Centres. The Sub Division of Calibration of Meteorological Equipment is task formulate calibration procedures, standardization, and specification of standard equipment and calibrators, as well as implementation inventory, monitoring and evaluation, procurement, repair and equipment calibrators and calibration equipment implementation.
BMKG PUSINKAL Laboratory is under of the Instrumentation Center, Engineering, and Calibration, under Climatology Meteorology and Geophysics Agency. The calibration laboratory is accredited by National Accreditation Committee, and provides the methodology and documentation, etc. related to calibrators and calibration equipment based on international standards.
The BMKG PUSINKAL Laboratory provides the following services: 1. Calibration services on professional and excellent service to customers; 2. Requirements in applying for ISO / IEC 17025:2005 to improve the effectiveness and sustainability of management systems; and 3. Implementing policies and procedures.
Some of the calibration equipment includes: wind tunnel, temperature test cabinet, pressure chamber and humidity test cabinet. BMKG does not manufacture weather instruments and most of these are purchased from foreign manufacturers (Vaisala, RMYoung, Casella, etc.).
However, initial efforts have been undertaken by BMKG’s Research and Development Centre to develop a prototype of AWS sensor and display but these are still at the research stage. In 2005 to 2007, a state-owned company named PT. LEN initiated to fabricate and test a prototype for local radiosonde transmitter, but up to now it is still in the experimental stage.
7.2 Hydrological observations
The Research Centre for Water Resources (RCWR) is being accredited for the calibration of current meter, automatic rainfall recorder, and anemometer. Together with universities and government owned companies, RCWR have joined in TECH 4 WATER to design a telemetry equipment and Flood Forecasting and Warning System (FFWS).
The RCWR has several laboratories equipped with facilities designed to calibrate various meteorological and hydrological instruments shown Figure 7.1.

62
Figure 7.1 Facilities for calibrating meteorological observation instruments
BMKG’s has the capacity for calibration of meteorological and hydrological instruments as follows: •CalibrationofBarometer/barographcapacity:40-1100mb •Calibrationofthermometercapacity:-20°s/d+50°C;50°s/d100°C •Calibrationofhumanitytestcabinet:CapacityofHygrograph:15-96% •Calibrationofautomaticraingauge:Capacity:0.5–15mm/menit •Calibrationofwindrunmeter(anemometer)capacity:0.15-50m/s •Calibrationofactinographandothersolarradiationmeters
Some of the river basin organizations (RBOs) are improving its hydrological network and equipment by new procurement, and repair and calibration of existing equipment. Calibration of current meter capacity: 0.02-5 m/s

63
Figure 7.2 Location of the Research Centre for Water Resources, Experimental Stations and Sub Experimental Stations
Figure 7.3 Facilities at the Laboratory of Hydrology Calibration in Bandung and Ciparay

64
8 NUMERICAL WEATHER PREDICTION (NWP)
8.1 Operational models
For operational use, the BMKG utilizes NWP products from ARPEGE model (METEO France) using the Synergie system as forecasters workstation. ARPEGE is the acronym for Action de Recherche Petite Echelle Grande Echelle: Research Project on Small and Large Scales. ARPEGE is a variable resolution spectral primitive equation model which is run with a semi-Lagrangian semi-implicit scheme.
Experiments on downscaling of global model outputs are being done in collaboration with the Kyoto University, and Meteorological Research Institute, Japan Meteorological Agency (MRI – JMA). In addition, starting 2008 the Centre for Research and Development – Meteorological, Climatological, and Geophysical Agency of Indonesia (BMKG) in collaboration with the Australian Commonwealth Scientific Research Organization (CSIRO) has also been experimenting with Cubic Conformal Atmospheric Model (CCAM), which is an alternative global model with stretched grid system. CCAM is expected to be used operationally in 2011.
Figure 8.1 Output of the ARPEGE model displayed in the BMKG website
8.2 Verification of NWPs
Validation of the rainfall forecast models are undertaken using statistical techniques through the application of Wavelet, Adaptive Neutral Fuzzy Inference System (ANFIS) or ARIMA (Auto-Regressive Integrated Moving Average) analysis. The Wavelet transformation can capture wave signs from decadal or monthly rainfall fluctuations during series data recognition. The ANFIS is an optimizing method which functions to identify a model of time series adjusted with environmental changes and combines logic making conclusions for decision making. The ARIMA is an extrapolation method for forecasting which is useful for time series modelling. The average forecast skill of the models is about 70%.

65
9 INFORMATION AND COMMUNICATION TECHNOLOGY (ICT)
9.1 Communication facilities
Table 9.1 Communication facilities for transmission, reception and exchange of data and products(RD = to receive data/observations, RI = to receive information/products, SD = to send data/ observation,
SI = to send information/products, RW = to receive warnings, SW = to send warnings).
RD RI SD SI RW SW RemarksTelephone √ √ √ √ √ √Mobile Phone √ √Telefax √ √ √ √ √ √Dedicated Leased Lines √ √ √ √UHF radio transceiverHigh frequency/Single side band radio √ √ √ √ √ √HF Radio EmailAeronautical Fixed Telecommunication Network √ √ √ √Very Small Aperture Terminal √ √ √ √ √ √Data Collection Platforms used to transmit data from AWSsGlobal Telecommunication system (WMO-GTS) √ √ √ √ √ √Meteosat Second Generation Satellite systemOther satellite systems (MTSAT) √ √Internet √ √ √ √ √ √Email √ √ √ √Post/mail √ √Print media √ √TV –national √ √TV-commercial √ √Radio √ √Bulletins √Others (please list)
BMKG is connected to the internet through Broadband with a speed of 100 Mbps.
Modern and reliable communication facilities for real time data transmission from remote stations in some parts of the country (especially eastern part of Indonesia) to HQ are still very limited.
Both the real time (using GTS) and digital on line stations (dial-up) are operating in high sampling
rate less than 1 minute. The former transmit the data every 15 minutes with facility capable of triggering the system to send the data more immediately if any extreme sea levels such as tsunami might occur while the latter are downloaded via telephone modem weekly. Table 9.1 shows the communication facilities in Indonesia for use in data collection, data exchange and dissemination of forecasts and warnings.

66
Indonesia through state government and private companies operates several telecommunication satellites (Palapa-C, Telkom-1, etc.) to cover and connect the whole of Indonesia’s territory and regions. Indonesia uses satellites for transmission of collected seismic, sea level, and GPS data. Currently these data are not immediately available for use in tsunami response.
In addition, the earthquake information is broadcast by SMS to government officials/leaders. BMKG can also cut into TV and radio broadcasts for emergency messages. Other methods used in warning dissemination are fax to Government officials/leaders, and internet. To alert communities, the population can subscribe to receive SMS messages. Brochures are available providing instruction on how to receive SMS messages.
The open architecture communication infrastructure of BMKG supports integration of additional components, as shown in Figure 9.1.
Figure 9.1 IT infrastructure of BMKG

67
The BMKG’s internet services
Currently, BMKG has 140 sites of radio internet for dissemination of information (Figure 9.2) which are installed in remote areas not covered by terrestrial communication system.
Figure 9.2 Network of radio internet for information dissemination
9.2 Data management
Rainfall and climate data processing is undertaken by BMKG. However, the agency’s database is fragmented since some of the data were lost when BMKG moved to the new office. Some of the data of BMKG are in paper form. The data before 1960 are still in the possession of the KNMI (Royal Netherlands Meteorological Institute) since the Dutch started meteorological observation in Bogor, Indonesia in 1841. The BMKG is negotiating with KNMI on the sharing of data, collaborative research, training and scholarship opportunity for BMKG personnel in Netherlands.
For hydrological data, processing of river discharge is carried out by the RBOs and supported operationally by the Directorate General of Water Resources and technically by the Research Centre for Water Resources. There has been an improvement in data processing and calibration due to the evolution of data measurement from manual to automatic then to telemetry system.
9.3 IT Personnel
Currently, there is a shortage of IT personnel in BMKG to operate and maintain its vast communication network and IT infrastructure in the Indonesian archipelago.
9.4 Needs to improve communica-tion system and data management
The needs to improve communication system and data management of BMKG are as follows: •Increaseamountofreal-timedata •Upgradeofsafetysystems •Develop user friendly and common system for real-time access of hydrometeorological and environmental data •Increase the number of IT and database management staff •ProvideappropriatetrainingstoITanddatabase management staff

68
10
Figure 10.1 BMKG’s Multi-mode Information Dissémination System
NATIONAL AND INTERNATIONAL COOPERATION AND DATA SHARING
10.1 National
At present, regular weather forecasts, up to date information and warning, and seasonal prediction are shared through the BMKG’s website.
Various meteorological and climatological informa-tion are distributed in both hardcopy and electronic forms to users such as governmental institutions, mass media, private sectors (on demand basis) via website, SMS and other media. For specific requests BMKG collects fees on its services (except for governmental, social, religious and disaster response activities).
Currently, BMKG also provides meteorological
information and analysis for insurance claims purposes on demand basis.
Through various activities and communications media, almost all potential users are aware of the types of products and services provided by the agency.
BMKG has a contingency plan that ensures continuity of warning products and services in case of organizational emergencies (e.g. power failure, communication disruption, etc.) for tsunami early warning system but not yet for meteorological disasters.
The strategy for BMKG’s information dissemination is shown in Figure 10.1.

69
Figure 10.2 Schematic overview of Global Telecommunication System
Source: http://www.jma.go.jp/jma/jma-eng/jma-center/rth/RTH_Tokyo.html
To maintain a reliable system in disseminating weather/hazard warnings, all facilities and systems installed in BMKG uses local expertise budget in the troubleshooting of facilities and in some cases involve overseas technical experts.
BMKG requires a robust communication system and automatic data switching system to strengthen its capacity to deliver its services even during disaster situations.
10.2 International
The data and information which BMKG exchanges internationally include: •Bulletin/messagedescribedinmanualonGTS(WMONo.386) •WMOBulletin/MessageinICAO“envelope”describedinICAOmanual(Doc.No10) •SingleStationreportdescribedintheWMOorICAOdocumentsandValidityTimeand •Meteorologicalobservationreports(e.g.SYNOP,PILOTetc.)
With the establishment of BMKG’s TCWC in 2008, tropical cyclone warning information is shared to other countries through an international network.
For GTS operation, BMKG uses CMSS applications connected to Melbourne and Singapore and is also connected with the 171 observation stations in Indonesia by using VSAT-IP network.
BMKG also have an Automatic Message Switching System.
GTS links to RTH: Jakarta – Singapore (FR, 64); Jakarta – Melbourne (FR, 64)
Service’s data-sharing protocols meet the WMO requirements and standards, where synoptic data, upper air data, ship data, climate data and TC information are shared.

70
Currently, the Centre for Water Resources Research serves as the Regional Training Centre for SEA HYCOS of WMO. As the RTC, Indonesia encourages neighboring countries in the Southeast Asian region to be actively involved in HYCOS activities and plans to promote capacity building activities, data sharing, climate change adaptive measures, and capacity development.
Source: http://www.jma.go.jp/jma/jma-eng/jma-center/rth/RTH_current_status.html
Figure 10.4 Status of Circuit connectivity between RTHs and NMCs
Figure 10.3 Multi-protocol Label Switching

71
11
Figure 11.1 Schematic of the main program of BMKG
RECENT DEVELOPMENT PLANS PROPOSED/ BEING IMPLEMENTED BY BMKG
The BMKG has embarked on two (2) major priority development programs for a period of 10 years, namely the Indonesian Tsunami Early Warning System (Ina-TEWS) and the Indonesian Meteorological and Climatological Early Warning System (Ina-MCEWS). The Ina-TEWS and Ina-MCEWS were launch on 11th November 2008 by the President of the Republic of Indonesia at BMKG headquarters in Jakarta. Ina-MEWS (for meteorology) started in 2010 while Ina-CEWS (for climatology) will commence in 2012.
With these two new major initiatives in place, it is expected that BMKG will increasingly be able to enhance its services in the field of meteorology, climatology, and geophysics through the provision of fast, precise, accurate, and easily understood forecast and information.
Apart from the core program, BMKG also imple- mented other projects to improve its observation network funded by the government.

72
Table 11.1 Recently completed or existing projects of BMKG
Title of Project Project Duration Project Cost/ Donor Brief Description/Objectives Expected Output Status
Strengthening BMKG Climate and Weather Service Capacity
2011 - 2013 € 30M/France
To strengthen climate and weather services of BMKG
Indonesia : observation, data transmission, and
processing system, High performance computer
systems, NWP assimilation, production and information
dissemination system
High performance of weather and climate services for public
On-going
Meteorological Early Warning System (MEWS)
2011$25M / domestic
budget
Deploys new Doppler weather radar, POES
receiving system AWS, AWOS, marine observing
system, maintenance of observation and
communication system
Timely and accurate weather warnings & advisories for public
On-going
Tsunami Early Warning System (TEWS)
2005 - 2009Grant / USA,
Germany, Japan, China, France
Establishment of Tsunami Early Warning System
(TEWS)
Timely tsunami early warning
Completed
(TEWS) 2010 -2012$40M / domestic
budgetMaintenance of TEWS
Maintain tsunami early warning system and its timely information for
public
On-going
The establishment of the Ina-TEWS program capacitated the BMKG to provide information of position of the epicenter and information on the presence or absence of potential tsunami generated by an earthquake in less than five minutes. This information is automatically sent to the agencies that are closely linked to disaster management in the event of an earthquake and/or tsunami.
On the other hand the establishment of Ina-MCEWS will greatly enhance BMKG’s capability in the provision of forecast and early warning for severe thunderstorms or heavy rains accompanied by
strong winds and lightning, including wave forecast information within one to seven days. Within the Ina-MEWS program is the Jakarta Tropical Cyclone Warning Centre (Jakarta TCWC). It was established through a resolution by the WMO and it considerably improved BMKG’s forecasts for tropical cyclones and their impacts in the region. All information products derived from the Ina-MEWS are disseminated to the public through the relevant interface institutions.
Listed in Table 11.1 are the recently completed and on-going projects of BMKG.

73
The project “Strengthening Climate and Weather Services” which is part of the Ina-MCEWS will commence in 2011 under the France/EU loan scheme. This project will be implemented until 2015 and consists of strengthening observing system (more automatic weather stations will be installed), data processing system, data communications system, products dissemination system, and establishment of Local NWP system (downscaling from Global model). The project cost is about US$35 million.
JICA’s climate change adaptation project is also currently being implemented.
The modernization infrastructure that BMKG has to maintain and enhance for data provision, observation, forecasting, warning and capacities are: •Maintenanceofradarnetwork; •MaintenanceofAWSnetworkandconventionalsurfaceobsevationnetwork; •Mantenanceofsatellitedatareceivingsystem; •Maintenanceofcommunicationssystem;and •DevelopmentandmaintenanceofRegionalNWPModel(DownscalingfromARPEGE-TROPmodel).

74
12 SUMMARY
Despite the tremendous investments in its observing equipment and facilities and several activities in research and development, the BMKG is still short of becoming at par with advanced meteorological centres in the region due to gaps in its technical capacity. However, its sustained efforts and current
programs are leading towards that direction. Table 12.1 enumerates the institutional capacities, gaps and needs that have to be addressed to enable BMKG to fulfil its mandate and improve its services for the major economic sectors in the country including the disaster management sector.
Table 12.1 Institutional capacities, gaps and needs of BMKG
Issues Institutional Capacities Gaps & Needs
Data products
Synoptic data, climate data, METAR, SPECI, SIGMET, TAFOR, ROFOR, satellite, radar, AWS, air quality (O3, SO2, NO2, SPM, rain water acidity), lightning, earthquake, gravity, geomagnetic, time standard/almanac,
•Historicalclimatedatarecoveryurgentlyneeded•HighperformanceDataQualityManagementsystemto support NWP system•IntegrateddatabasesystemforNWPdataassimilation•Replacementandtimelycalibrationscheduleofmet.and climate Instruments in some remote stations•Reliableandlow-costobservationdatacommunication needed for efficiency
Hazard analysis to support risk assessment
Provide expert in disaster mitigation (still limited number)
•Sufficientnumberofexpertindisastermitigationandrisk assessment •AppliedR&Dproductstofordomesticweatherandclimate forecasting still relatively limited
Forecasts and warnings
Indonesian cities daily weather forecast, 6-hr forecast for Jakarta area, province weather forecast, extreme weather warning, flood forecast, wave height forecast, wind forecast, tropical cyclone track forecast and warning, climate forecast, tsunami warning, earthquake information
•HighperformanceNWPassimilationsystemneeded•Radarandsatellitedataassimilationandremotesensing- based observation product development•Developmentofhumanresourcesinweatherandclimate modeling (NWP and climate models)
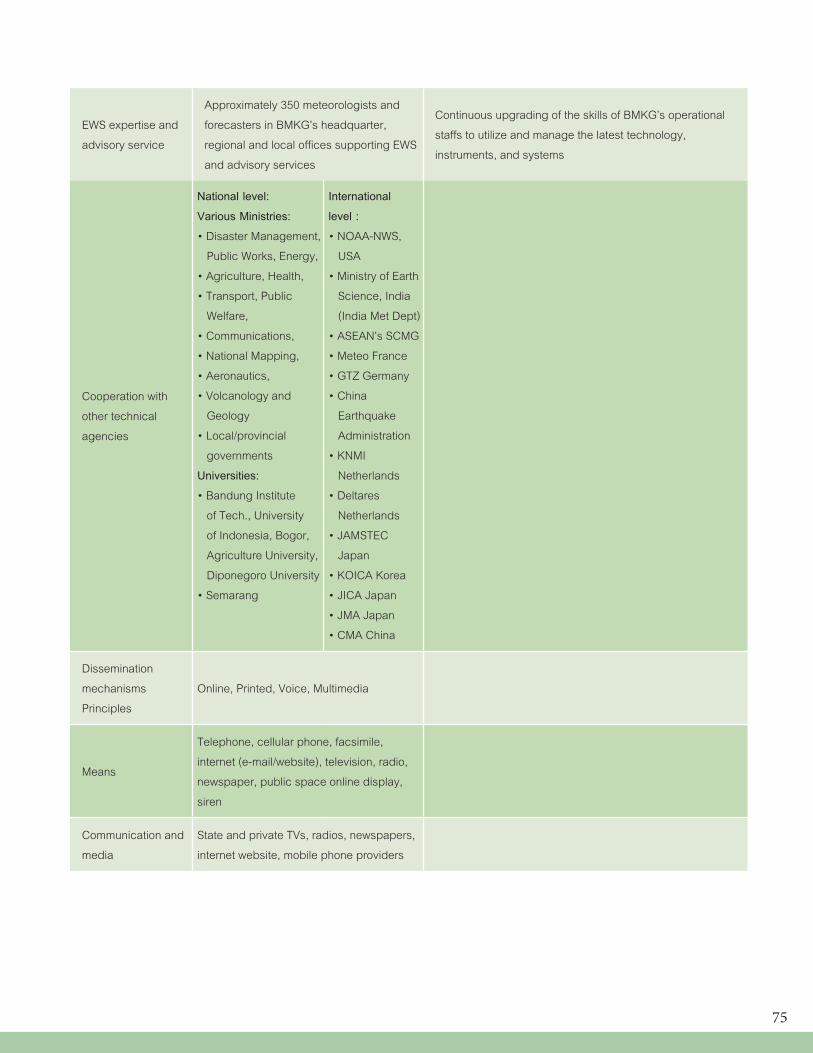
75
Cooperation with other technical agencies
National level: Various Ministries:•DisasterManagement, Public Works, Energy, •Agriculture,Health,•Transport,Public Welfare, •Communications,•NationalMapping,•Aeronautics,•Volcanologyand Geology•Local/provincial governmentsUniversities: •BandungInstitute of Tech., University of Indonesia, Bogor, Agriculture University, Diponegoro University•Semarang
International level :•NOAA-NWS, USA•MinistryofEarth Science, India (India Met Dept)•ASEAN’sSCMG•MeteoFrance•GTZGermany•China Earthquake Administration•KNMI Netherlands•Deltares Netherlands•JAMSTEC Japan•KOICAKorea•JICAJapan•JMAJapan•CMAChina
Dissemination mechanismsPrinciples
Online, Printed, Voice, Multimedia
Means
Telephone, cellular phone, facsimile, internet (e-mail/website), television, radio, newspaper, public space online display, siren
Communication and media
State and private TVs, radios, newspapers, internet website, mobile phone providers
EWS expertise and advisory service
Approximately 350 meteorologists and forecasters in BMKG’s headquarter, regional and local offices supporting EWS and advisory services
Continuous upgrading of the skills of BMKG’s operational staffs to utilize and manage the latest technology, instruments, and systems

76
Table 12.2 Evaluation of level of different skills of BMKG5= excellent, 4= good, 3= moderate, 2= poor, 1= very bad
Score Remarks
Disaster reduction 4 Effective early warning and monitoring system in place
Data sharing / GTS 4 More data are being shared in the region thru GTS
Networking to RegionalHydromet organizations
3For meteorological activities, BMKG hosts the Indian Ocean Tsunami Warning System
International cooperation 4Director General of BMKG is the President of RA V; Centre for Water Resources Research is the RTC for SEA-HYCOS
Weather forecast 3 Still considered too technical by the public
NWP 3 There is a need to downscale the ARPEGE-TROP model.
Hydrological forecast 4Indonesian Red Cross claims that the hydrological/flood forecasts issued by the Directorate General for Water Resources are understandable and people respond to the forecasts.
Agromet service 4 Climate Field School has been established in 10 districts
Automated processing and visualization
5 BMKG has the latest version of Synergie, a visualization tool from Meteo France
Climate Change 3Climate change scenarios have been derived. Need to establish Greenhouse Gases Inventory System and Climate Change Centre
R & D 4More research activities need to be undertaken to improve operational activities, e.g. CCAM, develop transmitter for radiosonde, develop AWS sensors, adaptation measures on climate change impacts, etc.
Support for R&D 4 Have sufficient funds for R&D activities
Surface synop. network 3 Need to increase number of real-time data
Upper-air data 3 Need to increase the number of upper air data
Radar data 3 There is a need to fully utilize radar data for forecasting purposes
Lightning detection 3Need to increase the number of lightning detection stations and issue warnings on lightning
Based on the questionnaire provided to the NMHSs by the WMO in 2006, Table 12.2 shows the grading of the different activities in BMKG.

77
Hydrological Obs. network 3 Need to increase the telemetered monitoring stations
Environmental obs. 3 Need to install more environmental stations
Maintenance and calibration 4Currently, BMKG get enough budget for maintenance but with more new stations, additional budget will be required.
Communication system 4BMKG utilizes 5 in 1 communication system, i.e. SMS, fax, internet, RANET, satellite
Data management 2 Database is fragmented; need data rescue
Webpage 2 BMKG’s website has no English version.
Human resources 3Shortage of meteorologists in local offices, NWP scientists, IT specialist, and technical specialist in radar & satellite data interpretation.
Level of education of staff 3 Staff with post graduatedegree should be increased
Training programme 3 Needs specialized training on radar, satellite & IT
Competitiveness on labour market 2 Need to increase incentives for staff
Management 4 Well managed by the present Director General
Organization 5 Very strong; ministry level since 2008
Public visibility 3 Need to come up with tailored information based on practical users needs
Public appreciation 3Needs to simplify information and continuously make efforts to develop easy and understandable information for various specific users
Customer orientation 3 Needs to be improved
Cooperation with media 3 Needs to enhance cooperation through conduct of media seminars/workshops
Market position 4 Collect revenues from aviation
Foreseen possibilities for sustainable dev’t.
4Enhance R & D, particularly on the manufacturing of AWS and radiosonde transmitters
Total Score 115
The gaps and needs identified in Tables 12.1 and 12.2 were the bases in coming up with recommendations to strengthen the services as well as the investment plan for BMKG.

78
13 RECOMMENDATIONS TO STRENGTHEN THE SERVICES OF BMKG
As outlined in its 2010-2014 development plan, BMKG has formulated major programs to be implemented within the next 5 years in order to support national safety and economy through the following programs:
•Strengthening weather and climate services capacity especially to improve meteorological early warning system. This is very important to minimize life and economic losses due to weather and climate related disaster events •Decentralizationofdataprocessingandanalysis to enhance BMKG’s regional centres in the provision of weather and climate services and warnings to their respective responsibility areas. •Enhancing weather services for transportation (aviation and marine) through easy and accessible information for transportation operators e.g. web-based information to minimize transportation disasters. •Establishment of Greenhouse Gas Inventory System and Climate Change Centre to provide national reference for GHGs assessment and provision of scientific basis information on climate change. Moreover, development of climate projection modeling for district levels up to year 2025 and provision of climate change vulnerability map based on island/regions, and climate change mitigation and adaptation for the major sectors (agriculture, energy, water, forestry, health and environment)
Recommendations made during the consultation workshop with various stakeholders are summarized below:
1. For weather information, near real-time information is needed while for climate information, seasonal forecast with a lead time of 2 months is required.
2. Information provided by BMKG needs to be more understandable and should contain more details in accordance with the user’s needs, service standard and regulation;
3. More comprehensive, timely, accurate and user friendly quantitative seasonal forecast and information are also required;
4. Integration of system information between BMKG and related institution is highly needed, including mass media and information display in public areas;
5. Weather and climate information distribution needs to be expanded to reach district level, small airports, and harbors;
6. Terminology used in the forecast and information needs to be tailored to the users’ needs;
7. Improvement in the knowledge and comprehension of the shipping crew, especially for inter island shipping, cruising shipping, and fishermen to increase the benefits of weather information from BMKG;
8. Weather information and forecasts provided by BMKG need to be more user-friendly by using more understandable terminology and language;

79
9. Seminars/workshops regarding weather and climate information involving stakeholders are needed to gain understanding on synergized inter-sectoral systems and programs;
10. The amount of seasonal forecast zone needs to be increased to have higher temporal and spatial resolution;
11. Coordination between BMKG and related institution/association such as the Indonesian Red Cross at the national, regional and local levels is needed to achieve more effective information service delivery;
12. Public dissemination of the address, phone and fax number, SMS centre and website of weather and climate information provider at the national to the provincial or district level.
Other recommendations identified include:
•Provision of advisories/warnings for extreme small-scale and short duration weather systems, such as tornados, thunderstorms, severe storm phenomena, etc. •Improvementofdataandinformationvisibilityin the web and other public network
•Improvementofunderstandingandpredictionof long-term climate variability through the production of solid and validated climate change scenario on a more localized scale •Intensification of information and education campaign on climate change
•Operationalizationofexpandedwaveandstorm surge forecasting models •Increasecapabilityintropicalcycloneforecasting and warning •Encourage, recognize, and reward innovation at all levels, especially for improved service to customers •Enhancement of professional development
and training program for the work force to include teamwork, leadership, diversity, customer service, and implementing change •Aggressiverecruitmentandproperplacementof personnel especially in the local stations •Complete radar coverage of the country and production of composite pictures; •Closer coordination, quality control and possibilities of common use of hydrometeorological measurements taken by different organizations in the country; •Planning of activities in cooperation with stakeholders and end-users to promote collection, sharing and use of data, extending their use to meet local, regional and international demands; •Raise the quality of observations, equipment maintenance, automatic quality control, and data management; •Promotion of IT-supported data collection, smooth and user friendly data management, and local manufacturing of weather instruments; •Implementation of data rescue project and upgrade the data management and collecting systems; •IncreaserecruitmentofITpersonnel; •Expansionofthecommercializationofproducts to the shipping industry and other key economic sectors; and •Enhancement of skills of staff through local capacity building and participation in international training programmes.
In the order of importance according to priorities (1 being the most important and 10 being the lowest), BMKG ranked the following areas where global and regional coordinated efforts could enhance the overall contributions in disaster risk reduction activities (based on WMO’s questionnaire):

80
Table 13.1 Ranking of priority areas for global and regional coordinated efforts
i. Advocacy for enhanced visibility of National Meteorological and Hydrological Service’ in the area of disaster risk reduction
Rank 8
ii. Assist members in the development of the national disaster risk reduction plans Rank 4
iii. Cost benefit analysis of hydrometeorological services in disaster risk reduction Rank 3
iv. Provision of technical advice and specifications (e.g. to enhance observing networks, operational infrastructures, relevant products and services for disaster risk reduction applications)
Rank 2
v. Technology transfer, capacity building, technical guidelines and technical trainings (e.g. forecasting tools and methodologies, hazard mapping, and other inputs to risk assessment tools, etc.)
Rank 1
vi. Strengthening strategic partnerships with stakeholders (e.g. disaster risk managers, media, etc.) Rank 6
vii. Strengthening strategic partnerships with other technical organizations and agencies (e.g. meteorology, hydrology, ocean services, etc.)
Rank 5
viii. Education, training and public outreach programs in disaster risk reduction (e.g. targeted at National Meteorological and Hydrological Service and their stakeholders)
Rank 7
ix. Establishment of regional emergency protocols for the National Meteorological and Hydrological Services in support of each other in case of disruption of services due to the impact of a disaster
Rank 9
x. Resource mobilization Rank 10

81
14
Table 14.1 Proposal for stand alone (A) scheme and with regional cooperation (B)
A (US$) B (US$)
International cooperation of experts 100,000 100,000
IT Centre
- IT staff 25,000 25,000
Data management
- Consultation and training 100,000 50,000- Annual maintenance Local area model 100,000 50,000
Capacity Building
Media workshop 30,000 Radar & satellite Training Courses 100,000 80,000Technical writeshop 10,000 IEC around the country 50,000 Climate change 100,000 80,000BS &Post graduate scholarships 200,000
Research and development
- impacts of climate change 100,000 50,000- socio economic impacts 100,000 50,000- national seminar on socio-economic benefits 100,000 50,000- end-user seminar 30,000 30,000Project management
- consultant 200,000 100,000- local project coordinator 100,000 50,000
Total 1,445,000 715,000
PROJECT PROPOSAL
Based on a recent World Bank Report, Indonesia has a high economic risk from natural hazards with 62% of GDP and 67% of the population exposed to various natural hazards. There are about 200-300 disasters that occur in the country annually, killing hundreds of people and taking a considerable toll on the economy. Most often, local and large scale infrastructures are at risk with the yearly occurrence of natural disasters in Indonesia.
This project proposal is developed in order to enhance the capability of the BMKG to address the requirements for preparing and producing the products and delivering the services that will cover the
national needs of key economic sectors that need such products and services. It also takes into consideration the investments from the national government and grants from foreign donors to upgrade the observing network and facilities of BMKG.
The proposal focus mainly on addressing the capacity gaps of the BMKG since the improvement of its equipments and facilities are already covered by ongoing projects.
Table 14.1 shows the capacity building components of the proposal for a) Stand Alone, and b) Regional Cooperation .

82
ANNEX 1People Met During The Mission
The participants in the meeting came from the following organizations/ institutions:1. Directorate General of Crops, Ministry of Agriculture2. Directorate General of Crop Protection, Ministry of Agriculture3. Grain Cultivation Directorate, Ministry of Agriculture4. Agricultural Research and Development Agency, Ministry of Agriculture5. Central Agricultural Land Resources Research and Development, Ministry of Agriculture6. Central Agricultural Land Resources, Ministry of Agriculture7. Research Centre of Agro-climate and Hydrology, Ministry of Agriculture8. Directorate General of Water Resources, Department of Public Works9. Directorate of Irrigation10. Centre of Research and Development for Water Resources11. Central Region Cisadane Ciliwung River, Department of Public Works12. Public Works Services, DKI Jakarta13. Dissemination of Statistics, Central Bureau of Statistics14. Crisis Centre Prop, DKI Jakarta15. Water Resources Research and Development (PUSAIR)16. Crisis Response Centre, Ministry of Health17. Federation of Indonesian Pilots (FPI)18. Indonesian Seafarers Union (KPI)19. Research and Development Transportation Agency, Ministry of Transportation20. Directorate General of Air Transportation, Ministry of Transportation21. Directorate General of Sea Transportation, Ministry of Transportation22. Directorate General of Land Transportation, Ministry of Transportation23. Indonesian National Carriers Association (INACA)24. Port Angkasa Pura I25. Port Angkasa Pura II26. Port ASDP Indonesia Ferry (Persero)27. Tanjung Priok Port Administrator28. Port Marunda, Jakarta29. Indonesia Air Traffic Controller Association (IATCA)30. Data and Information Centre, Ministry of Transportation 31. Data Management Centre and Network Systems, Ministry of Culture and Tourism32. National Disaster Response Agency33. BMKG officials and personnel

83
ANNEX 2References
Rinbo, E., 2009. Cambodia: Mainstreaming Flood and Drought Risk Mitigation in East Mekong Delta, The Expert Group Meeting on Innovative Strategies towards Flood Resilient Cities in Asia-Pacific 21-23 July 2009, Bangkok, Thailand.
Hautala, R., P. Leviakangas, J. Rasanen, R. Oorni, S. Sonninen, P. Vahanne, M. Hekkanen, M. Ohlstrom, S. Saku, B. Tammelin and A. Venalainen. 2008. of Meteorological Services in South Eastern Europe: An Assessment of Potential Benefits in Albania, Bosnia-Herzegovina, FYR Macedonia, Moldova and Montenegro. Technical Research Centre of Finland and FMI Finnish Meteorological Institute, VTT Working Papers 109. p. 63.
Leviakangas, P., R. Hautala, J. Rasanen, R. Oornie, S. Sonninen M. Hekkanen, M. Ohlstrom, A. Venalainen and S. Sakku. 2007. Benefits of Meteorological Services in Croatia. VTT TIEDOTTEITA Research Notes 2420. P. 71.
Jegillos, S. 2011. RIMES Council Meeting, Asian Institute of Technology, Thailand.
Jos Houterman, Mestika Djoeachir, Robiyanto Hendro Susanto, Frank van Steenbergen, During Transition and Reform in Indonesia: Toward an Integrated Perspective on Agricultural Drainage, siteresources.worldbank.org/INTARD/825826-1111412536563/...
Presidential Regulation No.7/2005 on the National Medium Term Development Plan issued on 19 January 2005.
Srivastava, S. 2010. Could ESCAP DRR Regional Advisory Service make a difference? ESCAP/WMO Typhoon Committee Expert Meeting: Urban Flood Risk Management, -20 July 2010, Bangkok, Thailand.
Tammelin, B., 2007. Country Profile: Serbia for the UN/ISDR Project “Strengthening the Hydrometeorological Services in South Eastern Europe.” In Cooperation with Staff of RHMSS. p. 115.
Tammelin, B., 2007. Strengthening the Hydrometeorological Services in South Eastern Europe. WB-UN/ISDR-WMO-FMI. p. 104.
The World Bank (2005). Natural Disaster Hotspots: A Global Risk Analysis. Washington D.C.
Vannareth, S., 2010. International Workshop “Towards the Successful Implementation of WMO Information System in Asia”, Japan Meteorological Agency, 9 - 11 March 2010, Tokyo, Japan.
WMO Country-Level Disaster Prevention and Mitigation Programme Survey, 2006.
WMO, No.-1037, 2008. Regional Association II (Asia), Fourteenth Session.
Zhuang, J., Zhihong, L., Tun, L. and F. De Guzman. 2007. Theory and Practice in the Choice of Social Discount

84
Rate for Cost -benefit Analysis: A Survey. ERD Working Paper No. 94, Asian Development Bank. Manila, Philippines. p. 40.
Internet Sources:COUNTRY PROFILE: INDONESIA, December 2004, http://memory.loc.gov/frd/cs/profiles/Indonesia.pdf
Country Synthesis Report on Urban Air Quality Management, INDONESIA, ADBhttp://www.adb.org/Documents/Reports/Urban-Air-Quality-Management/indonesia.pdf
Encyclopedia of Nations; www.nationsencyclopedia.com › ... › Indonesia
Heru Setiawan, Roadmap toward Effective Flood Hazard Mapping in Indonesia,http://www.icharm.pwri.go.jp/training/2004-pdf/5_heru.pdf
http://www.nationsencyclopedia.com/Asia-and-Oceania/Indonesia-AGRICULTURE.html#ixzz0pxv6XaBx
http://www.mapsofworld.com/indonesia/tourism/transportation.html
http://news.bbc.co.uk/2/hi/asia-pacific/country_profiles/1260544.stm
http://www.adb.org/Water/PDA/INO/Citarum-West-Tarum-water-quality.asp
http://www.adrc.asia/countryreport/IDN/2004/index.html
http://www-pcmdi.llnl.gov/projects/modeldoc/amip/13cnrm_b.html (ARPEGE Model)
http://maritim.bmg.go.id/arpege/arpege.html
Indonesia Agriculture, Information about Agriculture in Indonesia http://www.nationsencyclopedia.com/economies/Asia-and-the-Pacific/Indonesia-AGRICULTURE.html#ixzz0pxsK6RFm
Land use change in Indonesia by Stefano Pagiola
Monitoring and Reporting Progress on Community-Based Disaster Risk Reduction in Indonesia, April 2008, Partnerships for Disaster Reduction-South East Asia Phase 4 http://www.adpc.net/v2007/Programs/CBDRM/INFORMATION%20RESOURCE%20CENTER/CBDRM%20Publications/2008/final_crindonesia_23nov.pdf
Tri W. Hadi1 et al, Prediction of Diurnal Variation over Java Island: A Four-Model Intercomparison presented in The Second International Workshop on Prevention and Mitigation of Meteorological Disasters in Southeast Asia March 2-5, 2009,http://www-mete.kugi.kyoto-u.ac.jp/project/MEXT/pdf/jst2008report.pdf
www.undp.or.id/.../UNDP%20-20The%20Other%20Half%20of%20Climate%20Change%20EN.p

85
ANNEX 3
A systematic Framework for Presentation of the Analysis ofMeteorological and Hydrological Services
A fundamental mission of Meteorological and Hydrological Services and the World Meteorological Organization (WMO) is to contribute to the protection of the lives and livelihoods of people by providing early warnings of meteorological and hydrological hazards and related information to reduce risks. They are crucial support for DRM agencies and EWS stakeholders with regard to disaster prevention and preparedness, mitigation of the impacts of disasters, emergency response, recovery and reconstruction.
The schematic presented in the figure is an illustration of the core aspects of the support that Meteorological Services provide to DRM agencies and EWS stakeholders (e.g., Emergency Preparedness and Response, Agriculture, Health, Infrastructure and Planning, Water Resource Management, Tourisms, Fisheries and Marine, Transportation, etc) . Starting from a user requirements perspective (blue column) the figure illustrates the products and services, core services required to develop these products and services, and the interface between the Meteorological Services and the EWS stakeholders. This interface comprises Public Outreach
Figure 4. Schematic of linkages of Meteorological Services with EWS and DRM stakeholders

86
and Education, Service Delivery as well as Feedback.As identified in many countries of good practice in EWS, feedback mechanisms such as routine or post-event meetings, workshops, training and simulation exercises are crucial to increase bilateral and multi-sectoral understanding and for continual improvement of the service delivery on the Meteorological Service side. Meteorological Services must ensure that the interface between their activities and the EWS stakeholders are operational and efficient. Thus, the goal of the Meteorological Services is to provide and deliver useful, usable and credible products and services such as forecast and warning products or hazard information to meet country or territory needs, especially when an extreme weather-related event occurs.
The set of services and products not only comprises forecasting and warning products but also a wide variety of data products, of hazards information and analysis as well as services of expertise for specific EWS-oriented studies and research, for products design and to support decision-making. For this, it is critical that the Meteorological Service has adequate core capacities for observation, monitoring and operational forecasting. The forecasting system should enable accurate and timely forecasts via access to a wide variety of numerical weather products, monitoring information and integrated guidance systems with up-to-date tools, software and functionalities.
Observation networks are essential in many dimensions in the MHEWS, in real-time hazard monitoring and models verification and adjustment but also for climatological matters and hazard analysis. Thus, Meteorological Services have to manage real-time and historical observation networks with sufficient space and time coverage.
These basics capacities need essential supporting functions and activities such as data management, product development and the relevant information technology (IT) and telecommunication. Data management includes quality controls and also access and exchange at national and regional level. Product development capacities are essential to guarantee the provision of adequate products according to user needs and specifications.
All these activities rely on robust and up to date IT and telecommunication with redundancy and back up procedures for internal aspects as well as for dissemination capacities to DRM agencies, other institutions or general public including the Media.
For an effective management of these activities, overarching capacities such as human resources, training capacities, standard operational procedures (SOPs) or quality management systems (QMS) are essential. Multi-hazard Watch and Warning System is part of these sets of SOPs or QMS and serve as an umbrella for comprehensive warning delivery to DRM agencies, stakeholders and the general public. It frames all the relevant activities from forecasting and warning to dissemination and communication matters.
All of this is possible only with a sufficient number of qualified and trained meteorologists, not only from a forecasting point of view but also for all the supporting activities like computer and network engineering, Web management, maintenance, communication, etc.
The figure above highlights that other technical institutions, especially hydrological institutions, can play an essential role in many areas through direct input on the DRM side and through synergies and collaboration with the Meteorological Services in terms of forecasting, warning and data exchange.