countermeasures against urban flood in beijing - gfdrr.orgsession_5)_yang_fen_wang_jing... ·...
TRANSCRIPT

Countermeasures against
urban flood in Beijing
Fen Yang
Beijing Institute of Water (BIW), China
Urban flood inundation warning and flood
hazard mapping in China
29th May, Korea
Wang Jing
China Institute of Water Resources and Hydropower Research
(IWHR), China

Flood control system in Beijing
Information of Beijing
16400 km2
About 20 million people
2 important reservoirs
5 main rivers
Mountain 61%
Guangting
Reservoir
Miyun Reservoir

Flood control system in Beijing
Centrol Town
The Central Town
1085 km2(7%)
About 12 million
people(60%)
Yongding River in the
west is for flood control
Beiyun River in the east
is for drainage

Flood control system in Beijing
Flood Control Project
Reservoir
total 9.4billion m3, control the
flow generated by 70% mountain
area.
Rivers
425 Rivers with 6400 km long
in the city.
143 Rivers with 2004 km long
in plain, 32% regulated.
40 Rivers with 380 km long in
central town, 72% regulated.
controlled natural

Flood control system in Beijing
3645
5056
113 115
128.9
0
20
40
60
80
100
120
140
1年 2年 3年 5年 20040710 20060731 20110623
小时雨量(mm)
Food Control Project
Rainwater Pipeline
2000 km long covered 95%
area of central town.
most design standard is 36mm
(1year), or 56mm(5year) in
some important place.
Rainwater Pump station
Total 130 pump stations in
the city, most designed suitable
for 2~3 year return period.
Design standard distribution of
pump station in Central Town

Urban flood events
Recent years, urban flood happened suddenly and
frequently because of extreme weather and local sudden
rainstorm, which replaced the past flood most came from
the Yongding River.
Extreme weather events have occurred 41 times since 2004.

“2012.7.21” Flood Event
7.21 Flood Detail
Rainfall
average rain is 170 mm in the
city, which is the maximum
rainfall since 1949(63year).
average rain is 215 mm in
Central Town, which is the
maximum rainfall since
1963(49year).
the rainstorm center is in
Fangshan, 541 mm rainfall is the
maximum recorded rainfall.

Effect of Current Flood Control System
Reservoir & Sluice
The city's large and medium-
sized reservoirs and sluice running
normal, while effectively held
flood, cutting flood peak, increase
water storage.
Chongqing
Reservoir
Dingjiawa
Reservoir
flood diversion and
storage
Safe discharging
Source reduction
monitoring forecast
regulation
Department linkage, social
participation

Effect of Current Flood Control System
River & Embankment
The Yongding river
200year flood control
standard), Chaobai river,
Beiyun river ( 50year flood
control standard) and other
Small and medium-sized
rivers regulation (20year
drainage standard) make
flood through the central
town normally,and ensure
the urban safety.
Beiguan Sluice open for flood discharge in Beiyun River
Chiwei river for flood discharge in Fangshan
flood diversion and
storage
Safe discharging
Source reduction
monitoring forecast
regulation
Department linkage, social
participation

Effect of Current Flood Control System
Stormwater utilization
these structural measures
are useful for increasing
infiltration ,storing water and
reducing downstream pressure.
flood diversion and
storage
Safe discharging
Source reduction
monitoring forecast
regulation
Department linkage, social
participation
Artificial lake
Sand and gravel pit
Small watershed governance
Flood volume and flood peak decreased
by 36% ~ 58%,
Runoff coefficient changed from 0.6~0.7
to 0.3~0.4.

Effect of Current Flood Control System
Monitoring forecast Regulation
According to rain forecast and
upstream real-time monitoring, 5
hours in advance notice of people
evacuated.
flood diversion and
storage
Safe discharging
Source reduction
monitoring forecast
regulation
Department linkage, social
participation
Mountain disaster monitoring and early
warning system broadcast 728 times,
warning of more than 10,000 text
messages, keep contact and well
regulation when public communication
interrupt, make the loss to a minimum.

Effect of Current Flood Control System
Department linkage, social participation
flood diversion and
storage
Safe discharging
Source reduction
monitoring forecast
regulation
Department linkage, social
participation

The Next Focus
Basic Principle
Keep human safety primarily
Overall plan, systemic management
Integrated structural and non-structural measures
coordinate the relation between the near future
and the forward future

The Next Focus
Take 4 years
river governance 1460
km long
Reduce water
accumulation in flyover,
lower elevation etc.
(Low standard, human construction in river etc.)

The Next Focus
flood detention facilities
storage : use Sand and gravel pit, rivers, make sure under 100-
year flood do not flow through the central town.
reduction: in small watershed drainage unit, enforce construction
of lower elevation greenbelt, permeable pavement, provide source
control, slow down flow.
Detention: Use of low-lying land, park green land, as storage to
cut flood peak.
storage
lower
elevation permeable

The Next Focus
Flood simulating
In important rivers and key areas,
figure out flood submerged area ,
depth, duration, etc.
Flood risk grading
Define urban flood risk
management area

The Next Focus
Establish and improve early warning mechanism
build linkage mechanism with television and other media and
communications operators, expand coverage of early warning.
Improve safe work mechanism for flood in key areas
no entry to dangerous mountain road, go around the city roads and
flyovers with water, strengthen security warning in danger zone etc.
Build command platform for flood control
include rainfall and flow monitoring, early warning, emergency
rescue, flood dispatching, flood disaster reporting etc.

The Next Focus
Universal education about flood prevention, risk escape, self-
aid and mutual-aid, disaster mitigation etc.
popular science readings,
lectures, safety drills,
television, radio,
newspapers, network,
phone message, etc.


Urban flood inundation warning and flood
hazard mapping in China
29th May, Korea
Wang Jing
Department of Water Hazard Research
China Institute of Water Resources and Hydropower Research
(IWHR)

Contents
3 Urban Flood Simulation model
1 Urban inundation events in China
2 Characteristics of urban inundation
6 Conclusions
5 Flood hazard mapping in China
4 Urban Flood inundation warning

1 Urban inundation events in China
June 2005, Wuzhou
July 2007, Jinan and Chongqing
August 2008, Shanghai
August 2009, Wenzhou
May 2010, Guangzhou
July 2004, June 2011,
July 2012, Beijing
August 2010, Zhouqu

1 Urban inundation events in China
“2004.07.10” Rainfall in Beijing
Serious inundation on street and
under overpass seriously, traffic tied
up in city

1 Urban inundation events in China
“2012.07.21” Rainfall in Beijing
Serious inundation on street,
highway in low-lying area and
under overpass seriously, traffic tied
up in city

1 Urban inundation events in China
Flood from Xijiang River affected Wuzhou city
on 22nd June,2005
Inundation hazard from outside flood

Heavy rain in Jinan on 18th July, 2007
flood spreading along streets , inundation under railway overpass
and inundation in underground square
1 Urban inundation events in China

Streets were changed to rivers
1 Urban inundation events in China
Heavy rain in Chongqing on 17th July, 2007
Mountain city

1 Urban inundation events in China
Typhoon Morakot in August, 2009

1 Urban inundation events in China
The death toll was 1463, and 302 missing
Flash flood and debris flow in Zhouqu county
in August, 2010

2 Characteristics of urban inundation disaster
The types of disasters which would cause urban inundation are multiple
1
Including heavy rainfall, outside flood, typhoon, flash flood, debris flow, and so
on
Many new features of urban inundation appear as the rapid development of cities
2
Such as: inundation under road overpass and railway overpass is serious
flood spreading along the street
flood flows into underground space
flood hazard of urban area in the lower reaches increases as
the flood control standard improved in the upper reaches.

2 Characteristics of urban inundation disaster
Secondary disasters are severe 5
Urban flood and waterlogging disasters would affect the lifeline system of a
city seriously, such as traffic, water supply, power supply and gas supply, etc.
The statistical flood and waterlogging disaster loss data of cities in Zhejiang
province in 1998 and 1999 shows that the waterlogging loss occupies about
40% of total loss.
For some cities, the waterlogging loss is severe 3
The main reason for death in mountain cities are flash flood and debris flow
4
In 1991, 1293 persons died caused by flash flood and debris flow in
Yunnan and Sichuan province ;
In 1997, 1680 persons died caused by flash flood and debris flow in China;
In 2004, the flash flood and debris flow caused by Rainne typhoon leaded
to 44 persons died which is 24.2% of total death toll.

3 Simulation technology: Urban
Flood Simulation model

Can’t reflect the spatial distribution and change process of
hydraulic factors for everywhere, such as flood depth,
velocity and inundation duration, etc.
Hard to reflect the function of flood control projects, such as
pumps, gates, drainage system
Flood simulation methods
Hydrological
model
Hydraulic
model
Digital terrain analysis
method based on GIS
technology
The basic principle is that water moves from high to
low. The simulation result can only reflect the eventual
state instead of the real movement process of flood.
Dimension description Available software
1D Solution of the one-dimensional
St Venant equations Infoworks RS(ISIS), Mike 11, HEC-RAS
1D+
1D plus a flood storage cell
approach to the simulation of
floodplain flow
Infoworks RS(ISIS), Mike 11, HEC-RAS
2D-
2D minus the law of
conservation of momentum for
the floodplain flow
LISFLOOD-FP
2D Solution of the two-dimensional
shallow wave equations
TUFLOW, MIKE21, TELEMAC
Urban flood numerical simulation model (UFSM)
developed by IWHR
2D+ 2D plus a solution for vertical
velocities using continuity only TELEMAC 3D
3D CFX, FLUENT, PHEONIX
3 Urban flood simulation model
Urban flood numerical simulation model (UFSM)
developed by IWHR

Urban flood numerical simulation model
(UFSM)——basic principle
The study area is dispersed by unstructured
irregular meshes
h M Nq
t x y
2 2 2
1/3
( ) ( )0
N uN vN Z n v u vgh g
t x y y h
Continuity
equation:
Momentum
equation:
2 2 2
1/3
( ) ( )0
M uM vM Z n u u vgh g
t x y x h
Basic
equations
×
×
× ×
× ×
× ×
× ×
× × Water level is calculated on the centroid of mesh
Flow is calculated on the passages of mesh
Finite volume method is used to solve the equations
3 Urban flood simulation model

Terrain
Building
Dikes
Rivers
Gates
Pumps
Drainage system
Underground space
3 Urban flood simulation model

Rainfall
River flood
Storm surge
Dike break
Combinations
3 Urban flood simulation model

Rainfall
3 Urban flood simulation model

Combination of
rainfall and storm surge
3 Urban flood simulation model

The different running way of the UFSM
3 Urban flood simulation model
Running ways of the model
Before disaster During disaster After disaster
Real-time
calculation
Forecasting
calculation Design scheme
calculation
Testing &adjusting
calculation +

4 Urban flood inundation warning
Urban area of Foshan city: 79.7km2
1km˟1km
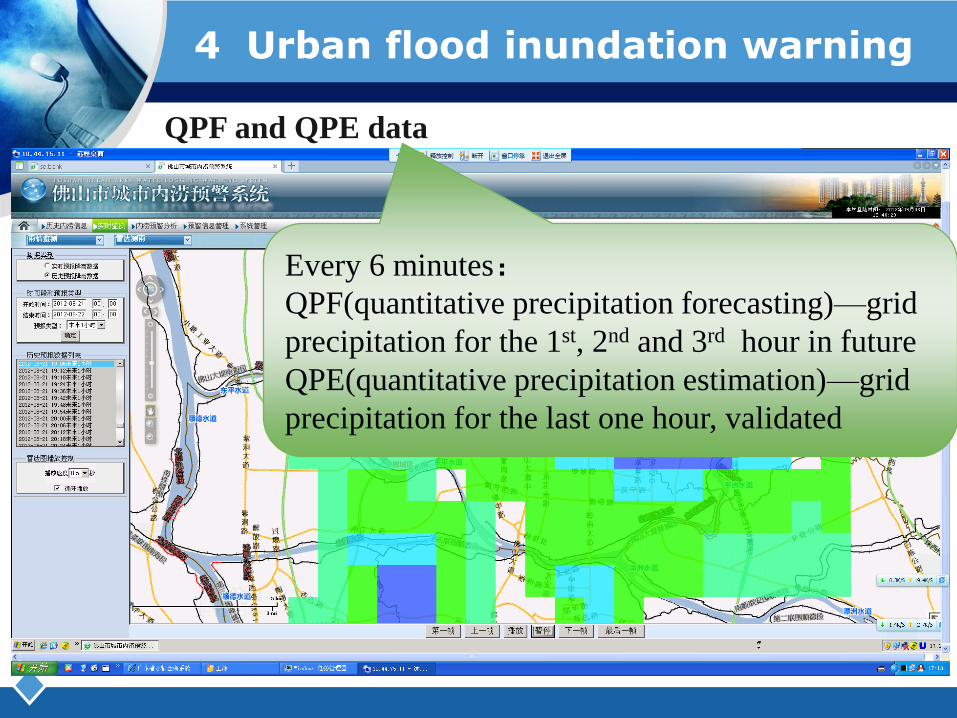
4 Urban flood inundation warning
QPF and QPE data
Every 6 minutes:
QPF(quantitative precipitation forecasting)—grid
precipitation for the 1st, 2nd and 3rd hour in future
QPE(quantitative precipitation estimation)—grid
precipitation for the last one hour, validated

4 Urban flood inundation warning

4 Urban flood inundation warning
Blue:0.15~0.30m
Yellow:0.30~0.50m
Orange:0.50~1.00m
Red:>1.00m

5 Flood hazard mapping
Practices of flood hazard mapping in China
Flood mapping research started in 1986
Practices of flood hazard mapping in 1997
From 2003 to 2008: compile guidelines, pilot projects (36)
New stage of flood hazard mapping from 2008 (21million RMB)
project of 1st phase national flood hazard mapping commenced
New stage of flood hazard mapping from 2011 (81million RMB)
project of 2nd phase national flood hazard mapping commenced

4 Flood hazard mapping
Achievements Details
1. Report on flood hazard mapping in
China and abroad
2. Establish standards and
regulations for flood hazard mapping
Guidelines
Technical Rules
Administrative Regulation
Cost
3. Technical platform and template
Flood analysis system
Flood disaster impacts and loss
assessment system
Flood hazard mapping system
Flood risk map management
system

Achievements Details
4. 20 pilot areas
9 flood protection areas
6 flood detention areas
1 flooded area
2 cities (shanghai)
2 Reservoirs
5. Technical training course Three times
4 Flood hazard mapping

4 Flood hazard mapping
Practices of flood hazard mapping in China
Flood mapping research started in 1986
Practices of flood hazard mapping in 1997
From 2003 to 2008: compile guidelines, pilot projects (36)
New stage of flood hazard mapping from 2008 (21million RMB)
project of 1st phase national flood hazard mapping commenced
New stage of flood hazard mapping from 2011 (81million RMB)
project of 2nd phase national flood hazard mapping commenced

4 Flood hazard mapping
Tasks
1. Revise the standards and regulations for flood hazard mapping
2. Improve the technical platforms
3. Flood risk analysis technology development for mountain area and pilot
study
4. Flood risk analysis technology development for storm surge and pilot
study
5. Real–time flood risk analysis and flood hazard mapping study
6. Flood insurance system scheme study and pilot study
7. Flood hazard mapping in pilot areas
8. Pilot study on application of flood hazard maps
9. Development of flood hazard map management and application platform

4 Flood hazard mapping
The purpose of flood hazard mapping in China
In China, we hope flood hazard maps can be used in many fields
Serve for the flood
control and flood
fighting decision-
making at all
levels of FCH
Enhance the
consciousness of
flood hazard
mitigation of the
nation
Direct the
constructions of the
safety facilities for
the flood detention
areas, and to chose
reasonable way
and place for
evacuating people
in emergency Offer basic data
for assessing
flood losses, and
so on
Provide support for
working out flood
control planning,
drainage planning
Provide support
for working out
Flood defense
emergency plan

Historical rainfall Design rainfall

Dike break Inundation distribution on roads

Sea wall overflow
Sea wall break
Combination of
rainfall and Sea wall
break

4 Flood hazard mapping
Flood hazard mapping in urban area in China
661 cities
4 municipalities
283 prefecture-level cities
374 county-level cities

5 Conclusions
The urban type flood disasters are very serious in China. As
Cities of China are in a stage of rapid development, the urban areas
will expand continually. In future, the flood disaster risk will rise and
the types will be multiple.
In order to reduce the flood risk in urban area, flood simulation
technology is an important non-structural measures which can
provide support to flood hazard mapping, flood prevention warning
and decision-making. In fact, this technology have been applied in
many cities in China.
The urban inundation can not be avoided completely. But we
need to try our best to decrease the losses not only by improving
and reconstructing our drainage system, but also considering the
storage, detention, infiltration and utilization of rain water in process
of infrastructure construction.
