counselors or craigslist? relationships between housing search resources and voucher holders’...
TRANSCRIPT

Counselors or : How Housing Search Resources Impact HCV Neighborhood Outcomes
Michael D. Webb, William M. Rohe, and Kirstin P. FrescolnCenter for Urban and Regional Studies, UNC-Chapel [email protected]


Housing Search
Utility maximization
• Neoclassical econ
• Search is a fn of personal preferences and housing supply
• Entire metro falls within the choice set
Awareness space
• Subset of a mental map
• Housing search is biased and limited within AS
• …Often around anchor nodes
• Search often in 2-5 neighborhoods
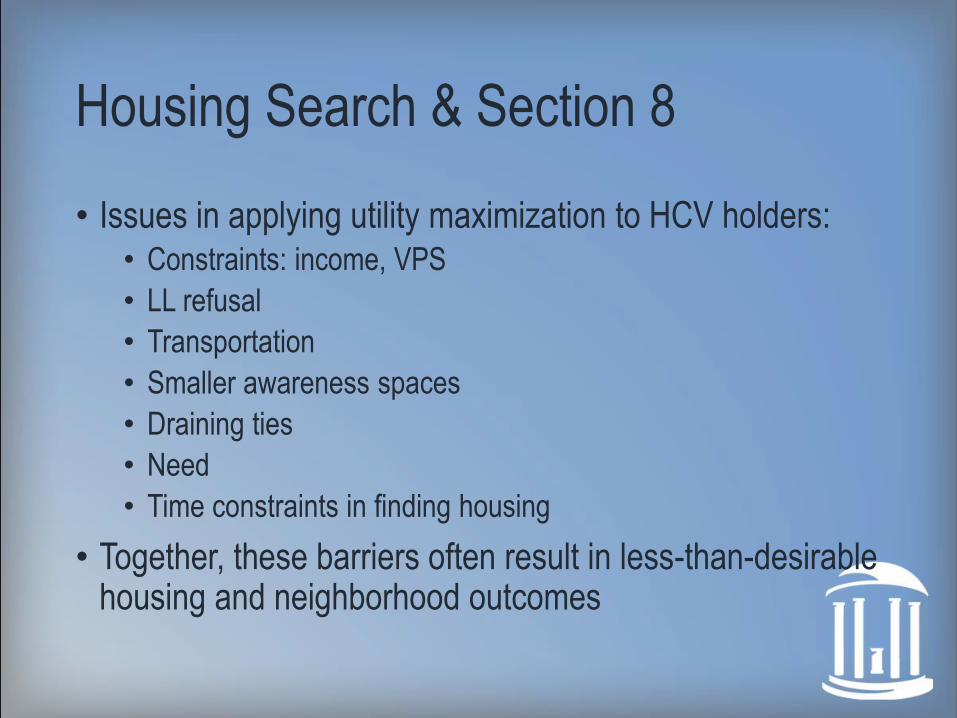
Housing Search & Section 8
• Issues in applying utility maximization to HCV holders:• Constraints: income, VPS
• LL refusal
• Transportation
• Smaller awareness spaces
• Draining ties
• Need
• Time constraints in finding housing
• Together, these barriers often result in less-than-desirable housing and neighborhood outcomes

HCV search strategies
Counseling
• Longstanding HCV deconcentration goal
• Counseling: understand benefits of opportunity NBs, find listings
• Range of outcomes (see following)
Web searches
• Users search within a confined band
• Little spatial mismatch: a priori limitations
• Searchers still limit themselves to <5 areas
• Popular: craigslist, GoSection8, SocialServe.com

HCV Counseling Outcomes
• Knowledge primarily from large, unique projects (HOPE VI, MTO, Chicago/Atlanta)
• Gautreaux: strong counseling + motivated tenants = good outcomes
• MTO: many housing searches failed; issues finding subsequent housing w/o counseling
• Chicago PFT: no obvious relationship between resources and success of search
• HOPE VI: HCV holders fared better than public housing relocatees, but worse than others in poverty

Research Questions & Hypotheses
• What types of households were more likely to utilize particular resources?
• Do particular housing search resources achieve greater subjective and/or objective housing outcomes?
• Counseling will have greaterawareness spaces, and more knowledge of opportunity areas
• Online resources will have greater awareness spaces, but less knowledge of opportunity areas
• Since information is priceless, those utilizing more resources will have better outcomes

Search resources
Counseling Online Friends/Family Driving
around
Cost
Potentially high:
transportation,
time
Minimal,
assuming
internet access
MinimalMore than
minimal
VolumeLimited but
high-qualityHigh
Limited, quality
varies
Varies
depending on
effort
Primary
limitationTime-intensive Internet access
Potentially v
biasedVehicle access
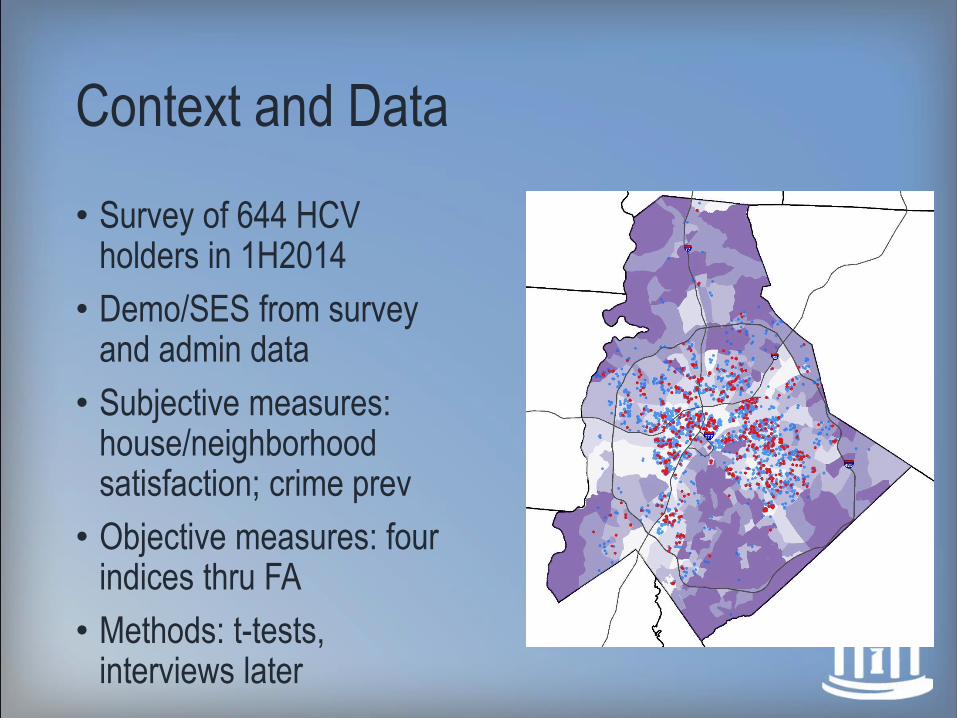
Context and Data
• Survey of 644 HCV holders in 1H2014
• Demo/SES from survey and admin data
• Subjective measures: house/neighborhood satisfaction; crime prev
• Objective measures: four indices thru FA
• Methods: t-tests, interviews later

Descriptive Statistics
63%
49%43%
39%
0
200
400
38
201
218
144
42
Zero One Two Three Four

School index: elementary, middle, high
school proficiency; dropout and truancy
rates
Access index: proximity to groceries,
clinics, pharmacies; transit access
Dot colors:
Both
Counseling only
Online only
Neither

Advantage index: household income,
house value, homeownership, food
stamps
Safety index: violent crime, property
crime, fire calls
Dot colors:
Both
Counseling only
Online only
Neither

Which households were more likely to utilize counseling?
Measure Ov
era
ll
Co
un
se
l-
ing
On
lin
e
Fri
en
ds
/
Fa
mily
Dri
ve
Aro
un
d
Age 49.4 48.9 48.9 50.1 49.3
If Elderly 15% 16% 14% 17% 14%
If HOH disabled 38% 40% 36% 34% 36%
If other disabled 6% 5% 7% 5% 6%
Household size 2.4 2.4 2.5 2.5 2.4
Total income $10,389 $10,213 $10,841 $10,496 $10,538
Wage income $4,469 $4,539 $4,626 $4,489 $4,629
Rent paid $143 $142 $154 $143 $149
If working 30% 31% 31% 31% 31%
Education 11.78 11.54 12.09 11.74 11.91
Years with voucher 15.77 18.01 15.86 17.37 19.40
Apartments visited 6.27 6.23 5.86 6.39 6.14
Vehicle ownership 52% 50% 61% 49% 55%Re
so
ur
ce
sS
ES
De
mo

What search resources resulted in better housing outcomes?
Measure Ov
era
ll
Co
un
se
lin
g
On
lin
e
Fri
en
ds
/
Fa
mily
Dri
ve
Aro
un
d
Home Satisfaction 46% 45% 49% 48% 48%
NB Satisfaction 41% 41% 42% 42% 41%
Perception of crime 0.16 0.17 0.16 0.16 0.16
Advantage -0.91 -0.94 -0.84 -0.89 -0.89
Safety -0.33 -0.37 -0.26 -0.29 -0.34
Schools -0.88 -0.91 -0.81 -0.85 -0.89
Access 0.21 0.23 0.17 0.16 0.19
Total Quality -1.90 -1.98 -1.75 -1.88 -1.92
Ob
jS
ub
j

Online Resource & Neighborhood Outcomes
Measure Alo
ne
On
lin
e
Dri
vin
g
Fri
en
ds
Alo
ne
Dri
vin
g
Fri
en
ds
Home Satisfaction 46% 45% 46% 45% 44% 49% 52% 52% 54%
NB Satisfaction 41% 41% 38% 38% 45% 42% 44% 45% 47%
Perception of crime 0.16 0.17 0.17 0.16 0.18 0.16 0.16 0.15 0.15
Advantage -0.91 -0.94 -0.89 -0.92 -0.90 -0.84 -0.80 -0.82 -0.80
Safety -0.33 -0.37 -0.30 -0.43 -0.33 -0.26 -0.28 -0.27 -0.31
Schools -0.88 -0.91 -0.84 -0.92 -0.86 -0.81 -0.81 -0.81 -0.82
Access 0.21 0.23 0.21 0.27 0.16 0.17 0.16 0.14 0.15
Total Quality -1.90 -1.98 -1.82 -2.00 -1.93 -1.75 -1.72 -1.76 -1.78
All 4
Counseling with …
Ov
era
ll
Online with …
Su
bj
Ob
j

Findings
• Those who used online resources fared better objectively (c.p.)
• No many sig difference between satisfaction and resource used
• But … most people satisfied
• No value added through multiple resources
• Possible contaminating factors?

Policy Implications and Future Research
Policy implications
• Apparent benefit of online resources
• Aids argument for wifi in developments
• Lack of benefit of counseling … why?
• Are services oriented toward finding a place, or finding a good place
Future research
• Interview voucher holders• Which websites work best
• Why do people seek counseling?
• What, if any, impact of counseling
• Interviews with counselors and landlords
• Acquire search data from Section 8 websites
