council of brussels, 7 november 2011 the european union
TRANSCRIPT

16473/11 ADD 1 UH/cs 1DG G 1 EN
COUNCIL OFTHE EUROPEAN UNION
Brussels, 7 November 2011
16473/11ADD 1
FSTR 68SOC 957REGIO 114FC 51
COVER NOTEfrom: Secretary-General of the European Commission,
signed by Mr Jordi AYET PUIGARNAU, Directordate of receipt: 31 October 2011to: Mr Uwe CORSEPIUS, Secretary-General of the Council of the European
UnionNo Cion doc.: SEC(2011) 1308 finalSubject: COMMISSION STAFF WORKING PAPER
Accompanying document to:REPORT FROM THE COMMISSION22nd Annual Report on Implementation of the Structural Funds (2010)
Delegations will find attached Commission document SEC(2011) 1308 final.
________________________
Encl.: SEC(2011) 1308 final

EN EN
EUROPEAN COMMISSION
Brussels, 31.10.2011SEC(2011) 1308 final
COMMISSION STAFF WORKING PAPER
Accompanying the
22ND ANNUAL REPORT ON IMPLEMENTATION OF THE STRUCTURAL FUNDS (2010)
{COM(2011) 693 final}

EN 1 EN
Part 1: General analysis of activities
1. INTRODUCTION
As required by Article 45(2) of Council Regulation (EC) No 1260/1999, this report sets out to give an overview of the implementation of the Structural Funds (2000-2006) in 2010.
2010 was the eleventh year in which Structural Funds programmes and projects for the 2000-2006 programming period were implemented. Altogether 226 Objective 1 and Objective 2, 47 Objective 3, 12 Financial Instrument for Fisheries Guidance (FIFG) (outside Objective 1), 81 INTERREG, 71 URBAN, 27 EQUAL, 73 LEADER+ and 181 Innovative Action programmes were managed in 2010.
Even though no further commitments could be made in 2010, sums were disbursed in respect of 2000-2006 Structural Funds assistance. Implementation of the 2010 budget was excellent. In terms of payment appropriations, 100.0 % of the European Regional Development Fund (ERDF) , 97.0% of the European Social Fund (ESF), 30.7% of the European Agricultural Guidance and Guarantee Fund (EAGGF)-Guidance budget available at the end of 2010 (after a reduction of EUR 13.9 million — see section 2.1.3 below) and 100.0% of FIFG resources were used (compared to 100.0% ERDF, 97.0% ESF, 97.9% EAGGF and 69.5% FIFG in 2009).
The low budget execution of EAGGF-Guidance in 2010 was due to the fact that 112 out of a total of 152 programmes had already reached the 95 % ceiling for interim payments at the beginning of the year. In these cases, no further payments were possible in 2010 until closure (see section 2.1.3 below). The Commission proposed in September 2010 the transfer of another EUR 345.4 million of payment appropriations, but this transfer was ultimately not accomplished.
In 2010, the closure process started for most 2000-2006 ERDF operational programmes. Most of the related closure documents were submitted by Member States in September 2010. The general framework for the closure of 2000-2006 Structural Funds assistance was set out in Commission Decision C(2006)3424 in 2006, amended by Commission Decisions C(2008)1362 and C(2009)960.
In view of the financial crisis and the recovery package proposed by the Commission, an extension of six (or twelve) months has been granted on a programme-by-programme basis for those Member States which opted for it. This flexibility allowed Member States and regions to maximise the absorption of the allocated funds by addressing unexpected programme implementation challenges and, consequently, achieve the objectives of the programmes.
For those programmes that an extension of the eligibility period was granted, the deadline for the submission of the closure documents was also extended to September 2010. Some Greek and Cross-border programmes were granted a 12-month extension. Their closures documents will have to be submitted to the Commission by end of March 2011

EN 2 EN
The Commission has 5 months to asses the Final Report and the winding up declaration and once declared acceptable it can proceed to make the final payment. The closure of operational programmes is an important and time-consuming process involving audit and operational units of DG Regional Policy, to assess the quality of the results delivered by programmes and to check the legality and regularity of final expenditure declared to the Commission for reimbursement (final clearance of all payments made).
The ERDF 2000-2006 closure task force, set up in autumn 2009, closely monitored the process. As of 31 December 2010, a proposal for closure was sent to Member States for 25 programmes. The closure of the remaining 354 is a work in progress and it is expected that the majority of these programmes will be closed within 2011.
As regards the 2000-2006 Regional Innovative Actions Programmes, 24 were closed in 2010 bringing the total number of programmes closed so far to 176. Only 5 programmes remain to be closed (2 in France, 2 in Portugal and 1 in Italy) out of a total of 181 programmes adopted
Concerning Cohesion Fund projects, some 348 projects out of a total of 1143 projects were closed by the end of 2010. The closure process will intensify in 2011-2012 since the deadline for expenditure on the ground was 31 December 2010. In the light of financial crisis, the Commission decided in April 2110 to give the possibility to a limited number of projects to extend their eligibility in 2011 or 2012.
For the projects still open, the financial implementations generally improved throughout 2010. The incidence of high risk projects (projects with a serious possibility of not being completed within the currently valid eligibility deadline) was concentrated in a relatively small number of countries. Similar to 2009, high risk projects continued to be mainly in the environment sector (16% of high risk projects for environment compared to an average of 13% of all projects).
In addition to the implementation of 2000-2006 Structural Funds programmes and projects and preparation for their closure, in 2010 the Commission was also heavily involved in implementing 434 programmes (317 ERDF, 117 ESF)1 for the 2007-2013 period.
In 2010, the Commission completed the ex post evaluation of ERDF interventions in objective 1 and 2 regions. The synthesis report of the all work was published and presented to the public in April 20102. The ex post evaluations of the ESF and EQUAL were completed in 2010, and their results presented to the Member States.The European Agricultural Guidance and Guarantee Fund (EAGGF) Guidance Section and LEADER+ are evaluated separately. In 2010 the ex post evaluation of LEADER+ was completed and the ex-post evaluation of 2000-2006 rural development programmes was launched. As for the Financial Instrument for
1 See Communication on the results of negotiations on strategies and programmes for the programming
period 2007-2013.2 published on: http://ec.europa.eu/regional_policy/sources/docgener/evaluation/expost_reaction_en.htm.

EN 3 EN
Fisheries Guidance (FIFG), the ex post evaluation was undertaken in 2009 and is available on the website3.
Sharing of experience was promoted, notably through interregional and urban networks and the conference "Regions for Economic Change: building sustainable growth" on 20th and 21st May with 755 participants from all 27 countries. At this occasion, three papers were drafted on: i) Good practice in the use of ICT, ii) Good practice in promoting energy efficiency and iii) Good practice in managing Brownfield sites and buildings. Also, RegioStars awards were granted for the third time to good practice innovation projects from the periods 2000-2006 and 2007-2013 in different categories: ICT (Applications for e-inclusion & for SMEs, Broadband coverage in less developed regions of rural areas) – CityStars (Innovative use of brownfield sites in an urban context & Integration of migrants or marginalised groups in urban areas).
The 8th edition of OPEN DAYS ‘European week of regions and cities’ took place 4-7 October 2010 and brought together 5,900 local, regional, national and European decision makers and experts in the field of regional and local development (including 330 journalists). In addition to this 263 local events were organised in 33 countries. The OPEN DAYS, organised jointly by the Commission and the Committee of the Regions, is an arena for cooperation and networking, for sharing knowledge and experience, and offers regions and cities a possibility to showcase their achievements. It also offers the ideal opportunity to highlight the synergies between cohesion policy and other EU policies.
The Belgian presidency organised a two-day conference (18 and 19 November 2010)on "The role of the ESF in the fight against poverty and social exclusion". Work sessions were organised over two half days. The conclusions, among others, highlighted the role of the ESF as a policy instrument in the fight against poverty and social exclusion. The focus of the ESF on the development of competences with a special attention to those furthest away from the labour market was also underlined as well as the need for the ESF to continue to pay attention to gender equality and equal opportunities as transversal points of attention.
2. ANALYSIS OF IMPLEMENTATION
2.1. Budget Implementation
2.1.1. ERDF
In spite of the financial downturn, 2010 was an excellent year in terms of budgetary execution. The overall absorption rate reached 100.0% or EUR 1,694 million reimbursed to operational programmes.
While the execution under Objective 2 was higher than initially voted (EUR 230 million instead of EUR 104 million), payments to Objective 1 and Interreg programmes were lower than originally foreseen (for Objective 1, EUR 1,348 million instead of EUR 2,077 million and for Interreg EUR 90 million instead of
3 Published on: http://ec.europa.eu/fisheries/documentation/studies/fifg_evaluation/index_en.htm

EN 4 EN
EUR 202 million), mainly due to a transfer of appropriations during the global transfer to reinforce the 2007-2013 appropriations.
In total for other programmes (Urban, Innovative actions), EUR 25 millions were paid.
DG REGIO is managing previous and current programming periods in parallel. After a slow start-up of the 2007-2013 programmes, payment claims have been accelerating during 2010. This trend combined with the fact that most 2000-2006 programmes had reached the 95% ceiling for interim payments led to a transfer of appropriations from the 2000-2006 period to the 2007-2013 period. This allowed for the 100.0% execution of payment appropriations for ERDF programmes financed under both programming periods.
Closures
In 2010, the closure process started for most 2000-2006 ERDF operationalprogrammes. The bulk of the related closure documents were submitted by Member States in September 2010. This was due to the extension of six months granted by the Commission for the final date of eligibility of expenditure. Some Greek and Cross-border programmes were granted a 12-month extension. Their closures documents will have to be submitted to the Commission by end of March 2011.
Out of 379 programmes, 281 (or 74%) representing 90% of ERDF funds have chosen to extend their eligibility dates. As at 31 December 2010, closures documents were received for 356 programmes. The responsible units are currently analysing the Winding-up Declarations and Final reports.
A proposal for closure had been sent to Member States for 25 programmes while the remaining 354 will be closed during 2011 and 2012.
Programmes closed at end 2010: Objective / Initiative
Country File Reference File title Amount paid
Interreg CB 2000CB160PC020 Karelia 376,306.86CB 2000CB160PC001 PIC Interreg III 77,658.23CB 2000CB160PC002 PIC Interreg III 214,931.63CB 2000RG160PC020 Alpine Space 716,562.38CB 2000RG160PC019 Wallonie-Lorraine-Lux 344,477.01CB 2001RG160PC013 ESPON 2006 20,042.19CB 2000RG160PC016 IT-AT 1,739,158.10
Objective 1 DE 2000DE161PO001 PO obj. 1 Transport 83,050,000.00Objective 2 AT 2000AT162DO007 DOCUP obj. 2 Tirol 2,332,700.00
AT 2000AT162DO004 DOCUP obj. 2 Salzburg 926,650.00AT 2000AT162DO002 DOCUP obj. 2
Niederösterrreich9,248,350.00
AT 2000AT162DO001 DOCUP obj. 2 Kärnten 4,249,550.00AT 2000AT162DO005 DOCUP obj. 2
Vorarlberg861,378.51
SE 2000SE162DO001 DOCUP obj. 2 Öarna 335,379.85GB 2000GB162DO001 Gibraltar 437,180.00
Urban IT 2001IT160PC010 Torino-Italy 544,647.45

EN 5 EN
DE 2000DE160PC107 Leipzig 210,190.72DE 2000DE160PC108 Luckenwalde 711,206.41DE 2000DE160PC103 Dortmund 163,066.31DE 2000DE160PC100 Berlin 755,987.60IT 2001IT160PC001 Carrara-Italy 448,855.90DE 2000DE160PC106 Kiel 387,156.69FR 2000FR160PC007 Strasbourg 14,946.99FR 2000FR160PC006 Le Havre 538,488.29DE 2000DE160PC102 Dessau 755,987.60
TOTAL 25 109,460,858.72
As regards the Regional Programmes of Innovative Actions, 24 were closed in 2010 bringing the total number of programmes closed so far to 176. Therefore, only 5 programmes remain to be closed (2 in France, 2 in Portugal and 1 in Italy) out of a total of 181 programmes adopted.
For the entire 2000-2006 period, EUR 123,339 million have been paid to Member States as of 31 December 2010. This represents an average absorption rate for all Member States of 95.2% of the EUR 129,600 million overall allocation. Most of the remaining payments concern payments of balances for the closure of programmes.
RAL
At the end of 2010, commitments from previous years on which payments were still to be made (RAL) amounted to EUR 6,751 million for ERDF compared with EUR 8,400 million at end 2009. This represents 5.2% of the total amount committed for ERDF. A further decrease of the RAL is foreseen with the payment of final balances in the coming years. ‘n+2’ rule
In 2010, as in the previous year, the so-called ‘n+2’ rule did not apply. As a general rule, the last commitment tranche (i.e. 2006) will be used to execute final payments once the closure of the programme is agreed between the Member State and the Commission. Accordingly, the amount to be decommitted will only be calculated at the closure stage of the operational programme4.
2.1.2. ESF
Budget Implementation
For the 2000-2006 programming period, the payment credits consumption during 2010 reached EUR 318 million. This corresponds to 26, 42 % of the annual payment credits allocation.
This is due to the fact that the closure exercise for 2000-2006 programmes has begun and the first submission deadline for closure documents was March-2010. Interim payments have been therefore processed for the programmes that did not reach the 95% treshold before closure then interim payments execution was rather limited.
4 Article 105(3) of Regulation (EC) No 1083/2006.
EN 6 EN
The under-execution is due to the low consumption of the OPs from 2000-2006 period. It amounts to EUR 882 million (or 73, 58 % of 2010 payment appropriation), of which EUR 259 million concern C1 payment appropriations and EUR 623 million C2 payments appropriations carried forward from 2009.. The suspended/interrupted payments, following the audit results, for 21 out of 38 programmes put into reserve (AAR 2009) remained blocked and, in those cases, the financial suspension/correction procedure is foreseen to be merged with the final payments processed in the context of 2000-2006 closure.
The total outstanding commitments (RAL) at the end of 2010 stood at EUR 3 002 million (compared to EUR 4 700 million in 2009). This represents 4, 38% of total commitments for the period 2000-2006. The RAL has been consumed by interim payments, a few final payments and an automatic de-commitment of the unused RAL has been processed for an amount of EUR 1,461 million under closure exercise.
In 2010, as in the previous year, the so-called ‘n+2’ rule did not apply and the concerned RAL has been decreased by de-committments for the programming period 2000-2006 at the closure of the operational programmes according to the provisions set in the Article 105(3) of Regulation (EC) No 1083/2006.
For the whole period, at the end of 2010 EUR 64 118 million have been paid to Member States. This represents an absorption rate for all Member States of 93, 47% of the EUR 68 600 million overall allocation.
Closure
There are 239 ESF operational programmes to be closed within the 2000-2006 programming period.
According to the regulation, payments for the 2000-2006 period could continue until the end of 2008. However, in view of the financial crisis and the recovery package proposed by the Commission, an extension of six (or twelve) months was granted on a programme-by-programme basis for the Member States which opted for it. Out of 91 programmes where the Directorate-General for Employment, Social Affairs and Equal Opportunities is ‘Chef de file’, 68 chose to extend their eligibility dates.
The Commission has allowed the Member States to request extension of the programmes up to 30 June 2009 following the financial and economic crisis as long as the request was substantiated and sent to the Commission before 31/12/2008.
In the event that the deadline for eligibility of expenditure wa extended, the deadline for submission of the closure documents was extended accordingly.
Therefore the following submission deadlines have become effective: 31/03/2010, 21/07/2010, 30/09/2010, 31/03/2011 and 30/09/2011under regulation in force.
All submitted closure documents have been received in due time as per the following Table 1.
In total for 229 programmes under closure in 2010 all closure documents have been submitted in the required deadline.

EN 7 EN
Table 1: Number of programmes to be submitted under submission deadlines and and closure progress of ESF programmes for 2000-2006 programming period
For 10 programmes from submission deadline 31/03/2010 a total closure has been completed and accepted by the Member States. This represents: 7 payments, 1 balance 0 and 2 recoveries, see following Table 2.
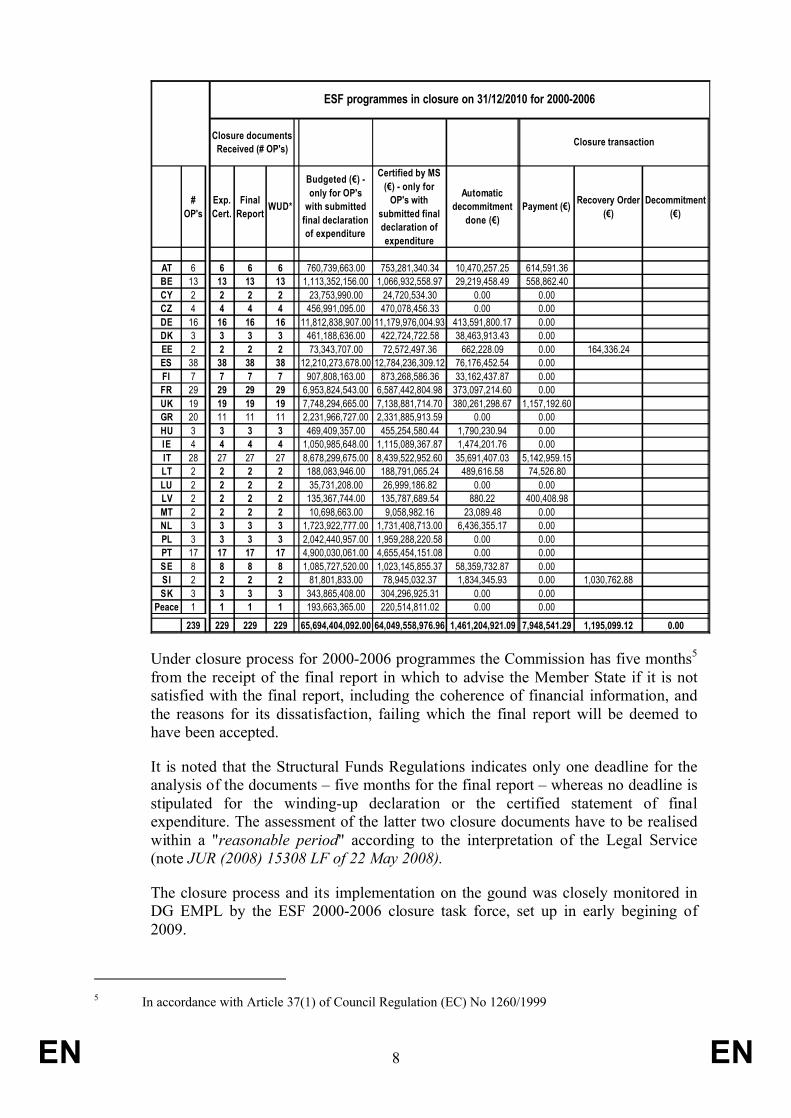
Table 2: Closure progress of ESF programmes for 2000-2006 programming period
EN 8 EN
# OP's
Exp. Cert.
Final Report WUD*
Budgeted (€) - only for OP's
with submitted final declaration of expenditure
Certified by MS (€) - only for
OP's with submitted final declaration of expenditure
Automatic decommitment
done (€)Payment (€) Recovery Order
(€)Decommitment
(€)
AT 6 6 6 6 760,739,663.00 753,281,340.34 10,470,257.25 614,591.36BE 13 13 13 13 1,113,352,156.00 1,066,932,558.97 29,219,458.49 558,862.40CY 2 2 2 2 23,753,990.00 24,720,534.30 0.00 0.00CZ 4 4 4 4 456,991,095.00 470,078,456.33 0.00 0.00DE 16 16 16 16 11,812,838,907.00 11,179,976,004.93 413,591,800.17 0.00DK 3 3 3 3 461,188,636.00 422,724,722.58 38,463,913.43 0.00EE 2 2 2 2 73,343,707.00 72,572,497.36 662,228.09 0.00 164,336.24ES 38 38 38 38 12,210,273,678.00 12,784,236,309.12 76,176,452.54 0.00FI 7 7 7 7 907,808,163.00 873,268,586.36 33,162,437.87 0.00FR 29 29 29 29 6,953,824,543.00 6,587,442,804.98 373,097,214.60 0.00UK 19 19 19 19 7,748,294,665.00 7,138,881,714.70 380,261,298.67 1,157,192.60GR 20 11 11 11 2,231,966,727.00 2,331,885,913.59 0.00 0.00HU 3 3 3 3 469,409,357.00 455,254,580.44 1,790,230.94 0.00IE 4 4 4 4 1,050,985,648.00 1,115,089,367.87 1,474,201.76 0.00IT 28 27 27 27 8,678,299,675.00 8,439,522,952.60 35,691,407.03 5,142,959.15LT 2 2 2 2 188,083,946.00 188,791,065.24 489,616.58 74,526.80LU 2 2 2 2 35,731,208.00 26,999,186.82 0.00 0.00LV 2 2 2 2 135,367,744.00 135,787,689.54 880.22 400,408.98MT 2 2 2 2 10,698,663.00 9,058,982.16 23,089.48 0.00NL 3 3 3 3 1,723,922,777.00 1,731,408,713.00 6,436,355.17 0.00PL 3 3 3 3 2,042,440,957.00 1,959,288,220.58 0.00 0.00PT 17 17 17 17 4,900,030,061.00 4,655,454,151.08 0.00 0.00SE 8 8 8 8 1,085,727,520.00 1,023,145,855.37 58,359,732.87 0.00SI 2 2 2 2 81,801,833.00 78,945,032.37 1,834,345.93 0.00 1,030,762.88SK 3 3 3 3 343,865,408.00 304,296,925.31 0.00 0.00
Peace 1 1 1 1 193,663,365.00 220,514,811.02 0.00 0.00
239 229 229 229 65,694,404,092.00 64,049,558,976.96 1,461,204,921.09 7,948,541.29 1,195,099.12 0.00
Closure documents Received (# OP's)
ESF programmes in closure on 31/12/2010 for 2000-2006
Closure transaction
Under closure process for 2000-2006 programmes the Commission has five months5
from the receipt of the final report in which to advise the Member State if it is not satisfied with the final report, including the coherence of financial information, and the reasons for its dissatisfaction, failing which the final report will be deemed to have been accepted.
It is noted that the Structural Funds Regulations indicates only one deadline for the analysis of the documents – five months for the final report – whereas no deadline is stipulated for the winding-up declaration or the certified statement of finalexpenditure. The assessment of the latter two closure documents have to be realised within a "reasonable period" according to the interpretation of the Legal Service (note JUR (2008) 15308 LF of 22 May 2008).
The closure process and its implementation on the gound was closely monitored in DG EMPL by the ESF 2000-2006 closure task force, set up in early begining of 2009.
5 In accordance with Article 37(1) of Council Regulation (EC) No 1260/1999

EN 9 EN
In 2010, in addition to provided guidelines refferring to the general framework for the closure of 2000-2006 Structural Funds assistance set out in Commission Decision C(2006)3424 in 2006, amended by Commission Decisions C(2008)1362 and C(2009)960; DG EMPL approved the guidance package for ESF 2000-2006 closures including establishment of the Closure Monitoring Group and the Closure Working Group.
Both groups are important platforms to deal with the closure of the ESF 2000-2006 programming period to speed up the process and ensure consistency and transparency of treatment of closure files.
The closure of the remaining 229 programmes is a work in progress and it is expected that the a major part of these programmes will be closed by the end of 2011.
2.1.3. EAGGF
The total amount paid in 2010 was EUR 168.3 million or 30.7% of the budget available at the end of the year (an amount of EUR 13.9 million was transferred during the year to other budget lines outside the EAGGF). The execution rate as regards the initial budget for payment appropriations would be 29.9%.
In absolute terms, the amount paid in 2010 is far below the amount paid in 2009 (EUR 300 million less). Three main reasons are behind this reduction:
– The rural development programmes financed by EAGGF-Guidance have followed a very high rhythm of implementation in previous years. At the end of 2009, 94% of the EAGGF-Guidance contribution programmed for the whole period had already been paid, and a substantial number of programmes (112 out of a total of 152), had already reached the 95 % ceiling for interim payments. In these cases, no further payments were possible in 2010 until closure.
– In 2010 the closure of 2000 – 2006 EAGGF-Guidance programmes started and by the end of the year 19 programmes (out of a total of 152 programmes), were closed.
– The low EAGGF-Guidance expenditure in 2010 was very largely compensated by EUR 11.12 billion of EAFRD expenditure under the rural development programming 2007-2013 (which is EUR 2.91 billion more than in the year 2009).
The EAGGF-Guidance outstanding commitments (RAL) at the end of 2010 amounted to EUR 1,183.3 million, equivalent to 5.3% of the whole allocation 2000-2006. This amount is EUR 171.3 million lower than the EUR 1,354.6 billion RAL at the end of 2009.
2.1.4. FIFG
The overall absorption rate for payments was 100%, with EUR 10 million being disbursed to Member States.

EN 10 EN
Concerning the execution level of payment appropriations, EUR 10 million was paid under Objective 1, no payment was made outside Objective 1.
The total RAL for the FIFG at the end of 2010 reached EUR 296,44 million (compared with EUR 306,41 million in 2009). This represents 7.5% of total commitments for the period 2000-2006.
For the whole period, as at the end of 2010, EUR 3639 million have been paid to Member States. This represents an absorption rate for all Member States of 92.5% of the EUR 3935 million overall allocation.
2.2. Programme Implementation
2.2.1. Objective 1
Expenditure on Objective 1 programmes followed much the same path as in 2009(for details, see part 5). Objective 1 programmes focused on basic infrastructure projects (40.2%), with almost half of all investment in this category spent on transport infrastructure (49.9%). More than a third (34.9%) of Objective 1 resources was invested in the productive environment, where the focus continues to be on assisting SMEs and the craft sector (26.6%). Projects geared to human resources account for 22.5% of resources in Objective 1 regions. The main areas of assistance in this field are almost equally split between labour market policies (30.6%) and education, and vocational training (31.2%).
2.2.2. Objective 2
The main focus of programmes in Objective 2 regions continues to be on productive investments, with over half of all financial resources devoted to this category (55.4%). Within this field, assistance to SMEs and the craft sector is the most dominant (55.6%). The second most supported field is basic infrastructure, with 29.2% of all Objective 2 resources. Unlike Objective 1 programmes, the most important areas in financial terms are planning and rehabilitation of areas (45.6%). In the category of human resources (10.5% of all investment in Objective 2 regions), workforce flexibility, entrepreneurial activity, innovation, information and communication technologies are the main fields of investment (31.6%).
2.2.3. Objective 3
ESF programme implementation in 2010 continued to be focused on the European Employment Strategy, particularly on the measures aimed at improvingemployability in the labour market (30,9 % of certified expenditure), lifelong learning (activities developing educational and vocational training represented 31;2 % of certified expenditure), social inclusion (13;3 % of certified expenditure), equal opportunities (5.2 % of certified expenditure) and entrepreneurial activities, workforce flexibility, innovation, information and communication technologies (19,05%)
2.2.4. Fisheries outside Objective 1
Expenditure of the FIFG programmes outside Objective 1 focused on the processing, marketing and promoting of fisheries products (26.7%). The second most important

EN 11 EN
measure was adjustment of the fishing effort (17.8%), followed by the renewal and modernisation of the fishing fleet (17.5%), fishing port facilities (16.9%) and actions by professionals (vocational training, small coastal fishing) (12.8%).
2.2.5. Community Initiatives
2.2.5.1. INTERREG
INTERREG supports cross-border, transnational and interregional cooperation to encourage the harmonious, balanced and sustainable development of the EU. By the end of 2010 the 81 INTERREG III/Neighbourhood programmes had selected about 19 000 projects and networks aimed at reducing the effects of national borders, language barriers and cultural differences and developing border areas, supporting strategic development and territorial integration across larger zones of the EU and better integration with its neighbours. Effectiveness of regional development policies and instruments was also supported by sharing of good practice and exchange ofexperience.
The first 54 INTERREG III programmes were adopted in 2001 and were followed by 15 programmes in 2002 and 3 in 2003. Enlargement increased the overall number of EU borders and resulted in nine new programmes being adopted in 2004, many of which are Neighbourhood Programmes. In 2004 most programmes were modified to take account of the mid-term evaluations and the distribution of indexation funds.
For some programmes changes were also necessary due to enlargement and/or integration of the Neighbourhood Programme concept. Some ‘n+2’ decommitments and results of the updates of the mid-term evaluations contributed to further programme modifications in the following years. By the end of 2010, the payment absorption rate was about 92 %. Due to the more specific and challenging nature of cooperation programmes, project decommitments due to the ‘n+2’ rule could not be avoided for some programmes. In total EUR 135.0 million was decommitted during the programming period due to the automatic decommitment rule.
In 2010, the closure process for 81 INTERREG III/Neighbourhood programmes has been started. By the end of reporting year 64 programmes have been submitted to the Commission. The Commission services worked in close cooperation with the authorities responsible for programme implementation in order to conclude the closing procedure. Within 2010, closure of 3 programmes has been finalised. The remaining 17 programmes, due to extended final dater of eligibility of expenditure affected by the financial crisis and prolonged eligibility for the Technical assistance priority are expected to enter the closure procedure by 31 March 2011.
Due to their international nature, financial control and audit are challenging for INTERREG programmes. Audit findings have called for some programmes to develop action plans on how to improve their financial control and audit systems. The implementation of these action plans has been closely monitored.
2.2.5.2. EQUAL
The EQUAL Community Initiative focused on supporting innovative, transnational projects aimed at tackling discrimination and disadvantage in the labour market.

EN 12 EN
These projects were created to generate and test new ideas with the aim of finding new ways of fighting all forms of discrimination and inequality within and beyond the labour market.
The principles underpinning EQUAL projects were the following: Partnership, Innovation, Empowerment, Transnational cooperation and Mainstreaming
EQUAL was structured according to thematic fields defined within the four pillars of the European Employment Strategy (EES): Employability, Entrepreneurship, Adaptability and Equal opportunities. In addition to these pillars, the programme supported a further theme of activities to help the integration of asylum seekers.
It was implemented by all Member States, following common guidelines established by the Commission. The programme stood for €3 bn investment of the ESF in labour market development and social inclusion and has helped to make the ESF a more effective, efficient and relevant instrument for contributing to the Lisbon reform strategy to create more and better jobs. EQUAL has provided evidence for innovative and adaptable policy strategies and delivery mechanisms that bring greater inclusiveness to Europe’s diverse labour markets, based on the efforts and achievements of 3,480 development partnerships with more than 20,000 partners, reaching over 200,000 persons in Europe.
The EQUAL Community Initiative programmes were administratively closed in 2008 in most Member States. Only a few asked for an extension of the final date of eligibility into 2009 in order to achieve a higher absorption rate and to continue mainstreaming actions. In 2010 the administartive closure process was continued and by the end of the year 4 closures of EQUAL Operational programmes were completed.
2.2.5.3. URBAN
In 2010, URBACT I programme has been closed. The URBACT Programme reported a total eligible cost of 25 043 714€ of which a total of 15 386 591€ ERDF was claimed, this represents an ERDF under-spend of 2 644 526€ or 14.67%.
The URBACT II programme, the Urban Development Network Programme under the European Territorial Cooperation Objective, is an exchange and learning programme for cities based on the good experiences with the URBACT I programme. In 2010, work on the management of the URBACT II programme continued by way of monitoring committees and reporting procedures.
After having launched the first call for proposals in 2007, in total, 19 thematic networks and 6 working groups were launched. In 2010, five working group closed their projects. All the partners produced and submitted their Local Action Plans. The remaining one working group and the 19 thematic networks got close to the end of their implementation phase. They consolidated their work in the implementation phase by elaborating and starting to implement Local Action Plans in close cooperation with Local Support Groups.
In 2009, a second call for proposals was launched and another thirteen thematic networks and three working groups started the development phase. In 2010 they all

EN 13 EN
finished this first phase and applied for the implementation phase. Due to not having met the eligibility criteria for the implementation phase, only nine thematic networks were able to start the implementation phase in 2010.
So far 30 thematic networks and seven working groups (in 2009 there was an additional call for the establishment of a working group to facilitate the implementation of integrated sustainable urban development according to the Leipzig Charter) have been working under the programme. Together with the two Pilot Fast Track Networks and the working groups and thematic networks that finished their projects at the end of the development phase of the second call, the projects have gathered 333 partners (cities, Member States, regional authorities, universities, NGOs) from 28 countries (26 Member States plus Norway and Switzerland).
The creation of strong links between cities and their managing authorities is the guiding principle of the entire URBACT II programme. Following the two calls for projects launched under URBACT II, the Managing Authorities signed letters declaring their intent to cooperation with 240 URBACT partners.
The URBACT II programme is one of the main instruments of the Regions for Economic Change initiative, aiming at faster implementation of best practice and innovative concepts. In this framework, the Commission in 2010 actively supported six running Fast Track Networks of the first call and selected and labelled two networks of the second call. Several Commission services, led by the Directorate-General for Regional Policy (and one network led by the Directorate-General for Health and Consumers), are involved in the Fast Track Network activities and support the project partners in implementing their Local Action Plans through regional or national Operational Programmes.
2.2.5.4. LEADER+
The Community Initiative Leader+ consisted of three activities: implementation of local development strategies by public private partnerships, cooperation between rural territories and networking. 73 Leader+ programmes for the EU 15 were approved for the period 2000-2006. (Recently acceded EU Member States had the option of integrating Leader+ type measures into their EAGGF Objective 1 programmes.)
By the end of 2010, 14 LEADER+ programmes were closed and 8 closure letters had been sent to Member States
2.2.6. Innovative Actions
2.2.6.1. ERDF
The Directorate-General for Regional Policy also managed 181 Regional Programmes of Innovative Actions (by 31 December 2010, 171 had been closed, 24 of them during 2010). These programmes helped to promote strategic innovation in the regions, by experimenting with innovative methods and practices designed to improve the level of innovation and the quality of EU assistance under three themes: knowledge and technological innovation, information society and sustainable development. In December 2010, the European Policy Evaluation Consortium
EN 14 EN
(EPEC) delivered conclusions of a study on Policy lessons from experience with the Regional Programme for Innovative Actions in the fields of innovation, sustainable development and information society.
2.2.6.2. ESF
The remaining Innovative Actions for 2005 and 2006 projects were completed as planned and closed in 2010.
3. CONSISTENCY AND COORDINATION
3.1. Consistency with other Community policies
Previous reports have given details of developments to maintain consistency between cohesion policy and other EU policy priorities such as competition policy, internal market, environment, transport and gender equality objectives. There were no specific changes in requirements or expectations on managing authorities as the 2000-2006 programmes entered the final months of implementation.
For the future programming period, thematic inter services taskforces have been implemented to ensure coherence of Structural Funds’ policies in following fields: “Smart growth”, “Sustainable development”, "Education", "Employment and Social inclusion", “Transport”. (NB in early 2011)
3.2. Coordination of instruments
3.2.1. The Structural Funds and the Cohesion Fund
Aid granted by the Cohesion Fund provides financing for transport infrastructure projects in the fields of trans-European networks and the environment. The Cohesion Fund enables the beneficiary Member States to channel significant public investment into these two fields of common interest, while meeting the objectives of reducing the budget deficits set out in the convergence and stability programmes drawn up as part of Economic and Monetary Union.
Following the enlargement of the European Union in May 2004, the ten new Member States are covered by the Cohesion Fund. In the period 2000-2006, before the latest enlargement on 1 January 2007 to include Romania and Bulgaria, there were 13 beneficiary Member States. As a result of its economic growth, Ireland has not been eligible for the Fund since 1 January 2004.
The principal instrument for coordinating funding under the Cohesion Fund and the Structural Funds is the national strategic reference framework (SRF), which covers the whole of the 2000-2006 period. Council Regulation (EC) No 1265/1999 amending Annex II to Regulation (EC) No 1164/94 provides that ‘Member States shall also provide the results of the environmental impact assessment in conformity with Community legislation, and their consistency with a general environmental or transport strategy at administrative unit or sector level’.
The four ‘old’ Member States benefiting from the Cohesion Fund presented their SRFs for the environment and transport sectors at the end of 2000. The ten new

EN 15 EN
Member States submitted theirs during the first half of 2004. Since then, decisions to finance projects by the Cohesion Fund have been subject to a verification process to avoid duplication with programmes adopted under the Structural Funds. In addition, SRFs improve the complementarity between the two instruments.
Thus, in certain cases, these SRFs form an integral part of the programmes approved under the Structural Funds for the period 2000-2006; this improves coordination between funding under the Cohesion Fund and the Structural Funds.

EN 16 EN
3.2.2. The Structural Funds and the EIB/EIF
Since the implementation of the 2000-2006 period entered the closure phase in 2010, there is nothing to report.
4. EVALUATIONS
In 2010, the Commission continued to carry out evaluations to support decision-making under the Cohesion Policy.
ERDF
In 2010, the Commission completed the ex post evaluation of ERDF interventions in objective 1 and 2 regions. The synthesis report of the all work was published and presented to the public in April 2010.
The ex post evaluations of the Community Initiatives URBAN and Interreg were also completed in 2010.
The ex post evaluation of the URBAN Community Initiative provided evidence of the added value of this aspect of the policy and supported the proposals by the Commission for a stronger urban agenda in the future policy. Successful projects were characterised by local leadership (80% of URBAN programmes) and local ownership. They were selected in line with local perceptions of need, with commitment from local players and delivered in partnership with local people. Unsuccessful projects were usually imposed from above, with little local ownership and involvement.
The ex post evaluation of the INTERREG III Community Initiative concluded that it was about much more than mutual learning, although this too was important. Financially larger programmes generated significant investments and achieved lasting tangible impacts, while smaller programmes achieved mostly intangible impacts on territorial development. INTERREG generated important soft leverage effects – actor mobilisation, an increased inter-cultural understanding and development of social capital.
In addition other evaluations were launched in 2010 and are currently underway. Three of them are studies on Counterfactual Impact Evaluation of Cohesion Policy:
· Examples from enterprise support, with the aim to assemble and use support and outcome data for assistance to enterprise in Member States. The study will use econometric analysis to estimate the impact of ERDF enterprise assistance
· Examples from support to innovation and research: aiming to document the process of combining beneficiary data, firm-level economic data and innovation and research data for the purposes of counterfactual impact evaluation, to see where it is possible and to give a practical guide to the kind of issues which arise.

EN 17 EN
· Data-linking and impact evaluation in N. Ireland: looking to document work currently underway preparing and linking various datasets in Northern Ireland, as well as to perform an impact evaluation using these datasets.
Two thematic studies were also launched. The first one concerns local development, in order to assess the contribution of local development to the effective delivery of Cohesion Policy and to provide lessons for the future and on territories with specific. The second one concerns regions with specific geographic features, with a view to examine the extent to which cohesion policy interventions are and have been appropriate in mountainous, islands and sparsely populated regions
Another study launched in 2010 concerns the evaluation of Innovation activities, to provide a state of the art of the evaluation of innovation in Member States and an analysis of the advantages and limits of available methodologies for assessing different kinds of innovation activities, to conduct a series of case studies on good quality evaluations, as well as to draft guidance for managing authorities to support their evaluation activities.
ESF
The ex post evaluation of the ESF (2000-2006) was completed in 2010. It consists of 1 preparatory study, 2 thematic studies (a - ESF support to the Open Method of Coordination in social protection and social inclusion; b - The impact of the ESF on the functionning of the labour market and investment in human capital infrastructure through support to systems and structures), and 2 main evaluations on the ESF and EQUAL. All the evaluation reports have been published1.
Besides the ex post evaluation, the following evaluations and studies were completed in 2010 or beginning of 2011:
- Evaluation of the ESF contribution to the European Employment Strategy.The evaluation confirmed that the ESF is an essential instrument to implement and disseminate concepts and reforms linked to the EES;
- Evaluation of the capacity of the ESF delivery system to attract and support operational programme target groups. The evaluation found that in some cases the delivery systems put in place by Member States have a limited capacity to attract and support certain OP target groups. This is especially true for target groups that face multiple barriers to enter the labour market;
- Evaluation of ESF support to the integration of the ethnic minorities andmigrants in the labour market. A key conclusion of this evaluation was that there is an increased attention to promoting the labour market and social inclusion of migrants and minorities in ESF in the 2007-2013 period compared with 2000-2006;
- Evaluation of ESF support to Gender Equality. The evaluation confirmed the European Added Value in the ESF's support to gender equality policy, which is mostly visible in terms of capacity building and support for the creation of a recognised and autonomous policy space for gender equality;

EN 18 EN
- ESF implementation in the 2007-2013 period - template for EC reporting and 2008 outline report. The study has developed a template to report on the use and performance of the European Social Fund (ESF) since the beginning of the current programming period in 2007, as notified by Member States to the Commission through the SFC 2007 platform. It also proposes a limited set of aggregated common indicators.
In addition, the following evaluations and studies were launched in 2010 and are currently underway:
- Developing logics of intervention and related common indicators for the next ESF operational programmes. The purpose of the study is threefold: (1) to develop methodologies for establishing logics of intervention at the most suitable level for the ESF; (2) to develop logics of intervention by way of example for three selected policy areas: access to employment; social inclusion and poverty; institutional capacity and governance; (3) to develop common indicators relevant for all ESF policy fields;
- Evaluation of ESF support to Lifelong Learning. This evaluation focuses on how ESF Lifelong Learning activities could better support the sustainable integration of young job seekers, low-skilled workers and older workers into the labour market;
- Evaluation of the reaction of the ESF to the economic and financial crisis. The purpose is to assess if the economic crisis has had an impact on the ESF spending, at which level it had an impact, if the ESF is sufficiently flexible to react to such challenges and at which stage of the crisis is the ESF best placed to intervene.
Furthermore, DG Employment launched an ESF Evaluation expert network The purpose of the network is to aggregate and synthesise the ESF evaluations carried out by the Member States, as well as to deliver policy analysis and evidence on the performance of ESF.
In 2010, DG Employment continued to hold ESF Evaluation Partnership meetings to which it invited all Member States’ evaluation functions. The main objective of these meetings is to steer and capitalise on evaluation of actions supported by the ESF. In 2010, the Evaluation Partnership met three times
EAGGF
Ex-post evaluation of LEADER+
The ex post evaluation of Leader+ was completed in 2010. This evaluation covers the Leader+ programmes, as specified by Council Regulation (EC) No 1260/99, and the Leader+-type measures included in transitional rural development programmes for the period 2004-2006 (EU-10).
The purpose of this evaluation is to assess the effectiveness, efficiency, relevance and sustainability of Leader+ programmes and Leader+-type measures as implemented in the EU-15 and EU-10 respectively.
The evaluation concluded that Leader+ was an important complement to mainstream policies and has contributed to economic diversification, quality of life and

EN 19 EN
enhancement of the natural and built environment of rural areas. Its flexibility and sensitivity to local needs distinguished Leader+ from other interventions, and exploited potential unreachable through more conventional channels. It successfully promoted multi-sectoral integrated development and contributed to strengthening the local economy and social capital in rural areas. Leader+ had significant positive effects on local governance capacity. LAG autonomy was considered an important factor in the effectiveness of the policy.
The recommendations of the report included increasing the focus on long-term development, increasing resilience and adaptive capacity as compared to short-term job creation and productivity gains; increasing the autonomy of LAGs; taking additional account of the needs of minority or marginalised groups; encouraging further networking and cooperation between LAGs; increasing capacity building and ensuring continuity between programming periods.
Ex-post evaluation of 2000-2006 Rural Development Programmes
In 2010 the Commission launched the ex-post evaluation of 2000-2006 rural development programmes. This evaluation consists of a synthesis of individual programme-specific ex-post evaluation reports for EAGGF-Guarantee co-financed EU15 RDPs, and for EU10 2004-2006 Transitional Rural Development Instrument programmes, together with the evaluation of EAGGF-Guidance co-finanded rural development measures implemented throughout Objective 1 regions and EAGGF-Guarantee co-financed rural development measures implemetned within Objective 2 regions in France. All of these were implemetnd within the framework of Council Regulation (EC) No 1257/99. It will be completed during 2011.
The evaluation will assess the relevance, coherence, effectiveness and efficiency of the different measures and programmes. It will seek to identify examples of good practice and to make recomendations for future policy design. It will consist of documentary analysis, surveys of Mananging Authorities and Monitoring Committee members and case studies of selected programming areas. The findings and conclusions will be structured according to eight themes: relevance of the policy objectives; coherence between the measures and policy objectives; complementarity between rural development and other support instruments; coverage, content and consistency of programmes; results, impact, effectiveness and efficiency of support; delivery systems; monitoring and evaluation; and impact achieved in relation to new priorities.
5. CONTROLS
5.1. ERDF
Audit work
Assurance on 2000-2006 ERDF (mainstream and INTERREG) programmes has been built up gradually over the years.
First, the effective functioning of the Member States' management and control systems has been the subject of wide-ranging audits since 2004 covering key

EN 20 EN
elements of management and control. In terms of coverage, the programmes audited represent 43% of the number of the mainstream programmes and 76% of the decided ERDF contribution. As regards INTERREG, a separate audit enquiry launched in 2006 was concluded in 2010 for the 23 programmes examined (28% of total programmes) representing 54 % of the decided contribution.
Second, an extensive preparatory enquiry was carried out from 2007 to 2010 to review the winding-up bodies (WUB) in order to verify the assurance which can be placed on their closure work underpinning the winding-up declarations (WUD), to verify the preparation of Member States for closure and to identify and mitigate related risks. The objective was to reach conclusions as to whether the audit work of the national bodies can be relied on as a main source of assurance for the remainder of the programming period and whether the winding up declaration will be based on adequate audit work and will be a reliable source of assurance at programme closure. The 42 audits carried out under this enquiry, together with audit missions done on the winding-up body as part of regular systems audits which started in 2004, resulted in a coverage of winding-up bodies in charge of approximately 85% of the decided amount of the 2000-2006 programmes at the end of 2010.
Third, an extensive preparatory enquiry was carried out from 2007 to review the Winding-Up Bodies (WUB) in order to verify the assurance which can be placed on their closure work underpinning the winding-up declarations, to verify the preparation of Member States for closure and to identify and mitigate related risks. The 42 audits (including three in 2010) carried out under this enquiry, together with work done on the WUB as part of systems audits, resulted in coverage of WUB in charge of approximately 85% of the decided amount of the 2000-2006 programmes at the end of 2010.
Finally, during 2010, four audit missions were carried out to follow up previous ERDF systems audits (mainly implementation of remedial action plans following the detection of systems deficiencies) in three countries: in Spain (1), Germany (1) and Italy (2).
Other audit work carried out in 2010 for the 2000-2006 programming period included the examination of the 86 systems audit reports received from national auditors, eleven annual control reports received under Article 13 of Regulation No. 438/2001 (2009 was the last year where submission of annual control report summarising all audit work carried out in the year was obligatory, before submission of the closure documents by Member States for most programmes in 2010). Assessment letters were sent to all the Member States with observations and, where necessary, requests for additional information in order to be able to draw as much assurance as possible from the results of national audit work.
The closure process of programmes started in 2010 with the submission to the Commission of closure documents for most programmes (final implementation report, final declaration of expenditure and winding-up declaration summarising the audit findings over the programming period).
The analysis of winding-up declarations (WUDs) received from Member States started in 2010. The total number of ERDF programmes to close for 2000-2006 period is 379. There were 350 WUDs due and received by end 2010, the remaining

EN 21 EN
29 being due by March 2011 (one received in advance by end 2010). The analysis of WUD also takes into account any overall analysis or statement of assurance supplied in the annual summaries, where available. By end 2010, 279 WUDs had been analysed: 165 (47%) WUD have been accepted and for 114 (33%) WUD the analysis was interrupted in order to request additional clarifications or audit work from the Member States. The analysis was ongoing for the remaining 71 (20%) WUD.
The Winding-Up Bodies classified their audit opinions as: unqualified, qualified, and adverse or disclaimer in line with the closure guidance. DG Regional Policy undertook an in depth analysis and further classified the reported qualified opinions into "reasonable assurance with moderate impact" or "limited assurance", depending on the seriousness of qualifications reported by the WUB. The categorisation is provisional as outstanding issues will be cleared in the coming months. DG Regional Policy agreed with the opinions expressed in the WUDs in 261 cases (74%)6 and reclassified the opinion in 92 cases (26%). For the latter programmes, this means that DG Regional Policy considered that it could not entirely rely on the work or opinion of the Winding-Up Body to draw its assurance or took into account additional audit information at its disposal (for one programme).
Finally, in order to complete all the above audit work, an enquiry on the closure of ERDF assistance for 2000-2006 is planned in 2011. Following an analysis of the residual risk for closure, on the basis of the audit work carried throughout the programming period and the result of the assessment of the WUDs, DG Regional Policy plans to carry out closure audits in 2011 in nine Member States (CZ, DE, ES, IE, EL, IT, PT, SK and the UK).
In 2010, for INTERREG., following the reservations expressed in Annual Activity Report 2009 on 15 INTERREG III programmes, following an extensive audit enquiry carried out between 2006 and 2009 for 23 programmes representing 54% of the ERDF amounts committed, appropriate action was taken to address the remainingrisks. In its Annual Activity Report 2010, DG REGIO maintains a reservation until closure of programmes for nine programmes.
Impact of controls
In exercising its supervisory role, the Directorate-General for Regional Policy had established a policy in 20087 to ensure more rapid adoption of decisions to suspend payment and make financial corrections when serious systems weaknesses are detected which endanger the reimbursements of Funds made to Member States. The more rigorous approach continued in 2010 even though no additional suspension was decided in 2010 (since 1994-1999 programmes are now closed and most 2000-2006 programmes reached the 95% threshold for payments , meaning no Commission payment necessary before closure and where necessary, financial corrections decisions will be taken at closure). Three suspension decisions (for two German and one Interreg 2000-2006 programmes) remained in force at year end as the identified deficiencies (management verifications and audit function) were not solved and the
6 26 cases were excluded from the total of 379 because WUD were not received or no opinion was
available in the Winding-up declaration. 7 Under the Action Plan to strengthen the Commission’s supervisory role — COM(2008) 97 of 19
February 2009.

EN 22 EN
closure procedure is interrupted (DE). (In the case of the Interreg DK/SE programme, payment will be resumed when it is agreed to implement the necessary financial corrections following audit results at closure (Interreg DK/SE programme).)
This raises the total ERDF financial corrections decided/ agreed following in 2008-2010 to EUR (2900 plus X 2010) XX million and the cumulative corrections in the period 2000-2010 to EUR YY (5400 million plus Y 2010) for the financial corrections made by the Commission and by the Member States, as a result of Commission or Court of Auditors audit activity or OLAF investigations.
In 2010, many of the procedures in progress in the previous years were finalised for ERDF with the application of financial corrections or the adjustments of the amounts. Furthermore, 2010 was a transition year for the two programming periods; the conclusion of procedures for 2000-2006 leading to a decrease of amounts in progress and the initiation of new procedures (somewhat less at this stage) for 2007-2013. Thus, the amounts of financial corrections in progress this year are lower compared to the previous year. At the end of 2010, suspension and correction procedures were in progress for a total number of approximately 117 ERDF programmes, with an estimated amount of approximately EUR 559 million.
Concerning the ESF, most of the EUR 9 million of new cases refers to the 2000-2006 programming period as all the operational programmes concerned are reaching their closure phase. The processing of financial corrections will be dealt with in the closure process. Nevertheless, half of the on-going procedures concern the 2007-2013 programming period. These were estimated to be at EUR 1 (provisional amount) as the amount to be corrected still needs to be identified.
In addition to the above-mentioned figure, an amount of EUR 1 437 million has been reported by Member States and represents potential recoveries following the detection of irregular claims on structural funds notified to OLAF under regulation No. 1681/94. However the prospects of recovery in individual cases cannot be assessed with sufficient accuracy based on the information forwarded by Member States. In addition there is a risk of overlap with the figures above-disclosed which is difficult to quantify as Member States are not obliged to distinguish in their reporting between potential recoveries and those resulting from their own controls.
Part 6 of this report provides further information and details on the financial corrections and recoveries in the structural funds for 2010 by fund and country, as well as cumulatively up to the end of 2010.
Annual summaries
Annual summaries were received for the fourth consecutive year in February 2011 as per Article 53b(3) of the amended Financial Regulation and were assessed by the Directorates-General responsible for structural actions.
The European Court of Auditors reported in its 2008 and 2009 Annual Reports that the Commission supervised the annual summaries exercise well. The Commission revised the guidance for the 2009 Summaries (submitted in February 2010) and reiterated its encouragement to the Member States to add value to the summaries by providing additional information which is not communicated in other reports. This

EN 23 EN
can be done by analysing the functioning of systems, diagnosing problems and their solutions, describing good practices and providing a declaration as to the degree of assurance the Member States derive from their systems. The revised guidance note takes on board some of the recommendations formulated in the study of 5 June 2009 on the annual summaries commissioned by the European Parliament. Finally, the Commission, as recommended by the European Parliament in its 2008 discharge resolution, commissioned an external study to take stock of the added value of annual summaries after three consecutive exercises and to envisage the possible contribution of annual summaries to the assurance building process, particularly in view of the revision of the Financial Regulation.
The external, independent analysis done by the consultancy firm on the Member States' annual summaries submitted from 2007 to 2009 was based on desk reviews of submitted documents, on meetings with European Commission audit representatives and with a sample of Member State audit authorities and on the review of national declarations and annual control reports. The study, which was finalised in April 2011 and made public thereafter, concluded that the annual summary in its current form has provided little added value. It also confirmed that whilst there were improvements in the compliance elements of the summary over the three year process, the same was not true of voluntary disclosures, which have remained limited.
Following the analysis of the annual summaries received for 2010, the Commission services noted that twenty-six Member States have complied with the minimum requirements of the Financial Regulation regarding information to be provided. Where necessary, Member States which have not completely followed the recommendations in the Commission's guidance note, have been requested to provide the additional information. For one Member State (Spain), there were non-compliance issues (major elements of the annual summary were missing for 2000-2006 programming period), therefore the Commission have requested a revised annual summary.
Sixteen Member States have provided an overall analysis and eleven Member States have provided a statement of overall level of assurance, following the Commission recommendations to maximise the value of the annual summaries. In such cases, the Directorate General has used this to corroborate its own assessment of the national management and control systems or to complete information provided to the Commission in the ACR, in some cases. Namely, Bulgaria, Czech Republic, Greece and Romania reported in their overall analysis similar weaknesses as the ones identified by DG Regional Policy for programmes put in the reservations, without though providing a similar level of overall assurance. The other Member States that have programmes in the 2010 list of reservations did not provide an overall level of assurance.
National declarations
Four Member States - the Netherlands, the U.K., Denmark and Sweden – submitted national declarations on a voluntary basis to the Commission. The Commission supports these initiatives and encourages these Member States to share the process they follow in order for the Commission to be able to optimise the assurance it may draw from their declarations. Public declarations issued at senior national level make

EN 24 EN
the control process in the Member States more transparent and help identify changes needed to make the system more effective.
The Commission services elaborated guidance on national declarations for the use of Member States authorities, made available to Member States in March 2011. This guidance points the key issues to be solved in order for national declarations to provide added value to the Commission assurance process: format, report on ongoing work and audit opinion supporting the declaration, timing of submission. The guidance, while encouraging Member States to develop such national declarations that would fulfil the conditions for adding value to the Commission assurance building process, also concludes that the Commission proposal on management declarations in the revised Financial Regulation, signed at the operational level, may constitute a first more practical and useful step that could later be endorsed at a political level in the Member States.
Communication of follow-up to the action plan to strengthen the Commission’s supervisory role
Following the 2006 Annual report of the European Court of Auditors (ECA), the Commission adopted in February 2008 and put in place a comprehensive Action Planto strengthen the Commission's supervisory role in the system of shared management of the Structural Funds and the Cohesion Fund. The overall aim was to reduce the level of error in expenditure claims certified to the Commission for co-financing under structural actions. The actions should also prevent loss to the EU budget through the application of financial corrections. The Action Plan set out 37 actions, under 10 main headings. As regards the 2000-2006 programming period the main objectives were to focus audit resources on high-risk bodies so as to reduce the potential residual risk, to follow-up Member States' action plans to remedy deficiencies in management and control systems and to bring to conclusion suspension and financial correction procedures. Preventive actions for the 2007-2013 programming period comprised the review of compliance assessment reports and opinions, the review of national audit strategies, actions on simplification and review and clarification on eligibility issues as well as awareness-raising in relation to public procurement rules.
The Commission published in February 2010 a report8 to assess the first impact of the Action Plan. The report was presented to the Budgetary Control Committee of the European Parliament and to the Structural Funds working group of the European Council.
The implementation of the actions had an overall positive impact. The Commission has now a strengthened position to supervise the management of the Structural and Cohesion Funds. There are three areas which provide evidence of the tangible impact of the actions implemented:
Reduced level of error in expenditure claims certified to the Commission: the results of a Commission audit enquiry performed in 2009 on the 2007-2013
8 Communication from the Commission to the European Parliament, the Council and the Court of
Auditors - Impact of the action plan to strengthen the Commission's supervisory role under shared management of structural actions. COM (2010) 52 of 18 February 2010.

EN 25 EN
programmes provide an indication that the enhanced control provisions for the 2007-2013 regulatory framework and the preventive measures taken by the Commission have started to produce results on the error rate. The results presented by the Court in its Annual Report for 2009 came to confirm this indication: the least error rate reported for 2009 is at 3%, compared to 11% in 2008 and 2007;
The improved supervisory role of the Commission increases the effectiveness of the multi-annual control systems and reduces the residual risk of error after closure of the programmes. The results of the audit closure enquiry on 1994-1999 programmes showed that for those programmes the residual risk at closure was substantially reduced;
Reduced risk of loss to the EU budget by financial corrections: The value of financial corrections for the 1994-1999 and 2000-2006 periods substantially increased in the years 2008 and 2009, compared to the years 2000-2007. The level of financial corrections shows the rigorous Commission response to the detection of significant systems deficiencies in the Member States.
The Joint Audit Strategy of the Commission's services responsible for Cohesion will continue to build on the achievements of the Action Plan and provides a solid base in streamlining the overall audit approach to strengthen the Commission's supervisory role in shared management of structural actions and focus on high risk Member States and issues.
The Commission is maintaining the momentum generated by the Action Plan by continuing its rigorous actions and, in a system of shared management, by ensuring that the Member States continue to demonstrate their accountability and take responsibility for the use of EU funds. The Commission considers it essential that Member States add value to the current arrangements to maximize the assurance available, in the absence of a mandatory statement of management assurance.
5.2. ESF
Results of the audit activities concerning the programming period 2000-2006
5.2.1. Audit coverage 2000-2006 period
During the 2000-06 programming period, the work carried out by the audit directorate included the assessment of management and control system descriptions, analysis of national system audit reports and annual control reports in the context of annual bilateral coordination meetings, and three main audit enquiries:
– An enquiry on the verification of effective functioning of the management and control systems in the Member States, where the objective was to obtain reasonable assurance that the systems are functioning effectively to prevent and detect errors and irregularities and ensure the legality and regularity of the underlying operations and the accuracy of the expenditure declared to the Commission.
– An enquiry on project expenditure to obtain reasonable assurance on the compliance with the legislative framework as far as it concerns the conformity

EN 26 EN
with EC law on legality and regularity of the expenditure incurred in the Member States.
– An enquiry to review the work of the Winding-up Bodies in the Member States in preparation for the closure of 2000-06 programmes, where the objective was to obtain reasonable assurance that the work carried out by the Winding-up Bodies, and the systems and procedures put in place for the provision of the winding-up declaration were compliant with the requirements of Regulation 438/2001 and the Closure Guidelines, in order to be able to conclude whether the systems and procedures set up and the work carried out provide a reliable source of assurance for the remainder of the programming period and in the context of programme closure.
As a result of the above audit enquiries, at the end of 2009, the audit units had carried out missions on the spot in Member states covering 94,88% of the Operational Programmes (Note: Figures to be updated in line with 2009 country fiches)
This audit coverage was considered adequate to be able to conclude that existing systemic deficiencies presenting a material risk had been identified at the end of 2009. Accordingly, through the completion of follow-up work and of action plans with certain Member states, including the application of financial corrections when required, the Commission should be able to obtain assurance prior to programme closure that the risks have been adequately addressed. This also led to the decision not to carry out any system audit work in 2010 outside certain follow up work.
From April 2010 onwards, the audit units have been involved in the analysis of the Winding up declaration. The results of this analysis work have, and will continue, to be sent to the geographical desks as input for their closure activities and as a basis of assurance for the assessment of the final payment. The analysis work has suffered a slight delay due to the fact that much of the work was outsourced to an external audit company. The overall assessment of the winding-up documents was carried out by DG EMPL auditors. In many cases, the winding-up bodies did not send the information in the format requested by the Commission, hence requiring longer analysis work. Secondly, the EMPL auditors are carefully assessing the level of residual error in the programmes while ensuring an equal treatment across Operational Programmes and Member States
5.2.2. . Audit work in 2010
Considering the stage of implementation of the 2000-2006 programming period's Operational Programmes, no further audits of management and control systems were organised. Instead, the audit work focused on the follow up of irregularities and the reservations issued in the AAR 2009. In this respect, 2 audit missions were carried out. The breakdown of these audits is as follows:
– System audit of O.P. 2000ES053PO311: Iniciativa Impresarial – Follow up from the ECA DAS 2008;
– - Follow up of O.P. 2000GR051PO003: Health and Prevention in Greece.

EN 27 EN
– As far as the other Operational Programmes under reservation are concerned, suspension and correction procedures were launched by the geographical desks.
5.3. EAGGF
The Directorate-General for Agriculture and Rural Development followed the same basic approach as the Directorate-General for Regional Policy and shared the same general objectives.
As regards the 1994-1999 period, the planned ex-post audit programme for this period was already completed in 2006. The last financial correction procedures were completed in 2009 (the last Commission Decision adopted in February 2010).
As regards programmes financed by EAGGF Guidance for the 2000-2006 programming period the deadline for payments by Member States was 31 December 2009 at the latest.
In total, at the end of 2010, 103 programmes out of the 152 were subject to audit (67.8%), covering €21.7 billion (96.4%) of total programmed expenditure. The total number of programmes which were subject to a follow-up audit was 44. During 2010 all those audits were closed.
Consequently, pre-closure activities have been started. In accordance with Article 38 (1) (f) of Council Regulation (EC) No 1260/1999 Member States have to submit a declaration drawn up by a person or department having a function independent of the designated managing authority summarizing the conclusions of the checks carried out during previous years and assessing the validity of the application for payment of the final balance and the legality and regularity of the transactions covered by the final certificate of expenditure.
By 31 December 2010, the examination of those winding-up declarations submitted by Member States was finalized as regards 78 programmes, representing 51.3% of the total number of programmes.
5.4. FIFG
As regards the 1994-1999 period, the three FIFG audits carried out in 2010 covered three operational programmes. For Spain, the audit was focused on the Management and control systems for specific measures and consequently, the results are not extrapolated to the whole programme. For the Netherlands the audit was focused on the effective implementation of the Action plan decided following an audit in 2008. For Germany (Bremen) the audit was focused on closure and the work of the Winding-up body. The audits tested key controls in place in the Management and Control Systems, combined with sample checks of projects by desk review at the level of the Managing authorities and on-the-spot visits to projects and beneficiaries. These audits indicated that out of the programmes/systems audited by DG MARE in 2010, one worked with some improvements needed, one worked but neededsignificant improvement and part of one system did not work.

EN 28 EN
In total, 50 projects were checked by desk reviews and/or on the spot for a total eligible amount checked of €70.2 million with FIFG participation of €15.3 million. From the project audits no ineligible amounts were identified.
It should be noted that no payments were made in 2010 in respect of the programmes referred to above, where weaknesses were identified. The identified weaknesses and the financial risks for the FIFG contribution paid to the programmes are being addressed in the closure exercise.
Since the beginning of the 2000-2006 programming period, DG MARE has carried out a total of 58 audit missions covering all its mono-fund programmes (18programmes representing an initial budget contribution of €3,608.73 million – 87.4% of the total 2000-2006 budget) as well as 18 multi-fund programmes representing a contribution of €374.58 million - 9.2% of total 2000-2006 initial budget. In total, DG MARE systems audits have covered programmes representing 96.6% of the total FIFG initial contribution for 2000-2006. For the remaining programmes, theassurance is gained from other Structural Funds DGs' audit work and/or national audits.
The work on the closure process of programmes started in 2010 with the submission, at the end of September 2010, of all the closure documents for the 60 Operational Programmes except for the Greek programme where an extension of one year had been granted.
By the end of 2010, 17 Winding up declarations had been analysed: 9 had been accepted, for 8 the analysis was interrupted and additional information was requested and for the remaining 43 the analysis was ongoing. From the 9 which have been accepted, the opinion for 8 was unqualified and for one the opinion was qualified (and for which a financial correction will be proposed).
5.5. OLAF
In 2010, OLAF undertook 53 missions in the Member States relating to measures co-financed by the Structural Funds. During these missions on-the-spot checks9 were carried out on 52 economic operators and 6 other types of missions were carried out to gather information or to assist either national administrations or judicial authorities. As was the case in previous years, typical problems identified by OLAF in the course of 2010 included false declarations, false invoicing and failure to abide by public procurement rules as well as specified instances of conflict of interest in certain tendering procedures.
In 2010, Members States communicated to the Commission, in accordance with Regulation (EC) N° 1681/9410 as amended11 and Regulation (EC) N° 1828/200612 as amended13, some 6,91014 notifications of irregularities involving € 1.546 billion
9 Regulation (EC) N° 2185/1996, OJ L 292, 15.10.1996, p. 210 OJ L 178, 12.07.1994, p.4311 By Regulation (EC) N°2035/2005, JO L 328, 15.12.2005, p; 812 OJ L 371, 27.12.2006, p,113 By Regulation (EC) N° 846/2009, JO L 250, 23.09.2009, p.1

EN 29 EN
affecting co-financed measures of the 1994-99, 2000-2006 and 2007-2013 programming periods.
8 notifications concern the 1994-99 programming period with a financial impact of approximately € 3.2 million. 5,883 notifications concern the 2000-2006 programming period with a financial impact of approximately € 1,04 billion. For the programming period 2007-2013, 1,019 irregularities were reported, involving an irregular amount of € 416 million.
Member States have informed the Commission that administrative and/or judicial procedures have been concluded at national level for 4,072 cases and an amount of € 711 million has been recovered.
In 2010, both the number of notifications and the involved amounts increased by around 42% and 26% respectively, as compared to the year before. The main explanation for this situation seems to be the preparation of the closure of the programmes for the programming period 2000-2006 and the increase of irregularities in relation to the programming period 2007-2013, which is now in its full implementation phase.
The most frequent types of irregularities reported is “non-eligible expenditure”, and secondary, “infringement of rules concerned with public procurement” and “Missingor incomplete supporting documents”.
The figures demonstrate an increased awareness and a better reporting by the Member States in conformity with their Community law obligations.
6. COMMITTEES ASSISTING THE COMMISSION
6.1. COCOF
There were no COCOF related activities in 2010 concerning the implementation of the 2000 -2006 period.
6.2. ESF Committee
The ESF Committee, pursuant to Article 163 of the Treaty, assists the Commission in administrating the Eupen Social Fund. The Committee is presided over by a Member of the Commission and is composed of representatives of governments, trade unions and employers’ organisations. In 2010 there were three Plenary Sessions and six Technical Working Group mettins.
In 2010, the Committee was consulted on a number of issues, including on ESF support for social partners, Budget Review and 5th Cohesion Report as well as the Future of the ESF. . The ESF Committee also discussed further the Europe 2020Strategy, the flagship initiatives "Agenda for New Skils and Jobs" and "Youth on the move".. The adhoc group set up by the Committee in 2009 to reflect on the future of
14 2009: number of communicated cases 4.858; overall amount related to the communications €
1.161.865.730.

EN 30 EN
the ESF for the next programming period (2014-2020) continued its work and the Committee drafted an Opinion on the future of the ESF in the context of the 5th Cohesion Report and Budget Review..
The ESF Committee Technical Working Group (TWG) continued discussing, among other issues, the simplification of the General Regulation, the ESF Regulation and the implementation of the simplified cost options (flat rates, standard scales of unit costs, lump sums). The Commission followed up on the new PROGRESS microfinance facility aiming at providing for microcredit to small businesses and to people who have lost their jobs and want to start their own small businesses. The Commission presented also the assessment of the use of EU funds for Roma integration. The ESF TWG pursued its programme of mutual learning concerning financial engineering, ESF support to young people, ESF and public tendering, quality of deliverables as well as ESF and administrative capacity reinforcement. .The ESF TWG concentrated also during the 2010 meetings on the future of the Cohesion Policy with the 5th Cohesion Report and Budget review as well as on Europe2020.
6.3. Committee on Agricultural Structures and Rural Development (STAR)
The STAR Committee met six times in 2010 and gave one favourable opinion on the two following decisions: Draft DECISION of the Commission exempting certain cases of irregularity arising from operations co-financed by the Structural Funds and the Cohesion Fund for the 2000-2006 programming period from the special reporting requirements laid down by Article 5(2) of Regulation (EC) No 1681/94 and by Article 5(2) of Regulation (EC) No 1831/94, and the Draft DECISION of the Commission concerning the financial consequences for the Union budget exempting certain cases of irregularity arising from operations co-financed by the Structural Funds and the Cohesion Fund for the 2000-2006 programming period from the special reporting requirements laid down by Article 5(2) of Regulation (EC) No 1681/94 and by Article 5(2) of Regulation (EC) No 1831/94.
6.4. Committee on Structures for Fisheries and Aquaculture (CSFA)
The Committee on Structures for Fisheries and Aquaculture (CSFA) met twice in 2010. Main points discussed at the meetings include ex-post evaluation and the closure of the FIFG.

EN 31 EN
Part 2: Analysis by Member State
1. BELGIUM
2000-2006 programming period
1.1. Objectives 1 and 2
For the single Belgian programme (Hainaut) under Objective 1, an extension of the eligibility period by six months until June 2009 was granted by the Commission.
All 7 Belgian Objective 2 programmes also asked for a six-month extension of the eligibility period until June 2009, which was granted by the Commission.
Total appropriation for the Belgian ERDF programmes was EUR 416.3 million.
Total appropriation for the Belgian ESF programmes was EUR 248.7 million.
Due to the sixth-month extension of the eligibility period, in early 2010 all regions kept on working with the objective of zero losses at closure and the Commission organised technical meetings in some regions with the objective of fully explaining closure rules. In late September, all closure documents were transmitted by the three Belgian authorities and closure procedures started immediately. Following assessment of the final reports, complementary information has been asked to the managing authorities. Observations have been made on each final report and responses are expected before the end of spring. The analysis of all winding up declarations was interrupted in view of obtaining additional information or the results of additional audit work.
The commitment rate for the ERDF and ESF was 100% for both Objective 1 and Objective 2 regions. The average payments rate for the ERDF was 94,80% for Objective 1 and Objective 2 regions, or a total of EUR 393,7 million bringing the balance between the total ERDF committed and the total ERDF paid to EUR 22.5 million.
The EAGGF-Guidance contribution to the Objective 1 programme (a commitment of some EUR 41.8 million) achieved a final payment rate of 96.70%. A pre-closure report for the EAGGF Guidance contribution was sent in March 2011.
The average payments rate for the ESF was 95,00 % for Objective 1 and 93,17 % for Objective 2 regions of the total ESF appropriation.
1.2. Objective 3
There are five ESF-only operational programmes covering respectively Flanders, Belgium fédérale, French-speaking Wallonia, German-speaking Wallonia and Bruxelles Capitale) totalling appropriations of EUR 796.4 million. An absorption rate of 94.9% was achieved, representing EUR 755.8 million.

EN 32 EN
For the Federal Single Programming Document (SPD), the total ESF budget amounts to EUR 70.1 million. Payments at the end of 2010 amount to EUR 65.3 million (93.1% of the total ESF appropriation). The Flemish programme has a total ESF budget of EUR 392.5 million. The entire budget was allocated to projects. Payments at the end of 2010 amounted to EUR 372.9 million. The Wallonia-French Community programme has a total ESF budget of EUR 297.9 million (95% of the total ESF appropriation). Total payments at the end of 2010 amounted to EUR 283 million (95.0% of the total budget). The ESF budget for the Brussels region amounts to EUR 24.7 million, 95.0% of which was paid at the end of 2010.
For the four above-mentioned programmes, closure documents were received end of September and additional information has been asked to the respective managing authorities and Winding up Bodies.
The German-speaking Community has a separate Objective 3 programme, with a total ESF budget of EUR 11.2 million.. The implementation of this programme was finalised at the end of 2006. . Closure documents were received in due time end March and programme was fully closed in November 2011 with a payment of 100% of the total ESF appropriation.
1.3. Fisheries outside Objective 1
The total FIFG allocation to the fisheries programme is EUR 21.3 million. A last payment claim of EUR 3.6 million was sent to the Commission. Over the whole programming period the Commission paid EUR 19.6 million, with the total reimbursement rate reaching 91.9%.
The closure documents were received on 20 April 2010. The assessment of the documents is ongoing.
1.4. Community Initiatives
1.4.1. Equal
The ESF appropriation for the two EQUAL programmes in Belgium — one for the French and German-speaking community, and one for the Dutch-speaking Community — amounts to EUR 68.2 million. The programme covering the French-German speaking community proceeded without any major difficulty in 2010. In financial terms, the rate of execution of the ESF part of the programme at the end of 2010 was 95%. The rate of execution of the Dutch-speaking EQUAL programme was 83.4% at the end of 2010. The two EQUAL programmes supported around 125 projects, mainly in fields such as employability, adaptability, life-long learning and social economy. Closure documents were received end of September and additional information has been asked to the respective managing authorities and Winding up Bodies.
1.4.2. Leader
Belgium has two Leader+ programmes: one for Flanders, involving total public expenditure of EUR 7.9 million and one for Wallonia, involving total public expenditure of EUR 20.7 million. For both programmes, the allocated funds have

EN 33 EN
been fully committed. Total financial execution came to EUR 13.2 million, i.e. 92.7% of total EAGGF-Guidance expenditure earmarked for the period 2000-2006.
For the Flemish programme, closure documents were transmitted before end March 2010 and the final payment was made in February 2011. For the Walloon programme, due to the sixth-month extension of the eligibility period, closure documents were transmitted before the end September 2010 and their analysis was finalized in April 2011.
1.4.3. Urban
The three URBAN II programmes in Belgium have an appropriation of EUR 21.4 million and relate to the cities of Antwerp, Sambreville and Brussels. Each programme originally received EUR 7.2 million from ERDF, but due to the ‘n+2’ rule the contribution was reduced to EUR 7.1 million for Antwerp and to EUR 7.1 million for Brussels. Total expenditure for all URBAN programmes was EUR 20.3 million, or 95.0% absorption rate, leaving a balance to between committed and paid appropriations of EUR 44.9 million.
Due to the sixth-month extension of the eligibility period, for all URBAN II programmes, closure documents have been transmitted before end September and closure procedures started immediately. Following assessment of the final reports, complementary information has been asked to the managing authorities. Observations were made on each final report and responses are expected before the end of spring. The analysis of the winding up declarations for all Belgian Urban programmes was interrupted in view of obtaining additional information or the results of additional audit work.
EN 34 EN
2. CYPRUS
2.1. Objective 2
One Objective 2 Single Programming Document (SPD) was co-financed by the ERDF amounting to some EUR 28 million Community contribution.
The payments made by the ERDF (including the advance) amount to approximately EUR 26.6 million (absorption rate 95%), which results to a RAL of some EUR 1.4 million of Community Contribution. During the year 2010 no payment was executed as the 95% ceiling for payments was already reached in 2009.
Following the 6-month extension of the final eligibility date to 30 June 2009 in the framework of the financial crisis, the closure documents were submitted on 29 September 2010 which is within the 15-month deadline of 30 September 2010. The assessments of these documents have been completed resulting to the acceptance of the documents.
The final payment procedure was completed end March 2011.
Taking into consideration, that the final date of eligibility of expenditure was set on 30 June 2009, no monitoring committee took place and no annual implementation report had to be submitted. However, for the utmost preparation of the closure documents, Unit I3 provided during the year 2010 assistance to the Cypriot services.
2.2. Objective 3
Following the 6-month extension of the eligibility period of the Single Programming Document for Objective 3 (up to 30 June 2009), the closure documents weresubmitted on 28 September 2010 and procedures for closure started immediately. Following the assessment of all closure documents, it was concluded that the final payment application as sent by the Cypriot authorities concerned an amount that was higher than the amount to be paid because it included the clearing amount. As this is a calculation error, it will not be included in the final payment request. With regard to irregularities, there are no pending issues.
The Final Report was accepted in December 2010, and the closure procedure is currently nearing its completion. The final payment is expected for July 2011.
All payments made by the ESF (including the advance and final payments) have reached the committed amount of EUR 21,945,197 million (absorption rate of 100%).
Considering that the final date of eligibility of expenditure was set for 30 June 2009, no Monitoring Committee meeting took place in the course of 2010 and no annual implementation report was submitted for 2010. However, the issue of closure remained on the agenda of the annual review meeting and of technical meetings with the Cypriot authorities.

EN 35 EN
2.3. Fisheries outside Objective 1
The Fisheries Operational Programme for Cyprus (A Single Programming Document), adopted by the Commission in 2004, arrived at the and of its implementation.
Payments from the Commission to the Member State had reached the level of 95.0% of the planned FIFG contribution.
Taking into consideration that the final date of eligibility of expenditures was set on 30 June 2009, no monitoring committee took place and no annual implementation report had to be submitted.
Following the 6-month extension of the final eligibility date to 30 June 2009 in the framework of the financial crisis, the closure documents were submitted on 30 september 2010 which is within the 15-month deadline. The assessment of these documents is still on going. The Commission's services, in close cooperation with the Cypriot relevant authorities, estimate to be able to complete the closure before the end of 2011.
2.4. Community Initiatives
2.4.1. Equal
Following the 6-month extension of the eligibility periodof the Community Initiative Programme EQUAL for Cyprus, the closure documents were submitted on 28September 2010 and procedures for closure started immediately. Following the assessment of all closure documents, it was concluded that the final payment application as sent by the Cypriot Authorities concerned an amount that was higher than the amount to be paid because it included the clearing amount. As this is a calculation error, it will not be included in the final payment request. With regard to irregularities, there are no pending issues (OLAF).
The Final Report was accepted in December 2010, and the closure procedure is currently nearing its completion. The final payment is expected for July 2011.
All ESF payments (including the advance and the final payments) will reach the amount of EUR 1,807,393 million (absorption rate of 99.92%).
Considering that the final date of eligibility of expenditure was set for 30 June 2009, no Monitoring Committee meeting took place in the course of 2010 and no annual implementation report was submitted for 2010. However, the issue of closure remained on the agenda of the annual review meeting and of technical meetings with the Cypriot authorities.

EN 36 EN
3. CZECH REPUBLIC
2000-2006 programming period
During 2010, the activities of all managing authorities concentrated on the finalisation of the programme closure. For most operational programmes, the budget realised on the ground exceeded 100% (due to overbooking) already in 2009. The payment rate (paid out/decided by the Commission) corresponds to 95% of the total 2004-2006 budget.
The final implementation reports together with final payment claims and winding-up declarations were submitted for each operational programme in due time. All of them were deemed admissible. The closure procedure was then started
3.1. Objective 1
The Community Support Framework for the period 2004-2006 covers a total budget of EUR 1 954 million, of which EUR 1 454 million is contributed by the Structural Funds (63% ERDF, 25% ESF, 11.5% EAGGF and 0.5% FIFG). Five Operational Programmes are implemented under the CSF.
The CSF Managing Authority, at the Ministry for Regional Development, is responsible for the effectiveness, correct management and delivery of the support provided by the Structural Funds in the Czech Republic.
No monitoring committee took place in 2010. Major activities of the Managing Authority focused on assistance to individual operational programmes for the closure exercise.
The Joint Regional Operational Programme (JROP) is the largest Czech programme with a share of 31.2 % (EUR 454 million) of the total Objective 1 allocation (28 % ERDF and 3.2 % ESF). In 2010 no monitoring committee was held, the managing authority focused on finalisation of the programme closure. No payment claim was executed in 2010 since already in 2008 the ceiling of 95% was reached. All closure documents were submitted to the Commission in due time by the end of September 2010 with overbooking of the programme. The JROP is the Czech OP with the highest number of irregularities which is partially consequence of a rather complex implementation structure. The most successful measures in terms of absorption were projects of regional transport infrastructure, urban regeneration and tourism
The Human Resource Development Operational Programme accounts for a share of 21.2% (EUR 318.8 million ESF contribution) of the total Objective 1 allocation. No monitoring committee took place in 2010. One payment claim was executed in 2010 after which the ceiling of 95% was reached. All closure documents were submitted to the Commission in due time by the end of September 2010. The final report is acceptable except the table of irregularities where some further clarifications are required
The Operational Programme Industry and Enterprise is the third largest programme with 17.9% (only ERDF) of the total Objective 1 allocation. No monitoring

EN 37 EN
committee took place in 2010 as the managing authority concentrated on the finalisation of the programme closure. No payment claim was executed in 2010 since the ceiling of 95% was reached already in 2008. All closure documents were submitted to the Commission in due time. During the whole programming period, the most popular measures remained schemes supporting small and medium-sized enterprises, innovation schemes and two loan schemes aimed at starting entrepreneurs and firms in the initial development stage. The support schemes targeting energy saving and renewable sources of energy had been lagging behind at the beginning but caught up in the second part of the programming period.
The Operational Programme Infrastructure (OPI) is the fourth largest OP, with almost 16.9 % (only ERDF) of the Objective 1 budget allocation. One by mail voting of the monitoring committee was organized for this programme in 2010. The preparation for closure took place in 2009. The closure documents were approved by the monitoring committee on 3 February 2010 during a mail vote. The closure documents were all submitted on 7 October 2010. This programme fully absorbed the allocated funds. By the end of the eligibility period, the absorption rate on the ground reached 115.0 %. The most successful interventions in terms of absorption and the most popular were transport axes 1 and 2. Axis 1 was for transport infrastructure projects, whereas axis 2 focused on reducing the negative impact of transport on the environment.
The Operational Programme Rural Development and Multifunctional Agriculture accounts for a share of 11.5% of the total Objective 1 allocation, with a contribution from the EAGGF Guidance section of EUR 170 million. The main intervention areas were investments in agricultural holdings and the support for promoting adaptation and development of rural areas. In 2010, no Monitoring Committee was held and no amount was paid out by the Commission as 95.0% of the total programmed amount had already been paid in July 2008. All closure documents were submitted to the Commission in due time, by the end of March 2010.
Fisheries
The implementation of the FIFG in the Czech Republic finished in 2007 using up the allocations committed up to almost 92.0%, with the 2006 allocation reallocated in favour of the EAGGF measures under the two-fund OP. The last interim payment in 2008 reached the 95.0% payment limit during the implementation period. Closure can proceed as this programme was not extended, with the closure documents for FIFG received in April 2010.
3.2. Objective 2
The Single Programming Document Objective 2 Prague (SPD2 Prague) receives support of EUR 71.3 million from the Structural Funds. In 2010 no monitoring committee was organised, the managing authority focused on finalisation of the programme closure. No payment claim was executed in 2010 since the ceiling of 95% was reached already in 2009. All closure documents were submitted to the Commission in due time by the end of September 2010 with slight overbooking of the programme. The most successful measures in terms of absorption were projects of regeneration of damaged and unsuitably used area, public infrastructure improving the quality of life mainly in housing estates and projects improving the quality of

EN 38 EN
partnership between the public and private sectors, non-profit sector, science and research
3.3. Objective 3
The Single Programming Document Prague Objective 3 receives support of EUR 58.8 million from the Structural Funds. No monitoring committee took place in 2010 and no payment claim was executed since already in 2009 the ceiling of 95% was reached. All closure documents were submitted to the Commission in due time by the end of September 2010. The final report is acceptable except the table of irregularities where some further clarifications are required.
3.4. Community Initiatives
The Community initiative EQUAL has an ESF allocation of EUR 32.1 million from the Structural Funds (ESF only). No monitoring committee took place in 2010 and no payment claim was executed since already in 2008 the ceiling of 95% was reached. All closure documents were submitted to the Commission in due time by the end of September 2010. The final report is acceptable except the table of irregularities where some further clarifications are required.

EN 39 EN
4. GERMANY
2000-2006 programming period
A total number of 22 programmes submitted their closure documents in 2010 to the Commission. At year end, 21 of these closure files are under instruction. The national objective 1 transport programme was closed in December 2010. The final date for eligibility of expenditure of Structural Funds interventions, normally set at 31 December 2008, was extended at Germany’s request to 30 June 2009. This was confirmed by Commission decision of February 2009. In addition, for the three Federal ESF programmes the final date for the eligibility of expenditure was extended to 30 April 2009. This extension gave the regions concerned the possibility of funding projects for an additional six months, which was intended to mitigate possible impacts of the unprecedented economic and financial crisis on programme execution.
As a result of the exercise, the Commission expects a positive effect on the overall quality of programme execution, in physical and financial terms, as measured by key indicators such as jobs created and investment volume co-financed. As for financial execution, the overall majority of German programmes were ‘on schedule’. This means that 95.0% of their total ERDF contributions, that is the maximum amount of payment which can be claimed prior to closure, have been paid by the Commission, whereas three programmes had their contribution limited below the 95.0% threshold because of open audit issues. For these programmes, however, the expenditure required for receiving the full ERDF contribution was in most cases declared at closure. For the ESF contributions, 94.9% have already been paid out
4.1. Objective 1
Overall, financial absorption in the German Objective 1 regions was very satisfactory. For all but one programme, total payments attained the 95.0% payment limit for total ERDF and ESF commitments for the 2000-2006 programming period according to Article 32(4) of Regulation No 1260/1999.
For several reasons the ERDF Objective 1 programme for Berlin did not fully meet the 95.0% payment limit for the ERDF. Regarding the final payment claim further information on irregularities is required. Additionally the European Court of Auditors report on financial engineering instrument contains findings which may affect the final payment.
The overall physical and financial implementation in the German Objective 1 regions was good and, in general, the core targets as set in the programmes can be expected to have been globally attained
The payments of the ESF share of the Objective 1 programmes reached the 95.0% payment limit (including advance payments). A final absorption rate of about 98.0% is to be expected. The closure documents were received in due time.
Since the beginning of the period, more than 2.7 million people have participated in ESF measures in Objective 1 regions. More than 40.0% were young people (17-24

EN 40 EN
years) and around 10.0% were start-ups. Within the different priorities around 40.0% were spent for ‘Active and preventive Labour Market Policy’, 21.0% for ‘Society without Exclusion’, 8.0% for ‘Vocational Training, Systems and Infrastructure’, 20.0% for ‘Adaptability and Entrepreneurship’, 10.0% for ‘Equal Opportunities’ and around 1.0% for ‘Local Social Capital’.
Six German regions benefit from the EAGGF Guidance through Objective 1 programmes. All regional operational programmes have reached the maximum level of 95% of the total Community contribution for the period 2000-2006, amounting to total payments of EUR 3,246.834 million.
Two of these programmes were closed and paid up in 2010: Berlin, with a final payment amounting to EUR 314 210.50 and Saxony-Anhalt, with a final paymentamounting to EUR 37 825 582.36, i.e. a total payment from the EAGGF-Guidance of EUR 38 139 792.86. Amounts of EUR 51 739.50 (in respect of Berlin) and EUR 381197.64 (in respect of Saxony-Anhalt) were decommitted in 2010.
The FIFG Programme for Germany under Objective 1 required two decommitments for a total amount of EUR 12,934,943 for the years 2002 and 2003. By the end of 2010, commitments amounted to EUR 91.5 million and payments had reached EUR 86.9 million, representing a payment rate of 95.0 %. During the program 439 projects were implemented. Nearly half of the FIFG funding was invested in measure 33 (Fishing port facilities). The closure documentation was submitted on 17 March 2010. Their analysis is ongoing.
4.2. Objective 2
At the end of 2010, financial absorption of ERDF assistance in German Objective 2 regions was satisfactory overall and totalled more than 94.0%, marginally less than in Objective 1 regions. Almost all regions met the target of 95.0%, but two programmes (Baden-Württemberg and Saarland) had not been able to absorb 95.0% of total commitments by the end of 2010. These are among the smallest programmes in Germany, so their impact on the overall financial performance in Objective 2 is however low. The evaluation of the final reports has been conducted with involved DGs working with the structural funds. Overall, the outlook for programme implementation is positive since no fundamental problems have been noticed in 2010 and the regions will generally meet the targets set in the programmes.
As for Saarland a payment interruption and a formal suspension of payments were made as Commission audits identified significant deficiencies in the areas of systems' audits and checks on operations. The final evaluation of the results of systems and project audits is not yet available.
In Baden-Württemberg another audit of the Commission prevented ERDF payments to reach the 95% limit. The follow-up will be finalized in the preparation of the final payment.
For the ESF both financial absorption and programme implementation were satisfactory as well, with the exception of one Objective 2 programme. The closure documents were received in due time.

EN 41 EN
4.3. Objective 3
The Objective 3 programme is the largest in Germany, covering ESF support for the West German Länder and Berlin. It is partly managed at Federal level (Bund) and partly by the Länder. With the implementation of Labour Market reforms in Germany, an increasing share of the programme was shifted to the Länder.
Unlike most German programmes, the Federal Objective 3 programme did not apply for eligibility of expenditure to be extended until 30 June 2009, as an extension until 30 April 2009 was already agreed upon in 2008. A modification of the programme complement was also made so that the programme could be fine-tuned before closure. All projects were closed by the end of 2008. All closure documents were received in due time
4.4. Fisheries outside Objective 1
By the end of 2010, commitments amounted to EUR 62.9 million and payments had reached EUR 45.7 million, representing a payment rate of 72.6%. Dicommitments took place in the years 2001, 2002, 2003, 2004 2005 for a total sum of EUR 50,557,670. During the program 1.998 projects were implemented. The largest part of investments occurred with 55% FIFG contribution in the measure 3.4 (processing and marketing), followed by measure 3.2 (Developing aquaculture). The closure documentation was submitted on 17 March 2010. Their analysis is ongoing.
4.5. Community Initiatives
4.5.1. Equal
The development partnerships’ activities already came to an end in 2008. In 2009, the focus was on verifying expenditure declarations and preparing for closure. The final closure documents were submitted in due time . The total consumption rate is expected to be around 94.1% at project level, excluding technical assistance, and 90.8% including technical assistance.
4.5.2. Leader
The total consumption of EAGGF resources in all 14 German Leader+ programmes (13 regional programmes and a national network programme) has reached the maximum level of 95%.
In 2010 five of these programmes were closed and final payments or recoveries made. Payments were made for the following regional programmes: Schleswig-Holstein (EUR 174 762.38), Saxony (EUR 1 103 646.00), Saarland (EUR 12 836.24)and Baden-Württemberg (EUR 1 453 451.00), i.e. a total from the EAGGF of EUR 2744 692.62.
A recovery was made for the German National Network programme by issuing a debit note amounting to EUR -49 232.64.
Decommitments were made in 2010 for the Leader+ programmes of Saxony-Anhalt (EUR 389 072.25), Schleswig-Holstein (EUR 444 936.84), Saarland (EUR 69744.76) and for the German National Network for the amount of EUR 75 000.

EN 42 EN
4.5.3. Urban
There were twelve URBAN II programmes in Germany with a total ERDF contribution of EUR 149.6 million (Berlin, Bremerhaven, Dessau, Dortmund, Gera, Kassel, Kiel, Leipzig, Luckenwalde, Mannheim/Ludwigshafen, Neubrandenburg and Saarbrücken). The six programmes in the new Länder received about EUR 15 million each. The six programmes in the Western part of Germany each received an ERDF contribution of about EUR 10 million. The total eligible cost of the twelve programmes is EUR 276.8 million. For nine programmes, the managing authority is at the level of the ‘Bundesland’ in which they are located. In the case of three cities, the managing authority has been transferred from the Land to the city during the programming period.
All German and Austrian URBAN II cities met regularly as part of the German/Austrian URBAN II Network. In 2010, three Network meetings took place in Bremen, Berlin-Neukölln and Graz.
The implementation of the German URBAN II programmes was very satisfactory, both in terms of implementation and of management. The main focus was on improving the economic performance of distressed urban areas. Taking an applied integrated approach towards sustainable urban development, the economic measures taken were successfully combined with social, environmental and cultural activities. In addition, new forms of governance and the active involvement of citizens in the implementation of the programmes helped to meet the sometimes ambitious objectives of the programmes. Programme eligibility for nine programmes lasted until the end of 2008; it was prolonged until June 2009 for three programmes. In 2010 six programmes were closed and final payments made. Good progress was made on closure of the remaining six which will be completed in 2011.
4.6. Closure of the 1994-1999 programming period
4.6.1. ERDF
For the programming period 1994-1999, DG REGIO is still following up together with OLAF the financial consequences of irregularities communicated by Germany. Commission decisions to charge partial amounts to the Community budget or recovery orders have been issued in 2010.
4.6.2. ESF
The Commission continued the closures of the period 1994-99. Out of a total 48 mainstream Operational programmes 2 further German programmes were fully closed in 2010. 413.780 € were paid out and 8.357.438 € were decommited. The payments/decommitments included also amounts concerned after an Art. 5.2 decision on the ESF contribution to unrecoverable amounts. Payments for an amount of 679.540,90€ and decommitments for an amount of 125.371,84€ have not yet been totally executed in 2010.
Two Art. 5.2 procedures for the programming period 1994-1999 were launched in 2010. Five decisions (all Art. 5.2) about the contribution of the ESF budget to unrecoverable amounts were taken..

EN 43 EN
4.6.3. EAGGF
The last German programmes for the programming period 1994-1999 were closed in 2006.
EN 44 EN
5. DENMARK
2000-2006 programming period
5.1. Objective 2
For the programming period 2000-2006, there was one Objective 2 Programme for Denmark.
The funding for the programme initially totalled EUR 617 million, of which EUR 192.9 million was from the Structural Funds (EUR 29 million was for phasing-out regions), EUR 217 million from the national public sector (an increase of EUR 9 million compared to the initial allocation) and EUR 194 million from the private sector (a decrease of EUR 30 million).
The programme aimed to create the conditions for self-sustained growth in the regions of Denmark facing structural problems. It combined actions under the ERDF (71%) and the ESF (29%).
The eligible areas consisted of five geographical sub-regions: Bornholm (Objective 2), Lolland, Falster and Møn (Objective 2), Nordjylland (Objective 2 and phasing-out), parts of the counties of Viborg, Århus, Ringkøbing and Sønderjylland (Objective 2 and phasing-out) and Sydfyn and islands not covered by the above regions (Objective 2).
There were no meetings in the Programme (PMC) in 2010.
5.1.1. ERDF
By the end of 2010, the Commission had paid out EUR 133.5 million, equalling an absorption rate of close to 95% for the ERDF.
The Member State submitted the closure documents to the Commission in 2010. A final payment will be made as part of the closure scheduled to take place in 2011.
5.1.2. ESF
The final spending for the programming period 2000-2006 was EUR 108.4 million in total cost, financed by EUR 45.4 million in ESF (total paid in 2009 included). The ESF spending equalled an absorption rate of approximately 88.41%. In the programming period, in total, the ESF supported 828 projects under which 22738 persons (46.5% of them women) participated in competence development.
The ESF part of the programme helped to create new education and training courses and bolstered cooperation between education institutions in the regions.
Furthermore, the ESF projects helped to make company training planning more systematic and to develop new courses and new ways of cooperation between education institutions and enterprises.
EN 45 EN
5.2. Objective 3
For the programming period 2000-2006, there is one Objective 3 programme for Denmark. Funding initially totalled EUR 757.9 million, with EUR 378.9 million from the ESF. After allocation of the performance reserve, the Structural Fund contribution amounted to EUR 394.8 million, plus EUR 294.3 million from the national public sector (an increase of EUR 9.5 million compared to the initial allocation) and EUR 100.9 million from the private sector (an increase of EUR 6.7 million). EUR 14.9 million was decommitted in 2007, thereby decreasing the Structural Fund contribution to EUR 379.9 million.
The programme supports active labour market measures, the labour market integration of vulnerable unemployed persons, the development of employee competencies and entrepreneurship.
The reporting for 2008 was included in the final implementation report for the programme. The final spending for the programming period 2000-2006 (with continuation to 2008) amounted to EUR 826.2 million in total cost, financed by EUR 351.7 million from ESF, EUR 321 million in public and EUR 153.4 million in private contributions. The ESF spending equalled an absorption rate of approximately 92.6%.
The ESF Objective 3 programme supported 4111 projects with 154889 participants, 48.2% of them women. The priorities absorbing the largest shares of funding were support for competence development and support for entrepreneurship.
5.3. Fisheries outside Objective 1
The total initial FIFG allocation, including the reserve, to the country-wide Danish fisheries programme was EUR 213.3 million. The programme had a rather low level of implementation. There were decommitments in 2004, 2005 and 2007 in application of the ‘n+2’ rule. In total, the programme has so far been reduced by EUR 30.7 million. Out of EUR 182.6 million remaining, the financial execution has reached 90.4% (EUR 165.1 million). Denmark submitted the closure documents in July 2010. The closure procedure has reached an advanced phase of analysis. The Danish final payment claim amounts to EUR 159.4 million for 3414 operations. The main measures in the programme were scrapping of vessels, processing and marketing, collective investments and innovative measures.
5.4. Community Initiatives
5.4.1. Equal
The Danish EQUAL programme supported 89 projects in total, with 11 088 participants (61.8% of them women). The final spending for the programming period 2000-2006 (with continuation to 2008) amounted to EUR 59.7 million in total cost, financed by EUR 28.7 million in public, EUR 5.4 million in private contribution and EUR 24.6 million from ESF, which means an absorption rate of 80.9%.
The two most active networks were Integration of Immigrants and Refugees and Adaptability.

EN 46 EN
5.4.2. Leader
Denmark has implemented the Leader+ initiative through a single national programme. 12 local action groups have received support, covering 29 per cent of the area and 11 per cent of the total population of Denmark.
At the closure of the programme in 2010 cumulative payments amounted to EUR 16.4 million, accounting for 94.7% of the total planned EU budget for the programme (EUR 17.3 million). The total cumulative eligible expenditure declared under the programme amounted to EUR 41.7 million.
5.4.3. Urban
The Århus URBAN II programme is the only one in Denmark. The ERDF will contribute a total of EUR 5.4 million to this programme, for which the total eligible costs amount to EUR 12.1 million.
The managing authority for the programme is the Danish Enterprise and Construction Authority. There were no meetings of the monitoring committee in 2010.
The URBAN programme successfully contributes to all three dimensions of the Lisbon Strategy. On the economic side, it has helped to initiate and stimulate entrepreneurial culture, education and IT development. For the social dimension, the programme contributes to employment efforts, equality, social protection through citizen involvement, empowerment and crime prevention. Its environmental contribution is exemplified by the project — Hasle Bakkelandskab‘.
The Commission has paid in total EUR 5.1 million of the EUR 5.4 millioncommitted.
The Member State submitted the closure documents to the Commission in 2010. A final payment will be made as part of the closure scheduled to take place in 2011
5.5. Closure of the period 1994-1999
All programmes were closed before the end of 2004.

EN 47 EN
6. GREECE
2000-2006 programming period
6.1. Objective 1
In the 2000–2006 period the thirteen regions of Greece were all under Objective 1. All regional and sectoral national OPs had received either half-year extensions (within the frame-work of the European Economic Recovery Package) or one-year extensions (due to the wildfires of 2007). In 2010, the closure documents for 14 programmes (those with a half-year extension) had been received within the deadline. Final payment claims (total amount of EUR 221,106,448.32) were interrupted following the initial review of the WUD by the auditors. Additional closure documents for the remaining five programmes were submitted within the deadline in 2011.
In terms of financial management of the programmes in 2010, interim payment requests were processed on time and according to regulatory deadlines. In total, 23 payment claims were processed in 2010, out of which only 2 claims had a financial transaction amounting to EUR 15,888,921. The remaining claims related to clearing of pre-financing and/or withdrawal of projects without any financial transaction.
In addition, in 2010, financial corrections totalling EUR 14,107,356.77 were applied by the Greek Authorities to the operational programmes, in conformity with the Commission Decision C (2005)1731 by which part of the Community assistance (ERDF) for Greece was cancelled.
Taking into consideration that the final date of eligibility of expenditures was set on 30 June 2009 or 31 December 2009, no monitoring committee took place and no annual implementation report had to be submitted.
Co-financing by the ESF during the 2000-2006 programming period concerned 19 operational programmes under the CSF III. Of these programmes, 3 had been adopted under the responsibility of the ESF (operational programmes "Employment and Vocational Training", "Education and Initial Vocational Training" and "Health" and Welfare") and 16 under the responsibility of the ERDF (13 Regional operational programmes, and the operational programmes "Competitiveness", "Information Society" and "Technical Assistance").
Due to the 2007 wildfires in Greece 2 ESF and 7 ERDF operational programmes received a one-year extension. On top of this, these operational programmes received an additional half-year extension within the framework of the European Economic Revocery Package, therefore final deadline for submitting their closure documents was set on 31 March 2011. The half-year extension within the framework of the European Economic Revocery Package was accorded also to the rest (10) of the ESF co-financed operational programmes, therefore the final deadline for submitting the closure documents for these programmes was set on 30 September 2010.
EN 48 EN
The ESF received in 2010, within the deadline, the closure documents for the 10 programmes and in 2011, also within the deadline, the closure documents for the 9 programmes.
The closing process for the 10 programmes received in 2010 (total amount of EUR 106,301,431.31), was interrupted following the initial review of the winding-up declaration (WUD) by the Auditors and additional information was requested fromthe Greek authorities. The additional information was received on 05 April 2011 and the final report and the analysis of the WUD was completed. No irregularities cases were found for these 10 programmes, therefore OLAF's agreement is awaited in order to proceed with the closure of these programmes. Closure is expected to be completed within deadline.
The closing documents for the 9 programmes received in 2011 (total amount of EUR 132,281,268.30) are currently being analysed by the responsible services.
The payment ceiling of 95% has been reached for all ESF co-financed programmes
The national mono-fund EAGGF Guidance Section programme for Greece was approved by the Commission on 6 April 2001. The Community contribution to this programme was EUR 1233 million for a total cost of EUR 3010 million. On 24 November 2004, the Commission approved the decision for the mid-term revision of this programme, which included an additional amount of EUR 0.25 million coming from the programming and performance reserves. Anadditional modification of the programme took place on 7 December 2006, without however having any impact on total EU co-funding.
The 13 regional multi-fund programmes approved during the first half of 2001 and last amended on 7 December 2006 represent a total EAGGF contribution of EUR 1069 million. All programming complements were adopted by the monitoring committees by written procedure.
Due to the extensive fires that took place in Greece in the summer of 2007 which affected — amongst other things — rural infrastructures, forestry and private investments in rural areas, Greece submitted to the Commission in autumn 2007 a request to extend to 31 December 2009 the date of eligibility of the national mono-fund EAGGF Guidance programme, as well as of the four multi-fund regional operational programmes for the affected areas of Attica, Continental Greece, Peloponnese and Western Greece mentioned above. The extension of the final date of eligibility of expenditure until 30 June 2009 was requested in December 2008 for the remaining nine regional multi-fund operational programmes, due to the impact of the 2008 financial crisis.
In 2009 payments reached EUR 77 million. Cumulative payments from the EAGGF Guidance Section since the start of the 2000-2006 programming period (EUR 2422 million) account for 95.0% of the planned budget.
On 30/9/2010 the Closure documents for 9 Regional Operational Programmes and for the national Operational Programmes were submitted by the Greek authorities to the Commission and are now under treatment.

EN 49 EN
Implementation of the FIFG Objective 1 ‘Fisheries’ Operational Programme for Greece ended in in 2010. Payments from the Commission to the Member State reached 95.0% of the FIFG contribution planned for this operational programme.
Taking into consideration that the final date of eligibility of expenditures was set on 31 December 2009, no monitoring committee took place and no annual implementation report had to be submitted.
Following the above mentionned extension of the final eligibility date, the closure documents were submitted on January 2011 which is within the 15-month deadline. The assessment of these documents is still on going. The Commission's services, in close cooperation with the Greek relevant authorities, estimate to be able to complete the closure before the end of 2011.
6.2. Community Initiatives
6.2.1. Equal
At the end of 2009 the rate of financial execution of the ESF was 95.0% of the total budget (EUR 100.6 million). The extension of the eligibility period to 30 June 2009 allowed full absorption of the ESF allocation while easing the closure process.
All the closure documents have been transmitted 28 September 2010 and closure procedures started immediately. The analysis of the final report and the WUD finally has been accepted and the final payment claim (total amount EUR 5,296,691.35) will be paid by July 2011.
6.2.2. Leader
There is only one Leader+ programme for Greece, approved on 19 November 2001 with a total cost, following the 2004 indexation exercise, of EUR 368.7 million. Of this, EUR 186.1 million comes from the EAGGF Guidance Section. The programme was last amended in November 2006. There was also a request to extend the final date of eligibility for Leader+ after the extensive fires affecting Greece in the summer of 2007. For 2009, the payments amount to EUR 4.3 million. Cumulative EAGGF payments from the start of the 2000-2006 programming period account for 95.0% of the total EAGGF contribution to the programme.
On 30/9/2010 the Closure documents for the Leader+ programme were submitted by the Greek authorities to the Commission and are now under treatment.
6.2.3. Urban
As for the Community initiative URBAN II, the 3 programmes for Greece (Perama, Iraklio and Komotini) have all received a half-year extension within the framework of the European Economic Recovery Package. In 2010, closure documents for these 3 programmes had been received within the deadline. Final payment claims (total amount of EUR 2,843,281,57) were interrupted following the initial review of the WUD by the auditors. No monitoring committee took place and no annual implementation report had to be submitted. No interim payment claims were processed in 2010 for these programmes

EN 50 EN
6.3. Closure of the period 1994-1999
All programmes were closed before the end of 2008.

EN 51 EN
7. SPAIN
2000-2006 programming period
7.1. Objective 1
The average financial execution for Objective 1 remained positive. The current absorption rate, compared with the amount programmed for 2000-2006, is 94.6% for ERDF, including the advance payments. The ERDF amount executed has already reached EUR 23 998 million out of the EUR 25351 million committed for this Objective in Spain for the period.
The ESF amount executed (including advance payments) reached EUR 8453 million of the EUR 9 080 million (93.1%) committed by the ESF for this objective in Spain for the period 2000-2006.
Concerning decommitment rules, no ‘n+2’ rule was in place at the end of 2010 as any decommitment will take place at closure. Following the findings of Commission audits, a financial correction amounting to EUR 79 091 million was applied to intermediate body Directorate General for Research, which covered both research infrastructures and projects. Any other correction will be considered at the moment of the closure. In 2010 there were no monitoring committees or annual meetings concerning 2009.
Further to the extension of the eligibility period, all closure documents (Final Report, Payment Claim and Winding-up Declaration) were submitted on time for all ERDF Operational Programs and Single Programming Documents. Final balance will paid after completion of assessment procedures.
EAGGF
All twelve programmes reached the 95.0% payment limit by the end of 2009. No further interim payment applications have been sent by the Member State and no payments were made in 2010.
The 36 closure documents were submitted on time (30 September 2010). Checking of the documents started in the last quarter of 2010.
EUR 6.9 million have been recovered for the Castilla y León programme, following a financial correction Decision of December 2009 (result of a Commission audit mission).
Fisheries inside Objective 1 regions
The total FIFG allocation to the fisheries programme is EUR 1571 million. By the final date of eligibility of expenditure of 30 June 2009, close to 20.000 operations had been supported. The final declared expenditure amounts to EUR 1 488 million and no payment claim was sent as the Commision had already paid EUR 1.492 million. Accordingly, a revenue forecast was created for the programme (circa 4M€).

EN 52 EN
All the closure documents for the programme were received by the deadline of 30 September 2010 and analysis of the final implementation report, the winding-up declaration and the Infosys reports was ongoing by the end of 2010. Progress on the infosys corrections has been slow given the high number of individual operations to be checked on their eligibility and correct implementation. Other closure-related work during the year focused on verifying that the reporting obligations for some measures were respected and that all ineligible expenditure related to audit findings had been properly deducted from the final declared amounts (including the EUR 86 million linked to a serious deficiency identified in a DG MARE ex-post audit).
7.2. Objective 2
The average financial execution for Objective 2 is positive as well. For the ERDF, the current absorption rate, compared with the amount programmed for 2000-2006, is 92.96% (including the advance payment) and the amount executed has already reached EUR 2 373 million out of the EUR 2,554 million committed for this Objective in Spain for the period
For the ESF, the financial absorption rate is 86.4 91,8 % corresponding to EUR 267.9 285 million out of a total amount of EUR 310.3 million committed for the ESF in Spain under this objective for the period 2000-2006.
7.3. Objective 3
The financial absorption rate for the ESF reached 94.5%, which amounts to EUR 2182 million out of a total amount programmed for 2000-2006 for this objective in Spain of EUR 2308 million.
7.4. Fisheries outside Objective 1
The total FIFG allocation to the fisheries programme is EUR 216.6 million. By the final date of eligibility of expenditure of 30 June 2009, 5.853 operations had been supported. The final declared expenditure amounts to EUR 201.9 million and no payment claim was sent as the Commision had already paid EUR 205.7 million. Accordingly, a revenue forecast was created for the programme (circa EUR 3.8million).
All the closure documents were received by the deadline of 30 September 2010 and analysis of the final implementation report, the winding-up declaration and the Infosys reports was ongoing by the end of 2010. Other closure-related work during the year focused on verifying that the reporting obligations for some measures were respected and that all ineligible expenditure related to audit findings had been properly deducted from the final declared amounts.
Morocco Specific Action (fisheries)
For the Morocco specific action — the EU aid package to compensate vessel owners and crews whose activities were dependant until 1999 on the fishing agreement with Morocco (R[EC] 2561/2001) — the Community granted EUR 186.3 million to Spain. The Community aid executed amounts to EUR 163.7 million (achievement rate of 87.8%). In 2010 a reviewed final payment claim of EUR 5.49 million was

EN 53 EN
received to account for a series of corrections and deductions done. Although the specific Morocco action ended in 2004, closure was still in progress in 2010 as some final clarifications and documents had to be requested from the Spanish authorities before the Commission could come up with the closure proposal which might bring about financial corrections.
7.5. Community Initiatives
7.5.1. Equal
The EQUAL amount executed reached EUR 468 million of the EUR 511 million (91.5%) committed under this initiative in Spain for the period 2000-2006.
7.5.2. Leader
All 54 closure documents were submitted on time (31 March for 12 programmes, 30 September for the 6 others). Checking of the documents was begun, requests for supplementary information were sent to the Member State and corrections to the documents were delivered. For 5 programmes, the pre-closure letter was prepared and 1 final payment was executed, after agreement by the Member State, on the balance calculation mentioned in the letter (LEADER+ Valenciana).
The LEADER+ Aragón programme was affected by a financial correction following a Commission audit mission (EUR 0.6 million recovered).
7.5.3. Urban
There are 10 Community Initiative Programmes in Spain with an EU contribution of EUR 114.2 million, which represents 15% of the total URBAN II budget for the period 2000-2006.
The Spanish URBAN II CI programmes are being implemented steadily according to the original programming — the absorption rate at the end of 2010 was 89.53%.
The managing authority for the programmes is the Ministry of Finance. Management and implementation has been delegated to the local authorities.
No ‘n+2’ rule was in place at the end of 2010, as any decommitment will take place at closure.
Overall comments for the 2000-2006 period
The focus on a single area has produced a very targeted approach. The strong local partnership and presence of several agencies in the decision-making procedure has ensured the smooth running and sustainability of URBAN projects.
7.6. Closure of the 1994-1999 programming period
At the end of 2010, the RAL was already zero, as the last open document SPD 5b País Vasco (RAL: EUR 0.1 million) had been closed in 2009.

EN 54 EN
As for the ESF, the remaining outstanding commitments of EUR 5.1 million were awaiting a ruling by the Spanish courts. This concerns the three programmes of INEM Objective 3, Catalonia Objective 2 and Catalonia Objective 3, which were suspended by decisions under Article 24 of Regulation (EC) No 4253/88.
A financial correction Decision of February 2010 enabled de-commitment of the last four outstanding amounts relating to 1994-1999 programmes (their final payments or recoveries were made in 2007 or before).
In the arbitration exercise on cases reported by the Member State to OLAF (in application of Commission Regulation (EC) No 1681/94), three cases still need to be given a final solution.

EN 55 EN
8. ESTONIA
2000-2006 programming period
8.1. Objective 1
Estonia is implementing a Single Programming Document with an ERDF participation of EUR 232.8 million and ESF participation of EUR 69.3 million out of EUR 371.4 million in total. Payments from the Commission already reached the 95.0% payment limit in 2008. The eligibility end date of the programme was extended to 30 June 2009 in response to the crisis.
The SPD aimed for ‘fast socially and regionally balanced sustainable economic development’ mainly by shifting into higher value-added production. The SPD strategy is based on four priorities (excluding technical assistance): (i) Human Resource Development, (ii) Enterprise Competitiveness, (iii) Agriculture, Fisheries and Rural Development and (iv) Infrastructure and Local Development.
Final Monitoring Committee meeting for approving the final report was held in September 2010. All closure documents were submitted on time. Additional information was requested regarding the final report and the winding-up declaration.
According to the report, the levels of indicators set to measure the achievements were largely met and exceeded. Where the targeted level of indicator was not met, additional explanations have been provided.
3,281 ERDF projects were finished within the programme.
The programme results include: 1,650 enterprises received SF support, 7,850 gross jobs were created, (4040 of these can be considered sustained net jobs 12 months after project), 835 new enterprises were created, 95 km of roads were built or rehabilitated, 12,300 student places in vocational education were upgraded and 2 major hospitals were modernized.
266 irregularities have been reported to AFCOS in relation to the programme, 193 irregularities were included below the reporting ceiling. In total 459 irregularities were identified. One OLAF investigation was carried out and it concluded that for three projects implemented by the same beneficiary, there were certain irregularities related to the public procurement rules.
The cohesion policy has facilitated the transfer to a more knowledge-intensive economy and has provided the necessary infrastructure for the economy. In addition, the programmes have had an effect on softer issues such as: introduction of evaluation culture, audit quality (evidenced also through the signing of the contract of confidence between the Commission and the Estonian authorities), increased management and project planning capacity, increased levels of administrative capacity at sub-national level.
According to the final report 99.34% of ERDF resources have been used, 99.41% of ESF, 99.1% of EAGGF and 88.9% of FIFG.

EN 56 EN
The FIFG share in the Single Programming Document for Estonia represents 3.4% (i.e. EUR 12.5 million). The 95.0% payment limit for Commission reimbursement was reached in April 2008. As it is not possible to continue any further reimbursement before the programme is closed, there were no payments by the Commission in 2009 and 2010. During the whole programming period 275 applications were approved; from that 248 were successfully completed. Modernisation and renewal of the fishing fleet was the most popular and had 65 projects approved. Other important measures were investments in aquaculture and fishing ports, and socio-economic measures for fishermen. There have been no de-commitments of the initial allocation and the programme implementation in Estonia has not seen any major problems. The closure documents were submitted by 30 September 2010. The assessment of the documents is in the final stage of analysis. As the final absorption of FIFG remains below 95%, Estonia will have to reimburse Commission approximately EUR 539 000.
The total EAGGF allocation for Estonia amounts to 56.798.282 €. By the end of the programming period 56.258.497 € was paid out. Eligible expenditure was 56.189.598 €. The difference of 68.900 € is irrecoverable expenditure which is expected to be shared by Estonia and the Commission. In total 4028 EAGGF project applications were accepted and 3657 implemented. The last EAGGF interim payment of up to 95.0% was made in March 2008
8.2. Community Initiatives
8.2.1. Equal
The ESF contribution to the EQUAL programme amounted to EUR 4.1 million. The final date of eligibility for this programme was 31 December 2008. By the end of the eligibility period, 91.0% of the programme funds were spent.. .Closure documents were submitted in time by the end of march 2010. The Final report demnostrates that the programme met its objective, which was to develop innovative ideas for lowering unequal treatment in the labour market. The programme was closed in the first quarter 2011.
8.2.2. Leader
Estonia implemented the Leader approach through the measure ‘Local initiative based development projects — LEADER’ within the framework of the Estonian National Development Plan 2004–2006 (Single Programming Document 2004-2006). The measure was implemented by two options: acquisition of skills (local development strategies were prepared) and integrated rural area development strategy (the strategies were implemented).
Local Action Groups (LAGs) applied for support under the Leader measure at the end of 2006. By the beginning of 2007, 24 LAGs were chosen. Most of the LAGs received support for preparing local development strategies, three LAGs started to implement their existing strategies. Two more LAGs were established and supported from the Rural Development Programme 2007-2013. By 20010 LAGs covered approximately 99.5% of the total rural area.

EN 57 EN
As a support structure for the LAGs a Leader Information Centre was established in June 2005. The Estonian National Rural Network Unit within the Rural Economy Research Centre has been coordinating the LAGs' activities: organising meetings and training courses; being responsible for networking; managing websites and databases; disseminating information and experience related to rural development. The implementation of Leader under the Single Programming Document ended in summer 2008 and continues under the Rural Development Programme 2007-2013.

EN 58 EN
9. FRANCE
2000-2006 programming period
2000-2006 programming period
9.1. Objective 1 and 2
Objective 1 covers the four French outermost regions15, Corsica and three districts of the North/Pas de Calais region.
Objective 2 concerns 21 of the 22 regions of metropolitan France. There are four national programmes on technical assistance and IT management in addition to the 27 regional programmes.
Due to the sixth-month extension of the eligibility period, in early 2010 all regions kept on working with the objective of zero losses at closure and the Commission organised technical meetings in some regions with the objective of fully explaining closure rules. In late September, all closure documents were transmitted by the French authorities and closure procedures started immediately. Following assessment of the final reports, complementary information has been asked to the managing authorities. The winding up documentation was considered acceptable for the whole of the French programmes.
The commitment rate for the ERDF was 100% for both Objective 1 and Objective 2 regions.
The average payments rates for the ERDF were 94.6% for Objective 1 regions and 95.1% for Objective 2 regions. For the EAGGF the rate was 95%.
At the end of 2010, 92.3% (EUR 874.4 million) of the ESF programming amounts had been paid out under Objective 1 and 93.6% (EUR 748.9 million) under Objective 2.
At the end of 2010, the final execution of the FIFG in the Objective 1 regions were satisfactory (la Réunion, Martinique, Guyana and Corsica having reached the reimboursement ceiling of 95,00%), except for Guadeloupe, where the level remained at 88,26%.
The closure documents of the FIFG intervention were received in due time (September 30th) and all the final reports have been accepted, except for Martinique. The quality analyses of the final reports have been launched as well as the Infosys and winding-up declarations analyses. Results of the quality analysis of the final report and of the Infosys report have been sent to La Réunion before the end of the year.
15 Guadeloupe, Guyane, Martinique, Réunion.

EN 59 EN
9.2. Objective 3
The 2000-2006 ESF Objective 3 programme covers metropolitan France and benefitted from a six-month extension of the eligibility period over the first half of 2009. The extension was used to maximise expenditure under the 2000-2006 programme and to prepare the operational programme for closure.
At the end of 2010, 94.1% (EUR 4.6 million) of the programming amounts had been paid out by the Commission under Objective 3.
The 2010 annual meeting between the Commission and the French managing authority (Délégation Générale à l’Emploi et à la Formation Professionnelle) took place on a April and on 16 November 2010.
9.3. Fisheries outside Objective 1
The total FIFG allocation to the fisheries programme is EUR 243.8 million. The most important measures are operations by members of the trade, scrapping, fishing port facilities, processing and marketing. No changes in 2010, as the payment limit of 95.0% was already reached at the end of 2009.
The closure documents of the FIFG intervention were received in due time (September 30th). The final report was admissible but its quality analysis as well as the Infosys analysis were not finished at the end of 2010. The winding-up declaration analysis was launched.
9.4. Community Initiatives
9.4.1. Urban
The URBAN II programme in France consists of nine programmes being carried out in the following cities/group of cities: Bastia, Bordeaux/Cenon/Floirac, Clichy-sous-Bois/Montfermeuil, Grenoble, Grigny/Viry-Chatillon, Le Havre, Le Mantois, Les Mureaux/Val-de-Seine, Strasbourg. Four of the nine programmes (Clichy, Le Mantois, Grigny and Val-de-Seine) are located in the Ile de France region, with an ERDF contribution of EUR 51 million. In total, nine programmes received an amount of EUR 294.6 million, of which EUR 102.5 million was from the ERDF.
For all URBAN II programmes, closure documents have been transmitted before end September and closure procedures started immediately. Two URBAN programmes (Le Havre and Strasbourg) did not ask for an extension of the eligibility period and the programmes have been closed definitely in 2010. For the seven other French Urban programmes, following assessment of the final reports, complementary information has been asked to the managing authorities. The winding up documentation was considered acceptable for the whole of the French Urbanprogrammes.
The commitment rate for the ERDF was 100% and the average payments rate for the ERDF was 95.6%.

EN 60 EN
9.4.2. Equal
Following several decommitments since 2001, the total appropriation for EQUAL is now EUR 287.4 million. 94.9% (EUR 273 million)of this budget had been paid outby the Commission at the end of 2010.
9.4.3. Leader
The French National Programme on Community Initiative Leader+ was adopted on 7 August 2001 (C(2001)2094), taking the form of a global grant. The National Centre for Setting-up of Farming Structures (CNASEA) was designated as the managing authority.
The total Community contribution initially amounting to EUR 272.8 million was finally fixed at EUR 259.9 million by Commission Decision C(2007) 3542 of 17 July 2007.
The implementation of this programme is carried out by 140 Local Action Groups (LAGs), selected in 2002. Their action plans were set up in 2003, after signing bilateral conventions with CNASEA.
Global execution at the end of 2010 amounted to EUR 246.9 million, which represents 95.0% of the EAGGF Community contribution to the programme.
9.5. Closure of the 1994-1999 programming period
All EAGGF (Guidance) programmes are closed.

EN 61 EN
10. ITALY
2000-2006 programming period
10.1. Objective 1
For the 2000-2006 programming period, in Objective 1 regions, Italy has succeeded in committing the full amount allocated. In terms of financial execution, all Objective 1 ERDF programmes attained the 95% threshold thanks, also, to the extension of the eligibility date up to 30 June 2009.
All Programmes timely submitted their closure documents. No Objectve 1 Programme was closed in 2010.
In 2010, a single annual meeting between the Commission and the National and Regional Authorities was held in Cagliari in October for both Objectives 1 and 2 and for the 2000-2006 and 2007-2013 programming periods. For the 2000-2006 programming period, the agenda focused primarily on closure procedures (Final Implementation Reports, practical arrangements for the financial follow-up and the treatment of irregularities).
Monitoring committee meetings for almost all programmes took place once during the year in order to discuss and approve the Final Implementation Reports and fine-tune closure proceedings, in relation in particular to the treatment of irregularities.
As regards the EAGGF Guidance Section, the payment rate reached 93%. For ESF the final certifications presented by the different OPs lead to a maximum amount of possible payments equal to 97.5% of the 2000-2006 overall budget. The actual amount will be determined on the basis of the ongoging closure procedures. For FIFG the absorption rate was 88.3%.
In the EAGGF Guidance section, three programmes reached the 95.0% payment limit (Calabria, Puglia and Molise). According to the payment data at the end of 2009, the best performing EAGGF programmes are the regional programmes of Calabria (95.0%), Puglia and Molise (95.0%); in contrast, the poorest performing programme is Sardegna (89.5%).
As far as the FIFG is concerned, at the end of 2010, financial implementation of the national fisheries programme (PON) reached 92.7% in terms of payments on total eligible expenditure. At the regional level, the best performing programmes in terms of payments are Molise and Calabria (which reached the 95.0% payment limit) as well as Campania (92.9%). The programmes performing least well in financial terms were the regional programmes Sicilia (81.3%), Puglia (87.5%) and more severly Sardegna (68.0%).
As for ESF, according to the final certification of expenditure, the maximum possible payments range from 94.03% for the OP Campania to 100% of the OPs Ricerca, Molise, Sicilia, Basilicata, and Scuola. In average the National OPs performed slightly better than regional ones.

EN 62 EN
In addition to that, the closure procedure will take into account for the actual final payments the problems of some of the regional OPs, in particular Sicily, Puglia and Calabria, mainly linked to the high error rates detected during audits.
10.2. Objective 2
In line with Objective 1 Regions, in Objective 2 regions too, Italy has succeeded in committing the full amount allocated. Likewise, in terms of financial execution, all Objective 2 ERDF programmes but one attained the 95 % threshold thanks, also, in this case too, to the extension of the eligibility date up to 30 June 2009 with the only exception of Region Valle D'Aosta which had not asked for the extension. The only Region where financial execution did not reach the 95% theshold is Abruzzo which, due to the earthquake which hit the Region in April 2009, only reached 91.2 % of total payments despite the extension of the final eligibility date up to 30 June 2010 granted to the Region by decision of 11 May 2009.
All Programmes submitted their closure documents as scheduled by 30 September 2010 with the exceptions of Abruzzo which, following the extension of its final eligibility date up to 30 June 2010, will need to submit its closure documents by 30 September 2011.
As already indicated for Objective 1, in 2010, a single annual meeting was held in Cagliari in October for both Objectives 1 and 2 regions and for the 2000-2006 and 2007-2013 programming periods. For the 2000-2006 programming periods, the agenda focused on the same items for both objectives.
Monitoring committee meetings for almost all programmes took place once during the year in order to discuss and approve Final Implementation Reports as well as examine and fine-tune closure issues, in relation in particular to the treatment of irregularities.
10.3. Objective 3
All OPs submitted the closure documents by 30 September 2010, with the exception of the Abruzzo OP, which, following the earthquake which hit the Region, was granted an extension up to 30 June 2010 and whose deadline for the submission of the closure document is 30 September 2011.
The final certifications presented by the different OPs lead to a maximum amount of possible payments equal to 97.97% of the 2000-2006 overall budget (not taking into account the figures of the Abruzzo OP). The actual amount of payments will be determined on the basis of the ongoing closure procedures.
Most of the OPs (10) presented a final certification of expenditure of 100% (or more) of the total budget. For three OPs (Toscana, Lazio and Azioni di sistema) the figure is above 95% while the Veneto OP attained 87.81%.
In the case of the OP Trento, which did not ask for the extension of the eligible date for expenditure and submitted the closure documents already by 31 March 2010, the closing procedure was concluded in 2010, with the payment of 100% of the foreseen budget.

EN 63 EN
10.4. Fisheries outside Objective 1
According to the monitoring data provided by the Italian authorities on 31 December 2010, the financial implementation of the FIFG mono-fund Single Programming Document (SPD-DOCUP) had in practice reached 100% in terms of commitments of total eligible expenditure and 95.0% in terms of payments on total eligible expenditure, which is 100.0% of the amount that the Commission can reimburse before closure.
10.5. Community Initiatives
10.5.1. Equal
The final certification of expenditure, presented by 30 September 2010, amounts to384 920 106.83 €, that is 95.9% of the total budget. The actual amount of payments will be determined on the basis of the ongoing closure procedure.
.
10.5.2. Leader
There are 22 Leader+ programmes in Italy: 21 regional programmes and one national programme for the LEADER network, amounting to a Community contribution of EUR 28161 million for the period 2000-2006.
According to financial execution on 31 December 20010, the payment rate amounted to 93.35% of the total eligible expenditure. Three Final Payments have been already finalized (Piemonte, Trento and Valle d'Aosta. In 2010 we have received the three closure documents for all remaining programmes with the exception of the programme of Abruzzo (Deadline is 31/03/2011 because of the earthquake in 2009).
10.5.3. Urban
There are ten Urban II Community Initiative Programmes in Italy (Carrara, Caserta, Crotone, Genova, Milano, Misterbianco, Mola di Bari, Pescara, Taranto, Torino) for an overall ERDF contribution of EUR 114.0 million.
Financial execution has been on average satisfactory. All but one programme reached the 95% payment theshold. The exception is the Taranto Programme which only reached 79.8% primarily due to administrative problems (the municipality of Taranto was declared insolvent in 2006), affecting the implementation of the programme.
All URBAN II Programmes timely submitted their closure documents by the scheduled date. Two of them - Urban Torino and Urban Carrara - were fully closed in 2010: by paying the full outstanding requested amount.
10.6. Closure of the 1994-1999 programming period
Out of the 106 programmes relating to the 1994-1999 programming periods, three are still not fully closed (Leader II Lazio, Leader II Puglia and GG FICEI). In 2010, no new closure proposals were sent as the Member State confirmed that the three

EN 64 EN
cases have not yet completed all the legal stages of the ongoing judicial and administrative proceedings.
In the case of GG FICEI, the closure letter proposal was sent to the national authorities in order to recover an unduly paid amount of EUR 0.1 million and decommit the unspent commitment amount. In early 2010, however, Italy confirmed the existence of delays in the ongoing administrative proceedings. At 31 December 2010, the outstanding open commitment equals approximately EUR 2.1 million for three 1994-1999 programmes and one 1989-1993 programme (Leader I Italy), for which a certain amount was kept committed as it is linked to projects subject to judiciary proceedings.
It is to be noted that these cases cannot be followed by a decommitment procedure ex Article 24 (2),(3) of Council Regulation (CE) n.4253/88 as the administrative and judicial proceedings are still ongoing and might not come to an end in the near future.
The closure of these cases should be carried out in close cooperation with the competent Authorities in the Member State and taking into account of the Legal Service support for further action necessary to safeguard the principle of loyal cooperation set by the TFEU
All 59 ESF files were processed. Currently, the RAL (outstanding commitments) amounts to approximately EUR 40 million and is entirely due to legal and/or administrative disputes at national level, which also considerably delayed the winding-up process. It will be possible to reduce this RAL gradually as soon as the legal action is resolved.
As regards EAGGF programmes, all 1994-1999 programmes have been closed.

EN 65 EN
11. IRELAND
2000-2006 programming period
11.1. Objective 1
The ERDF provided a total of EUR 1 946 million to Objective 1 programmes in Ireland during the programming period. Implementation of the ERDF took place in the five Irish Objective 1 programmes: Economic & Social Infrastructure, Productive Sector (PSOP), Technical Assistance (TAOP), Border, Midland & Western (BMW) Region and Southern & Eastern (S&E) Region. There were also ESF-funded programmes: the ESF-funded childcare measures in the two regional programmes.
During the 2000-2006 programming period the ESF funded the Human Resources Development Operational Programme (EHRD) OP, The Border, Midland andWestern Region (BMW) OP, the Southern and Eastern Region (S&E) OP, the PEACE programme and the EQUAL programme for a total of EUR 1 092 million.
The Structural Funds for 2000-2006 played an important role in fostering research, development and innovation and boosting the information society. In the period 2000-2006, the ERDF will have spent an estimated EUR 260 million on research, technical development and innovation and the information society. During the 2000-2006 period, Irish research and innovation capacity increased significantly, in particularly in the S&E region.
Similarly strong impacts can be observed in the field of human resources, which has been a vital area of ESF assistance since 1989. In the years preceding 2000, investment helped to boost education and skills levels, with a strong focus on young people while at the same time enhancing the employment prospects of the unemployed. Funding in 2000-2006 put more emphasis on responding to shortages through targeted supply-side initiatives in education and training. A good example of this development is the emphasis on in-company training and support for a number of lifelong learning schemes.
A backdrop for these programme achievements has nevertheless been a serious contraction in the Irish economy precipitated by the collapse in the real estate market, the crisis in the banking sector and the public finances. The economic downturn (which commenced in 2008) worsened during the course of both 2009 and 2010, necessitating a series of incremental budgetary steps seeking to improve the state of public finance.
As part of the emergency recovery package, Ireland requested a six-month extension in eligibility date for all of the above programmes (except for the EHRD OP and the EQUAL programme) allowing the mopping-up of remaining funds to proceed and for Ireland to maximise its draw-down of Structural Funds.
As already reported in 2008, ERDF payments had already reached the payment limit of 95.0 % for four of the programmes, i.e. PSOP, TA, BMW and S&E. Payments thus far represent 93.9 % of commitments for ESIOP — no payments were recorded during 2009. Closure packages were received for the 5 programmes in September

EN 66 EN
2010 and Commission services are presently carrying out the necessary quality control and consistency checks of the closure documentation.
Closure documents were received within the regulatory deadlines for all Irish programmes co-financed by ERDF. URBAN II Dublin Ballyfermot was received on 31 March 2010, whist all the rest including PEACE II, were sent on 30 September 2010.
ESF Final claims arrived in due time as scheduled. The Employment and Human Resources Development programme and the Southern & Eastern (S&E) Region programme have reached 100% consumption of which 95% were already paid. The Border, Midland & Western (BMW) has reached 98.3% consumption of which 90.7% was already paid.
The EHRD final report was accepted on 1/3/2011 but further work has to be done on the WUD by the Irish authorities.
The documents related to S&E and BMW need some clarification by the Irish auhorities concerning irregularities.
PEACE II
The ‘PEACE II’ programme covers Northern Ireland and the border regions ofIreland. It builds on the experience of the special support programme ‘PEACE I’(1995–1999) and exemplifies the practical support given by the EU to the peaceprocess after the Belfast Agreement. Initially PEACE II covered the period 2000-2004 but in 2004 it was decided to provide additional funding and extend theprogramme to 2006, bringing it in line with the other Structural Funds programmesin the rest of the European Union.
For the PEACE II programme, the ERDF contribution amounts to EUR 368 million. Further contributions are provided by ESF (EUR 194 million) and EAGGF (EUR 44 million). Payments under all Funds have reached their 95.0 % payment limit.
The closure process is ongoing. On the basis of the documentation received, it appears that the programme has overspent across all funds.
EAGGF
The revised EAGGF-Guidance section amounts to EUR 153.6 million. Cumulative EAGGF (Guidance) payments to the end of 2009 amount to EUR 148.9 million or 95.0% of the amount planned for the programming period 2000-2006. (No payments were carried out during 2009 as the 95.0% payment limit was already reached in 2008).
EAGGF Guidance will not contribute to the two-year extension of the PEACE II operational programme, jointly managed with Northern Ireland. Therefore the EUR 12.6 million EU contribution to the programme was not increased. Up to the end of 2009, total expenditure for the PEACE II programme was EUR 12.3 million.
Closure documents for the Irish objective 1 operational programmes were submitted to the Commission by the deadline of 30/9/2010 and are under treatment.

EN 67 EN
FIFG
Objective 1
The three Objective 1 programmes (Productive Sector, Southern & Eastern and Border, Midlands, Western) contain a total FIFG assistance of EUR 67.8 million.All threee programmes reached the payment limit of 95.0% at the end of 2009. Closure documents for all the programmes were received in due time in 2010 and the final FIFG narrative reports have been accepted by DG MARE. Analysis of the financial information of the programmes is in process. Final eligible FIFG uptake figures are therefore not available yet
PEACE II -Ireland
The total FIFG allocation to the Irish part of the programmes is EUR 2.7 million. No execution took place in 2009 as the 95.0% payment limit had already been reached before. Closure documents for the programmes was received in due time in 2010 and the final FIFG narrative report have been accepted by DG MARE. Analysis of the financial information of the programme is in process. Final eligible FIFG uptake figures are therefore not available yet
11.2. Community Initiatives
The final claim for the Irish EQUAL programme arrived on 30 March 2010. The total absorption rate of ESF represents 95.7% . An automatic decommitment of 1.4 ml. was made.
The final report was accepted on 15/12/2010 and the final payment was made on 11 May 2011 once all irregularities were reconciliated. The programme is thus closed.
11.2.1. Leader
The Ireland Leader+ programme was implemented with 22 Local Action Groups involved. The total expenditure of the Ireland Leader+ programme was EUR 74 million. The EAGGF contribution for 2000-2006 was EUR 46 million.
At the end of 2009, expenditure amounted to EUR 43.5 million, 94.5% of the initial programme budget.
Closure documents for the Ireland Leader+ programme were submitted on 31/3/2010and are under treatment.
11.2.2. Urban
The Dublin-Ballyfermot URBAN II programme is the only URBAN II Programme in Ireland. It was approved in December 2001, and amended in 2004 as a result of indexation. The ERDF will contribute a total of EUR 5.4 million to this programme, the total cost of which amounts to EUR 11.6 million. The final eligibility date of this programme was 31 December 2008 and was not extended as part of the recovery package. On the basis of the closure documentation received, the programme has under-spent.

EN 68 EN
11.3. Closure of the 1994-1999 programming period
The RAL is zero for ERDF 94-99, ESF 94-99 and EAGGF 94-99 programmes. The C.I. PESCA programme was closed at the end of 2008.

EN 69 EN
12. LATVIA
2000-2006 programming period
12.1. Objective 1
Latvia is implementing a Single Programming Document (SPD) with an ERDF participation of EUR 382 million and an ESF allocation of EUR 127.3 million out of EUR 626 million in total. The Programme Complement was last modified by the Monitoring Committee in December 2008 and accepted by the Commission in 2009. Payments for the ERDF and ESF reached the 95.0% payment limit in 2008 so no further payments before closure were possible.
In 2009 the Commission adopted an amending decision to the SPD to extend the final eligibility date to 30 June 2009, although effective implementation for most of the SPD was concluded in 2008. The Latvian Authorities submitted closure documentation for the SPD on 30 June 2010.
The SPD is aiming for ‘fast and regionally balanced sustainable economic development’ mainly by shifting into higher value-added production. According tothe monitoring data, the progress made so far in implementing the SPD has been good. The target levels for the main indicators have been attained to a great extent, including the impact indicators at the priority level.
The managing authority for the SPD is located in the Ministry of Finance. The paying authority is the treasury of Latvia and the audit body is a department in the Ministry of Finance. There is one monitoring committee. It includes participants from all state institutions involved and representatives of social and economic partners, planning regions and civil society.
The Latvian 2004-2006 Objective 1 programme partly contributed to the high growth rate and employment in Latvia until the end of 2007. On the negative side, the growth was accompanied by supply-side constraints leading to high price and wage growth and overheating. In the last quarter of 2008 the economy started to shrink drastically. In 2009, GDP declined by 18.0% while unemployment reached 17.1%.
The monitoring committees include participants from all state institutions involved and representatives of social and economic partners, planning regions and civil society. No major problems in the implementation of the SPD have been detected to date.
The FIFG share in the Single Programming Document for Latvia represents 3,89% (i.e. EUR 24.3 million). The 95.0% payment limit of Commission reimbursement was reached at the end of 2008. As no further reimbursement is possible before the programme is closed, there were no payments by the Commission in 2009 and 2010.
After the receipt of closure documents on 30 June 2010, the analysis of winding up declaration has been completed and the document was accepted by the Commission on 17 November 2010. For rest of the documents the request for complementary information was sent to the Latvian authorities therefore their assesment was not

EN 70 EN
finalised in 2010. The main measures implemented were scrapping of fishing vessels, investment in aquaculture and processing, investment in fishing ports and socio-economic measures for fishermen. In total 447 projects were completed during the programming period. All allocated FIFG funding have been entirely exhausted.
12.2. Community Initiatives
12.2.1. Equal
EQUAL Latvia was a successful programme in terms of reaching the set targets and financial performance.
The actual implementation of the programme was concluded in 2007.95% of the programme expenditure was paid in 2007.
The EQUAL Latvia closure package was submitted to the Commission on 11 June 2009. The programme was closed (payment of the final balance) on 19 October 2010.
12.2.2. Leader
Leader+ type measures were included in the Objective 1 programme under Priority 4: Promotion of Development of Rural Areas and Fisheries. The EU contribution for 2004-2006 amounted to EUR 2.3 million. The start of Leader+ type measures was delayed due to administrative and legal difficulties.
In December 2006, seventeen Local Action Groups were selected and selection of projects finished in October 2007 with contracts covering 100% of the finances available. In total 433 contracts were concluded during two rounds of selection. Implementation of the projects commenced in May 2008 and continued until September 2008. The implementation of Leader under the Single Programming Document ended in summer 2008 and continues under the EU Rural Development Programme 2007-2013 (separate from cohesion policy).

EN 71 EN
13. LITHUANIA
2000-2006 programming period
13.1. Objective 1
General
The Lithuanian Objective 1 Programme (Single Programming Document of Lithuania for 2004-2006) covers the whole of Lithuania as an eligible area. The programme was adopted by Commission Decision C(2004)2120 of 18 June 2004 and is co-financed by the ERDF (EUR 583.9 million), the ESF (EUR 176.2 million), the EAGGF (EUR 122.9 million), and the FIFG (EUR 12.1 million). The national funding consists of EUR 309.5 million of public funds and EUR 2.3 million of private financing. Thus, the Structural Funds provide EUR 895 million of a total budget of EUR 1207 million. The managing authority of the programme is the Ministry of Finance of the Republic of Lithuania.
The global objective of the programme is to strengthen the basis for long-term national economic competitiveness and to facilitate the transition to a knowledge-based economy. It consists of five priorities: socio-economic infrastructure (EUR 347.1 million, ERDF), human resources development (EUR 163.8 million, ESF), productive sector and services (EUR 222.4 million, ERDF), rural and fisheries development (EUR 122.9 million, EAGGF and EUR 12.1 million, FIFG), and technical assistance (EUR 14.5 million, ERDF and EUR 12.4 million, ESF).
Monitoring and annual review
No programme monitoring committee meetings were held during 2009 and 2010.
In 2009 and 2010 no specific annual review meetings between the Commission and the Managing Authority was arranged for the Single Programming Document of Lithuania for 2004-2006. The work related to the closure of 2004-2006 Structural Funds assistance advanced during the year and closure documents were submitted to the Commission by the end of September. Closure procedure is in well advanced and it is expected to be completed in 2011 with the payment of the balance.
Information and publicity
Lithuania has continued to implement a variety of Structural Funds publicity and information activities. The public internet portal www.esparama.lt, maintained by the Lithuanian Ministry of Finance, has developed into a central tool for providing the stakeholders with timely information on programme implementation.
Payments and programme results
By the end of 2009, 95.0% (EUR 554.7 million) of the total ERDF allocation (EUR 583.9 million) and 95.0% (EUR 167.4 million) of the total ESF allocation (EUR 176.2 million) had been paid out to Lithuania by the Commission

EN 72 EN
With regard to the FIFG measures, already by mid-2008 the Commission had paid 95.0% of the total FIFG allocations (EUR 12.1 million). The greatest share of the EU support had targeted the reduction of the Baltic fleet and the compensations related to these measures. Investments have been made into fisheries aquaculture and processing sector. The closure documents were received by DG MARE on 04.10.2011. The documents have been assessed; additional information and clarifications have been recently requested to the Lithuanian authorities. The final implementation report has been accepted.
The absorption rate of 95.0% of the total EAGGF-Guidance allocation (including the advance) was already reached in 2008, and as a result there were no payments in 2010.
The total amount of funding for projects implemented stands at EUR 1700 million of which EUR 932 million is from the EU. Development of social and economic infrastructure accounted for almost 40.0% of the funding. Among EU-10 Member States Lithuania has one of the highest levels of spending on energy efficiency. In terms of results, over 3 500 projects were implemented and in 2008 the GDP was 2.1% higher compared to a scenario without SPD interventions. More than 19 500 jobs were created.
13.2. Community Initiatives
13.2.1. Equal
The Lithuanian EQUAL programme proceeded without any difficulties. The main focus was on preparing for the closure of the programme. At the end of 2009, the rate of financial execution of the community funding for the programme was 95.0%. The managing authority presented the closure documents to the Commission on 30 March 2010. The closure letter to the Lithuanian Authorities has been sent on 22 December 2010 and the final payment has been executed on 4 May 2011.
13.2.2. Leader
Leader+ type measures are mainstreamed in the Objective 1 programme under Priority 4: Rural and Fisheries Development. The implementation of all selected projects under Leader (106 in total) was already completed in 2009.

EN 73 EN
14. LUXEMBOURG
2000-2006 programming period
14.1. Objective 2
Overall, 100% of the ERDF programme budget was allocated through grant agreements.
The programme monitoring committee met once in 2010, at the initiative of the Ministry of Economy, the managing authority of the programme. The Commission played an active part in the work of the committee. At this meeting was presented and adopted the final report.
The three documents for closure were received before the end of September: final report, final payment claim, and winding up declaration. Some observations about the winding up declaration were communicated to the Audit and Managing authorities.
The level of expenditure submitted for payment from the ERDF amounted to EUR 41.8 million, i.e. 95.0% of the ERDF allocation at the end of 2010.
14.2. Objective 3
The Objective 3 programme involves a total ESF contribution of EUR 31.7 million. Luxembourg did not manage to spend the total ESF allocations, so there will be decommitments. The absorption rate is 74%.
Further to the decision to suspend interim payments following the audit mission in June-July 2007, a 100%'s Article 4 (Regulation (EC) No 438/2001) verifications to all expenses was made by external auditors, The results of these verifications were analysed by the Commission and it was concluded that they comply with Article 4; all financial corrective measures related to Article 4 were taken into account. On 21 January 2010, the Commission sent a letter to the Luxembourg authorities to withdraw the suspension and to relaunch the interim payments
The Luxembourg authorities sent all closure documents on 6 October 2010. They were considered admissible. On 24 October 2010, the Commission sent a letter to the Luxembourg authorities concerning a technical correction in the final payment request and on the same day, the Commission sent a letter regarding the list of irregularities to be transmitted by the Member State.
During the annual meeting meeting between the Commission and Luxembourg on 8 December 2010, the closure of the 2000-2006 period was also on the agenda and some administrative errors already discovered in the closure documents (including an ineligible project in the winding-up declaration, lack of submission of the list of irregularities) were discussed and further detailed in a letter sent by the Commission on 3 March 2011 related to the remarks of the Commission on the final execution report

EN 74 EN
14.3. Community Initiatives
14.3.1. Equal
At the end of 2010, the rate of execution amounted to 73.1% (EUR 2.9 million).
Further to the decision to suspend interim payments following the audit mission in June-July 2007, a 100%'s Article 4 (Regulation (EC) No 438/2001) verifications to all expenses was made by external auditors, The results of these verifications were analysed by the Commission and it was concluded that they comply with Article 4; all financial corrective measures related to Article 4 were taken into account. On 21 January 2010, the Commission sent a letter to the Luxembourg authorities to withdraw the suspension and to relaunch the interim payments
The Luxembourg authorities sent all closure documents on 6 October 2010. They were considered admissible. On 24 October 2010, the Commission sent a letter to the Luxembourg authorities concerning a technical correction in the final payment request and on the same day, the Commission sent a letter regarding the list of irregularities to be transmitted by the Member State.
During the annual meeting meeting between the Commission and Luxembourg on 8 December 2010, the closure of the 2000-2006 period was also on the agenda and some administrative errors already discovered in the closure documents were discussed and further detailed in a letter sent by the Commission on 7 March 2011 related to the remarks of the Commission on the final execution report.
14.3.2. Leader
The programme involves total public expenditure of EUR 8.4 million. The EAGGF contribution was fully committed ( EUR 2.1 million). Total financial execution came to EUR 2.0 million, i.e.92.6% of the EAGGF amount committed .
In Luxembourg, four LAGs were selected, covering 90000 inhabitants, with a fifth LAG financed by national funds.
Closure documents were transmited to the Commission in March 2010; a pre-closure letter was sent in July 2010, resulting in the transmission of a final recovery order in November 2010.

EN 75 EN
15. HUNGARY
2000-2006 programming period
15.1. Objective 1
All Hungarian regions belong in 2004-2006 period to Objective 1. The payments for the 4 ERDF OP in Hungary reached the limit of 95% in 2008, 3 of which were nevertheless extended until June 2009. No payments were done in 2010.
The documents necessary for the closure were submitted in all cases on time. The closure procedure will be finalised at the beginning of 2011 for the Regional OP. For the other OPs the procedure has been interrupted awaiting complementary information from Hungarian Authorities on the final report and winding-up declaration and precise definition of the financial impact of irregularities and unfinished projects.
In general the objectives settled in the OPs were broadly achieved. However, even if all regions have grown, the gap between most developed and least developed regions has not decreased. The medium term impact of the grants to SMEs (companies surviving after 5 years) within the Economic Development OP arouse concern aboutthe sustainability of the investments financed. In contrast this OP allowed for the creation of 11.263 new jobs or safeguarded; GVA growth in supported enterprises was nearly EUR 500 million. Further 3000 jobs were created by the new touristic attractions within the Regional operational programme allowed for the creation of near 3000 jobs.
In addition to the large infrastructure CF/ISPA projects, ERDF supported the upgrade of 1073 km of national roads and 544 km of regional/local roads. ERDF also supported improved drinking water and waste water treatment facilities for respectively 20.477 and 17.208 new households.
Evaluations workshops on the results of the programmes and preparatory seminars and meetings for the closure were organised in 2010, including two Monitoring Committees in view of the approval of the final report.
ESF contribution to Hungary between 2004-2006 has been channelled through the following programmes:
– Human Resources Development Operational Programme (HRD OP) (2003HU051PO001)
– Operational Programme for Regional Development (OPRD) (2003HU161PO001)
The HRD OP contains 4 priorities (excluding technical assistance), three financed by ESF and one by ERDF. At the same time, there is one ESF priority in the OPRD, complementing the two ERDF priorities.
The main priorities of the Human Resources Development OP Supporting active labour market policies (Preventing and tackling unemployment, Developing the

EN 76 EN
Public Employment Service, Promoting the participation of women in the labour market and the reconciliation of work and family life), Fighting social exclusion by promoting access to the labour market, Promoting life-long learning policies (Developing skills and competencies necessary for lifelong learning, the content, methodology and structure of VET, the structure and content of higher education, Training - promoting job-creation and dev. of entrepreneurial skills, adult training system).
For the HRD OP
The MA requested an extension of the eligibility deadline until 30/06/2009. The closure documents have been received by the COM on time and are being analysed.The following amounts were paid from the ESF: EUR 366.168.888 (95% reached) out of which EUR 17.459.007,36 was paid in 2010.
For the OPRD
The main priorities of the For Regional Development OP Developing the human resources of the regions (Capacity building of local public administration and NGOs, Support for local employment initiatives, Strengthening co-operation of higher education institutions with local actors, Support of region-specific vocational training).
The closure documents have been received by the COM on time and are being analysed. The following amounts were paid from the ESF: EUR 50.984.157 (95% reached). No payments were made in 2010.
As at 31 December 2009, total payments made under measures co-financed by the EAGGF-Guidance Section (including the advance) amounted to EUR 297 million or 95.0% of the total Fund allocation for the period 2004-2006. For that reason no payment has been made in 2010. The Programme is now in the closure phase.
The FIFG share in ARDOP represents 2,4% (i.e. EUR 4,4 million). The total payment rate from the Commission reached 90.9% of the total FIFG allocation. FIFG was used exclusively for measure 2.1 “Structural assistance in the fisheries sector” under Priority 1: Establishment of competitive basic material production in agriculture. During the whole programming period 55 applications were approved; from that 51 were successfully completed. Aquaculture was the most popular measure and had 30 projects completed. The closure documents were submitted by 30 September 2010. The assessment of the documents is in the final stage of analysis.
15.2. Community Initiatives
15.2.1. Equal
The main priorities of the EQUAL Community Initiative Programme was to facilitate access to the labour market of those which feel difficulties of integrating, promote lifelong training and inclusive practices encouraging recruitment and maintenance to the use of those which suffer from discrimination or from treatment inequality in

EN 77 EN
industry, reduce the divergences between men and women and promote professional desegregation, help to integrate asylum seekers.
In order to facilitate the mainstreaming of the results of EQUAL, the MA requested an extension on the eligibility deadline until 30/06/2009. The closure documents have been received by the COM on time and are being analysed. The 95% ceiling has been reached and therefore no payments were made in 2010.
15.2.2. Leader
Hungary included a Leader+ type measure in the ARDOP under Priority 3 ‘Development of rural areas’. The objective of the measure was to strengthen the LEADER approach to local development by means of integrated regional development strategies organised and realised at local level in the form of partnerships. Overall, 70 local action groups were selected. The total Community contribution for this measure amounted to EUR 14.3 million. Given the resources committed, the measure has been outstandingly successful, as the amount contracted for the applications submitted (EUR 23.2 million) exceeded the initial amount planned for the programming period 2004-2006.

EN 78 EN
16. MALTA
2000-2006 programming period
16.1. Objective 1
Malta has one Single Programming Document (SPD) for the period 2004-2006, jointly co-financed by ERDF (6 measures), ESF (5 measures), EAGGF (2 measures) and FIFG (1 measure). The total Structural Funds' allocation amounts to EUR 63.2 million (EUR 46.7 million from ERDF, EUR 9.5 million from ESF, EUR 4.2 million from EAGGF and EUR 2.8 million from FIFG), supplemented by EUR 23.3 million of national contribution.
The ERDF share of payments made in favour of ERDF co-financed projects amounts to EUR 47.6 million, bringing the overall commitment for ERDF co-financed measures to 102% of allocated resources.
The last Monitoring Committee meeting approving the Final Report of the programme was held in July 2010. The implementation of the programme has reached its objectives. In total, 89 projects had been implemented, including 9 aid schemes. 373 enterprises benefitted from grants under the programme.
All documents necessary for the closure of the ERDF parts of the programme were submitted to the Commission on 30 September 2010, i.e. within the agreed deadline.
As regards implementation of the EAGGF, on 31 December 2009 total payments made under measures co-financed by the EAGGF-Guidance Section amounted to EUR 4.4 million (interim payments of EUR 3.7 million and advance payments of EUR 0.7 million, including national co-financing), thus attaining the payment limit of 95.0% for total eligible expenditure for the period 2004-2006 . For that reason no payment has been made in 2010. The Programme is now in the closure phase.
The total FIFG allocation committed to the sub-measures ‘Fleet’ and ‘Structures’ within the SPD for structural assistance in Malta under Objective 1 (2004-2006) amounted to EUR 2.8 million. The payment limit of 95.0% was reached in 2008. A final balance to the amount of EUR 120,000 was found to be paid at Closure, and EUR 22,000 to be de-committed. That translates into an execution rate of 99.2% for the Maltese FIFG budget. A smooth closure of the FIFG programme share could be prepared still in 2010.
16.2. Community Initiatives
16.2.1. Equal
All EQUAL projects finalised their training activities by the end of December 2007. The monitoring committee lats met in May 2009.The EQUAL Programme reached the ceiling of 95.0%.

EN 79 EN
17. NETHERLANDS
2000-2006 programming period
The Netherlands received a total Structural Fund contribution of EUR 2.8 billion between 2000 and 2006 from the ERDF, ESF, EAGGF and FIFG.
The final date for the eligibility of expenditure, normally set at 31 December 2008, was — at the request of the Dutch authorities — extended for the single Objective 1, four Objective 2, three URBAN and four LEADER programmes until 30 June 2009. For this extension, the Commission adopted a decision on 23 February 2009. This gave the regions and cities concerned an additional six months to implement the available Structural Funds allocations.
For ERDF and the EAGGF-Guidance, the closure documents were submitted within the requested time frame.
The final payment claims show a high absorption rate reaching or approaching hundred percent of the available funds for all the ERDF programmes. Following audits in 2005 and 2006, the Dutch authorities had agreed with the European Commission to adopt a national action plan for ERDF programmes. This national action plan led in 2010 to a final settlement between the Dutch Ministry of Economical Affairs, Agriculture and Innovation, the respective management authorities and the European Commission. The financial corrections which were to be implemented as a result of this settlement have been incorporated in the final payment requests. These payment requests are currently being analyzed as part of the closure exercise.
The annual review meeting was jointly organised by the Dutch authorities and the European Commission in November 2010. The progress of the implementation and the ex-post evaluation of the 2000-2006 programming period, prepared by the European Commission, were discussed. During 2010 the final monitoring committees for the 2000-2006 programmes have taken place and several official events have been organized to mark the end of this programming period.
17.1. Objective 1
The Flevoland province received phasing-out support under Objective 1 amounting up to EUR 131.9 million of which EUR 81.7 million from ERDF, EUR 33.6 million from ESF, EUR 10.3 million from EAGGF and EUR 6.2 million from FIFG.
The final payment request shows a full absorption of the ERDF funds and close to full absorption for EAGGF and FIFG. For ESF the absorption was close to 95.0%.
The closure documents received in September 2010 indicate total EAGGF payments reaching EUR 10.3 million, i.e. 99% of the EAGGF allocation.
The total FIFG allocation for Flevoland amounts to EUR 6.2 million. There were no decommitments. The total payment rate of the Commission reached 95 % of the FIFG allocation. Two measures were implemented, "fleet renovation and crew

EN 80 EN
management" and "Strengthening the competitiveness of the fishery sector". At the end of the programme 18 projects were completed. The closure documents were received on 29 September 2010. The assessment of the documents is ongoing.
17.2. Objective 2
The final payment requests of the four Dutch Objective 2 programmes show an absorption level of 98% for the four programmes combined. A realized amount of EUR 845 million has been declared out of a decided amount of EUR 859 million, hence a shortfall of EUR 14 million.
The absorption rates of the individual programmes are; 96.1% for Zuid, 98.4% for Oost, 99.8% for Noord and 97.4% for Stedelijke Gebieden.
The final payment requests of the different programmes reflect the outcome of the settlement of the national action plan. This correction amounted up to EUR 160 million (including the Objective 1 programme) on the total eligible costs, mainly impacting the programme Noord which was responsible for EUR 109 million.
17.3. Objective 3
The total available ESF allocation for the SPD amounted to EUR 1532 million, which had been committed by the end of October 2005. As all projects were terminated by the end of 2007, activities focused on preparing closure of the programme. No request was received to extend the final date of eligibility. The final implementation of the programme is estimated to arrive at full absorption (the 95.0% payment limit has already been reached).In 2010 closure documents were received and accepted except for the WUD. Futher work has to be done on the WUD by the Dutch authorities.
17.4. Fisheries outside Objective 1
The total FIFG allocation for the Netherlands amounts to EUR 32.7 million. The total payment rate of the Commission reached 80.3% of the total FIFG allocation. At the end of the programming period serious weaknesses were found by the Commission services in the management and control system and the payments were suspended. The Netherlands made an action plan to verify and correct these weaknesses. So far this resulted in a deduction of EUR 1.6 million applied by the Netherlands.
The programme resulted in assistance to 502 operations. The great majority of assistance was given under the measures: 44 (Operations of members of the trade), 12 (transfer to a third country/reassignment), 11 (scrapping) and 46 (innovative measures). The closure documents were received on 30 July 2010. The assessment of the documents is ongoing.
17.5. Community Initiatives
17.5.1. Urban
Three URBAN II programmes have been implemented in the Netherlands in Amsterdam, Heerlen and Rotterdam. The ERDF contribution for the programmes in

EN 81 EN
Amsterdam and Rotterdam is EUR 9 million each and in Heerlen EUR 12 million. The total eligible cost of the three programmes is EUR 84 million. The cities themselves are both managing authority and paying authority. Based on the final payment requests received in March 2010, the three Urban programme requested EUR 29.1 million out of the EUR 30.3 million available, i.e. an absorption rate of 96%. The Rotterdam programme has now been closed and both Amsterdam and Heerlen will be closed in the course of 2011.
17.5.2. Equal
The total available ESF allocation amounted to EUR 158.2 million. As all projects had ended by the end of 2007, activities focused on preparing closure of the programme. No request was received to extend the final eligibility date. The final implementation of the programme is estimated to show 87% absorption (at end of 2009 the rate was 76.4%). In 2010 closure documents were received and accepted except for the WUD. Futher work has to be done on the WUD by the Dutch authorities.
17.5.3. Leader
Four Leader+ programmes were implemented in the Netherlands in the 2000-2006 programming period (Randstad, Noord, Zuid and Oost). The closure documents received in September 2010 indicate total EAGGF payments reaching EUR 80.6 million, i.e. 98.5% of the EAGGF allocation.
17.6. Closure of the 1994-1999 programming period
ERDF
Closure of the ERDF programmes of the 1994-1999 programming period was already completed at the end of 2009.
ESF
Three ESF programmes remain open due to ongoing judicial proceedings.
As regards the Community Initiative Programmes (CIP), two programmes are still to be closed due to ongoing judicial proceedings. The Resider CIP was closed in 2009.
EAGGF
Closure of the EAGGF programmes of the 1994-1999 programming period was already completed at the end of 2008.

EN 82 EN
18. AUSTRIA
2000-2006 programming period
Between 2000 and 2006 Austria was allocated to a total Structural Fund contribution of EUR 1,782 million from the ERDF, ESF, EAGGF and FIFG. The ERDF allocation alone amounted to EUR 885.2 million.
18.1. Objective 1
For the only Objective 1 region in Austria (Burgenland) the ERDF allocation of EUR 181.5 million was committed from 2000 to 2006. Total ERDF payments by the Commission between 2000 and 2009 amounted to EUR 172.4 million representing 95% of commitments, the maximum percentage possible prior to closure. In January 2010, the Austrian authorities submitted the closure documents (final report, winding-up declaration and final payment claim) for this programme, and the Commission prepared the final payment (EUR 9.1 million) thereafter which was paid in January 2011. The final report included the 2008 annual implementation report as a separate chapter which was consequently assessed and accepted as part of the closure procedure.
No further meetings of the monitoring committee took place after its last meeting in June 2006, and any further consultations of the committee (inter alia, on the closure documents) were carried out by way of written procedure.
As regards the EAGGF-Guidance Section, the final payment of EUR 2 148 218 was made by the Commission for the Objective 1 priority for Burgenland. The total amount paid and committed for the 2000-2006 period amounted to EUR 43 684 352.
In the period 2000-2006, a total of EUR 57.4 million was committed and EUR 54.5 million was paid by the Commission (i.e. 95.0% of the total ESF contribution). The closure documents were received in due time
The total FIFG allocation for Burgenland amounts finally to EUR 0.2 million and the total payment rate from the Commission reached 77.6 % of the total final FIFG allocation. The programme resulted in assistance to 15 Projects. All assistance was given under measure 3.2 (Aquaculture), in particular to increase the profitability of the fisheries sector in Burgenland, with an improved processing and marketing. The closure documents were sent by 8 March 2010. The assessment of the documents is in the final stage of assessment.
18.2. Objective 2
The eight Austrian Objective 2 regions (Upper Austria, Lower Austria, Styria, Carinthia, Salzburg, Tyrol, Vorarlberg and Vienna) have been allocated to the an ERDF contribution of EUR 703.7 million which was committed between 2001 and 2006, and received the according ERDF contribution before end of 2009.
In 2010 the Commission reimbursed only a small amount EUR 0.86 million representing 0.12% of the total ERDF contribution for one programme (Vorarlberg),

EN 83 EN
and closed the programme for Vienna by a recovery of EUR 0.82 million. In total, the Commission reimbursed EUR 686.1 million (including final payments) between 2000 and 2010, which is equivalent to 97.5% of ERDF contributions allocated to the Austrian Objective 2 programmes. The remainder is partly due to de-commitments undertaken by the Commission, and/or under-utilisation of programmes taken account of at closure.
The closure documents for all programmes were formally submitted to the Commission between September 2009 and March 2010, and included the 2008annual implementation reports as part of each final report.
No monitoring committee meetings took place in 2010 but all necessary decisions (inter alia, on closure documents) were carried out by written procedure.
At the annual meeting on 16 November 2010 in Bregenz, the state of play of the closure of all programmes was discussed. Before the end of the year 2010 six of eight programmes (Lower Austria, Tyrol, Carinthia, Salzburg, Vienna and Vorarlberg) were fully closed, and closure of the remaining two programmes was under preparation
In the period 2000-2006, a total of EUR 27.5 million was committed and EUR 26 million was paid (i.e. 95.0% of the total ESF contribution). The closure documents were received in due time.The final closure payment for Carinthia (146.915,34 €) and Styria (467.676,02 €) were executed at the end of 2010
18.3. Objective 3
The closure documents for the objective 3 programme were received in due time
18.4. Fisheries outside Objective 1
The total FIFG allocation amounts to EUR 4.5 million. The total payment rate from the Commission reached 93.9 % of the total FIFG allocation. (EUR 4.2 million out of EUR 4.5 million). There have been no decommitments. There were two priority axes, ‘Aquatic resources, aquaculture, fishing ports, processing and marketing, inland fisheries’ and ‘Other measures’. The closure letter was sent on 2 August 2010 to the Austrian Permanent Representation.
18.5. Community Initiatives
18.5.1. Urban
There were two URBAN II programmes for Austria. The programme for Vienna received EUR 3.5 million and the one for Graz EUR 4.0 million from the ERDF. The total budget (including national co-financing) for Vienna was EUR 12.9 million and for Graz EUR 23.1 million. For both programmes, the final reports including the annual reports for 2008 were submitted in November 2009. Both programmes were fully closed in July 2010.
18.5.2. Equal
The closure documents were received in due time

EN 84 EN
18.5.3. Leader
The Leader+ programme for Austria was approved by Commission Decision C(2001) 820 of 26 March 2001 and amended by Decision C(2006) 4830 of 6 December 2006. The Austrian Leader+ programme covered 8 regions of Austria, excluding the urban area of Vienna.
The total EAGGF amount paid for the Leader+ programme amounted to EUR 74 879 475.53 for the whole period, including the final payment in 2010 of EUR 1 887 865.53. An amount of EUR 1 953 798.47 was decommitted in 2010.
During the programming period 2001-2006, total expenditure under the programme was initially foreseen to be EUR 164.30 million, including an EU contribution of EUR 76.80 million. In practice, total expenditure amounted to EUR 184 162 554.35, comprising an EAGGF contribution of EUR 74.8 million, national funds (including national public expenditure) of around EUR 29 346 951 and private financing of some EUR 79 936 127.
18.6. Closure of the 1994-1999 programming period
All programmes are closed
All Austrian Programmes could be fully closed in 2010 after the final decisions about the last open cases

EN 85 EN
19. POLAND
2000-2006 programming period
19.1. Objective 1
In 2004-2006, Poland received EUR 12.47 billion (EUR 8.27 billion Structural Funds and EUR 4.2 billion Cohesion Fund). At the end of 2010, payments for ERDF, ESF, FIFG and EAGGF taken together accounted for 94.84% of the total allocation for 2004-2006 or 7.97 billion EUR. Only final payments were still to be executed.
For ERDF 95% of allocation (4.72 billion EUR) has been paid, which means that no final payment for ERDF programmes was made in 2010. As the final date of eligibility for all operational programmes, except for the OP Technical Assistance and CIP EQUAL, was extended up to 30 June 2009, the closure documents were submitted in September-October 2010. Until the end of December 2010 the assessment of closure documentation for SOP Improvement of the competitiveness of the economy, Integrated regional operational programme and SOP Transport was ongoing and resulted in an interruption of the process in February 2011 due to questions related to the final report and winding up declaration. In the case of OP Technical assistance the closure letter proposing a small financial correction was sent. The assessment of closure documentation for ESF programmes was interrupted in the beginning of 2011 due to questions related to closure documents. Pending assessment of additional documents and clarifications received from Poland, CIP EQUAL will be closed by mid-2011 and remaining programmes - by the third quarter of 2011 at the latest.
For ESF the final date of eligibility of the Sectoral Operational Programme Human Resources Development and Integrated Regional Operational Programme (IROP) was extended to 30 June 2009. As far as financial execution of the ESF is concerned, the overall rate of execution in terms of payments reached the level of 95% and, in terms of contracts, – exceeded 100% of the allocation at the end of 2009..
The Sectoral Operational Programme Human Resources Development and CIP EQUAL demonstrated satisfactory progress in implementation throughout the whole programming period. However, the Human Resources Development OP was affected by corrective measures which will impact on the final payment. As far as the Integrated Regional Operational Programme (the ESF priority) is concerned, despite the slower pace of implementation in some regions the risk of underspending was successfully addressed. In 2010, the final Monitoring Committees took place, where consolidated results of implementation were presented and discussed. The ex-post evaluation of ESF programmes was finalised and fed into the discussion on the current ESF OP (2007-2013).
As far as other funds are concerned, payments for the EAGGF programme also reached 95.0%. 98% of the FIFG allocation was paid out to final beneficiaries. The payments for the FIFG executed by the Commission accounted for 88.1% of the total FIFG allocation.

EN 86 EN
4.124 projects were implemented in the framework of the Sectoral Operational Programme "Fisheries and Fish Processing 2004-2006". The most important measures from the point of view of the budget spent were: scrapping of fishing vessels, support to fish processing and market, fishing port facilities and aquaculture.
The closure documents were received by the Commission on 30 June 2010 and their evaluation is ongoing.
Structural Funds became one of the main pro-development sources of financing (in 2007, 35% of overall public spending). The main impact of the cohesion policy is expected after 2012, as a result of higher allocations of funds in the period 2007-2013 and expected accumulation of outputs after 2012.
The ex-post evaluations of Cohesion Policy implemented in Poland in 2004-2009 and the final implementation reports of the operational programmes allow to draw the conclusion that EU funds played a positive role in the socio-economic development of the country. Positive effects of interventions may be observed both at macro-economic level and at microeconomic level under respective strategic areas of support.
Macroeconomic impact
Cohesion Policy contributed to the increase of socio-economic welfare of Poland. Evaluations show that GDP level (in current prices) in the 2004-2009 period was higher by 3% on average in 2009 due to EU funds. Due to implementation of Cohesion Policy, the yearly average pace of GDP increase in Poland in the 2004-2009 period was higher by 0.4 percentage point. In 2009, in the period of world economic crisis, Poland was the only EU Member State to experience a GDP increase (+1.7%). It is estimated that half of this increase resulted from the implementation of Cohesion Policy.
The labour market interventions within Cohesion Policy contributed to the reduction of unemployment and increase of employment in Poland. In 2009 an increase in the employment ratio reached due to the interventions financed by Structural Funds ranged from 0.5 to as much as 2.6 percentage points, i.e. the average circa 200 thousand new jobs. By stimulating new employment, the policy contributed to the decrease of the unemployment level. In 2009, the unemployment level was lower by over 1 percentage point due to the EU funds.
Evaluations demonstrate that support provided under Cohesion Policy contributed to the increase of competitiveness and innovation of Polish enterprises and economy. Structural funds interventions contributed to the increase of spending on research and development in the economy, both in public and private sectors (without Cohesion Policy support, the share of R&D expenditure in GDP would decrease). In particular, an increase of innovation expenditure of enterprises as compared to 2003 was circa 6 percentage points higher than in a scenario without EU funds.
Cohesion Policy decreased the pace of inter-regional divergence processes. In addition, as compared to the GDP level and the level of competitiveness of regions, Cohesion Policy played a more important role in speeding up the development processes in regions with a lower level of development.

EN 87 EN
19.2. Community Initiatives
19.2.1. Equal
The eligibility period for EQUAL, until 30 April 2009, was not extended. In financial terms the level of expenditure declared to the Commission represented 102% of the total ESF allocation by the end of 2009.
CIP EQUAL principles, e.g. partnership, gender mainstreaming, transnational cooperation and innovation have been successfully transferred to the new programming period 2007-2013.
The last Monitoring Committee Meeting for CIP EQUAL took place in 2010, approving the final implementation report. .
Closure documents were submitted on time. While Poland had to provide additional intormaiton on the winding-up declaration, the implementation report was considered satisfactory. The final stage of the closure procedure is on-going.
19.2.2. Leader
As with other recently acceded Member States, a Leader+ type measure is mainstreamed in the EAGGF Objective 1 programme ‘Restructuring and modernisation of the agri-food sector and rural development’.

EN 88 EN
20. PORTUGAL
2000-2006 programming period
20.1. Objective 1
The Portuguese Community Support Framework III (2000-2006) received financial support under Objective 1 (with Lisbon and the Tejo valley region as a phasing out region) and consisted of twenty operational programmes. Out of the 20 operational programmes, seven covered each of the Portuguese regions individually and thirteen were cross-regional.
For operations included in the CSF III, as part of the response to the financial crisis, an extension of the expenditure eligibility date to 30 June 2009 was agreed for all operational programmes.
During the year 2010 there was no implementation activity just administrative in order to prepare the final reports, as well as the 2008 and 2009 annual implementation reports, the final expenditure certification and the winding-up declarations from the audit authority.
The final Monitoring Committee meetings were held during the first quarter of 2010 (exception of one OP "Administração Pública" held in December 2009), where the overall execution of each programme was discussed and the final reports were approved, as well as the two specific sections, for 2008 and 2009, as annual activity reports for those years. In few cases the consultation of the monitoring committees took the form of written procedure. Considered not to have any useful purpose, no annual meetings under article 34.2 of the regulation 1260/1999 were organised in 2010.
All the Portuguese CSF III 2000-2006 operational programmes, and the three URBAN Community Initiative Programmes in Portugal, completed their implementation period and the execution of the ERDF 2000-2006 programming period is globally satisfactory in financial and physical terms being the rate of execution above 100% (109%) with some overbooking in most of the operational programmes which allowed for substitution of potential irregular expenditure by other regular expenditure. This was the case of the PRIME operational programme showing 128% execution rate.
No financial transactions were carried out in 2010, for most of the programmes the ceiling of 95% of interim payments with the advance was reached in 2009 so no further intermediate payment claims were submitted by the Member State.
All the closure documents were submitted within the deadline (30th September 2010), the final reports were submitted first, as they were approved by the monitoring committees and the balance payment claims, with the final certification of expenditure and the winding-up declarations, were submitted close to the deadline but all in time according to the sending date.
EN 89 EN
No automatic decommitment procedures were initiated, as the ‘n+2’ threshold will be calculated at programme closure.
Several programmes are affected by irregularities reported by the Member State toOLAF (in application of Commission Regulation (EC) No 1681/94). In the run-up to closure of the programmes, initial arbitration made it possible to propose the closure of a number of cases to OLAF.
There were no financial transactions in 2010 as the seventeen operational programmes co-financed by the ESF reached the 95.0% payment limit in 2009. A total amount of 4.545 mio EUR was paid out of 4.748 mio EUR ESF total allocation..
As far as the FIFG is concerned, at the end of 2010 reimbursements amounted to EUR 221 million out of EUR 237 million, corresponding to 93.5% of the total FIFG appropriations to the eight operational programmes. With the extension to 30 June 2009 of the eligibility deadline for the height multi-funds programmes, the final execution is between 98 and 100% according the operational programme concerned.
As for the EAGGF Guidance Section, at the end of 2009 two out of nine programmes did not reach the 95.0 payment limit (according to Article 32(3) of Regulation (EC) No 1260/1999). The Norte programme (1999PT161PO017) reached the payment limit in 2010 by submitting a last interim payment application, while while no more applications were received for the the Technical Assistance programme (2000PT161PO001) whose execution rate reached only 42.1%. The 27 closure documents were submitted on time (30 September 2010). Check of the documents started in the last quarter of 2010.
Three recovery orders have been established for a total of EUR 17.8 million. The Norte, Centro and Agricultura e Desenvolvimento Rural programmes are touched by these financial corrections resulting from Commission audit missions.
20.2. Community Initiatives
20.2.1. Equal
The 95.0% payment limit of the programme budget was reached in 2009, so no financial transaction was carried out in 2010. An amount of EUR110 million was reimbursed. out of EUR115,8 million toal allocation..
No monitoring committee meetings were organised in 2009.
The managing authority continued its efforts to mainstream EQUAL best practice and took advantage of the extended eligibility period to make full use of the allocations available.
Efforts were also made to transfer knowledge, mainly by promoting the use of EQUAL innovation solutions by training operators (especially in the field of social development contracts and difficult areas).

EN 90 EN
20.2.2. Leader
By the end of 2008, the LEADER+ programme had already reached the 95.0% payment limit.
The closure documents for the programme have been submitted on time (30 September 2010) and their check started in the last quarter of 2010.
No automatic decommitment procedure was initiated, as the ‘n+2’ threshold will be calculated at programme closure.
The programme is affected by a small number of irregularities reported by the Member State to OLAF (in application of Commission Regulation (EC) No 1681/94). In the run-up to closure of the programmes, initial arbitration made it possible to propose the closure of four cases to OLAF.
20.2.3. Urban
There are three URBAN II Programmes in Portugal: Amadora, Lisboa and Porto-Gondomar. Overall, these programmes tackle serious socio-economic and environment problems in inner-city areas. The managing authorities for the programmes are at regional level, whereas the beneficiaries are different bodies of the corresponding municipalities and local public enterprises. As it has been indicated for the Objective 1 interventions, the Monitoring Committees of the three Programmes approved at the end of 2009 a request for extending the payments end date, which was approved by a global Commission Decision in March 2010 for all the Portuguese interventions. The Monitoring Committee met in January 2010 and approved the related final implementation reports.
20.3. Closure of 1994-1999 programming period
The closure is now complete for the 1994-1999 programming period for CSF II with a recovery of 18.5 M€ on Operational Programme "Modernização do Tecido Económico" related to irregular expenditure.
4 cases reported by the Member State to OLAF (in application of Commission Regulation (EC) No 1681/94) were still open in 2010 and were closed in the meantime in the database.
EN 91 EN
21. SLOVAKIA
2000-2006 programming period
Slovakia received a total EU contribution of over EUR 1 137 million for the programming period 2004-2006 under the CSF (i.e. funding from the ERDF, ESF, EAGGF and FIFG). This is split into three mono-fund operational programmes (two ERDF and one ESF) and one operational programme funded from the EAGGF and the FIFG respectively, as described below. There are also Objective 2 and Objective 3 single programming documents for the Bratislava Region
21.1. Objective 1
OP Basic Infrastructure
The programme benefitted from the extension of the eligibility period until 30 June 2009. In 2010, the monitoring committee approved the final implementation report via written procedure. The closure documents (final report, winding-up declaration, final payment claim) were formally submitted to the Commission in September 2010. The analysis of the closure documents by the Commission Services had not been fully completed by the end of 2010; the closure process has been interrupted. In total, EUR 401.2 million had already been paid out up to the end of 2008, representing 95.0 % of overall commitments. Therefore, in 2009, only clearing of pre-financing took place. There were no payments and no clearing of pre-financing in 2010. No ‘n+2’ decommitments were carried out during the period of implementation. There is an agreed 5.0 % flat-rate financial correction for this programme resulting from deficiencies in public procurement procedures. About 1130 projects (excluding technical assistance) were financed under the operational programme, including large environmental projects, road and railway projects, schools, hospitals, social care facilities, cultural facilities, information technology projects and regeneration of settlements.
OP Industry & Services
The programme benefitted from the extension of the eligibility period until 30 June 2009. In 2010, the monitoring committee approved the final implementation report via written procedure. The closure documents (final report, winding-up declaration, final payment claim) were formally submitted to the Commission in September 2010. The analysis of the closure documents by the Commission Services had not been fully completed by the end of 2010; the closure process has been interrupted. By the end of 2008, EUR 140.7 million had already been paid, representing 93.1 % of the overall commitment. There were no payments and no clearing of pre-financing in 2010. There is an agreed 10 % flat-rate financial correction for this programmeresulting from deficiencies in public procurement procedures. About 480 projects (excluding technical assistance) were supported under the operational programme, including investments in private companies and public infrastructure to support innovation, business incubators, industrial parks, research and development, energy efficiency and tourism
The Agriculture and Rural Development OP
EN 92 EN
The programme benefited from the extension of the eligibility period until 30 June 2009. In terms of financial resources, the programme accounts for 16 % of funds for programming period 2004 – 2006 under the CSF, with a contribution from the EAGGF Guidance section of EUR 181 million. The main intervention areas were investments in agricultural and processing holdings and support for promoting adaptation and development of rural areas. In 2010, two consultations by written procedure were held within the Monitoring Committee on the final report of the programme. No amount was paid out by the Commission as 95.0% of the total programmed amount had been reached by the end of June 2008. All closure documents were submitted to the Commission in due time, by the end of September 2010.
The level of contracting was 104% from the FIFG contribution to the operational programme and the FIFG funding was mainly used in aquaculture (52 %) and processing & marketing (44 %). The Commission made the last interim payment in 2008, reaching the 95.0% payment limit. All projects were completed by the end of 2008. Slovakia requested an extension until 30 June 2009 of the final date for eligibility of expenditure under the Agriculture and Rural Development Operational Programme. SK has used 100 % of its FIFG allocation (1,9 M€) for 20 operations. The closure letter was sent on 31/03/2011 and the final balance was paid out on 19/04/2011.
The ESF Human Resources OP benefitted from the extension of the eligibility period until 30 June 2009. There was no monitoring committee meeting in 2009; the last one took place in 2010. The Commission did not process any payments in 2010. In total (advance and interim payments) EUR 270.2 million was paid to the Paying Authority, representing 95.0 % of the total 2004-2006 allocation. Decommitments under the ‘n+2’ rule did not take place for this programme. The projects financed included active labour market policy development, improving the qualifications and adaptability of employees and job seekers, and increasing social inclusion and equal opportunities in the labour market. The closure documents were received on 6 October 2010 and the analysis of the documents is on-going.
21.2. Objective 2
SPD 2 programme Bratislava
The programme benefitted from the extension of the eligibility period until 30 June 2009. In 2010, the monitoring committee approved the final implementation report via written procedure. The closure documents (final report, winding-up declaration, final payment claim) were formally submitted to the Commission in September 2010. The analysis of the closure documents by the Commission Services had not been fully completed by the end of 2010; the closure process has been interrupted. In total, EUR 35.2 million had already been paid out up to the end of 2008, of which EUR 14.1 million was paid in 2008. This amounts to 95.0 % of overall commitments. Therefore, in 2009 only clearing of pre-financing took place under. There were no payments and no clearing of pre-financing in 2010. A decommitment under the ‘n+2’ rule took place in relation to the 2004 annual commitment. There is an agreed 5.0 % flat-rate financial correction for this OP resulting from deficiencies in public procurement. About 260 projects (excluding technical assistance) were financed

EN 93 EN
under the SPD, including investments in SMEs, public infrastructure in support of entrepreneurs, tourism and regeneration of settlements.
21.3. Objective 3
SPD 3 programme Bratislava
The programme benefitted from the extension of the eligibility period until 30 June 2009. SPD held no monitoring committee meetings in 2009; the last one took place in 2010. The Commission did not process any payments in 2010. In total (advance and interim payments), EUR 35.3 million was paid to the Paying Authority, representing 95.0 % of the total 2004-2006 allocation. Decommitment under the ‘n+2’ rule took place in relation to the 2004 and 2005 annual commitment. Projects financed included demand-driven and national projects for active labour market policy development, life-long learning development and support to R&D.The closure documents were received on 5 October 2010 (the analysis of the documents is in progress).
21.4. Community Initiatives
21.4.1. Equal
The eligibility period was extended until 30 June 2009. There were no monitoring committee meetings in 2009; the last one took place in 2010. The Commission did not process any payments in 2010. In total (advance and interim payments), EUR 21.1 million was paid to the Paying Authority, representing 95.0 % of the total 2004-2006 allocation. Decommitment under the ‘n+2’ rule did not take place in relation to EQUAL. The closure documents were received on 5 October 2010 and the analysis of the documents is on-going.

EN 94 EN
22. SLOVENIA
2000-2006 programming period
22.1. Objective 1
During 2010 the national authorities concentrated on the closure of the programme and funds. In line with the extension of the final date for eligibility of expenditure for the Slovene Single programming Document (SPD) 2004-2006 by six months until 30 June 2009, the Commission received the complete closure documents on 30 September 2010, and the final report was considered admissible by all Commission services involved. The assessment of the final report and other closure documents was completed only in 2011.
The ERDF interventions were to a large extent Lisbon-oriented and focussed on key areas such as improving the business environment for entrepreneurship, enhancing public economic infrastructure and related public services necessary for investment, transfer of knowledge and the promotion of entrepreneurship as well as fostering innovation and research. A preliminary analysis of the final report for the ERDF interventions showed that the majority of target values of the indicators fixed for the programme were achieved or exceeded. Over 7,900 jobs were created, and nine centres of excellence, 15 business zones across Slovenia and over 5,900 small and medium-sized enterprises received support. The impact of the ERDF was overall positive with a clear added value at macro economic level and, for instance, in terms of initiating research and development networks and organisational structures (technology centres/parks, clusters). The main portion of ERDF funds was invested in the Eastern and South-Eastern parts of Slovenia thus contributing to reduce the development disparities within the country.
The cumulative amount of ERDF payments made by the Commission until the end of 2010 (incl. advance payments) amounted to EUR 129.7 million equivalent to 95% of the total allocation to the programme. No automatic de-commitments under the “n+2” rule had to be made during its implementation, and it is expected that after assessment of the closure documents, the ERDF allocation will be fully absorbed.
As the final date for eligibility of expenditure was set on 30 June 2009, no meeting of the Monitoring Committee took place in 2010, yet the committee was duly consulted on the closure of the programme and endorsed the final report by written procedure.
The annual reports for 2008 and the first semester of 2009 were included in the final report submitted on 30 September 2010 and were declared admissible, though its assessment was continued in 2011. No annual meeting took place in 2010.
The Slovene SPD 2004-2006 contains a specific priority for technical assistance which was destined to ensure financial support from the ERDF and the ESF foreffective implementation of the development strategy. This included activities to facilitate the management, follow-up, control, monitoring and evaluation of the programme.

EN 95 EN
The eligibility period was extended until 30 June 2009. The payments for the ESF share of the programme reached the 95.0 % payment limit (including advance payments) before the beginning of 2009. All closure documents were submitted to the Commission in due time by the end of September 2010. The expected level of reimbursement at closure is 98.6%.
As regards financial execution of the EAGGF-Guidance section, the Slovenian Objective 1 programme already reached the 95.0% payment limit for the 2004-2006 period in 2008, amounting to total payments of EUR 22.4 million. Therefore no payments were made in 2010.
The total FIFG allocation within the SPD for structural assistance in Slovenia under Objective 1 (2004-2006) amounts to EUR 1.8 million, of which an amount of EUR 1.5 million was certified before the end of 2008. Legally binding commitments were reported to have covered the whole FIFG allocation. The payment limit of 95.0% was reached; payments to the Member State amounted to EUR 1.7 million. The latest statement of expenditure showed EUR 1.9 million spent for the Community share, which is an ‘overbooking’ in case some of the expenditure is found not to be eligible at closure.
In fact EUR 0.4 million, or possibly more, risks having to be recovered and decommitted at closure due to the sale of the company to which the aid was granted, the largest beneficiary of FIFG aid under the Slovenian SPD.
The aforementioned risk could be averted by explanations given at Closure, and the remaining 5% of the budget were prepared still in 2010 for payment of the final balance thsu bringing the execution rate of the Slovenian FIFG budget to 100%.
22.2. Community Initiatives
22.2.1. Equal
The closure documents were submitted to the Commission within the deadline, on 31 March 2010. The programme was closed in March 2011 with a recovery in the amount of 1 million EUR. The reimbursement rate at the end of the programme was 70%.

EN 96 EN
23. FINLAND
2000-2006 programming period
For the 2000-2006 period, Finland was allocated EUR 2124 million from the Structural Funds, of which approximately 60.0% ERDF, 26.0% ESF, 13.5% EAGGF and 0.5% FIFG. The funds were allocated to two Objective 1 programmes, three Objective 2 programmes, two Objective 3 programmes, one FIFG programme, nine IINTERREG programmes, one URBAN programme, one LEADER programme and one EQUAL Community Initiative programme.
23.1. Objective 1
The Northern and Eastern Finland Objective 1 programmes did not have any ongoing activity in 2010. At the national level, EU funds were fully committed to projects and approximately 100.0% of EU funding was paid to final beneficiaries. At the Commission level, 100.0% of the programme funds were committed by the end of 2007 and 95.0% of programme funds had been paid to Finland, including advance payments. No ‘n+2’ decommitments were made for any of the programmes.
No monitoring committee meetings were organised for the two programmes in 2010.
The quantitative and horizontal objectives set for the programmes were achieved. The programmes helped to create nearly 40 000 jobs and 8300 enterprises. Over 250000 people participated in ESF measures. In addition, the programmes strengthened the role of regions, fostered regional identity and responsibility for local development, improved multi-annual strategic planning, and promoted partnership and cooperation between the different levels of public administration and other stakeholders. New methods and models were created in the field of employment and education and training policies
At the closure of the programmes, an amount of EUR 129.3 million or 99.9% of the total EAGGF for the programme was paid out for the Eastern Finland programme, EUR 0.121 million was decommitted at the closure.
For Northern Finland programme EUR 69.9 million was paid out at the closure, corresponding to 96.9% of the total EAGGF financing for the programme. EUR 2.3 million was decommitted at the closure.
The Northern and Eastern Finland Objective 1 programmes did not have any activity in 2010. EU funds were fully committed to projects and approximately 100.0% of EU funding was paid to final beneficiaries. 95.0 % of programme funds had been paid to Finland, including advance payments. No ‘n+2’ decommitments were made for any of the programmes. In both programmes support was allocated mainly to inland fishing measures including ice-fishing, followed by processing and marketing measures. The closure documentation was submitted on 25th June 2010 for the Eastern program and on 30th June 2010 for the Northern program. The analysis is ongoing.

EN 97 EN
23.2. Objective 2
The three Finnish Objective 2 programmes for Southern Finland, Western Finland and the Åland Islands did not have any ongoing activity in 2010. At national level, over 100.0% of EU funds were committed to projects and 100.0% of EU funding was paid to final beneficiaries in Southern and Western Finland, and, for the Åland Islands, the funds are virtually fully committed and payment levels about 93.0%. At Commission level, 100.0% of the programme funds had been committed by the end of 2008 and 95.0% of programme funds paid to the national authorities, including advance payments. The programmes had no ‘n+2’ decommitments.
The Southern and Western Finland programmes helped to create nearly 40000 jobs and over 7500 enterprises. Over 180000 people participated in ESF measures. The horizontal targets for equality, environmental sustainability and information society were reached, apart from gender equality projects in Southern Finland, where only 50.0% of the target was met. Due to very ambitious target setting, the target for creating new enterprises will only be partly met: 50.0% for Western Finland and 57.0% for Southern Finland. The Åland Islands Objective 2 programme helped to create around 200 new jobs and 30 new enterprises.
No monitoring committee meetings were organised for the Finnish Objective 2 programmes in 2010.
Extension of 2000-2006 programming period
Because of the global financial crisis, the Commission decided to give the Member States more time to finalise the programming period 2000-2006. Finland applied to extend the programming period until 30 June 2009. The remaining resources (approximately EUR 38.5 million) were budgeted again and there were about 160 new projects.
23.3. Objective 3
Budgeted ESF funding for Finland’s Objective 3 programmes, including the Åland Islands, totalled EUR 436.6 million. Finland applied for the eligibility period for the Mainland programme to be extended until 30 June 2009. By the end of 2009, the payment limit of 95.0% was reached for the mainland programme. No extension was requested for the Åland programme, which reached 88.8% level of payments. About 540000 people in total participated in the activities funded by Objective 3 programmes. The Mainland programme helped to create 9114 new enterprises and 21040 new jobs.
The monitoring committee for the mainland Finland programme met on 15 April 2010 to adopt the final report. The annual review meeting was held in Helsinki on 11 March 2010. The issue relevant to the Objective 3 programme was the progress of the closure process and expected delivery of the final report. The closure documents for the Mainland programme were submitted in June 2010. Those for the Åland Islands programme were submitted in March 2010

EN 98 EN
23.4. Fisheries outside Objective 1
The programme did not have any activity in 2010. EU funds were fully committed to projects and approximately 100.0% of EU funding was paid to final beneficiaries. 95.0% of programme funds had been paid to Finland, including advance payments. Support was mainly given to processing and marketing measures followed by fishing port facilities and collective actions. No ‘n+2’ decommitments were made for the program. The closure documentation was received on 1 October 2010. Analysis is ongoing.
23.5. Community Initiatives
23.5.1. Equal
Finland had decided to run down the EQUAL programme according to the original schedule, and no prolongation of the eligibility period was requested. Thus there were no operations running in 2010. The final payment level was estimated to be 94.0%. Finland submitted the closure documents in March 2010Leader
In 2001, the Commission approved a Leader+ programme for Finland. Twenty-five Local Action Groups (LAGs) were selected and are supported by a national network.
At the closure of the programme, an amount of EUR 51.3 million or 91.0% of the total EAGGF funding was paid out, while EUR 5.0 million were decommitted.
Overall, the Leader+ programme has reached or exceeded its targets. Only the overall employment target has not been achieved, but employment of women and young people has exceeded the expected level. All in all 4612 projects were financed. The majority of the projects were non-farm-related investment in enterprises. The Leader+ programme provided a good complement to the other EU-financed programmes on rural areas.
23.5.2. Leader
In 2001, the Commission approved a Leader+ programme for Finland. Twenty-five Local Action Groups (LAGs) were selected and are supported by a national network.At the closure of the programme, an amount of EUR 51.3 million or 91.0 % of the total EAGGF financing was paid out, while EUR 5.0 million was decommitted. Overall, the Leader+ programme has reached or exceeded its targets. Only the overall employment target has not been achieved, but employment of women and young people has exceeded the expected level. All in all 4612 projects were financed. The majority of the projects were non-farm-related investment in enterprises. The Leader+ programme provided a good complement to the other EU financed programmes on rural areas
23.5.3. Urban
The Helsinki-Vantaa URBAN II programme is the only one in Finland. The ERDF will contribute a total of EUR 5.4 million to this programme, for which the total eligible cost amounts to EUR 20.4 million. The managing authority for the programme is the City of Helsinki and the functional day-to-day management is delegated to URBAN Helsinki-Vantaa.
EN 99 EN
The URBAN programme in Helsinki/Vantaa did not have any ongoing activity in 2010.
23.6. Closure of the 1994-1999 programming period
All Finnish Structural Fund programmes from the 1994-1999 programming period were closed before 2006.

EN 100 EN
24. SWEDEN
2000-2006 programming period
General Objectives 1 and 2
The two Objective 1 programmes for Sweden, Norra Norrlandsregionen and Södra Skogslänsregionen, cover 65% of Sweden’s land area but only 11% of the total population. The funding of the programmes accounts for 33% of the total allocation from the Structural Funds 2000-2006 in Sweden. When including national public and private participation, the Structural Funds generated assistance of EUR 2100 million through the Objective 1 programmes.
The four Objective 2 programmes, the North, West, South and the Islands programmes, cover approximately 16% of the Swedish population. The funding for the programmes represents 18% of the total allocation from the Structural Funds 2000-2006 in Sweden. When including national public and private participation, the Structural Funds generated assistance of EUR 1500 million through the Objective 2 programmes.
The Swedish programmes (all funds) created more than 110 000 new or preserved jobs and more than 26000 new companies.
There were no monitoring committee meetings in 2009 and 2010. Annual implementation reports for 2008 for three programmes were approved in written procedure by the Monitoring Committees and accepted by the Commission at the end of 2009. Annual implementation reports for 2008 for the remaining programmes were included in the final reports, submitted end March 2010. Activities in 2010 were dominated by the closure of the 2000-2006 programmes. Closure documents for all programmes were submitted to the Commission end of March 2010
24.1. Objective 1
ERDF, ESF and EAGGF-Guidance Section
By the end of 2009, the Commission had already paid out 95% of the total ERDF budget, 94.0% of the total ESF budget and 95.0% of the total EAGGF budget. No decommitments following the ‘n+2’ rule were necessary in 2010. Theclosure is carried out by fund and is progressing according to plan. Financial closure is expected in 2011.
The ERDF contributed to improving the competitiveness of SMEs and increasing cooperation between them. The support for R&D activities in SMEs and research centres contributed to raising the expenditure on R&D in the regions. It also strengthened local partnerships.
The EAGGF contributed to the development in the farm-, forestry and reindeer sector (e.g: modernisation, processing and marketing, training) and to rural development measures such as small scale tourism, services, village development

EN 101 EN
and conservation of rural heritage and last but not least environmental protection measures connected to agriculture and forestry as well as animal welfare.
24.2. Objective 2
By the end of 2009, the Commission had already paid out 95% of the total budget. The closure of the programmes is carried out by fund and is progressing according to plan. By the end of 2010, the payment of the final ERDF balance had been carried out for one of the Objective 2 programmes (the Islands programme), with the remaining expected to follow in 2011.
The ERDF helped to adapt development to the requirements of global competition. It contributed to a substantial increase in expenditure on R&D, the development of advanced services and scientific and cultural exchanges, improving the business environment and stimulating knowledge-driven development.
24.3. Objective 3
The available ESF allocation for the SPD amounted to EUR 780 million for the period 2000-2006. By the end of 2009, 94.0% of the total ESF budget had been paid out by the Commission. The closure documents were submitted in March 2010. The closure is expected to be finalised in 2011.
Almost 48000 projects were implemented in the programming period and most of the targets set were reached. The number of participants exceeded the targets for all priorities, amounting to a total of about 1.7 million persons. The targets for the number of persons who started a company and the number of people at work six months after participating in a project were not fully reached. Nonetheless, the programme showed good overall results.
24.4. Fisheries outside Objective 1
The total FIFG allocation to the Swedish fisheries programme outside Objective 1, including the reserve, is EUR 65 million. The programme had a rather low level of implementation. There were decommitments for four consecutive years in application of the ‘n+2’ rule. In total, the programme has so far been reduced by EUR 11 million. The financial execution reached 86.5% (EUR 46.7 million out of EUR 54 million). Sweden submitted the closure documents in April 2010. The closure procedure has reached an advanced phase of analysis. The Swedish final payment claim amounts to EUR 45.5 million. The main measures in the programme were scrapping of vessels, processing and marketing, innovative measures/pilot projects, fishing port equipment, protection of aquatic resources, collective investments, and renewal and modernisation of the fleet.
24.5. Community Initiatives
24.5.1. Equal
The rate of financial execution of the ESF part of the programme already reached the 95.0% payment limit in 2008.. Three monitoring committee meetings and an annual review meeting were held in 2009. The closure documents were submitted in March 2010. The closure is expected to be finalised in 2011.

EN 102 EN
Many of the experiences from the EQUAL programme, especially when it comes to partnership, innovation, transnationality and ways to influence system and policies, have been mainstreamed in the 2007-2013 ESF operational programme.
24.5.2. Leader
In 2001, the Commission approved one Swedish Leader+ programme. Total support from the EAGGF-Guidance Section amounted to EUR 41.2 million. In total, twelve Local Action Groups were selected. The implementation of the programme reached its end in 2008. By the end of 2008 approximately 116.0% of the total EAGGF budget for 2000–2006 had been allocated to projects. By the end of 2009 the Commission had in total paid out EUR 39.2 million (of which EUR 2.8 million as advances), an amount equivalent to 95.0% of the total EAGGF budget. No automatic decommitment needed to be executed. Payment claims presented to the Commission up to the end of 2009 amounted to EUR 38.2 million. The final report has been accepted in December 2010 and the financial closure procedure will be finished in 2011. The final amount accepted beginning of 2011 is 37.977.806,42 € = 92,15 % of the total financial plan.
24.5.3. Urban
The Göteborg URBAN II programme is the only URBAN programme in Sweden. The funding for the programmes represents 0.2% of the total allocation from the Structural Funds 2000-2006 in Sweden. When including national participation, the Structural Funds generated assistance of EUR 16 million through the URBAN programme. The programme strategy has a coherent approach combining entrepreneurship, infrastructure improvement and equal opportunities. The programme reached 94.7% of payments in 2009 and the ‘n+2’ rule was met. The annual implementation report for 2008 was included in the final report, submitted end of March 2010. The closure of the programme is progressing according to plan with financial closure expected in 2011.
24.6. Closure of the 1994-1999 programming period
The last programmes from the budget period 1994-1999 were already closed in 2004.

EN 103 EN
25. UNITED KINGDOM
2000-2006 programming period
25.1. Objective 1
The ERDF provided a total of EUR 3 970 million (excluding Peace II programme) to Objective 1 programmes in the United Kingdom during the programming period. FIFG support was available in five Objective 1 programmes, for a total of EUR 94.3 million.Closure documents for all FIFG programmes were received in due time in 2010. Four final narrative reports of FIFG Objective 1 programmes have been accepted by DG MARE. Analysis of the last final narrative report, as well as the financial information of all 5 programmes is in process. Final eligible FIFG uptake figures are therefore not available yet.The ESF provided a total of EUR 1 886 million to Objective 1programmes in the United Kingdom during the programming period (including the Northern Ireland BSP programme).
The total ERDF amount paid out in 2010 was EUR 71.7 million.
All the final claims for UK Objective 1 arrived in due time as scheduled. The total average consumption was 92% of the total ESF allocated for the 2000-2006 programming period.
Automatic decommitments were made for a total of EUR 77 million. in 2010 and EUR 27million. in 2011. The closure process is underway for the English programmes, after the irregularities reconciliation was made. Concerning Scotland further clarifications are still needed concerning irregularities.
For the EAGGF, the total amount (excluding PEACE II) paid by the end of 2009 was EUR 344 million (95% of the scheduled budget for the 2000-2006 programming period). Closure documents for the UK objective 1 operational programmes were received by the deadline of 31/3/2010 (3 programmes) or 30/9/2010 (3 programmes). The documents are under treatment.
Assistance was provided through five Single Programming Documents and two Operational Programmes. Three of the Single Programming Documents concern the English regions of Cornwall and the Isles of Scilly, Merseyside and South Yorkshire; the other two Single Programming Documents concern Wales (West Wales and The Valleys) and Scotland (transitional programme for Highlands and Islands). Each programme covers four to six priority areas, grouped around five main themes: support for small and medium-sized business, support for business modernisation, community economic regeneration, human resource development and development of strategic infrastructure.
The two Operational Programmes under the Northern Ireland Community Support Framework are funded by all four Structural Funds. They are: ‘Building Sustainable Prosperity’ (BSP), a transitional Objective 1 programme, and the EU Programme for Peace and Reconciliation in Northern Ireland and the Border Region of Ireland (‘PEACE II’ programme 2000–2006).

EN 104 EN
Extension of the final date of eligibility of expenditure until 30 June 2009 was given for West Wales and the Valleys, Highlands and Islands of Scotland and the BSP Operational Programme of Northern Ireland, due to the impact of the 2008 financial crisis.
PEACE II
The ‘PEACE II’ programme covers Northern Ireland and the border regions of Ireland. It builds on the experience of the special support programme ‘PEACE I’ (1995–1999) and exemplifies the practical support given by the EU to the peace process after the Belfast Agreement. Initially PEACE II covered the period 2000-2004 but in 2004 it was decided to provide additional funding and extend the programme to 2006, bringing it into line with the other Structural Funds programmes in the rest of the European Union.
No interim payment claims were received for the PEACE II programme for the ERDF in 2010. An extension of the final date of eligibility until 30 June 2009 was given for the PEACE II programme.
The final claim for the PEACE II programme arrived in time as scheduled. The absorption was 100% of the total ESF funding for the period 2000/2006 of which 95% was already paid.
The analysis of the documents is finished except for the OLAF reconciliation where some more clarifications are needed concerning irregularities.
The total FIFG allocation for Northern Ireland is EUR 0.8 million. No execution took place in 2009 as the 95.0% payment limit had already been reached. Closure documents for the programme were received in due time in 2010 and the final FIFG narrative report have been accepted by DG MARE. Analysis of the financial information of the programme is in process. Final eligible FIFG uptake figures are therefore not available yet.
25.2. Objective 2
The ERDF provided a total of EUR 4 526 million and the ESF a total of EUR 526.8 million for Objective 2 programmes in the United Kingdom. The funds were implemented through fourteen Single Programming Documents. Nine programmes covered the English regions of West Midlands, Yorkshire and the Humber, East Midlands, North East of England, North West of England, East England, South East England, South West England and London; three covered the regions of South of Scotland, East of Scotland and Western Scotland; one concerns East Wales and one Gibraltar. Each programme covered an average of three priority areas, grouped around three main themes: developing diverse, dynamic and competitive business bases, strategic spatial development, and community regeneration and economic and social development. The UK Objective 2 programmes were adopted in 2001, meaning that increasing levels of activity and progress were not registered until 2003. The total amount of ERDF paid in 2010 was EUR 24.6 million.
EN 105 EN
Extensions of the final date of eligibility of expenditure until 30 June 2009, due to the impact of the 2008 financial crisis, were given for East Wales, Gibraltar, and Eastern, Western and South Scotland.
The total ESF amount of interim claim paid out in 2010 for Western Scotland Objective 2 is EUR 16.5 million. The final claims for all UK Objective 2 programmes arrived in due time as scheduled. The total average consumption was 92% of the total ESF allocated for the 2000-2006 programming period. Automatic decommitments were made for a total of € 59 ml. in 2010. The analysis of the documents is finished but the final reports are not yet approved Overall summary of the 2000-2006 period
The final eligibility dates for PEACE II, BSP Northern Ireland Objective 1, the Welsh and Scottish Operational Programmes were extended to 30 June 2010. and all closure packages were received by that date.
All English ESF and the two GB EQUAL programmes retained the original final eligibility date of 31 December 2008 and closure packages were received by end of March 2010
On 31 March 2010, the Commission received all closure-related documents for those UK and Irish programmes for which the final date of eligibility had not been extended. These included all English programmes, URBAN II Clyde Waterfront and URBAN II West Wrexham. In the case of Ireland, the closure package sent was that of URBAN II Dublin Ballyfermot. The closure package for Northern Ireland "Building Sustainable Prosperity" had been sent in August 2009.
The remainder of the closure packages for the UK and Ireland were sent on 30 September 2010. For the UK these included Highlands & Islands, South of Scotland, East of Scotland and Western Scotland; West Wales and the Valleys and East Wales as well as Gibraltar and PEACE II. In the case of Ireland the closure packages covered the Productive Sector OP, the Technical Assistance OP, the Economic and Social Infrastructure OP, the Southern and Eastern Ireland OP and the Borders, Midland and Western OP.
The Gibraltar programme was closed on 20 December 2010.
25.3. Objective 3
The ESF provides a total of EUR 4948 million for Objective 3 programmes in Great Britain, implemented through one Community Support Framework and three Operational Programmes: England (EUR 4290 million), Scotland (EUR 520 million) and East Wales (EUR 138.0 million).
The programmes were implemented through five policy fields: active labour markets, equal opportunities and social inclusion, lifelong learning, adaptability and entrepreneurship and gender equality. The English OP alone supported about 6630 projects and helped more than 5.26 million people through a range of employability, training, advice and guidance activities. Almost half a million unemployed or inactive participants gained jobs and 1.4 million participants gained qualifications.

EN 106 EN
After a formal suspension of the Objective 3 Scotland Programme in 2008 and after the action plan had been implemented by the Scottish Authorities, the audit problems were solved end 2009. An Interim payment was then paid out for Scotland Objective 3 of EUR 107.6 ml in 2010.
All the closure documents for the three programmes were received in due time.
The English Objective 3 programme consumption was 92% of the total ESF allocated for the 2000-2006 programming period and an automatic decommitment was made for 214.4M
The East Wales Objective 3 programme consumption was 94.7 of the total ESF allocated for the 2000-2006 programming period and an automatic decommitment of 9.1 ml. was made.
The Scottish Objective 3 programme consumption was 89.1% of the total ESF allocated for the 2000-2006 programming period and an automatic decommitment of 28.8 ml. was made.
The analysis of the documents is finished and some clarification is still needed concerning irregularities
25.4. Fisheries outside Objective 1
The UK FIFG outside Objective 1 programme was closed in 2008; the end date of eligibility was 30 April 2009. DG MARE accepted the final narrative report of the progamme in March 2011, the analysis of financial information is in process. The total FIFG allocation to the programme was EUR 88.9 million following the last decommitment in 2008 of EUR 4.3 million of the 2005 commitment. Total declared FIFG expenditures amount 77,2 MEUR, i.e. only 61% of the original allocation of 125,5 MEUR. Final eligible FIFG uptake figures are not available yet.
The most important measures were processing and marketing (35.3% of FIFG committed), scrapping (19.8% of FIFG committed), operations by members of trade (15.1% of FIFG committed) and fishing port facilities (16.4% of FIFG committed).
25.5. Community Initiatives
25.5.1. Equal
The UK has two EQUAL programmes: Great Britain (GB) and Northern Ireland (NI).
The closure package for N.I. Equal programme and UK Equal programme were sent in due time. The documents were analysed and accepted.
The N.I. Equal programme is closed, a final payment of 1.157.192€ was made on 16/12/2010 and the closure letter was sent to the MS on 22/12/2010. The total consumption is 92.9% of the total ESF allocated for the 2000-2006 programming period and an automatic decommitment of 0.8 M.was made.
EN 107 EN
The UK Equal programme closure is underway. All documents have been accepted and a final payment of 25.010.727€ is proposed.
25.5.2. Leader
The UK has four Leader+ programmes: England, Northern Ireland, Scotland and Wales with fifty-five Local Action Groups. The total cost of the four programmes amounts to EUR 266.0 million, of which the EAGGF-Guidance Section contributes EUR 115.0 million.
By the end of 2009, a total amount of EUR 109.4 million was paid (95% of the total budget for the 2000-2006 programming period).
All the programmes reached their ‘n+2’ targets.
The extension of the final date of eligibility of expenditure until 30 June 2009 was requested in December 2008 for Leader+ Northern Ireland, due to the impact of the 2008 financial crisis.
Closure documents for the UK Leader+ programmes were submitted by the deadline of 31/3/2010 (3 programmes) or 30/9/2010 (Northern Ireland Leader+ programme). The Leader+ England programme was closed at the end of 2010. For the other UK Leader+ programmes, the closure documents are under treatment.
25.5.3. Urban
In the UK, the ERDF supported eleven programmes under the URBAN II Community Initiative, eight of them in England, one in Wales, one in Scotland and one in Northern Ireland. These programmes proposed innovative development models for the economic and social regeneration of the areas concerned, and finance projects to this end. Partnership in design, selection and implementation of projects was a key feature of the URBAN II programmes.
The total ERDF support allocated to all 11 programmes was EUR 126.2 million. In2010, total payments to URBAN II programmes reached EUR 11.6 million (the average absorption rate for all programmes reached 92 %).
25.6. Closure of the 1994-1999 programming period
All ERDF programmes are closed
All ESF programmes were already closed at the end of 2008.
All EAGGF programmes are closed.

EN 108 EN
Part 3: List of Major Projects
A list of major projects for the 2000-2006 programming period was included in Part 3 of the Commission Staff Working Document accompanying the 18th Annual Report on the Implementation of the Structural Funds (COM(2007) 676), as amended in Part 3 of Commission Staff Working Document accompanying the 20th
Annual Report on the Implementation of the Structural Funds (COM(2009) 617) and the Commission Staff Working Document accompanying the 21st Annual Report on the Implementation of the Structural Funds (COM(2010) 587). That list remains valid and can be consulted for further details. There were no major projects decisions in 2010.

EN 109 EN

EN 110 EN
Part 4: Financial Figures
Financial implementation 2010: Objectives 1-3
Sum of all transactions, up to 2010, since the beginning of the programming period 2000-2006 Financial year: 2010
Country ERDF ESF EAGGF FIFG Total SF ERDF ESF EAGGF FIFG Total SF
1.Decided 843,903,942.00 1,045,114,317.00 41,805,665.00 1,556,226.00 1,932,380,150.00
2.Committed 843,903,942.00 1,022,053,069.47 41,805,665.00 1,556,225.78 1,909,318,902.25 -23,061,248.04 -23,061,248.04
3.Paid 799,985,250.39 991,207,998.54 36,663,486.00 1,478,414.70 1,829,335,149.63 23,710,020.09 1,518,147.72 950,000.92 26,178,168.73
% (2)/(1) 100.00 % 97.79 % 100.00 % 100.00 % 98.81 %
Belgique-België
% (3)/(1) 94.80 % 94.84 % 87.70 % 95.00 % 94.67 %
1.Decided 985,562,948.00 424,890,166.00 169,790,354.00 4,111,073.00 1,584,354,541.00
2.Committed 985,562,948.00 424,890,166.00 169,790,354.00 4,111,073.00 1,584,354,541.00
3.Paid 936,284,800.60 403,645,657.70 161,300,836.00 3,905,519.35 1,505,136,813.65 1,292,762.34 1,292,762.34
% (2)/(1) 100.00 % 100.00 % 100.00 % 100.00 % 100.00 %
Ceska Republika
% (3)/(1) 95.00 % 95.00 % 95.00 % 95.00 % 95.00 %
1.Decided 141,648,773.00 446,121,951.00 587,770,724.00
2.Committed 141,648,773.00 397,125,340.98 538,774,113.98 -34,049,348.12 -34,049,348.12
3.Paid 133,363,289.34 362,762,350.49 496,125,639.83
Danmark
% (2)/(1) 100.00 % 89.02 % 91.66 %

EN 111 EN
Sum of all transactions, up to 2010, since the beginning of the programming period 2000-2006 Financial year: 2010
Country ERDF ESF EAGGF FIFG Total SF ERDF ESF EAGGF FIFG Total SF
% (3)/(1) 94.15 % 81.31 % 84.41 %
1.Decided 15,424,973,509.00 11,289,253,220.00 3,417,719,969.00 91,495,213.00 30,223,441,911.00
2.Committed 15,424,973,512.68 10,921,876,551.95 3,417,287,030.86 91,495,212.58 29,855,632,308.07 -367,376,668.90 -432,937.14 -367,809,606.04
3.Paid 14,721,321,360.25 10,723,033,324.13 3,284,973,761.86 86,920,452.35 28,816,248,898.59 83,187,413.60 38,139,792.86 121,327,206.46
% (2)/(1) 100.00 % 96.75 % 99.99 % 100.00 % 98.78 %
Deutschland
% (3)/(1) 95.44 % 94.98 % 96.12 % 95.00 % 95.34 %
1.Decided 232,820,142.00 69,275,610.00 56,798,282.00 12,469,418.00 371,363,452.00
2.Committed 232,820,142.00 68,816,786.76 56,798,282.00 12,469,418.00 370,904,628.76 -458,823.24 -458,823.24
3.Paid 221,179,134.88 65,640,753.54 53,958,367.00 11,845,947.10 352,624,202.52
% (2)/(1) 100.00 % 99.34 % 100.00 % 100.00 % 99.88 %
Eesti
% (3)/(1) 95.00 % 94.75 % 95.00 % 95.00 % 94.95 %
1.Decided 15,152,463,366.00 4,771,653,980.00 2,550,311,562.00 213,893,365.00 22,688,322,273.00
2.Committed 15,152,463,366.20 4,771,653,979.60 2,550,311,562.00 213,893,365.00 22,688,322,272.80
3.Paid 14,394,840,197.60 4,533,071,280.03 2,422,795,979.00 203,198,696.75 21,553,906,153.38 15,888,922.42 3,051,126.75 1,096,525.00 20,036,574.17
% (2)/(1) 100.00 % 100.00 % 100.00 % 100.00 % 100.00 %
Ellada
% (3)/(1) 95.00 % 95.00 % 95.00 % 95.00 % 95.00 %
1.Decided 27,904,766,267.00 11,699,051,196.00 5,232,503,468.00 1,570,925,014.00 46,407,245,945.00España
2.Committed 27,904,766,267.00 11,666,155,505.57 5,232,503,468.28 1,570,925,014.00 46,374,350,254.85 -32,895,691.28 -32,895,691.28

EN 112 EN
Sum of all transactions, up to 2010, since the beginning of the programming period 2000-2006 Financial year: 2010
Country ERDF ESF EAGGF FIFG Total SF ERDF ESF EAGGF FIFG Total SF
3.Paid 26,371,895,708.51 10,919,194,712.78 4,970,878,288.52 1,492,378,763.30 43,754,347,473.11 346,388,171.05 17,071,891.16 363,460,062.21
% (2)/(1) 100.00 % 99.72 % 100.00 % 100.00 % 99.93 %
% (3)/(1) 94.51 % 93.33 % 95.00 % 95.00 % 94.28 %
1.Decided 8,167,416,971.00 6,666,386,443.00 670,263,108.00 33,842,296.00 15,537,908,818.00
2.Committed 8,167,416,972.00 6,306,018,437.59 670,263,108.00 33,842,296.00 15,177,540,813.59 758,730.98 -360,368,004.01 -359,609,273.03
3.Paid 7,745,898,631.80 6,252,565,174.87 636,749,950.00 31,853,568.87 14,667,067,325.54 27,460,236.95 34,344.44 27,494,581.39
% (2)/(1) 100.00 % 94.59 % 100.00 % 100.00 % 97.68 %
France
% (3)/(1) 94.84 % 93.79 % 95.00 % 94.12 % 94.40 %
1.Decided 1,946,313,000.00 1,016,487,000.00 153,636,289.00 67,800,000.00 3,184,236,289.00
2.Committed 1,946,313,000.00 1,016,487,000.00 153,636,289.00 67,800,000.00 3,184,236,289.00
3.Paid 1,837,448,414.77 961,937,618.00 145,954,474.00 64,410,000.00 3,009,750,506.77
% (2)/(1) 100.00 % 100.00 % 100.00 % 100.00 % 100.00 %
Ireland
% (3)/(1) 94.41 % 94.63 % 95.00 % 95.00 % 94.52 %
1.Decided 18,639,088,813.00 8,457,731,299.00 3,258,998,890.00 288,055,284.00 30,643,874,286.00
2.Committed 18,639,088,813.00 8,422,039,892.39 3,258,998,890.00 288,055,283.61 30,608,182,879.00 -35,691,407.03 -35,691,407.03
3.Paid 17,699,749,395.62 7,510,696,850.00 3,033,531,694.00 254,262,266.92 28,498,240,206.54 946,683,482.07 101,651,077.73 94,131,901.00 5,536,379.17 1,148,002,839.97
% (2)/(1) 100.00 % 99.58 % 100.00 % 100.00 % 99.88 %
Italia
% (3)/(1) 94.96 % 88.80 % 93.08 % 88.27 % 93.00 %

EN 113 EN
Sum of all transactions, up to 2010, since the beginning of the programming period 2000-2006 Financial year: 2010
Country ERDF ESF EAGGF FIFG Total SF ERDF ESF EAGGF FIFG Total SF
1.Decided 28,022,807.00 21,945,197.00 49,968,004.00
2.Committed 28,022,807.00 21,945,197.00 49,968,004.00
3.Paid 26,621,666.65 20,847,937.15 47,469,603.80
% (2)/(1) 100.00 % 100.00 % 100.00 %
Kypros
% (3)/(1) 95.00 % 95.00 % 95.00 %
1.Decided 382,043,677.00 127,341,960.00 91,848,189.00 24,335,000.00 625,568,826.00
2.Committed 382,043,677.00 127,341,960.00 91,848,189.00 24,335,000.00 625,568,826.00
3.Paid 362,941,493.15 120,974,862.00 87,255,779.00 23,118,250.00 594,290,384.15
% (2)/(1) 100.00 % 100.00 % 100.00 % 100.00 % 100.00 %
Latvija
% (3)/(1) 95.00 % 95.00 % 95.00 % 95.00 % 95.00 %
1.Decided 583,939,739.00 176,217,551.00 122,898,628.00 12,116,766.00 895,172,684.00
2.Committed 583,939,739.00 176,217,551.00 122,898,628.00 12,116,766.00 895,172,684.00
3.Paid 554,742,752.05 167,406,673.45 116,753,696.00 11,510,927.70 850,414,049.20
% (2)/(1) 100.00 % 100.00 % 100.00 % 100.00 % 100.00 %
Lietuva
% (3)/(1) 95.00 % 95.00 % 95.00 % 95.00 % 95.00 %
1.Decided 44,000,000.00 31,682,966.00 75,682,966.00
2.Committed 44,000,000.00 31,682,966.63 75,682,966.63
Luxembourg (Grand-Duche)
3.Paid 41,800,000.00 25,990,446.00 67,790,446.00 2,549,530.50 2,549,530.50
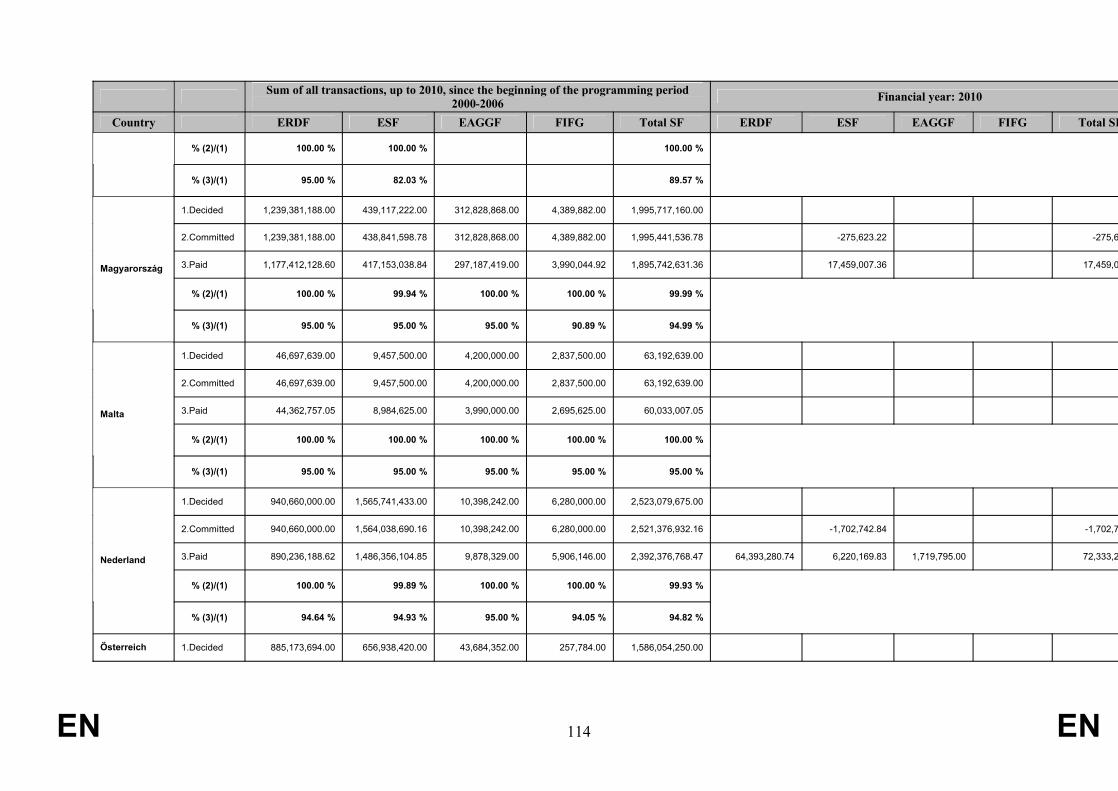
EN 114 EN
Sum of all transactions, up to 2010, since the beginning of the programming period 2000-2006 Financial year: 2010
Country ERDF ESF EAGGF FIFG Total SF ERDF ESF EAGGF FIFG Total SF
% (2)/(1) 100.00 % 100.00 % 100.00 %
% (3)/(1) 95.00 % 82.03 % 89.57 %
1.Decided 1,239,381,188.00 439,117,222.00 312,828,868.00 4,389,882.00 1,995,717,160.00
2.Committed 1,239,381,188.00 438,841,598.78 312,828,868.00 4,389,882.00 1,995,441,536.78 -275,623.22 -275,623.22
3.Paid 1,177,412,128.60 417,153,038.84 297,187,419.00 3,990,044.92 1,895,742,631.36 17,459,007.36 17,459,007.36
% (2)/(1) 100.00 % 99.94 % 100.00 % 100.00 % 99.99 %
Magyarország
% (3)/(1) 95.00 % 95.00 % 95.00 % 90.89 % 94.99 %
1.Decided 46,697,639.00 9,457,500.00 4,200,000.00 2,837,500.00 63,192,639.00
2.Committed 46,697,639.00 9,457,500.00 4,200,000.00 2,837,500.00 63,192,639.00
3.Paid 44,362,757.05 8,984,625.00 3,990,000.00 2,695,625.00 60,033,007.05
% (2)/(1) 100.00 % 100.00 % 100.00 % 100.00 % 100.00 %
Malta
% (3)/(1) 95.00 % 95.00 % 95.00 % 95.00 % 95.00 %
1.Decided 940,660,000.00 1,565,741,433.00 10,398,242.00 6,280,000.00 2,523,079,675.00
2.Committed 940,660,000.00 1,564,038,690.16 10,398,242.00 6,280,000.00 2,521,376,932.16 -1,702,742.84 -1,702,742.84
3.Paid 890,236,188.62 1,486,356,104.85 9,878,329.00 5,906,146.00 2,392,376,768.47 64,393,280.74 6,220,169.83 1,719,795.00 72,333,245.57
% (2)/(1) 100.00 % 99.89 % 100.00 % 100.00 % 99.93 %
Nederland
% (3)/(1) 94.64 % 94.93 % 95.00 % 94.05 % 94.82 %
Österreich 1.Decided 885,173,694.00 656,938,420.00 43,684,352.00 257,784.00 1,586,054,250.00

EN 115 EN
Sum of all transactions, up to 2010, since the beginning of the programming period 2000-2006 Financial year: 2010
Country ERDF ESF EAGGF FIFG Total SF ERDF ESF EAGGF FIFG Total SF
2.Committed 884,203,372.36 655,988,574.07 43,684,352.00 257,784.09 1,584,134,082.52 -970,321.68 -949,845.93 -1,920,167.61
3.Paid 858,533,637.81 624,706,090.36 43,684,352.00 195,451.73 1,527,119,531.90 861,378.51 614,591.36 2,184,218.00 3,660,187.87
% (2)/(1) 99.89 % 99.86 % 100.00 % 100.00 % 99.88 %
% (3)/(1) 96.99 % 95.09 % 100.00 % 75.82 % 96.28 %
1.Decided 4,972,788,583.00 1,908,502,751.00 1,192,689,238.00 201,832,064.00 8,275,812,636.00
2.Committed 4,972,788,583.00 1,908,502,751.00 1,192,689,238.00 201,832,064.00 8,275,812,636.00
3.Paid 4,724,149,153.85 1,813,077,613.45 1,133,054,776.00 177,788,079.98 7,848,069,623.28
% (2)/(1) 100.00 % 100.00 % 100.00 % 100.00 % 100.00 %
Polska
% (3)/(1) 95.00 % 95.00 % 95.00 % 88.09 % 94.83 %
1.Decided 13,229,822,910.00 4,784,220,439.00 2,185,038,433.00 236,816,863.00 20,435,898,645.00
2.Committed 13,229,822,910.00 4,784,220,439.05 2,185,038,432.57 236,816,863.00 20,435,898,644.62
3.Paid 12,568,231,567.68 4,545,009,417.05 2,060,567,852.00 224,929,584.87 19,398,738,421.60 2,623,837.00 3,443,884.68 6,067,721.68
% (2)/(1) 100.00 % 100.00 % 100.00 % 100.00 % 100.00 %
Portugal
% (3)/(1) 95.00 % 95.00 % 94.30 % 94.98 % 94.92 %
1.Decided 136,523,478.00 75,635,986.00 23,569,093.00 1,781,040.00 237,509,597.00
2.Committed 136,523,478.00 74,615,524.76 23,569,093.00 1,781,040.00 236,489,135.76 -1,020,461.24 -1,020,461.24
3.Paid 129,697,304.10 71,854,186.70 22,390,638.00 1,691,988.00 225,634,116.80
Slovenija
% (2)/(1) 100.00 % 98.65 % 100.00 % 100.00 % 99.57 %

EN 116 EN
Sum of all transactions, up to 2010, since the beginning of the programming period 2000-2006 Financial year: 2010
Country ERDF ESF EAGGF FIFG Total SF ERDF ESF EAGGF FIFG Total SF
% (3)/(1) 95.00 % 95.00 % 95.00 % 95.00 % 95.00 %
1.Decided 610,606,848.00 321,599,056.00 181,158,922.00 1,829,065.00 1,115,193,891.00
2.Committed 610,606,847.30 321,599,057.12 181,158,922.00 1,829,065.00 1,115,193,891.42
3.Paid 577,121,220.55 305,519,103.20 172,100,975.00 1,737,611.75 1,056,478,910.50
% (2)/(1) 100.00 % 100.00 % 100.00 % 100.00 % 100.00 %
Slovenska Republica
% (3)/(1) 94.52 % 95.00 % 95.00 % 95.00 % 94.73 %
1.Decided 910,807,000.00 834,231,400.00 201,640,000.00 8,884,000.00 1,955,562,400.00
2.Committed 910,807,000.00 804,747,800.28 201,640,000.00 8,884,000.00 1,926,078,800.28 -29,483,599.72 -29,483,599.72
3.Paid 865,164,572.29 792,351,783.30 199,250,797.76 8,439,800.00 1,865,206,953.35 7,692,797.76 7,692,797.76
% (2)/(1) 100.00 % 96.47 % 100.00 % 100.00 % 98.49 %
Suomi/Finland
% (3)/(1) 94.99 % 94.98 % 98.82 % 95.00 % 95.38 %
1.Decided 875,439,631.00 998,005,293.00 116,044,514.00 8,425,923.00 1,997,915,361.00
2.Committed 875,439,631.00 941,046,571.60 116,044,514.00 8,425,923.82 1,940,956,640.42 -56,971,671.00 -56,971,671.00
3.Paid 832,003,029.30 938,989,976.75 110,242,287.00 7,280,756.24 1,888,516,049.29 335,379.85 335,379.85
% (2)/(1) 100.00 % 94.29 % 100.00 % 100.00 % 97.15 %
Sverige
% (3)/(1) 95.04 % 94.09 % 95.00 % 86.41 % 94.52 %
1.Decided 8,864,321,357.00 7,535,301,392.00 400,196,902.00 97,763,651.00 16,897,583,302.00United Kingdom
2.Committed 8,864,321,357.28 7,155,877,020.59 400,196,902.00 97,763,650.42 16,518,158,930.29 -379,424,370.99 -379,424,370.99

EN 117 EN
Sum of all transactions, up to 2010, since the beginning of the programming period 2000-2006 Financial year: 2010
Country ERDF ESF EAGGF FIFG Total SF ERDF ESF EAGGF FIFG Total SF
3.Paid 8,381,088,485.54 7,077,227,509.16 380,298,950.00 85,137,027.77 15,923,751,972.47 96,863,164.79 123,559,228.32 5,414,229.00 225,836,622.11
% (2)/(1) 100.00 % 94.96 % 100.00 % 100.00 % 97.75 %
% (3)/(1) 94.55 % 93.92 % 95.03 % 87.08 % 94.24 %
Total 1. Decided 123,189,186,282.00 65,371,903,748.00 20,438,022,968.00 2,891,697,427.00 211,890,810,425.00
2.Committed 123,188,215,964.82 64,033,239,932.35 20,437,590,029.71 2,891,697,426.30 210,550,743,353.18 -211,590.70 -1,323,729,505.56 -432,937.14 -1,324,374,033.4
3.Paid 116,896,072,141.00 61,140,205,087.34 19,383,462,687.14 2,704,674,923.30 200,124,414,838.78 1,578,311,213.12 302,447,770.02 153,003,095.62 9,964,609.21 2,043,726,687.97
% (2)/(1) 100.00 % 97.95 % 100.00 % 100.00 % 99.37 %
% (3)/(1) 94.89 % 93.53 % 94.84 % 93.53 % 94.45 %
Source: Commission database SFC / ABAC / SINCOM
Financial implementation 2010: Objective 1
Sum of all transactions, up to 2010, since the beginning of the programming period 2000-2006 Financial year: 2010
Country ERDF ESF EAGGF FIFG Total SF ERDF ESF EAGGF FIFG Total SF
1.Decided 427,589,200.00 200,203,797.00 41,805,665.00 1,556,226.00 671,154,888.00
2.Committed 427,589,200.00 193,172,088.09 41,805,665.00 1,556,225.78 664,123,178.87 -7,031,708.91 -7,031,708.91
3.Paid 406,209,740.00 190,193,607.15 36,663,486.00 1,478,414.70 634,545,247.85 1,633,809.05 950,000.92 2,583,809.97
% (2)/(1) 100.00 % 96.49 % 100.00 % 100.00 % 98.95 %
Belgique-België
% (3)/(1) 95.00 % 95.00 % 87.70 % 95.00 % 94.55 %

EN 118 EN
Sum of all transactions, up to 2010, since the beginning of the programming period 2000-2006 Financial year: 2010
Country ERDF ESF EAGGF FIFG Total SF ERDF ESF EAGGF FIFG Total SF
1.Decided 914,267,548.00 366,096,803.00 169,790,354.00 4,111,073.00 1,454,265,778.00
2.Committed 914,267,548.00 366,096,803.00 169,790,354.00 4,111,073.00 1,454,265,778.00
3.Paid 868,554,170.60 347,791,962.85 161,300,836.00 3,905,519.35 1,381,552,488.80 1,292,762.34 1,292,762.34
% (2)/(1) 100.00 % 100.00 % 100.00 % 100.00 % 100.00 %
Ceska Republika
% (3)/(1) 95.00 % 95.00 % 95.00 % 95.00 % 95.00 %
1.Decided 12,177,017,415.00 5,816,988,103.00 3,417,719,969.00 91,495,213.00 21,503,220,700.00
2.Committed 12,177,017,415.21 5,678,824,751.65 3,417,287,030.86 91,495,212.58 21,364,624,410.30 -138,163,350.94 -432,937.14 -138,596,288.08
3.Paid 11,647,928,536.51 5,526,138,697.85 3,284,973,761.86 86,920,452.35 20,545,961,448.57 83,050,000.00 38,139,792.86 121,189,792.86
% (2)/(1) 100.00 % 97.62 % 99.99 % 100.00 % 99.36 %
Deutschland
% (3)/(1) 95.66 % 95.00 % 96.12 % 95.00 % 95.55 %
1.Decided 232,820,142.00 69,275,610.00 56,798,282.00 12,469,418.00 371,363,452.00
2.Committed 232,820,142.00 68,816,786.76 56,798,282.00 12,469,418.00 370,904,628.76 -458,823.24 -458,823.24
3.Paid 221,179,134.88 65,640,753.54 53,958,367.00 11,845,947.10 352,624,202.52
% (2)/(1) 100.00 % 99.34 % 100.00 % 100.00 % 99.88 %
Eesti
% (3)/(1) 95.00 % 94.75 % 95.00 % 95.00 % 94.95 %
1.Decided 15,152,463,366.00 4,771,653,980.00 2,550,311,562.00 213,893,365.00 22,688,322,273.00
2.Committed 15,152,463,366.20 4,771,653,979.60 2,550,311,562.00 213,893,365.00 22,688,322,272.80
3.Paid 14,394,840,197.60 4,533,071,280.03 2,422,795,979.00 203,198,696.75 21,553,906,153.38 15,888,922.42 3,051,126.75 1,096,525.00 20,036,574.17
% (2)/(1) 100.00 % 100.00 % 100.00 % 100.00 % 100.00 %
Ellada
% (3)/(1) 95.00 % 95.00 % 95.00 % 95.00 % 95.00 %
1.Decided 25,351,187,210.00 9,080,273,167.00 5,232,503,468.00 1,570,925,014.00 41,234,888,859.00
2.Committed 25,351,187,210.00 9,076,893,196.48 5,232,503,468.28 1,570,925,014.00 41,231,508,888.76 -3,379,970.16 -3,379,970.16
3.Paid 23,998,121,237.17 8,452,555,425.24 4,970,878,288.52 1,492,378,763.30 38,913,933,714.23 228,827,259.04 228,827,259.04
% (2)/(1) 100.00 % 99.96 % 100.00 % 100.00 % 99.99 %
España
% (3)/(1) 94.66 % 93.09 % 95.00 % 95.00 % 94.37 %
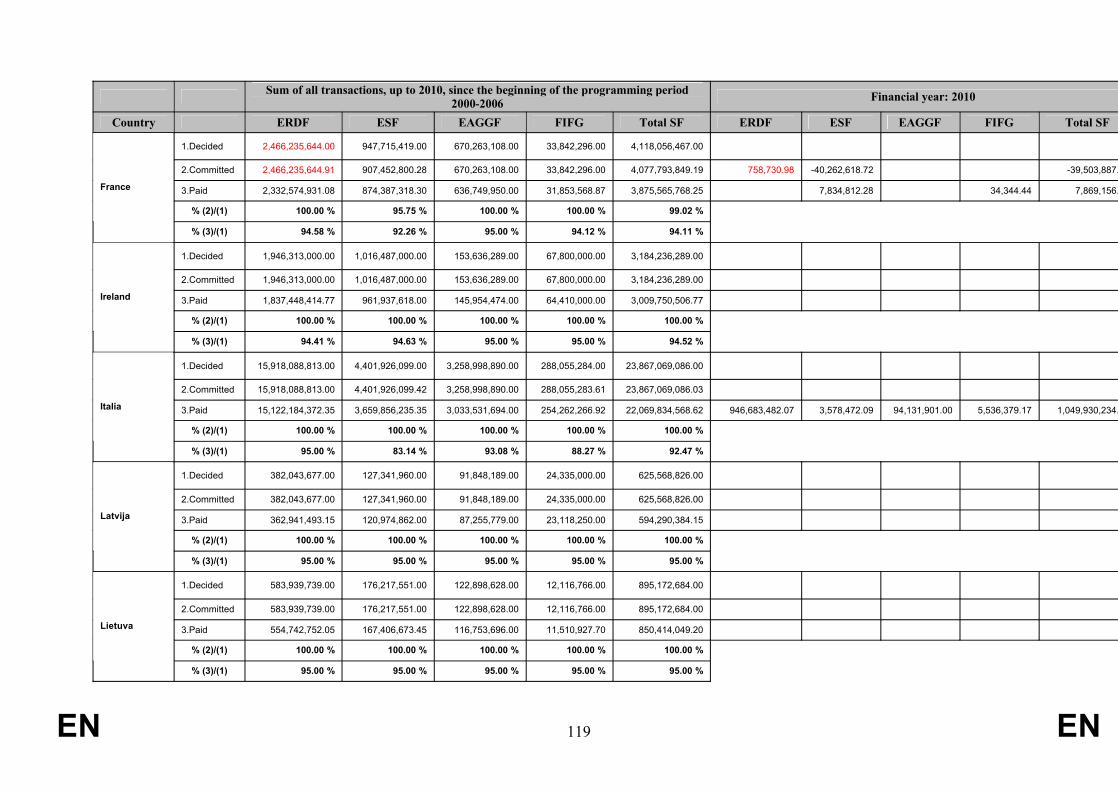
EN 119 EN
Sum of all transactions, up to 2010, since the beginning of the programming period 2000-2006 Financial year: 2010
Country ERDF ESF EAGGF FIFG Total SF ERDF ESF EAGGF FIFG Total SF
1.Decided 2,466,235,644.00 947,715,419.00 670,263,108.00 33,842,296.00 4,118,056,467.00
2.Committed 2,466,235,644.91 907,452,800.28 670,263,108.00 33,842,296.00 4,077,793,849.19 758,730.98 -40,262,618.72 -39,503,887.74
3.Paid 2,332,574,931.08 874,387,318.30 636,749,950.00 31,853,568.87 3,875,565,768.25 7,834,812.28 34,344.44 7,869,156.72
% (2)/(1) 100.00 % 95.75 % 100.00 % 100.00 % 99.02 %
France
% (3)/(1) 94.58 % 92.26 % 95.00 % 94.12 % 94.11 %
1.Decided 1,946,313,000.00 1,016,487,000.00 153,636,289.00 67,800,000.00 3,184,236,289.00
2.Committed 1,946,313,000.00 1,016,487,000.00 153,636,289.00 67,800,000.00 3,184,236,289.00
3.Paid 1,837,448,414.77 961,937,618.00 145,954,474.00 64,410,000.00 3,009,750,506.77
% (2)/(1) 100.00 % 100.00 % 100.00 % 100.00 % 100.00 %
Ireland
% (3)/(1) 94.41 % 94.63 % 95.00 % 95.00 % 94.52 %
1.Decided 15,918,088,813.00 4,401,926,099.00 3,258,998,890.00 288,055,284.00 23,867,069,086.00
2.Committed 15,918,088,813.00 4,401,926,099.42 3,258,998,890.00 288,055,283.61 23,867,069,086.03
3.Paid 15,122,184,372.35 3,659,856,235.35 3,033,531,694.00 254,262,266.92 22,069,834,568.62 946,683,482.07 3,578,472.09 94,131,901.00 5,536,379.17 1,049,930,234.33
% (2)/(1) 100.00 % 100.00 % 100.00 % 100.00 % 100.00 %
Italia
% (3)/(1) 95.00 % 83.14 % 93.08 % 88.27 % 92.47 %
1.Decided 382,043,677.00 127,341,960.00 91,848,189.00 24,335,000.00 625,568,826.00
2.Committed 382,043,677.00 127,341,960.00 91,848,189.00 24,335,000.00 625,568,826.00
3.Paid 362,941,493.15 120,974,862.00 87,255,779.00 23,118,250.00 594,290,384.15
% (2)/(1) 100.00 % 100.00 % 100.00 % 100.00 % 100.00 %
Latvija
% (3)/(1) 95.00 % 95.00 % 95.00 % 95.00 % 95.00 %
1.Decided 583,939,739.00 176,217,551.00 122,898,628.00 12,116,766.00 895,172,684.00
2.Committed 583,939,739.00 176,217,551.00 122,898,628.00 12,116,766.00 895,172,684.00
3.Paid 554,742,752.05 167,406,673.45 116,753,696.00 11,510,927.70 850,414,049.20
% (2)/(1) 100.00 % 100.00 % 100.00 % 100.00 % 100.00 %
Lietuva
% (3)/(1) 95.00 % 95.00 % 95.00 % 95.00 % 95.00 %

EN 120 EN
Sum of all transactions, up to 2010, since the beginning of the programming period 2000-2006 Financial year: 2010
Country ERDF ESF EAGGF FIFG Total SF ERDF ESF EAGGF FIFG Total SF
1.Decided 1,239,381,188.00 439,117,222.00 312,828,868.00 4,389,882.00 1,995,717,160.00
2.Committed 1,239,381,188.00 438,841,598.78 312,828,868.00 4,389,882.00 1,995,441,536.78 -275,623.22 -275,623.22
3.Paid 1,177,412,128.60 417,153,038.84 297,187,419.00 3,990,044.92 1,895,742,631.36 17,459,007.36 17,459,007.36
% (2)/(1) 100.00 % 99.94 % 100.00 % 100.00 % 99.99 %
Magyarország
% (3)/(1) 95.00 % 95.00 % 95.00 % 90.89 % 94.99 %
1.Decided 46,697,639.00 9,457,500.00 4,200,000.00 2,837,500.00 63,192,639.00
2.Committed 46,697,639.00 9,457,500.00 4,200,000.00 2,837,500.00 63,192,639.00
3.Paid 44,362,757.05 8,984,625.00 3,990,000.00 2,695,625.00 60,033,007.05
% (2)/(1) 100.00 % 100.00 % 100.00 % 100.00 % 100.00 %
Malta
% (3)/(1) 95.00 % 95.00 % 95.00 % 95.00 % 95.00 %
1.Decided 81,660,000.00 33,590,000.00 10,398,242.00 6,280,000.00 131,928,242.00
2.Committed 81,660,000.00 31,887,257.16 10,398,242.00 6,280,000.00 130,225,499.16 -1,702,742.84 -1,702,742.84
3.Paid 77,577,000.00 30,812,243.50 9,878,329.00 5,906,146.00 124,173,718.50 6,220,169.83 1,719,795.00 7,939,964.83
% (2)/(1) 100.00 % 94.93 % 100.00 % 100.00 % 98.71 %
Nederland
% (3)/(1) 95.00 % 91.73 % 95.00 % 94.05 % 94.12 %
1.Decided 181,519,085.00 57,440,139.00 43,684,352.00 257,784.00 282,901,360.00
2.Committed 181,519,085.00 57,251,995.76 43,684,352.00 257,784.09 282,713,216.85 -188,143.24 -188,143.24
3.Paid 172,443,130.75 54,568,132.05 43,684,352.00 195,451.73 270,891,066.53 2,184,218.00 2,184,218.00
% (2)/(1) 100.00 % 99.67 % 100.00 % 100.00 % 99.93 %
Österreich
% (3)/(1) 95.00 % 95.00 % 100.00 % 75.82 % 95.75 %
1.Decided 4,972,788,583.00 1,908,502,751.00 1,192,689,238.00 201,832,064.00 8,275,812,636.00
2.Committed 4,972,788,583.00 1,908,502,751.00 1,192,689,238.00 201,832,064.00 8,275,812,636.00
3.Paid 4,724,149,153.85 1,813,077,613.45 1,133,054,776.00 177,788,079.98 7,848,069,623.28
% (2)/(1) 100.00 % 100.00 % 100.00 % 100.00 % 100.00 %
Polska
% (3)/(1) 95.00 % 95.00 % 95.00 % 88.09 % 94.83 %

EN 121 EN
Sum of all transactions, up to 2010, since the beginning of the programming period 2000-2006 Financial year: 2010
Country ERDF ESF EAGGF FIFG Total SF ERDF ESF EAGGF FIFG Total SF
1.Decided 13,229,822,910.00 4,784,220,439.00 2,185,038,433.00 236,816,863.00 20,435,898,645.00
2.Committed 13,229,822,910.00 4,784,220,439.05 2,185,038,432.57 236,816,863.00 20,435,898,644.62
3.Paid 12,568,231,567.68 4,545,009,417.05 2,060,567,852.00 224,929,584.87 19,398,738,421.60 2,623,837.00 3,443,884.68 6,067,721.68
% (2)/(1) 100.00 % 100.00 % 100.00 % 100.00 % 100.00 %
Portugal
% (3)/(1) 95.00 % 95.00 % 94.30 % 94.98 % 94.92 %
1.Decided 136,523,478.00 75,635,986.00 23,569,093.00 1,781,040.00 237,509,597.00
2.Committed 136,523,478.00 74,615,524.76 23,569,093.00 1,781,040.00 236,489,135.76 -1,020,461.24 -1,020,461.24
3.Paid 129,697,304.10 71,854,186.70 22,390,638.00 1,691,988.00 225,634,116.80
% (2)/(1) 100.00 % 98.65 % 100.00 % 100.00 % 99.57 %
Slovenija
% (3)/(1) 95.00 % 95.00 % 95.00 % 95.00 % 95.00 %
1.Decided 573,574,135.00 284,480,923.00 181,158,922.00 1,829,065.00 1,041,043,045.00
2.Committed 573,574,135.00 284,480,923.00 181,158,922.00 1,829,065.00 1,041,043,045.00
3.Paid 541,940,143.20 270,256,876.85 172,100,975.00 1,737,611.75 986,035,606.80
% (2)/(1) 100.00 % 100.00 % 100.00 % 100.00 % 100.00 %
Slovenska Republica
% (3)/(1) 94.48 % 95.00 % 95.00 % 95.00 % 94.72 %
1.Decided 498,641,000.00 279,835,000.00 201,640,000.00 8,884,000.00 989,000,000.00
2.Committed 498,641,000.00 276,937,540.69 201,640,000.00 8,884,000.00 986,102,540.69 -2,897,459.31 -2,897,459.31
3.Paid 473,708,950.00 265,843,250.00 199,250,797.76 8,439,800.00 947,242,797.76 7,692,797.76 7,692,797.76
% (2)/(1) 100.00 % 98.96 % 100.00 % 100.00 % 99.71 %
Suomi/Finland
% (3)/(1) 95.00 % 95.00 % 98.82 % 95.00 % 95.78 %
1.Decided 489,460,422.00 164,021,802.00 116,044,514.00 8,425,923.00 777,952,661.00
2.Committed 489,460,422.00 154,091,910.85 116,044,514.00 8,425,923.82 768,022,770.67 -9,929,890.75 -9,929,890.75
3.Paid 464,987,400.90 154,091,910.85 110,242,287.00 7,280,756.24 736,602,354.99
% (2)/(1) 100.00 % 93.95 % 100.00 % 100.00 % 98.72 %
Sverige
% (3)/(1) 95.00 % 93.95 % 95.00 % 86.41 % 94.68 %

EN 122 EN
Sum of all transactions, up to 2010, since the beginning of the programming period 2000-2006 Financial year: 2010
Country ERDF ESF EAGGF FIFG Total SF ERDF ESF EAGGF FIFG Total SF
1.Decided 4,338,242,143.00 2,060,065,687.00 400,196,902.00 97,763,651.00 6,896,268,383.00
2.Committed 4,338,242,144.06 1,983,023,061.85 400,196,902.00 97,763,650.42 6,819,225,758.33 -77,042,625.81 -77,042,625.81
3.Paid 4,120,374,693.76 1,923,864,371.26 380,298,950.00 85,137,027.77 6,509,675,042.79 71,771,278.46 5,414,229.00 77,185,507.46
% (2)/(1) 100.00 % 96.26 % 100.00 % 100.00 % 98.88 %
United Kingdom
% (3)/(1) 94.98 % 93.39 % 95.03 % 87.08 % 94.39 %
Total 1. Decided 101,340,276,337.00 37,070,546,938.00 20,438,022,968.00 2,891,697,427.00 161,740,543,670.00
2.Committed 101,340,276,339.38 36,788,193,519.18 20,437,590,029.71 2,891,697,426.30 161,457,757,314.57 758,730.98 -282,353,418.38 -432,937.14 -282,027,624.54
3.Paid 96,241,609,210.05 34,455,470,099.31 19,383,462,687.14 2,704,674,923.30 152,785,216,919.80 1,347,854,751.04 39,436,350.65 153,003,095.62 9,964,609.21 1,550,258,806.52
% (2)/(1) 100.00 % 99.24 % 100.00 % 100.00 % 99.83 %
% (3)/(1) 94.97 % 92.95 % 94.84 % 93.53 % 94.46 %
Source: Commission database SFC / ABAC / SINCOM
Financial implementation 2010: Objective 2
Sum of all transactions, up to 2010, since the beginning of the programming period 2000-2006 Financial year: 2010
Country ERDF ESF EAGGF FIFG Total SF ERDF ESF EAGGF FIFG Total SF
1.Decided 416,314,742.00 48,499,226.00 464,813,968.00
2.Committed 416,314,742.00 46,200,617.23 462,515,359.23 -2,298,608.77 -2,298,608.77
3.Paid 393,775,510.39 45,185,882.01 438,961,392.40 22,076,211.04 959,285.32 23,035,496.36
Belgique-België
% (2)/(1) 100.00 % 95.26 % 99.51 %

EN 123 EN
Sum of all transactions, up to 2010, since the beginning of the programming period 2000-2006 Financial year: 2010
Country ERDF ESF EAGGF FIFG Total SF ERDF ESF EAGGF FIFG Total SF% (3)/(1) 94.59 % 93.17 % 94.44 %
1.Decided 71,295,400.00 71,295,400.00
2.Committed 71,295,400.00 71,295,400.00
3.Paid 67,730,630.00 67,730,630.00
% (2)/(1) 100.00 % 100.00 %
Ceska Republika
% (3)/(1) 95.00 % 95.00 %
1.Decided 141,648,773.00 51,322,702.00 192,971,475.00
2.Committed 141,648,773.00 45,376,450.61 187,025,223.61 -5,946,251.90 -5,946,251.90
3.Paid 133,363,289.34 42,806,163.90 176,169,453.24
% (2)/(1) 100.00 % 88.41 % 96.92 %
Danmark
% (3)/(1) 94.15 % 83.41 % 91.29 %
1.Decided 3,247,956,094.00 509,753,617.00 3,757,709,711.00
2.Committed 3,247,956,097.47 492,005,399.64 3,739,961,497.11 -17,748,218.62 -17,748,218.62
3.Paid 3,073,392,823.74 482,508,701.28 3,555,901,525.02 137,413.60 137,413.60
% (2)/(1) 100.00 % 96.52 % 99.53 %
Deutschland
% (3)/(1) 94.63 % 94.66 % 94.63 %
1.Decided 2,553,579,057.00 310,304,761.00 2,863,883,818.00
2.Committed 2,553,579,057.00 288,207,164.39 2,841,786,221.39 -22,097,597.42 -22,097,597.42
3.Paid 2,373,774,471.34 284,161,782.33 2,657,936,253.67 117,560,912.01 16,217,709.34 133,778,621.35
% (2)/(1) 100.00 % 92.88 % 99.23 %
España
% (3)/(1) 92.96 % 91.58 % 92.81 %
1.Decided 5,701,181,327.00 800,573,924.00 6,501,755,251.00
2.Committed 5,701,181,327.09 769,290,876.96 6,470,472,204.05 -31,283,045.64 -31,283,045.64
3.Paid 5,413,323,700.72 748,903,096.22 6,162,226,796.94
France
% (2)/(1) 100.00 % 96.09 % 99.52 %

EN 124 EN
Sum of all transactions, up to 2010, since the beginning of the programming period 2000-2006 Financial year: 2010
Country ERDF ESF EAGGF FIFG Total SF ERDF ESF EAGGF FIFG Total SF% (3)/(1) 94.95 % 93.55 % 94.78 %
1.Decided 2,721,000,000.00 2,721,000,000.00
2.Committed 2,721,000,000.00 2,721,000,000.00
3.Paid 2,577,565,023.27 2,577,565,023.27
% (2)/(1) 100.00 % 100.00 %
Italia
% (3)/(1) 94.73 % 94.73 %
1.Decided 28,022,807.00 28,022,807.00
2.Committed 28,022,807.00 28,022,807.00
3.Paid 26,621,666.65 26,621,666.65
% (2)/(1) 100.00 % 100.00 %
Kypros
% (3)/(1) 95.00 % 95.00 %
1.Decided 44,000,000.00 44,000,000.00
2.Committed 44,000,000.00 44,000,000.00
3.Paid 41,800,000.00 41,800,000.00
% (2)/(1) 100.00 % 100.00 %
Luxembourg (Grand-Duche)
% (3)/(1) 95.00 % 95.00 %
1.Decided 859,000,000.00 859,000,000.00
2.Committed 859,000,000.00 859,000,000.00
3.Paid 812,659,188.62 812,659,188.62 64,393,280.74 64,393,280.74
% (2)/(1) 100.00 % 100.00 %
Nederland
% (3)/(1) 94.61 % 94.61 %
1.Decided 703,654,609.00 27,525,881.00 731,180,490.00
2.Committed 702,684,287.36 26,764,178.31 729,448,465.67 -970,321.68 -761,702.69 -1,732,024.37
3.Paid 686,090,507.06 26,764,178.31 712,854,685.37 861,378.51 614,591.36 1,475,969.87
Österreich
% (2)/(1) 99.86 % 97.23 % 99.76 %

EN 125 EN
Sum of all transactions, up to 2010, since the beginning of the programming period 2000-2006 Financial year: 2010
Country ERDF ESF EAGGF FIFG Total SF ERDF ESF EAGGF FIFG Total SF% (3)/(1) 97.50 % 97.23 % 97.49 %
1.Decided 37,032,713.00 37,032,713.00
2.Committed 37,032,712.30 37,032,712.30
3.Paid 35,181,077.35 35,181,077.35
% (2)/(1) 100.00 % 100.00 %
Slovenska Republica
% (3)/(1) 95.00 % 95.00 %
1.Decided 412,166,000.00 117,834,000.00 530,000,000.00
2.Committed 412,166,000.00 113,244,026.29 525,410,026.29 -4,589,973.71 -4,589,973.71
3.Paid 391,455,622.29 111,942,300.00 503,397,922.29
% (2)/(1) 100.00 % 96.10 % 99.13 %
Suomi/Finland
% (3)/(1) 94.98 % 95.00 % 94.98 %
1.Decided 385,979,209.00 54,020,791.00 440,000,000.00
2.Committed 385,979,209.00 51,350,420.56 437,329,629.56 -2,670,370.44 -2,670,370.44
3.Paid 367,015,628.40 51,319,751.45 418,335,379.85 335,379.85 335,379.85
% (2)/(1) 100.00 % 95.06 % 99.39 %
Sverige
% (3)/(1) 95.09 % 95.00 % 95.08 %
1.Decided 4,526,079,214.00 526,806,805.00 5,052,886,019.00
2.Committed 4,526,079,213.22 467,729,142.05 4,993,808,355.27 -59,077,662.87 -59,077,662.87
3.Paid 4,260,713,791.78 459,621,519.77 4,720,335,311.55 25,091,886.33 16,545,045.91 41,636,932.24
% (2)/(1) 100.00 % 88.79 % 98.83 %
United Kingdom
% (3)/(1) 94.14 % 87.25 % 93.42 %
Total 1. Decided 21,848,909,945.00 2,446,641,707.00 24,295,551,652.00
2.Committed 21,847,939,625.44 2,300,168,276.04 24,148,107,901.48 -970,321.68 - -147,443,753.74

EN 126 EN
Sum of all transactions, up to 2010, since the beginning of the programming period 2000-2006 Financial year: 2010
Country ERDF ESF EAGGF FIFG Total SF ERDF ESF EAGGF FIFG Total SF146,473,432.06
3.Paid 20,654,462,930.95 2,253,213,375.27 22,907,676,306.22 230,456,462.08 34,336,631.93 264,793,094.01
% (2)/(1) 100.00 % 94.01 % 99.39 %
% (3)/(1) 94.53 % 92.09 % 94.29 %
Source: Commission database SFC / ABAC / SINCOM
Financial implementation 2010: Objective 3
Sum of all transactions, up to 2010, since the beginning of the programming period 2000-2006
Financial year: 2010
Country ERDF ESF EAGGF FIFG Total SF ERDF ESF EAGGF FIFG Total SF
1.Decided 796,411,294.00 796,411,294.00
2.Committed 782,680,364.15 782,680,364.15 -13,730,930.36 -13,730,930.36
3.Paid 755,828,509.38 755,828,509.38 558,862.40 558,862.40
% (2)/(1) 98.28 % 98.28 %
Belgique-België
% (3)/(1) 94.90 % 94.90 %
1.Decided 58,793,363.00 58,793,363.00
2.Committed 58,793,363.00 58,793,363.00
3.Paid 55,853,694.85 55,853,694.85
% (2)/(1) 100.00 % 100.00 %
Ceska Republika
% (3)/(1) 95.00 % 95.00 %
1.Decided 394,799,249.00 394,799,249.00
2.Committed 351,748,890.37 351,748,890.37 -28,103,096.22 -28,103,096.22
Danmark
3.Paid 319,956,186.59 319,956,186.59

EN 127 EN
Sum of all transactions, up to 2010, since the beginning of the programming period 2000-2006
Financial year: 2010
Country ERDF ESF EAGGF FIFG Total SF ERDF ESF EAGGF FIFG Total SF
% (2)/(1) 89.10 % 89.10 %
% (3)/(1) 81.04 % 81.04 %
1.Decided 4,962,511,500.00 4,962,511,500.00
2.Committed 4,751,046,400.66 4,751,046,400.66 -211,465,099.34 -211,465,099.34
3.Paid 4,714,385,925.00 4,714,385,925.00
% (2)/(1) 95.74 % 95.74 %
Deutschland
% (3)/(1) 95.00 % 95.00 %
1.Decided 2,308,473,268.00 2,308,473,268.00
2.Committed 2,301,055,144.70 2,301,055,144.70 -7,418,123.70 -7,418,123.70
3.Paid 2,182,477,505.21 2,182,477,505.21 854,181.82 854,181.82
% (2)/(1) 99.68 % 99.68 %
España
% (3)/(1) 94.54 % 94.54 %
1.Decided 4,918,097,100.00 4,918,097,100.00
2.Committed 4,629,274,760.35 4,629,274,760.35 -288,822,339.65 -288,822,339.65
3.Paid 4,629,274,760.35 4,629,274,760.35 19,625,424.67 19,625,424.67
% (2)/(1) 94.13 % 94.13 %
France
% (3)/(1) 94.13 % 94.13 %
1.Decided 4,055,805,200.00 4,055,805,200.00
2.Committed 4,020,113,792.97 4,020,113,792.97 -35,691,407.03 -35,691,407.03
3.Paid 3,850,840,614.65 3,850,840,614.65 98,072,605.64 98,072,605.64
% (2)/(1) 99.12 % 99.12 %
Italia
% (3)/(1) 94.95 % 94.95 %
1.Decided 21,945,197.00 21,945,197.00
2.Committed 21,945,197.00 21,945,197.00
Kypros
3.Paid 20,847,937.15 20,847,937.15

EN 128 EN
Sum of all transactions, up to 2010, since the beginning of the programming period 2000-2006
Financial year: 2010
Country ERDF ESF EAGGF FIFG Total SF ERDF ESF EAGGF FIFG Total SF
% (2)/(1) 100.00 % 100.00 %
% (3)/(1) 95.00 % 95.00 %
1.Decided 31,682,966.00 31,682,966.00
2.Committed 31,682,966.63 31,682,966.63
3.Paid 25,990,446.00 25,990,446.00 2,549,530.50 2,549,530.50
% (2)/(1) 100.00 % 100.00 %
Luxembourg (Grand-Duche)
% (3)/(1) 82.03 % 82.03 %
1.Decided 1,532,151,433.00 1,532,151,433.00
2.Committed 1,532,151,433.00 1,532,151,433.00
3.Paid 1,455,543,861.35 1,455,543,861.35
% (2)/(1) 100.00 % 100.00 %
Nederland
% (3)/(1) 95.00 % 95.00 %
1.Decided 571,972,400.00 571,972,400.00
2.Committed 571,972,400.00 571,972,400.00
3.Paid 543,373,780.00 543,373,780.00
% (2)/(1) 100.00 % 100.00 %
Österreich
% (3)/(1) 95.00 % 95.00 %
1.Decided 37,118,133.00 37,118,133.00
2.Committed 37,118,134.12 37,118,134.12
3.Paid 35,262,226.35 35,262,226.35
% (2)/(1) 100.00 % 100.00 %
Slovenska Republica
% (3)/(1) 95.00 % 95.00 %
1.Decided 436,562,400.00 436,562,400.00
2.Committed 414,566,233.30 414,566,233.30 -21,996,166.70 -21,996,166.70
Suomi/Finland
3.Paid 414,566,233.30 414,566,233.30

EN 129 EN
Sum of all transactions, up to 2010, since the beginning of the programming period 2000-2006
Financial year: 2010
Country ERDF ESF EAGGF FIFG Total SF ERDF ESF EAGGF FIFG Total SF
% (2)/(1) 94.96 % 94.96 %
% (3)/(1) 94.96 % 94.96 %
1.Decided 779,962,700.00 779,962,700.00
2.Committed 735,604,240.19 735,604,240.19 -44,371,409.81 -44,371,409.81
3.Paid 733,578,314.45 733,578,314.45
% (2)/(1) 94.31 % 94.31 %
Sverige
% (3)/(1) 94.05 % 94.05 %
1.Decided 4,948,428,900.00 4,948,428,900.00
2.Committed 4,705,124,816.69 4,705,124,816.69 -243,304,082.31 -243,304,082.31
3.Paid 4,693,741,618.13 4,693,741,618.13 107,014,182.41 107,014,182.41
% (2)/(1) 95.08 % 95.08 %
United Kingdom
% (3)/(1) 94.85 % 94.85 %
Total 1. Decided 25,854,715,103.00 25,854,715,103.00
2.Committed 24,944,878,137.13 24,944,878,137.13 -894,902,655.12 -894,902,655.12
3.Paid 24,431,521,612.76 24,431,521,612.76 228,674,787.44 228,674,787.44
% (2)/(1) 96.48 % 96.48 %
% (3)/(1) 94.50 % 94.50 %
Source: Commission database SFC / ABAC / SINCOM
Financial implementation 2010: Community Initiatives

EN 130 EN
Sum of all transactions, up to 2010, since the beginning of the programming period 2000-2006 Financial year: 2010
Country ERDF ESF EAGGF FIFG Total SF ERDF ESF EAGGF FIFG Total SF
1.Decided 21,387,345.00 68,237,842.00 14,326,747.00 103,951,934.00
2.Committed 21,387,345.62 62,079,628.20 14,627,257.00 98,094,230.82 -6,158,210.45 -6,158,210.45
3.Paid 20,317,977.75 61,804,746.41 12,115,845.83 94,238,569.99 3,307,552.79 4.81 3,307,557.60
% (2)/(1) 100.00 % 90.98 % 102.10 % 94.36 %
Belgique-België
% (3)/(1) 95.00 % 90.57 % 84.57 % 90.66 %
1.Decided 32,100,930.00 32,100,930.00
2.Committed 32,100,929.00 32,100,929.00
3.Paid 30,495,883.34 30,495,883.34
% (2)/(1) 100.00 % 100.00 %
Ceska Republika
% (3)/(1) 95.00 % 95.00 %
1.Decided 5,380,115.00 30,0428,011.00 17,300,208.00 53,108,334.00
2.Committed 5,380,115.00 25,599,382.14 17,300,208.00 48,279,705.14 -4,414,565.31 -4,414,565.31
3.Paid 5,111,109.25 24,627,778.43 16,380,016.89 46,118,904.57 1,118,601.89 1,118,601.89
% (2)/(1) 100.00 % 84.13 % 100.00 % 90.91 %
Danmark
% (3)/(1) 95.00 % 80.94 % 94.68 % 86.84 %
1.Decided 149,639,795.00 523,585,685.00 255,874,055.00 929,099,535.00
2.Committed 148,635,680.92 477,370,553.76 255,284,372.65 881,290,607.33 -1,004,113.42 -46,215,131.24 -589,681.60 -47,808,926.26
3.Paid 144,140,156.61 477,370,553.76 244,873,682.62 866,384,392.99 2,983,595.33 2,744,695.62 5,728,290.95
% (2)/(1) 99.33 % 91.17 % 99.77 % 94.85 %
Deutschland
% (3)/(1) 96.32 % 91.17 % 95.70 % 93.25 %
1.Decided 4,068,097.00 4,068,097.00
2.Committed 3,864,692.15 3,864,692.15 -203,404.85 -203,404.85
3.Paid 3,864,692.15 3,864,692.15
% (2)/(1) 95.00 % 95.00 %
Eesti
% (3)/(1) 95.00 % 95.00 %

EN 131 EN
Sum of all transactions, up to 2010, since the beginning of the programming period 2000-2006 Financial year: 2010
Country ERDF ESF EAGGF FIFG Total SF ERDF ESF EAGGF FIFG Total SF
1.Decided 24,130,374.00 105,938,327.00 186,129,877.00 316,198,578.00
2.Committed 24,130,375.81 105,938,102.00 186,129,877.00 316,198,354.81
3.Paid 19,528,289.77 100,641,410.65 176,823,383.00 296,993,083.42
% (2)/(1) 100.00 % 100.00 % 100.00 % 100.00 %
Ellada
% (3)/(1) 80.93 % 95.00 % 95.00 % 93.93 %
1.Decided 114,199,845.00 511,222,482.00 497,080,370.00 1,122,502,697.00
2.Committed 114,199,845.00 467,941,719.75 497,080,370.00 1,079,221,934.75 -43,280,761.26 -43,280,761.26
3.Paid 102,248,121.76 467,941,719.75 467,847,531.24 1,038,037,372.75 1,860,367.67 8,252,457.24 10,112,824.91
% (2)/(1) 100.00 % 91.53 % 100.00 % 96.14 %
España
% (3)/(1) 89.53 % 91.53 % 94.12 % 92.48 %
1.Decided 4,324,336,688.00 4,324,336,688.00
2.Committed 4,308,610,350.95 4,308,610,350.95 -15,726,336.00 -15,726,336.00
3.Paid 4,064,329,672.21 4,064,329,672.21 80,460,454.58 80,460,454.58
% (2)/(1) 99.64 % 99.64 %
EU cross-border cooperation
% (3)/(1) 93.99 % 93.99 %
1.Decided 18,031,417.00 18,031,417.00
2.Committed 16,276,024.00 16,276,024.00 -1,755,393.00 -1,755,393.00
3.Paid 16,276,024.00 16,276,024.00
% (2)/(1) 90.26 % 90.26 %
EU internal needs.
% (3)/(1) 90.26 % 90.26 %
1.Decided 1,320,811,837.00 1,320,811,837.00
2.Committed 1,320,811,836.35 1,320,811,836.35
3.Paid 1,196,962,659.47 1,196,962,659.47 9,845,228.82 9,845,228.82
% (2)/(1) 100.00 % 100.00 %
EU Interregional cooperation.
% (3)/(1) 90.62 % 90.62 %

EN 132 EN
Sum of all transactions, up to 2010, since the beginning of the programming period 2000-2006 Financial year: 2010
Country ERDF ESF EAGGF FIFG Total SF ERDF ESF EAGGF FIFG Total SF
1.Decided 102,548,897.00 287,438,101.00 259,909,081.00 649,896,079.00
2.Committed 102,066,812.33 274,755,717.37 259,909,081.00 636,731,610.70 -482,084.67 -12,682,382.96 -13,164,467.63
3.Paid 97,974,887.43 273,016,214.61 246,913,626.00 617,904,728.04 1,690,778.58 1,690,778.58
% (2)/(1) 99.53 % 95.59 % 100.00 % 97.97 %
France
% (3)/(1) 95.54 % 94.98 % 95.00 % 95.08 %
1.Decided 5,380,115.00 34,498,648.00 45,927,997.00 85,806,760.00
2.Committed 5,380,115.00 33,024,446.24 45,927,997.00 84,332,558.24 -1,474,201.76 -1,474,201.76
3.Paid 4,521,094.57 32,772,223.93 43,631,597.00 80,924,915.50
% (2)/(1) 100.00 % 95.73 % 100.00 % 98.28 %
Ireland
% (3)/(1) 84.03 % 95.00 % 95.00 % 94.31 %
1.Decided 114,065,379.00 401,364,808.00 281,553,068.00 796,983,255.00
2.Committed 114,065,379.16 401,364,808.00 281,553,068.00 796,983,255.16
3.Paid 107,651,827.15 375,382,693.35 248,923,490.14 731,958,010.64 1,411,211.50 9,815,808.35 533,730.14 11,760,749.99
% (2)/(1) 100.00 % 100.00 % 100.00 % 100.00 %
Italia
% (3)/(1) 94.38 % 93.53 % 88.41 % 91.84 %
1.Decided 1,808,793.00 1,808,793.00
2.Committed 1,808,793.00 1,808,793.00
3.Paid 1,718,353.35 1,718,353.35
% (2)/(1) 100.00 % 100.00 %
Kypros
% (3)/(1) 95.00 % 95.00 %
1.Decided 8,025,784.00 8,025,784.00
2.Committed 8,024,903.78 8,024,903.78 -880.22 -880.22
3.Paid 8,024,903.78 8,024,903.78 400,408.98 400,408.98
% (2)/(1) 99.99 % 99.99 %
Latvija
% (3)/(1) 99.99 % 99.99 %

EN 133 EN
Sum of all transactions, up to 2010, since the beginning of the programming period 2000-2006 Financial year: 2010
Country ERDF ESF EAGGF FIFG Total SF ERDF ESF EAGGF FIFG Total SF
1.Decided 11,866,395.00 11,866,395.00
2.Committed 11,376,778.42 11,376,778.42 -489,616.58 -489,616.58
3.Paid 11,347,602.05 11,347,602.05 74,526.80 74,526.80
% (2)/(1) 95.87 % 95.87 %
Lietuva
% (3)/(1) 95.63 % 95.63 %
1.Decided 4,048,041.00 2,137,084.00 6,185,125.00
2.Committed 4,048,241.09 2,137,084.00 6,185,325.09
3.Paid 3,551,071.25 1,991,135.00 5,542,206.25 591,776.63 591,776.63
% (2)/(1) 100.00 % 100.00 % 100.00 %
Luxembourg (Grand-Duche)
% (3)/(1) 87.72 % 93.17 % 89.61 %
1.Decided 30,292,135.00 30,292,135.00
2.Committed 28,777,527.28 28,777,527.28 -1,514,607.72 -1,514,607.72
3.Paid 28,777,527.28 28,777,527.28
% (2)/(1) 95.00 % 95.00 %
Magyarország
% (3)/(1) 95.00 % 95.00 %
1.Decided 1,241,163.00 1,241,163.00
2.Committed 1,218,073.52 1,218,073.52 -23,089.48 -23,089.48
3.Paid 1,179,104.85 1,179,104.85
% (2)/(1) 98.14 % 98.14 %
Malta
% (3)/(1) 95.00 % 95.00 %
1.Decided 30,250,460.00 158,221,240.00 81,787,596.00 270,259,296.00
2.Committed 30,250,460.00 152,960,434.31 81,787,596.00 264,998,490.31 -5,220,909.87 -5,220,909.87
3.Paid 27,953,364.17 120,808,590.54 77,037,758.00 225,799,712.71 1,057,923.46 1,057,923.46
% (2)/(1) 100.00 % 96.68 % 100.00 % 98.05 %
Nederland
% (3)/(1) 92.41 % 76.35 % 94.19 % 83.55 %

EN 134 EN
Sum of all transactions, up to 2010, since the beginning of the programming period 2000-2006 Financial year: 2010
Country ERDF ESF EAGGF FIFG Total SF ERDF ESF EAGGF FIFG Total SF
1.Decided 8,526,975.00 103,801,243.00 76,833,274.00 189,161,492.00
2.Committed 7,699,937.42 94,280,831.68 74,879,475.53 176,860,244.63 -827,037.58 -9,520,411.32 -10,347,448.90
3.Paid 7,699,937.42 94,280,831.68 74,879,475.53 176,860,244.63 1,887,865.53 1,887,865.53
% (2)/(1) 90.30 % 90.83 % 97.46 % 93.50 %
Österreich
% (3)/(1) 90.30 % 90.83 % 97.46 % 93.50 %
1.Decided 133,938,206.00 133,938,206.00
2.Committed 133,938,206.00 133,938,206.00
3.Paid 127,241,295.70 127,241,295.70
% (2)/(1) 100.00 % 100.00 %
Polska
% (3)/(1) 95.00 % 95.00 %
1.Decided 19,456,845.00 115,809,622.00 164,453,735.00 299,720,202.00
2.Committed 19,456,845.00 115,809,622.00 164,453,735.00 299,720,202.00
3.Paid 16,782,859.71 110,019,140.90 156,231,048.00 283,033,048.61
% (2)/(1) 100.00 % 100.00 % 100.00 % 100.00 %
Portugal
% (3)/(1) 86.26 % 95.00 % 95.00 % 94.43 %
1.Decided 6,165,847.00 6,165,847.00
2.Committed 5,351,962.47 5,351,962.47 -813,884.69 -813,884.69
3.Paid 5,351,962.47 5,351,962.47 355,188.96 355,188.96
% (2)/(1) 86.80 % 86.80 %
Slovenija
% (3)/(1) 86.80 % 86.80 %
1.Decided 22,266,351.00 22,266,351.00
2.Committed 22,266,351.00 22,266,351.00
3.Paid 21,153,033.45 21,153,033.45
% (2)/(1) 100.00 % 100.00 %
Slovenska Republica
% (3)/(1) 95.00 % 95.00 %

EN 135 EN
Sum of all transactions, up to 2010, since the beginning of the programming period 2000-2006 Financial year: 2010
Country ERDF ESF EAGGF FIFG Total SF ERDF ESF EAGGF FIFG Total SF
1.Decided 5,380,115.00 73,576,763.00 56,378,322.00 135,335,200.00
2.Committed 5,380,115.00 69,897,924.85 56,378,322.00 131,656,361.85 -3,678,838.15 -3,678,838.15
3.Paid 4,911,492.23 69,897,924.85 47,898,886.00 122,708,303.08
% (2)/(1) 100.00 % 95.00 % 100.00 % 97.28 %
Suomi/Finland
% (3)/(1) 91.29 % 95.00 % 84.96 % 90.67 %
1.Decided 5,380,115.00 87,722,227.00 41,215,200.00 134,317,542.00
2.Committed 5,380,115.00 86,334,165.13 41,215,200.00 132,929,480.13 -1,388,061.87 -1,388,061.87
3.Paid 5,096,390.40 83,336,115.65 39,154,439.00 127,586,945.05
% (2)/(1) 100.00 % 98.42 % 100.00 % 98.97 %
Sverige
% (3)/(1) 94.73 % 95.00 % 95.00 % 94.99 %
1.Decided 126,178,934.00 406,656,637.00 114,690,197.00 647,525,768.00
2.Committed 126,178,934.00 405,819,709.32 114,690,197.00 646,688,840.32 -836,927.68 -836,927.68
3.Paid 114,136,734.97 380,808,981.92 109,470,989.98 604,416,706.87 1,058,648.44 1,157,192.60 736,241.98 2,952,083.02
% (2)/(1) 100.00 % 99.79 % 100.00 % 99.87 %
United Kingdom
% (3)/(1) 90.46 % 93.64 % 95.45 % 93.34 %
Total 1. Decided 6,395,085,251.00 3,164,323,378.00 2,095,596,811.00 11,655,005,440.00
2.Committed 6,375,290,286.56 3,025,953,502.46 2,093,353,840.18 11,494,597,629.20 -19,794,964.67 -137,915,885.41 -589,681.60 -158,300,531.68
3.Paid 5,955,642,598.87 2,915,414,356.10 1,964,172,904.23 10,835,229,859.20 100,368,208.38 15,702,455.11 15,273,597.21 131,344,260.70
% (2)/(1) 99.69 % 95.63 % 99.89 % 98.62 %
% (3)/(1) 93.13 % 92.13 % 93.73 % 92.97 %
Source: Commission database SFC / ABAC / SINCOM

EN 136 EN
Financial implementation 2010: Objective F
Sum of all transactions, up to 2010, since the beginning of the programming period 2000-2006 Financial year: 2010
Country ERDF ESF EAGGF FIFG Total SF ERDF ESF EAGGF FIFG Total SF
1.Decided 21,309,355.00 21,309,355.00
2.Committed 21,309,355.23 21,309,355.23
3.Paid 19,600,054.39 19,600,054.39
% (2)/(1) 100.00 % 100.00 %
Belgique-België
% (3)/(1) 91.98 % 91.98 %
1.Decided 182,587,747.00 182,587,747.00
2.Committed 182,587,746.81 182,587,746.81
3.Paid 165,065,915.10 165,065,915.10
% (2)/(1) 100.00 % 100.00 %
Danmark
% (3)/(1) 90.40 % 90.40 %
1.Decided 62,992,329.00 62,992,329.00
2.Committed 62,992,329.22 62,992,329.22
3.Paid 48,850,567.16 48,850,567.16
% (2)/(1) 100.00 % 100.00 %
Deutschland
% (3)/(1) 77.55 % 77.55 %
1.Decided 216,600,000.00 216,600,000.00
2.Committed 216,600,000.00 216,600,000.00
3.Paid 205,770,000.00 205,770,000.00
% (2)/(1) 100.00 % 100.00 %
España
% (3)/(1) 95.00 % 95.00 %
1.Decided 243,800,000.00 243,800,000.00
2.Committed 243,800,000.00 243,800,000.00
France
3.Paid 231,610,000.00 231,610,000.00

EN 137 EN
Sum of all transactions, up to 2010, since the beginning of the programming period 2000-2006 Financial year: 2010
Country ERDF ESF EAGGF FIFG Total SF ERDF ESF EAGGF FIFG Total SF% (2)/(1) 100.00 % 100.00 %
% (3)/(1) 95.00 % 95.00 %
1.Decided 99,734,031.00 99,734,031.00
2.Committed 99,734,031.00 99,734,031.00
3.Paid 94,747,329.45 94,747,329.45
% (2)/(1) 100.00 % 100.00 %
Italia
% (3)/(1) 95.00 % 95.00 %
1.Decided 3,419,073.00 3,419,073.00
2.Committed 3,419,073.00 3,419,073.00
3.Paid 3,248,119.35 3,248,119.35
% (2)/(1) 100.00 % 100.00 %
Kypros
% (3)/(1) 95.00 % 95.00 %
1.Decided 32,754,732.00 32,754,732.00
2.Committed 32,754,732.00 32,754,732.00
3.Paid 26,310,085.24 26,310,085.24
% (2)/(1) 100.00 % 100.00 %
Nederland
% (3)/(1) 80.32 % 80.32 %
1.Decided 4,500,000.00 4,500,000.00
2.Committed 4,500,000.00 4,500,000.00
3.Paid 4,229,726.52 4,229,726.52
% (2)/(1) 100.00 % 100.00 %
Österreich
% (3)/(1) 93.99 % 93.99 %
1.Decided 33,500,000.00 33,500,000.00
2.Committed 33,500,000.00 33,500,000.00
Suomi/Finland
3.Paid 30,781,875.81 30,781,875.81

EN 138 EN
Sum of all transactions, up to 2010, since the beginning of the programming period 2000-2006 Financial year: 2010
Country ERDF ESF EAGGF FIFG Total SF ERDF ESF EAGGF FIFG Total SF% (2)/(1) 100.00 % 100.00 %
% (3)/(1) 91.89 % 91.89 %
1.Decided 54,014,745.00 54,014,745.00
2.Committed 54,014,745.08 54,014,745.08
3.Paid 46,721,761.87 46,721,761.87
% (2)/(1) 100.00 % 100.00 %
Sverige
% (3)/(1) 86.50 % 86.50 %
1.Decided 88,913,742.00 88,913,742.00
2.Committed 88,913,742.00 88,913,742.00
3.Paid 57,770,640.53 57,770,640.53
% (2)/(1) 100.00 % 100.00 %
United Kingdom
% (3)/(1) 64.97 % 64.97 %
Total 1. Decided 1,044,125,754.00 1,044,125,754.00
2.Committed 1,044,125,754.34 1,044,125,754.34
3.Paid 934,706,075.42 934,706,075.42
% (2)/(1) 100.00 % 100.00 %
% (3)/(1) 89.52 % 89.52 %
Source: Commission database SFC / ABAC / SINCOM

EN 139 EN
Part 5: Use of Structural Funds in the 2000-2006 period by Objective and Field of Intervention
Prog. complement Total (%) Cert. Expenditure Total (%)Total (SF) 224,613,432,069 100.00 % 222,786,376,488 100.00 %
Prog. complement Total (%) Cert. Expenditure Total (%)Objective 1 (SF) 161,740,543,670 72.01 % 162,971,187,791 73.15 %
Prog. complement(SF)
Total (%) Cert. Expenditure(SF)
Total (%)
1. Productive Environment 56,487,988,042 34.93 % 53,523,362,783 32.84 %10. Productive Environment 31,267,582 0.06 % 37,301,123 0.07 %1. Productive Environment 31,267,582 100.00 % 37,301,123 100.00 %
Prog. complement(SF)
Total (%) Cert. Expenditure(SF)
Total (%)
1. Productive Environment 56,487,988,042 34.93 % 53,523,362,783 32.84 %11. Agriculture 8,598,071,899 15.22 % 8,310,362,907 15.53 %11. Agriculture 624,878,777 7.27 % 605,555,023 7.29 %111. Investments in agricultural holdings 3,871,721,686 45.03 % 3,845,974,839 46.28 %112. Setting up young farmers 1,131,953,445 13.17 % 1,112,487,410 13.39 %114. Improving processing and marketing of agricultural products
2,745,575,629 31.93 % 2,542,088,091 30.59 %
113. Agriculture-specific vocational training 189,717,003 2.21 % 170,541,178 2.05 %1182. Meeting standards: use of farm advisory services
34,225,359 0.40 % 33,716,365 0.41 %
Prog. complement(SF)
Total (%) Cert. Expenditure(SF)
Total (%)
1. Productive Environment 56,487,988,042 34.93 % 53,523,362,783 32.84 %12. Forestry 2,019,003,988 3.57 % 2,022,821,403 3.78 %

EN 140 EN
12. Forestry 489,706,179 24.25 % 496,913,274 24.57 %122. Improving harvesting, processing and marketing of forestry products
98,323,271 4.87 % 95,763,285 4.73 %
123. Promoting new outlets for the use and marketing of forestry products
45,188,848 2.24 % 47,321,004 2.34 %
124. Establishment of associations of forest holders
21,638,173 1.07 % 22,484,444 1.11 %
125. Restoring forestry production potential damaged by natural disasters and fire and introducing appropriate prevention instruments
480,045,072 23.78 % 500,315,451 24.73 %
121. Investments in forest holdings 457,344,364 22.65 % 441,210,252 21.81 %128. Forestry-specific vocational training 78,351,288 3.88 % 73,608,167 3.64 %126. Planting of non-farm land 238,157,797 11.80 % 230,780,937 11.41 %127. Improving and maintaining the ecological stability of protected woodlands
110,248,995 5.46 % 114,424,588 5.66 %
Prog. complement(SF)
Total (%) Cert. Expenditure(SF)
Total (%)
1. Productive Environment 56,487,988,042 34.93 % 53,523,362,783 32.84 %13. Promoting the adaptation and the development of rural areas
10,479,070,105 18.55 % 10,207,048,186 19.07 %
13. Promoting the adaptation and the development of rural areas
876,085,410 8.36 % 808,787,592 7.92 %
1301. Land improvement 189,958,209 1.81 % 182,528,935 1.79 %1302. Reparcelling 550,740,342 5.26 % 537,456,537 5.27 %1303. Setting up of farm relief and farm management services
160,279,871 1.53 % 161,142,784 1.58 %
1304. Marketing of quality agricultural products 179,406,269 1.71 % 170,914,466 1.67 %1305. Basic services for the rural economy and population
332,988,448 3.18 % 318,870,724 3.12 %
1306. Renovation and development of villages and protection and conservation of the rural heritage
2,100,281,868 20.04 % 2,078,691,574 20.37 %

EN 141 EN
1307. Diversification of agricultural activities and activities close to agriculture, to provide multiple activities or alternative incomes
488,653,279 4.66 % 435,767,731 4.27 %
1308. Agricultural water resources management 2,160,194,076 20.61 % 1,963,193,733 19.23 %1309. Development and improvement of infrastructire connected with the development of agriculture
1,602,667,446 15.29 % 1,662,351,611 16.29 %
1310. Encouragement for tourist activities 391,948,168 3.74 % 392,143,441 3.84 %1311. Encouragement for craft activities 434,892,992 4.15 % 439,991,424 4.31 %1312. Preservation of the environment inconnection with land, forestry and landscape conservation as well as with the improvement of animal welfare
702,630,596 6.71 % 739,103,963 7.24 %
1313. Restoring agricultural production potential damaged by natural disaters and introducing appropriate prevention instruments
250,798,235 2.39 % 246,372,607 2.41 %
1314. Financial engineering 43,178,009 0.41 % 52,088,325 0.51 %1399. LEADER+ 14,366,887 0.14 % 17,642,740 0.17 %
Prog. complement(SF)
Total (%) Cert. Expenditure(SF)
Total (%)
1. Productive Environment 56,487,988,042 34.93 % 53,523,362,783 32.84 %14. Fisheries 2,920,327,130 5.17 % 2,622,680,891 4.64 %14. Fisheries 57,551,432 1.97 % 37,245,090 64.72 %141. Adjustment of the fishing effort 431,621,728 14.78 % 430,688,651 99.78 %142. Renewal and modernisation of the fishing fleet
518,781,002 17.76 % 465,161,674 89.66 %
143. Processing, marketing and promoting of fisheries products
630,943,772 21.61 % 567,353,980 89.92 %
144. Aquaculture 337,670,049 11.56 % 286,409,977 84.82 %145. Equipment of the fishing ports and protection of the coastal marine zones
390,106,792 13.36 % 289,250,975 74.15 %

EN 142 EN
146. Socio-economic measures (including aids to the temporary stopping and compensation for technical restrictions)
339,915,760 11.64 % 346,157,608 101.84 %
147. Actions by professionals (including vocational training, small coastal fishing)
110,922,865 3.80 % 104,522,971 94.23 %
148. Measures financed by other Structural Funds (ERDF, ESF)
102,813,729 3.52 % 95,889,965 93.27 %
Prog. complement(SF)
Total (%) Cert. Expenditure(SF)
Total (%)
1. Productive Environment 56,487,988,042 34.93 % 53,523,362,783 32.84 %15. Assisting large business organisations 4,364,959,091 7.73 % 4,380,849,014 8.18 %15. Assisting large business organisations 438,279,245 10.04 % 446,090,015 10.18 %151. Investment in physical capital (plant and equipment, cofinancing of state aids)
2,847,969,052 65.25 % 2,789,482,851 63.67 %
152. Environment-friendly technologies, clean and economical energy technologies
358,284,408 8.21 % 376,522,000 8.59 %
153. Business advisory services (including internationalisation, exporting and environmental management, purchase of technology)
504,032,744 11.55 % 569,202,976 12.99 %
154. Services to stakeholders (health and safety, providing care for dependants)
56,297,890 1.29 % 56,559,585 1.29 %
155. Financial engineering 160,095,751 3.67 % 142,991,587 3.26 %
Prog. complement(SF)
Total (%) Cert. Expenditure(SF)
Total (%)
1. Productive Environment 56,487,988,042 34.93 % 53,523,362,783 32.84 %16. Assisting SMEs and the craft sector 15,020,123,741 26.59 % 15,061,255,464 28.14 %16. Assisting SMEs and the craft sector 763,725,373 5.08 % 763,008,954 5.07 %161. Investment in physical capital (plant and equipment, cofinancing of state aids)
7,896,909,788 52.58 % 7,954,433,027 52.81 %
162. Environment-friendly technologies, clean and economical energy technologies
811,331,951 5.40 % 845,393,174 5.61 %

EN 143 EN
163. Business advisory services (information, business planning, consultancy services, marketing, management, design, internationalisation, exporting, environmental management, purchase of technology)
1,747,059,287 11.63 % 1,786,552,276 11.86 %
164. Shared business services (business estates, incubator units, stimulation, promotional services, networking, conferences, trade fairs)
2,004,489,982 13.35 % 2,050,083,341 13.61 %
165. Financial engineering 1,087,944,964 7.24 % 1,032,987,005 6.86 %166. Services in support of the social economy (providing care for dependents, health and safety, cultural activities)
300,677,117 2.00 % 296,445,911 1.97 %
167. Vocational training 407,985,278 2.72 % 332,351,776 2.21 %
Prog. complement(SF)
Total (%) Cert. Expenditure(SF)
Total (%)
1. Productive Environment 56,487,988,042 34.93 % 53,523,362,783 32.84 %17. Tourism 5,141,814,509 9.10 % 5,251,164,642 9.81 %17. Tourism 572,532,726 11.13 % 588,123,456 11.20 %171. Physical investment (information centres, tourist accommodation, catering, facilities)
3,113,182,196 60.55 % 3,188,415,411 60.72 %
172. Non-physical investments (development and provision of tourist services, sporting, cultural and leisure activities, heritage)
681,891,664 13.26 % 673,632,187 12.83 %
173. Shared services for the tourism industry (including promotional activities, networking, conferences and trade fairs)
613,587,949 11.93 % 628,374,789 11.97 %
174. Vocational training 160,619,973 3.12 % 172,618,799 3.29 %
Prog. complement(SF)
Total (%) Cert. Expenditure(SF)
Total (%)
1. Productive Environment 56,487,988,042 34.93 % 53,523,362,783 32.84 %18. Research, technological development and 7,913,349,997 14.01 % 8,083,212,797 15.10 %

EN 144 EN
innovation (RTDI)18. Research, technological development and innovation (RTDI)
533,631,025 6.74 % 529,774,352 6.55 %
181. Research projects based in universities and research institutes
1,939,709,568 24.51 % 2,008,760,563 24.85 %
182. Innovation and technology transfers, establishment of networks and partnerships between businesses and/or research institutes
2,640,461,537 33.37 % 2,667,431,925 33.00 %
183. RTDI Infrastructure 2,445,597,218 30.90 % 2,523,955,651 31.22 %184. Training for researchers 353,950,649 4.47 % 353,290,306 4.37 %
Prog. complement(SF)
Total (%) Cert. Expenditure(SF)
Total (%)
2. Human Resources 36,469,898,378 22.55 % 37,006,528,445 22.71 %20. Human Resources 98,582,302 0.27 % 93,712,100 0.25 %2. Human Resources 98,582,302 100.00 % 93,712,100 100.00 %
Prog. complement(SF)
Total (%) Cert. Expenditure(SF)
Total (%)
2. Human Resources 36,469,898,378 22.55 % 37,006,528,445 22.71 %21. Labour market policy 11,169,905,319 30.63 % 11,446,763,293 30.93 %21. Labour market policy 11,169,905,319 100.00 % 11,446,763,293 100.00 %
Prog. complement(SF)
Total (%) Cert. Expenditure(SF)
Total (%)
2. Human Resources 36,469,898,378 22.55 % 37,006,528,445 22.71 %22. Social inclusion 4,902,656,985 13.44 % 4,934,542,032 13.33 %22. Social inclusion 4,902,656,985 100.00 % 4,934,542,032 100.00 %
Prog. complement(SF)
Total (%) Cert. Expenditure(SF)
Total (%)
2. Human Resources 36,469,898,378 22.55 % 37,006,528,445 22.71 %23. Developing educational and vocational 11,376,619,570 31.19 % 11,553,614,983 31.22 %

EN 145 EN
training (persons, firms)23. Developing educational and vocational training (persons, firms)
11,376,619,570 100.00 % 11,553,614,983 100.00 %
Prog. complement(SF)
Total (%) Cert. Expenditure(SF)
Total (%)
2. Human Resources 36,469,898,378 22.55 % 37,006,528,445 22.71 %24. Workforce flexibility, entrepreneurial activity, innovation, information and communication technologies (persons, firms)
7,010,515,844 19.22 % 7,048,424,640 19.05 %
24. Workforce flexibility, entrepreneurial activity, innovation, information and communication technologies (persons, firms)
7,010,515,844 100.00 % 7,048,424,640 100.00 %
Prog. complement(SF)
Total (%) Cert. Expenditure(SF)
Total (%)
2. Human Resources 36,469,898,378 22.55 % 37,006,528,445 22.71 %25. Positive labour market actions for woman 1,911,618,359 5.24 % 1,929,471,398 5.21 %25. Positive labour market actions for woman 1,911,618,359 100.00 % 1,929,471,398 100.00 %
Prog. complement(SF)
Total (%) Cert. Expenditure(SF)
Total (%)
3. Basic Infrastructure 65,085,431,094 40.24 % 69,081,841,854 42.39 %30. Basic Infrastructure 4,997,238 0.01 % 5,197,480 0.01 %3. Basic Infrastructure 4,997,238 100.00 % 5,197,480 100.00 %
Prog. complement(SF)
Total (%) Cert. Expenditure(SF)
Total (%)
3. Basic Infrastructure 65,085,431,094 40.24 % 69,081,841,854 42.39 %31. Transport infrastructure 32,460,747,092 49.87 % 35,170,514,692 50.91 %31. Transport infrastructure 477,381,715 1.47 % 473,347,241 1.35 %311. Rail 7,537,857,661 23.22 % 8,382,170,576 23.83 %3121. National roads 2,267,519,323 6.99 % 2,626,505,142 7.47 %

EN 146 EN
3122. Regional/local roads 2,767,047,249 8.52 % 3,013,880,040 8.57 %3123. Cycle tracks 33,401,364 0.10 % 36,433,745 0.10 %312. Roads 9,199,064,879 28.34 % 9,999,151,451 28.43 %313. Motorways 4,305,893,031 13.26 % 4,521,233,178 12.86 %314. Airports 915,485,819 2.82 % 1,057,556,866 3.01 %315. Ports 1,437,264,597 4.43 % 1,488,139,879 4.23 %316. Waterways 79,523,156 0.24 % 82,636,316 0.23 %317. Urban Transport 2,070,842,642 6.38 % 2,062,894,496 5.87 %318. Multimodal Transport 940,816,936 2.90 % 993,205,357 2.82 %319. Intelligent Transport Systems 428,648,719 1.32 % 433,360,407 1.23 %
Prog. complement(SF)
Total (%) Cert. Expenditure(SF)
Total (%)
3. Basic Infrastructure 65,085,431,094 40.24 % 69,081,841,854 42.39 %32. Telecommunications infrastructure and information society
5,568,003,450 8.55 % 5,759,206,450 8.34 %
32. Telecommunications infrastructure and information society
335,924,949 6.03 % 357,386,810 6.21 %
321. Basic infrastructure 998,129,349 17.93 % 1,052,588,350 18.28 %322. Information and Communication Technology (including security and safe transmission measures)
1,463,126,644 26.28 % 1,483,630,045 25.76 %
323. Services and applications for the citizen (health, administration, education)
1,831,855,673 32.90 % 1,884,457,449 32.72 %
324. Services and applications for SMEs (electronic commerce and transactions, education and training, networking)
938,966,835 16.86 % 981,143,795 17.04 %
Prog. complement(SF)
Total (%) Cert. Expenditure(SF)
Total (%)
3. Basic Infrastructure 65,085,431,094 40.24 % 69,081,841,854 42.39 %33. Energy infrastructures (production, delivery)
1,355,363,505 2.08 % 1,334,285,235 1.93 %

EN 147 EN
33. Energy infrastructures (production, delivery) 384,203,715 28.35 % 391,055,077 29.31 %331. Electricity, gas, petrol, solid fuel 357,302,037 26.36 % 359,768,002 26.96 %332. Renewable sources of energy (solar power, wind power, hydro-electricity, biomass)
379,311,638 27.99 % 362,446,895 27.16 %
333. Energy efficiency, cogeneration, energy control
234,546,114 17.31 % 221,015,261 16.56 %
Prog. complement(SF)
Total (%) Cert. Expenditure(SF)
Total (%)
3. Basic Infrastructure 65,085,431,094 40.24 % 69,081,841,854 42.39 %34. Environmental infrastructure (including water)
10,360,323,077 15.92 % 10,731,115,326 15.53 %
34. Environmental infrastructure (including water) 2,070,332,225 19.98 % 2,106,486,382 19.63 %341. Air 280,869,612 2.71 % 281,814,983 2.63 %342. Noise 44,736,817 0.43 % 45,084,324 0.42 %343. Urban and industrial waste (including hospital and dangerous waste)
1,315,569,362 12.70 % 1,381,808,498 12.88 %
344. Drinking water (collection, storage, treatment and distribution)
2,832,897,955 27.34 % 2,874,170,855 26.78 %
345. Sewerage and purification 3,815,917,107 36.83 % 4,041,750,284 37.66 %
Prog. complement(SF)
Total (%) Cert. Expenditure(SF)
Total (%)
3. Basic Infrastructure 65,085,431,094 40.24 % 69,081,841,854 42.39 %35. Planning and rehabilitation 8,888,625,815 13.66 % 9,193,437,700 13.31 %35. Planning and rehabilitation 204,820,245 2.30 % 209,344,327 2.28 %351. Upgrading and Rehabilitation of industrial and military sites
1,194,182,796 13.43 % 1,192,660,878 12.97 %
352. Rehabilitation of urban areas 3,291,314,250 37.03 % 3,485,282,008 37.91 %353. Protection, improvement and regeneration of the natural environment
2,459,235,873 27.67 % 2,451,378,498 26.66 %
354. Maintenance and restoration of the cultural heritage
1,739,072,652 19.57 % 1,854,771,989 20.17 %

EN 148 EN
Prog. complement(SF)
Total (%) Cert. Expenditure(SF)
Total (%)
3. Basic Infrastructure 65,085,431,094 40.24 % 69,081,841,854 42.39 %36. Social infrastructure and public health 6,447,370,917 9.91 % 6,888,084,970 9.97 %36. Social infrastructure and public health 6,447,370,917 100.00 % 6,888,084,970 100.00 %
Prog. complement(SF)
Total (%) Cert. Expenditure(SF)
Total (%)
4. Miscelllaneous 3,697,226,155 2.29 % 3,359,454,710 2.06 %40. Miscelllaneous 256,519,006 6.94 % 286,203,280 8.52 %4. Miscelllaneous 256,519,006 100.00 % 286,203,280 100.00 %
Prog. complement(SF)
Total (%) Cert. Expenditure(SF)
Total (%)
4. Miscelllaneous 3,697,226,155 2.29 % 3,359,454,710 2.06 %41. Technical assistance and innovative actions (ERDF, ESF, EAGGF, FIFG)
2,978,327,631 80.56 % 2,621,039,212 78.02 %
41. Technical assistance and innovative actions (ERDF, ESF, EAGGF, FIFG)
568,552,064 19.09 % 455,350,740 17.37 %
411. Preparation, implementation, monitoring, publicity
1,147,303,437 38.52 % 1,077,880,401 41.12 %
412. Evaluation 227,627,985 7.64 % 208,238,186 7.94 %413. Studies 658,644,114 22.11 % 603,265,660 23.02 %414. Innovative actions 182,465,288 6.13 % 89,336,047 3.41 %415. Information to the public 193,734,742 6.50 % 186,968,178 7.13 %
Prog. complement(SF)
Total (%) Cert. Expenditure(SF)
Total (%)
4. Miscelllaneous 3,697,226,155 2.29 % 3,359,454,710 2.06 %49. 462,379,518 12.51 % 452,212,218 13.46 %499. Data not available 462,379,518 100.00 % 452,212,218 100.00 %

EN 149 EN
Prog. complement Total (%) Cert. Expenditure Total (%)Objective 2 (SF) 24,295,551,652 10.82 % 23,754,059,201 10.66 %
Prog. complement(SF)
Total (%) Cert. Expenditure(SF)
Total (%)
1. Productive Environment 13,458,381,153 55.39 % 13,020,352,807 54.81 %10. Productive Environment 8,008,875 0.06 % 7,924,553 0.06 %1. Productive Environment 8,008,875 100.00 % 7,924,553 100.00 %
Prog. complement(SF)
Total (%) Cert. Expenditure(SF)
Total (%)
1. Productive Environment 13,458,381,153 55.39 % 13,020,352,807 54.81 %11. Agriculture 29,318,825 0.22 % 27,233,185 0.21 %11. Agriculture 6,298,307 21.48 % 5,802,777 21.31 %112. Setting up young farmers 8,168,382 27.86 % 6,950,963 25.52 %113. Agriculture-specific vocational training 14,852,136 50.66 % 14,479,445 53.17 %
Prog. complement(SF)
Total (%) Cert. Expenditure(SF)
Total (%)
1. Productive Environment 13,458,381,153 55.39 % 13,020,352,807 54.81 %12. Forestry 9,601,560 0.07 % 10,065,662 0.08 %123. Promoting new outlets for the use and marketing of forestry products
353,218 3.68 % 407,849 4.05 %
128. Forestry-specific vocational training 5,167,142 53.82 % 5,308,087 52.73 %127. Improving and maintaining the ecological stability of protected woodlands
4,081,201 42.51 % 4,349,726 43.21 %
Prog. complement(SF)
Total (%) Cert. Expenditure(SF)
Total (%)
1. Productive Environment 13,458,381,153 55.39 % 13,020,352,807 54.81 %13. Promoting the adaptation and the development of rural areas
591,784,017 4.40 % 580,733,562 4.46 %

EN 150 EN
13. Promoting the adaptation and the development of rural areas
81,367,577 13.75 % 79,688,852 13.72 %
1301. Land improvement 2,640,677 0.45 % 2,600,971 0.45 %1302. Reparcelling 7,727,620 1.31 % 6,642,731 1.14 %1304. Marketing of quality agricultural products 1,141,974 0.19 % 1,132,719 0.20 %1305. Basic services for the rural economy and population
58,585,548 9.90 % 55,841,300 9.62 %
1306. Renovation and development of villages and protection and conservation of the rural heritage
204,851,425 34.62 % 202,462,970 34.86 %
1307. Diversification of agricultural activities and activities close to agriculture, to provide multiple activities or alternative incomes
11,498,154 1.94 % 10,875,293 1.87 %
1308. Agricultural water resources management 9,929,872 1.68 % 9,699,910 1.67 %1309. Development and improvement of infrastructire connected with the development of agriculture
34,664,176 5.86 % 31,963,696 5.50 %
1310. Encouragement for tourist activities 51,694,452 8.74 % 55,641,038 9.58 %1311. Encouragement for craft activities 15,891,092 2.69 % 15,022,746 2.59 %1312. Preservation of the environment inconnection with land, forestry and landscape conservation as well as with the improvement of animal welfare
109,450,725 18.50 % 106,853,581 18.40 %
1314. Financial engineering 2,340,726 0.40 % 2,307,757 0.40 %
Prog. complement(SF)
Total (%) Cert. Expenditure(SF)
Total (%)
1. Productive Environment 13,458,381,153 55.39 % 13,020,352,807 54.81 %14. Fisheries 12,751,774 0.09 % 12,732,091 0.10 %14. Fisheries 4,573,486 35.87 % 4,684,075 36.79 %145. Equipment of the fishing ports and protection of the coastal marine zones
1,900,470 14.90 % 1,850,095 14.53 %
148. Measures financed by other Structural Funds (ERDF, ESF)
6,277,819 49.23 % 6,197,921 48.68 %

EN 151 EN
Prog. complement(SF)
Total (%) Cert. Expenditure(SF)
Total (%)
1. Productive Environment 13,458,381,153 55.39 % 13,020,352,807 54.81 %15. Assisting large business organisations 560,852,368 4.17 % 543,053,639 4.17 %15. Assisting large business organisations 41,035,409 7.32 % 39,523,715 7.28 %151. Investment in physical capital (plant and equipment, cofinancing of state aids)
431,271,473 76.90 % 418,978,966 77.15 %
152. Environment-friendly technologies, clean and economical energy technologies
26,171,118 4.67 % 24,611,320 4.53 %
153. Business advisory services (including internationalisation, exporting and environmental management, purchase of technology)
32,395,097 5.78 % 31,866,566 5.87 %
154. Services to stakeholders (health and safety, providing care for dependants)
330,749 0.06 % 250,783 0.05 %
155. Financial engineering 29,648,522 5.29 % 27,822,288 5.12 %
Prog. complement(SF)
Total (%) Cert. Expenditure(SF)
Total (%)
1. Productive Environment 13,458,381,153 55.39 % 13,020,352,807 54.81 %16. Assisting SMEs and the craft sector 7,484,106,293 55.61 % 7,094,157,259 54.49 %16. Assisting SMEs and the craft sector 1,125,681,491 15.04 % 1,067,051,310 15.04 %161. Investment in physical capital (plant and equipment, cofinancing of state aids)
1,950,219,380 26.06 % 1,943,754,002 27.40 %
162. Environment-friendly technologies, clean and economical energy technologies
298,784,199 3.99 % 286,038,676 4.03 %
163. Business advisory services (information, business planning, consultancy services, marketing, management, design, internationalisation, exporting, environmental management, purchase of technology)
1,358,855,903 18.16 % 1,219,352,501 17.19 %

EN 152 EN
164. Shared business services (business estates, incubator units, stimulation, promotional services, networking, conferences, trade fairs)
1,647,734,223 22.02 % 1,553,049,174 21.89 %
165. Financial engineering 488,597,562 6.53 % 446,240,108 6.29 %166. Services in support of the social economy (providing care for dependents, health and safety, cultural activities)
382,570,955 5.11 % 365,286,193 5.15 %
167. Vocational training 231,662,581 3.10 % 213,385,295 3.01 %
Prog. complement(SF)
Total (%) Cert. Expenditure(SF)
Total (%)
1. Productive Environment 13,458,381,153 55.39 % 13,020,352,807 54.81 %17. Tourism 2,269,394,363 16.86 % 2,300,508,411 17.67 %17. Tourism 268,978,354 11.85 % 266,241,830 11.57 %171. Physical investment (information centres, tourist accommodation, catering, facilities)
1,397,406,167 61.58 % 1,426,212,546 62.00 %
172. Non-physical investments (development and provision of tourist services, sporting, cultural and leisure activities, heritage)
369,775,600 16.29 % 376,407,890 16.36 %
173. Shared services for the tourism industry (including promotional activities, networking, conferences and trade fairs)
198,632,162 8.75 % 197,144,733 8.57 %
174. Vocational training 34,602,080 1.52 % 34,501,413 1.50 %
Prog. complement(SF)
Total (%) Cert. Expenditure(SF)
Total (%)
1. Productive Environment 13,458,381,153 55.39 % 13,020,352,807 54.81 %18. Research, technological development and innovation (RTDI)
2,492,563,077 18.52 % 2,443,944,445 18.77 %
18. Research, technological development and innovation (RTDI)
251,824,729 10.10 % 237,688,200 9.73 %
181. Research projects based in universities and research institutes
646,131,144 25.92 % 651,332,911 26.65 %

EN 153 EN
182. Innovation and technology transfers, establishment of networks and partnerships between businesses and/or research institutes
896,703,558 35.98 % 867,970,928 35.52 %
183. RTDI Infrastructure 680,701,648 27.31 % 670,264,945 27.43 %184. Training for researchers 17,201,998 0.69 % 16,687,461 0.68 %
Prog. complement(SF)
Total (%) Cert. Expenditure(SF)
Total (%)
2. Human Resources 2,554,162,327 10.51 % 2,373,462,215 9.99 %20. Human Resources 124,208,021 4.86 % 114,878,748 4.84 %2. Human Resources 124,208,021 100.00 % 114,878,748 100.00 %
Prog. complement(SF)
Total (%) Cert. Expenditure(SF)
Total (%)
2. Human Resources 2,554,162,327 10.51 % 2,373,462,215 9.99 %21. Labour market policy 448,555,744 17.56 % 426,978,207 17.99 %21. Labour market policy 448,555,744 100.00 % 426,978,207 100.00 %
Prog. complement(SF)
Total (%) Cert. Expenditure(SF)
Total (%)
2. Human Resources 2,554,162,327 10.51 % 2,373,462,215 9.99 %22. Social inclusion 486,445,817 19.05 % 451,494,454 19.02 %22. Social inclusion 486,445,817 100.00 % 451,494,454 100.00 %
Prog. complement(SF)
Total (%) Cert. Expenditure(SF)
Total (%)
2. Human Resources 2,554,162,327 10.51 % 2,373,462,215 9.99 %23. Developing educational and vocational training (persons, firms)
550,104,122 21.54 % 520,956,206 21.95 %
23. Developing educational and vocational training (persons, firms)
550,104,122 100.00 % 520,956,206 100.00 %

EN 154 EN
Prog. complement(SF)
Total (%) Cert. Expenditure(SF)
Total (%)
2. Human Resources 2,554,162,327 10.51 % 2,373,462,215 9.99 %24. Workforce flexibility, entrepreneurial activity, innovation, information and communication technologies (persons, firms)
807,932,364 31.63 % 730,122,190 30.76 %
24. Workforce flexibility, entrepreneurial activity, innovation, information and communication technologies (persons, firms)
807,932,364 100.00 % 730,122,190 100.00 %
Prog. complement(SF)
Total (%) Cert. Expenditure(SF)
Total (%)
2. Human Resources 2,554,162,327 10.51 % 2,373,462,215 9.99 %25. Positive labour market actions for woman 136,916,260 5.36 % 129,032,410 5.44 %25. Positive labour market actions for woman 136,916,260 100.00 % 129,032,410 100.00 %
Prog. complement(SF)
Total (%) Cert. Expenditure(SF)
Total (%)
3. Basic Infrastructure 7,107,138,025 29.25 % 7,253,049,121 30.53 %30. Basic Infrastructure 211,368,935 2.97 % 211,043,330 2.91 %3. Basic Infrastructure 211,368,935 100.00 % 211,043,330 100.00 %
Prog. complement(SF)
Total (%) Cert. Expenditure(SF)
Total (%)
3. Basic Infrastructure 7,107,138,025 29.25 % 7,253,049,121 30.53 %31. Transport infrastructure 1,392,257,454 19.59 % 1,461,447,033 20.15 %31. Transport infrastructure 202,993,864 14.58 % 195,119,250 13.35 %311. Rail 186,506,019 13.40 % 219,776,807 15.04 %3121. National roads 84,057,511 6.04 % 98,694,375 6.75 %3122. Regional/local roads 113,756,195 8.17 % 126,659,820 8.67 %3123. Cycle tracks 17,740,150 1.27 % 18,567,108 1.27 %312. Roads 147,983,968 10.63 % 151,894,320 10.39 %313. Motorways 10,927,125 0.78 % 10,693,475 0.73 %

EN 155 EN
314. Airports 13,967,232 1.00 % 15,961,956 1.09 %315. Ports 256,981,424 18.46 % 266,914,002 18.26 %316. Waterways 18,424,341 1.32 % 18,798,787 1.29 %317. Urban Transport 93,621,532 6.72 % 91,691,433 6.27 %318. Multimodal Transport 239,463,913 17.20 % 240,842,690 16.48 %319. Intelligent Transport Systems 5,834,180 0.42 % 5,833,011 0.40 %
Prog. complement(SF)
Total (%) Cert. Expenditure(SF)
Total (%)
3. Basic Infrastructure 7,107,138,025 29.25 % 7,253,049,121 30.53 %32. Telecommunications infrastructure and information society
764,490,511 10.76 % 755,536,264 10.42 %
32. Telecommunications infrastructure and information society
168,840,590 22.09 % 167,930,789 22.23 %
321. Basic infrastructure 126,553,522 16.55 % 128,374,234 16.99 %322. Information and Communication Technology (including security and safe transmission measures)
134,944,954 17.65 % 127,358,793 16.86 %
323. Services and applications for the citizen (health, administration, education)
137,471,409 17.98 % 134,696,388 17.83 %
324. Services and applications for SMEs (electronic commerce and transactions, education and training, networking)
196,680,035 25.73 % 197,176,060 26.10 %
Prog. complement(SF)
Total (%) Cert. Expenditure(SF)
Total (%)
3. Basic Infrastructure 7,107,138,025 29.25 % 7,253,049,121 30.53 %33. Energy infrastructures (production, delivery)
211,106,115 2.97 % 200,070,853 2.76 %
33. Energy infrastructures (production, delivery) 37,214,846 17.63 % 36,469,488 18.23 %331. Electricity, gas, petrol, solid fuel 28,072,357 13.30 % 27,766,329 13.88 %332. Renewable sources of energy (solar power, wind power, hydro-electricity, biomass)
84,977,367 40.25 % 77,661,828 38.82 %

EN 156 EN
333. Energy efficiency, cogeneration, energy control
60,841,545 28.82 % 58,173,207 29.08 %
Prog. complement(SF)
Total (%) Cert. Expenditure(SF)
Total (%)
3. Basic Infrastructure 7,107,138,025 29.25 % 7,253,049,121 30.53 %34. Environmental infrastructure (including water)
1,006,746,732 14.17 % 1,062,283,473 14.65 %
34. Environmental infrastructure (including water) 306,454,041 30.44 % 309,280,718 29.11 %341. Air 39,873,502 3.96 % 39,754,827 3.74 %342. Noise 7,550,801 0.75 % 7,880,504 0.74 %343. Urban and industrial waste (including hospital and dangerous waste)
141,038,835 14.01 % 154,872,496 14.58 %
344. Drinking water (collection, storage, treatment and distribution)
214,185,759 21.28 % 227,500,281 21.42 %
345. Sewerage and purification 297,643,794 29.56 % 322,994,647 30.41 %
Prog. complement(SF)
Total (%) Cert. Expenditure(SF)
Total (%)
3. Basic Infrastructure 7,107,138,025 29.25 % 7,253,049,121 30.53 %35. Planning and rehabilitation 3,239,499,657 45.58 % 3,277,795,362 45.19 %35. Planning and rehabilitation 319,004,320 9.85 % 323,262,133 9.86 %351. Upgrading and Rehabilitation of industrial and military sites
1,002,540,063 30.95 % 980,607,514 29.92 %
352. Rehabilitation of urban areas 1,244,630,466 38.42 % 1,268,198,421 38.69 %353. Protection, improvement and regeneration of the natural environment
371,781,062 11.48 % 389,728,238 11.89 %
354. Maintenance and restoration of the cultural heritage
301,543,747 9.31 % 315,999,055 9.64 %
Prog. complement(SF)
Total (%) Cert. Expenditure(SF)
Total (%)
3. Basic Infrastructure 7,107,138,025 29.25 % 7,253,049,121 30.53 %
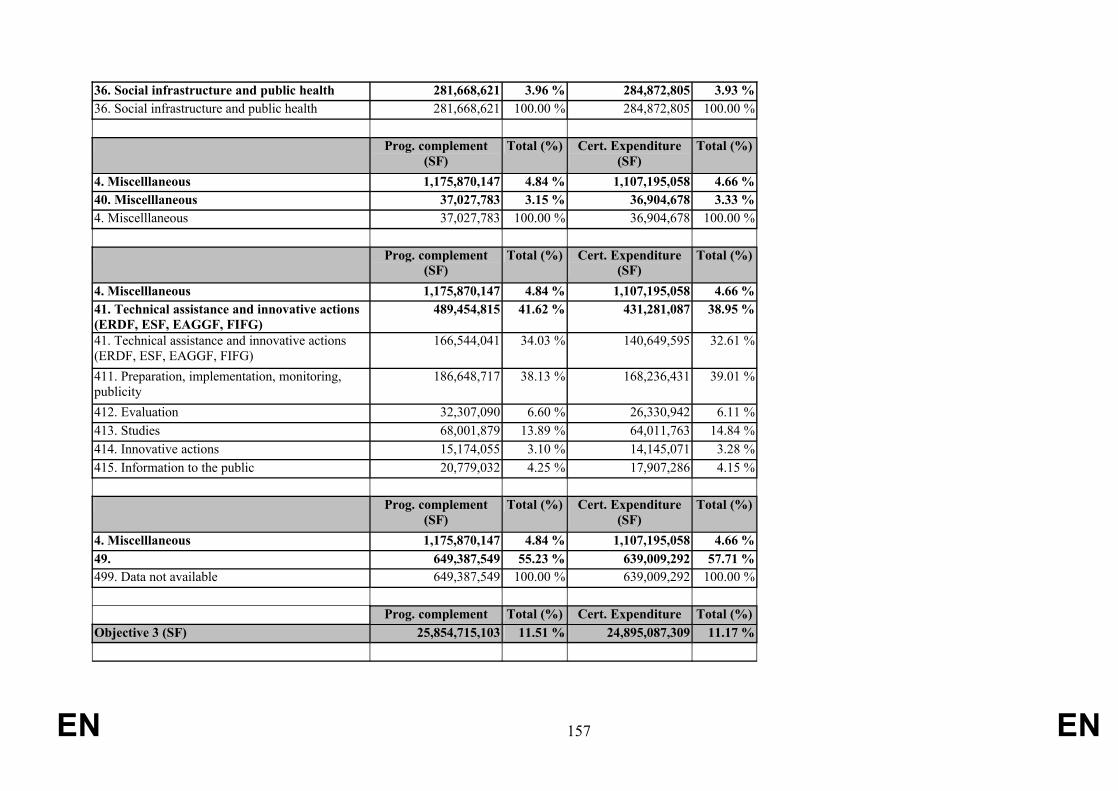
EN 157 EN
36. Social infrastructure and public health 281,668,621 3.96 % 284,872,805 3.93 %36. Social infrastructure and public health 281,668,621 100.00 % 284,872,805 100.00 %
Prog. complement(SF)
Total (%) Cert. Expenditure(SF)
Total (%)
4. Miscelllaneous 1,175,870,147 4.84 % 1,107,195,058 4.66 %40. Miscelllaneous 37,027,783 3.15 % 36,904,678 3.33 %4. Miscelllaneous 37,027,783 100.00 % 36,904,678 100.00 %
Prog. complement(SF)
Total (%) Cert. Expenditure(SF)
Total (%)
4. Miscelllaneous 1,175,870,147 4.84 % 1,107,195,058 4.66 %41. Technical assistance and innovative actions (ERDF, ESF, EAGGF, FIFG)
489,454,815 41.62 % 431,281,087 38.95 %
41. Technical assistance and innovative actions (ERDF, ESF, EAGGF, FIFG)
166,544,041 34.03 % 140,649,595 32.61 %
411. Preparation, implementation, monitoring, publicity
186,648,717 38.13 % 168,236,431 39.01 %
412. Evaluation 32,307,090 6.60 % 26,330,942 6.11 %413. Studies 68,001,879 13.89 % 64,011,763 14.84 %414. Innovative actions 15,174,055 3.10 % 14,145,071 3.28 %415. Information to the public 20,779,032 4.25 % 17,907,286 4.15 %
Prog. complement(SF)
Total (%) Cert. Expenditure(SF)
Total (%)
4. Miscelllaneous 1,175,870,147 4.84 % 1,107,195,058 4.66 %49. 649,387,549 55.23 % 639,009,292 57.71 %499. Data not available 649,387,549 100.00 % 639,009,292 100.00 %
Prog. complement Total (%) Cert. Expenditure Total (%)Objective 3 (SF) 25,854,715,103 11.51 % 24,895,087,309 11.17 %
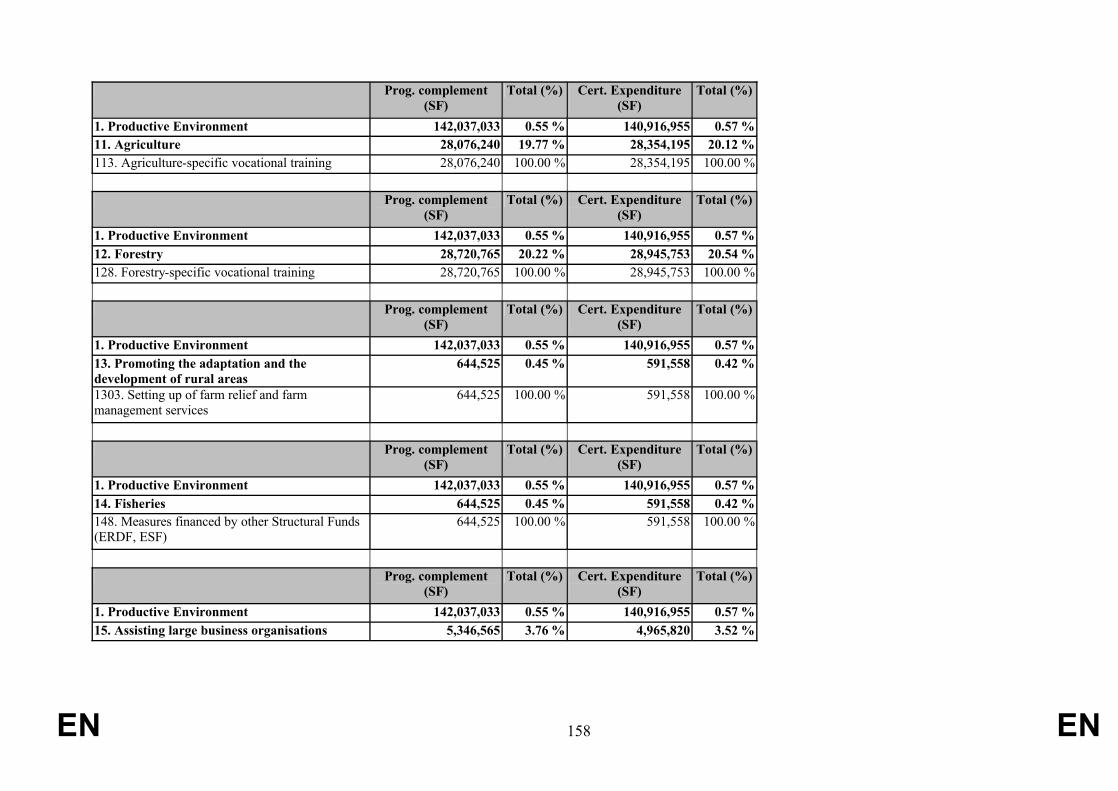
EN 158 EN
Prog. complement(SF)
Total (%) Cert. Expenditure(SF)
Total (%)
1. Productive Environment 142,037,033 0.55 % 140,916,955 0.57 %11. Agriculture 28,076,240 19.77 % 28,354,195 20.12 %113. Agriculture-specific vocational training 28,076,240 100.00 % 28,354,195 100.00 %
Prog. complement(SF)
Total (%) Cert. Expenditure(SF)
Total (%)
1. Productive Environment 142,037,033 0.55 % 140,916,955 0.57 %12. Forestry 28,720,765 20.22 % 28,945,753 20.54 %128. Forestry-specific vocational training 28,720,765 100.00 % 28,945,753 100.00 %
Prog. complement(SF)
Total (%) Cert. Expenditure(SF)
Total (%)
1. Productive Environment 142,037,033 0.55 % 140,916,955 0.57 %13. Promoting the adaptation and the development of rural areas
644,525 0.45 % 591,558 0.42 %
1303. Setting up of farm relief and farm management services
644,525 100.00 % 591,558 100.00 %
Prog. complement(SF)
Total (%) Cert. Expenditure(SF)
Total (%)
1. Productive Environment 142,037,033 0.55 % 140,916,955 0.57 %14. Fisheries 644,525 0.45 % 591,558 0.42 %148. Measures financed by other Structural Funds (ERDF, ESF)
644,525 100.00 % 591,558 100.00 %
Prog. complement(SF)
Total (%) Cert. Expenditure(SF)
Total (%)
1. Productive Environment 142,037,033 0.55 % 140,916,955 0.57 %15. Assisting large business organisations 5,346,565 3.76 % 4,965,820 3.52 %

EN 159 EN
153. Business advisory services (including internationalisation, exporting and environmental management, purchase of technology)
5,346,565 100.00 % 4,965,820 100.00 %
Prog. complement(SF)
Total (%) Cert. Expenditure(SF)
Total (%)
1. Productive Environment 142,037,033 0.55 % 140,916,955 0.57 %16. Assisting SMEs and the craft sector 36,000,905 25.35 % 35,686,245 25.32 %163. Business advisory services (information, business planning, consultancy services, marketing, management, design, internationalisation, exporting, environmental management, purchase of technology)
5,346,565 14.85 % 4,965,820 13.92 %
164. Shared business services (business estates, incubator units, stimulation, promotional services, networking, conferences, trade fairs)
644,525 1.79 % 591,558 1.66 %
165. Financial engineering 644,525 1.79 % 591,558 1.66 %166. Services in support of the social economy (providing care for dependents, health and safety, cultural activities)
644,525 1.79 % 591,558 1.66 %
167. Vocational training 28,720,765 79.78 % 28,945,753 81.11 %
Prog. complement(SF)
Total (%) Cert. Expenditure(SF)
Total (%)
1. Productive Environment 142,037,033 0.55 % 140,916,955 0.57 %17. Tourism 29,365,290 20.67 % 29,537,310 20.96 %173. Shared services for the tourism industry (including promotional activities, networking, conferences and trade fairs)
644,525 2.19 % 591,558 2.00 %
174. Vocational training 28,720,765 97.81 % 28,945,753 98.00 %
Prog. complement(SF)
Total (%) Cert. Expenditure(SF)
Total (%)

EN 160 EN
1. Productive Environment 142,037,033 0.55 % 140,916,955 0.57 %18. Research, technological development and innovation (RTDI)
13,238,218 9.32 % 12,244,516 8.69 %
181. Research projects based in universities and research institutes
8,294,893 62.66 % 7,828,918 63.94 %
182. Innovation and technology transfers, establishment of networks and partnerships between businesses and/or research institutes
2,579,280 19.48 % 2,294,425 18.74 %
184. Training for researchers 2,364,045 17.86 % 2,121,174 17.32 %
Prog. complement(SF)
Total (%) Cert. Expenditure(SF)
Total (%)
2. Human Resources 25,101,436,032 97.09 % 24,216,762,127 97.28 %20. Human Resources 37,610,300 0.15 % 23,207,045 0.10 %2. Human Resources 37,610,300 100.00 % 23,207,045 100.00 %
Prog. complement(SF)
Total (%) Cert. Expenditure(SF)
Total (%)
2. Human Resources 25,101,436,032 97.09 % 24,216,762,127 97.28 %21. Labour market policy 7,504,037,832 29.89 % 7,372,490,798 30.44 %21. Labour market policy 7,504,037,832 100.00 % 7,372,490,798 100.00 %
Prog. complement(SF)
Total (%) Cert. Expenditure(SF)
Total (%)
2. Human Resources 25,101,436,032 97.09 % 24,216,762,127 97.28 %22. Social inclusion 5,342,018,070 21.28 % 4,987,349,620 20.59 %22. Social inclusion 5,342,018,070 100.00 % 4,987,349,620 100.00 %
Prog. complement(SF)
Total (%) Cert. Expenditure(SF)
Total (%)
2. Human Resources 25,101,436,032 97.09 % 24,216,762,127 97.28 %23. Developing educational and vocational training (persons, firms)
5,710,121,732 22.75 % 5,503,967,416 22.73 %

EN 161 EN
23. Developing educational and vocational training (persons, firms)
5,710,121,732 100.00 % 5,503,967,416 100.00 %
Prog. complement(SF)
Total (%) Cert. Expenditure(SF)
Total (%)
2. Human Resources 25,101,436,032 97.09 % 24,216,762,127 97.28 %24. Workforce flexibility, entrepreneurial activity, innovation, information and communication technologies (persons, firms)
4,846,891,516 19.31 % 4,762,108,446 19.66 %
24. Workforce flexibility, entrepreneurial activity, innovation, information and communication technologies (persons, firms)
4,846,891,516 100.00 % 4,762,108,446 100.00 %
Prog. complement(SF)
Total (%) Cert. Expenditure(SF)
Total (%)
2. Human Resources 25,101,436,032 97.09 % 24,216,762,127 97.28 %25. Positive labour market actions for woman 1,660,756,583 6.62 % 1,567,638,801 6.47 %25. Positive labour market actions for woman 1,660,756,583 100.00 % 1,567,638,801 100.00 %
Prog. complement(SF)
Total (%) Cert. Expenditure(SF)
Total (%)
3. Basic Infrastructure 92,568,775 0.36 % 92,914,751 0.37 %32. Telecommunications infrastructure and information society
86,162,295 93.08 % 86,837,258 93.46 %
322. Information and Communication Technology (including security and safe transmission measures)
28,720,765 33.33 % 28,945,753 33.33 %
323. Services and applications for the citizen (health, administration, education)
28,720,765 33.33 % 28,945,753 33.33 %
324. Services and applications for SMEs (electronic commerce and transactions, education and training, networking)
28,720,765 33.33 % 28,945,753 33.33 %

EN 162 EN
Prog. complement(SF)
Total (%) Cert. Expenditure(SF)
Total (%)
3. Basic Infrastructure 92,568,775 0.36 % 92,914,751 0.37 %36. Social infrastructure and public health 6,406,480 6.92 % 6,077,493 6.54 %36. Social infrastructure and public health 6,406,480 100.00 % 6,077,493 100.00 %
Prog. complement(SF)
Total (%) Cert. Expenditure(SF)
Total (%)
4. Miscelllaneous 518,673,263 2.01 % 444,493,475 1.79 %41. Technical assistance and innovative actions (ERDF, ESF, EAGGF, FIFG)
518,673,263 100.00 % 444,493,475 100.00 %
41. Technical assistance and innovative actions (ERDF, ESF, EAGGF, FIFG)
436,206,490 84.10 % 371,947,869 83.68 %
411. Preparation, implementation, monitoring, publicity
41,724,453 8.04 % 40,701,354 9.16 %
412. Evaluation 6,135,011 1.18 % 3,922,386 0.88 %413. Studies 5,937,976 1.14 % 4,316,526 0.97 %414. Innovative actions 11,283,857 2.18 % 9,689,846 2.18 %415. Information to the public 17,385,475 3.35 % 13,915,495 3.13 %
Prog. complement Total (%) Cert. Expenditure Total (%)Objective F (SF) 1,044,125,754 0.46 % 912,638,218
Prog. complement(SF)
Total (%) Cert. Expenditure(SF)
Total (%)
1. Productive Environment 964,954,640 92.42 % 850,678,152 93.21 %14. Fisheries 964,954,640 100.00 % 850,678,152 88.16 %141. Adjustment of the fishing effort 171,685,278 17.79 % 168,824,292 19.84 %142. Renewal and modernisation of the fishing fleet
168,852,388 17.50 % 141,393,192 16.62 %
143. Processing, marketing and promoting of fisheries products
258,141,196 26.75 % 220,933,474 25.97 %
144. Aquaculture 53,467,390 5.54 % 45,678,345 5.4 %

EN 163 EN
145. Equipment of the fishing ports and protection of the coastal marine zones
162,726,258 16.86 % 142,137,472 16.71 %
146. Socio-economic measures (including aids to the temporary stopping and compensation for technical restrictions)
27,070,729 2.81 % 25,984,224 3.05 %
147. Actions by professionals (including vocational training, small coastal fishing)
123,011,401 12.75 % 105,727,152 12.43 %
Prog. complement(SF)
Total (%) Cert. Expenditure(SF)
Total (%)
4. Miscelllaneous 79,171,114 7.58 %41. Technical assistance and innovative actions (ERDF, ESF, EAGGF, FIFG)
79,171,114 100.00 %
41. Technical assistance and innovative actions (ERDF, ESF, EAGGF, FIFG)
12,583,072 15.89 %
411. Preparation, implementation, monitoring, publicity
6,599,303 8.34 %
413. Studies 2,515,727 3.18 %414. Innovative actions 57,158,546 72.20 %415. Information to the public 314,466 0.40 %
Prog. complement Total (%) Cert. Expenditure Total (%)IC (SF) 11,678,495,890 5.20 % 11,166,042,188 5.01 %
Prog. complement(SF)
Total (%) Cert. Expenditure(SF)
Total (%)
1. Productive Environment 4,187,311,429 35.85 % 4,052,129,061 36.29 %10. Productive Environment 900,131 0.02 % 1,137,758 0.03 %1. Productive Environment 900,131 100.00 % 1,137,758 100.00 %
Prog. complement(SF)
Total (%) Cert. Expenditure(SF)
Total (%)
1. Productive Environment 4,187,311,429 35.85 % 4,052,129,061 36.29 %

EN 164 EN
11. Agriculture 47,998,696 1.15 % 47,886,752 1.18 %11. Agriculture 1,141,770 2.38 % 1,153,377 2.41 %111. Investments in agricultural holdings 14,790,961 30.82 % 14,229,244 29.71 %114. Improving processing and marketing of agricultural products
27,554,969 57.41 % 27,938,032 58.34 %
113. Agriculture-specific vocational training 4,510,996 9.40 % 4,566,099 9.54 %
Prog. complement(SF)
Total (%) Cert. Expenditure(SF)
Total (%)
1. Productive Environment 4,187,311,429 35.85 % 4,052,129,061 36.29 %12. Forestry 43,652,221 1.04 % 42,496,148 1.05 %12. Forestry 3,442,705 7.89 % 3,285,015 7.73 %122. Improving harvesting, processing and marketing of forestry products
6,452,273 14.78 % 5,925,388 13.94 %
123. Promoting new outlets for the use and marketing of forestry products
745,874 1.71 % 683,010 1.61 %
124. Establishment of associations of forest holders
22,415 0.05 % 21,672 0.05 %
125. Restoring forestry production potential damaged by natural disasters and fire and introducing appropriate prevention instruments
12,489,840 28.61 % 12,630,750 29.72 %
121. Investments in forest holdings 1,726,079 3.95 % 1,493,341 3.51 %128. Forestry-specific vocational training 2,971,909 6.81 % 2,898,170 6.82 %126. Planting of non-farm land 3,576,449 8.19 % 3,618,935 8.52 %127. Improving and maintaining the ecological stability of protected woodlands
12,224,678 28.00 % 11,939,867 28.10 %
Prog. complement(SF)
Total (%) Cert. Expenditure(SF)
Total (%)
1. Productive Environment 4,187,311,429 35.85 % 4,052,129,061 36.29 %13. Promoting the adaptation and the development of rural areas
2,460,491,826 58.76 % 2,393,215,905 59.06 %
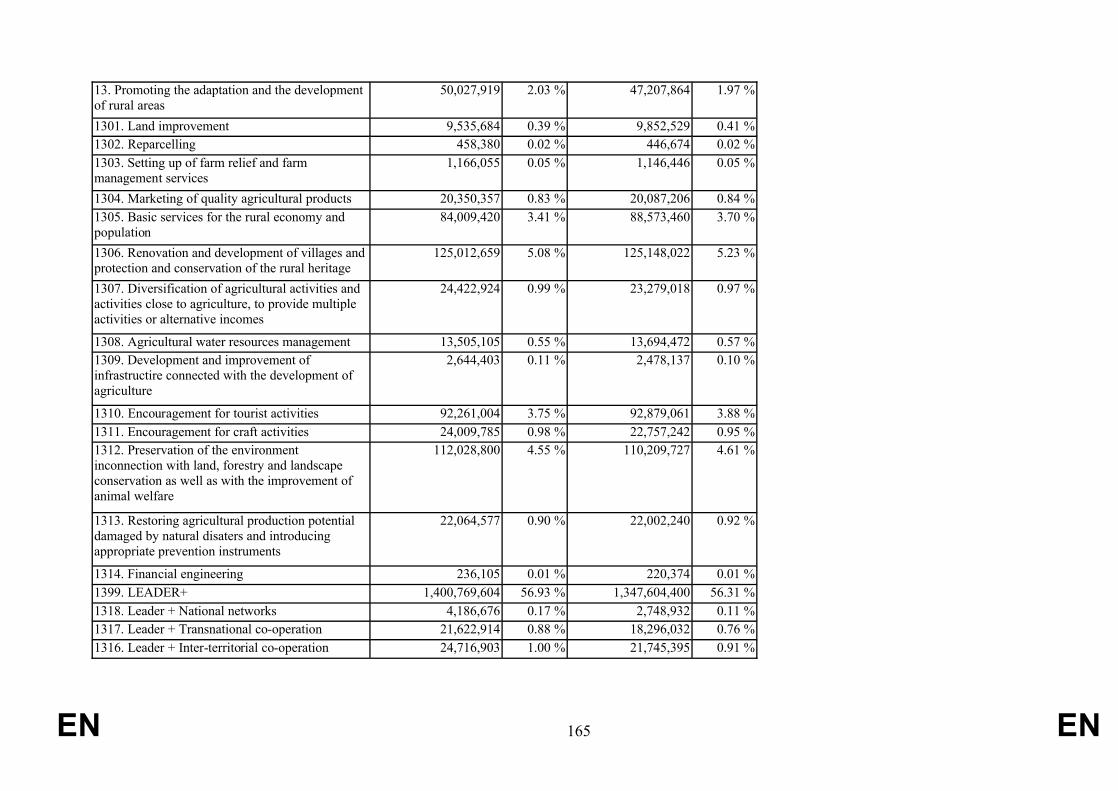
EN 165 EN
13. Promoting the adaptation and the development of rural areas
50,027,919 2.03 % 47,207,864 1.97 %
1301. Land improvement 9,535,684 0.39 % 9,852,529 0.41 %1302. Reparcelling 458,380 0.02 % 446,674 0.02 %1303. Setting up of farm relief and farm management services
1,166,055 0.05 % 1,146,446 0.05 %
1304. Marketing of quality agricultural products 20,350,357 0.83 % 20,087,206 0.84 %1305. Basic services for the rural economy and population
84,009,420 3.41 % 88,573,460 3.70 %
1306. Renovation and development of villages and protection and conservation of the rural heritage
125,012,659 5.08 % 125,148,022 5.23 %
1307. Diversification of agricultural activities and activities close to agriculture, to provide multiple activities or alternative incomes
24,422,924 0.99 % 23,279,018 0.97 %
1308. Agricultural water resources management 13,505,105 0.55 % 13,694,472 0.57 %1309. Development and improvement of infrastructire connected with the development of agriculture
2,644,403 0.11 % 2,478,137 0.10 %
1310. Encouragement for tourist activities 92,261,004 3.75 % 92,879,061 3.88 %1311. Encouragement for craft activities 24,009,785 0.98 % 22,757,242 0.95 %1312. Preservation of the environment inconnection with land, forestry and landscape conservation as well as with the improvement of animal welfare
112,028,800 4.55 % 110,209,727 4.61 %
1313. Restoring agricultural production potential damaged by natural disaters and introducing appropriate prevention instruments
22,064,577 0.90 % 22,002,240 0.92 %
1314. Financial engineering 236,105 0.01 % 220,374 0.01 %1399. LEADER+ 1,400,769,604 56.93 % 1,347,604,400 56.31 %1318. Leader + National networks 4,186,676 0.17 % 2,748,932 0.11 %1317. Leader + Transnational co-operation 21,622,914 0.88 % 18,296,032 0.76 %1316. Leader + Inter-territorial co-operation 24,716,903 1.00 % 21,745,395 0.91 %

EN 166 EN
1315. Leader + LAG overhead and animation costs 427,462,551 17.37 % 422,838,675 17.67 %
Prog. complement(SF)
Total (%) Cert. Expenditure(SF)
Total (%)
1. Productive Environment 4,187,311,429 35.85 % 4,052,129,061 36.29 %14. Fisheries 20,420,003 0.49 % 20,008,361 0.49 %14. Fisheries 723,518 3.54 % 578,552 2.89 %141. Adjustment of the fishing effort 858,652 4.20 % 888,794 4.44 %142. Renewal and modernisation of the fishing fleet
998,248 4.89 % 1,017,515 5.09 %
143. Processing, marketing and promoting of fisheries products
9,419,921 46.13 % 9,428,353 47.12 %
144. Aquaculture 1,998,072 9.78 % 2,001,877 10.01 %145. Equipment of the fishing ports and protection of the coastal marine zones
998,248 4.89 % 1,017,515 5.09 %
146. Socio-economic measures (including aids to the temporary stopping and compensation for technical restrictions)
998,248 4.89 % 1,017,515 5.09 %
147. Actions by professionals (including vocational training, small coastal fishing)
836,237 4.10 % 867,122 4.33 %
148. Measures financed by other Structural Funds (ERDF, ESF)
3,588,859 17.58 % 3,191,116 15.95 %
Prog. complement(SF)
Total (%) Cert. Expenditure(SF)
Total (%)
1. Productive Environment 4,187,311,429 35.85 % 4,052,129,061 36.29 %15. Assisting large business organisations 29,716,255 0.71 % 27,564,107 0.68 %15. Assisting large business organisations 4,540,828 15.28 % 4,077,686 14.79 %151. Investment in physical capital (plant and equipment, cofinancing of state aids)
3,492,953 11.75 % 3,283,421 11.91 %
152. Environment-friendly technologies, clean and economical energy technologies
10,355,908 34.85 % 9,805,796 35.57 %

EN 167 EN
153. Business advisory services (including internationalisation, exporting and environmental management, purchase of technology)
8,302,388 27.94 % 7,501,202 27.21 %
154. Services to stakeholders (health and safety, providing care for dependants)
2,932,698 9.87 % 2,810,113 10.19 %
155. Financial engineering 91,480 0.31 % 85,889 0.31 %
Prog. complement(SF)
Total (%) Cert. Expenditure(SF)
Total (%)
1. Productive Environment 4,187,311,429 35.85 % 4,052,129,061 36.29 %16. Assisting SMEs and the craft sector 730,358,278 17.44 % 699,492,183 17.26 %16. Assisting SMEs and the craft sector 85,201,995 11.67 % 79,547,799 11.37 %161. Investment in physical capital (plant and equipment, cofinancing of state aids)
61,918,164 8.48 % 55,797,013 7.98 %
162. Environment-friendly technologies, clean and economical energy technologies
78,999,979 10.82 % 72,851,568 10.41 %
163. Business advisory services (information, business planning, consultancy services, marketing, management, design, internationalisation, exporting, environmental management, purchase of technology)
206,783,240 28.31 % 204,683,423 29.26 %
164. Shared business services (business estates, incubator units, stimulation, promotional services, networking, conferences, trade fairs)
147,228,377 20.16 % 139,104,337 19.89 %
165. Financial engineering 19,376,987 2.65 % 18,425,045 2.63 %166. Services in support of the social economy (providing care for dependents, health and safety, cultural activities)
63,343,204 8.67 % 60,498,757 8.65 %
167. Vocational training 67,506,331 9.24 % 68,584,239 9.80 %
Prog. complement(SF)
Total (%) Cert. Expenditure(SF)
Total (%)
1. Productive Environment 4,187,311,429 35.85 % 4,052,129,061 36.29 %

EN 168 EN
17. Tourism 559,672,523 13.37 % 539,595,996 13.32 %17. Tourism 124,042,065 22.16 % 118,022,693 21.87 %171. Physical investment (information centres, tourist accommodation, catering, facilities)
104,027,774 18.59 % 103,302,175 19.14 %
172. Non-physical investments (development and provision of tourist services, sporting, cultural and leisure activities, heritage)
167,161,620 29.87 % 158,725,765 29.42 %
173. Shared services for the tourism industry (including promotional activities, networking, conferences and trade fairs)
116,071,576 20.74 % 112,552,303 20.86 %
174. Vocational training 48,369,487 8.64 % 46,993,060 8.71 %
Prog. complement(SF)
Total (%) Cert. Expenditure(SF)
Total (%)
1. Productive Environment 4,187,311,429 35.85 % 4,052,129,061 36.29 %18. Research, technological development and innovation (RTDI)
294,101,497 7.02 % 280,731,852 6.93 %
18. Research, technological development and innovation (RTDI)
57,337,330 19.50 % 54,667,527 19.47 %
181. Research projects based in universities and research institutes
71,093,962 24.17 % 67,345,283 23.99 %
182. Innovation and technology transfers, establishment of networks and partnerships between businesses and/or research institutes
117,852,814 40.07 % 112,650,743 40.13 %
183. RTDI Infrastructure 35,436,438 12.05 % 34,827,940 12.41 %184. Training for researchers 12,380,953 4.21 % 11,240,358 4.00 %
Prog. complement(SF)
Total (%) Cert. Expenditure(SF)
Total (%)
2. Human Resources 3,411,936,417 29.22 % 3,242,353,636 29.04 %20. Human Resources 215,530,122 6.32 % 201,230,232 6.21 %2. Human Resources 215,530,122 100.00 % 201,230,232 100.00 %

EN 169 EN
Prog. complement(SF)
Total (%) Cert. Expenditure(SF)
Total (%)
2. Human Resources 3,411,936,417 29.22 % 3,242,353,636 29.04 %21. Labour market policy 625,177,758 18.32 % 596,142,671 18.39 %21. Labour market policy 625,177,758 100.00 % 596,142,671 100.00 %
Prog. complement(SF)
Total (%) Cert. Expenditure(SF)
Total (%)
2. Human Resources 3,411,936,417 29.22 % 3,242,353,636 29.04 %22. Social inclusion 810,174,173 23.75 % 780,025,173 24.06 %22. Social inclusion 810,174,173 100.00 % 780,025,173 100.00 %
Prog. complement(SF)
Total (%) Cert. Expenditure(SF)
Total (%)
2. Human Resources 3,411,936,417 29.22 % 3,242,353,636 29.04 %23. Developing educational and vocational training (persons, firms)
466,692,398 13.68 % 439,613,503 13.56 %
23. Developing educational and vocational training (persons, firms)
466,692,398 100.00 % 439,613,503 100.00 %
Prog. complement(SF)
Total (%) Cert. Expenditure(SF)
Total (%)
2. Human Resources 3,411,936,417 29.22 % 3,242,353,636 29.04 %24. Workforce flexibility, entrepreneurial activity, innovation, information and communication technologies (persons, firms)
905,356,244 26.53 % 858,622,869 26.48 %
24. Workforce flexibility, entrepreneurial activity, innovation, information and communication technologies (persons, firms)
905,356,244 100.00 % 858,622,869 100.00 %
Prog. complement(SF)
Total (%) Cert. Expenditure(SF)
Total (%)
2. Human Resources 3,411,936,417 29.22 % 3,242,353,636 29.04 %
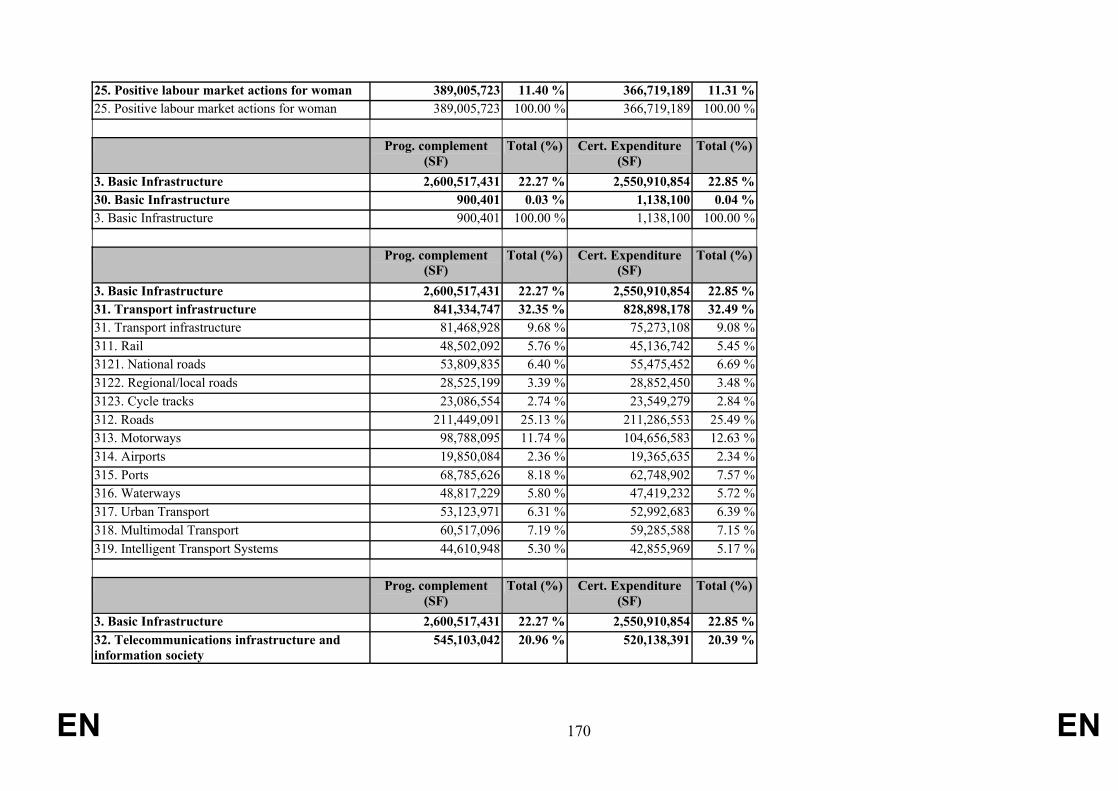
EN 170 EN
25. Positive labour market actions for woman 389,005,723 11.40 % 366,719,189 11.31 %25. Positive labour market actions for woman 389,005,723 100.00 % 366,719,189 100.00 %
Prog. complement(SF)
Total (%) Cert. Expenditure(SF)
Total (%)
3. Basic Infrastructure 2,600,517,431 22.27 % 2,550,910,854 22.85 %30. Basic Infrastructure 900,401 0.03 % 1,138,100 0.04 %3. Basic Infrastructure 900,401 100.00 % 1,138,100 100.00 %
Prog. complement(SF)
Total (%) Cert. Expenditure(SF)
Total (%)
3. Basic Infrastructure 2,600,517,431 22.27 % 2,550,910,854 22.85 %31. Transport infrastructure 841,334,747 32.35 % 828,898,178 32.49 %31. Transport infrastructure 81,468,928 9.68 % 75,273,108 9.08 %311. Rail 48,502,092 5.76 % 45,136,742 5.45 %3121. National roads 53,809,835 6.40 % 55,475,452 6.69 %3122. Regional/local roads 28,525,199 3.39 % 28,852,450 3.48 %3123. Cycle tracks 23,086,554 2.74 % 23,549,279 2.84 %312. Roads 211,449,091 25.13 % 211,286,553 25.49 %313. Motorways 98,788,095 11.74 % 104,656,583 12.63 %314. Airports 19,850,084 2.36 % 19,365,635 2.34 %315. Ports 68,785,626 8.18 % 62,748,902 7.57 %316. Waterways 48,817,229 5.80 % 47,419,232 5.72 %317. Urban Transport 53,123,971 6.31 % 52,992,683 6.39 %318. Multimodal Transport 60,517,096 7.19 % 59,285,588 7.15 %319. Intelligent Transport Systems 44,610,948 5.30 % 42,855,969 5.17 %
Prog. complement(SF)
Total (%) Cert. Expenditure(SF)
Total (%)
3. Basic Infrastructure 2,600,517,431 22.27 % 2,550,910,854 22.85 %32. Telecommunications infrastructure andinformation society
545,103,042 20.96 % 520,138,391 20.39 %

EN 171 EN
32. Telecommunications infrastructure and information society
80,701,984 14.80 % 74,310,166 14.29 %
321. Basic infrastructure 86,546,633 15.88 % 85,155,300 16.37 %322. Information and Communication Technology (including security and safe transmission measures)
131,507,384 24.13 % 125,474,190 24.12 %
323. Services and applications for the citizen (health, administration, education)
143,984,771 26.41 % 136,631,273 26.27 %
324. Services and applications for SMEs (electronic commerce and transactions, education and training, networking)
102,362,270 18.78 % 98,567,461 18.95 %
Prog. complement(SF)
Total (%) Cert. Expenditure(SF)
Total (%)
3. Basic Infrastructure 2,600,517,431 22.27 % 2,550,910,854 22.85 %33. Energy infrastructures (production, delivery)
78,505,681 3.02 % 74,428,443 2.92 %
33. Energy infrastructures (production, delivery) 4,076,208 5.19 % 3,912,996 5.26 %331. Electricity, gas, petrol, solid fuel 8,279,139 10.55 % 8,201,344 11.02 %332. Renewable sources of energy (solar power, wind power, hydro-electricity, biomass)
54,814,887 69.82 % 52,370,886 70.36 %
333. Energy efficiency, cogeneration, energy control
11,335,448 14.44 % 9,943,217 13.36 %
Prog. complement(SF)
Total (%) Cert. Expenditure(SF)
Total (%)
3. Basic Infrastructure 2,600,517,431 22.27 % 2,550,910,854 22.85 %34. Environmental infrastructure (including water)
262,213,847 10.08 % 257,449,175 10.09 %
34. Environmental infrastructure (including water) 25,335,311 9.66 % 22,030,446 8.56 %341. Air 11,993,491 4.57 % 12,176,532 4.73 %342. Noise 8,196,539 3.13 % 8,402,895 3.26 %

EN 172 EN
343. Urban and industrial waste (including hospital and dangerous waste)
78,290,749 29.86 % 78,929,108 30.66 %
344. Drinking water (collection, storage, treatment and distribution)
78,501,866 29.94 % 76,851,677 29.85 %
345. Sewerage and purification 59,895,891 22.84 % 59,058,517 22.94 %
Prog. complement(SF)
Total (%) Cert. Expenditure(SF)
Total (%)
3. Basic Infrastructure 2,600,517,431 22.27 % 2,550,910,854 22.85 %35. Planning and rehabilitation 716,321,327 27.55 % 710,584,893 27.86 %35. Planning and rehabilitation 133,559,176 18.65 % 123,155,560 17.33 %351. Upgrading and Rehabilitation of industrial and military sites
51,740,587 7.22 % 52,033,280 7.32 %
352. Rehabilitation of urban areas 288,722,723 40.31 % 292,303,468 41.14 %353. Protection, improvement and regeneration of the natural environment
129,047,223 18.02 % 130,158,929 18.32 %
354. Maintenance and restoration of the cultural heritage
113,251,618 15.81 % 112,933,656 15.89 %
Prog. complement(SF)
Total (%) Cert. Expenditure(SF)
Total (%)
3. Basic Infrastructure 2,600,517,431 22.27 % 2,550,910,854 22.85 %36. Social infrastructure and public health 156,138,387 6.00 % 158,273,674 6.20 %36. Social infrastructure and public health 156,138,387 100.00 % 158,273,674 100.00 %
Prog. complement(SF)
Total (%) Cert. Expenditure(SF)
Total (%)
4. Miscelllaneous 1,478,730,612 12.66 % 1,320,648,636 11.83 %40. Miscelllaneous 1,315,101 0.09 % 1,225,976 0.09 %4. Miscelllaneous 1,315,101 100.00 % 1,225,976 100.00 %
Prog. complement(SF)
Total (%) Cert. Expenditure(SF)
Total (%)

EN 173 EN
4. Miscelllaneous 1,478,730,612 12.66 % 1,320,648,636 11.83 %41. Technical assistance and innovative actions (ERDF, ESF, EAGGF, FIFG)
1,411,676,742 95.47 % 1,252,307,760 94.83 %
41. Technical assistance and innovative actions (ERDF, ESF, EAGGF, FIFG)
196,332,833 13.91 % 154,857,714 12.37 %
411. Preparation, implementation, monitoring, publicity
217,444,696 15.40 % 192,009,946 15.33 %
412. Evaluation 40,668,139 2.88 % 30,712,897 2.45 %413. Studies 360,767,416 25.56 % 335,133,887 26.76 %414. Innovative actions 463,617,785 32.84 % 418,996,497 33.46 %415. Information to the public 132,845,874 9.41 % 120,596,820 9.63 %
Prog. complement(SF)
Total (%) Cert. Expenditure(SF)
Total (%)
4. Miscelllaneous 1,478,730,612 12.66 % 1,320,648,636 11.83 %49. 65,738,768 4.45 % 67,114,900 5.08 %499. Data not available 65,738,768 100.00 % 67,114,900 100.00 %
Source: Commission database SFC, data as of December 2010

EN 174 EN
Part 6: Information on financial corrections and recoveries in the Structural Funds
1. INTRODUCTION
It is important for the Commission to have reliable information on all types of financial corrections and recoveries resulting from Commission, European Court of Auditors and Member States audit activities. The Commission needs this information to perform its supervisory role and to provide evidence that the multi-annual control system is working, as financial corrections and recoveries are generally carried out in years subsequent to the one in which the respective payments from the Union budget were made.
In its most recent annual reports the European Court of Auditors noted weaknesses in the information provided by the Commission on reporting of financial corrections by Member States. In the Annual Report for 2009, the Court noted for the second consecutive year that the Commission reports reliable information on financial corrections as long as they result from its own audit activities. Based on the Court’s observations, the European Parliament and the Council have been consistently calling for detailed, complete and easily readable information on financial corrections and recoveries to be published and regularly updated.
The Commission now regularly publishes this information. Figures on corrections and recoveries resulting from Commission audit work, audit work by the Court of Auditors and OLAF investigations have been provided in the explanatory notes to the Commission’s accounts since 2006. Since the beginning of 2008 the Commission has also been reporting corrections resulting from its work and that of other EU bodies to the Parliament on a quarterly basis, under the Action Plan to strengthen the Commission’s supervisory role in the shared management of structural actions16.
Information on corrections by the Member States has been provided in annexes to the Annual Report on the Implementation of the Structural Funds since 200617. The Commission is also publishing summary information on Member States’ financial corrections in the Notes to its Annual Accounts (Note 6).
The present annex contains detailed cumulative information on Member States’ corrections for the period 2000-2006, and repeats the data on corrections and recoveries resulting from its own and other EU bodies’ work published in Note 6 to the
16 See final impact report on the Action Plan in COM(2010) 52.17 See Commission staff working document SEC(2007) 1456: Annex to the 18th Annual Report on
Implementation of the Structural Funds (2006) (COM(2007) 676 final), Part 7 ‘Information on financial corrections and recoveries in the Structural Funds’. See Commission staff working document SEC(2008) 2649: Annex to the 19th Annual Report on Implementation of the Structural Funds (2007) (COM(2008) 659 final), Part 6 ‘Information on financial corrections and recoveries in the Structural Funds’. See Commission staff working document SEC(2009) 1495: Annex to the 20th Annual Report on Implementation of the Structural Funds (2008) (COM(2009) 617 final), Part 6 ‘Information on financial corrections and recoveries in the Structural Funds’.

EN 175 EN
Commission’s Annual Accounts for 2010, in order to provide a complete picture of correction activity in the Structural Funds.
For a detailed explanation of the terminology and procedures in the area of financial corrections and recoveries and the reporting of irregularities, reference is made to Note 6 to the Commission's Annual Accounts for 2010.
2. FINANCIAL CORRECTION ACTIVITY AND RECOVERIES BY MEMBER STATES
2.1. Execution of financial corrections (withdrawals and recoveries) by Member States for the 2000-2006 period
In the previous years, the Commission required Member States to provide information on their financial corrections (reported as withdrawals, recoveries and pending recoveries) of Structural Funds both for the year in question and cumulatively for the whole 2000-2006 period, and for all four funds (ERDF, ESF, EAGGF and FIFG).
In their reports on financial corrections, the Member States were asked to distinguish between ‘withdrawals’ and ‘recoveries’. The distinction is as follows. When correcting irregular expenditure Member States have a choice between:
– withdrawing the expenditure affected from the programme immediately by deducting it from the next statement of expenditure submitted to the Commission, thereby immediately releasing the EU funding for commitment to other operations; or
– leaving the expenditure for the time being in the programme pending the outcome of proceedings to recover the unduly paid amount from the beneficiaries and removing the expenditure once the recovery has been effected18. Recovery is made either by obtaining repayment of the sums concerned from the beneficiary or setting off the sums to be repaid against further payments due to the same beneficiary.
In addition, Member States were required to report the amounts awaiting recovery (i.e. subject to a recovery procedure but not yet recovered), or ‘pending recoveries’.
As the period 2000-2006 is now at closure phase, during which proof of deduction is requested in relation to all irregularities, Member States were not required to separately submit to the Commission information on withdrawals, recoveries and pending recoveries. The information in point 2.1.1 below presents cumulative information submitted by the Member States in the previous years for the whole programming period 2000-2006, complemented by additional information received in March 2011 from Greece, Belgium, Hungary, Portugal and regarding Inter-regional programmes.
Based on data received so far, in terms of EU contribution, Member States have reported a total of some EUR 5,1 billion of cumulative financial corrections resulting
18 If the unduly paid amounts cannot be recovered and the Member State wishes the EU contribution to be
borne by the Community budget, it does not remove the expenditure but leaves it in the declaration.

EN 176 EN
from their national audit work for the 2000-2006 programmes (total withdrawals of some EUR 4 billion and recoveries of some EUR 1,1 billion).
2.1.1. Cumulative totals of withdrawals and recoveries for the entire 2000–2006 period up to the end of 2010
Below are the data submitted for the cumulative totals of withdrawals and recoveries for the entire 2000-2006 period. The data for a number of Member States are incomplete as they do not cover the earlier years of the programming period.
Totals by FundEUR million
Cumulative total of withdrawals Cumulative total of recoveriesFund
Total public funding*
EU contribution
Total public funding*
EU contribution
ERDF 4 727.32 2 803.65 1 153.17 824.89
ESF 1 648.07 1 014.22 487.50 214.54
EAGGF 192.85 129.17 136.69 61.94
FIFG 27.04 18.78 12.54 8.52
Total 6 595.28 3 965.83 1 789.91.89 1 109.88
Source: Member States (rounded figures)
* Total public funding includes national public funding and the EU contribution
Total by Member State (all Funds) and for INTERREG/PEACE
EUR million
Cumulative total of withdrawals Cumulative total of recoveriesMember State
Total public funding*
EU contribution
Total public funding*
EU contribution
BE 63.84 22.75 12.13 8.24
CZ 21.26 15.69 2.84 1.67
DK 0 0 5.16 1.59
DE 238.62 128.51 266.92 172.04
EE 2.60 1.57 0 0
IE 132.24 65.49 0.27 0.21
EL 2227.45 1587.13 0 0

EN 177 EN
Cumulative total of withdrawals Cumulative total of recoveriesMember State
Total public funding*
EU contribution
Total public funding*
EU contribution
ES 2072.97 1267.63 6.89 4.84
FR 155.00 36.34 3.36 0.91
IT 1025.07 587.21 459.28 133.14
CY 0.51 0.25 0 0
LV 3.84 2.84 0.86 0.65
LT 3.54 2.57 0.57 0.40
LU 16.88 4.25 0 0
HU 15.22 11.45 5.74 4.63
MT 0 0 1.51 1.11
NL 74.12 19.90 28.91 31.52
AT 0 0 39.12 20.90
PL 0 0 27.73 22.42
PT 0 0 549.21 521.34
SI 2.51 1.88 2.05 1.54
SK 1.41 0.98 4.64 3.17
FI 12.38 4.71 6.90 3.12
SE 1.26 0.45 11.47 6.29
UK 476.99 171.78 327.26 151.45
INTERREG and PEACE 47.55 34.43 27.73 18.70
Total 6 595.28 3 965.83 1 789.91 1 109.88
Source: Member States (update 06/2011, rounded figures)* Total public funding includes national public funding and the EU contribution
2.2. Verifications of reported data on corrections
The on-the-spot audit work undertaken by DG Regional Policy under the 2008 Action Plan to audit the national systems for recoveries for 2000-2006 programmes was completed in 2010 for the last six Member States, having covered thus all 25 concerned Member States (there was no reporting obligation for Bulgaria and Romania for the 2000-2006 period). Even if the latest results are still preliminary, the results of the whole enquiry as well as the audits carried out by the Court of Auditors in the last two

EN 178 EN
annual reports showed that Member States' authorities generally follow the requirements, although significant weaknesses still existed in respect of the completeness of data and the system for recording and reporting irregularities for some 2000-2006 programmes in Italy, Spain, France and the Netherlands. To a lesser extent, weaknesses also existed in programmes in the UK, Slovenia, Finland, Sweden and Latvia. Even if improvements have been identified in all Member States during the years 2007-2010 by the Commission audits, the Commission remains prudent at closure and requested all programmes authorities to report the follow-up (including financial corrections) that was given at national level to all irregularities registered in the debtor's ledger for each programme. The Commission will not close programmes until it assesses this information as coherent and complete.
3. FINANCIAL CORRECTION ACTIVITY AND RECOVERIES BY THE COMMISSION
3.1. Financial corrections
The financial corrections (EC contribution) made to Structural Fund programmes over the last eight years (2003 to 2010), resulting from Commission audit work, audit work by the Court of Auditors, OLAF investigations and the closure process for 1994-1999 programmes are given below for each programming period.
The Commission published figures for financial corrections in the Structural Funds resulting from its own and other EU bodies’ audit work for the first time in the 2006 Annual Accounts, distinguishing between corrections by formal Commission decision and those accepted by Member States without a decision. Under a commitment given in the 2006 discharge procedure, from 2008 onwards the Commission has been reporting information on corrections on a quarterly basis to the European Parliament.
The financial corrections for 2010 and cumulatively for both programming periods 1994-1999 and 2000-2006, as reported in the notes to the Commission’s 2010 Annual Accounts, are reproduced below with a breakdown by Member State.
There is a risk of overlap between the figures reported for financial corrections resulting from the work of EU bodies presented here and those reported by Member States shown in section 2. This is because a large proportion of the financial corrections resulting from the work of the Commission and the Court of Auditors and from OLAF investigations are accepted by the Member States and implemented by them without a formal Commission decision by withdrawing the expenditure concerned from their expenditure declarations. As Member States are not obliged to distinguish corrections resulting from EU bodies’ work from those due to their own controls and audits, the extent of this overlap cannot be precisely quantified.
3.1.1. Financial corrections for the 1994-1999 and 2000-2006 programming periods up to the end of 2010
Financial corrections confirmed – cumulative figures (EUR millions)
Fund 1994-1999 2000-2006

EN 179 EN
Period PeriodERDF 1.758 4.165Cohesion Fund 273 490ESF 397 1.174FIFG 100 96EAGGF Guidance 124 41Total 2.652 5.965
Total financial corrections confirmed in 2010 for Structural Actions:
Breakdown per Member State (EUR millions)
EUR millions
Financial corrections confirmed in 2010
Member State Cumulative end 2009
ERDF CF ESF FIFG
EAGGF
Guidance
Total Year 2010
Cumulative end 2010
1994-1999 2 516 125 0 4 3 3 136 2 652Belgium 5 0 5Denmark 3 0 3Germany 339 0 0 1 1 340Ireland 42 0 42Greece 526 1 0 0 2 528Spain 548 116 0 0 1 117 664France 84 4 0 4 88Italy 505 0 0 0 505Luxembourg 5 0 5Netherlands 177 0 177Austria 2 0 2Portugal 137 2 1 1 4 141Finland 1 0 1Sweden 1 0 1United Kingdom 131 6 1 0 7 138INTERREG 10 0 0 102000-2006 5 178 368 258 43 89 30 788 5 965Belgium 10 0 0 10Bulgaria 2 18 18 21Czech Republic 0 4 7 11 11Denmark 0 0 0Germany 12 0 0 0 1 13Estonia 0 0 0 0 0Ireland 42 2 1 2 44

EN 180 EN
Greece 920 40 0 0 40 961Spain 2 503 170 104 2 87 363 2 865France 261 16 0 9 26 287Italy 825 97 4 1 2 105 930Cyprus 0 0Latvia 4 1 0 1 4Lithuania 2 0 0 2Luxembourg 2 0 2Hungary 52 0 0 52Malta 0 0Netherlands 2 0 2Austria 0 0Poland 134 0 111 1 0 112 246Portugal 126 0 13 0 18 31 157Romania 10 2 2 12Slovenia 2 0 2Slovakia 39 0 2 2 41Finland 0 0 0 1Sweden 11 0 0 11United Kingdom 217 29 36 1 65 283INTERREG 1 9 9 10
The amount of financial corrections confirmed in the year and implemented by issuance of a recovery order by the Commission (i.e. cash reimbursed to the Commission) is EUR 158 million (compared to EUR 146 million in 2009). It should be noted that implementation by means of a recovery order represent only a limited amount of financial corrections (i.e. 20% of the amount implemented in 2010) since the applicable sectoral legislation foresees the possibility for the Member State to replace the irregular expenditure by a regular one, if it accepts the financial correction proposed by the Commission - thus meaning that no recovery order needs to be issued. Recovery orders are only issued in the cases where the Member State refuses the financial correction or at the stage of the programme closure, when it is no longer possible for the Member State to submit other expenditure to replace the irregular one.
For ERDF, the large difference between confirmed/decided corrections in 2009 and 2010 is due to a large correction in Spain (approximately EUR 1.5 billion), which was confirmed at the end of 2009. This correction concluded an important action plan initiated in 2004 and increased significantly the amounts of corrections reported in 2009. From 2010 onwards, the amounts linked to the 2000-2006 period will decrease as the closure period is winding down. Corrections reported will be linked to finalisation of procedures started in previous years, as well as to the results of closure proceedings and audits.
3.1.2. Corrections implemented
Financial corrections implemented – cumulative figures (EUR millions)

EN 181 EN
1994-1999Period
2000-2006Period
ERDF 1.736
1.972
Cohesion Fund 266 227
ESF 395 1.146
FIFG 100 94
EAGGF Guidance 124 41
Total 2.621 3.480
Concerning the programming period 2000-2006, the implementation rate is explained by the ongoing closure process whereby payment claims received end of 2010 are not yet authorised, and the related financial corrections for a total amount of EUR 2,3 billion cannot be taken into account in the 2010 implementation figures.
As regards ERDF, it should be noted that a large correction in Spain totalling EUR 1.5 billion was certified by the Member State in February 2010 as accounted for in the local accounting systems of the relevant programmes. This amount was then deducted from the 20 final payment claims introduced in September 2010. However these payment claims being still under authorising process, they have not been taken into account in the above implementation figures. So are the majority of the claims received for the 2000-2006 closure.
In relation to the ESF, all financial corrections confirmed in 2010 for the programming period 1994-1999 have been implemented in the same year. Moreover there are no outstanding amounts of financial corrections to be implemented concerning that programming period. The amounts of financial corrections for the programming period 2000-2006 confirmed in previous years will be identified and cleared within the closure process that is ongoing.

EN 182 EN
Total financial corrections implemented in 2010: Structural Actions Breakdown per Member State (EUR millions)
Financial corrections implemented in 2010Member State Cumulative end 2009
ERDF CF ESF FIFG Guidance Total 2010
Cumulative end 2010
1994-1999 2 144 462 4 5 3 3 476 2 621
Belgium 6 - - - - - - 6
Denmark 4 - - - - - - 4Germany 300 37 - - 0 1 38 338Ireland 40 - - - - - - 40Greece 521 1 3 - - 0 4 525
Spain 293 363 1 0 - 1 365 658
France 85 - - 4 - 0 4 89Italy 483 21 - - - - 21 504
Luxembourg 4 - - 1 - - 1 5Netherlands 177 - - - - - 0 177Austria 2 - - - - - 0 2
Portugal 118 20 - - 1 1 23 141
Finland 1 0 - - - - 0 1
Sweden 1 - - - - - - 1United Kingdom 108 11 - - 1 0 13 120
INTERREG 2 7 - - - - 7 9
2000-2006 3 222 80 18 36 87 38 259 3 480Belgium 8 - - 0 - - 0 8Bulgaria 2 - - - - - - 2
Czech Republic 0 - - - - - - 0Denmark 0 - - - - - - 0
Germany 10 0 - - - - 0 10
Estonia 0 - - 0 - - 0 0
Ireland 26 - - - - - - 26
Greece 904 - - - - - - 904
Spain 940 - 16 0 87 8 111 1 051
France 239 - - - - 9 9 248
Italy 686 79 - 0 - 2 82 786
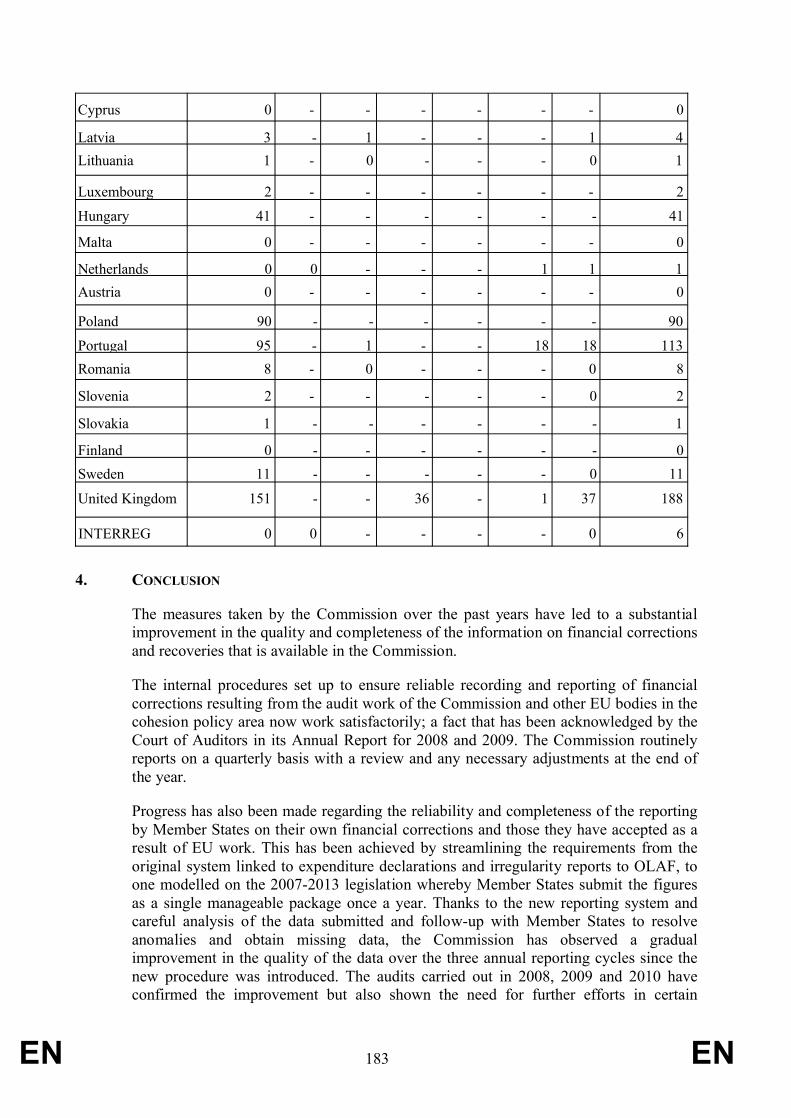
EN 183 EN
Cyprus 0 - - - - - - 0
Latvia 3 - 1 - - - 1 4Lithuania 1 - 0 - - - 0 1
Luxembourg 2 - - - - - - 2
Hungary 41 - - - - - - 41
Malta 0 - - - - - - 0
Netherlands 0 0 - - - 1 1 1Austria 0 - - - - - - 0
Poland 90 - - - - - - 90
Portugal 95 - 1 - - 18 18 113Romania 8 - 0 - - - 0 8
Slovenia 2 - - - - - 0 2
Slovakia 1 - - - - - - 1
Finland 0 - - - - - - 0Sweden 11 - - - - - 0 11
United Kingdom 151 - - 36 - 1 37 188
INTERREG 0 0 - - - - 0 6
4. CONCLUSION
The measures taken by the Commission over the past years have led to a substantial improvement in the quality and completeness of the information on financial corrections and recoveries that is available in the Commission.
The internal procedures set up to ensure reliable recording and reporting of financial corrections resulting from the audit work of the Commission and other EU bodies in the cohesion policy area now work satisfactorily; a fact that has been acknowledged by the Court of Auditors in its Annual Report for 2008 and 2009. The Commission routinely reports on a quarterly basis with a review and any necessary adjustments at the end of the year.
Progress has also been made regarding the reliability and completeness of the reporting by Member States on their own financial corrections and those they have accepted as a result of EU work. This has been achieved by streamlining the requirements from the original system linked to expenditure declarations and irregularity reports to OLAF, to one modelled on the 2007-2013 legislation whereby Member States submit the figures as a single manageable package once a year. Thanks to the new reporting system and careful analysis of the data submitted and follow-up with Member States to resolve anomalies and obtain missing data, the Commission has observed a gradual improvement in the quality of the data over the three annual reporting cycles since the new procedure was introduced. The audits carried out in 2008, 2009 and 2010 have confirmed the improvement but also shown the need for further efforts in certain

EN 184 EN
countries, for which appropriate recommendations have been issued. The Member States have received further guidance through the guidance note19 on the reporting of financial corrections by Member States in the 2007-2013 programming period and the remainder of the 2000-2006 period that was issued in early 2010.
19 COCOF Note #10/002/00/EN.