could dynamic variance-covariance settings and jump diffusion techniques enhance the accuracy of...
Post on 19-Dec-2015
217 views
TRANSCRIPT

Could Dynamic Variance-Covariance Settings and Jump Diffusion Techniques Enhance the Accuracy
of Risk Measurement Models? A Reality Test
Li, Ming-Yuan Leon


Motivations
• The importance of VaR (Value at Risk)
• The limitations of VaR
• Stress and scenario testing
• Improve the measurement of VaR

Motivations
• Three methods that are in common use to calculate VaR– (1) Parametric VaR– (2) Historical Simulation– (3) Monte Carlo Simulation
• Relative strengths and weakness
• VaR contribution (VaRC)

Motivations
• Limitations of the parametric VaR– Stable variances and correlations– Poor description of extreme tail events
• Solutions– Time-varying variances and covariance – A jump diffusion system– EVT (extreme value theory)

Literature review
• Billio and Pelizzon (2000) & Li, et al. (2004)
• Regime switching models to estimate VaR
• Limitations of them:– Li (2004): univariate system– Billio and Pelizzon (2000) : a simple setting on
variances

Literature review
• Unlike them– Bivariate system– Not only state-varying technique but also tim
e-varying process on the variances– Meaningful volatility-correlation relationship– Stable periods versus crisis periods

Model Specifications
• The linear model with constant variance and covariance
txxtx euR ,,
tyyty euR ,,
),0(~|| 1,
,1 HBN
e
ee t
ty
txtt

Model Specifications
2
2
yyx
yxxH

Model Specifications
tytxtp RRR ,,,
pyx uuVaR 32.2)(
yxyxp 222

Model Specifications
• The MVGARCH model with time-varying variance and covariance
2
,2,
2,
2,
tytxy
txytxtH

Model Specifications
s
nntxntxmtx
r
mmtxxtx e
1
2,,
2,
1,0,
2, )(
s
nntyntymty
r
mmtyyty e
1
2,,
2,
1,0,
2, )(
tytxtxy ,,2,

Model Specifications
tytxtytxyx
tpyxt
uu
uuVaR
,,2,
2,
,
232.2)(
32.2)(

Model Specifications
• The DCC proposed by Engle (2002):
1,1,1,1,2110 / tytxtytxtt eeqq
]1)/[(exp()exp( ttt qq
tytxttxy ,,2,

Model Specifications
• The jump diffusion model with regime-switching variance and covariance
x
s
mtxr
mmtxxx
s
tx
xmt
xt
g
e
g
2,
1,0,
2, )(
y
s
mtyr
mmtyyy
s
ty
ymt
yt
g
e
g
2,
1,0,
2, )(
1 X ARCH (r)
g2 X ARCH (r)

Model Specifications
tytxsstxy yt
xt
,,,
2,
xxt
xt
xxt
xt pssppssp 221111 )2|2(,)1|1(
yyt
yt
yyt
yt pssppssp 221111 )2|2(,)1|1(
Volatility-correlation relationship

Model Specifications
2
1
2
1
2
1
2
1,1)|,,,,,(32.2
)(
xt
xrt
yt
yrts s s s
tptyrt
yt
xrt
xt
yxt
ssssp
uuVaR
tytxsstytxtp yt
xt
,,,
2,
2,, 2

Back-testing of VaR Results

Back-testing of VaR Results

Data
• Daily index returns for the Canada, UK and US equity markets, as compiled by Morgan Stanley Capital International (MSCI)
• The two portfolios addressed by this study are (1) Canada-US and (2) UK-US
• The data cover the period from January 1st, 1990 through May 7th, 2007, and include 4,526 observations
• All the stock prices are stated in dollar terms

Rolling estimation process
• In the VaR back-testing, the final 2,500 daily observations of the sample are omitted from the initial sample
• Ten back testing periods with the 250 daily observations for each period

Rolling estimation process
• At time t, 2,026 (equal to 4,526 minus 2,500) historical data are incorporated into the estimation of the model parameters
• Based on these variance and correlation estimates, the VaR estimates are then constructed
• Two-step procedure in MVSWARCH model

Parameter estimates

Parameter estimates

Parameter estimates

Parameter estimates

Parameter estimates
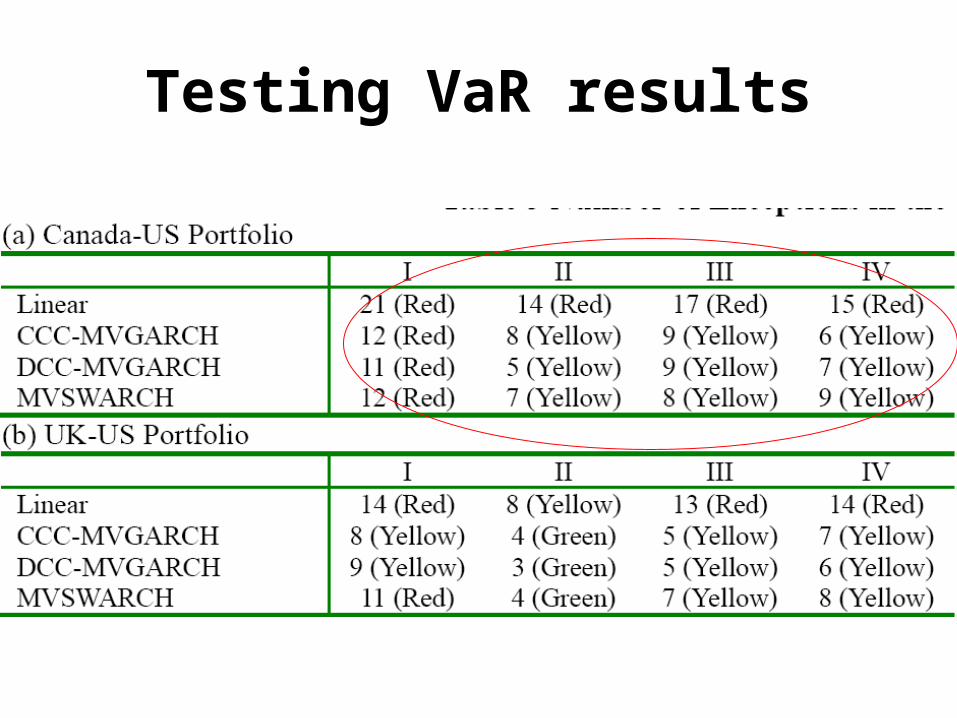
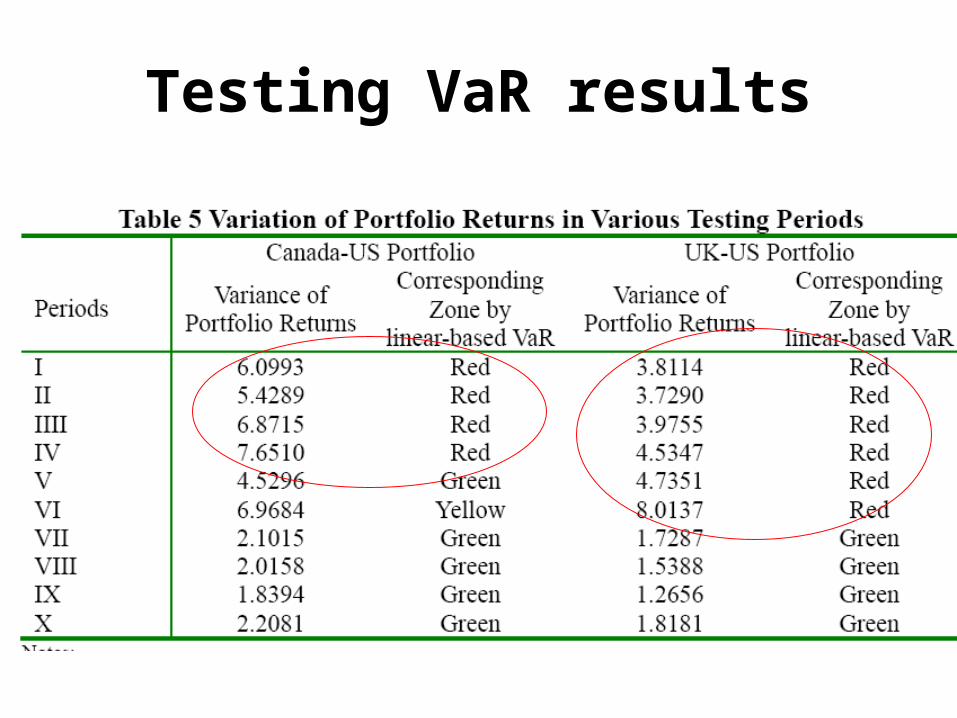
Testing VaR results

Testing VaR results

Testing VaR results

Testing VaR results
Testing VaR results

Conclusions
• During the stable period– The linear-based model and the three advanc
ed VaR models behave similarly
• During the crisis period – The linear-based model yields poorer results – The two MVGARCH and the MVSWARCH mo
dels do enhance the precision of VaR estimates in crisis periods

Three caveats
• In crisis periods, the of exceptions obtained with the three advanced models is still higher than four, the upper bound for the “Green” zone
• The improvement of the accuracy of VaR measurement obtained with the two dynamic correlation settings in comparison with the CCC-MVGARCH is less promising
• A system with more than two dimensions