cottonwood creek flood protection plan · cottonwood creek flood protection plan ... approved an...
TRANSCRIPT
Engineering Report
TEXAS WATER DEVELOPMENT BOARD
and
CIlY OF BAY CIlY, TEXAS
COTTONWOOD CREEK FLOOD PROTECTION PLAN City of Bay City, Matagorda County, Texas TWOB Contract No. 90-483-763
October, 1 990
Prepared By
PLEDGER KENNEDY ROGERS KALKOMEY CONSULTING ENGINEERS 1815 MONS AVENUE ROSENBERG, TEXAS n471
PLEDGER ROGERS
KENNEDY KALKOMEY
CONSULTING ENGINEERS
October 30, 19'90
Mr. G. E. (Sonny) Kret~schmar Executive Adinini,strator Texas Water Development Board P.O. Box 13231 Capitol Station 1700 N. Congress Av~nl.le Austin, Texas 78711-3231
Re: City of Bay City, Texas Cottonwood Creek Flood Protection Plan TWDB Contract No. 90-483-763
Dear Mr. Kret~schmar:
15005. DAV5T., P.O. BOX 1736
BRENHAM, TEXAS 77833
(409) 836-6631
1815MoNSAVENUE
ROSENBERG, TEXAS 77471
(713) 342-2033
Transmitted herewith are twelve (12) copies of the final engineering report for the Cottonwood Creek Flood Protection Plan,. The report was given final approval by the City Council of Bay Ci.ty on Monday, October 29, 1990.
Thank you for your participation and assistance in this project. The eventual construction of the proposed project, will provide relief to area residents who have experienced flooding in past years.
~'CLL\~ Charles A. Kalkomey, P Texas Registration No. 46
CAK:tp
.- PLEDGER KENNEDY ROGERS KALKOMEY
CONSULTING ENGINEERS
October 18, 1990
Mayor Tommy Z. LeTulle and Council Members City of Bay City 1901 Fifth Street Bay City, Texas 77414
Re: City of Bay City, Texas Cottonwood Creek Flood Protection Plan TWDB Contract No. 90-483-763
Dear Mayor LeTulle and Council:
1500 S. CAY ST., P.O. Box 1736
BRENHAM, TEXAS 77833
(409) 836-6631
IBIS MONS AVENUE
ROSENBERG, TEXAS 77471
(71 3) 342-2033
Transmitted herewith are thirty (30) copies of the final engineering report for the Cottonwood Creek Flood Protection Plan. Upon your approval, twelve (12) copies should be forwarded to the Executive Administrator of the Texas Water Development Board.
We thank the City of Bay City for their assistance and cooperation in the preparation of this report. We especially acknowledge Mr. Jon Abshier, Director of Public Works, for his valuable insight and contributions.
We also recognize Matagorda County Drainage District No. 1 for their support of the project.
Thank you for the opportunity to work with the City on this project. We look forward to the possibility of working with the you and others to implement the Cottonwood Creek Flood Protection Plan.
Sincerely,
celdf:tr~~ Texas Registrati~No.b208
CAK:tp
TABLE OF CONTENTS
Page
EXECUT IVE SUMMA.RY........................................ i
I . INTRODUCTION ............................................. 1
II.
A. Authorization ........................................ 1
B. Objectives and Scope .............................•... 1
BACKGROUND INFORMATION.
A.
B.
General .•
Location.
. . . . . . . . . . . . . . . . . . . . . . . . . . . . . . . . . . . . . . . . . . . .3
.3
• 3
C. Topography ........................................... 5
D. Soil Characteristics ..............•...........•...... 5
E. Climate .............................................. 5'
F. Previous Flood Protection Plans ..•.................•. 6
III. FLOOD MITIGATION ••••••••••••••••••••••••••••••••••••••••• 8
IV.
A. General .............................................. 8
B. Al ternati ves ......................................... 8
C. Summary. ....................................... . 12
METHODOLOGY ••••••••••••••••••••••••••••••••••••••••••••• 13
A.
B.
C.
D.
General. . ................................. . 13
Hydrology. . ............................ . 13
Hydraulics ....... . . ............................ . 16
Economic Analysis ............. . .19
E. Legal/Financial Considerations .......•.•............ 20
V.
VI.
Page
RESULTS .•.•. . . . . . . . . . . . . . . . . . . . . . . . . . . . . . . . . . . . . . . . . . . . .22
A. General ............................................. 22
B.
C.
Peak Flood Discharges.
Alternatives.
· ....•... 22
.23
D. Project Costs ....................................... 28
E. Operation and Maintenance Costs ..................... 50
F. Flood Plain Impacts ..•.............................. 54
G.
H.
I.
J.
Benefit/Cost Analysis.
Recommended Plan ..... .
Financing and Implementation.
Regulatory Requirements.
· ....... . 60
.65
.66
• •••••••• 70
K. Secondary Benefits .................................. 76
S lJ1.!M.A.R Y • • . . . • . • . . . . . . . . . • . . . • • • . . . . • . . . • • . . . • • . . . • • . . . • • 7 8
A. Cone 1 us ions ......................................... 78
B. Recommendations . . . . . . . . . . . . . . . . . . . . . . . . . . . . . . . . . . . . .79
VI I. REFERENCES ..........................................•... 81
EXECUTIVE SUMMARY
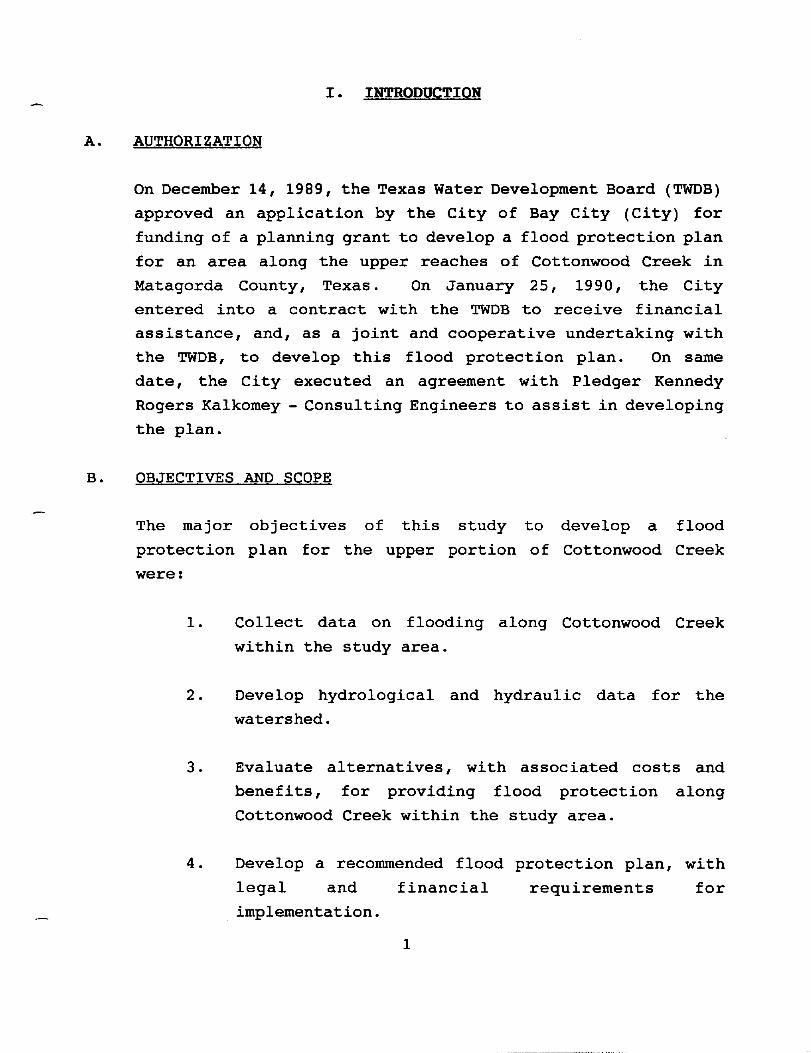
This report provides the results of an investigation into flood
protection plans for the upper portion of Cottonwood Creek in the
City of Bay City, Matagorda County, Texas. The study was jointly
authorized by the Texas Water Development Board and the City.
Several methods of reducing the flooding and resulting damages
along Cottonwood Creek were reviewed, including plans presented in
previous studies. It was found that a diversion of flows from
Cottonwood Creek to the Colorado River is an acceptable plan that
will reduce flooding, and can be constructed with local funding.
Five alternatives, each with four different design capacities, were
evaluated to accomplish the diversion to the Colorado River. All
of the alternatives provided the same relief to flooding based on
the 100-year storm. Construction costs, as well as potential
savings in the reduction of flood damages, were developed for each
alternative. Benefit/cost ratios were then computed for comparison
of the alternatives.
Based on costs and consideration for the general welfare of the
public, Alternative V was selected as the preferred plan for
construction of the proposed diversion facility. The total cost of
this alternative is $3,225,000. Construction of the project can be
funded locally by phasing the project over a four year period.
i
I. INTRODUCTION
A. AUTHORIZATION
On December 14, 1989, the Texas Water Development Board (TWOB)
approved an application by the City of Bay City (City) for
funding of a planning grant to develop a flood protection plan
for an area along the upper reaches of Cottonwood Creek in
Matagorda County, Texas. On January 25, 1990, the City
entered into a contract with the TWDB to receive financial
assistance, and, as a joint and cooperative undertaking with
the TWOB, to develop this flood protection plan. On same
date, the City executed an agreement with Pledger Kennedy
Rogers Kalkomey - Consulting Engineers to assist in developing
the plan.
B. OBJECTIVES AND SCOPE
The major objectives of this study to develop a flood
protection plan for the upper portion of Cottonwood Creek
were:
1. Collect data on flooding along Cottonwood Creek
within the study area.
2. Develop hydrological and hydraulic data for the
watershed.
3. Evaluate alternatives, with associated costs and
benefits, for providing flood protection along
Cottonwood Creek within the study area.
4. Develop a recommended flood protection plan, with
legal and financial requirements for
implementation.
1

5. Prepare and submit a report to the City and TWDB.
Discussion of the detailed analysis, along with a recommended
plan and related costs and benefits, are described in the
following sections.
2
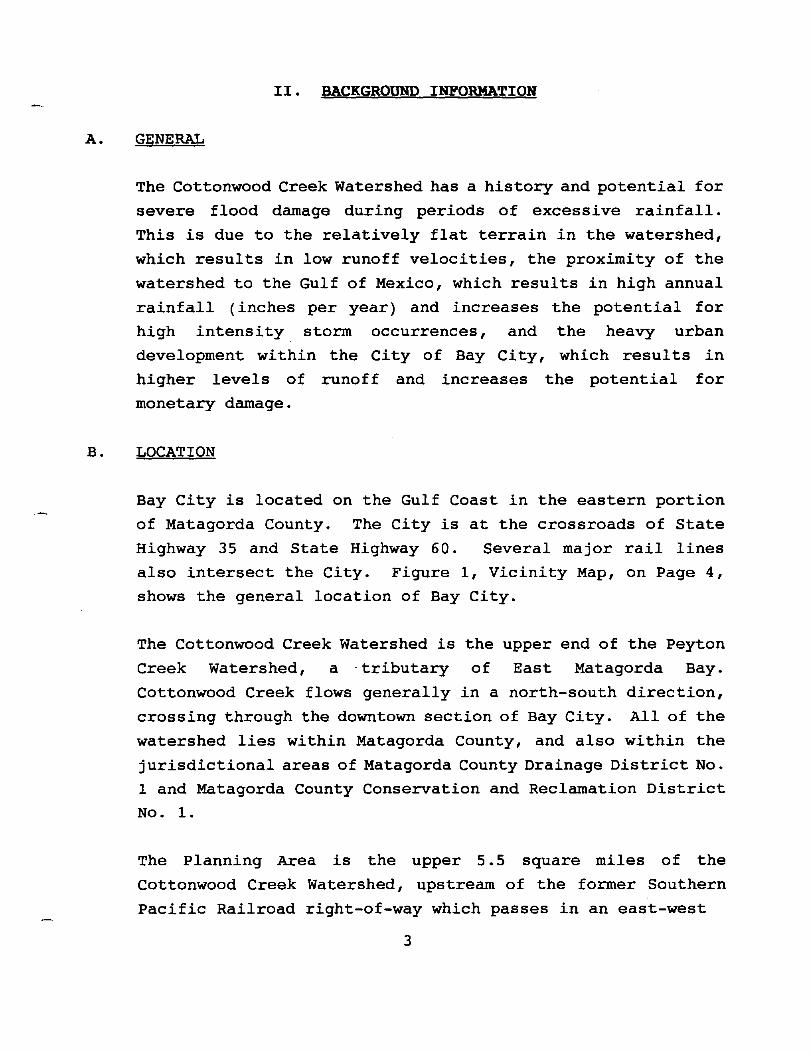
II . BACKGROUND INFORMATION
A. GENERAL
The Cottonwood Creek Watershed has a history and potential for
severe flood damage during periods of excessive rainfall.
This is due to the relatively flat terrain in the watershed,
which results in low runoff velocities, the proximity of the
watershed to the Gulf of Mexico, which results in high annual
rainfall (inches per year) and increases the potential for
high intensity storm occurrences, and the heavy urban
development within the City of Bay City, which results in
higher levels of runoff and increases the potential for
monetary damage.
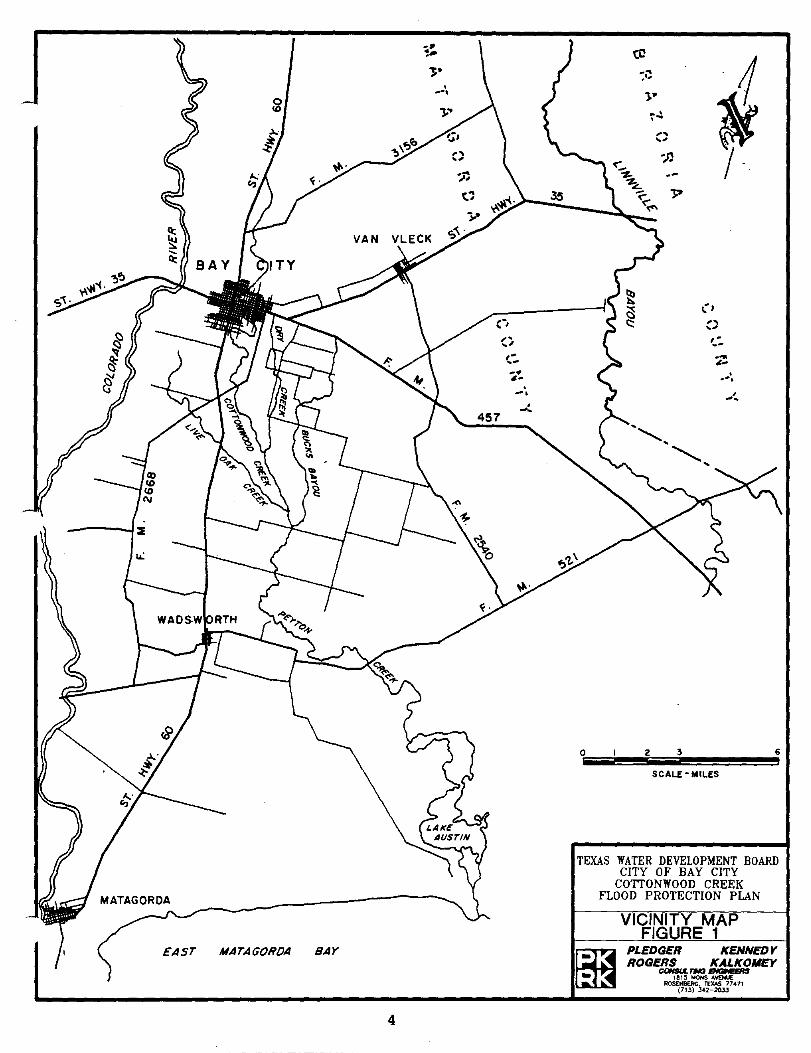
B. LOCATION
Bay City is located on the Gulf Coast in the eastern portion
of Matagorda County. The City is at the crossroads of State
Highway 35 and State Highway 60. Several major rail lines
also intersect the City. Figure 1, Vicinity Map, on Page 4, shows the general location of Bay City.
The Cottonwood Creek Watershed is the upper end of the Peyton
Creek Watershed, a tributary of East Matagorda Bay.
Cottonwood Creek flows generally in a north-south direction,
crossing through the downtown section of Bay City. All of the
watershed lies within Matagorda County, and also within the
jurisdictional areas of Matagorda County Drainage District No.
1 and Matagorda County Conservation and Reclamation District
No.1.
The Planning Area is the upper 5.5 square miles of the
Cottonwood Creek Watershed, upstream of the former Southern
Pacific Railroad right-of-way which passes in an east-west
3
-" : ... J'
, .-, 0 <D
MATAGOROA BAY
4
o
tc -;i!
>" ~~ .. , ~ .. ." --~
2
1 ~ j-
,.. -... ~-, .-,
, .. ,
SCALE - MI~ES
6
TEXAS WATER DEVELOPMENT BOARD CITY OF BAY CITY
COTTONWOOD CREEK FLOOD PROTECTION PLAN
VICINITY MAP FIG RE 1
PLEDGER KENNED Y ROGERS KALKOMFY cONSULTHIi _
HI15 MONS AVENUE ROSOIBERG. TEXAS 17471
(713) J42-2I)JJ
direction through the heart of the City. This right-of-way,
containing approximately 27 acres of land, has been purchased
by the City of Bay City, and provides a direct access from
Cottonwood Creek to the Colorado River.
C • TOPOGRAPHY
The topography of the Cottonwood Creek Watershed is relatively
flat with a gentle slope to the south and southeast.
Elevations vary from approximately 60 feet above sea level
north of the City to approximately 25 feet of elevation at the
mouth of Cottonwood Creek. These elevations were obtained
from the United States Geological Survey (U. S . G. S .) 7.5 minute
quadrangle maps (Reference 1) of the area.
o. SOIL CHARACTERISTICS
The majority of the soils within the Cottonwood Creek
Watershed are classified as a part of the Lake Charles-Bernard
soil group. The soils in the very upper extreme of the
watershed fall into the Edna-Telferner group. Both of these
soil groups are poorly drained, and belong to the hydrologic
group "0", as defined by the Soil Conservation Service (SCS).
E. CLIMATE
The climate of Matagorda County can be summarized as
semitropical with warm summers and mild winters. The average
daily maximum temperature is 79° F, and the average daily
minimum is 62° F. There are an average of 76 days during the
year in which the temperature exceeds 90° F, and only 11 days
in which the temperature drops below 32° F.
5
Matagorda County experiences a mean rainfall amount of 43
inches per year. The most rainfall received during one year
was in 1979, when almost 72 inches were recorded in the
County.
F. PREVIOUS FLOOD PROTECTION PLANS
Cottonwood Creek is the only means of drainage relief for the
majority of the City of Bay City. Areas of the watershed
north of the City experience flooding due to the channel
restrictions within the incorporated area. The total
watershed includes a large area south of the City, which
eventually drains to Peyton Creek, through Lake Austin, and
into East Matagorda Bay. Flooding problems in the watershed
are compounded by the lack of adequate drainage at this
outlet.
Conventional methods for accommodating the flood flows have
been found to be too costly for the citizens in the area.
Because Cottonwood Creek traverses the downtown section of the
City of Bay City, access along the existing creek is
restricted by the encroachment of current improvements. These
improvements include buildings, both commercial and
residential, streets, and underground utilities. The
acquisition of additional right-of-way through the City,
containing these improvements, has been too costly. The
alternative to obtaining the additional right-of-way is to
concrete line the channel, increasing its capacity. This
alternative has also been found to be a financial burden on
the taxpayers of the area. Therefore, the leaders of the area
have been searching for a cost-effective alternative to
address the flooding problems along Cottonwood Creek.
6
In 1970, the U.S. Army Corps of Engineers (COE) completed and
released a Survey Report on Peyton Creek, Texas Flood Control
(Reference 2). The total project cost in the recommended plan
was $8,100,000, and included construction work on Bucks Bayou
and Peyton Creek. Extrapolated to 1990 costs, this figure
could more than double.
In 1973, Brown & Root, Inc. prepared a study for Matagorda
County Conservation and Reclamation District No. 1 entitled,
Preliminary Drainage Study, Peyton Creek Watershed (Reference
3). Although this report looked at a diversion to the
Colorado River, the recommended plan did not include this
diversion. Instead, major channel improvements were
recommended for Cottonwood Creek and Peyton Creek. At a
project cost of $3,618,750 in 1973, this cost would be
significantly higher today.
A high level, flood flow channel to the Colorado River
continues to be considered by local officials as a possible
means of reducing the amount of flood waters which must
negotiate the small channel and restricted bridges and
culverts along the channel. However, a route to the river was
always a major obstacle due to the land ownership in the area.
When the City was presented with an option to purchase the
Southern Pacific Railroad right-of-way, they quickly
responded, seizing the opportunity to secure this access to
the Colorado River. This opened the door for a further look
into the benefits of the diversion channel.
7
III • FLOOD MITIGATION
A. GENERAL
Flood mitigation is the act or process of reducing the degree
or intensity of a flood event. This section discusses
structural and non-structural alternatives to reduce flood
damages.
B. ALTERNATIVES
Little can be done to prevent a major flood occurrence.
However, damage to crops and personal property can be
minimized for various statistical storm flows. The key to the
amount of flood damage mitigation possible is a function of
several items. These items are:
1. Statistical definition of the storm occurrence to be
mitigated (i.e., 5-yr., lO-yr., 25-yr., IOO-yr., etc.
storms) .
2. The potential for property damage sustained as a result
of a flood.
3. The financial ability of the citizens affected by the
storm occurrence.
4. The physical characteristics and properties of the
watershed.
5. The willingness of the governmental entity to act upon
the flood problem.
8
Several measures for reducing flood damage during major flood
occurrences are commonly used. These methods are:
1. Reduction of peak flow by reservoirs.
2. Confinement of the flow within a predetermined channel by
levees.
3. Reduction of the peak flood stage by increasing
velocities as a result of channel improvements.
4. Diversion of flood waters through channels or floodways.
5. Temporary evacuation of the flood plain.
6. Floodproofing of specific properties and structures.
7. Reduction of flood runoff by land management.
8. Runoff retention management.
9. Flood Insurance Program.
Typically, the use of only one of these alternatives does not
significantly reduce flood damages within a given watershed.
Most solutions involve a combination of plans. However,
conditions within the Cottonwood Creek Watershed render some
of these alternatives ineffective.
Because the watershed is relatively flat, it is impractical to
construct a reservoir to contain and reduce peak flows. The
amount of land area required for this alternative would be
large because of a lack of elevation differential available
for use by such a reservoir.
9
Although some of the channels of Cottonwood Creek have high
banks which act as levees, the raising of water levels within
the channel to contain the flows would seriously impact the
ability of areas adjacent to the channel to drain into the
creek. The flooding from this alternative could be
potentially more severe than flooding under current
conditions.
Previous reports have evaluated increasing channel capacities
by channel improvements which would increase flow velocities.
The Brown & Root, Inc. report (Reference 3), discussed
previously, specifically included concrete channel lining.
However, the costs of this alternative are prohibitive.
Temporary evacuations of the flood plain reduce the potential
for loss of human life. However, ample notice is necessary to
allow residents to accomplish this. Because of the small size
of the watershed, Cottonwood Creek responds very quickly, and
the time available for evacuation is very short. Also, the
watershed does not experience dangerous flow velocities and
depths that normally are associated with the potential for
loss of life.
Floodproofing is an alternative that can reduce monetary
damages from storm events. The cost of such efforts would
have to be borne by the private property owners. Because of
the number of structures involved in the Cottonwood Creek
Watershed, this alternative would not be very effective, as it
would involve the support and cooperation of a large number of
residents, many of whom do not have the financial resources to
make such improvements.
Reduction of runoff by land management pertains to various
types of vegetation utilized to slow overland flows, thereby
reducing peak flow rates. The most significant contribution
10
of flows into the upper portion of the Cottonwood Creek
Watershed comes from within the City of Bay City. This
urbanization produces more concrete than vegetation as ground
cover, and not much can be accomplished in these developed
areas to reduce runoff by land management. Those areas
outside of the City are mostly farming and grazing areas.
These agricultural land uses, especially the land which is
actively used in the growing of rice, already offer some
reduction of flows.
It is the loss of these agricultural areas that add to the
flooding problems within the Cottonwood Creek Watershed.
Runoff retention management is an alternative that should be
utilized as these agricultural land uses evolve into urban
land patterns. This can be used to keep current peak flows
from rising as development occurs, but does not address the
current flooding problems.
The Flood Insurance Program, as administered through the
Federal Emergency Management Agency (FEMA), incorporates two
concepts which reduce flood damages. The first is virtually
prohibiting the building or rebuilding of structures within
areas of high velocities known as floodways. The second is
requiring building slabs or floor heights to be raised to a
level above the flood elevations, reducing the potential for
damage from flood waters getting into these structures. Both
the City of Bay City and Matagorda County are in the Flood
Insurance Program, and a floodway has been established for
Cottonwood Creek. The enforcement of this program by local
building officials should be continued, reducing the potential
for additional flood damages in the future. However, this
alternative does little to alleviate existing problems and
flooding.
11
This study specifically considers the alternative of diversion
of flows, and more specifically the affect of diverting a
portion of the storm flows of Cottonwood Creek along the
former Southern Pacific Railroad right-of-way to the Colorado
River. Due to development within the City, this is the only
viable method of flood abatement that would impact current
flooding conditions. Other alternatives have proven to be too
costly, or do not address current problems.
C. SUMMARY
The City of Bay City and Matagorda County should carefully
consider development restrictions within the Cottonwood Creek
watershed as it pertains to storm runoff. Further
uncontrolled development within the watershed will increase
runoff amounts. This in turn can exacerbate the flooding
conditions in Bay City. Many cities now require the
construction of runoff retention structures for residential
subdivisions and commercial developments to prevent runoff
from increasing from the existing undeveloped condition. In
effect, the flood conditions remain unchanged, and do not
become worse.
12
IV. METHODOLOGY
A. GENERAL
The following section describes the models and methods utilized to
establish the flooding potential along Cottonwood Creek. Sources
of the data base and procedures used to construct the models are
addressed.
B. HYDROLOGY
1. General
Hydrology is the study of the movement of water over and
through the ground surface. The responsiveness of a
given area subjected to a preselected synthetic rainfall
event results in a peak discharge rate for that area.
This responsiveness is expressed in terms of the amount
of rainfall absorbed into or stored on the ground versus
the quality of rainfall travelling over ground surfaces
and into drainage facilities such as open channels and
reservoirs.
Peak flood discharge rates can be computed in various
manners. Two generally accepted methods are through the
use of a computer model of the watershed and empirical
equations developed for certain watersheds based on
specific watershed characteristics.
13
2. Drainage Areas
The Cottonwood Creek Watershed is depicted in Exhibit 1,
Cottonwood Creek Watershed. As shown, Cottonwood Creek is
the major drainageway in the basin. It is joined by Dry
Creek and Live Oak Creek in the lower portion of the
watershed, just prior to Cottonwood Creek becoming Peyton
Creek. Table 1, on Page 15, lists the acreage within
each subbasin of the Cottonwood Creek Watershed.
3. Peak Discharge Rates
During the initial phases of the study, efforts were
undertaken to locate the COE HEC-l. Flood Hydrograph
Package (Reference 4) model of the Cottonwood Creek
Watershed. However, this model was not created for use
in the FEMA Flood Insurance Study (FIS) for the City of
Bay City (Reference 5) or for the unincorporated areas of
Matagorda County (Reference 6). Therefore, no attempt
was made to generate this hydrologic model due to the
possibility that a satisfactory agreement with the FEMA
FIS discharge rates might not be achievable. It was
beyond the scope of this report to verify or disprove the
established regulatory discharge rates.
According to the FEMA FIS for both Bay City and Matagorda
County, peak discharge rates for Cottonwood Creek were
based on USGS Water Investigations 3-73, Effects of
Urbanization on Floods in the Houston, Texas,
Metropolitan Area (Reference 7). This is a regional
method based on regression analysis. The method relates
drainage area and percentage of impervious area to peak
discharge by empirical equations developed for the
Houston Metropolitan Area. Since the Bay City area is
14
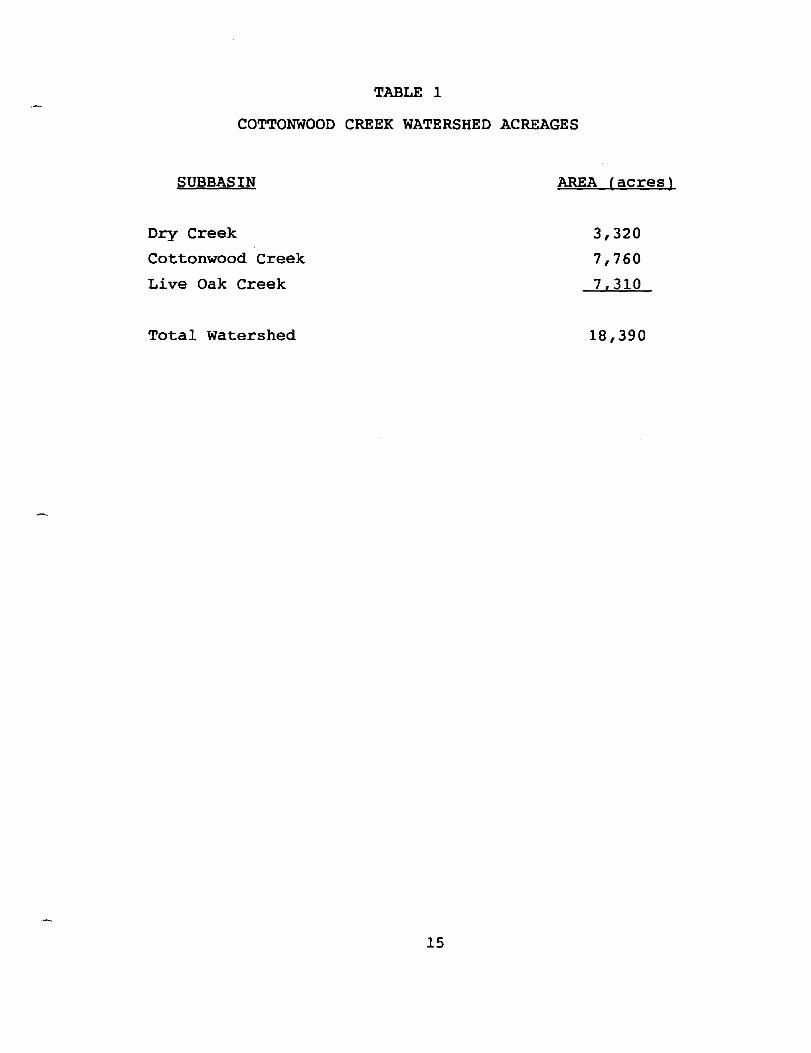
TABLE 1
COTTONWOOD CREEK WATERSHED ACREAGES
SUBBASIN
Dry Creek
Cottonwood Creek
Live Oak Creek
Total Watershed
15
AREA (acres)
3,320
7,760
7,310
18,390
geographically close to Houston and similar in drainage basin
characteristics, this method was adopted for application in
the FIS. The peak discharge rate from rural drainage areas
upstream of Bay City were generated based on USGS report 77-
110, Techniques for Estimating the Magnitude and Frequency of
Floods in Texas (Reference 8). This regional method relates
drainage area and channel slope to peak discharge by empirical
equations developed for a large portion of Texas.
Therefore, the peak discharge rates adopted in the FEMA FIS
for Bay City and Matagorda County were utilized for this study
on Cottonwood Creek. Peak discharge rates for various points
within the Cottonwood Creek Watershed are given in Table 2,
found on Page 17.
C. HYDRAULICS
1. General
In order to determine the effects of any proposed
diversion channel from Cottonwood Creek to the Colorado
River, it was necessary to compute water surface
elevations during storm events along the main channel of
Cottonwood Creek. The most commonly accepted method of
accomplishing this task is the use of COE HEC-2 Water
Surface Profiles (Reference 9) computer modeling package.
This method was utilized for computations along
Cottonwood Creek.
Another widely accepted method of calculating the water
surface elevations is by use of the slope-area method,
which employs Manning's Equation. This method was
utilized for the sizing of the diversion channel to the
Colorado River.
16
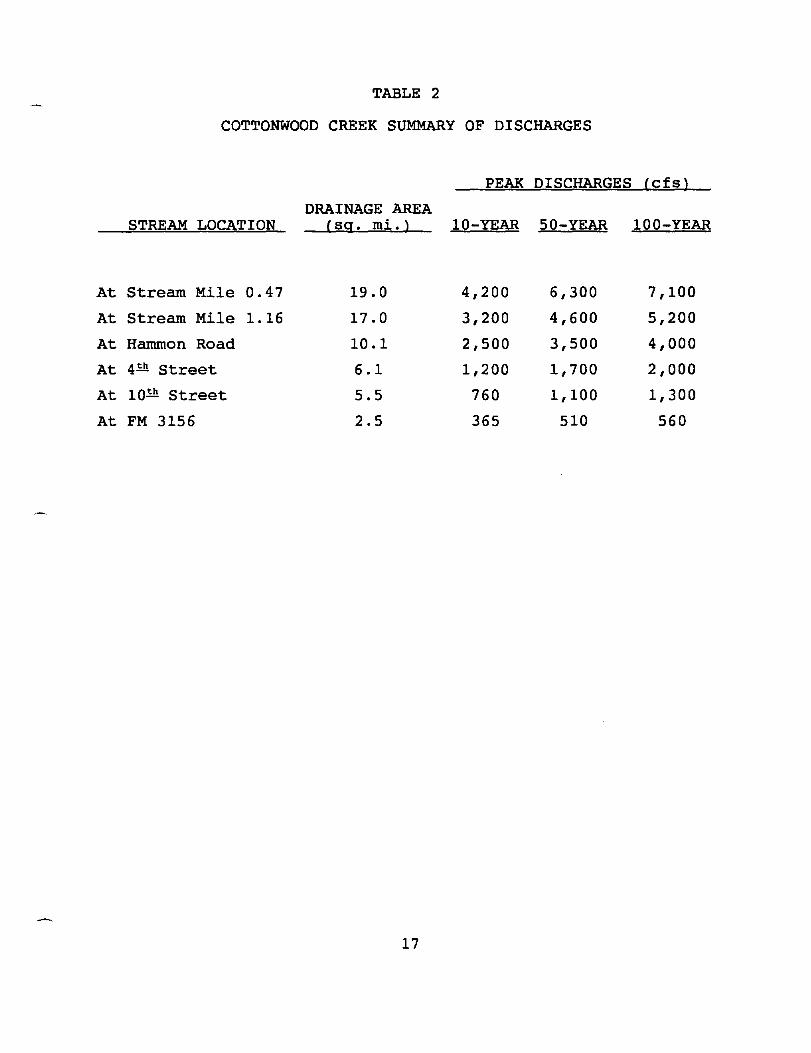
TABLE 2
COTTONWOOD CREEK SUMMARY OF DISCHARGES
PEAK DISCHARGES (cfs)
DRAINAGE AREA STREAM LOCATION (sq. mi.) 10-YEAR 50-YEAR 100-YEAR
At Stream Mile 0.47 19.0 4,200 6,300 7,100
At Stream Mile 1.16 17.0 3,200 4,600 5,200
At Hammon Road 10.1 2,500 3,500 4,000
At 4.!:!! Street 6.1 1,200 1,700 2,000
At 10.!:!! Street 5.5 760 1,100 1,300
At FM 3156 2.5 365 510 560
17
2. Cottonwood Creek Model
The FEMA FIS HEC-2 model for Cottonwood Creek was
obtained from Greehorne & 0' Maron, Inc., a contractor for
FEMA located in Greenbelt, Maryland. The model data was
provided on micro-fiche, which was input into a new
computer model. The output from the new model was
verified against the information from FEMA to insure the
new model was identical to the original. This model was
then used as a base for all other HEC-2 analyses.
The crossections utilized in the FIS for Bay City and
Matagorda County were plotted on a base map. These
sections were then used to plot the flood plain areas
wi thin the study area, and would be further used to
determine the limits of flood plain reductions resulting
from the introduction of the diversion channel into the
system.
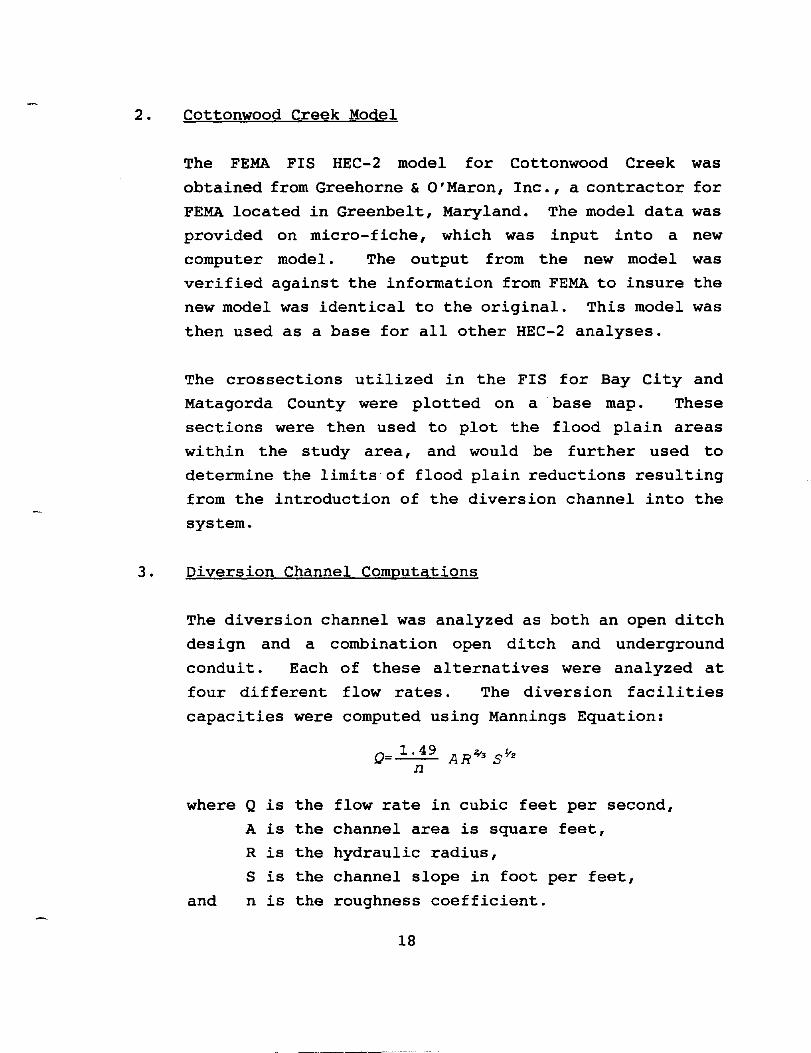
3. Diversion Channel Computations
The diversion channel was analyzed as both an open ditch
design and a combination open ditch and underground
conduit. Each of these alternatives were analyzed at
four different flow rates. The diversion facilities
capacities were computed using Mannings Equation:
where Q is the
A is the
R is the
S is the
and n is the
Q= 1.49 AR"-I. SY. n
flow rate in cubic feet per second,
channel area is square feet,
hydraulic radius,
channel slope in foot per feet,
roughness coefficient.
18
D. ECONOMIC ANALYSIS
1. General
The economics of a proposed project such as this plays an
important role in not only how the project is completed,
but possibly whether or not the project is even
undertaken. Therefore, it was important to determine the
economics of the alternatives considered in this study.
2. Costs
The costs associated with the completion of each
alternative were determined. The construction costs were
based on data gathered from similar projects, as well as
from discussions with material suppliers and construction
contracting companies in the area. Construction
contingencies were added to allow for unforeseen
conditions and design uncertainties at this time.
Finally engineering costs were added for design and
construction phase services.
3. Benefits
The purpose of the project is to reduce flooding within
the Cottonwood Creek Watershed. Accordingly, there are
economic values that can be assigned to the benefits
resulting from the project.
To determine these benefit values, the number and type of
structures (houses, businesses) were identified. Using
current tax rates from the Matagorda County Appraisal
District, the assessed values of these improvements were
determined. Damage costs were then assigned to the
structures to determine the benefits realized by reducing
19
the flood plain areas for each alternative.
A benefit/cost ratio for each alternative was computed
comparing the benefits of the reduction in damages to the
construction costs of the project. These ratios could
then be used to assist in the selection of a recommended
alternative.
E. LEGAL/FINANCIAL CONSIDERATIONS
1. General
The requirements of other
entities may impact the
governmental agencies and
project, and additional
environmental analysis, permits, and fees are sometimes
involved. In a like manner, the financing of the work
may require approvals of State regulatory agencies, and
may involve special financial and legal consultants.
2. Legal Requirements
There are several possible areas of a project such as
this one that may require coordination with other state
or federal agencies. The purpose of the project is to
divert storm water flows from one watershed to another.
The project also involves a navigable stream, and has an
impact on tidal waters. The items are all regulated by
federal and state agencies, and discussions were held
with various groups to identify the approvals needed for
implementation of the project.
20
3. Financial Requirements
Unless the project can be financed out of operational
funds of the City and various County entities, there will
be a need for long term financing of the work.
Therefore, consideration was given to the possible sale
of bonds and their associated costs.
21
V. RESULTS
A. GENERAL
This section describes the various alternatives and methods
utilized to establish existing flooding limits along Cottonwood
Creek within the study area. Benefits and costs of each
alternative, as well as the legal and financial requirements for
the project implementation, are discussed.
B. PEAK FLOOD DISCHARGES
1. General
Once peak flood discharge rates for Cottonwood Creek were
established, the decision had to be made as to how much
of the flow could be diverted to the Colorado River.
Various rates were initially investigated, and several
were analyzed in detail.
2. Cottonwood Creek Discharges
As previously discussed in Section IV. of this report,
the Cottonwood Creek discharges as adopted in the FEMA
FIS for Bay City and Matagorda County were accepted for
use in this study. The lOO-year and lO-year storm flows
were included in the analysis of the diversion facility.
3. Diversion Facility Discharges
Based on several preliminary computations using the COE
HEC-2 model for Cottonwood Creek, it was found that a
range of diversion flows existed in which significant
changes occurred to the lOO-year flood plain along
22
Cottonwood Creek. A drop in the flood plain elevation
began with about a 400 cfs diversion. More than a 700
cfs diversion did not continue to significantly lower the
of flood plain elevations along the creek channel.
Preliminary calculations on the channel itself indicated
that the upper limit for utilizing an open ditch channel
section was approximately 700 cfs. Further support for
this range of diversion flows came from the previously
mentioned COE report on Peyton Creek (Reference 2). The
report stated the capacity of the existing Cottonwood
Creek channel was approximately that of the lO-year
storm. At the point of diversion, the 10-year discharge,
according to the FEMA FIS, is 760 cfs. The 100-year
discharge is 1,300 cfs at the same point. If the creek
had a capacity for a 10-year storm flow, the excess flow
from the 100-year storm event would be the difference in
these two values, or 540 cfs. Based on all the above, a
range of 400 cfs to 700 cfs was selected. This range was
divided in 100 cfs increments for analysis of the
diversion facility in each alternative.
C. ALTERNATIVES
1. General
Five alternatives were selected for study in this report.
The alternatives were derived from local input and
engineering judgement. Diversion flow rates of 400 cfs,
500 cfs, 600 cfs, and 700 cfs were analyzed for each of
the alternatives.
Alternative I consists of an open channel from Cottonwood Creek to the Colorado River. Flows from the creek would
be diverted to the channel by a pump station constructed
on the creek bank.
23
Alternative II utilizes a storm sewer for the portion of
the diversion facility through the corporate limits of
Bay City. This storm sewer would be installed from
Cottonwood Creek to Moore Avenue. From this point, an
open channel would be constructed to the river. A pump
station would again be used to divert the flows.
Alternative III is a modification of Alternative II in
that the storm sewer is replaced with a force main
system. Instead of a gravity flow condition, the pump
station would pump the storm flows to Moore Avenue, where
the open ditch section would begin and carry the flows to
the river.
Alternative IV is similar to Alternative I in than an
open channel section is utilized the entire length of the
diversion route. However, instead of a pump station, a
weir inlet structure at Cottonwood Creek would be used to
divert the storm flows.
Alternative V is similar to Alternative II in its use of
storm sewer from Cottonwood Creek to Moore Avenue, and
then an open channel to the Colorado River. However, as
in Alternative IV, the weir inlet structure is used to
divert the flows in lieu of the pump station.
Exhibit 2, Diversion Channel Location, depicts the
location of the proposed facility in relation to the
City.
2. Alternative I
As stated above, Alternative I consists of a open ditch
from Cottonwood Creek to the Colorado River. There are
six existing streets which must cross this channel -
24
State Highway 60, Avenue E, Avenue D, Avenue C, Moore
Avenue, and Twelfth Street. Preliminary calculations on
structure design for these crossings indicated high head
losses if culverts were used. Therefore, bridge
structures are recommended for these crossings.
The pump station design consists of low head, high volume
pumps to divert the storm water. Included in the design
are an auxilIary power supply and a building to enclose
the facility.
Approximately 860 feet east of the Colorado River, the
channel crosses a Lower Colorado River Authority (LCRA)
Canal. The diversion flows would be routed under the
canal through a drop pipe structure utilizing corrugated
pipe.
Because the flows are being diverted to the Colorado
River, there is concern that, should the river be at a
100-year flood stage, it would "back-up" into the
diversion channel and into Bay City. A protection levee
now contains these high river floods, protecting the
City. The structure at the LCRA canal discussed above
would create a "hole" in this levee. Therefore, this
drop pipe structure will include flood gates which will
maintain the integrity of the protection levee.
At a point approximately 200 feet east of the river, the
diversion channel crosses Willis Ditch, an existing
drainage facility from the nortwest portion of Bay City.
This ditch flows southerly to the river. A second drop
pipe outlet structure is proposed at this location to
control erosion at the river. The storm flows will then
enter the river downstream of the diversion facility
through the Willis Ditch.
25
The construction of the diversion facility will require
the relocation of several utility lines. There are water
lines, gas lines, a sanitary sewer line, and utility
cables which cross the route and will require adjustment.
3. Alternative II
Alternative II is similar to Alternative I in all
respects except that a portion of the open channel is
replaced by an underground storm sewer. Preliminary
design calculations indicate that it will require twin
reinforced concrete boxes to convey the various design
flows. However, five of the bridges are eliminated by
the use of the storm sewer. Only the Twelfth Street
bridge remains within the open channel section of the
project from Moore Avenue to the river.
The pump station design, LCRA canal crossing, outlet
structure, and utility line relocations are similar to
those contained in Alternative I.
4. Alternative III
Alternative III replaces the gravity storm sewer system
with pressure conduits to convey the storm flows from
Cottonwood Creek to Moore Avenue. The conduits would
have a circular crossection, and would discharge into the
upstream end of the open channel section just west of
Moore Avenue.
The pump design in this alternative is different due to
the headlosses in the system. Pumps chosen for this
station must be capable of overcoming large system
losses, which increase pump size, motor size, and
operating costs.
26
The remainder of the design of this alternative is
identical to the first two alternatives, with the
exception of additional erosion protection at the
discharge points of the force main.
5. Alternative IV
This alternative is similar to the first alternative in
that it employs an open ditch from Cottonwood Creek to
the Colorado River. The major difference in the two is
this alternative deletes the pump station. Instead of
this facility, a broad-crested weir structure is used to
control the diversion channel flows.
The weir structure would be constructed in a channel
which would branch southwestward from Cottonwood Creek.
The structure itself would be concrete, with a concrete
apron on both the upstream and downstream faces of the
weir. The branch channel would be lined with stone
riprap for erosion protection.
The open channel downstream of the weir would differ from
the channel in Alternative I in depth. In order to
maintain a positive head on the weir from Cottonwood
Creek, the channel downstream of the weir is
approximately 3 feet deeper than that in Alternative I.
The remainder of Alternative IV, bridges, outlet
structure, etc., is similar in content to Alternative I.
6. Alternative V
Alternative V actually combines Alternatives II and IV.
This design alternative uses the box storm sewer from
27
Alternative II in combination with the weir inlet
structure from Alternative IV. The pumping station is
thereby eliminated from the design.
The remainder of this design, bridges, outlet structures,
etc., is identical to Alternative II.
Table 3, on Page 29, summarizes the various components of
these alternatives.
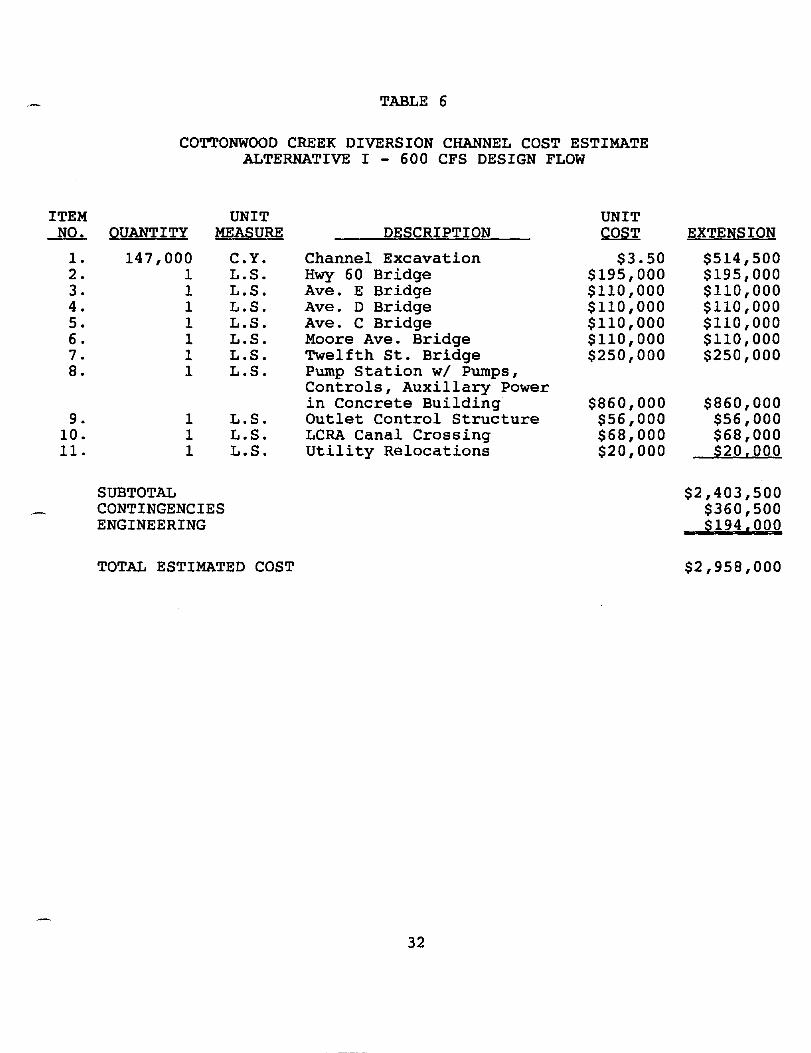
D. PROJECT COSTS
Construction costs for each flow design within each
alternative were compiled. These were based on unit costs for
the various components of each design alternative.
Contingencies (15 percent) and engineering costs were also
included to develop total project costs.
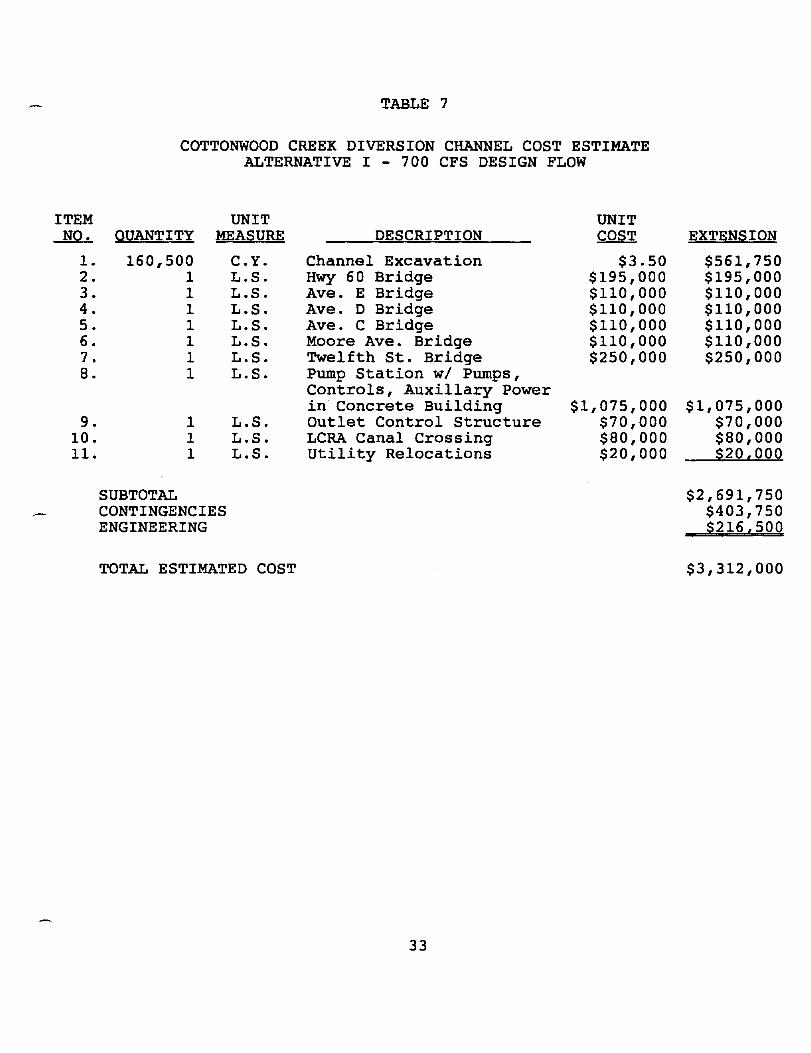
Tables 4 - 7, on Pages 30 - 33, indicate the costs for
Alternative I. Total project costs for this alternative vary
from $2,553,000 to $3,312,000.
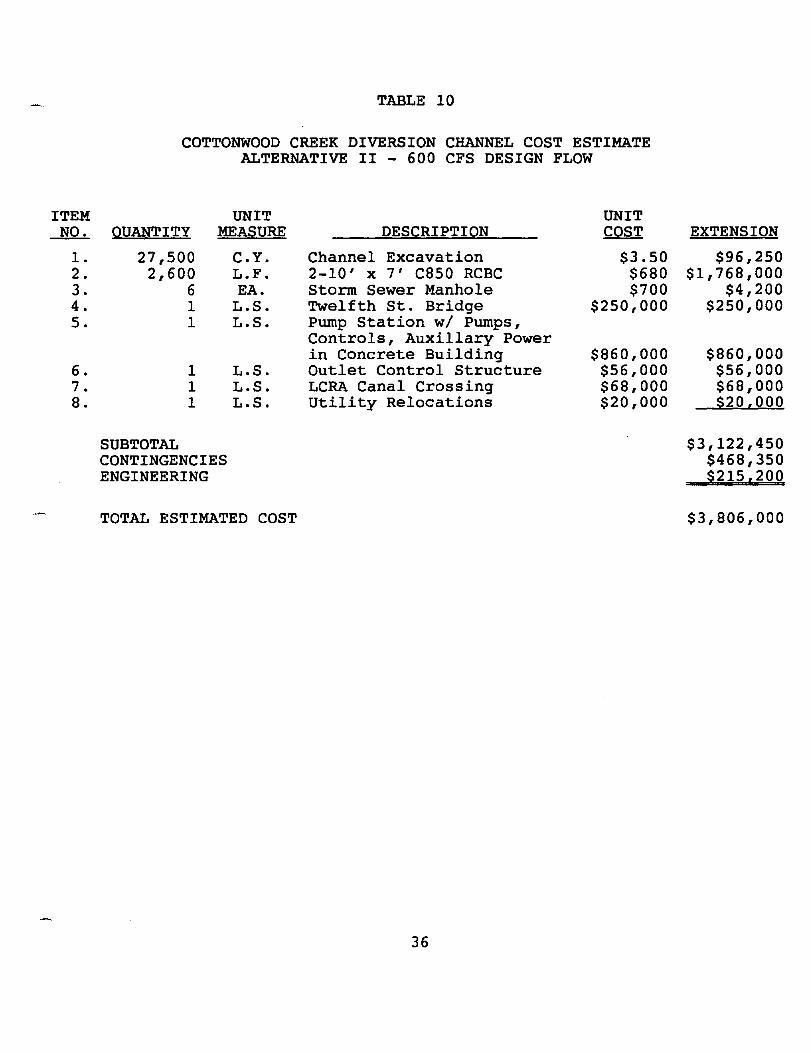
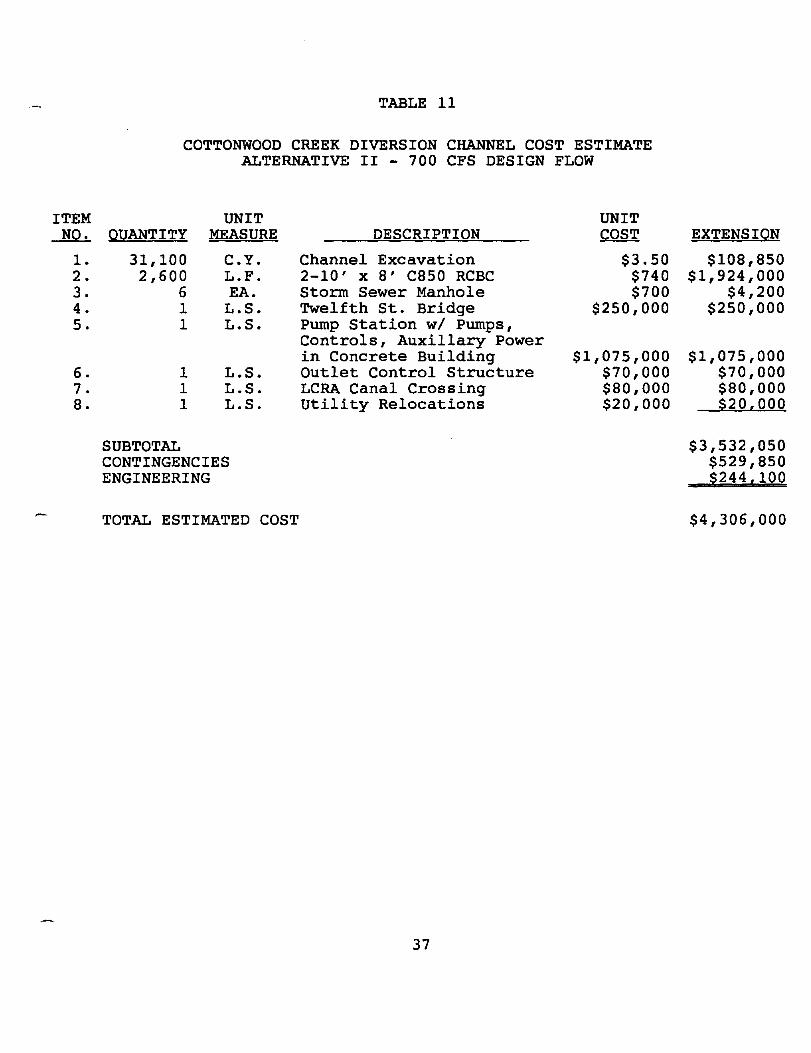
Tables 8 - 11, on Pages 34 - 37, illustrate the project costs
for Alternative II. The storm sewer portion of the
alternative increases the costs, resulting in total costs from
$3,172,000 to $4,306,000, for 400 cfs to 700 cfs diversion,
respectfully.
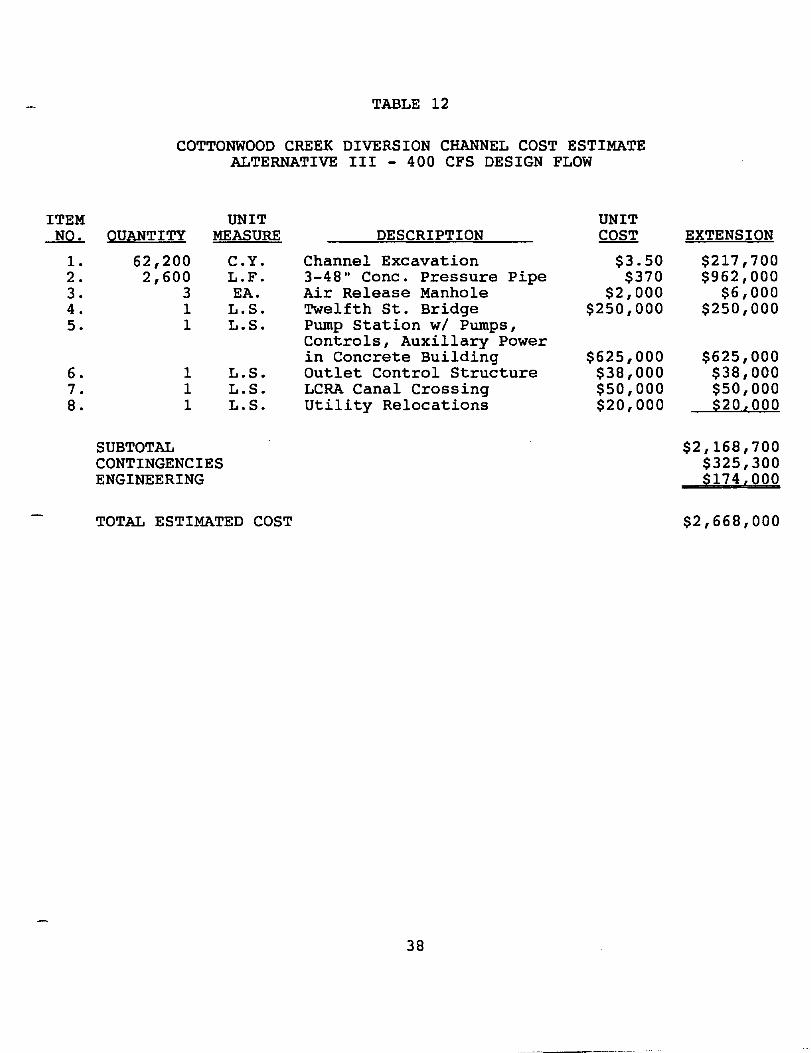
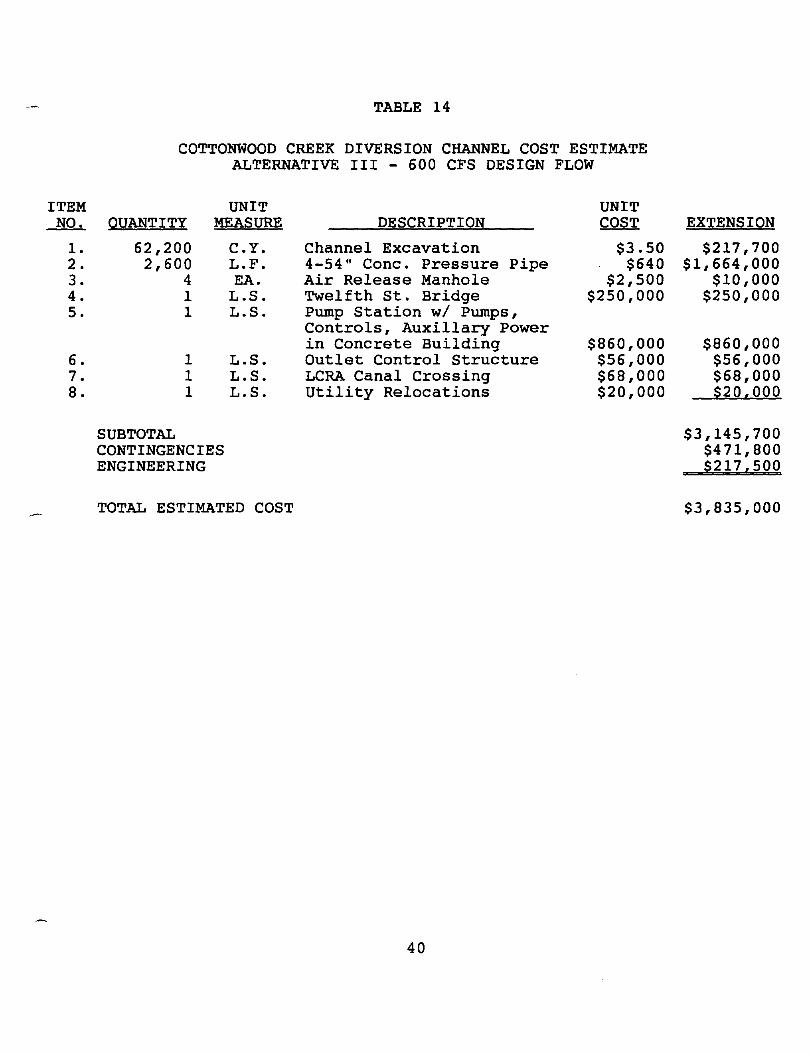
Tables 12 15, on Pages 38 41, list the costs for
Alternative III. Because of the more costly pressure pipe,
these project costs vary from $2,668,000 to $5,085,000.
Tables 16 - 19, on Pages 42 - 45, indicate the costs for
Alternative IV. Although there is substantial savings in the
use of the weir inlet control structure, there is an increase
28
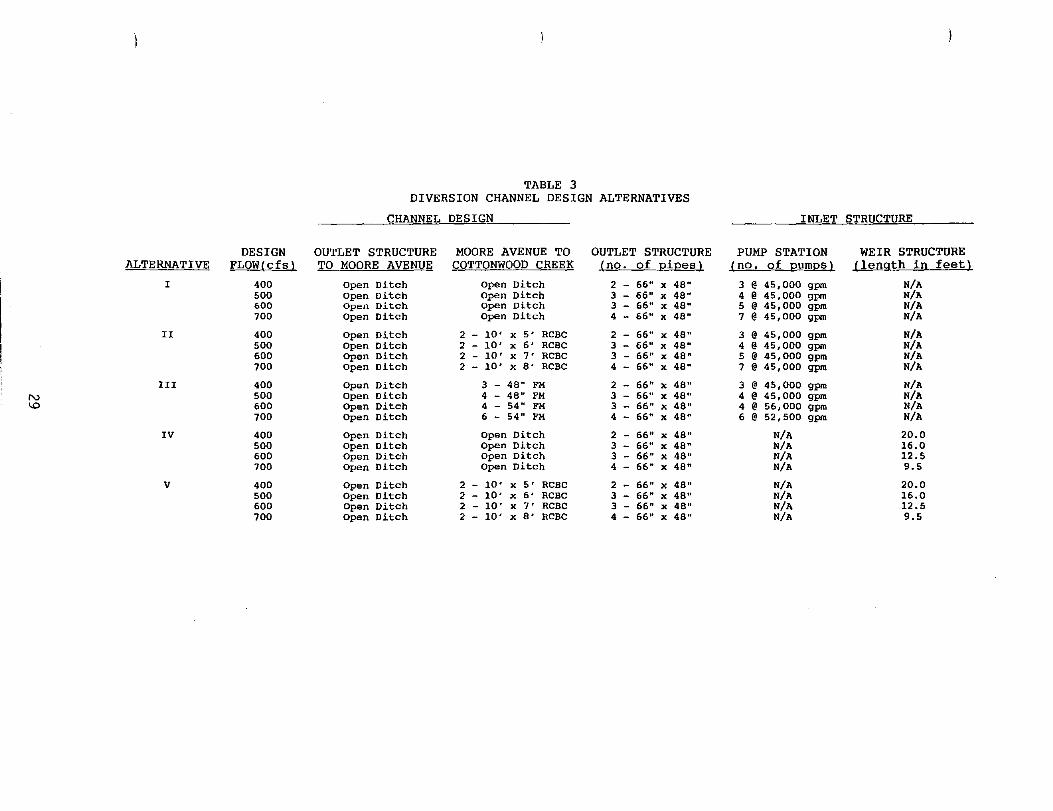
TABLE 3 DIVERSION CHANNEL DESIGN ALTERNATIVES
CHANNEL DESIGN INLET STRUCTURE
DESIGN OUTLET STRUCTURE MOORE AVENUE TO OUTLET STRUCTURE PUMP STATION WEIR STRUCTURE ALTERNATIVE FLOW(cfs} TO MOORE AVENUE COTTONWOOD CREEK (no. of QiQes) (no. of QumQs) (length in feet)
I 400 Open Ditch open Ditch 2 - 66" x 48" 3 @ 45,000 gpm N/A 500 Open Ditch Open Ditch 3 - 66" x 48" 4 @ 45,000 gpm N/A 600 Open Ditch Open Ditch 3 - 66" x 48" 5 @ 45,000 gpm N/A 700 Open Ditch Open Ditch 4 - 66" x 48" 7 @ 45,000 gpm N/A
II 400 Open Ditch 2 - 10' x 5' ReBe 2 - 66" x 48" 3 @ 45,000 gpm N/A 500 Open Ditch 2 - 10' x 6' ReBe 3 - 66" x 48" 4 @ 45,000 gpm N/A 600 Open Ditch 2 - 10' x 7' ReBe 3 - 66" x 48" 5 @ 45,000 gpm N/A 700 Open Ditch 2 - 10' x 8' ReBe 4 - 66" x 48" 7 @ 45,000 gpm N/A
III 400 Open Ditch 3 - 48" FM 2 - 66" x 48" 3 @ 45,000 gpm N/A N 500 Open Ditch 4 - 48" FM 3 - 66" x 48" 4 @ 45,000 gpm N/A <0 600 Open Ditch 4 - 54" FM 3 - 66" x 48" 4 @ 56,000 gpm N/A
700 Open Ditch 6 - 54" FM 4 - 66" x 48" 6 @ 52,500 gpm N/A
IV 400 Open Ditch open Ditch 2 - 66" x 48" N/A 20.0 500 Open Ditch Open Ditch 3 - 66" x 48" N/A 16.0 600 Open Ditch open Ditch 3 - 66" x 48" N/A 12.5 700 Open Ditch Open Ditch 4 - 66" x 48" N/A 9.5
V 400 Open Ditch 2 - 10' x 5' ReBe 2 - 66" x 48" N/A 20.0 500 Open Ditch 2 - 10' x 6' ReBe 3 - 66" x 48" N/A 16.0 600 Open Ditch 2 - 10' x 7' ReBe 3 - 66" X 48" N/A 12.5 700 Open Ditch 2 - 10' x 8' ReBe 4 - 66" x 48" N/A 9.5
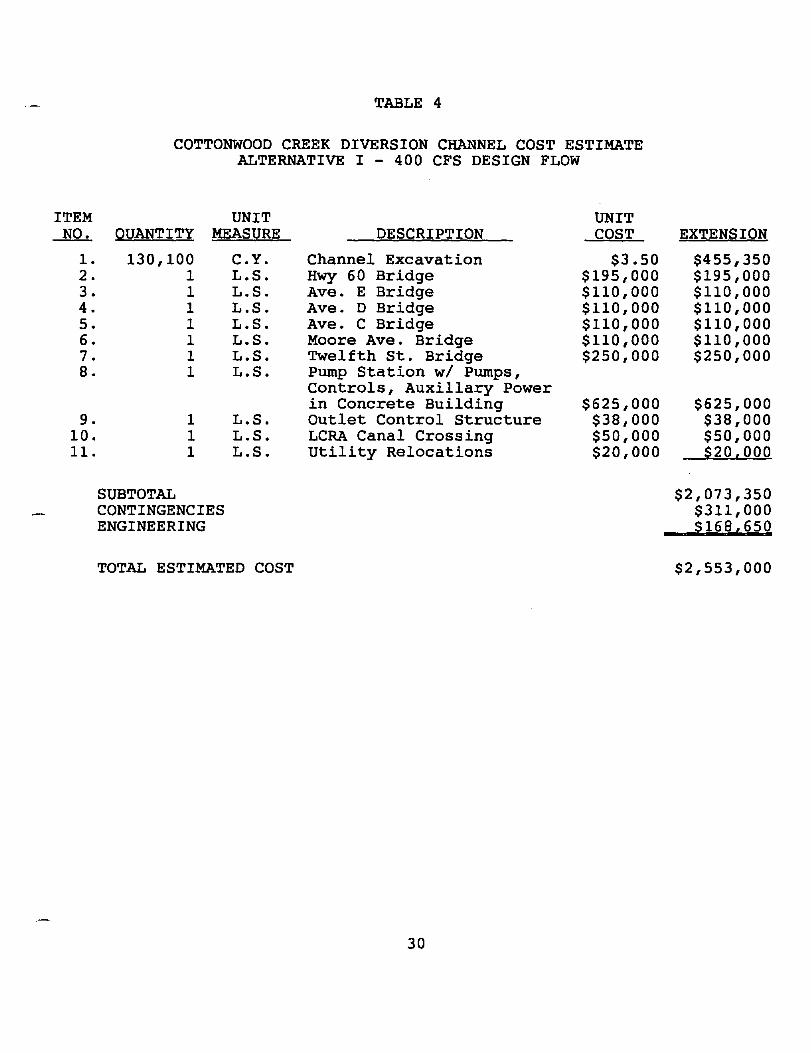
ITEM NO.
I. 2. 3. 4. 5. 6. 7. 8.
9. 10. II.
TABLE 4
COTTONWOOD CREEK DIVERSION CHANNEL COST ESTIMATE ALTERNATIVE I - 400 CFS DESIGN FLOW
UNIT UNIT QUANTITY MEASURE DESCRIPTION COST
130,100 C.Y. Channel Excavation $3.50 1 L.S. Hwy 60 Bridge $195,000 1 L.S. Ave. E Bridge $110,000 1 L.S. Ave. D Bridge $110,000 1 L.S. Ave. C Bridge $110,000 1 L.S. Moore Ave. Bridge $110,000 1 L.S. Twelfth St. Bridge $250,000 1 L.S. Pump Station wi Pumps,
Controls, AuxilIary Power in Concrete Building $625,000
1 L.S. Outlet Control Structure $38,000 1 L.S. LCRA Canal Crossing $50,000 1 L.S. Utility Relocations $20,000
SUBTOTAL CONTINGENCIES ENGINEERING
TOTAL ESTIMATED COST
30
EXTENSION
$455,350 $195,000 $110,000 $110,000 $110,000 $110,000 $250,000
$625,000 $38,000 $50,000 S20,000
$2,073,350 $311,000 S168,650
$2,553,000
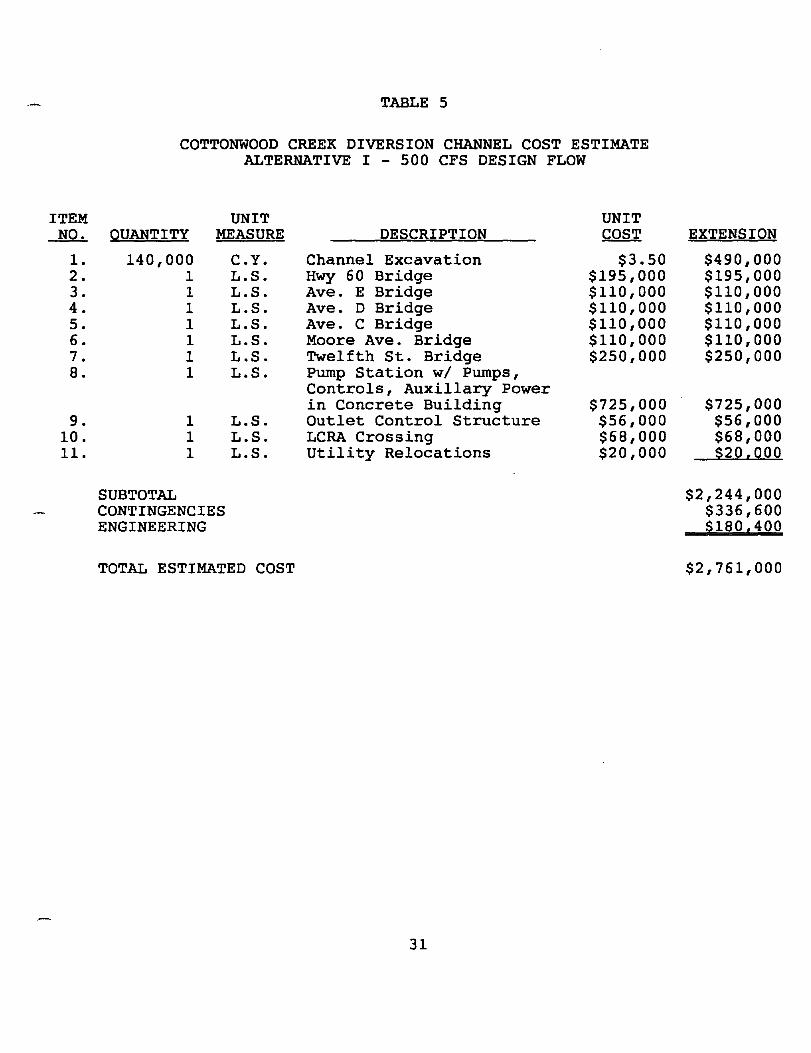
ITEM NO.
I. 2. 3. 4. 5. 6. 7. 8.
9. 10. II.
TABLE 5
COTTONWOOD CREEK DIVERSION CHANNEL COST ESTIMATE ALTERNATIVE I-500 CFS DESIGN FLOW
UNIT UNIT QUANTITY MEASURE DESCRIPTION COST
140,000 C.Y. Channel Excavation $3.50 1 L.S. Hwy 60 Bridge $195,000 1 L.S. Ave. E Bridge $110,000 I L.S. Ave. D Bridge $110,000 1 L.S. Ave. C Bridge $110,000 1 L.S. Moore Ave. Bridge $110,000 1 L.S. Twelfth St. Bridge $250,000 1 L.S. Pump Station wi Pumps,
Controls, AuxilIary Power in Concrete Building $725,000
1 L.S. Outlet Control Structure $56,000 1 L.S. LCRA Crossing $68,000 1 L.S. Utility Relocations $20,000
SUBTOTAL CONTINGENCIES ENGINEERING
TOTAL ESTIMATED COST
31
EXTENSION
$490,000 $195,000 $110,000 $110,000 $110,000 $110,000 $250,000
$725,000 $56,000 $68,000 520.000
$2,244,000 $336,600 5180.400
$2,761,000
ITEM NO.
I. 2. 3. 4. 5. 6. 7. 8.
9. 10. 1I.
TABLE 6
COTTONWOOD CREEK DIVERSION CHANNEL COST ESTIMATE ALTERNATIVE I - 600 CFS DESIGN FLOW
UNIT UNIT QUANTITY MEASURE DESCRIPTION COST
147,000 C.Y. Channel Excavation $3.50 1 L.S. Hwy 60 Bridge $195,000 1 L.S. Ave. E Bridge $110,000 1 L.S. Ave. D Bridge $110,000 1 L.S. Ave. C Bridge $110,000 1 L.S. Moore Ave. Bridge $110,000 1 L.S. Twelfth St. Bridge $250,000 1 L.S. Pump Station wi Pumps,
Controls, AuxilIary Power in Concrete Building $860,000
1 L.S. Outlet Control Structure $56,000 1 L.S. LCRA Canal Crossing $68,000 1 L.S. Utility Relocations $20,000
SUBTOTAL CONTINGENCIES ENGINEERING
TOTAL ESTIMATED COST
32
EXTENSION
$514,500 $195,000 $110,000 $110,000 $110,000 $110,000 $250,000
$860,000 $56,000 $68,000 $20,000
$2,403,500 $360,500 $194,000
$2,958,000
ITEM NO.
1. 2. 3. 4. 5. 6. 7 . 8.
9. 10. 11.
TABLE 7
COTTONWOOD CREEK DIVERSION CHANNEL COST ESTIMATE ALTERNATIVE I - 700 CFS DESIGN FLOW
UNIT UNIT QUANTITY MEASURE DESCRIPTION COST
160,500 C.Y. Channel Excavation $3.50 I L.S. Hwy 60 Bridge $195,000 1 L.S. Ave. E Bridge $110,000 1 L.S. Ave. D Bridge $110,000 1 L.S. Ave. C Bridge $110,000 1 L.S. Moore Ave. Bridge $110,000 1 L.S. Twelfth St. Bridge $250,000 1 L.S. Pump Station wi Pumps,
Controls, AuxilIary Power in Concrete Building $1,075,000
1 L.S. Outlet Control Structure $70,000 1 L.S. LCRA Canal Crossing $80,000 1 L.S. Utility Relocations $20,000
SUBTOTAL CONTINGENCIES ENGINEERING
TOTAL ESTIMATED COST
33
EXT~NSION
$561,750 $195,000 $110,000 $110,000 $110,000 $110,000 $250,000
$1,075,000 $70,000 $80,000 $20,000
$2,691,750 $403,750 $216,500
$3,312,000

ITEM NO.
l. 2. 3. 4. 5.
6. 7. 8.
TABLE 8
COTTONWOOD CREEK DIVERSION CHANNEL COST ESTIMATE ALTERNATIVE II - 400 CFS DESIGN FLOW
UNIT UNIT QUANTITY MEASURE DESCRIPTION COST
23,000 C.Y. Channel Excavation $3.50 2,600 L.F. 2-10' x 5' C850 RCBC $590
6 EA. Storm Sewer Manhole $700 1 L.S. Twelfth St. Bridge $250,000 1 L.S. Pump Station wi Pumps,
Controls, AuxilIary Power in Concrete Building $625,000
1 L.S. Outlet Control Structure $38,000 1 L.S. LCRA Canal Crossing $50,000 1 L.S. Utility Relocations $20,000
SUBTOTAL CONTINGENCIES ENGINEERING
TOTAL ESTIMATED COST
34
EXTENSION
$80,500 $1,534,000
$4,200 $250,000
$625,000 $38,000 $50,000 $20,000
$2,601,700 $390,300 $180,000
$3,172,000

ITEM NO.
l. 2. 3. 4. 5.
6. 7. 8.
TABLE 9
COTTONWOOD CREEK DIVERSION CHANNEL COST ESTIMATE ALTERNATIVE II - 500 CFS DESIGN FLOW
UNIT UNIT QUANTITY MEASURE DESCRIPTION COST
25,500 C.Y. Channel Excavation $3.50 2,600 L.F. 2-10' x 6' C850 RCBC $640
6 EA. Storm Sewer Manhole $700 1 L.S. Twelfth St. Bridge $250,000 1 L.S. Pump Station wi Pumps,
Controls, AuxilIary Power in Concrete Building $725,000
1 L.S. Outlet Control Structure $56,000 1 L.S. LCRA Canal Crossing $68,000 1 L.S. Utility Relocations $20,000
SUBTOTAL CONTINGENCIES ENGINEERING
TOTAL ESTIMATED COST
35
EXTENSION
$89,250 $1,664,000
$4,200 $250,000
$725,000 $56,000 $68,000 $20,000
$2,876,450 $431,450 $198,100
$3,506,000
ITEM NO.
l. 2. 3. 4. 5.
6. 7 . 8.
TABLE 10
COTTONWOOD CREEK DIVERSION CHANNEL COST ESTIMATE ALTERNATIVE II - 600 CFS DESIGN FLOW
UNIT UNIT QUANTITY MEASURE DESCRIPTION COST
27,500 C.Y. Channel Excavation $3.50 2,600 L.F. 2-10' x 7' C850 RCBC $680
6 EA. Storm Sewer Manhole $700 1 L.S. Twelfth St. Bridge $250,000 1 L.S. Pump Station wi Pumps,
Controls, AuxilIary Power in Concrete Building $860,000
1 L.S. Outlet Control Structure $56,000 1 L.S. LCRA Canal Crossing $68,000 1 L.S. Utility Relocations $20,000
SUBTOTAL CONTINGENCIES ENGINEERING
TOTAL ESTIMATED COST
36
EXTENSION
$96,250 $1,768,000
$4,200 $250,000
$860,000 $56,000 $68,000 $20,000
$3,122,450 $468,350 $215,200
$3,806,000
ITEM NO.
1-2. 3. 4. 5.
6. 7. 8.
TABLE 11
COTTONWOOD CREEK DIVERSION CHANNEL COST ESTIMATE ALTERNATIVE II - 700 CFS DESIGN FLOW
UNIT UNIT QUANTITY MEASURE DESCRIPTION COST
31,100 C.Y. Channel Excavation $3.50 2,600 L.F. 2-10' x 8' C850 RCBC $740
6 EA. Storm Sewer Manhole $700 1 L.S. Twelfth St. Bridge $250,000 1 L.S. Pump Station wi Pumps,
Controls, AuxilIary Power in Concrete Building $1,075,000
1 L.S. Outlet Control Structure $70,000 1 L.S. LCRA Canal Crossing $80,000 1 L.S. Utility Relocations $20,000
SUBTOTAL CONTINGENCIES ENGINEERING
TOTAL ESTIMATED COST
37
EXTENSION
$108,850 $1,924,000
$4,200 $250,000
$1,075,000 $70,000 $80,000 520,000
$3,532,050 $529,850 5244,100
$4,306,000
ITEM ~
1. 2. 3. 4. 5.
6. 7. 8.
TABLE 12
COTTONWOOD CREEK DIVERSION CHANNEL COST ESTIMATE ALTERNATIVE III - 400 CFS DESIGN FLOW
UNIT QUANTITY MEASURE
62,200 C.Y. 2,600 L.F.
3 EA. 1 L.S. 1 L.S.
1 L.S. 1 L.S. 1 L.S.
SUBTOTAL CONTINGENCIES ENGINEERING
TOTAL ESTIMATED COST
DESCRIPTION
Channel Excavation 3-48" Cone. Pressure Pipe Air Release Manhole Twelfth St. Bridge Pump Station wi Pumps, Controls, Auxillary Power in Concrete Building Outlet Control Structure LCRA Canal Crossing Utility Relocations
38
UNIT COST
$3.50 $370
$2,000 $250,000
$625,000 $38,000 $50,000 $20,000
EXTENSION
$217,700 $962,000
$6,000 $250,000
$625,000 $38,000 $50,000 $20,000
$2,168,700 $325,300 $174,000
$2,668,000

ITEM NO.
lo 2. 3. 4. 5.
6. 7. 8.
TABLE 13
COTTONWOOD CREEK DIVERSION CHANNEL COST ESTIMATE ALTERNATIVE III - 500 CFS DESIGN FLOW
QUANTITY
62,200
UNIT MEASURE
2,600 4 1 1
1 1 1
. SUBTOTAL CONTINGENCIES ENGINEERING
C.Y. L.F. EA.
L.S. L.S.
L.S. L.S. L.S.
TOTAL ESTIMATED COST
DESCRIPTION
Channel Excavation 4-48" Conc. Pressure Pipe Air Release Manhole Twelfth St. Bridge Pump Station wi Pumps, Controls, Auxiliary Power in Concrete Building Outlet Control Structure LCRA Canal Crossing Utility Relocations
39
UNIT COST
$3.50 $490
$2,000 $250,000
$725,000 $56,000 $68,000 $20,000
EXTENSION
$217,700 $1,274,000
$8,000 $250,000
$725,000 $56,000 $68,000 $20,000
$2,618,700 $392,800 $180,500
$3,192,000
ITEM NO.
1-2 . 3. 4. 5.
6. 7. 8.
TABLE 14
COTTONWOOD CREEK DIVERSION CHANNEL COST ESTIMATE ALTERNATIVE III - 600 CFS DESIGN FLOW
UNIT QUANTITY MEASURE
62,200 C.Y. 2,600 L.F.
4 EA. 1 L.S. 1 L.S.
1 L.S. 1 L.S. 1 L.S.
SUBTOTAL CONTINGENCIES ENGINEERING
TOTAL ESTIMATED COST
DESCRIPTION
Channel Excavation 4-54" Cone. Pressure Pipe Air Release Manhole Twelfth St. Bridge Pump Station wi Pumps, Controls, AuxilIary Power in Concrete Building Outlet Control Structure LCRA Canal Crossing Utility Relocations
40
UNIT COST
$3.50 $640
$2,500 $250,000
$860,000 $56,000 $68,000 $20,000
EXTENSION
$217,700 $1,664,000
$10,000 $250,000
$860,000 $56,000 $68,000 S20,000
$3,145,700 $471,800 S217,500
$3,835,000

ITEM NO.
l. 2. 3. 4. 5.
6. 7. 8.
TABLE 15
COTTONWOOD CREEK DIVERSION CHANNEL COST ESTIMATE ALTERNATIVE III - 700 CFS DESIGN FLOW
UNIT QUANTITY MEASURE
62,200 C.Y. 2,600 L.F.
6 EA. 1 L.S. 1 L. S.
1 L.S. 1 L.S. 1 L.S.
SUBTOTAL CONTINGENCIES ENGINEERING
TOTAL ESTIMATED COST
DESCRIPTION
Channel Excavation 6-54" Cone. Pressure Pipe Air Release Manhole Twelfth St. Bridge Pump Station wi Pumps, Controls, AuxilIary Power in Concrete Building Outlet Control Structure LCRA Canal Crossing Utility Relocations
41
UNIT COST
$3.50 $940
$2,500 $250,000
$1,075,000 $70,000 $80,000 $20,000
EXTENSION
$217,700 $2,444,000
$15,000 $250,000
$1,075,000 $70,000 $80,000 $20,000
$4,171,700 $625,700 $287,600
$5,085,000
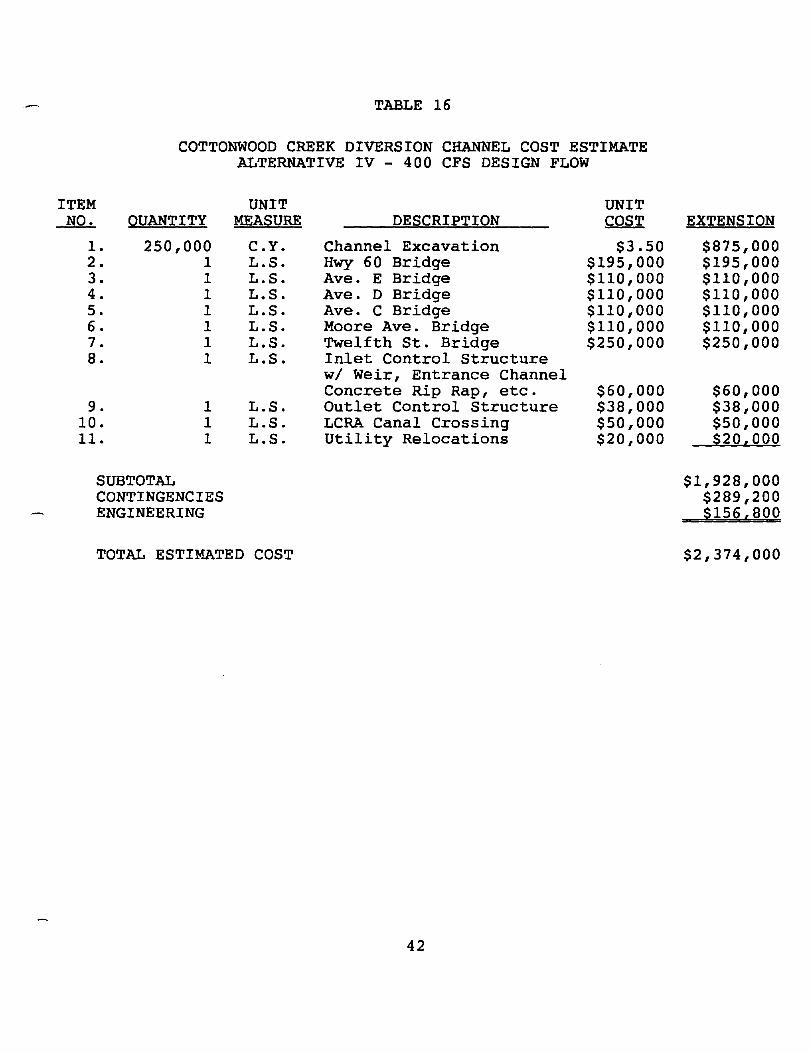
TABLE 16
COTTONWOOD CREEK DIVERSION CHANNEL COST ESTIMATE ALTERNATIVE IV - 400 CFS DESIGN FLOW
ITEM NO.
1. 2. 3. 4. 5. 6. 7. 8.
9. 10. 11.
OUANTITY
250,000 1 1 1 1 1 1 1
1 1 1
SUBTOTAL CONTINGENCIES ENGINEERING
UNIT MEASURE
C.Y. L.S. L.S. L.S. L.S. L.S. L.S. L.S.
L.S. L.S. L.S.
TOTAL ESTIMATED COST
DESCRIPTION
Channel Excavation Hwy 60 Bridge Ave. E Bridge Ave. D Bridge Ave. C Bridge Moore Ave. Bridge Twelfth St. Bridge Inlet Control Structure wi Weir, Entrance Channel Concrete Rip Rap, etc. Outlet Control Structure LCRA Canal Crossing Utility Relocations
42
UNIT COST
$3.50 $195,000 $110,000 $110,000 $110,000 $110,000 $250,000
$60,000 $38,000 $50,000 $20,000
EXTENSION
$875,000 $195,000 $110,000 $110,000 $110,000 $110,000 $250,000
$60,000 $38,000 $50,000 $20,000
$1,928,000 $289,200 $156,800
$2,374,000

TABLE 17
COTTONWOOD CREEK DIVERSION CHANNEL COST ESTIMATE ALTERNATIVE IV - 500 CFS DESIGN FLOW
ITEM NO.
1. 2 . 3. 4. 5. 6. 7. 8.
9. 10. 11.
QUANTITY
250,000 1 1 1 1 1 1 1
1 1 1
SUBTOTAL CONTINGENCIES ENGINEERING
UNIT MEASURE
C.Y. L.S. L.S. L.S. L.S. L.S. L.S. L.S.
L.S. L.S. L.S.
TOTAL ESTIMATED COST
DESCRIPTION
Channel Excavation Hwy 60 Bridge Ave. E Bridge Ave. D Bridge Ave. C Bridge Moore Ave. Bridge Twelfth St. Bridge Inlet Control Structure wi Weir, Entrance Channel Concrete Rip Rap, etc. Outlet Control Structure LCRA Canal Crossing Utility Relocations
43
UNIT COST
$3.50 $195,000 $110,000 $110,000 $110,000 $110,000 $250,000
$65,000 $56,000 $68,000 $20,000
EXTENSION
$875,000 $195,000 $110,000 $110,000 $110,000 $110,000 $250,000
$65,000 $56,000 $68,000 S20,000
$1,969,000 $295,350 S158,650
$2,423,000

TABLE 18
COTTONWOOD CREEK DIVERSION CHANNEL COST ESTIMATE ALTERNATIVE IV - 600 CFS DESIGN FLOW
ITEM NO.
1. 2. 3. 4. 5. 6. 7. 8.
9. 10. 11.
QUANTITY
250,000 1 1 1 1 1 1 1
1 1 1
SUBTOTAL CONTINGENCIES ENGINEERING
UNIT MEASURE
C.Y. L.S. L.S. L.S. L.S. L.S. L.S. L.S.
L.S. L.S. L.S.
TOTAL ESTIMATED COST
DESCRIPTION
Channel Excavation Hwy 60 Bridge Ave. E Bridge Ave. D Bridge Ave. C Bridge Moore Ave. Bridge Twelfth St. Bridge Inlet Control Structure wi Weir, Entrance Channel Concrete Rip Rap, etc. Outlet Control Structure LCRA Canal Crossing Utility Relocations
44
UNIT COST
$3.50 $195,000 $110,000 $110,000 $110; 000 $110,000 $250,000
$70,000 $56,000 $68,000 $20,000
EXTENSION
$875,000 $195,000 $110,000 $110,000 $110,000 $110,000 $250,000
$70,000 $56,000 $68,000 520,000
$1,974,000 $296,100 5158,900
$2,429,000
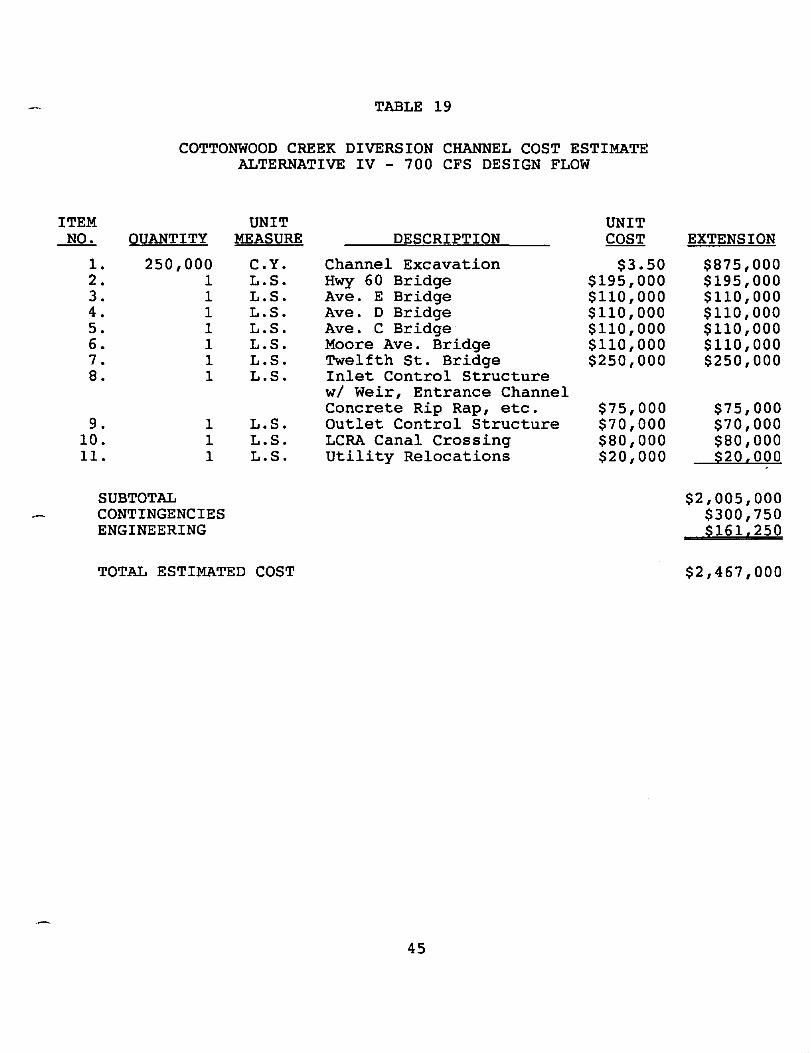
TABLE 19
COTTONWOOD CREEK DIVERSION CHANNEL COST ESTIMATE ALTERNATIVE IV - 700 CFS DESIGN FLOW
ITEM NO.
1. 2. 3. 4. 5. 6. 7. 8.
9 • 10. 11.
QUANTITY
250,000 1 1 1 1 1 1 1
1 1 1
SUBTOTAL CONTINGENCIES ENGINEERING
UNIT MEASURE
C.Y. L.S. L.S. L.S. L.S. L.S. L.S. L.S.
L.S. L.S. L.S.
TOTAL ESTIMATED COST
DESCRIPTION
Channel Excavation Hwy 60 Bridge Ave. E Bridge Ave. D Bridge Ave. C Bridge Moore Ave. Bridge Twelfth St. Bridge Inlet Control Structure wi Weir, Entrance Channel Concrete Rip Rap, etc. Outlet Control Structure LCRA Canal Crossing Utility Relocations
45
UNIT COST
$3.50 $195,000 $110,000 $110,000 $110,000 $110,000 $250,000
$75,000 $70,000 $80,000 $20,000
EXTENSION
$875,000 $195,000 $110,000 $110,000 $110,000 $110,000 $250,000
$75,000 $70,000 $80,000 $20.000
$2,005,000 $300,750 $161.250
$2,467,000
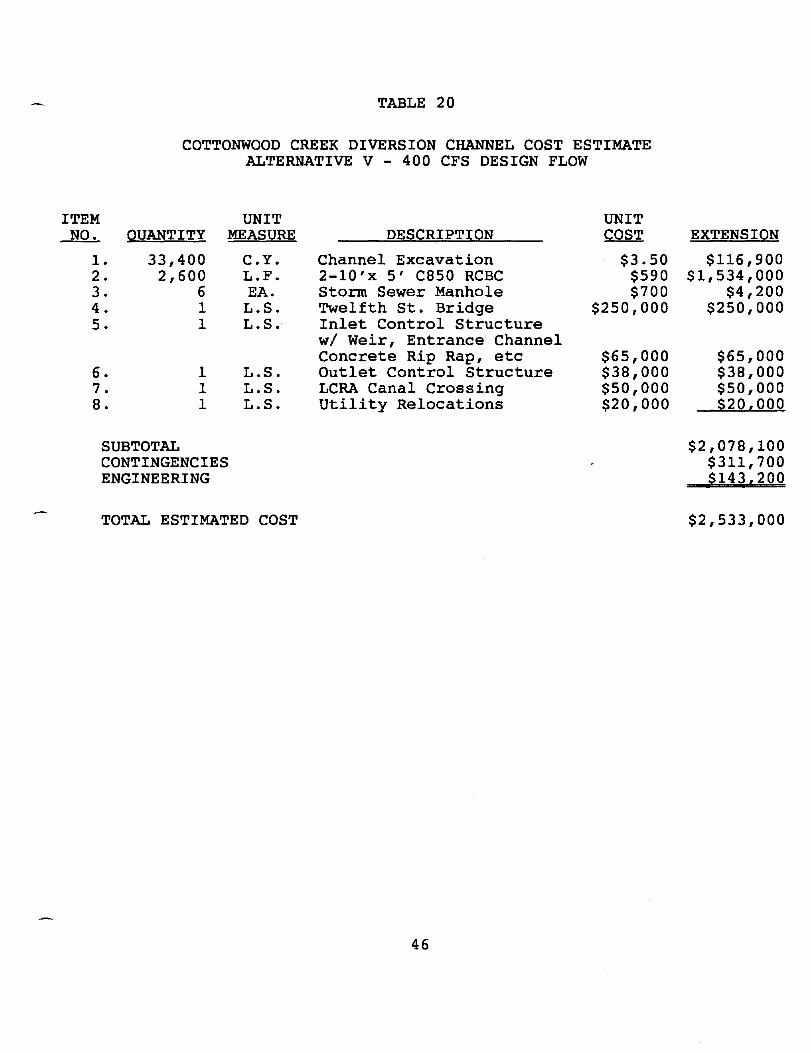
TABLE 20
COTTONWOOD CREEK DIVERSION CHANNEL COST ESTIMATE ALTERNATIVE V-400 CFS DESIGN FLOW
ITEM UNIT NO. QUANTITY MEASURE
1-2. 3. 4. 5.
6. 7. 8.
33,400 2,600
6 1 1
1 1 1
SUBTOTAL CONTINGENCIES ENGINEERING
C.Y. L.F. EA. L.S. L.S.
L.S. L.S. L.S.
TOTAL ESTIMATED COST
DESCRIPTION
Channel Excavation 2-10'x 5' C850 RCBC Storm Sewer Manhole Twelfth St. Bridge Inlet Control Structure wi Weir, Entrance Channel Concrete Rip Rap, etc Outlet Control Structure LCRA Canal Crossing Utility Relocations
46
UNIT COST
$3.50 $590 $700
$250,000
$65,000 $38,000 $50,000 $20,000
EXTENSION
$116,900 $1,534,000
$4,200 $250,000
$65,000 $38,000 $50,000 $20,000
$2,078,100 $311,700 $143,200
$2,533,000
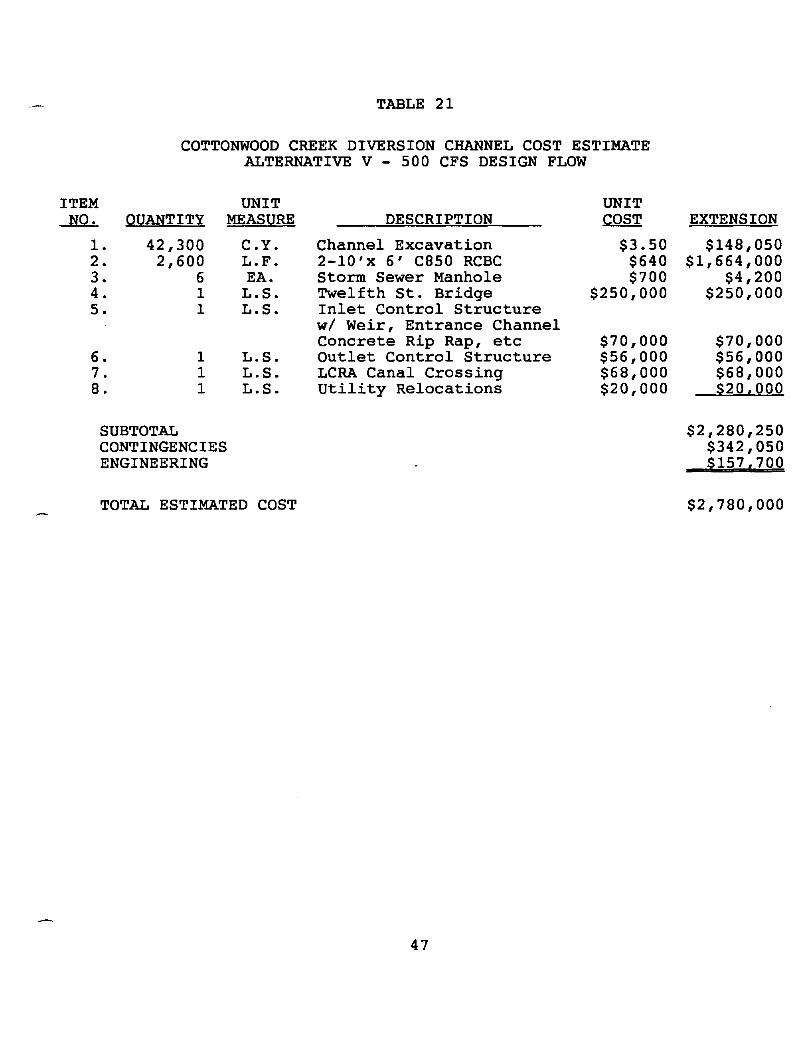
TABLE 21
COTTONWOOD CREEK DIVERSION CHANNEL COST ESTIMATE ALTERNATIVE V - 500 CFS DESIGN FLOW
ITEM UNIT NO. QUANTITY MEASURE
1. 2. 3. 4. 5.
6. 7. 8.
42,300 2,600
6 1 1
1 1 1
SUBTOTAL CONTINGENCIES ENGINEERING
C.Y. L.F. EA. L.S. L.S.
L.S. L.S. L.S.
TOTAL ESTIMATED COST
DESCRIPTION
Channel Excavation 2-10'x 6' C850 RCBC Storm Sewer Manhole Twelfth St. Bridge Inlet Control Structure wi Weir, Entrance Channel Concrete Rip Rap, etc Outlet Control Structure LCRA Canal Crossing Utility Relocations
47
UNIT COST
$3.50 $640 $700
$250,000
$70,000 $56,000 $68,000 $20,000
EXTENSION
$148,050 $1,664,000
$4,200 $250,000
$70,000 $56,000 $68,000 $20,000
$2,280,250 $342,050 $157,700
$2,780,000
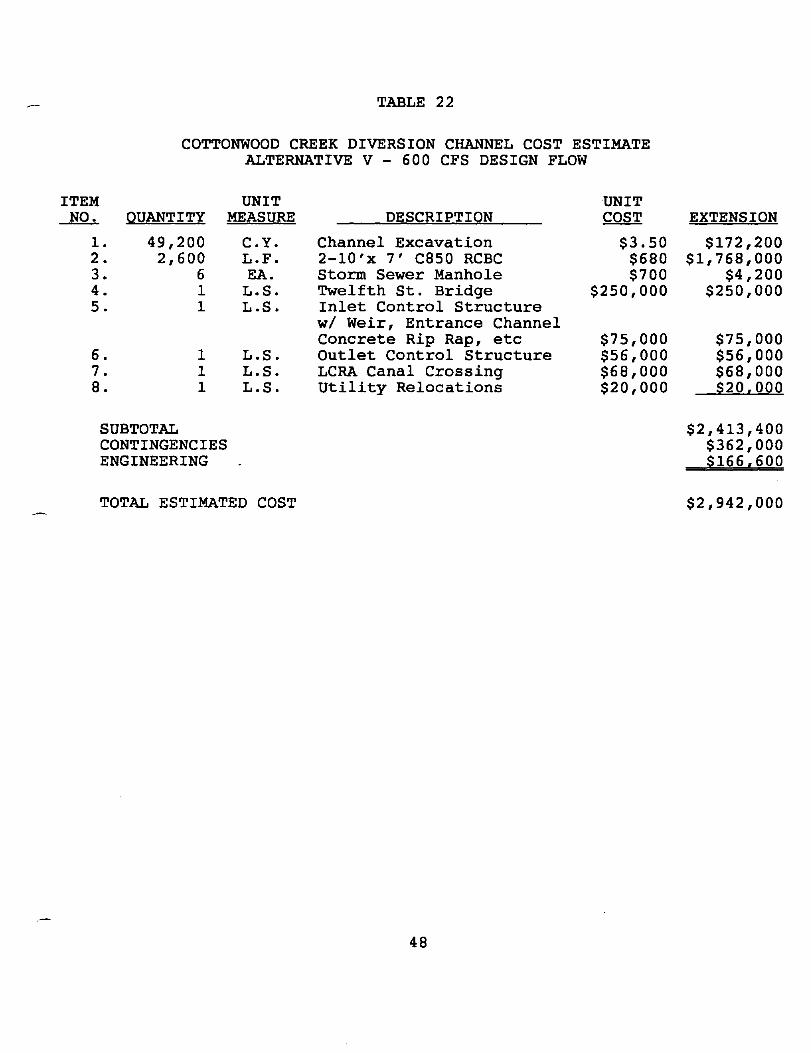
TABLE 22
COTTONWOOD CREEK DIVERSION CHANNEL COST ESTIMATE ALTERNATIVE V - 600 CFS DESIGN FLOW
ITEM NO.
1. 2 . 3. 4. 5.
6. 7. 8.
QUANTITY
49,200 2,600
6 1 1
1 1 1
SUBTOTAL CONTINGENCIES ENGINEERING
UNIT MEASURE
C.Y. L.F. EA.
L.S. L.S.
L. S. L.S. L.S.
TOTAL ESTIMATED COST
DESCRIPTION
Channel Excavation 2-10'x 7' C850 RCBC Storm Sewer Manhole Twelfth St. Bridge Inlet Control Structure wi Weir, Entrance Channel Concrete Rip Rap, etc Outlet Control Structure LCRA Canal Crossing Utility Relocations
48
UNIT COST
$3.50 $680 $700
$250,000
$75,000 $56,000 $68,000 $20,000
EXTENSION
$172,200 $1,768,000
$4,200 $250,000
$75,000 $56,000 $68,000 $20,000
$2,413,400 $362,000 $166,600
$2,942,000

TABLE 23
COTTONWOOD CREEK DIVERSION CHANNEL COST ESTIMATE ALTERNATIVE V - 700 CFS DESIGN FLOW
ITEM NO.
1. 2. 3. 4. 5.
6. 7. 8.
QUANTITY
62,200 2,600
6 1 1
1 1 1
SUBTOTAL CONTINGENCIES ENGINEERING
UNIT MEASURE
C.Y. L.F. EA.
L.S. L.S.
L.S. L.S. L.S.
TOTAL ESTIMATED COST
DESCRIPTION
Channel Excavation 2-10'x 8' C850 RCBC Storm Sewer Manhole Twelfth St. Bridge Inlet Control Structure wI weir, Entrance Channel Concrete Rip Rap, etc Outlet Control Structure LCRA Canal Crossing Utility Relocations
49
UNIT COST
$3.50 $740 $700
$250,000
$80,000 $70,000 $80,000 $20,000
EXTENSION
$217,700 $1,924,000
$4,200 $250,000
$80,000 $70,000 $80,000 520,000
$2,645,900 $396,900 5182,200
$3,225,000

in costs for the additional excavation required to obtain the
necessary channel depths. Total project costs vary from
$2,374,000 to $2,467,000 for Alternative IV.
Tables 20 - 23, on Pages 46 - 49, show the project costs for
Alternative V. The use of the storm sewer increases these
costs over those for Alternative IV. Project costs are
estimated to vary from $2,533,000 to $3,225,000.
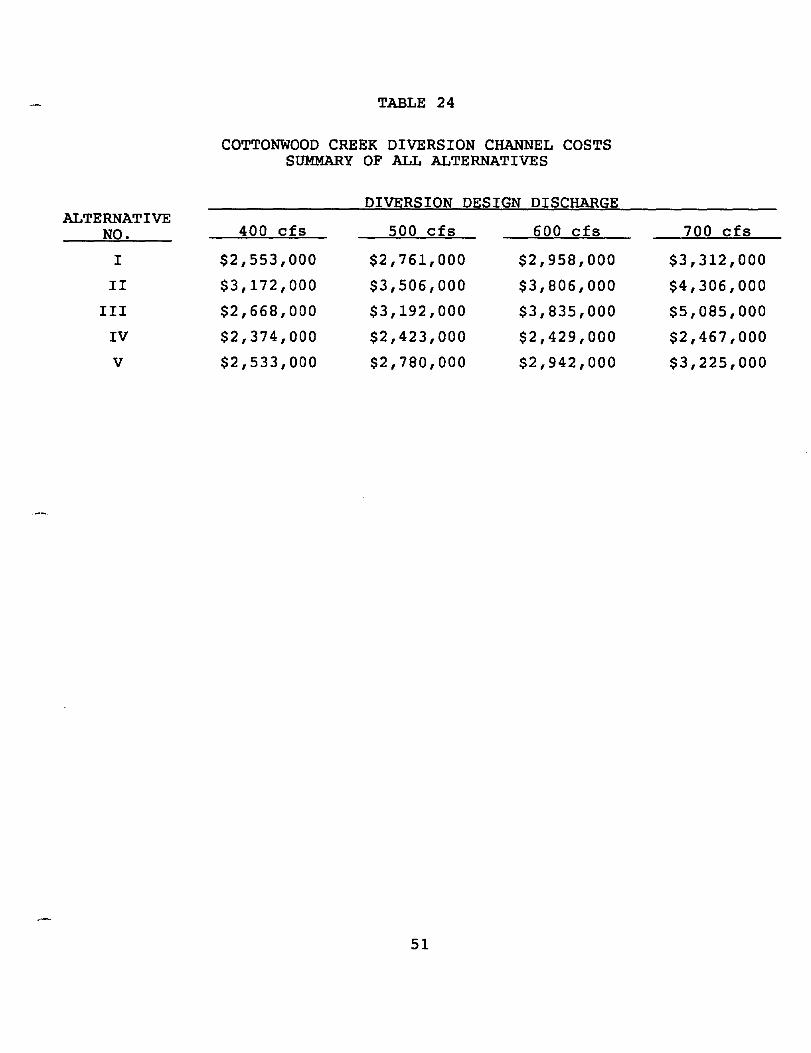
Table 24, on Page 51, summarizes the project costs for each
alternative for the various flows. The least expensive
alternative is Alternative IV for a 400 cfs diversion, at
$2,374,000. The most expensive option in Alternative III, at
a 700 cfs diversion, which is estimated to cost $5,085,000.
E. OPERATION AND MAINTENANCE COSTS
1. General
As with any public works project, there are annual costs
associated with the operation and maintenance of the
constructed facility. These costs are largely dependant
upon unpredictable events each year, namely the weather
and related rainfall amounts and intensities. However,
based on engineering judgements, an estimate of these
annual costs was made.
There are two main components of the operation and
maintenance costs for the alternatives analyzed. The
first of these is the maintenance of the open ditch
section of the diversion facility. The second is the
pump station proposed in three of the alternatives.
50
ALTERNATIVE NO.
I
II
III
IV
V
TABLE 24
COTTONWOOD CREEK DIVERSION CHANNEL COSTS SUMMARY OF ALL ALTERNATIVES
DIVERSION DESIGN DISCHARGE
400 cfs 500 cfs 600 cfs
$2,553,000 $2,761,000 $2,958,000
$3,172,000 $3,506,000 $3,806,000
$2,668,000 $3,192,000 $3,835,000
$2,374,000 $2,423,000 $2,429,000
$2,533,000 $2,780,000 $2,942,000
51
700 cfs
$3,312,000
$4,306,000
$5,085,000
$2,467,000
$3,225,000
2. Open Ditch Operation and Maintenance Costs
Proper maintenance of an open ditch section involves both
annual mowing and the spraying of herbicides to reduce
the growth of vegetation. If an adequate spraying
program is maintained, the number of times the ditch will
require mowing each year will be reduced. However, both
of these activities are influenced by the amount of
rainfall the area receives during the growth season.
Based on the concept of a combination of spraying and
mowing, normal maintenance of the ditch section can be
accomplished with two sprayings and two mowings each
year. In Alternatives I and IV, which incorporate an
open ditch for the entire length of the project, it is
estimated that the annual cost for the maintenance of
this length of ditch is $4,000. Under Alternatives II,
III, and V, the length of the open ditch is reduced. The
annual cost of maintaining this facility is estimated at
$2,000.
There is also periodic maintenance on open ditches to
correct or repair erosion problems that will occur.
Again, the magnitude of the problem is influenced by
unpredictable events that transpire during the life of
the project. For the purposes of this study, an annual
cost of $3,000 is estimated for this maintenance cost.
There are other minor costs in the maintenance of an open
ditch, such as spraying for vectors and clean-up costs
for illegal dumping. These costs were estimated at
$1,000 per year.
52
The storm sewer section of Alternatives II and V should
require only minimal amounts of maintenance during a
normal year. An occasional cleaning of junction boxes or
manholes should comprise the majority of the maintenance
on the storm sewer. An estimated annual cost of $1,000
was used for this work.
3. Pump Station Operation and Maintenance Costs
The two major components of the pump station are the
pumps and their motors, and the auxiliary power
generator. Both of these items will require periodic
maintenance and will have operational expenses.
The pumps and motors operation and maintenance costs are
comprised of two parts. The first in the annual cost of
the electricity required to operate the motors. This
cost is dependent upon the length of time the motors run,
which in turn is dependent upon the rainfall amounts
received. The second part of this cost pertains to the
care of the pumps and motors. Items such as bearings and
seals will require service and replacement, and other
small repairs will be experienced throughout the life of
the station.
The power generator in the station will be called upon to
work when normal electrical power is not available.
Because of the infrequency of this type of occurrence,
scheduled maintenance of this facility is imperative to
insure its operation when needed.
Assumptions were made with respect to the yearly
operation of the pumps within the station. Based on an
average electrical cost of $25.00 per hour of operation,
53
total electrical costs were assigned to the pumps in each
alternative. Normal maintenance was estimated at $600
per year per pump and motor. Maintenance of the power
generator was estimated at $1,000 per year.
Table 25 on page 55 summarizes the annual operation and
maintenance costs for each flow rate design for each
alternative. These costs were not included in the
benefit/cost ratio calculations contained in this report
because it would not change the final conclusions and
actual costs are unpredictable.
F. FLOOD PLAIN IMPACTS
1. General
City maps were utilized to determine the impacts on the
100-year flood plain as a result of diverting storm flows
from Cottonwood Creek. Once the areas of flooding were
determined, based on the projected water surface
elevations, the number of houses, businesses, etc.,
within the flood plain could be determined.
2. Limits of Flood Plain Impact
Based on the HEC-2 model for Cottonwood Creek, water
surface elevations for each diversion flow rate were
computed. Based on these elevations, and the width of
the flood plain at select crossections along the creek,
it was found that the areas outside of the corporate
limits of Bay City were not Significantly impacted by the
proposed diversion facility.
54
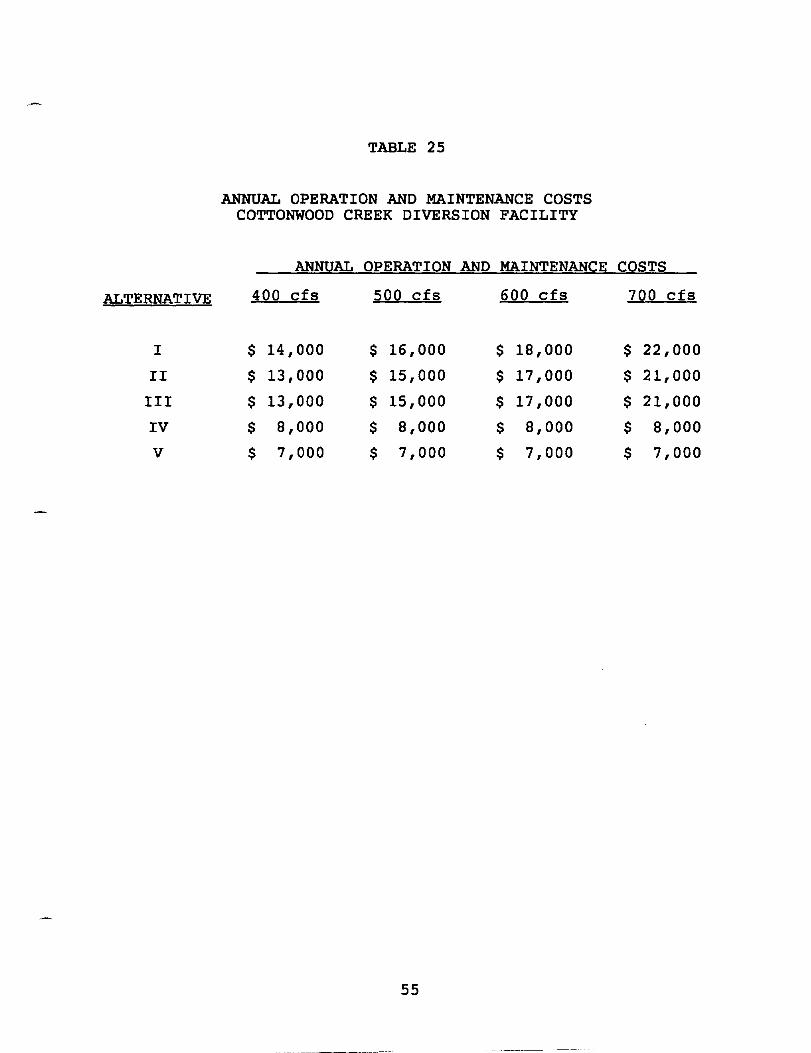
TABLE 25
ANNUAL OPERATION AND MAINTENANCE COSTS COTTONWOOD CREEK DIVERSION FACILITY
ANNUAL OPERATION AND MAINTENANCE COSTS
ALTERNATIVE 400 cfs 500 cfs 600 cfs 700 cfs
I $ 14,000 $ 16,000 $ 18,000 $ 22,000
II $ 13,000 $ 15,000 $ 17,000 $ 21,000
III $ 13,000 $ 15,000 $ 17,000 $ 21,000
IV $ 8,000 $ 8,000 $ 8,000 $ 8,000
V $ 7,000 $ 7,000 $ 7,000 $ 7,000
55
-----------------------
Table 26, on Page 57, lists proposed 100-year water
surface elevations at prominent locations on Cottonwood
Creek. Hanunond Road is near the southern boundary of the
City, and Golden Avenue is near the northern boundary.
Table 27, on Page 58, takes the same information and
illustrates the reductions in water surface elevations.
As this also shows, most of the impact of the diversion
facility is between Hanunond Road and Golden Avenue, or
within the City Limits of Bay City.
Therefore, for the purposes of this report, and the
analysis of the various alternatives, the impacts of any
of the design alternatives were limited to the portion of
the watershed within the City Limits of Bay City. Should
one of the diversion alternatives be constructed, and
additional structural improvements be made on Cottonwood
Creek, future impacts to the flood plain outside the City
are possible.
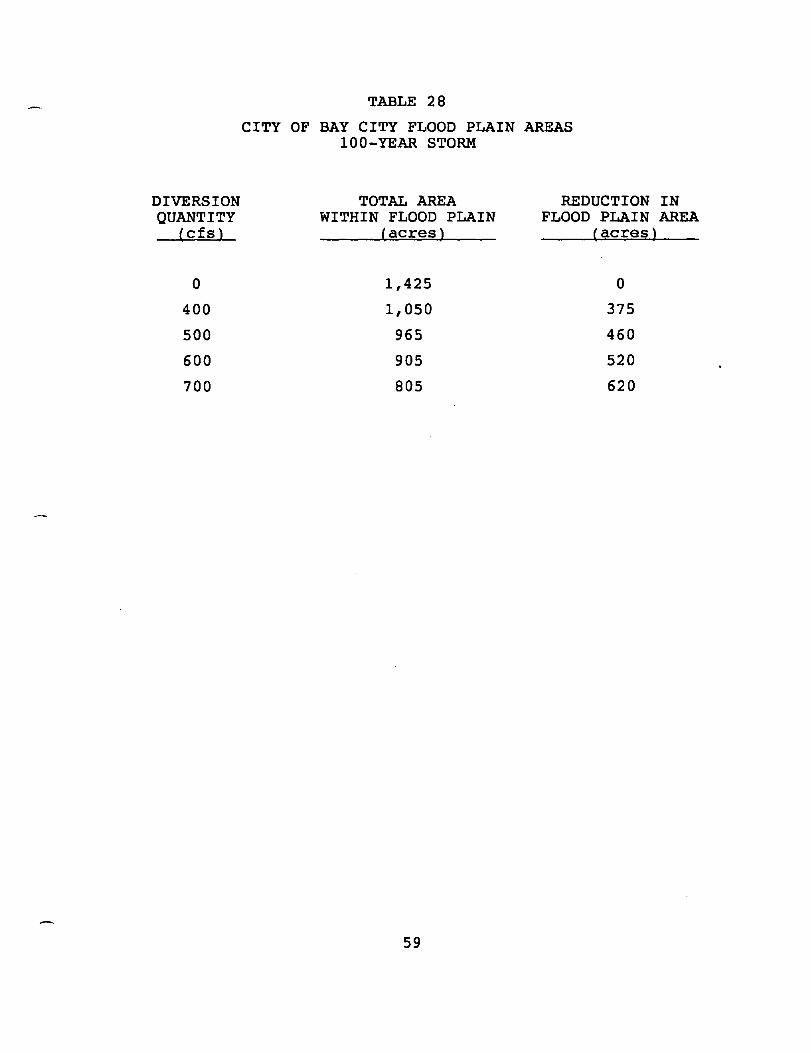
Exhibit 3, 100-Year Flood Plain Limits, illustrates the
extent of the reduction in the 100-year flood plain area
for each of the diversion facility design flows. Table
28, on Page 59, lists the acreage for each of these flood
plains within the City. As shown, there is a reduction
of 375 acres to 620 acres, depending on the diversion
amount.
56
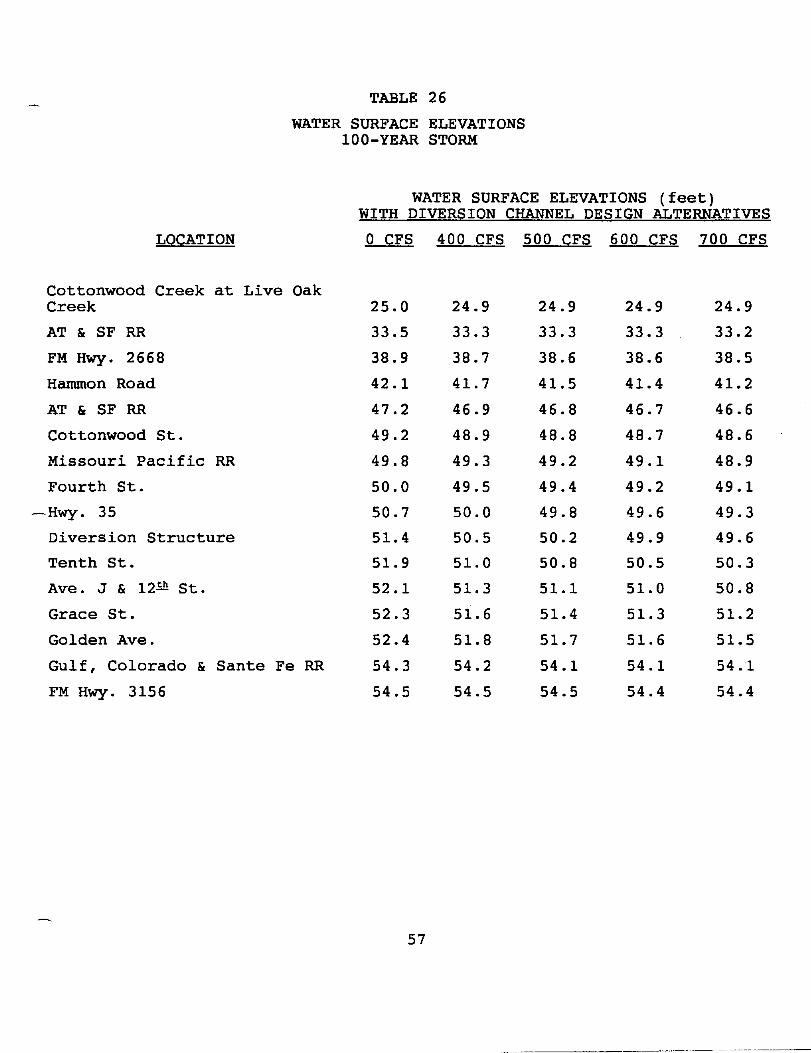
TABLE 26
WATER SURFACE ELEVATIONS 100-YEAR STORM
LOCATION
Cottonwood Creek at Live Oak Creek
AT & SF RR
FM Hwy. 2668
Hammon Road
AT & SF RR
Cottonwood St.
Missouri Pacific RR
Fourth St.
-Hwy. 35
Diversion Structure
Tenth St.
Ave. J & 12~ St.
Grace St.
Golden Ave.
Gulf, Colorado & Sante Fe RR
FM Hwy. 3156
WATER SURFACE ELEVATIONS (feet) WITH DIVERSION CHANNEL DESIGN ALTERNATIVES
o CFS 400 CFS 500 CFS 600 CFS 700 CFS
25.0
33.5
38.9
42.1
47.2
49.2
49.8
50.0
50.7
51.4
51.9
52.1
52.3
52.4
54.3
54.5
57
24.9
33.3
38.7
41.7
46.9
48.9
49.3
49.5
50.0
50.5
51. 0
51. 3
51.6
51.8
54.2
54.5
24.9
33.3
38.6
41.5
46.8
48.8
49.2
49.4
49.8
50.2
50.8
51.1
51.4
51.7
54.1
54.5
24.9
33.3
38.6
41.4
46.7
48.7
49.1
49.2
49.6
49.9
50.5
51.0
51.3
51.6
54.1
54.4
24.9
33.2
38.5
41.2
46.6
48.6
48.9
49.1
49.3
49.6
50.3
50.8
51.2
51.5
54.1
54.4
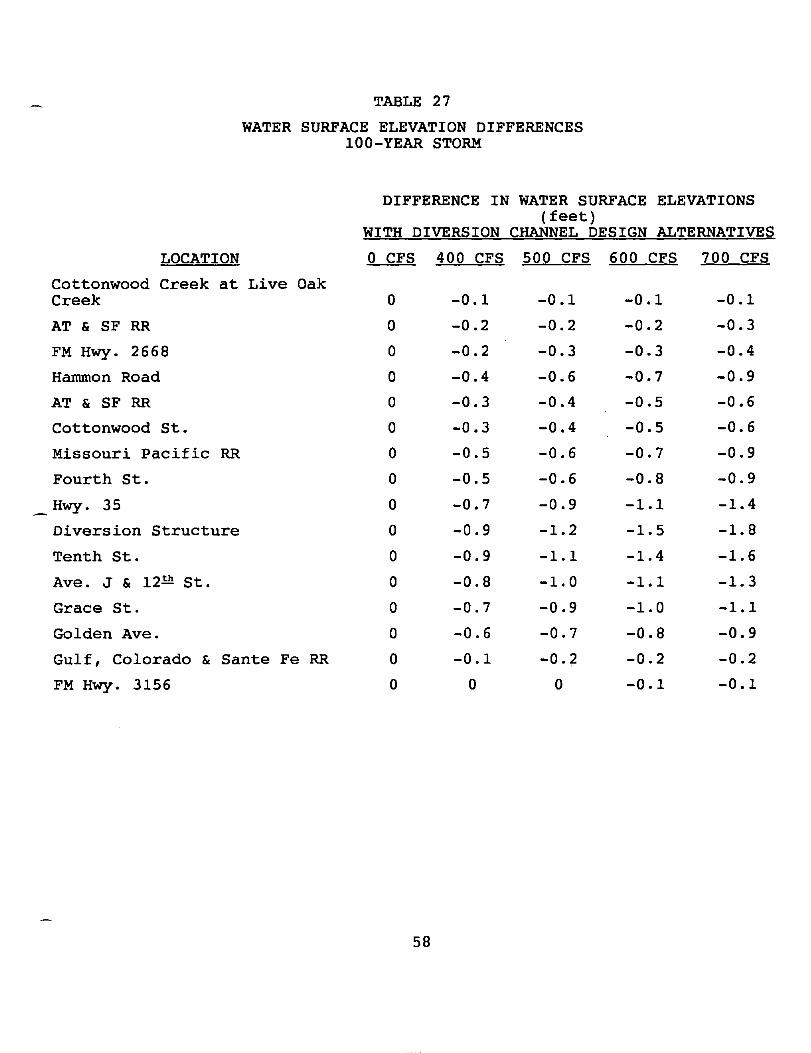
TABLE 27
WATER SURFACE ELEVATION DIFFERENCES 100-YEAR STORM
LOCATION
Cottonwood Creek at Live Oak Creek
AT & SF RR
FM Hwy. 2668
Hammon Road
AT & SF RR
Cottonwood St.
Missouri Pacific RR
Fourth St.
_ Hwy. 35
Diversion Structure
Tenth St.
Ave. J & 12!!! St.
Grace St.
Golden Ave.
Gulf, Colorado & Sante Fe RR
FM Hwy. 3156
DIFFERENCE IN WATER SURFACE ELEVATIONS (feet)
WITH DIVERSION CHANNEL DESIGN ALTERNATIVES
o CFS 400 CFS 500 CFS 600 CFS 700 CFS
o o o o o o o o o o o o o o o o
58
-0.1
-0.2
-0.2
-0.4
-0.3
-0.3
-0.5
-0.5
-0.7
-0.9
-0.9
-0.8
-0.7
-0.6
-0.1
o
-0.1
-0.2
-0.3
-0.6
-0.4
-0.4
-0.6
-0.6
-0.9
-1.2
-1.1
-1. 0
-0.9
-0.7
-0.2
o
-0.1 -0.1
-0.2 -0.3
-0.3 -0.4
-0.7 -0.9
-0.5 -0.6
-0.5 -0.6
-0.7 -0.9
-0.8 -0.9
-1.1 -1.4
-1.5 -1.8
-1.4 -1.6
-1.1 -1.3
-1.0 -1.1
-0.8 -0.9
-0.2 -0.2
-0.1 -0.1
DIVERSION QUANTITY
(cfs)
0
400
500
600
700
TABLE 28
CITY OF BAY CITY FLOOD PLAIN AREAS 100-YEAR STORM
TOTAL AREA REDUCTION IN WITHIN FLOOD PLAIN FLOOD PLAIN AREA
(acres) (acres)
1,425 0
1,050 375
965 460
905 520
805 620
59
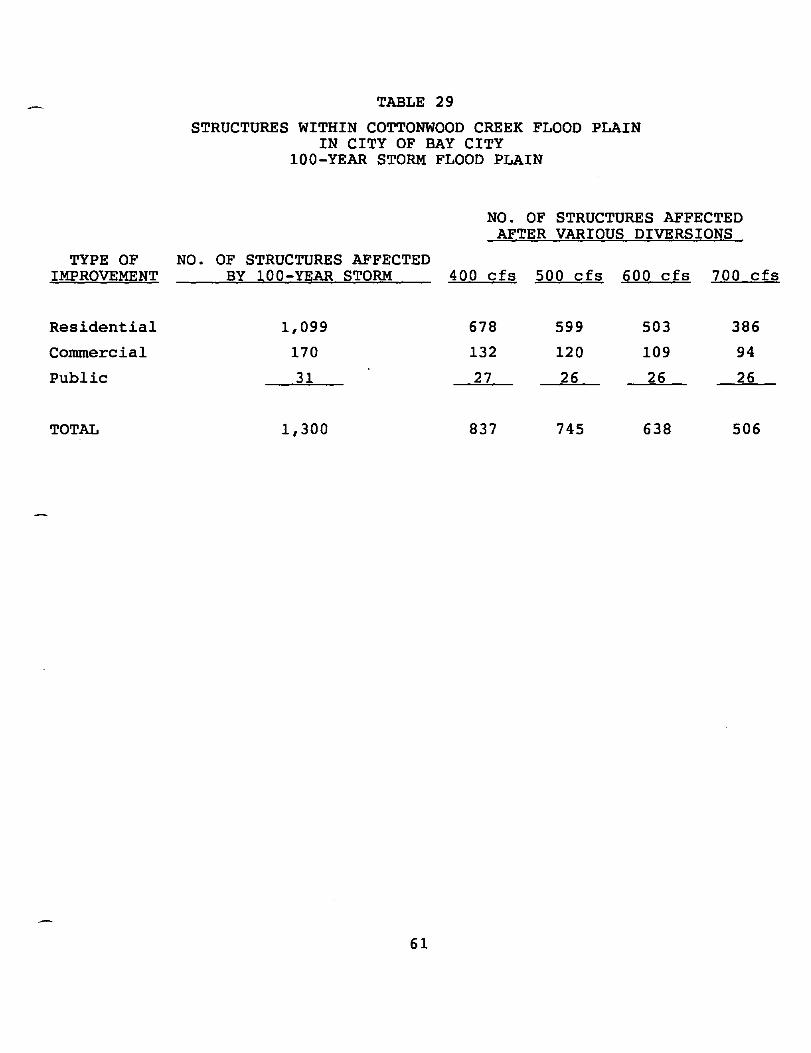
3. Number of Structures Affected
A total of 1,300 structures were identified by a review
of aerial photographs and the Matagorda County Appraisal
District records as being within the limits of the 100-
year storm flood plain. Based on modeling results for
the diversion of 400, 500, 600 and 700 cfs, a total of
463, 555, 662 and 794 structures, respectively, were
removed from the projected flood limit. A tabulation of
the number of structures which are affected by the 100-
year storm is provided in Table 29, found on Page 61.
G. BENEFIT/COST ANALYSIS
A review of Matagorda County Appraisal District records was
performed to determine the potential monetary damage a 100-
year flood occurrence would cause and the respective savings
should a flood water diversion project be constructed. The
diversion flows considered were 400, 500, 600 and 700 cfs.
The 1990 appraisal values for those structures which are
located in the predicted 100-year flood occurrence limits is
$52,049,000. This total potential monetary damage only
considers the improved value of the property affected.
Diversions of storm flows of 400, 500, 600 and 700 cfs reduces
the appraised improvements value located within the flood
plain to $31,723,000, $28,241,000, $25,632,000 and
$20,067,000, respectively.
Benefits realized by the citizens, should one of these
diversion options be constructed, is not the total value of
the improvements removed from the flood plain. The benefits
analysis assumed that damage sustained during a 100-year flood
occurrence would amount to twenty percent (20%) of the value
of the residential structures, fifteen percent (15%) of the
60
TYPE OF IMPROVEMENT
Residential
Commercial
Public
TOTAL
TABLE 29
STRUCTURES WITHIN COTTONWOOD CREEK FLOOD PLAIN IN CITY OF BAY CITY
100-YEAR STORM FLOOD PLAIN
NO. OF STRUCTURES AFFECTED AFTER VARIOUS DIVERSIONS
NO. OF STRUCTURES AFFECTED BY 100-YEAR STORM 400 cfs 500 cfs 600 cfs 700 cfs
1,099 678 599 503 386
170 132 120 109 94
31 27 26 26 26
1,300 837 745 638 506
61
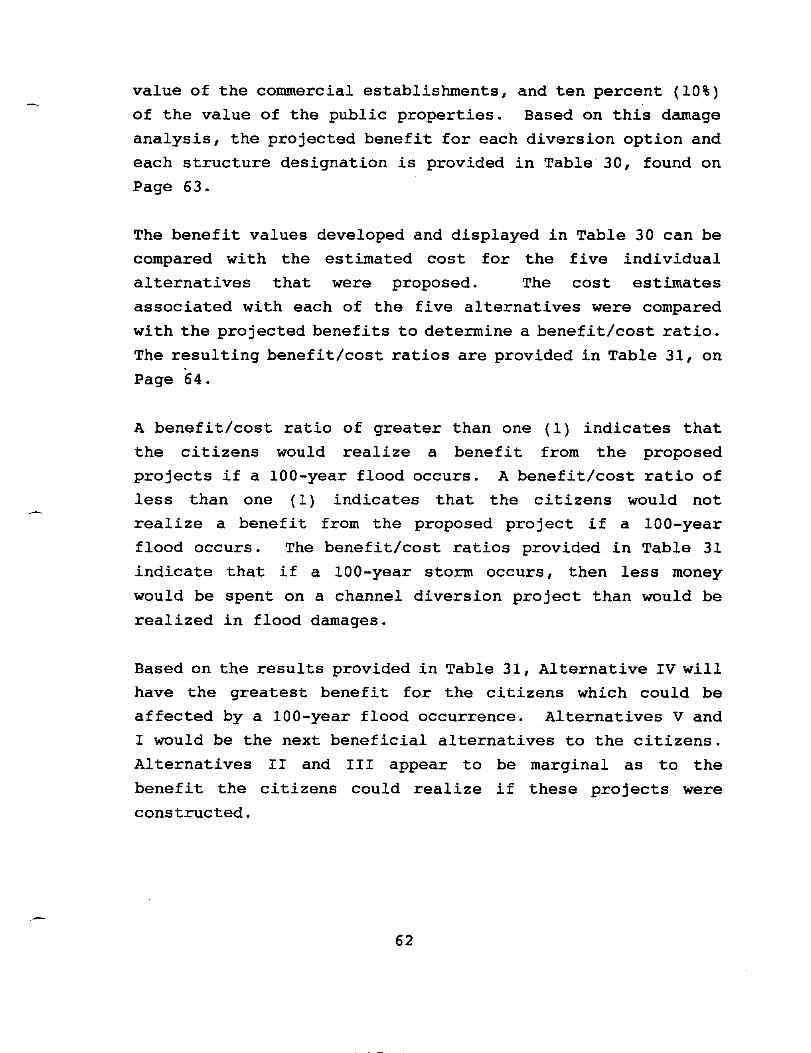
value of the commercial establishments, and ten percent (10%)
of the value of the public properties. Based on this damage
analysis, the projected benefit for each diversion option and
each structure designation is provided in Table 30, found on
Page 63.
The benefit values developed and displayed in Table 30 can be
compared with the estimated cost for the five individual
alternatives that were proposed. The cost estimates
associated with each of the five alternatives were compared
with the projected benefits to determine a benefit/cost ratio.
The resulting benefit/cost ratios are provided in Table 31, on
Page 64.
A benefit/cost ratio of greater than one (1) indicates that
the citizens would realize a benefit from the proposed
projects if a 100-year flood occurs. A benefit/cost ratio of
less than one (1) indicates that the citizens would not
realize a benefit from the proposed project if a 100-year
flood occurs. The benefit/cost ratios provided in Table 31
indicate that if a 100-year storm occurs, then less money
would be spent on a channel diversion project than would be
realized in flood damages.
Based on the results provided in Table 31, Alternative IV will
have the greatest benefit for the citizens which could be
affected by a 100-year flood occurrence. Alternatives V and
I would be the next beneficial alternatives to the citizens.
Alternatives II and III appear to be marginal as to the
benefit the citizens could realize if these projects were
constructed.
62
TYPE OF IMPROVEMENT
Residential
Conunercial
Public
TOTAL
TABLE 30
CITY OF BAY CITY FLOOD DAMAGE BENEFITS 100-YEAR STORM FLOOD PLAIN
MONETARY BENEFITS FROM REDUCED FLOODING WITH DIVERSIQN CHANNEL DESI~N ALTERNATIVES
400 CFS 500 CFS 600 CFS 700 CFS
$2,761,000 $3,112,000 $3,521,000 $4,164,000
$393,000 $570,000 $651,000 $792,000
5390.000 5441.000 5447.000 5588.000
$3,554,000 $4,123,000 $4,619,000 $5,544,000
63
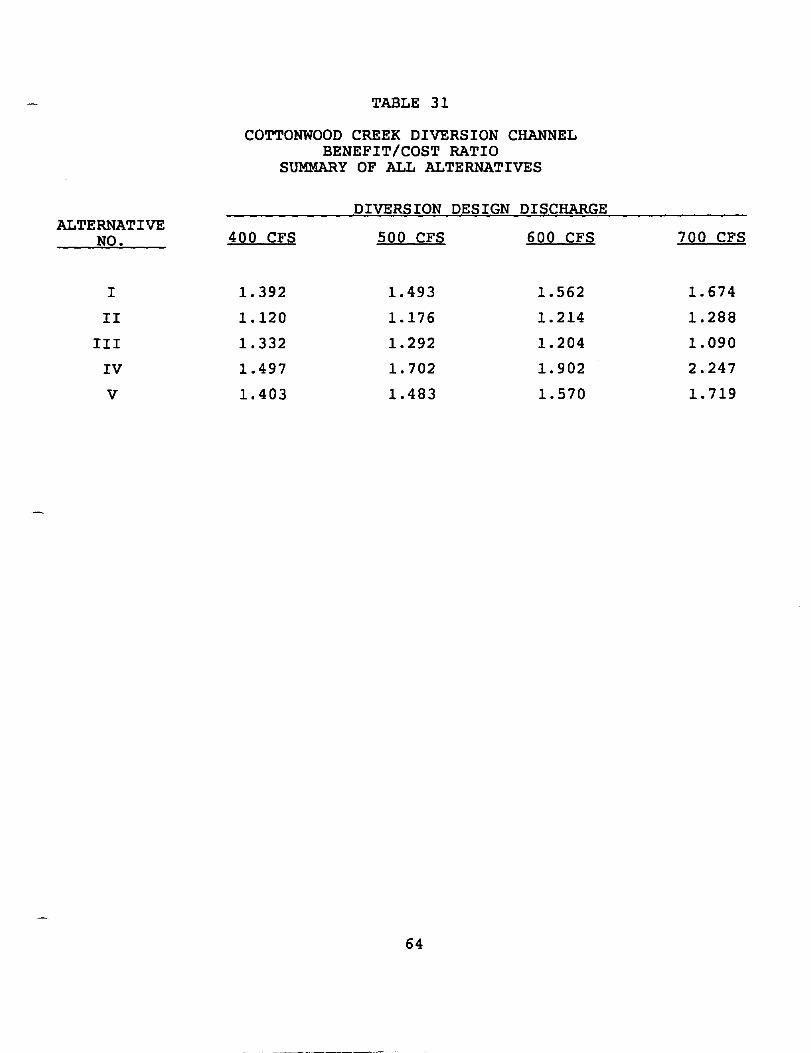
TABLE 31
COTTONWOOD CREEK DIVERSION CHANNEL BENEFIT/COST RATIO
SUMMARY OF ALL ALTERNATIVES
DIVERSION DESIGN DISCHARGE ALTERNATIVE
NO. 400 CFS 500 CFS 600 CFS 700 CFS
I 1. 392 1.493 1.562 1. 674
II 1.120 1.176 1.214 1.288
III 1.332 1.292 1.204 1.090
IV 1.497 1. 702 1. 902 2.247
V 1. 403 1.483 1.570 1. 719
64
._-_._----------------
H. RECOMMENDED PLAN
As previously discussed, the alternative with the highest
benefit/cost ratio is Alternative IV, with a diversion flow of
700 cfs. This alternative involves an open ditch from
Cottonwood Creek to the Colorado River, with a weir inlet
control structure at the creek. However, the existence of an
open ditch through a developed portion of the City creates
other concerns that do not lend themselves to simple dollar
evaluations.
The City of Bay City must also be concerned with the public's
health, safety, and welfare that would result from action they
may take. The City must also look at long term goals and
plans to insure that actions do not counteract these goals and
plans.
The concept of an open ditch through a developed portion of
the City does raise legitimate concerns for the safety and
welfare of the public. The presence of the ditch is an
invitation for young children to play in the facility during
both flow and non-flow conditions. Large open ditches,
especially those well maintained, are a gathering pOint for
activities by the users of motorcycles, skate boards, all
terrain vehicles, etc. Because of vehicular traffic at the
road crossings of the ditch, there is always the potential for
a serious accident to occur if a vehicle does not successfully
negotiate the bridge.
The potential for liability of the City if a serious accident
were to occur involving the open ditch does exist. Because it
is impossible to place a value on a human life, there is not
a straight-forward method of evaluating the costs of these
concerns and liabilities.
65

Long term City goals and plans include the opening of Ninth
Street as a major street from Moore Avenue on the west side of
town to the east side of town. This would provide another
east-west thoroughfare to relieve traffic loads on State
Highway 35. Ninth Street is at the same location as the
Southern Pacific Railroad occupied west of Cottonwood Creek,
and is the site of the proposed diversion. The construction
of an open ditch between Moore Avenue and Cottonwood Creek
would prohibit the construction of this thoroughfare, without
later filling in the ditch. This would ultimately drive the
total costs of the project above an affordable level, and the
majority of the costs of construction of the ditch section and
bridges would be lost and unsalvagable. If Ninth Street were
to be opened as a major thoroughfare in the future, this
section of the diversion channel would require construction as
an underground storm sewer.
Therefore, the City prefers the construction of Alternative V,
at a diversion flow of 700 cfs. Although the costs of the
alternative are higher, the overall analysis of the project
yields this to be the preferred option.
I. FINANCING AND IMPLEMENTATION
1. General
Although this study was done for the City of Bay City,
other local governmental agencies have expressed a need
for the proposed project. They have also expressed an
interest in assisting with the funding of the
construction. This sharing of costs reduces the
financial burden on the others, and greatly enhances the
ability to fund the construction locally.
66
The other local governmental entities are Matagorda
County Drainage District No.1, Matagorda County
Conservation and Reclamation District No.1, and
Matagorda County Commissioners' Court. The work on this
study has been coordinated with these entities.
2. General Fund
In order to finance the cost of this project through the
general fund, the construction work would have to be
completed in phases. However, this type of project lends
itself to this type of an approach.
At a total estimated project cost of $3,225,000, for
Alternative V, at a diversion rate of 700 cfs, the
construction of the diversion facility could be scheduled
over four years. The first year's cost would be
approximately $895,000, and would include total project
engineering, the construction of the outlet control
structure, the LCRA crossing, the Twelfth Street bridge,
and channel excavation to Moore Avenue. Construction in
the second year would build about 1,000 linear feet of
the storm sewer box culverts from Moore Avenue to just
east of Avenue B at a cost of approximately $850,000. In
the third year, another 1,000 linear feet of the box
culvert would be constructed at an approximate cost of
$ 8 5 0, 000. This third year's work would carry the pro j ect
across Avenue E. The forth and final year of the project
would see the completion of the box culverts and the
construction of the inlet weir control structure at a
cost of approximately $630,000.
With proper planning, the four taxing entities involved
can participate in these costs without seriously
67
impacting each entities' budget. The percentage of each
entities' involvement in the yearly costs are subject to
negotiations between the entities and their respective
financial responsibilities and obligations at that time.
3. General Obligation Bonds
As previously stated, another means of financing the
project is through the sale of bonds. These bonds are
then repaid by ad valorem taxes collected by the taxing
entity. However, the public reaction to the sale of
bonds, based on current conditions, is probably negative.
The passing of a bond issue by Matagorda County Drainage
District No.1, Matagorda County Conservation and
Reclamation District No.1, and Matagorda County
Commissioner's Court would be very difficult. These
entities cover areas larger than the area of Bay City
immediately impacted by the proposed diversion project.
Therefore, the voters in the other areas within these
entities would not be in support of raising their taxes
to pay for a project that would benefit those people
within the City.
Although the passing of a bond issue by the City would be
a difficult task due to the current tax load on the
citizens, it is an option for the financing of the
project. Two financial scenarios were developed for
presentation.
The first is if the City would assume the entire cost of
the project themselves, without assistance from the other
county governments. Table 32, on Page 69, shows the
payments that would be required each year for twenty
years if $3,270,000 dollars of bonds were sold. This
figure is based on an estimated cost of $3,225,000, with
68
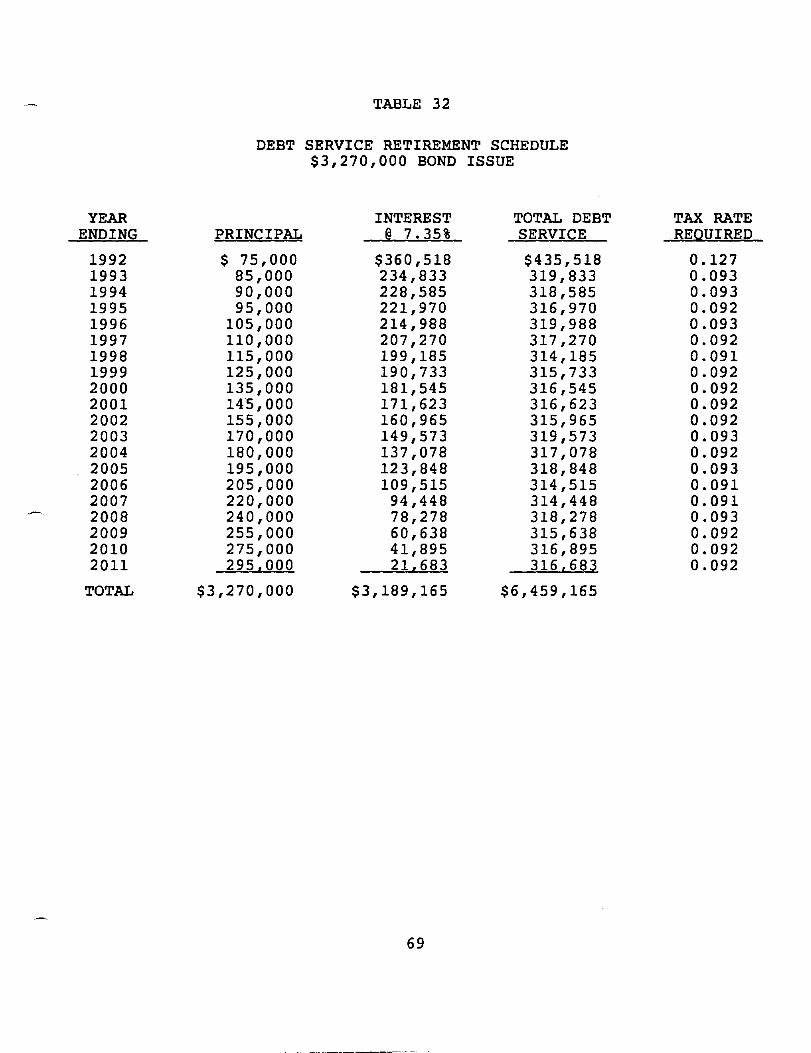
YEAR ENDING
1992 1993 1994 1995 1996 1997 1998 1999 2000 2001 2002 2003 2004 2005 2006 2007 2008 2009 2010 2011
TOTAL
TABLE 32
DEBT SERVICE RETIREMENT SCHEDULE $3,270,000 BOND ISSUE
INTEREST TOTAL DEBT PRINCIPAL @ 7.35% SERVICE
$ 75,000 $360,518 $435,518 85,000 234,833 319,833 90,000 228,585 318,585 95,000 221,970 316,970
105,000 214,988 319,988 110,000 207,270 317,270 115,000 199,185 314,185 125,000 190,733 315,733 135,000 181,545 316,545 145,000 171,623 316,623 155,000 160,965 315,965 170,000 149,573 319,573 180,000 137,078 317,078 195,000 123,848 318,848 205,000 109,515 314,515 220,000 94,448 314,448 240,000 78,278 318,278 255,000 60,638 315,638 275,000 41,895 316,895 295,000 21,683 316,683
$3,270,000 $3,189,165 $6,459,165
69
TAX RATE REQUIRED
0.127 0.093 0.093 0.092 0.093 0.092 0.091 0.092 0.092 0.092 0.092 0.093 0.092 0.093 0.091 0.091 0.093 0.092 0.092 0.092
legal and financial advisor fees added. The interest
rate on the bonds was calculated at 7.35 percent, which
was based on the City's current financial condition.
Based on current City property value of $343,909,880, and
a 95 percent collection rate, the City would be required
to raise taxes by almost $0.10 to repay the bonds. The
current city tax rate is $0.615. Therefore, the
additional taxes would represent a 16 percent increase in
the overall tax rate.
The second possible option is the City would assume the
additional cost of the box culvert storm sewer, and the
other county entities would fund the balance of the
project. This option is realistic because the City
prefers the storm sewer for reasons not directly
connected to the success of the proposed project. The
debt service requirement for the difference in cost
between Alternative IV and Alternative V (at 700 cfs) is
shown in Table 33 on Page 71. Again, legal and financial
advisor fees were added to the $758,000 construction
costs. Using the same basis for collection, the
resulting tax rate would average $0.022. This would
result in a 3.7 percent increase in the overall City tax
rate.
J. REGULATQRY REQUIREMENTS
The regulatory agencies who will review this project will be
the Texas Water Commission (TWC), the Lower Colorado River
Authority, and the United States Army Corps of Engineers. The
TWC would specifically be concerned with the total amount of
water that would be removed from the Cottonwood/Peyton Creek
Watershed. Several downstream landowners have water rights
for irrigation purposes. The TWC would require that a
Transbasin Diversion Permit be submitted and approved prior to
70
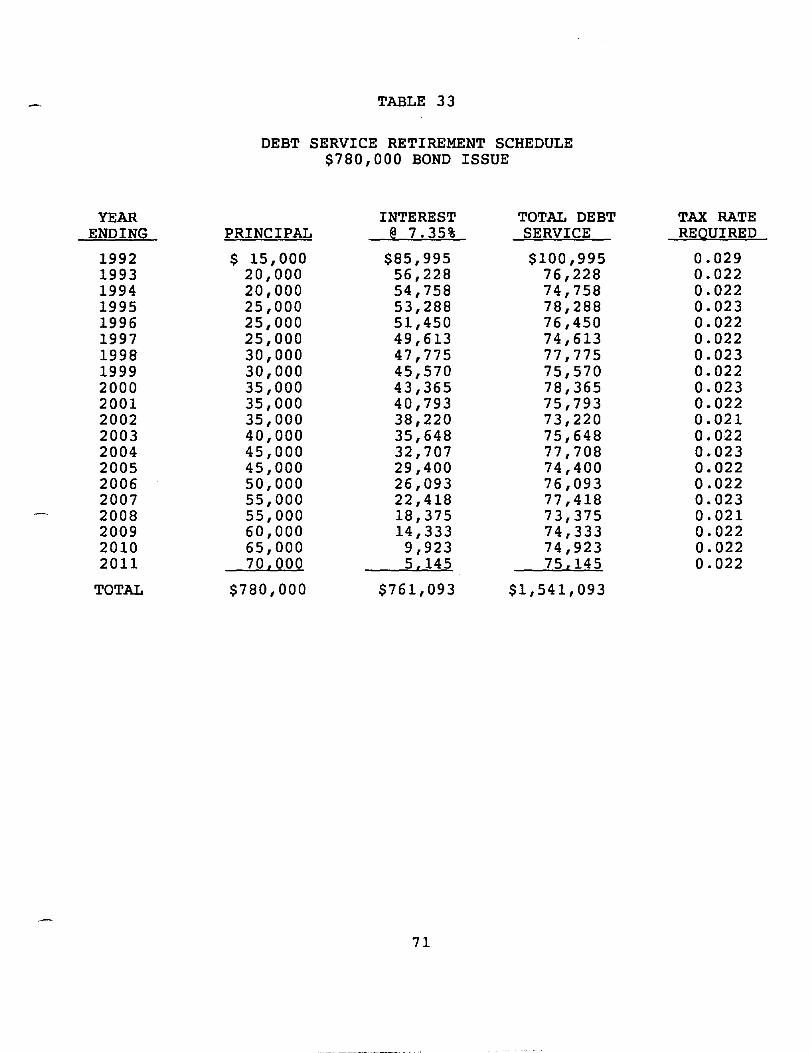
YEAR ENDING
1992 1993 1994 1995 1996 1997 1998 1999 2000 2001 2002 2003 2004 2005 2006 2007 2008 2009 2010 2011
TOTAL
TABLE 33
DEBT SERVICE RETIREMENT SCHEDULE $780,000 BOND ISSUE
INTEREST TOTAL DEBT PRINCIPAL ~ 7.35% SERVICE
$ 15,000 $85,995 $100,995 20,000 56,228 76,228 20,000 54,758 74,758 25,000 53,288 78,288 25,000 51,450 76,450 25,000 49,613 74,613 30,000 47,775 77,775 30,000 45,570 75,570 35,000 43,365 78,365 35,000 40,793 75,793 35,000 38,220 73,220 40,000 35,648 75,648 45,000 32,707 77,708 45,000 29,400 74,400 50,000 26,093 76,093 55,000 22,418 77,418 55,000 18,375 73,375 60,000 14,333 74,333 65,000 9,923 74,923 70£000 5£145 75£145
$780,000 $761,093 $1,541,093
71
TAX RATE REQUIRED
0.029 0.022 0.022 0.023 0.022 0.022 0.023 0.022 0.023 0.022 0.021 0.022 0.023 0.022 0.022 0.023 0.021 0.022 0.022 0.022
construction of this project. A copy of the permit
application would also be sent to the Texas Parks and Wildlife
Department (TP&W) for comment. The TP&W would be specifically
concerned with the effect the diversion would have upon the
salinity of East Matagorda Bay and the amount of nutrients
that would not be delivered to the coastal wetlands during
peak storm flow.
Preliminary studies indicate the amount of water diverted from
East Matagorda Bay during a 100-year storm occurrence would be
less than one percent (1%) of the total flow if the maximum
amount of 700 cfs is diverted. This percentage of the total
flow continues to reduce as the frequency of storm occurrence
increases. Essentially no water is diverted from a storm with
frequency of 10 years or less.
Four (4) Certificates of Adjudication of Water Rights have
been granted within the Cottonwood/Peyton Creek Watershed
below the proposed point of diversion. These water rights are
associated with agricultural irrigation and are noted on
Figure 2, on Page 73. The total amount of water reserved by
these four certificates is 4,810 acre-feet. Therefore, the
proposed diversion project should have no effect upon these
permittees' water rights. However, the TWC will notify these
individuals should a Transbasin Diversion Permit be submitted.
A public hearing may be required to inform the public as to
the effects of this proposed project.
Currently the TWC requires four (4) to six (6) months to
review and approve an administratively complete permit
application. The flow chart depicting the review process for
the Transbasin Diversion Permit Application is attached as
Figure 3, on Page 74.
72
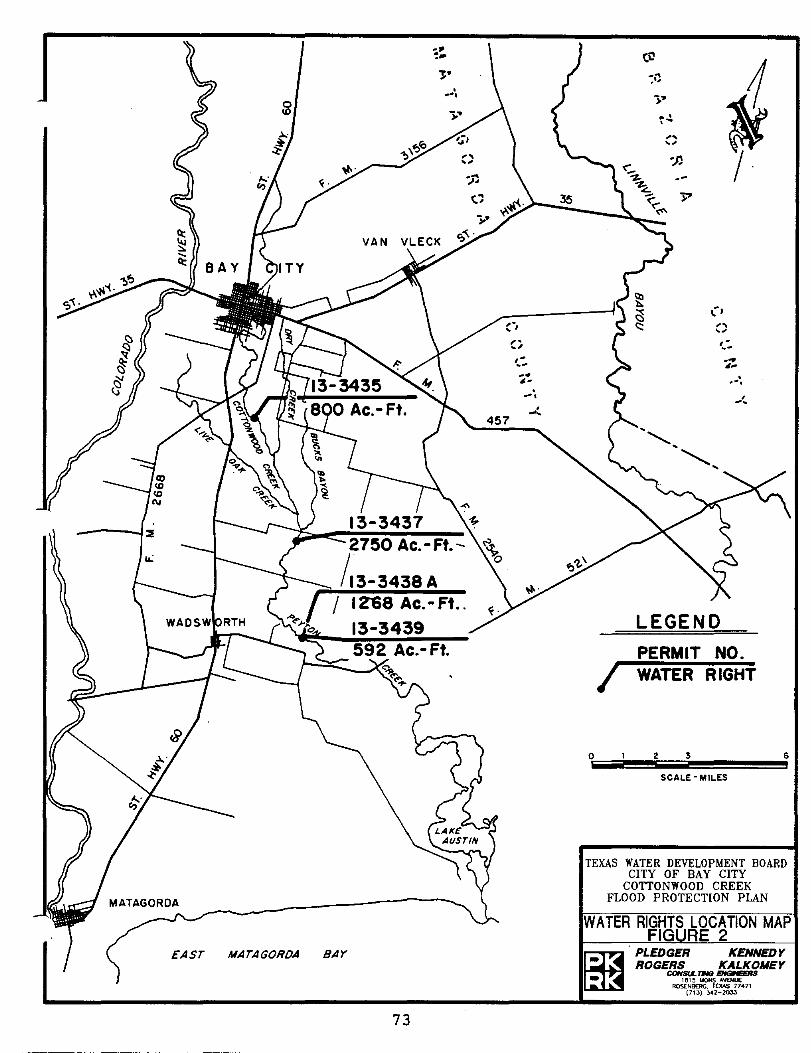
0 10
MATAGORDA
EAST MATAGORDA
•• ~-'];. . . ',
2750 Ac.-
113-3438 A 12"68 Ac.- Fto.
tC
:c V' ~ . . ~ .. ,
v
:n .-j;>
~ j-
" o·
. . ', , -.
13-3439 LEGEND
BAY
73
PERMIT NO. I WATER RIGHT
o 2 3 6
SCALE' MILES
TEXAS WATER DEVELOPMENT BOARD CITY OF BAY CITY
COTTONWOOD CREEK FLOOD PROTECTION PLAN
WA TER RIGHTS LOCATION MAP FIGURE 2
PLEDGER KENNEDY ROGERS KALKOMEY
CONSlA.1Mi ENGINEERS 1 8 1 ~ !.IONS A\IDruE
ROSENBER(;. TEXAS 17.71 (113) J42-203J
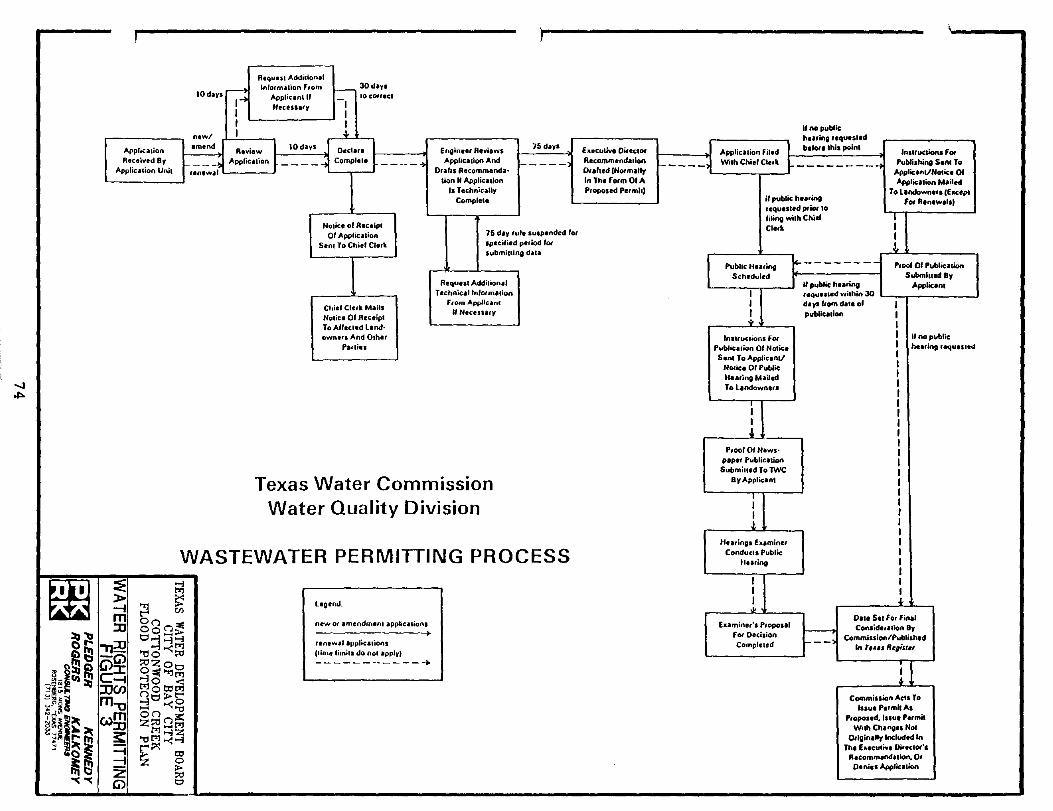
-...J ~
10 days r-::: 1 1 1
Requul Addidona' InlDlmanon Flom
Applic.nl If NecuSilr't
t-I
30d.)', 10 cOIleel
Application Received 8t
Applic.lion Unit
newl Imend
1---:;1 ,en,wil
1
Review AppliCilion
1 1 .I.
NOlice of Reuip. 01 Appliealion
Sent To Chiel CI.rk
Chie' Clert Mails Notice Of Receipt To Allecled lend· own'" And Other
Parties
Ehgio •• , A .... i.ws Appliulion And
D,.b_ Recommend.· tion If Application
,. T e(hnicallv Comple.e
75 d .....
15 dily lui, suspended 101 Ipecifjed p.,iod 'ot lubmilling data
Requ ••• Addilionll Technicalln'OIm.don
From Applicanl
" N.ceSSaly
Texas Water Commission Water Quality Division
WASTEWATER PERMITTING PROCESS
~ ::E > -I m :0
~~ :0 0 ... ,,_ as -G) ... Sl a Ci'>:r:
~_i!l) Sl C-I 3g~~ :ucn "~'i m-u ~g:l~ ~ U)!B ~~~"'1Ii 3:
OJ ~a ~ ~~ Z -.: -.: G)
t;J
~ ~ 0(') (')::11 00_>-0~...,t;J '1:l00-<:.l ::OZOO 0::E"'1t>:1
~°tt!tii (')0;..<...,00-<0 ~ '"tj O(')(,)i!:: Z::O~t>:I
M...,Z '"tjt>:lO-<-l
~~ to o ~ t:>
legend.
new or amendmenl app&.cillion, , 'ene ..... ' .pplic.lions Clime limi.s do nOI .ppld
------------+
Euculivl Dileetor R.commend.IIOIl O/.hed ,HOlm.lly In Thl fOlm D. A P/Gposed Per mil)
If no publtc he.,ing requesled be'OI. this poin.
---------f'
;
Inlllucdons FOI Pubtishing S.nl To
Applic.nllNOlicl or AppIK'I~ Mailed
i' public he.ring requested J)f'iot to .iling wilh Chi.' CI.,k
To l.ndown.', (E_uPl fOf Renlw.'si
1 1 1 1,
X
In"'UClions fOl PubUCllion Of Nol~' Senl To Apptic.ntJ
NOIiee 01 Public H .. ,ing Mailed To Llndown.r.
, 1 1 ~
P,ool 01 News, p.pel Public.lion
Submilled To 1WC 8yApplic.nt
I 1 1
_1 HUlings Examine'
Conducl' Publtc: Healing
1 1 1
-*-E"mine,', Plopoul
fOt Decision Completed
-------- P,oof 01 Public.don Submlu.d By
AppIic.nt if public hearing requesled within 30 days "orn d.I. a. public.lion
1 1 1
t=:
1 I if no 'Iolblic I hUlu., .eques.ed 1 1 1 1 I
.j.
0.1.511'1 for final Consid.,lIton By
Commission/Published In le~.' R~I;st.,
1 ~
Commission AcIS To Issul P"mil A,
Proposed, IIIUI ,.,mit Wil'" Ctt.nge, Nol
Oflgin,'ly Included In Th. EIl.cul;'" OillelOt',
R.comm.ndll'on. 0, O.nin Appliulion
jurisdiction with respect to the quality of the water
accepted. The LCRA is concerned about the amount of sediment
that could be diverted. They have a dam on the Colorado River
directly below State Highway 35 for irrigation purposes. The
LCRA would review this project to assure themselves that any
increased sedimentation would not adversely affect this
structure and the corresponding pump station.
However, a degradation of the quality of the water in the
Colorado River is not anticipated as a result of the operation
of the diversion facility. Although base flow rates in the
river can be low (less than 100 cfs) during dry, summer
months, the addition of flows to the river via the diversion
facility will be sporadic. If the Colorado River flows are
high, the amount of water added to the river from the
diversion facility will be insignificant when compared to the
base river flow. Under this same senario, it is unlikely that
LCRA will be operating their pumping facility below State
Highway 35, because water for irrigation purposes will not be
required. Although the introduction of additional pollutants,
such as fertilizers, pesticides, hydrocarbons, etc., into the
Colorado River is possible, the amounts of these pollutants is
anticipated to be small as compared to the overall system.
The COE will require that two (2) permits be filed with the
Galveston District Office. The permits are a Section 404
Permit and a Section 10 Permit. The Section 404 Permit refers
to the placement of dredge spoils where the proposed diversion
channel meets the Colorado River. The Section 10 Permit is
required since the COE must certify that the proposed outlet
structure does not pose a navigatable hazard on the Colorado
River.
75
K. SECONDARY BENEFITS
In addition to receiving benefits on a 100-year storm from the
construction of the diversion facility, the impact upon the
10-year storm event was studied. The reduction in the water
surface elevations along the channel through Bay City has a
significant impact on the size of the resulting flood plain.
On Exhibit 4, 10-Year Flood Plain Limits, the projected flood
plain with no diversion and with a 400 cfs diversion are
deliniated. The 400 cfs diversion is the maximum diversion
that can be obtained with the recommended Alternative V design
at 700 cfs (100-year storm event). As the exihibit shows,
downstream of the diversion point, the majority of the flood
plain is contained within the channel banks.
The number of structures within this area was also identified.
The construction of the proposed diversion facility would
result in the removal of approximately 183 structures from the
flood plain. Applying the same economic factors as with the
100-year storm event, the benefit derived from the project
would be $1,368,635.
Above the diversion point, the diversion project does not
impact the 10-year flood plain. The season for this
apparently is a result of channel restrictions at 10th Street
and Grace Street. If the diversion facility is constructed,
improvements to these structures will result in additional
benefits to the area.
The area will receive additional secondary benefits from the
construction of the diversion facility. These benefits are
not easy to quantify, but do provide further justification for
the project.
76
Because construction of the diversion facility will lower
flood levels, fewer roads will sustain damages, and those that
will still be within flooded areas should experience less
damage. The movement of vehicles within the City during major
storm events will be enhanced due to the reduction in flood
levels. Communication and electrical lines are buried
underground throughout the area. The loss of service during
and immediately after flooding conditions have occurred
results in not only inconviences, but also requires funds to
facilitate repairs. Likewise, water and sanitary sewer lines
can be affected during and after flooding conditions. The
inflow of storm waters into water wells or damaged water lines
can present health hazards to the public and usually require
the expedature of unallocated funds to quickly initiate
repairs. The encroachment of storm flows into the sanitary
sewer system increases operational costs at treatment plants.
Pollutants in the storm waters could also upset the
bacteriological balance of the plant components, creating
further public health concerns from the improper treatment of
sewage flows. Flooding conditions can leave areas of standing
water which can turn into breeding areas for mosquitos. These
insects can spread disease, and programs to control them can
be costly.
77
VI. SUMMARY
A. CONCLUSIONS
1. Conventional structural alternatives to improve
Cottonwood Creek have been reviewed in previous years
and, due to current constraints and encroachments caused
by urbanization, are too costly to be funded locally.
2. Non-structural means of providing relief by flood
mitigation can help in reducing future runoff quantities
and flood damage, but do not adequately address current
flooding problems in the Cottonwood Creek Watershed.
3. A diversion of high level flood flows is the only
economical means of providing flood protection in the
upper Cottonwood Creek Watershed.
4. The use of the former Southern Pacific Railroad right-of
way from Cottonwood Creek to the Colorado River is an
appropriate location of the proposed diversion. Although
the diversion facility may be rendered ineffective at the
lOa-year flood stage of the river, the possibility of
this occurring at the same time the Cottonwood Creek
Watershed receives a lOa-year storm is very remote.
5. The construction of the proposed diversion facility with
a design capacity of 700 cfs will significantly reduce
the limits of flooding and the water surface elevations
within the majority of the City of Bay City. Significant
impacts are also received on a la-year storm level.
78
6. The estimated construction cost of the preferred
Alternative V is $3,225,000 in 1990 dollars. The one
time benefits received during a 100-year storm event is
estimated at $5,544,000, or a benefit/cost ratio of
1. 719.
7. The project could be constructed from the general
operating fund, with construction costs shared by the
City of Bay City, Matagorda County Drainage District No.
1, Matagorda County Conservation and Reclamation District
No.1, and Matagorda County Commissioner's Court. The
project could be phased over four years, at an average
annual cost of $810,000.
B. RECOMMENDATIONS
It is recommended that:
1. The preferred Alternative V be constructed, and the
project be phased over a four year period to accommodate
local funding abilities.
2. The four governmental agencies that could be responsible
for the funding of this project come to an agreement as
to the funding amounts that can be dedicated to the
project.
3. That engineering services be authorized to prepare
complete construction plans and specifications for the
phased construction of the proposed facility.
4. That all necessary permits and all state and federal
agency permits be applied for and obtained.
79
5. Once completed, the City and County should submit
engineering data to FEMA and request that the Flood
Insurance Rate Maps for Cottonwood Creek be revised to
reduce the flood plain limits and elevations.
6. The City and others should continue to provide drainage
improvements in the Cottonwood Creek Watershed by
removing restrictions in the natural channel upstream of
the diversion point.
80
VI I • REFERENCES
1. 7.5 Minute Series Topographic Maps, U.S. Department of the
Interior Geological Survey, Scale 1:24000, contour interval 5
feet: Lake Austin, Texas, 1952 (photorevised 1972), Bay City,
Texas, 1952 (photorevised 1972), Bay City NE, Texas, 1952
(photorevised 1972), Wadsworth, Texas, 1952 (photorevised
1972), Van Vleck, Texas, 1952 (photorevised 1980).
2. Survey Report on Pevton Creek, Texas Flood Control, U.S. Army
Engineer District Galveston, Corps of Engineers, 1970.
3. Preliminary Drainage Study Peyton Creek Watershed, Brown &
Root, Inc., 1973.
4. HEC 1 Flood Hydrograph Package, Users Manual, U.S.
Department of the Army, Corps of Engineers, Hydrological
Engineering Center, Computer Program 723-X5-L2010, Davis,
California, September 1981, Revised January, 1985.
5. Flood Insurance Study, City of Bay City, Texas, Federal
Emergency Management Agency, June 5, 1985.
5. Flood Insurance Study, Matagorda County, Texas, Federal
Emergency Management Agency.
7. Effects of Urbanization on Floods in the Houston, Texas,
Metropolitan Area, U. S. Department of the Interior, Geological
Survey, Water Resources Investigations 3-73, Steven L. Johnson
and Douglas M. Sayre, Washington, D.C., April, 1973.
8. Technique for Estimating the Magnitude and Frequency of Floods
in Texas, U.S. Department of the Interior, Geological Survey,
Water Resources Investigations 77-110, E.E. Schroeder and B.C.
Massey, Washington, D.C.
81
9. HEC-2 Water Surface Profiles, Users Manual, U.S. Army Corps of
Engineers, Hydrologic Engineering Center, Davis, California,
August, 1979.
82
Cottonwood Creek Flood Protection Plan City of Bay City, Matagorda County, Texas
Contract No. 90-483-763 October 1990
The following maps are not attached to this report. Due to their size, they could not be copied. They are located in the official file and may be copied upon request.
Cottonwood Creek Watershed Exhibit 1
Diversion Channel Location Exhibit 2
100-Year Flood Plain limits Exhibit 3
10-Year Flood Plain limits Exhibit 4
Recommended Diversion Plan Exhibit 5
Please contact Research and Planning Fund Grants Management Division at (512) 463-7926 for copies.