cottesloe coastal monitoring summary report summer 2014/2015 · bmt oceanica: town of cottesloe:...
TRANSCRIPT

Cottesloe Coastal Monitoring Summary Report – Summer 2014/2015
1160_001/1_Rev0
May 2015

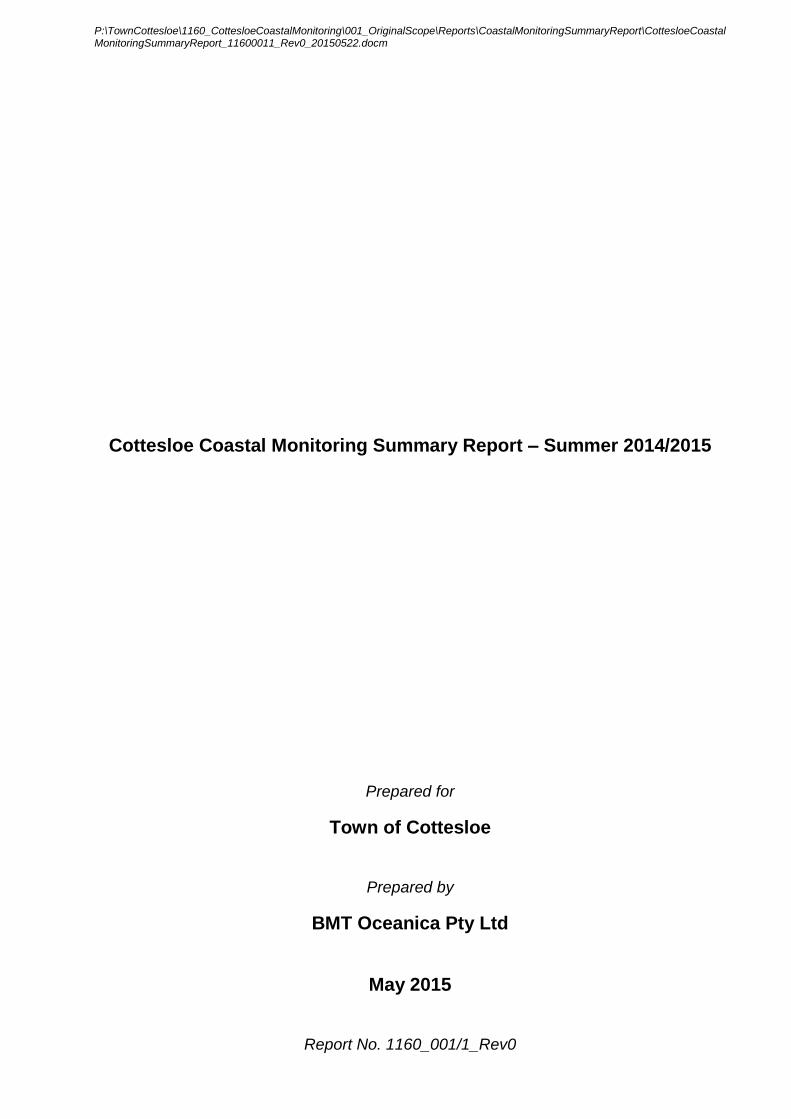
P:\TownCottesloe\1160_CottesloeCoastalMonitoring\001_OriginalScope\Reports\CoastalMonitoringSummaryReport\CottesloeCoastalMonitoringSummaryReport_11600011_Rev0_20150522.docm
Cottesloe Coastal Monitoring Summary Report – Summer 2014/2015
Prepared for
Town of Cottesloe
Prepared by
BMT Oceanica Pty Ltd
May 2015
Report No. 1160_001/1_Rev0

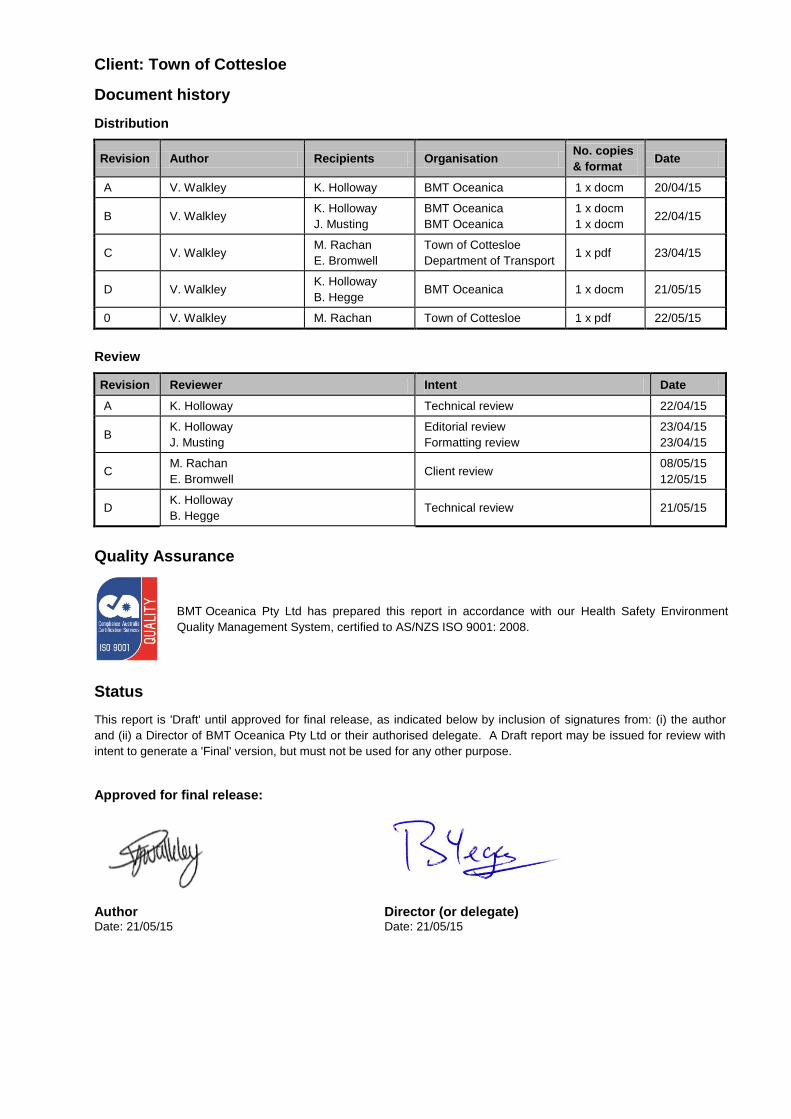
Client: Town of Cottesloe
Document history
Distribution
Revision Author Recipients Organisation No. copies
& format Date
A V. Walkley K. Holloway BMT Oceanica 1 x docm 20/04/15
B V. Walkley K. Holloway
J. Musting
BMT Oceanica
BMT Oceanica
1 x docm
1 x docm 22/04/15
C V. Walkley M. Rachan
E. Bromwell
Town of Cottesloe
Department of Transport 1 x pdf 23/04/15
D V. Walkley K. Holloway
B. Hegge BMT Oceanica 1 x docm 21/05/15
0 V. Walkley M. Rachan Town of Cottesloe 1 x pdf 22/05/15
Review
Revision Reviewer Intent Date
A K. Holloway Technical review 22/04/15
B K. Holloway
J. Musting
Editorial review
Formatting review
23/04/15
23/04/15
C M. Rachan
E. Bromwell Client review
08/05/15
12/05/15
D K. Holloway
B. Hegge Technical review 21/05/15
Quality Assurance
BMT Oceanica Pty Ltd has prepared this report in accordance with our Health Safety Environment
Quality Management System, certified to AS/NZS ISO 9001: 2008.
Status
This report is 'Draft' until approved for final release, as indicated below by inclusion of signatures from: (i) the author
and (ii) a Director of BMT Oceanica Pty Ltd or their authorised delegate. A Draft report may be issued for review with
intent to generate a 'Final' version, but must not be used for any other purpose.
Approved for final release:
Author Director (or delegate) Date: 21/05/15 Date: 21/05/15

Cover
Main image: Cottesloe Main Beach, November 2014 (BMT Oceanica Pty Ltd)
Minor images: Beach profile survey November 2014, Cottesloe Beach (Town of Cottesloe)
Remote imagery units at Cottesloe Main Beach, November 2014 (BMT Oceanica Pty Ltd)
Disclaimer
This report has been prepared on behalf of and for the exclusive use of Town of Cottesloe, and is subject to and issued
in accordance with the agreed terms and scope between Town of Cottesloe and BMT Oceanica Pty Ltd.
BMT Oceanica Pty Ltd accepts no liability or responsibility for it in respect of any use of or reliance upon this report by
any third party.
Copying this report without prior written consent of Town of Cottesloe or BMT Oceanica Pty Ltd is not permitted.
© Copyright 2015 BMT Oceanica Pty Ltd
BMT Oceanica: Town of Cottesloe: Cottesloe Coastal Monitoring Summary Report – Summer 2014/2015 i
Contents
List of terms and acronyms ...................................................................................................... iii
Executive Summary ................................................................................................................... v
1. Introduction ....................................................................................................................... 1
1.1 Project background ............................................................................................... 1
1.2 Project aims and scope ......................................................................................... 3
2. Literature and Data Review .............................................................................................. 4
2.1 Environmental conditions ..................................................................................... 4
2.1.1 Climate ......................................................................................................... 4
2.1.2 Geology and geomorphology ........................................................................ 4
2.1.3 Hydrodynamics ............................................................................................. 5
2.1.4 Sediment dynamics ...................................................................................... 6
2.2 Coastal vulnerability .............................................................................................. 7
2.3 Knowledge gaps .................................................................................................... 7
3. Methods ............................................................................................................................. 8
3.1 Remote imagery monitoring.................................................................................. 8
3.1.1 Remote imagery unit installation and maintenance ....................................... 8
3.1.2 Remote image capture ................................................................................10
3.1.3 Remote imagery review and analysis ..........................................................10
3.2 Beach profile monitoring ..................................................................................... 10
3.2.1 Beach profile data collection ........................................................................10
3.2.2 Beach profile data analysis ..........................................................................11
3.3 Water level and weather observations ............................................................... 11
4. Results ............................................................................................................................. 12
4.1 Remote imagery ................................................................................................... 12
4.1.1 Data quality .................................................................................................12
4.1.2 General trends in beach morphology change ..............................................12
4.1.3 Notable observations ...................................................................................13
4.2 Beach profile data ................................................................................................ 16
4.2.1 Data quality .................................................................................................16
4.2.2 Difference in beach elevation between surveys ...........................................17
5. Discussion and Recommendations ............................................................................... 22
5.1 Discussion............................................................................................................ 22
5.2 Recommendations ............................................................................................... 24
6. References ....................................................................................................................... 25

ii BMT Oceanica: Town of Cottesloe: Cottesloe Coastal Monitoring Summary Report – Summer 2014/2015
List of Figures
Figure 1.1 The Town of Cottesloe coastline ........................................................................... 2
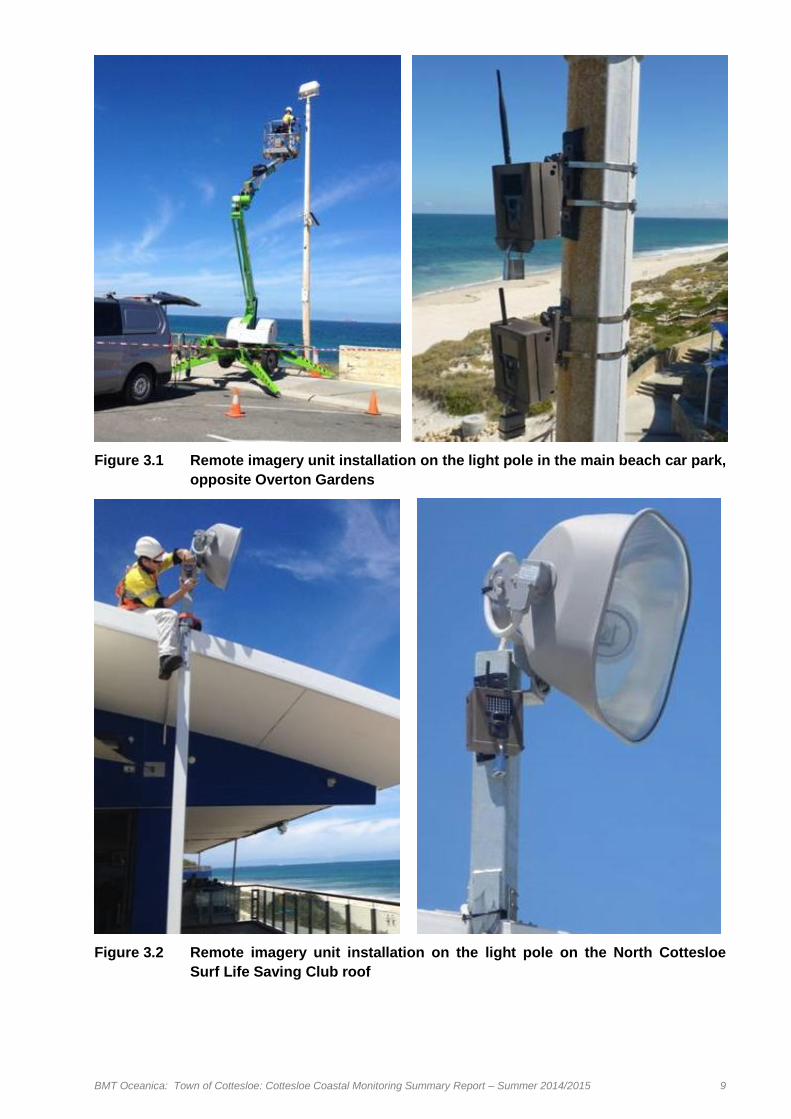
Figure 3.1 Remote imagery unit installation on the light pole in the main beach car park,
opposite Overton Gardens .................................................................................... 9
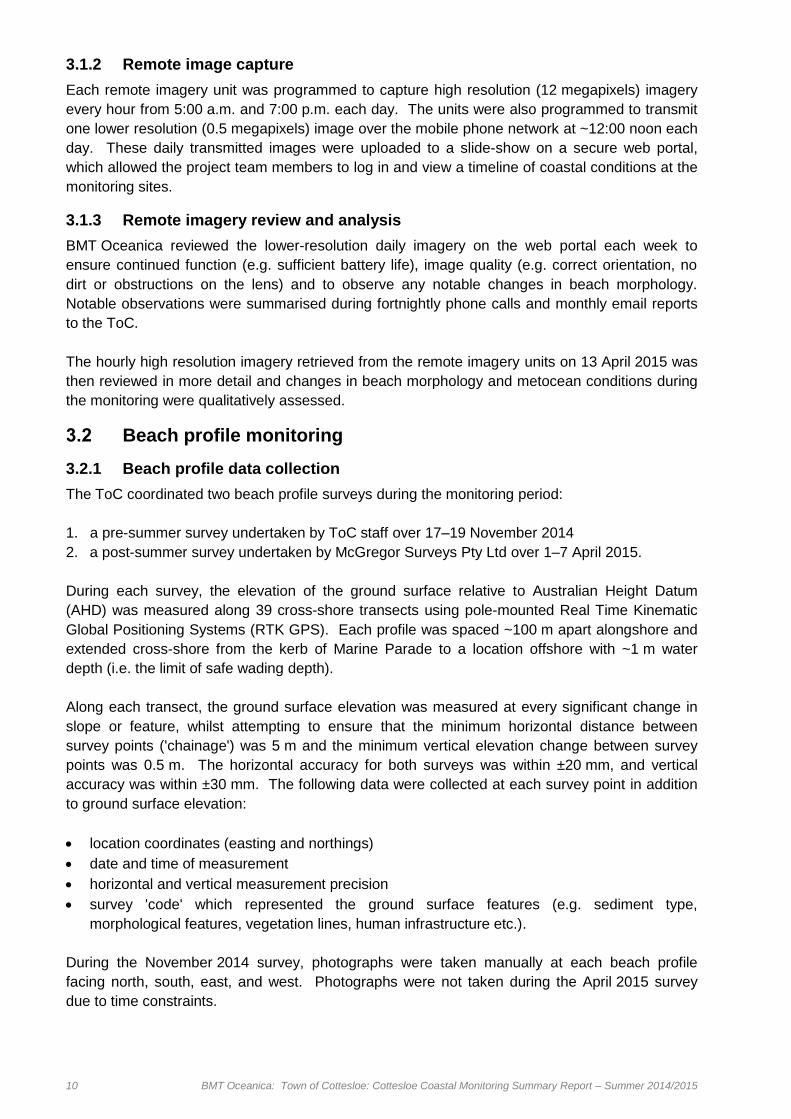
Figure 3.2 Remote imagery unit installation on the light pole on the North Cottesloe Surf
Life Saving Club roof ............................................................................................. 9
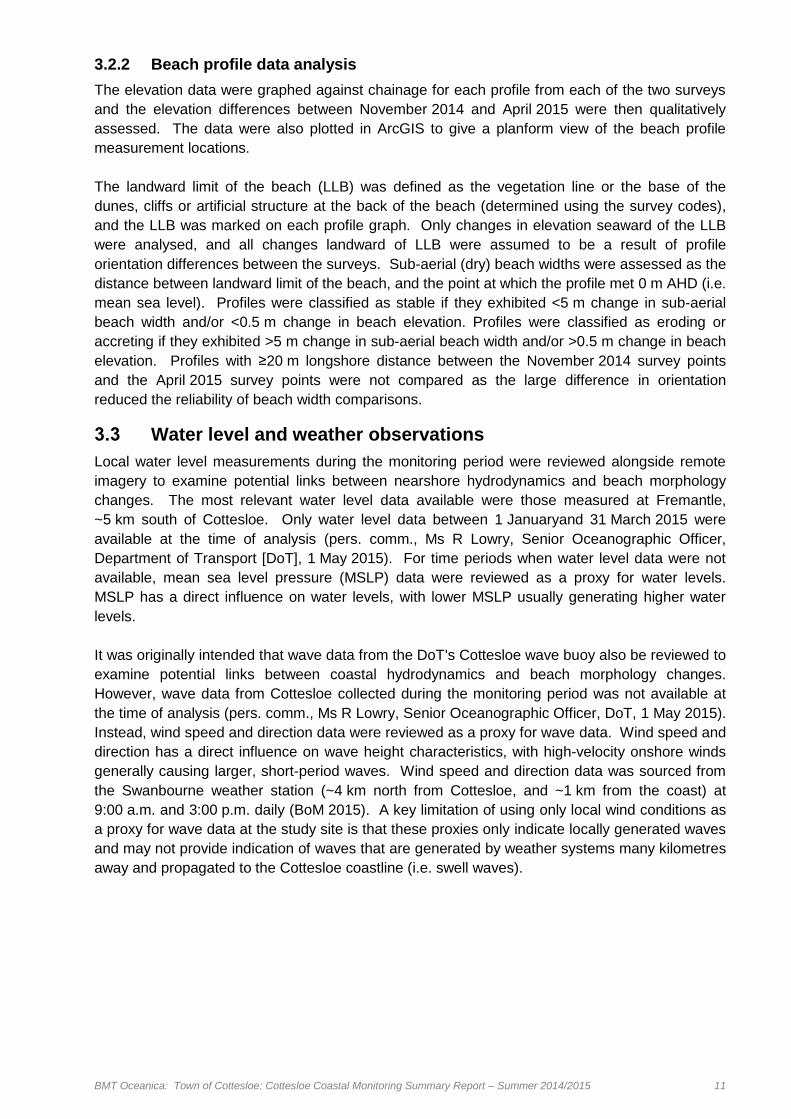
Figure 4.1 Cottesloe Main Beach at 11:08 hrs on 19 November 2014, the day of remote
imagery unit installation (left) and at 11:44 hrs on 13 April 2015, the day of
the service visit (right) ..........................................................................................12
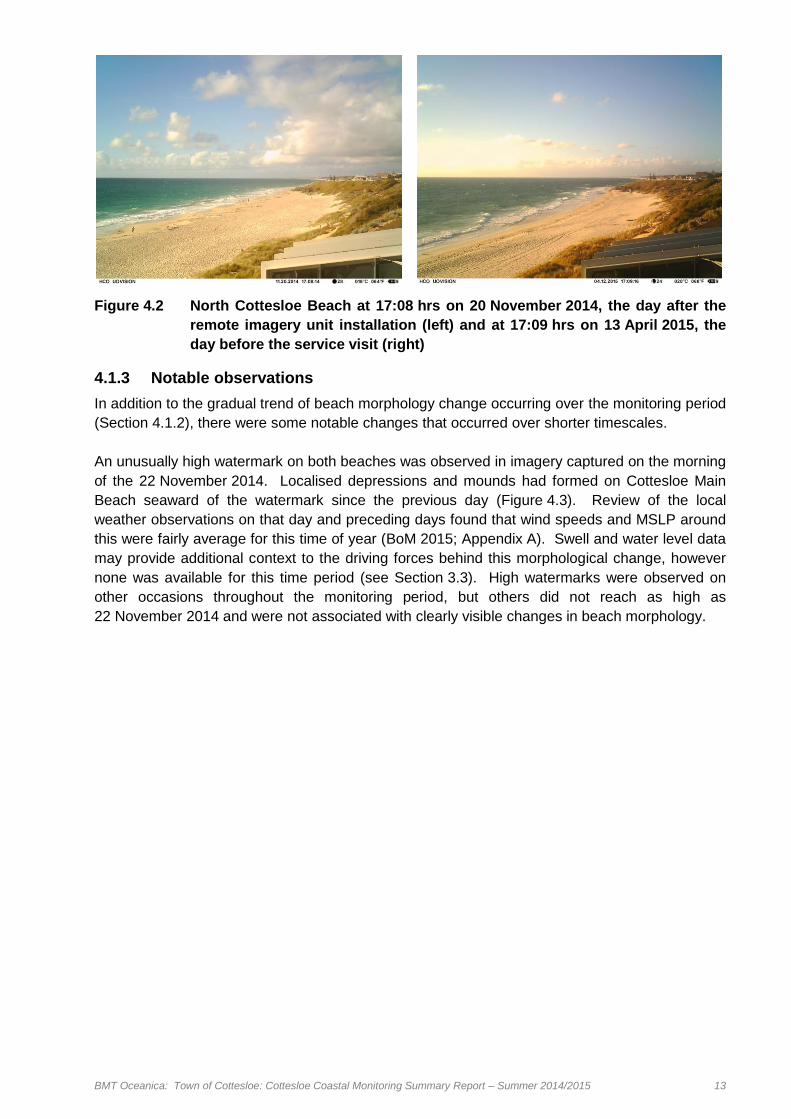
Figure 4.2 North Cottesloe Beach at 17:08 hrs on 20 November 2014, the day after the
remote imagery unit installation (left) and at 17:09 hrs on 13 April 2015, the
day before the service visit (right) .........................................................................13
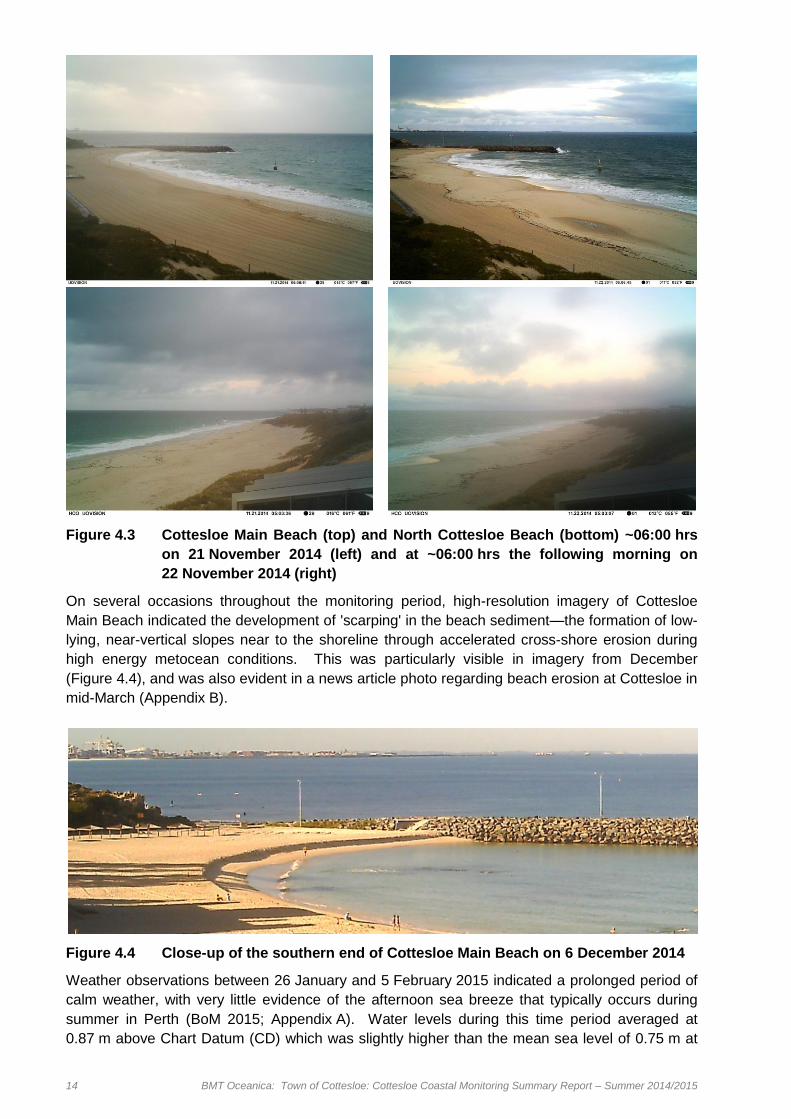
Figure 4.3 Cottesloe Main Beach (top) and North Cottesloe Beach (bottom) ~06:00 hrs
on 21 November 2014 (left) and at ~06:00 hrs the following morning on
22 November 2014 (right) ....................................................................................14
Figure 4.4 Close-up of the southern end of Cottesloe Main Beach on 6 December 2014 ......14
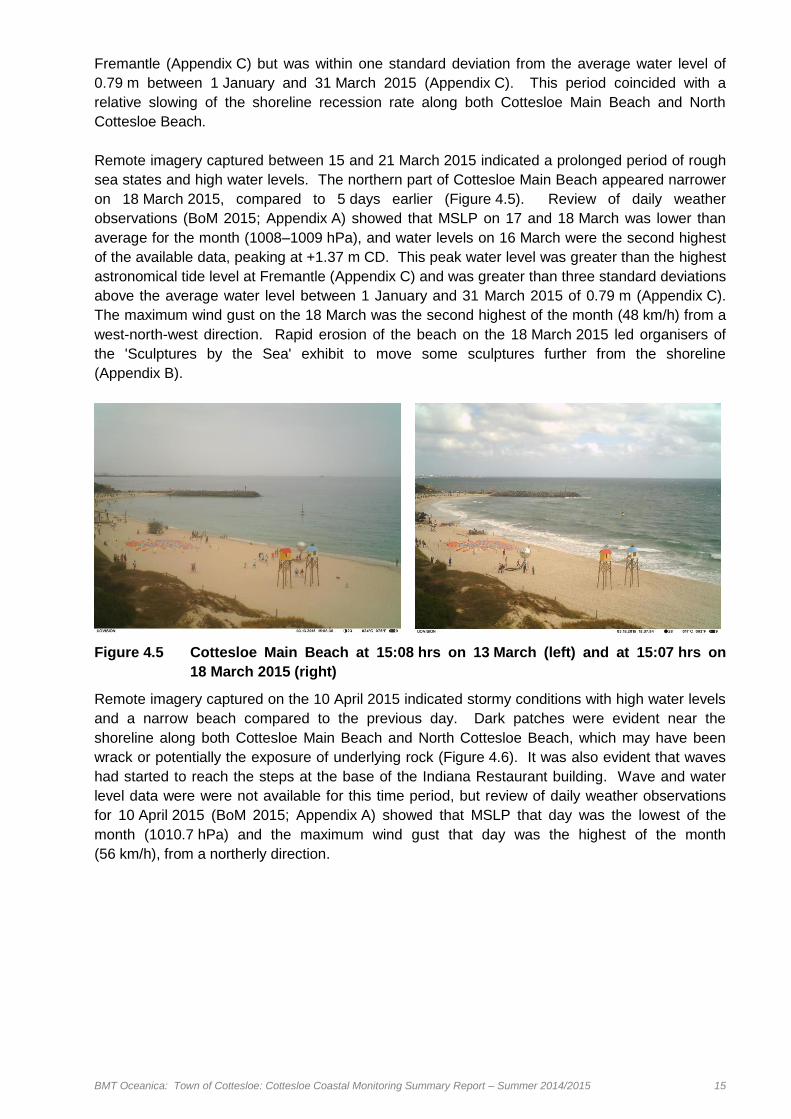
Figure 4.5 Cottesloe Main Beach at 15:08 hrs on 13 March (left) and at 15:07 hrs on
18 March 2015 (right) ...........................................................................................15
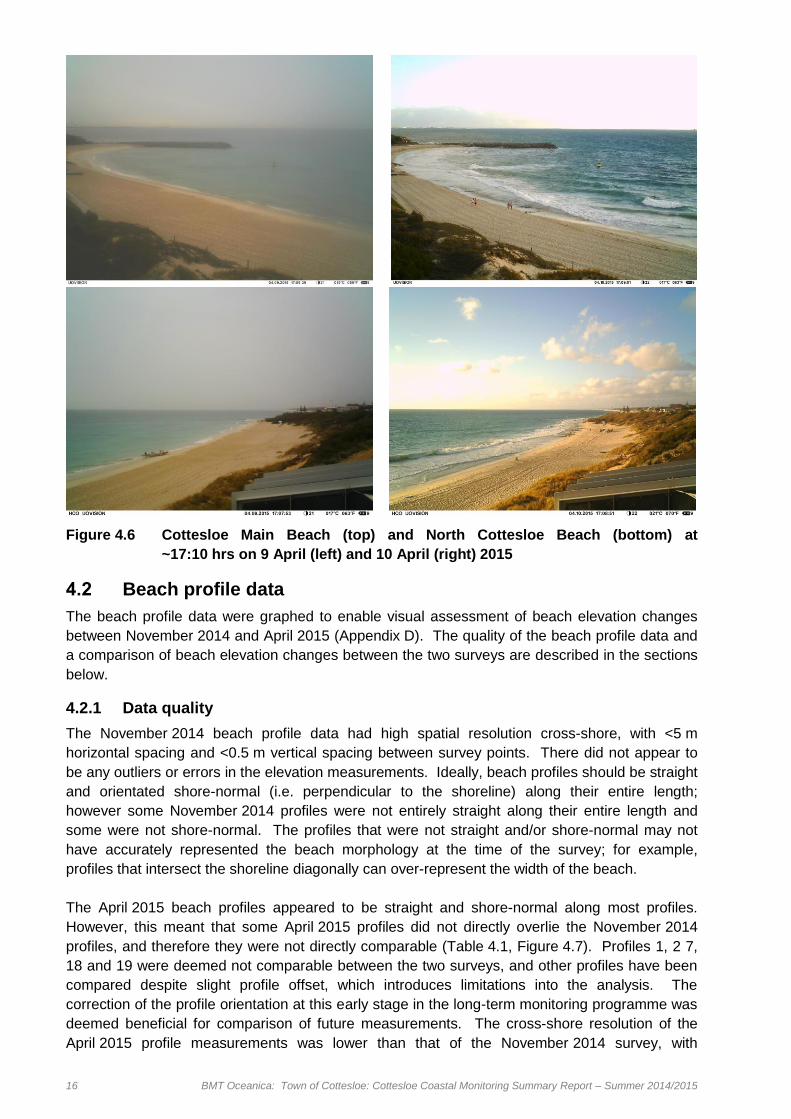
Figure 4.6 Cottesloe Main Beach (top) and North Cottesloe Beach (bottom) at
~17:10 hrs on 9 April (left) and 10 April (right) 2015 .............................................16
Figure 4.7 Remote imagery monitoring sites and beach profiles measured at Cottesloe
during the summer 2014/215 monitoring period ...................................................21
List of Tables
Table 4.1 Difference in beach elevation at Cottesloe from November 2014 to April
2015 .....................................................................................................................19
List of Appendices
Appendix A Daily weather observations November 2015–April 2015
Appendix B News article on beach erosion in March 2015
Appendix C Water Level Data
Appendix D Beach profile data
BMT Oceanica: Town of Cottesloe: Cottesloe Coastal Monitoring Summary Report – Summer 2014/2015 iii
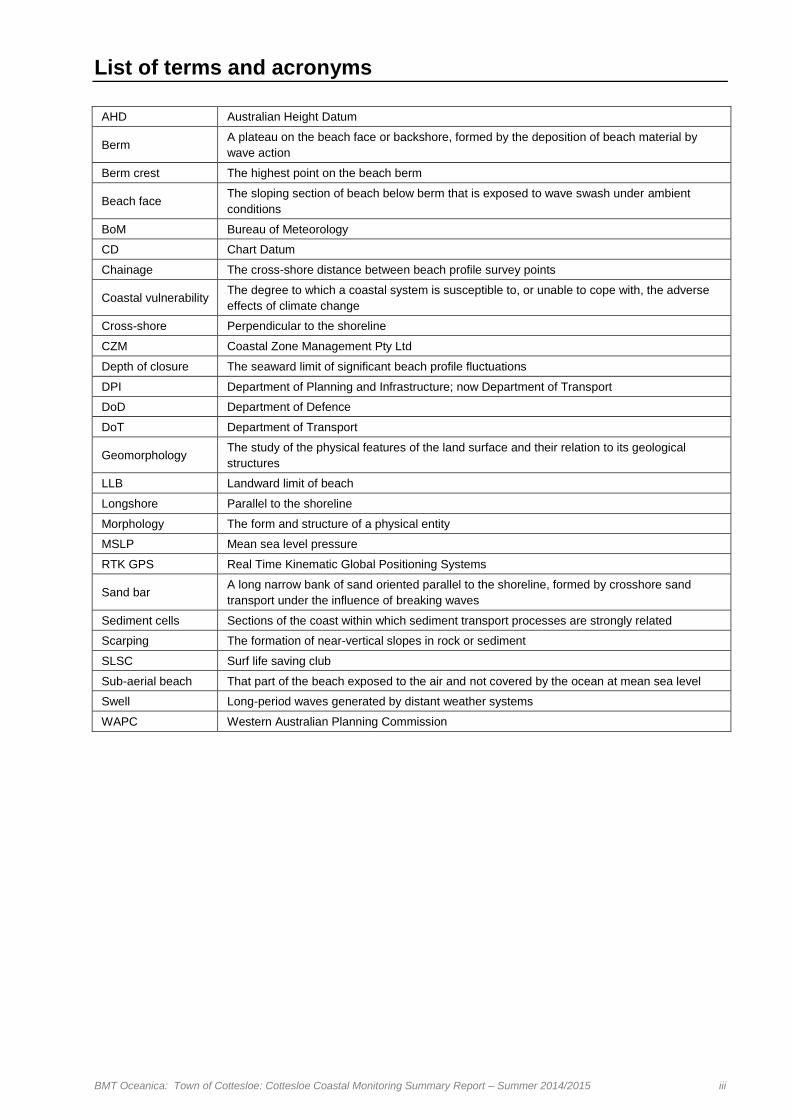
List of terms and acronyms
AHD Australian Height Datum
Berm A plateau on the beach face or backshore, formed by the deposition of beach material by
wave action
Berm crest The highest point on the beach berm
Beach face The sloping section of beach below berm that is exposed to wave swash under ambient
conditions
BoM Bureau of Meteorology
CD Chart Datum
Chainage The cross-shore distance between beach profile survey points
Coastal vulnerability The degree to which a coastal system is susceptible to, or unable to cope with, the adverse
effects of climate change
Cross-shore Perpendicular to the shoreline
CZM Coastal Zone Management Pty Ltd
Depth of closure The seaward limit of significant beach profile fluctuations
DPI Department of Planning and Infrastructure; now Department of Transport
DoD Department of Defence
DoT Department of Transport
Geomorphology The study of the physical features of the land surface and their relation to its geological
structures
LLB Landward limit of beach
Longshore Parallel to the shoreline
Morphology The form and structure of a physical entity
MSLP Mean sea level pressure
RTK GPS Real Time Kinematic Global Positioning Systems
Sand bar A long narrow bank of sand oriented parallel to the shoreline, formed by crosshore sand
transport under the influence of breaking waves
Sediment cells Sections of the coast within which sediment transport processes are strongly related
Scarping The formation of near-vertical slopes in rock or sediment
SLSC Surf life saving club
Sub-aerial beach That part of the beach exposed to the air and not covered by the ocean at mean sea level
Swell Long-period waves generated by distant weather systems
WAPC Western Australian Planning Commission

BMT Oceanica: Town of Cottesloe: Cottesloe Coastal Monitoring Summary Report – Summer 2014/2015 v
Executive Summary
Cottesloe is a coastal suburb ~12 km west of Perth city centre in Western Australia, known for its
iconic beach and terraced lawns overlooking the Indian Ocean. The Town of Cottesloe (ToC) is
the local government authority and its jurisdiction extends across ~4 km of coastline. The
coastline is highly developed, with key public and private infrastructure situated close to the
beach. The beaches at Cottesloe experience seasonal storm erosion on an annual basis, with
evidence of ongoing erosion and a potential future increase in erosion due to the effects of
climate change (CZM & Damara 2008). There are a number of negative effects associated with
such erosion, including loss of beach area, reduction of coastal access, recreational opportunities
and aesthetic values, and damage to coastal infrastructure.
The ToC are implementing an ongoing coastal monitoring project to inform future decision
making regarding the management of the Cottesloe coastline and to facilitate improved planning
for future coastal protection and adaptation. The ToC commissioned BMT Oceanica to assist
with implementing the first year of the coastal monitoring project, which involves hourly remote
imagery capture and biannual beach profile surveys. This report presents the results of the first
5 months of monitoring from November 2014 to April 2015 (i.e. summer 2014/2015).
Hourly remote imagery was captured at Cottesloe Main Beach and North Cottesloe Beach every
day during daylight hours from 19 November to 13 April 2015. Beach profiles were surveyed at
39 cross-shore transects on two occasions: 17–19 November 2014 and 1–7 April 2015. Each
profile was spaced ~100 m apart alongshore and extended cross-shore from the kerb of Marine
Parade to a location offshore with ~1 m water depth.
The results of the remote imagery and beach profile monitoring showed that the general pattern
of beach morphology change along the Cottesloe coastline during summer 2014/2015 was
erosion of the beaches north of Cottesloe Groyne/Mudurup Rocks, and accretion of the beaches
south of Cottesloe Groyne/Mudurup Rocks (with the exception of a small area of erosion directly
north of Beach Street Groyne). Erosion generally occurred via a reduction in beach width and
increase in beach face steepness, with an increase in berm crest height along some profiles.
Accretion generally occurred via an increase in beach width and an increase in berm crest height
along some profiles. The longshore pattern of erosion and accretion at Cottesloe is likely
attributable to the net northward longshore sand transport in summer (driven by predominant
south-south-westerly winds) being interrupted by cross-shore features such as groynes and rocky
outcrops, causing accumulation of sand updrift (i.e. to the south) and erosion of sand downdrift
(i.e. to the north) of these features. Remote imagery indicated that periods of accelerated or
slowed erosion at Cottesloe Main Beach and North Cottesloe during summer 2014/2015 may
have been be linked to variations in sea breeze activity, storm direction, water levels and long-
range swell.
As the general pattern of beach change at Cottesloe over summer 2014/2015 was mainly related
to seasonal northward sediment transport direction, it is likely that a sediment transport direction
reversal during winter will result in some accretion in previously eroded areas. However episodic
beach erosion may also occur in these areas during winter due to offshore sediment transport
during more frequent and/or intense winter storms. A full year of monitoring is required to fully
assess the cyclic nature of beach morphology changes over the seasons and to determine
potential areas of concern from a coastal management perspective.
vi BMT Oceanica: Town of Cottesloe: Cottesloe Coastal Monitoring Summary Report – Summer 2014/2015
Based solely on the erosion observed during summer 2014/2015, areas that may require further
attention in the event of more severe erosion in future include:
Cottesloe Main Beach, particularly in front of the Indiana Restaurant building
in front of the North Cottesloe SLSC
directly north of Beach Street Groyne.
Based on the results of the summer 2014/2015 coastal monitoring, it is recommended that the
monitoring programme be continued beyond the first year of monitoring (ending in November
2015), to build understanding of both seasonal and inter-annual changes in beach morphology at
Cottesloe. The ToC may also wish to consider the following specific recommendations for future
monitoring:
deploy additional remote imagery units to allow real-time monitoring of other potentially
vulnerable areas such as around Beach Street Groyne and North Street
implement post-storm beach profile monitoring, to help build understanding of how Cottesloe
beaches respond to certain extreme conditions
limit the landward extent of beach profile surveys to the LLB until any major changes to the
backshore occur (i.e. construction of new coastal infrastructure) to save time and cost. Costs
saved here could be used to fund other improvements to the monitoring (e.g. deployment of
extra cameras or post-storm monitoring)
ensure future beach profile surveys follow the transects surveyed during the April 2015
survey, as all of these profiles have the correct shore-normal orientation
ensure future beach profile surveys capture elevation measurements within ~1 m either side
(alongshore) of the April 2015 transects, to optimise the comparability of profiles between
surveys
ensure during future beach profile surveys that the minimum horizontal distance between
survey points is ~5 m and the minimum vertical elevation change between survey points is
~0.5 m, to guarantee the full shape of the profile is captured.
extend beach profile measurements to the depth of closure using boat-based survey
equipment to allow assessment of sediment exchanges across the full width of the active
profile and a more comprehensive understanding of seasonal beach profile fluctuations
analyse beach volume changes using beach profile and geotechnical data, to allow
quantification of sediment transport rates which may assist any further assessments of
coastal vulnerability.
BMT Oceanica: Town of Cottesloe: Cottesloe Coastal Monitoring Summary Report – Summer 2014/2015 1
1. Introduction
1.1 Project background
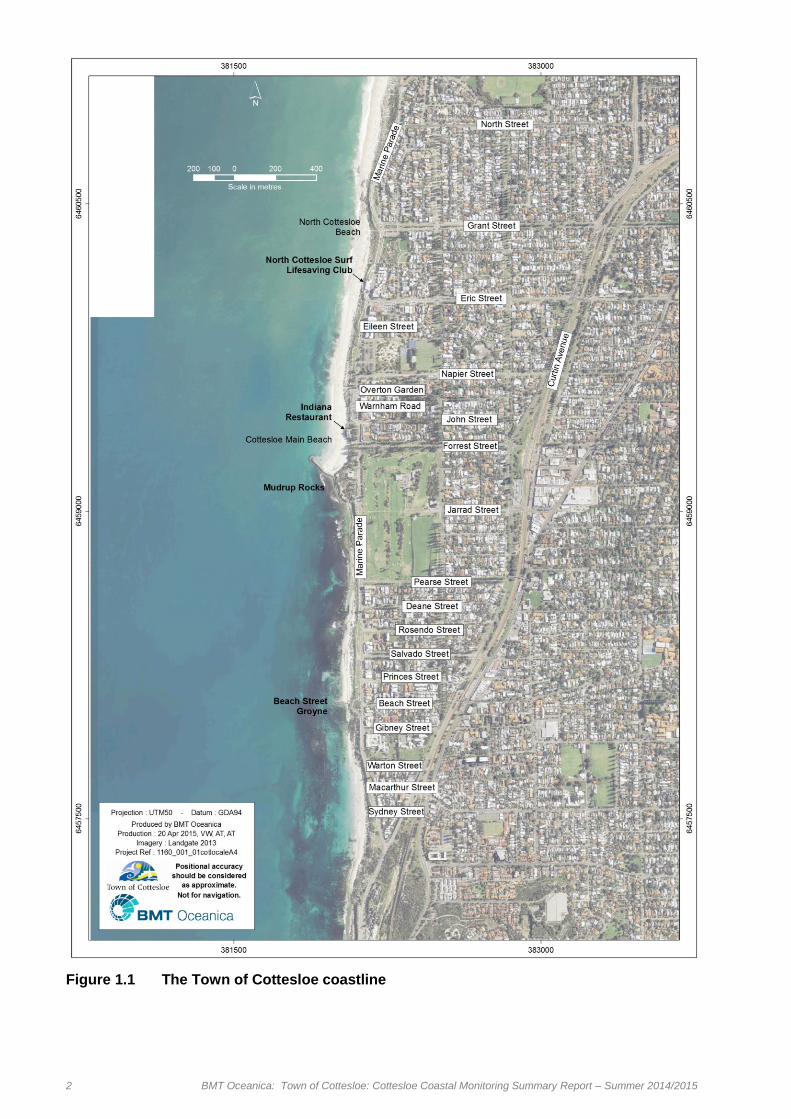
Cottesloe is a coastal suburb ~12 km west of Perth city centre in Western Australia (Figure 1.1),
known for its iconic beach and terraced lawns overlooking the Indian Ocean. The Town of
Cottesloe (ToC) is the local government authority and its jurisdiction extends across ~4 km of
coastline. The coastline is highly developed, with key public and private infrastructure situated
within ~150 m from the shoreline, including:
scenic parks, walk/cycle-ways and beach access paths
highly priced residential properties
Marine Parade, a key coastal access road
Indiana Restaurant, an iconic Western Australian landmark
Cottesloe Beach Hotel and the Ocean Beach Hotel, historic establishments dating back to the
early 1900s
several other bars, shops and restaurants.
The beaches along the Cottesloe coastline have undergone both long and short-term erosion
over the past few decades with some 'hotspots' suffering significant erosion during storms
(ToC 2014, CZM & Damara 2008). Various coastal management actions have mitigated and/or
masked this erosion, such as the construction of a ~130 m long curved rock groyne on Mudurup
Rocks in 1960 (Figure 1.1), a smaller ~70 m long rock groyne at Beach Street (Figure 1.1), and
sand nourishment campaigns since the 1980s. However, the coastline still experiences short-
term storm erosion on an annual basis, with evidence of net long-term erosion and a potential
future increase in erosion due to the effects of climate change (CZM & Damara 2008). The
negative effects of such erosion may include loss of beach area, reduction of coastal access,
recreational opportunities and aesthetic values, and damage to coastal infrastructure.
The ToC wish to formulate a better understanding of coastal hazards over an extended timeframe
to inform future coastal management decisions and facilitate improved planning for future coastal
protection and adaptation work. To achieve this objective, the ToC are implementing an ongoing
coastal monitoring project and have commissioned BMT Oceanica to assist with data collection
and analysis during the first year of the project from November 2014–November 2015.
2 BMT Oceanica: Town of Cottesloe: Cottesloe Coastal Monitoring Summary Report – Summer 2014/2015
Figure 1.1 The Town of Cottesloe coastline
BMT Oceanica: Town of Cottesloe: Cottesloe Coastal Monitoring Summary Report – Summer 2014/2015 3
1.2 Project aims and scope
The aim of this project was to implement the first year of a long-term coastal monitoring
programme at Cottesloe, to help improve understanding of seasonal fluctuations and eventually
long-term trends in coastal erosion, accretion and sediment dynamics. This first year of
monitoring will act as a baseline against which future datasets can be compared. The ToC
commissioned BMT Oceanica to undertake the following scope of work to assist with the first
year of the ToC's coastal monitoring programme:
1. Review relevant literature and data
2. Review and advise on the ToC's initial monitoring plans
3. Coordinate remote imagery monitoring
4. Analyse beach profile data (collected by the ToC) together with remote imagery
5. Prepare a summary report (this report) presenting the results of the first 5 months of
monitoring (November 2014 to April 2015, i.e. summer 2014/2015).

4 BMT Oceanica: Town of Cottesloe: Cottesloe Coastal Monitoring Summary Report – Summer 2014/2015
2. Literature and Data Review
A number of relevant studies and reports were reviewed to provide context to the monitoring of
coastal change at Cottesloe. Key information extracted from this review is presented in the
following sections:
Environmental conditions at Cottesloe—this information may assist in determining the
physical causes and mechanisms of any coastal change observed during the monitoring.
Coastal vulnerability along the Cottesloe coastline—this information may assist in explaining
any spatial variability in coastal change observed during the monitoring and may support the
understanding of impacts of the changes.
Knowledge gaps—this information may assist in determining what other studies or data are
required to monitor and explain coastal change.
These are further discussed below.
2.1 Environmental conditions
2.1.1 Climate
Climate and weather conditions play a key role in coastal change through their influence on the
rain, wind, waves and water levels that shape the coastline.
Perth experiences a Mediterranean climate, with hot, dry summers and mild, wet winters. An
eastward moving subtropical high pressure belt causes predominant south-westerly winds in the
summer and easterly winds in the winter (Gentilli 1972). During winter, the high pressure belt is
disrupted by mid-latitude depressions that generate high energy storms, with the strongest winds
usually from the north-west. During summer, strong south-westerly sea breezes occur in the
afternoons, with velocities frequently exceeding 15 m/s (Pattiaratchi et al. 1997). Tropical
cyclones track down from the north-west coast infrequently during late summer and can have
significant impact on the coastline (Eliot & Clarke 1986, Lemm 1996).
2.1.2 Geology and geomorphology
The geology and geomorphology of a coastline considerably affects its response to natural
drivers of coastal change such as varying climatic and hydrodynamic conditions.
Cottesloe lies on the western part of the Swan Coastal Plain, which extends from the north of
Perth to Dunsborough in the south, and from the Darling Scarp in the east to the Indian Ocean in
the west (WAPC 1999). The local geology consists mainly of Holocene sands overlying
Pleistocene Tamala Limestone, which rests on older sandstone, siltstone, claystone and shales.
The Tamala Limestone is calcarenite and forms small rocky headlands and nearshore reef
platforms (Searle & Semeniuk 1985; Sanderson & Eliot 1999).
The beaches comprise a limestone bedrock shelf overlain in most areas by unconsolidated beach
sediments. The results of a geotechnical survey undertaken along shore-parallel transects in
2010 between Curtin Avenue and North Street (GPG Maps 2010) indicated that that the depth of
the limestone bedrock varies alongshore from 5 m to >10 m below the ground surface. Between
south of Curtin Avenue and Gibney Street, the bedrock elevation was mainly above or near mean
sea level. The bedrock elevation in other areas was below present mean sea level, in some
places >2 m below present mean sea level. The survey also indicated variability in sand
compaction with depth below the ground surface and distance alongshore, with poor sand
compaction most common in the top 5 m (GPG Maps 2010).

BMT Oceanica: Town of Cottesloe: Cottesloe Coastal Monitoring Summary Report – Summer 2014/2015 5
The results of a second geotechnical survey undertaken along shore-perpendicular transects in
2011 between Curtin Avenue and North Street (GPG Maps 2011) indicated that there is a high
level of cross-shore variability in the depth of the limestone bedrock, ranging from ~2 m to >10 m
below the ground surface. Localised high and low points in the limestone bedrock were observed
and may relate to karstic features such as pinnacles and depressions (GPG Maps 2011).
Section 2.2 provides further discussion on how this geotechnical information may affect coastal
vulnerability.
Cottesloe has been classified as a reef-protected, reflective sandy beach with strong currents,
and North Cottesloe has been classified as a reflective (steep) beach (Velardo 1998, in
Stul 2005). The beaches are backed by calcarenite dunes in most areas, except along a stretch
of beach between Warnham Road and the Cottesloe Surf Lifesaving Club that is backed by
concrete seawalls, paved pathways and terraced lawns.
2.1.3 Hydrodynamics
Hydrodynamics such as waves, water levels and currents in the coastal zone are key drivers of
coastal change. The regional wave climate in Perth is comprised of short-period, locally
generated wind waves, and long-period swell waves. The sea breeze during summer generates
southerly to south-westerly wind waves, and storms during winter generate north-westerly to
south-westerly wind waves (Lemm et al. 1999). Swell waves come from the south to south-west
in summer with a greater westerly component in winter (Lemm et al. 1999). Offshore reefs,
islands and sloping bathymetry attenuate wave energy reaching Cottesloe, and consequently
inshore wave heights at the Cottesloe wave buoy (in 17 m water depth) are 40–50% less than the
offshore wave heights at the Rottnest wave buoy (in 48 m water depth; Sanderson et al. 2000;
Masselink & Pattiaratchi 2001). The smallest wave heights are usually experienced directly north
of the rock groyne at Cottesloe due to the groyne providing sheltering from south-westerly waves
(BeachSafe 2015). The mean significant wave height measured by the wave buoy at Cottesloe is
1.1 m in winter, 0.75 m in summer and 0.8 m annually (DPI 2004).
Perth is located in a microtidal environment, and experiences mixed, mainly diurnal tides with a
range of ~0.7 m during spring tides and ~0.3 m during neap tides (DoD 2005). Elevated
nearshore water levels can be generated by sea breezes during summer, and low atmospheric
pressure systems and high wave energy during winter (Hegge 1994). Analysis of historical mean
sea levels at Fremantle (~8 km south of Cottesloe) showed that mean sea level rose by
1.46 mm/year on average between 1897 and 2008, which was slightly lower than the global
average of 1.7 mm/yr for the 20th century (Haigh et al. 2011). However the rate of sea level rise
at Fremantle has been greater in more recent years, rising at an average of 5.66 mm/year
between 1992–2008 (Haigh et al. 2011).
Currents in the Perth coastal waters are predominantly wind-driven, characterised by a net
northward flow of water in summer and southward in winter, with longshore current speeds
ranging 0.04–0.2 m/s (Searle & Semeniuk 1985, Pattiaratchi et al. 1997). Topographic forcing
and longshore variation in wave energy can also create circulating current cells and high-velocity
rip currents (Bowyer 1987). Strong rip currents are common around the nearshore rock reefs at
Cottesloe, increasing in frequency during winter and high wave conditions (Olsson 2004).
6 BMT Oceanica: Town of Cottesloe: Cottesloe Coastal Monitoring Summary Report – Summer 2014/2015
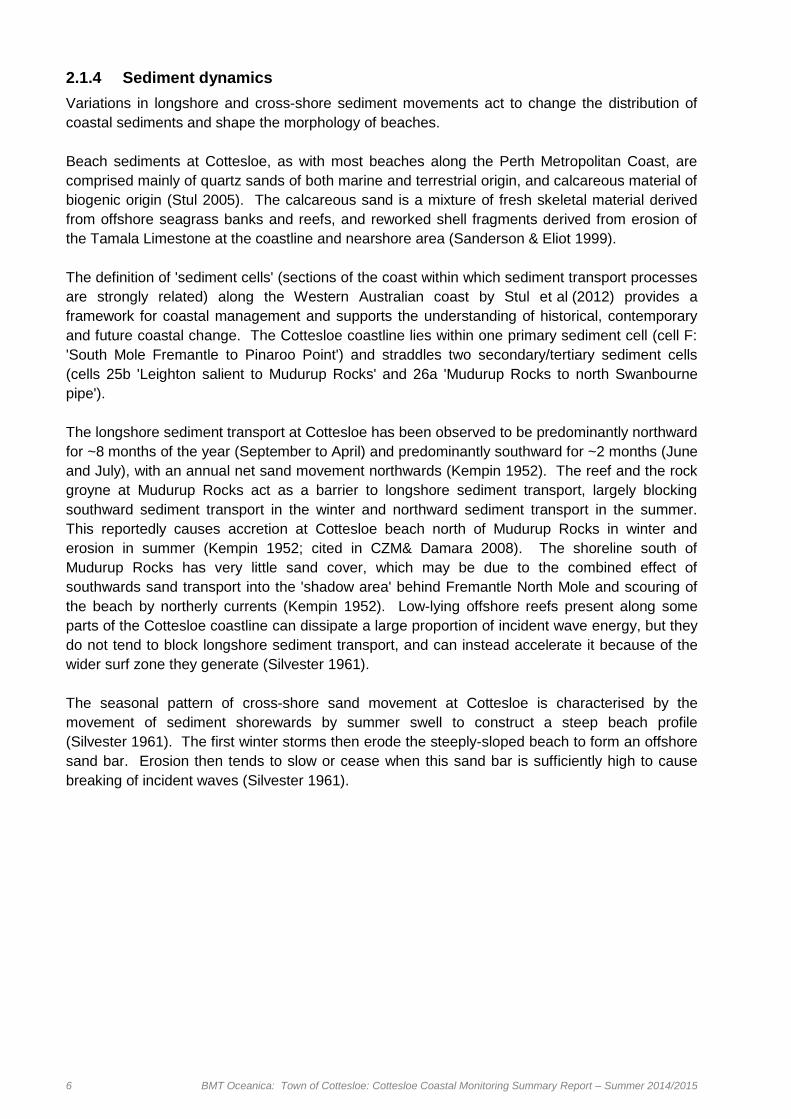
2.1.4 Sediment dynamics
Variations in longshore and cross-shore sediment movements act to change the distribution of
coastal sediments and shape the morphology of beaches.
Beach sediments at Cottesloe, as with most beaches along the Perth Metropolitan Coast, are
comprised mainly of quartz sands of both marine and terrestrial origin, and calcareous material of
biogenic origin (Stul 2005). The calcareous sand is a mixture of fresh skeletal material derived
from offshore seagrass banks and reefs, and reworked shell fragments derived from erosion of
the Tamala Limestone at the coastline and nearshore area (Sanderson & Eliot 1999).
The definition of 'sediment cells' (sections of the coast within which sediment transport processes
are strongly related) along the Western Australian coast by Stul et al (2012) provides a
framework for coastal management and supports the understanding of historical, contemporary
and future coastal change. The Cottesloe coastline lies within one primary sediment cell (cell F:
'South Mole Fremantle to Pinaroo Point') and straddles two secondary/tertiary sediment cells
(cells 25b 'Leighton salient to Mudurup Rocks' and 26a 'Mudurup Rocks to north Swanbourne
pipe').
The longshore sediment transport at Cottesloe has been observed to be predominantly northward
for ~8 months of the year (September to April) and predominantly southward for ~2 months (June
and July), with an annual net sand movement northwards (Kempin 1952). The reef and the rock
groyne at Mudurup Rocks act as a barrier to longshore sediment transport, largely blocking
southward sediment transport in the winter and northward sediment transport in the summer.
This reportedly causes accretion at Cottesloe beach north of Mudurup Rocks in winter and
erosion in summer (Kempin 1952; cited in CZM& Damara 2008). The shoreline south of
Mudurup Rocks has very little sand cover, which may be due to the combined effect of
southwards sand transport into the 'shadow area' behind Fremantle North Mole and scouring of
the beach by northerly currents (Kempin 1952). Low-lying offshore reefs present along some
parts of the Cottesloe coastline can dissipate a large proportion of incident wave energy, but they
do not tend to block longshore sediment transport, and can instead accelerate it because of the
wider surf zone they generate (Silvester 1961).
The seasonal pattern of cross-shore sand movement at Cottesloe is characterised by the
movement of sediment shorewards by summer swell to construct a steep beach profile
(Silvester 1961). The first winter storms then erode the steeply-sloped beach to form an offshore
sand bar. Erosion then tends to slow or cease when this sand bar is sufficiently high to cause
breaking of incident waves (Silvester 1961).
BMT Oceanica: Town of Cottesloe: Cottesloe Coastal Monitoring Summary Report – Summer 2014/2015 7
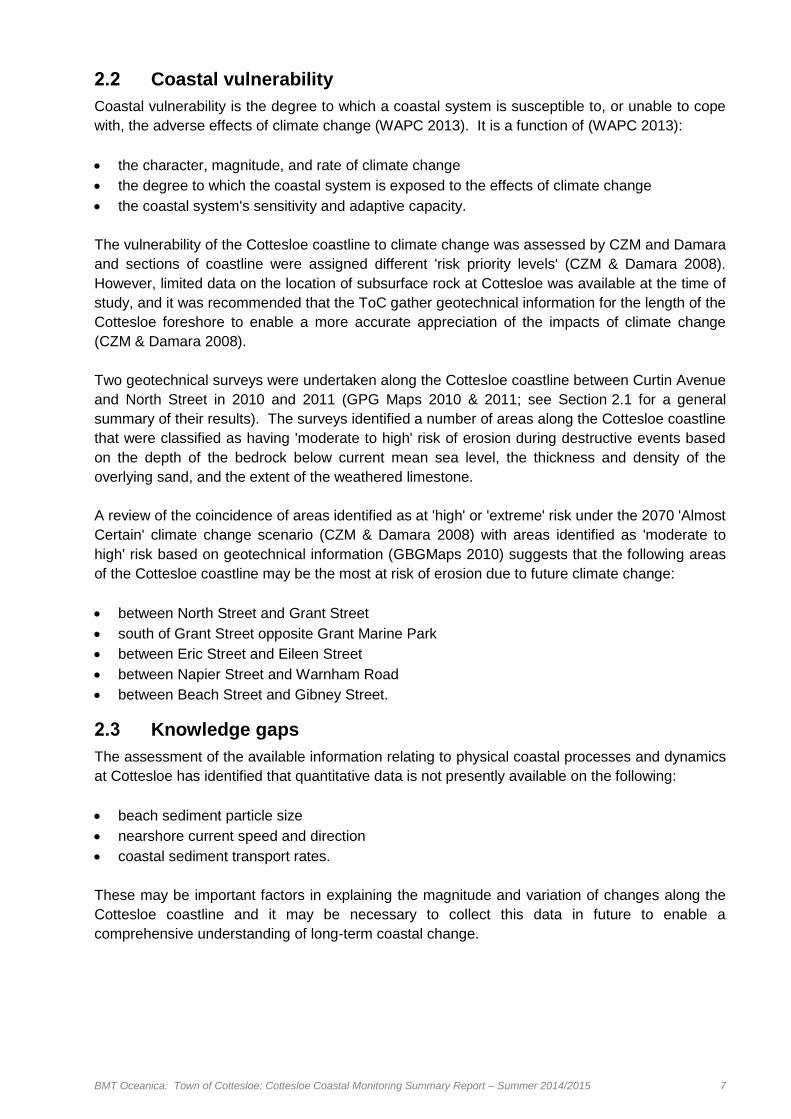
2.2 Coastal vulnerability
Coastal vulnerability is the degree to which a coastal system is susceptible to, or unable to cope
with, the adverse effects of climate change (WAPC 2013). It is a function of (WAPC 2013):
the character, magnitude, and rate of climate change
the degree to which the coastal system is exposed to the effects of climate change
the coastal system's sensitivity and adaptive capacity.
The vulnerability of the Cottesloe coastline to climate change was assessed by CZM and Damara
and sections of coastline were assigned different 'risk priority levels' (CZM & Damara 2008).
However, limited data on the location of subsurface rock at Cottesloe was available at the time of
study, and it was recommended that the ToC gather geotechnical information for the length of the
Cottesloe foreshore to enable a more accurate appreciation of the impacts of climate change
(CZM & Damara 2008).
Two geotechnical surveys were undertaken along the Cottesloe coastline between Curtin Avenue
and North Street in 2010 and 2011 (GPG Maps 2010 & 2011; see Section 2.1 for a general
summary of their results). The surveys identified a number of areas along the Cottesloe coastline
that were classified as having 'moderate to high' risk of erosion during destructive events based
on the depth of the bedrock below current mean sea level, the thickness and density of the
overlying sand, and the extent of the weathered limestone.
A review of the coincidence of areas identified as at 'high' or 'extreme' risk under the 2070 'Almost
Certain' climate change scenario (CZM & Damara 2008) with areas identified as 'moderate to
high' risk based on geotechnical information (GBGMaps 2010) suggests that the following areas
of the Cottesloe coastline may be the most at risk of erosion due to future climate change:
between North Street and Grant Street
south of Grant Street opposite Grant Marine Park
between Eric Street and Eileen Street
between Napier Street and Warnham Road
between Beach Street and Gibney Street.
2.3 Knowledge gaps
The assessment of the available information relating to physical coastal processes and dynamics
at Cottesloe has identified that quantitative data is not presently available on the following:
beach sediment particle size
nearshore current speed and direction
coastal sediment transport rates.
These may be important factors in explaining the magnitude and variation of changes along the
Cottesloe coastline and it may be necessary to collect this data in future to enable a
comprehensive understanding of long-term coastal change.
8 BMT Oceanica: Town of Cottesloe: Cottesloe Coastal Monitoring Summary Report – Summer 2014/2015
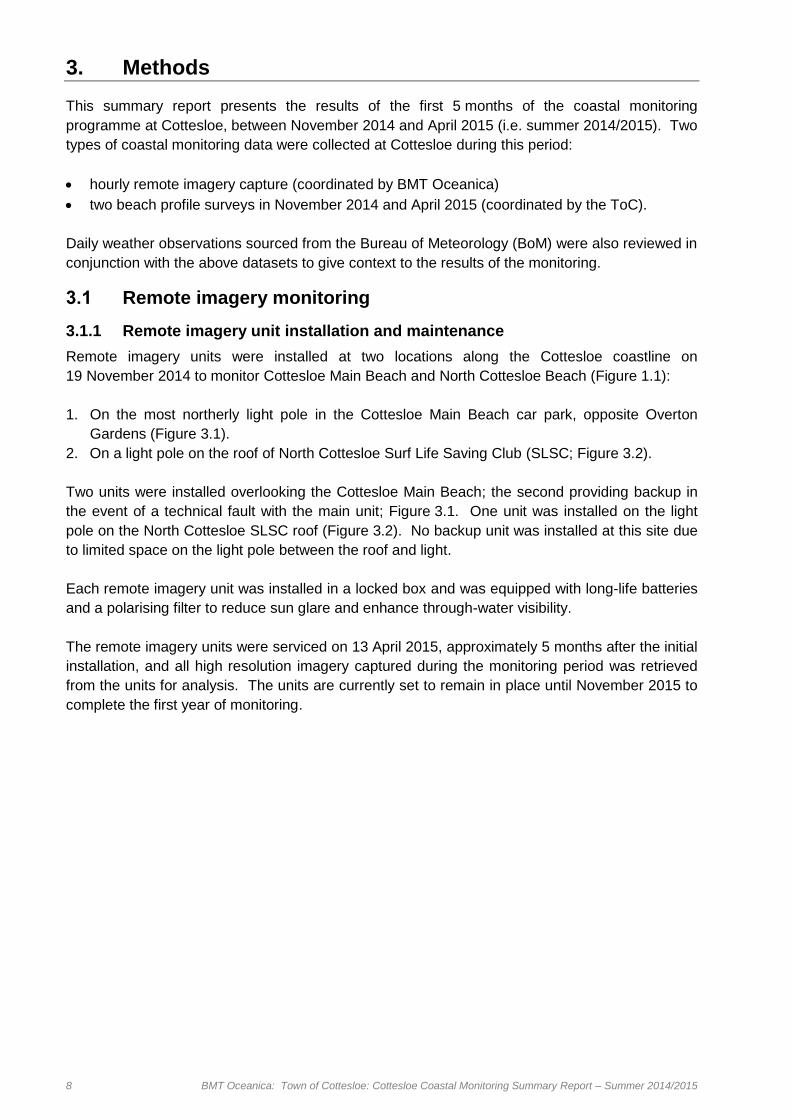
3. Methods
This summary report presents the results of the first 5 months of the coastal monitoring
programme at Cottesloe, between November 2014 and April 2015 (i.e. summer 2014/2015). Two
types of coastal monitoring data were collected at Cottesloe during this period:
hourly remote imagery capture (coordinated by BMT Oceanica)
two beach profile surveys in November 2014 and April 2015 (coordinated by the ToC).
Daily weather observations sourced from the Bureau of Meteorology (BoM) were also reviewed in
conjunction with the above datasets to give context to the results of the monitoring.
3.1 Remote imagery monitoring
3.1.1 Remote imagery unit installation and maintenance
Remote imagery units were installed at two locations along the Cottesloe coastline on
19 November 2014 to monitor Cottesloe Main Beach and North Cottesloe Beach (Figure 1.1):
1. On the most northerly light pole in the Cottesloe Main Beach car park, opposite Overton
Gardens (Figure 3.1).
2. On a light pole on the roof of North Cottesloe Surf Life Saving Club (SLSC; Figure 3.2).
Two units were installed overlooking the Cottesloe Main Beach; the second providing backup in
the event of a technical fault with the main unit; Figure 3.1. One unit was installed on the light
pole on the North Cottesloe SLSC roof (Figure 3.2). No backup unit was installed at this site due
to limited space on the light pole between the roof and light.
Each remote imagery unit was installed in a locked box and was equipped with long-life batteries
and a polarising filter to reduce sun glare and enhance through-water visibility.
The remote imagery units were serviced on 13 April 2015, approximately 5 months after the initial
installation, and all high resolution imagery captured during the monitoring period was retrieved
from the units for analysis. The units are currently set to remain in place until November 2015 to
complete the first year of monitoring.
BMT Oceanica: Town of Cottesloe: Cottesloe Coastal Monitoring Summary Report – Summer 2014/2015 9
Figure 3.1 Remote imagery unit installation on the light pole in the main beach car park,
opposite Overton Gardens
Figure 3.2 Remote imagery unit installation on the light pole on the North Cottesloe
Surf Life Saving Club roof
10 BMT Oceanica: Town of Cottesloe: Cottesloe Coastal Monitoring Summary Report – Summer 2014/2015
3.1.2 Remote image capture
Each remote imagery unit was programmed to capture high resolution (12 megapixels) imagery
every hour from 5:00 a.m. and 7:00 p.m. each day. The units were also programmed to transmit
one lower resolution (0.5 megapixels) image over the mobile phone network at ~12:00 noon each
day. These daily transmitted images were uploaded to a slide-show on a secure web portal,
which allowed the project team members to log in and view a timeline of coastal conditions at the
monitoring sites.
3.1.3 Remote imagery review and analysis
BMT Oceanica reviewed the lower-resolution daily imagery on the web portal each week to
ensure continued function (e.g. sufficient battery life), image quality (e.g. correct orientation, no
dirt or obstructions on the lens) and to observe any notable changes in beach morphology.
Notable observations were summarised during fortnightly phone calls and monthly email reports
to the ToC.
The hourly high resolution imagery retrieved from the remote imagery units on 13 April 2015 was
then reviewed in more detail and changes in beach morphology and metocean conditions during
the monitoring were qualitatively assessed.
3.2 Beach profile monitoring
3.2.1 Beach profile data collection
The ToC coordinated two beach profile surveys during the monitoring period:
1. a pre-summer survey undertaken by ToC staff over 17–19 November 2014
2. a post-summer survey undertaken by McGregor Surveys Pty Ltd over 1–7 April 2015.
During each survey, the elevation of the ground surface relative to Australian Height Datum
(AHD) was measured along 39 cross-shore transects using pole-mounted Real Time Kinematic
Global Positioning Systems (RTK GPS). Each profile was spaced ~100 m apart alongshore and
extended cross-shore from the kerb of Marine Parade to a location offshore with ~1 m water
depth (i.e. the limit of safe wading depth).
Along each transect, the ground surface elevation was measured at every significant change in
slope or feature, whilst attempting to ensure that the minimum horizontal distance between
survey points ('chainage') was 5 m and the minimum vertical elevation change between survey
points was 0.5 m. The horizontal accuracy for both surveys was within ±20 mm, and vertical
accuracy was within ±30 mm. The following data were collected at each survey point in addition
to ground surface elevation:
location coordinates (easting and northings)
date and time of measurement
horizontal and vertical measurement precision
survey 'code' which represented the ground surface features (e.g. sediment type,
morphological features, vegetation lines, human infrastructure etc.).
During the November 2014 survey, photographs were taken manually at each beach profile
facing north, south, east, and west. Photographs were not taken during the April 2015 survey
due to time constraints.
BMT Oceanica: Town of Cottesloe: Cottesloe Coastal Monitoring Summary Report – Summer 2014/2015 11
3.2.2 Beach profile data analysis
The elevation data were graphed against chainage for each profile from each of the two surveys
and the elevation differences between November 2014 and April 2015 were then qualitatively
assessed. The data were also plotted in ArcGIS to give a planform view of the beach profile
measurement locations.
The landward limit of the beach (LLB) was defined as the vegetation line or the base of the
dunes, cliffs or artificial structure at the back of the beach (determined using the survey codes),
and the LLB was marked on each profile graph. Only changes in elevation seaward of the LLB
were analysed, and all changes landward of LLB were assumed to be a result of profile
orientation differences between the surveys. Sub-aerial (dry) beach widths were assessed as the
distance between landward limit of the beach, and the point at which the profile met 0 m AHD (i.e.
mean sea level). Profiles were classified as stable if they exhibited <5 m change in sub-aerial
beach width and/or <0.5 m change in beach elevation. Profiles were classified as eroding or
accreting if they exhibited >5 m change in sub-aerial beach width and/or >0.5 m change in beach
elevation. Profiles with ≥20 m longshore distance between the November 2014 survey points
and the April 2015 survey points were not compared as the large difference in orientation
reduced the reliability of beach width comparisons.
3.3 Water level and weather observations
Local water level measurements during the monitoring period were reviewed alongside remote
imagery to examine potential links between nearshore hydrodynamics and beach morphology
changes. The most relevant water level data available were those measured at Fremantle,
~5 km south of Cottesloe. Only water level data between 1 Januaryand 31 March 2015 were
available at the time of analysis (pers. comm., Ms R Lowry, Senior Oceanographic Officer,
Department of Transport [DoT], 1 May 2015). For time periods when water level data were not
available, mean sea level pressure (MSLP) data were reviewed as a proxy for water levels.
MSLP has a direct influence on water levels, with lower MSLP usually generating higher water
levels.
It was originally intended that wave data from the DoT's Cottesloe wave buoy also be reviewed to
examine potential links between coastal hydrodynamics and beach morphology changes.
However, wave data from Cottesloe collected during the monitoring period was not available at
the time of analysis (pers. comm., Ms R Lowry, Senior Oceanographic Officer, DoT, 1 May 2015).
Instead, wind speed and direction data were reviewed as a proxy for wave data. Wind speed and
direction has a direct influence on wave height characteristics, with high-velocity onshore winds
generally causing larger, short-period waves. Wind speed and direction data was sourced from
the Swanbourne weather station (~4 km north from Cottesloe, and ~1 km from the coast) at
9:00 a.m. and 3:00 p.m. daily (BoM 2015). A key limitation of using only local wind conditions as
a proxy for wave data at the study site is that these proxies only indicate locally generated waves
and may not provide indication of waves that are generated by weather systems many kilometres
away and propagated to the Cottesloe coastline (i.e. swell waves).
12 BMT Oceanica: Town of Cottesloe: Cottesloe Coastal Monitoring Summary Report – Summer 2014/2015
4. Results
4.1 Remote imagery
4.1.1 Data quality
Hourly high-resolution imagery was successfully captured between 5:00 a.m. and 7:00 pm every
day between the initial installation on 19 November 2014 and the service visit on 13 April 2015, at
both monitoring sites. Lower-resolution imagery was successfully transmitted over the mobile
phone network on 94% of days between 19 November 2014 and 13 April 2015. Six percent of
daily transmissions were skipped, usually due to issues with the Telstra mobile phone network,
but this did not affect capture and storage of the hourly remote imagery.
4.1.2 General trends in beach morphology change
The remote imagery captured at Cottesloe Main Beach throughout the summer 2014/2015
monitoring period showed that the general trend of change in beach morphology was a gradual
landward recession of the shoreline, resulting in a decrease in beach width (Figure 4.1). The
curved section of beach adjacent to the rock groyne generally tended to erode faster than the
straighter section immediately to the north, resulting in a gradual increase in beach curvature at
the southern end, and gradual rotation of the shoreline in the northern section, from a north-south
orientation to a more north-west/south-east orientation.
Figure 4.1 Cottesloe Main Beach at 11:08 hrs on 19 November 2014, the day of remote
imagery unit installation (left) and at 11:44 hrs on 13 April 2015, the day of
the service visit (right)
The remote imagery captured at North Cottesloe Beach throughout the summer 2014/2015
monitoring period showed that the general trend of change in beach morphology was also a
gradual landward recession of the shoreline and decrease in beach width (Figure 4.2). The
shoreline gradually rotated from a north-south orientation to a more north-west/south-east
orientation, and acquired a concave curvature. Shoreline recession at North Cottesloe Beach
was generally more gradual than at Cottesloe Main Beach throughout the monitoring period.
BMT Oceanica: Town of Cottesloe: Cottesloe Coastal Monitoring Summary Report – Summer 2014/2015 13
Figure 4.2 North Cottesloe Beach at 17:08 hrs on 20 November 2014, the day after the
remote imagery unit installation (left) and at 17:09 hrs on 13 April 2015, the
day before the service visit (right)
4.1.3 Notable observations
In addition to the gradual trend of beach morphology change occurring over the monitoring period
(Section 4.1.2), there were some notable changes that occurred over shorter timescales.
An unusually high watermark on both beaches was observed in imagery captured on the morning
of the 22 November 2014. Localised depressions and mounds had formed on Cottesloe Main
Beach seaward of the watermark since the previous day (Figure 4.3). Review of the local
weather observations on that day and preceding days found that wind speeds and MSLP around
this were fairly average for this time of year (BoM 2015; Appendix A). Swell and water level data
may provide additional context to the driving forces behind this morphological change, however
none was available for this time period (see Section 3.3). High watermarks were observed on
other occasions throughout the monitoring period, but others did not reach as high as
22 November 2014 and were not associated with clearly visible changes in beach morphology.
14 BMT Oceanica: Town of Cottesloe: Cottesloe Coastal Monitoring Summary Report – Summer 2014/2015
Figure 4.3 Cottesloe Main Beach (top) and North Cottesloe Beach (bottom) ~06:00 hrs
on 21 November 2014 (left) and at ~06:00 hrs the following morning on
22 November 2014 (right)
On several occasions throughout the monitoring period, high-resolution imagery of Cottesloe
Main Beach indicated the development of 'scarping' in the beach sediment—the formation of low-
lying, near-vertical slopes near to the shoreline through accelerated cross-shore erosion during
high energy metocean conditions. This was particularly visible in imagery from December
(Figure 4.4), and was also evident in a news article photo regarding beach erosion at Cottesloe in
mid-March (Appendix B).
Figure 4.4 Close-up of the southern end of Cottesloe Main Beach on 6 December 2014
Weather observations between 26 January and 5 February 2015 indicated a prolonged period of
calm weather, with very little evidence of the afternoon sea breeze that typically occurs during
summer in Perth (BoM 2015; Appendix A). Water levels during this time period averaged at
0.87 m above Chart Datum (CD) which was slightly higher than the mean sea level of 0.75 m at
BMT Oceanica: Town of Cottesloe: Cottesloe Coastal Monitoring Summary Report – Summer 2014/2015 15
Fremantle (Appendix C) but was within one standard deviation from the average water level of
0.79 m between 1 January and 31 March 2015 (Appendix C). This period coincided with a
relative slowing of the shoreline recession rate along both Cottesloe Main Beach and North
Cottesloe Beach.
Remote imagery captured between 15 and 21 March 2015 indicated a prolonged period of rough
sea states and high water levels. The northern part of Cottesloe Main Beach appeared narrower
on 18 March 2015, compared to 5 days earlier (Figure 4.5). Review of daily weather
observations (BoM 2015; Appendix A) showed that MSLP on 17 and 18 March was lower than
average for the month (1008–1009 hPa), and water levels on 16 March were the second highest
of the available data, peaking at +1.37 m CD. This peak water level was greater than the highest
astronomical tide level at Fremantle (Appendix C) and was greater than three standard deviations
above the average water level between 1 January and 31 March 2015 of 0.79 m (Appendix C).
The maximum wind gust on the 18 March was the second highest of the month (48 km/h) from a
west-north-west direction. Rapid erosion of the beach on the 18 March 2015 led organisers of
the 'Sculptures by the Sea' exhibit to move some sculptures further from the shoreline
(Appendix B).
Figure 4.5 Cottesloe Main Beach at 15:08 hrs on 13 March (left) and at 15:07 hrs on
18 March 2015 (right)
Remote imagery captured on the 10 April 2015 indicated stormy conditions with high water levels
and a narrow beach compared to the previous day. Dark patches were evident near the
shoreline along both Cottesloe Main Beach and North Cottesloe Beach, which may have been
wrack or potentially the exposure of underlying rock (Figure 4.6). It was also evident that waves
had started to reach the steps at the base of the Indiana Restaurant building. Wave and water
level data were were not available for this time period, but review of daily weather observations
for 10 April 2015 (BoM 2015; Appendix A) showed that MSLP that day was the lowest of the
month (1010.7 hPa) and the maximum wind gust that day was the highest of the month
(56 km/h), from a northerly direction.
16 BMT Oceanica: Town of Cottesloe: Cottesloe Coastal Monitoring Summary Report – Summer 2014/2015
Figure 4.6 Cottesloe Main Beach (top) and North Cottesloe Beach (bottom) at
~17:10 hrs on 9 April (left) and 10 April (right) 2015
4.2 Beach profile data
The beach profile data were graphed to enable visual assessment of beach elevation changes
between November 2014 and April 2015 (Appendix D). The quality of the beach profile data and
a comparison of beach elevation changes between the two surveys are described in the sections
below.
4.2.1 Data quality
The November 2014 beach profile data had high spatial resolution cross-shore, with <5 m
horizontal spacing and <0.5 m vertical spacing between survey points. There did not appear to
be any outliers or errors in the elevation measurements. Ideally, beach profiles should be straight
and orientated shore-normal (i.e. perpendicular to the shoreline) along their entire length;
however some November 2014 profiles were not entirely straight along their entire length and
some were not shore-normal. The profiles that were not straight and/or shore-normal may not
have accurately represented the beach morphology at the time of the survey; for example,
profiles that intersect the shoreline diagonally can over-represent the width of the beach.
The April 2015 beach profiles appeared to be straight and shore-normal along most profiles.
However, this meant that some April 2015 profiles did not directly overlie the November 2014
profiles, and therefore they were not directly comparable (Table 4.1, Figure 4.7). Profiles 1, 2 7,
18 and 19 were deemed not comparable between the two surveys, and other profiles have been
compared despite slight profile offset, which introduces limitations into the analysis. The
correction of the profile orientation at this early stage in the long-term monitoring programme was
deemed beneficial for comparison of future measurements. The cross-shore resolution of the
April 2015 profile measurements was lower than that of the November 2014 survey, with
BMT Oceanica: Town of Cottesloe: Cottesloe Coastal Monitoring Summary Report – Summer 2014/2015 17
horizontal spacing between survey points often exceeding 5 m and vertical spacing between
survey points of up to 13 m. There appeared to be one outlier in the elevation measurements
along profile 2, representing a ~4 m dip in elevation at the base of the dune/cliff (Appendix D).
This may be a genuine feature of the beach, but this cannot be confirmed as no photographs
were captured during the April 2015 survey.
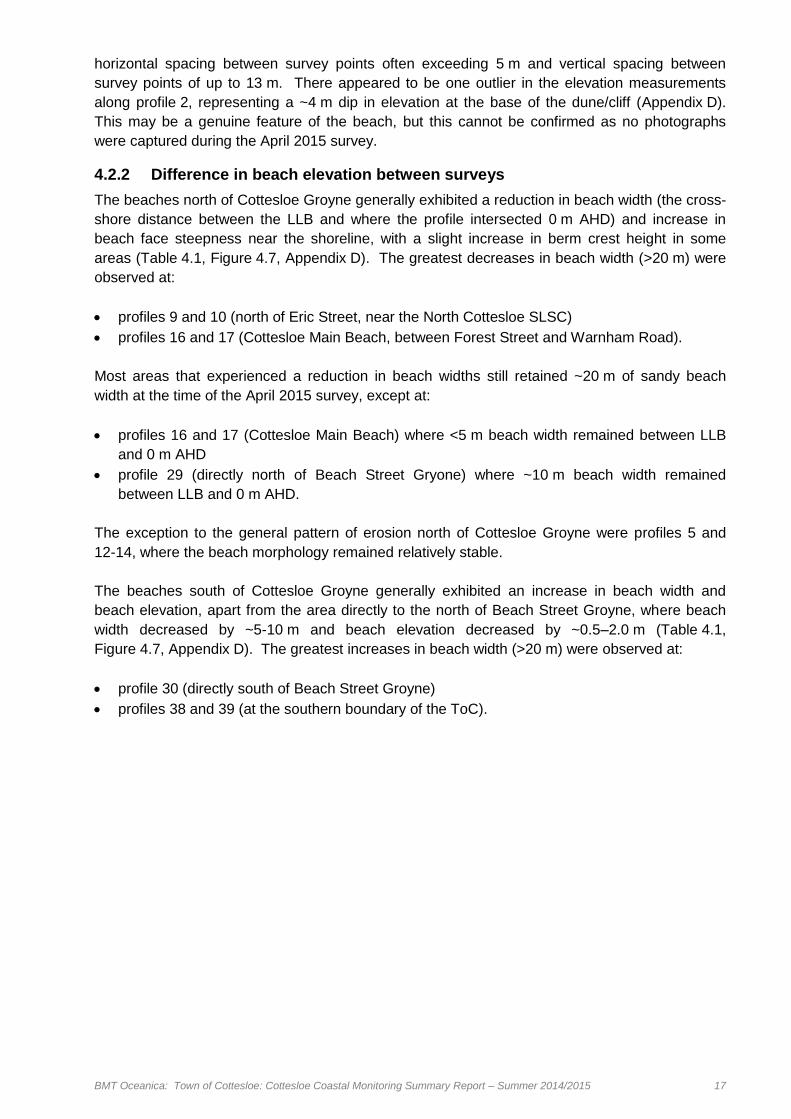
4.2.2 Difference in beach elevation between surveys
The beaches north of Cottesloe Groyne generally exhibited a reduction in beach width (the cross-
shore distance between the LLB and where the profile intersected 0 m AHD) and increase in
beach face steepness near the shoreline, with a slight increase in berm crest height in some
areas (Table 4.1, Figure 4.7, Appendix D). The greatest decreases in beach width (>20 m) were
observed at:
profiles 9 and 10 (north of Eric Street, near the North Cottesloe SLSC)
profiles 16 and 17 (Cottesloe Main Beach, between Forest Street and Warnham Road).
Most areas that experienced a reduction in beach widths still retained ~20 m of sandy beach
width at the time of the April 2015 survey, except at:
profiles 16 and 17 (Cottesloe Main Beach) where <5 m beach width remained between LLB
and 0 m AHD
profile 29 (directly north of Beach Street Gryone) where ~10 m beach width remained
between LLB and 0 m AHD.
The exception to the general pattern of erosion north of Cottesloe Groyne were profiles 5 and
12-14, where the beach morphology remained relatively stable.
The beaches south of Cottesloe Groyne generally exhibited an increase in beach width and
beach elevation, apart from the area directly to the north of Beach Street Groyne, where beach
width decreased by ~5-10 m and beach elevation decreased by ~0.5–2.0 m (Table 4.1,
Figure 4.7, Appendix D). The greatest increases in beach width (>20 m) were observed at:
profile 30 (directly south of Beach Street Groyne)
profiles 38 and 39 (at the southern boundary of the ToC).

BMT Oceanica: Town of Cottesloe: Cottesloe Coastal Monitoring Summary Report – Summer 2014/2015 19
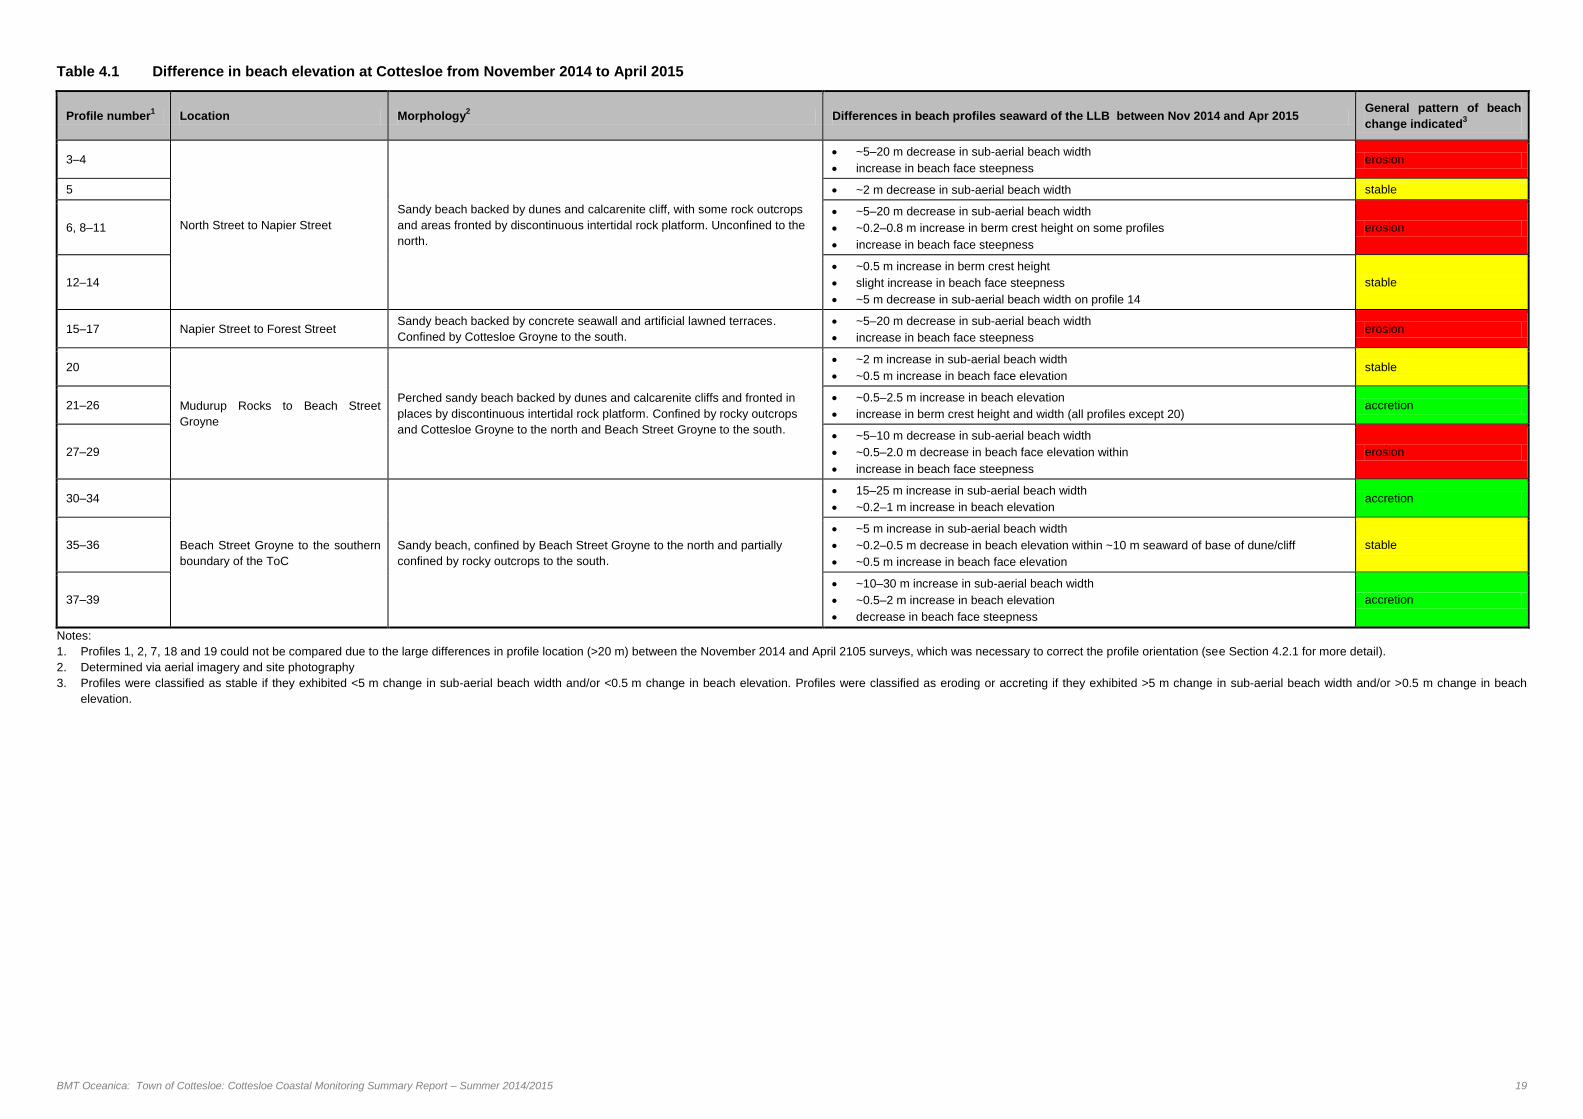
Table 4.1 Difference in beach elevation at Cottesloe from November 2014 to April 2015
Profile number1 Location Morphology
2 Differences in beach profiles seaward of the LLB between Nov 2014 and Apr 2015
General pattern of beach
change indicated3
3–4
North Street to Napier Street
Sandy beach backed by dunes and calcarenite cliff, with some rock outcrops
and areas fronted by discontinuous intertidal rock platform. Unconfined to the
north.
~5–20 m decrease in sub-aerial beach width
increase in beach face steepness erosion
5 ~2 m decrease in sub-aerial beach width stable
6, 8–11
~5–20 m decrease in sub-aerial beach width
~0.2–0.8 m increase in berm crest height on some profiles
increase in beach face steepness
erosion
12–14
~0.5 m increase in berm crest height
slight increase in beach face steepness
~5 m decrease in sub-aerial beach width on profile 14
stable
15–17 Napier Street to Forest Street Sandy beach backed by concrete seawall and artificial lawned terraces.
Confined by Cottesloe Groyne to the south.
~5–20 m decrease in sub-aerial beach width
increase in beach face steepness erosion
20
Mudurup Rocks to Beach Street
Groyne
Perched sandy beach backed by dunes and calcarenite cliffs and fronted in
places by discontinuous intertidal rock platform. Confined by rocky outcrops
and Cottesloe Groyne to the north and Beach Street Groyne to the south.
~2 m increase in sub-aerial beach width
~0.5 m increase in beach face elevation stable
21–26 ~0.5–2.5 m increase in beach elevation
increase in berm crest height and width (all profiles except 20) accretion
27–29
~5–10 m decrease in sub-aerial beach width
~0.5–2.0 m decrease in beach face elevation within
increase in beach face steepness
erosion
30–34
Beach Street Groyne to the southern
boundary of the ToC
Sandy beach, confined by Beach Street Groyne to the north and partially
confined by rocky outcrops to the south.
15–25 m increase in sub-aerial beach width
~0.2–1 m increase in beach elevation accretion
35–36
~5 m increase in sub-aerial beach width
~0.2–0.5 m decrease in beach elevation within ~10 m seaward of base of dune/cliff
~0.5 m increase in beach face elevation
stable
37–39
~10–30 m increase in sub-aerial beach width
~0.5–2 m increase in beach elevation
decrease in beach face steepness
accretion
Notes:
1. Profiles 1, 2, 7, 18 and 19 could not be compared due to the large differences in profile location (>20 m) between the November 2014 and April 2105 surveys, which was necessary to correct the profile orientation (see Section 4.2.1 for more detail).
2. Determined via aerial imagery and site photography
3. Profiles were classified as stable if they exhibited <5 m change in sub-aerial beach width and/or <0.5 m change in beach elevation. Profiles were classified as eroding or accreting if they exhibited >5 m change in sub-aerial beach width and/or >0.5 m change in beach
elevation.


BMT Oceanica: Town of Cottesloe: Cottesloe Coastal Monitoring Summary Report – Summer 2014/2015 21
Figure 4.7 Remote imagery monitoring sites and beach profiles measured at Cottesloe
during the summer 2014/215 monitoring period
22 BMT Oceanica: Town of Cottesloe: Cottesloe Coastal Monitoring Summary Report – Summer 2014/2015
5. Discussion and Recommendations
5.1 Discussion
Change in beach morphology along the Cottesloe coastline from November 2014 to April 2015
appeared to be generally characterised by erosion of the northern beaches and Cottesloe Main
Beach, and accretion of the southern beaches (apart from a small area of erosion directly north of
Beach Street Groyne). This pattern was likely attributable to net northward longshore sand
transport in summer (driven by predominant south-south-westerly winds) being interrupted by
cross-shore features such as Beach Street Groyne and Cottesloe Groyne/Mudurup Rocks. This
causes accumulation of sand updrift (i.e. to the south) and erosion of sand downdrift (i.e. to the
north) of these structures, similar to the observations of Kempin (1952; cited in
CZM & Damara 2008; Section 2.1.4). This explanation was supported by the observations that
the greatest increase in beach width was observed directly south of the Beach Street Groyne,
and the areas experiencing the greatest decrease in beach width were directly north of Beach
Street Groyne and Cottesloe Groyne.
Erosion generally occurred via a reduction in beach width and increase in beach face steepness,
with an increase in berm crest height along some profiles. Accretion generally occurred via an
increase in beach width and an increase in berm crest height along some profiles. Increases in
beach face steepness and berm height may have been attributable to the action of summer swell,
as suggested by Silvester (1961).
It should be noted that beach profile measurements do not extend offshore to 'the depth of
closure' (the seaward limit of significant beach profile fluctuations), which is ideally required to
ensure sediment exchanges across the full width of the active zone are accounted for during the
analysis. However, this requires boat-based survey equipment which was beyond the scope of
this project. Therefore, profile changes seaward of ~1 m water depth at the time of the surveys
could not be measured, which limits the assessment of local coastal sediment transport
dynamics.
The slowing of the shoreline recession rate at Cottesloe Main Beach and North Cottesloe during
a period of relatively little sea breeze activity (as observed during late January/early
February 2015; Section 4.1.3), and the acceleration of shoreline recession during storm events
from the north (as observed during mid-March 2015 and 10 April; Section 4.1.3), indicated that:
During ambient summer conditions, predominant south-south-westerly seabreezes resulted in
beach erosion to the north of cross-shore structures, due to sediment being transported
northward by longshore transport and not being replaced from the south due to blocking of
longshore transport by the cross-shore structures.
During storm conditions, northerly winds resulted in accelerated erosion to the north of cross-
shore structures, as these areas were particularly exposed to northerly waves. The northerly
storm conditions caused loss of sand from these areas rather than transportation of sand into
these areas because offshore sediment transport tends to dominate during storms rather than
longshore sediment transport.
This suggests that calm northerly conditions occurring during winter may lead to beach accretion
at Cottesloe Main Beach and North Cottesloe via trapping of southward longshore sediment
transport by the Cottesloe Groyne; but stormy northerly conditions during winter may lead to
erosion of these exposed areas, via offshore sediment transport.
BMT Oceanica: Town of Cottesloe: Cottesloe Coastal Monitoring Summary Report – Summer 2014/2015 23
Accelerated morphological change at Cottesloe Main Beach may have been linked to high water
levels associated with storms during summer 2014/2015, particularly during the stormy period in
mid-March (Section 4.1.3). However, changes in beach morphology were also observed after
high water levels that were not associated with local storm events, for example the high water
mark on 22 November 2014 (Section 4.1.3), which instead may have been attributable to large
wave runup from long-range swell waves. However, it was not possible to confirm this due to the
lack of available wave and water level data during this time period.
As the general pattern of beach change at Cottesloe over summer 2014/2015 was mainly related
to seasonal northward sediment transport direction, it is likely that a sediment transport direction
reversal during winter (southward, as per Kempin 1952) will result in some accretion in previously
eroded areas. However, episodic beach erosion may also occur in these areas during winter due
to offshore sediment transport during more frequent and/or intense storms (as observed by
Silvester 1961; Section 2.1.4). A full year of monitoring is required to fully assess the cyclic
nature of beach morphology changes over the seasons and to determine potential areas of
concern from a coastal management perspective.
Based solely on the erosion observed during summer 2014/2015, Cottesloe Main Beach may be
an area requiring further attention in future for the following reasons:
Reduction in beach width reduces beach amenity and restricts the space available for beach-
goers at this popular location.
Scarping of beach sediment and exposure of rock near the shoreline (as observed in remote
imagery; Section 4.1.3) may pose a safety hazard to beach-goers and swimmers.
Periods of accelerated erosion may affect the 'Sculptures by the Sea' exhibit in future
summers, as occurred in mid-March 2015 when some sculptures had to be moved further
from the shoreline to avoid being damaged due to beach erosion (see news article in
Appendix B).
Loss of the beach fronting the Indiana Restaurant may lead to storm waves breaking onto the
building, risking damage to the structure.
The following areas of beach may also require further attention in the event of more severe
erosion in future summers, based on the high rates of erosion observed here in summer
2014/2015 and/or relatively small width of beach remaining in April 2015:
in front of the North Cottesloe SLSC
directly north of Beach Street Groyne.
The relative coastal vulnerability of each of these areas depends on the characteristics of the
backshore. Backshores with high rocky cliffs (e.g. directly north of Beach Street Groyne) may be
less vulnerable than areas with lower-lying backshores with infrastructure close to the beach (e.g.
Cottesloe Main Beach and in front of North Cottesloe SLSC).
24 BMT Oceanica: Town of Cottesloe: Cottesloe Coastal Monitoring Summary Report – Summer 2014/2015
5.2 Recommendations
Based on the results of the summer 2014/2015 coastal monitoring it is recommended that the
monitoring programme be continued beyond the first year of monitoring (ending in
November 2015), to build understanding of both seasonal and inter-annual changes in beach
morphology at Cottesloe. The ToC may also wish to consider the following specific
recommendations for future monitoring:
deploy additional remote imagery units to allow real-time monitoring of other potentially
vulnerable areas such as around Beach Street Groyne and North Street
implement post-storm beach profile monitoring, to help build understanding of how Cottesloe
beaches respond to certain extreme conditions
limit the landward extent of beach profile surveys to ~20 m landward of the LLB, until any
major changes to the backshore occur (i.e. construction of new coastal infrastructure) to save
time and cost. Costs saved here could be used to fund other improvements to the monitoring
(e.g. deployment of extra cameras or post-storm monitoring)
ensure future beach profiles survey follow the transects surveyed during the April 2015
survey, as all of these profiles have the correct shore-normal orientation
ensure future beach profile surveys capture elevation measurements within ~1 m either side
(alongshore) of the April 2015 transects, to optimise the comparability of profiles between
surveys
ensure during future beach profile surveys that the minimum horizontal distance between
survey points is ~5 m and the minimum vertical elevation change between survey points is
~0.5 m, to guarantee the full shape of the profile is captured.
extend beach profile measurements to the depth of closure using boat-based survey
equipment to allow assessment of sediment exchanges across the full width of the active
profile and a more comprehensive understanding of seasonal beach profile fluctuations
analyse beach volume changes using beach profile and geotechnical data, to allow
quantification of sediment transport rates which may assist any further assessments of
coastal vulnerability.
At some stage, the ToC may also wish to consider monitoring beach sediment particle size,
nearshore current speeds/directions, and estimating coastal sediment transport rates, to address
the present knowledge gaps identified by the literature review (Section 2.3). However, it is
recommended that collection of further data be directly relevant to the objectives of future coastal
studies.
BMT Oceanica: Town of Cottesloe: Cottesloe Coastal Monitoring Summary Report – Summer 2014/2015 25
6. References
Beachsafe (2015) Cottesloe Beach. Available from http://beachsafe.org.au/beach/wa0839>
[Accessed 13 January 2015]
BoM (2015) Climate Data Online – Swanbourne, Western Australia, Daily Weather Observations.
Available from <http://www.bom.gov.au/climate/data/> [Accessed 14 April 2015]
Bowyer J (1987) Photogrammetric Techniques for the Assessment of Shoreline Variability
Between North Mole, Fremantle and Trigg Island, 1955 to 1985. Unpublished Honours
Thesis, University of Western Australia
CZM, Damara (2008) Vulnerability of the Cottesloe Foreshore to the Potential Impacts of Climate
Change. Prepared for Town of Cottesloe by Coastal Zone Management Pty Ltd and
Damara WA Pty Ltd, Perth, Western Australia, June 2008
Eliot IG, Clarke DJ (1986) Minor Storm Impact on the Beachface of a Sheltered Sandy Beach.
Marine Geology, 73, 1-2, pp 61-83
DoD (2005) Australian National Tide Tables: Australia, Papua and New Guinea for 2005.
Department of Defence, Royal Australian Navy
DPI (2004) Port Beach Coastal Erosion Study. Department for Planning and Infrastructure,
Technical Report, Report No. 427, Perth, Western Australia
GBGMaps (2010) Geophysical Investigation for Subsurface Lithology Along the Foreshore of
Cottesloe Beach, Cottesloe, Western Australia. Prepared for the Town of Cottesloe by
GBGMAPS Pty Ltd, Report No. 70096, Perth, Western Australia, January 2010
GBGMaps (2011) Ground Penetrating Radar Investigation for Subsurface Lithology Along Marine
Parade, Cottesloe, Western Australia. Prepared for the Town of Cottesloe by GBGMAPS
Pty Ltd, Perth, Western Australia, June 2011
Gentilli J (1972) Australian Climate Patterns. Thomas Nelson, Melbourne
Haigh ID, Eliot M, Pattiaratchi C, Wahl T (2011) Regional changes in mean sea level around
Western Australia between 1897 and 2008. Coasts & Ports, Perth, Western Australia
Hegge B (1994) Low-energy sandy beaches of Southwestern Australia: two-dimensional
morphology, sediments and dynamics. PhD Thesis, University of Western Australia,
Perth, Western Australia
Kempin ET (1952) Beach sand movements at Cottesloe, Western Australia. Journal of the Royal
Society of Western Australia, 37, pp 35-58
Lemm A (1996) Offshore Wave Climate, Perth, Western Australia. Unpublished Honours Thesis,
University of Western Australia
Lemm A, Hegge B, Masselink G (1999) Offshore wave climate, Perth (Western Australia) 1994-
96. Marine and Freshwater Research, 50, 2, pp 95-102
Masselink G, Pattiaratchi C (2001) Seasonal changes in beach morphology along the sheltered
coastline of Perth, Western Australia. Marine Geology, 172, 3-4, pp 243-263
Olsson D (2004) Field Studies of Rip Currents in the Lee of Coastal Structures. Research Thesis
prepared for Bachelor of Engineering (Applied Ocean Science) from The Centre for Water
Research, Faculty of Engineering Mathematics and Computing, University of Western
Australia, Perth, Western Australia, November 2004
26 BMT Oceanica: Town of Cottesloe: Cottesloe Coastal Monitoring Summary Report – Summer 2014/2015
Pattiaratchi C, Hegge B, Gould J, Eliot I (1997) Impact of sea-breeze activity on nearshore and
foreshore processes in southwestern Australia. Continental Shelf Research, 17,
pp 1539-1560
Sanderson PG, Eliot I, Hegge B, Maxwell S (2000) Regional variation of coastal morphology in
southwestern Australia: a synthesis. Geomorphology, 34, 1-2, pp 73-88
Searle P, Semeniuk V (1985) The natural sectors of the inner Rottnest Shelf coast adjoining the
Swan Coastal Plain. Journal of the Royal Society of Western Australia, 67, 3-4,
pp 116-136
Silvester R (1961) Beach erosion at Cottesloe, WA. In: Proceedings of the Engineering
Conference, Melbourne, Victoria
Stul T (2005) Physical Characteristics of Perth Beaches, Western Australia. BSc (Hons),
University of Western Australia, Perth, Western Australia
Stul T, Gozzard JR, Eliot IG, Eliot MJ (2012) Coastal Sediment Cells between Cape Naturaliste
and the Moore River, Western Australia. Prepared for the Department of Transport by
Damara WA Pty Ltd and Geological Survey of Western Australia, Perth, Western
Australia.
Velardo S (1998) Patrolled Sandy Beaches of Southwestern Australia: Characteristic Morphology
and Public Hazards, Unpublished Honours Thesis, University of Western Australia.
WAPC (1999) Coastal and Lakelands Planning Strategy: Dawesville – Binningup. Western
Australia Planning Commission, Perth, Western Australia, February 1999
WAPC (2013) State Planning Policy No 2.6 – State Coastal Planning Policy. Prepared for
Department of Planning by Western Australia Planning Commission, Perth, Western
Australia, July 2013
Appendix A
Daily weather observations November 2015–April 2015

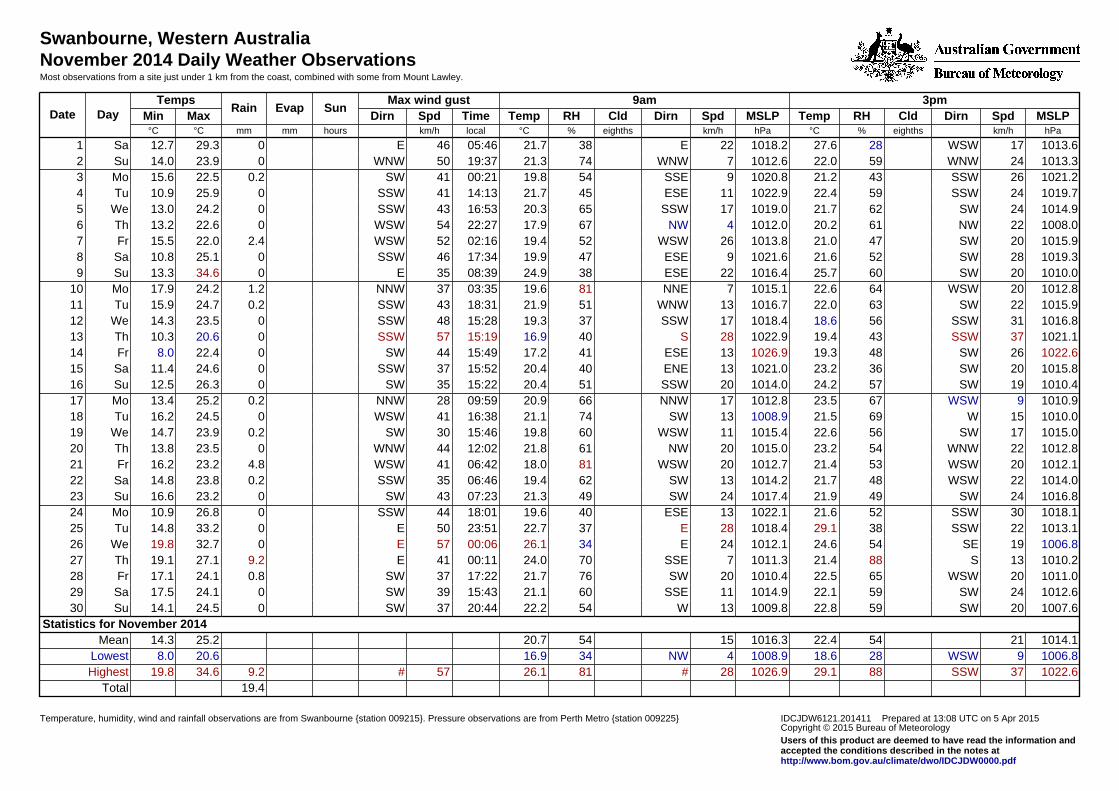
Swanbourne, Western AustraliaNovember 2014 Daily Weather ObservationsMost observations from a site just under 1 km from the coast, combined with some from Mount Lawley.
IDCJDW6121.201411 Prepared at 13:08 UTC on 5 Apr 2015Copyright © 2015 Bureau of MeteorologyUsers of this product are deemed to have read the information andaccepted the conditions described in the notes athttp://www.bom.gov.au/climate/dwo/IDCJDW0000.pdf
Temperature, humidity, wind and rainfall observations are from Swanbourne {station 009215}. Pressure observations are from Perth Metro {station 009225}
3pm9amMax wind gustSunEvapRain
TempsDayDate MSLPSpdDirnCldRHTempMSLPSpdDirnCldRHTempTimeSpdDirnMaxMin
hPakm/heighths%°ChPakm/heighths%°Clocalkm/hhoursmmmm°C°C
1013.617WSW2827.61018.222E3821.705:4646E029.312.7Sa11013.324WNW5922.01012.67WNW7421.319:3750WNW023.914.0Su21021.226SSW4321.21020.89SSE5419.800:2141SW0.222.515.6Mo31019.724SSW5922.41022.911ESE4521.714:1341SSW025.910.9Tu41014.924SW6221.71019.017SSW6520.316:5343SSW024.213.0We51008.022NW6120.21012.04NW6717.922:2754WSW022.613.2Th61015.920SW4721.01013.826WSW5219.402:1652WSW2.422.015.5Fr71019.328SW5221.61021.69ESE4719.917:3446SSW025.110.8Sa81010.020SW6025.71016.422ESE3824.908:3935E034.613.3Su91012.820WSW6422.61015.17NNE8119.603:3537NNW1.224.217.9Mo101015.922SW6322.01016.713WNW5121.918:3143SSW0.224.715.9Tu111016.831SSW5618.61018.417SSW3719.315:2848SSW023.514.3We121021.137SSW4319.41022.928S4016.915:1957SSW020.610.3Th131022.626SW4819.31026.913ESE4117.215:4944SW022.48.0Fr141015.820SW3623.21021.013ENE4020.415:5237SSW024.611.4Sa151010.419SW5724.21014.020SSW5120.415:2235SW026.312.5Su161010.99WSW6723.51012.817NNW6620.909:5928NNW0.225.213.4Mo171010.015W6921.51008.913SW7421.116:3841WSW024.516.2Tu181015.017SW5622.61015.411WSW6019.815:4630SW0.223.914.7We191012.822WNW5423.21015.020NW6121.812:0244WNW023.513.8Th201012.120WSW5321.41012.720WSW8118.006:4241WSW4.823.216.2Fr211014.022WSW4821.71014.213SW6219.406:4635SSW0.223.814.8Sa221016.824SW4921.91017.424SW4921.307:2343SW023.216.6Su231018.130SSW5221.61022.113ESE4019.618:0144SSW026.810.9Mo241013.122SSW3829.11018.428E3722.723:5150E033.214.8Tu251006.819SE5424.61012.124E3426.100:0657E032.719.8We261010.213S8821.41011.37SSE7024.000:1141E9.227.119.1Th271011.020WSW6522.51010.420SW7621.717:2237SW0.824.117.1Fr281012.624SW5922.11014.911SSE6021.115:4339SW024.117.5Sa291007.620SW5922.81009.813W5422.220:4437SW024.514.1Su30
Statistics for November 20141014.1215422.41016.3155420.725.214.3Mean1006.89WSW2818.61008.94NW3416.920.68.0Lowest1022.637SSW8829.11026.928#8126.157#9.234.619.8Highest
19.4Total

Swanbourne, Western AustraliaDecember 2014 Daily Weather ObservationsMost observations from a site just under 1 km from the coast, combined with some from Mount Lawley.
IDCJDW6121.201412 Prepared at 13:08 UTC on 4 Apr 2015Copyright © 2015 Bureau of MeteorologyUsers of this product are deemed to have read the information andaccepted the conditions described in the notes athttp://www.bom.gov.au/climate/dwo/IDCJDW0000.pdf
Temperature, humidity, wind and rainfall observations are from Swanbourne {station 009215}. Pressure observations are from Perth Metro {station 009225}
3pm9amMax wind gustSunEvapRain
TempsDayDate MSLPSpdDirnCldRHTempMSLPSpdDirnCldRHTempTimeSpdDirnMaxMin
hPakm/heighths%°ChPakm/heighths%°Clocalkm/hhoursmmmm°C°C
1008.424WSW6422.21008.920SW6420.321:4741SSW024.317.4Mo11010.322SW4722.11014.815E4620.010:5537ENE026.313.7Tu21010.326SW5522.91010.37NE3323.322:3744SSW025.314.1We31014.828SW5722.81017.015SSE4422.314:0143SW024.114.2Th41014.015SSW5822.61016.619E5920.019:1635S026.116.0Fr51011.526SW6423.31014.16SSE4824.216:4435SSW0.226.014.8Sa61007.520SW6024.61010.69ENE4625.018:1835SSW026.615.5Su71010.033SW5822.71010.030SSW6122.219:2756SSW025.118.1Mo81016.633SSW4421.81017.715S5417.816:3456SSW022.612.2Tu91017.830SW4922.51022.015E3819.614:5641SW027.412.0We101010.924SSW5626.11015.826E3925.707:5646E032.916.7Th111013.233SSW5722.31013.031SSW6522.115:2959SW024.418.9Fr121015.531SSW5321.91019.311SSE4520.514:5150SSW023.312.5Sa131012.228SW5222.01015.413SW4320.815:5048SSW023.811.9Su141012.426SW5423.11013.617WSW5420.615:3041SW024.414.9Mo151011.922SW4521.61014.99E4420.318:0635SSW023.112.1Tu161011.830SSW4921.51013.413SSE3821.418:0852SSW023.412.6We171013.828SSW5723.41017.319E4222.814:1341SSW030.814.4Th181007.226SSW5626.61012.522E2929.618:2043SSW038.816.3Fr191008.530SW5924.51008.126SW7022.716:1561SSW025.820.3Sa201014.428SSW5724.51017.417SE4423.417:3850SSW027.515.0Su211014.530SSW5524.81017.27SE4925.116:3446SSW027.016.4Mo221015.217SW3930.61018.322ESE4223.223:0150ESE034.416.1Tu231015.933SSW5524.91019.015ESE4224.117:5846SSW031.817.0We241018.224SSW5625.51021.719ESE2624.401:2043ESE033.315.9Th251015.628SSW4426.01020.820E3723.414:5539SSW033.414.8Fr261013.724SSW5126.81016.817NE2429.015:0839SSW033.519.0Sa271015.124SW5925.71016.811S3626.716:0843SSW028.117.2Su281013.130SSW4926.41016.615ESE3427.613:1344SSW034.818.6Mo291008.119WSW6226.91009.622NE1534.708:3144NE037.019.8Tu301010.528SSW5625.11012.415S6323.714:0246SW026.019.5We31
Statistics for December 20141012.7265424.11015.2164423.428.115.7Mean1007.215SSW3921.51008.16SSE1517.822.611.9Lowest1018.233#6430.61022.031SSW7034.761SSW0.238.820.3Highest
0.2Total
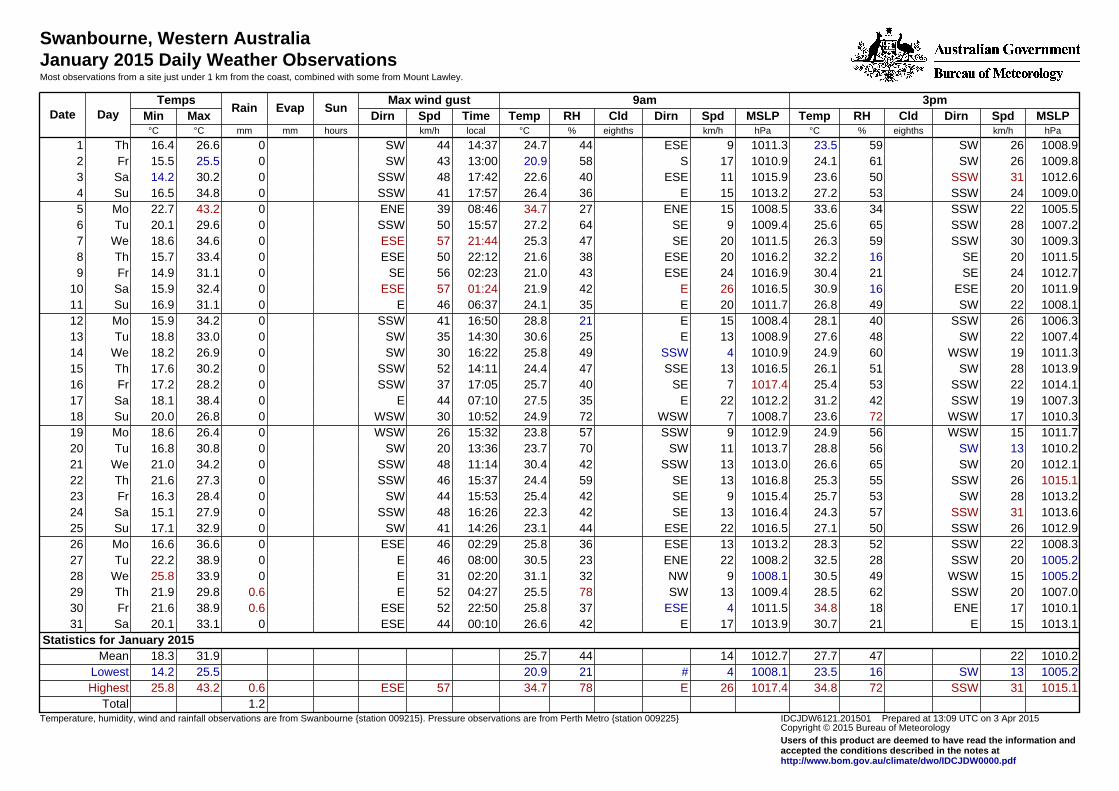
Swanbourne, Western AustraliaJanuary 2015 Daily Weather ObservationsMost observations from a site just under 1 km from the coast, combined with some from Mount Lawley.
IDCJDW6121.201501 Prepared at 13:09 UTC on 3 Apr 2015Copyright © 2015 Bureau of MeteorologyUsers of this product are deemed to have read the information andaccepted the conditions described in the notes athttp://www.bom.gov.au/climate/dwo/IDCJDW0000.pdf
Temperature, humidity, wind and rainfall observations are from Swanbourne {station 009215}. Pressure observations are from Perth Metro {station 009225}
3pm9amMax wind gustSunEvapRain
TempsDayDate MSLPSpdDirnCldRHTempMSLPSpdDirnCldRHTempTimeSpdDirnMaxMin
hPakm/heighths%°ChPakm/heighths%°Clocalkm/hhoursmmmm°C°C
1008.926SW5923.51011.39ESE4424.714:3744SW026.616.4Th11009.826SW6124.11010.917S5820.913:0043SW025.515.5Fr21012.631SSW5023.61015.911ESE4022.617:4248SSW030.214.2Sa31009.024SSW5327.21013.215E3626.417:5741SSW034.816.5Su41005.522SSW3433.61008.515ENE2734.708:4639ENE043.222.7Mo51007.228SSW6525.61009.49SE6427.215:5750SSW029.620.1Tu61009.330SSW5926.31011.520SE4725.321:4457ESE034.618.6We71011.520SE1632.21016.220ESE3821.622:1250ESE033.415.7Th81012.724SE2130.41016.924ESE4321.002:2356SE031.114.9Fr91011.920ESE1630.91016.526E4221.901:2457ESE032.415.9Sa101008.122SW4926.81011.720E3524.106:3746E031.116.9Su111006.326SSW4028.11008.415E2128.816:5041SSW034.215.9Mo121007.422SW4827.61008.913E2530.614:3035SW033.018.8Tu131011.319WSW6024.91010.94SSW4925.816:2230SW026.918.2We141013.928SW5126.11016.513SSE4724.414:1152SSW030.217.6Th151014.122SSW5325.41017.47SE4025.717:0537SSW028.217.2Fr161007.319SSW4231.21012.222E3527.507:1044E038.418.1Sa171010.317WSW7223.61008.77WSW7224.910:5230WSW026.820.0Su181011.715WSW5624.91012.99SSW5723.815:3226WSW026.418.6Mo191010.213SW5628.81013.711SW7023.713:3620SW030.816.8Tu201012.120SW6526.61013.013SSW4230.411:1448SSW034.221.0We211015.126SSW5525.31016.813SE5924.415:3746SSW027.321.6Th221013.228SW5325.71015.49SE4225.415:5344SW028.416.3Fr231013.631SSW5724.31016.413SE4222.316:2648SSW027.915.1Sa241012.926SSW5027.11016.522ESE4423.114:2641SW032.917.1Su251008.322SSW5228.31013.213ESE3625.802:2946ESE036.616.6Mo261005.220SSW2832.51008.222ENE2330.508:0046E038.922.2Tu271005.215WSW4930.51008.19NW3231.102:2031E033.925.8We281007.020SSW6228.51009.413SW7825.504:2752E0.629.821.9Th291010.117ENE1834.81011.54ESE3725.822:5052ESE0.638.921.6Fr301013.115E2130.71013.917E4226.600:1044ESE033.120.1Sa31
Statistics for January 20151010.2224727.71012.7144425.731.918.3Mean1005.213SW1623.51008.14#2120.925.514.2Lowest1015.131SSW7234.81017.426E7834.757ESE0.643.225.8Highest
1.2Total
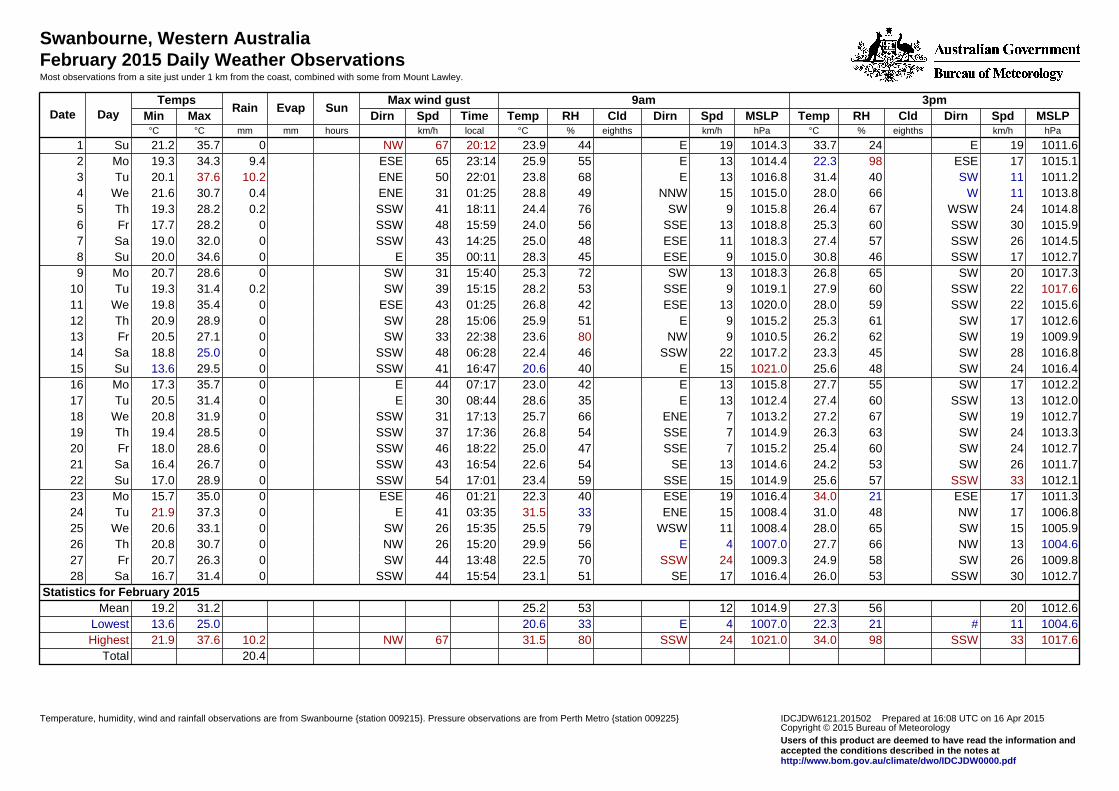
Swanbourne, Western AustraliaFebruary 2015 Daily Weather ObservationsMost observations from a site just under 1 km from the coast, combined with some from Mount Lawley.
IDCJDW6121.201502 Prepared at 16:08 UTC on 16 Apr 2015Copyright © 2015 Bureau of MeteorologyUsers of this product are deemed to have read the information andaccepted the conditions described in the notes athttp://www.bom.gov.au/climate/dwo/IDCJDW0000.pdf
Temperature, humidity, wind and rainfall observations are from Swanbourne {station 009215}. Pressure observations are from Perth Metro {station 009225}
3pm9amMax wind gustSunEvapRain
TempsDayDate MSLPSpdDirnCldRHTempMSLPSpdDirnCldRHTempTimeSpdDirnMaxMin
hPakm/heighths%°ChPakm/heighths%°Clocalkm/hhoursmmmm°C°C
1011.619E2433.71014.319E4423.920:1267NW035.721.2Su11015.117ESE9822.31014.413E5525.923:1465ESE9.434.319.3Mo21011.211SW4031.41016.813E6823.822:0150ENE10.237.620.1Tu31013.811W6628.01015.015NNW4928.801:2531ENE0.430.721.6We41014.824WSW6726.41015.89SW7624.418:1141SSW0.228.219.3Th51015.930SSW6025.31018.813SSE5624.015:5948SSW028.217.7Fr61014.526SSW5727.41018.311ESE4825.014:2543SSW032.019.0Sa71012.717SSW4630.81015.09ESE4528.300:1135E034.620.0Su81017.320SW6526.81018.313SW7225.315:4031SW028.620.7Mo91017.622SSW6027.91019.19SSE5328.215:1539SW0.231.419.3Tu101015.622SSW5928.01020.013ESE4226.801:2543ESE035.419.8We111012.617SW6125.31015.29E5125.915:0628SW028.920.9Th121009.919SW6226.21010.59NW8023.622:3833SW027.120.5Fr131016.828SW4523.31017.222SSW4622.406:2848SSW025.018.8Sa141016.424SW4825.61021.015E4020.616:4741SSW029.513.6Su151012.217SW5527.71015.813E4223.007:1744E035.717.3Mo161012.013SSW6027.41012.413E3528.608:4430E031.420.5Tu171012.719SW6727.21013.27ENE6625.717:1331SSW031.920.8We181013.324SW6326.31014.97SSE5426.817:3637SSW028.519.4Th191012.724SW6025.41015.27SSE4725.018:2246SSW028.618.0Fr201011.726SW5324.21014.613SE5422.616:5443SSW026.716.4Sa211012.133SSW5725.61014.915SSE5923.417:0154SSW028.917.0Su221011.317ESE2134.01016.419ESE4022.301:2146ESE035.015.7Mo231006.817NW4831.01008.415ENE3331.503:3541E037.321.9Tu241005.915SW6528.01008.411WSW7925.515:3526SW033.120.6We251004.613NW6627.71007.04E5629.915:2026NW030.720.8Th261009.826SW5824.91009.324SSW7022.513:4844SW026.320.7Fr271012.730SSW5326.01016.417SE5123.115:5444SSW031.416.7Sa28
Statistics for February 20151012.6205627.31014.9125325.231.219.2Mean1004.611#2122.31007.04E3320.625.013.6Lowest1017.633SSW9834.01021.024SSW8031.567NW10.237.621.9Highest
20.4Total
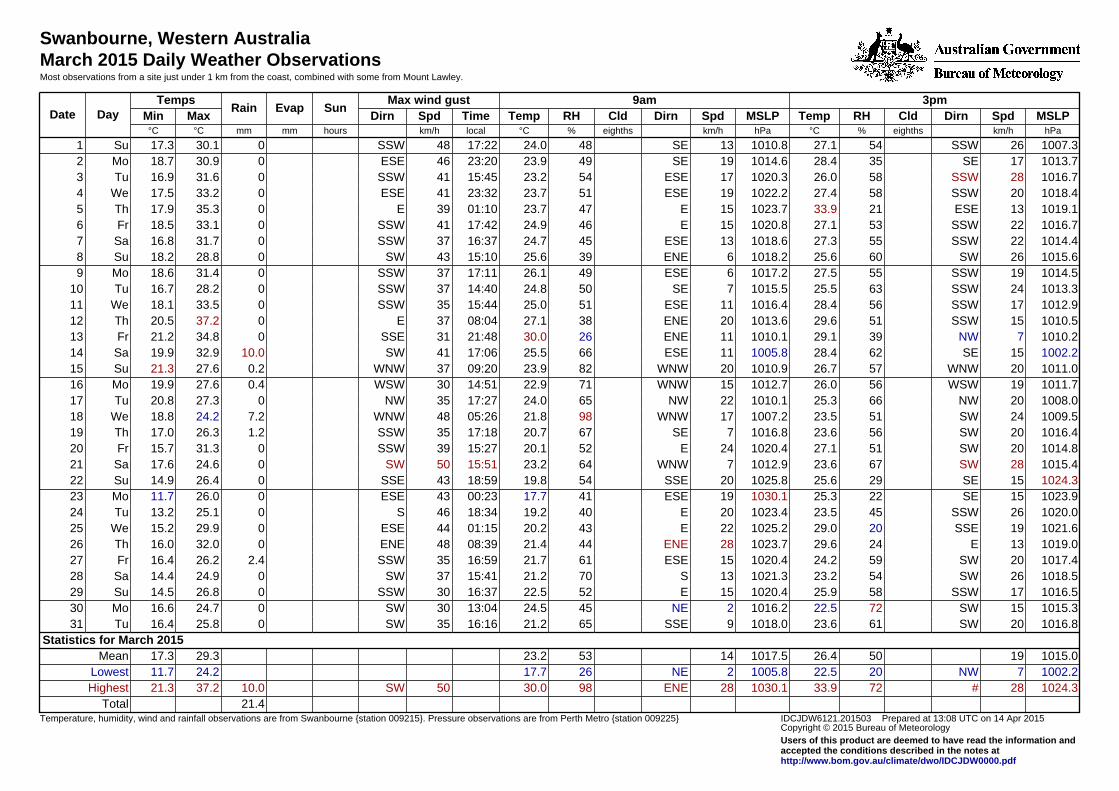
Swanbourne, Western AustraliaMarch 2015 Daily Weather ObservationsMost observations from a site just under 1 km from the coast, combined with some from Mount Lawley.
IDCJDW6121.201503 Prepared at 13:08 UTC on 14 Apr 2015Copyright © 2015 Bureau of MeteorologyUsers of this product are deemed to have read the information andaccepted the conditions described in the notes athttp://www.bom.gov.au/climate/dwo/IDCJDW0000.pdf
Temperature, humidity, wind and rainfall observations are from Swanbourne {station 009215}. Pressure observations are from Perth Metro {station 009225}
3pm9amMax wind gustSunEvapRain
TempsDayDate MSLPSpdDirnCldRHTempMSLPSpdDirnCldRHTempTimeSpdDirnMaxMin
hPakm/heighths%°ChPakm/heighths%°Clocalkm/hhoursmmmm°C°C
1007.326SSW5427.11010.813SE4824.017:2248SSW030.117.3Su11013.717SE3528.41014.619SE4923.923:2046ESE030.918.7Mo21016.728SSW5826.01020.317ESE5423.215:4541SSW031.616.9Tu31018.420SSW5827.41022.219ESE5123.723:3241ESE033.217.5We41019.113ESE2133.91023.715E4723.701:1039E035.317.9Th51016.722SSW5327.11020.815E4624.917:4241SSW033.118.5Fr61014.422SSW5527.31018.613ESE4524.716:3737SSW031.716.8Sa71015.626SW6025.61018.26ENE3925.615:1043SW028.818.2Su81014.519SSW5527.51017.26ESE4926.117:1137SSW031.418.6Mo91013.324SSW6325.51015.57SE5024.814:4037SSW028.216.7Tu101012.917SSW5628.41016.411ESE5125.015:4435SSW033.518.1We111010.515SSW5129.61013.620ENE3827.108:0437E037.220.5Th121010.27NW3929.11010.111ENE2630.021:4831SSE034.821.2Fr131002.215SE6228.41005.811ESE6625.517:0641SW10.032.919.9Sa141011.020WNW5726.71010.920WNW8223.909:2037WNW0.227.621.3Su151011.719WSW5626.01012.715WNW7122.914:5130WSW0.427.619.9Mo161008.020NW6625.31010.122NW6524.017:2735NW027.320.8Tu171009.524SW5123.51007.217WNW9821.805:2648WNW7.224.218.8We181016.420SW5623.61016.87SE6720.717:1835SSW1.226.317.0Th191014.820SW5127.11020.424E5220.115:2739SSW031.315.7Fr201015.428SW6723.61012.97WNW6423.215:5150SW024.617.6Sa211024.315SE2925.61025.820SSE5419.818:5943SSE026.414.9Su221023.915SE2225.31030.119ESE4117.700:2343ESE026.011.7Mo231020.026SSW4523.51023.420E4019.218:3446S025.113.2Tu241021.619SSE2029.01025.222E4320.201:1544ESE029.915.2We251019.013E2429.61023.728ENE4421.408:3948ENE032.016.0Th261017.420SW5924.21020.415ESE6121.716:5935SSW2.426.216.4Fr271018.526SW5423.21021.313S7021.215:4137SW024.914.4Sa281016.517SSW5825.91020.415E5222.516:3730SSW026.814.5Su291015.315SW7222.51016.22NE4524.513:0430SW024.716.6Mo301016.820SW6123.61018.09SSE6521.216:1635SW025.816.4Tu31
Statistics for March 20151015.0195026.41017.5145323.229.317.3Mean1002.27NW2022.51005.82NE2617.724.211.7Lowest1024.328#7233.91030.128ENE9830.050SW10.037.221.3Highest
21.4Total
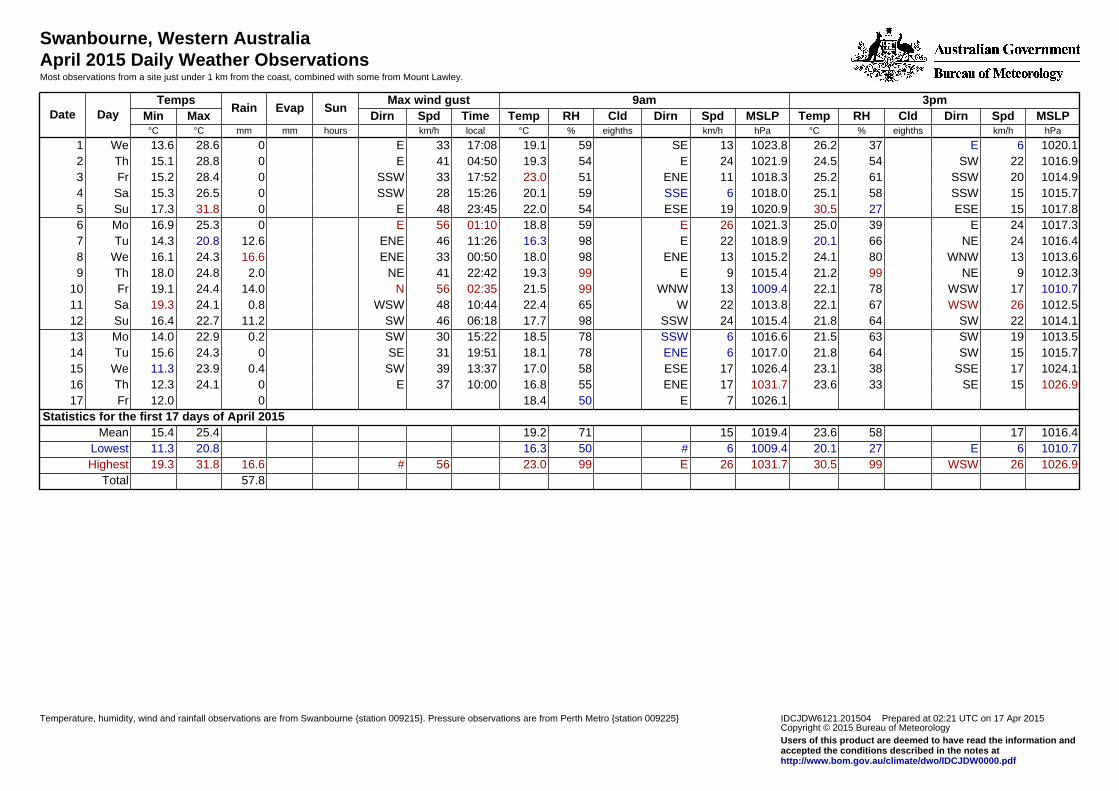
Swanbourne, Western AustraliaApril 2015 Daily Weather ObservationsMost observations from a site just under 1 km from the coast, combined with some from Mount Lawley.
IDCJDW6121.201504 Prepared at 02:21 UTC on 17 Apr 2015Copyright © 2015 Bureau of MeteorologyUsers of this product are deemed to have read the information andaccepted the conditions described in the notes athttp://www.bom.gov.au/climate/dwo/IDCJDW0000.pdf
Temperature, humidity, wind and rainfall observations are from Swanbourne {station 009215}. Pressure observations are from Perth Metro {station 009225}
3pm9amMax wind gustSunEvapRain
TempsDayDate MSLPSpdDirnCldRHTempMSLPSpdDirnCldRHTempTimeSpdDirnMaxMin
hPakm/heighths%°ChPakm/heighths%°Clocalkm/hhoursmmmm°C°C
1020.16E3726.21023.813SE5919.117:0833E028.613.6We11016.922SW5424.51021.924E5419.304:5041E028.815.1Th21014.920SSW6125.21018.311ENE5123.017:5233SSW028.415.2Fr31015.715SSW5825.11018.06SSE5920.115:2628SSW026.515.3Sa41017.815ESE2730.51020.919ESE5422.023:4548E031.817.3Su51017.324E3925.01021.326E5918.801:1056E025.316.9Mo61016.424NE6620.11018.922E9816.311:2646ENE12.620.814.3Tu71013.613WNW8024.11015.213ENE9818.000:5033ENE16.624.316.1We81012.39NE9921.21015.49E9919.322:4241NE2.024.818.0Th91010.717WSW7822.11009.413WNW9921.502:3556N14.024.419.1Fr101012.526WSW6722.11013.822W6522.410:4448WSW0.824.119.3Sa111014.122SW6421.81015.424SSW9817.706:1846SW11.222.716.4Su121013.519SW6321.51016.66SSW7818.515:2230SW0.222.914.0Mo131015.715SW6421.81017.06ENE7818.119:5131SE024.315.6Tu141024.117SSE3823.11026.417ESE5817.013:3739SW0.423.911.3We151026.915SE3323.61031.717ENE5516.810:0037E024.112.3Th16
1026.17E5018.4012.0Fr17Statistics for the first 17 days of April 2015
1016.4175823.61019.4157119.225.415.4Mean1010.76E2720.11009.46#5016.320.811.3Lowest1026.926WSW9930.51031.726E9923.056#16.631.819.3Highest
57.8Total

Appendix B
News article on beach erosion in March 2015

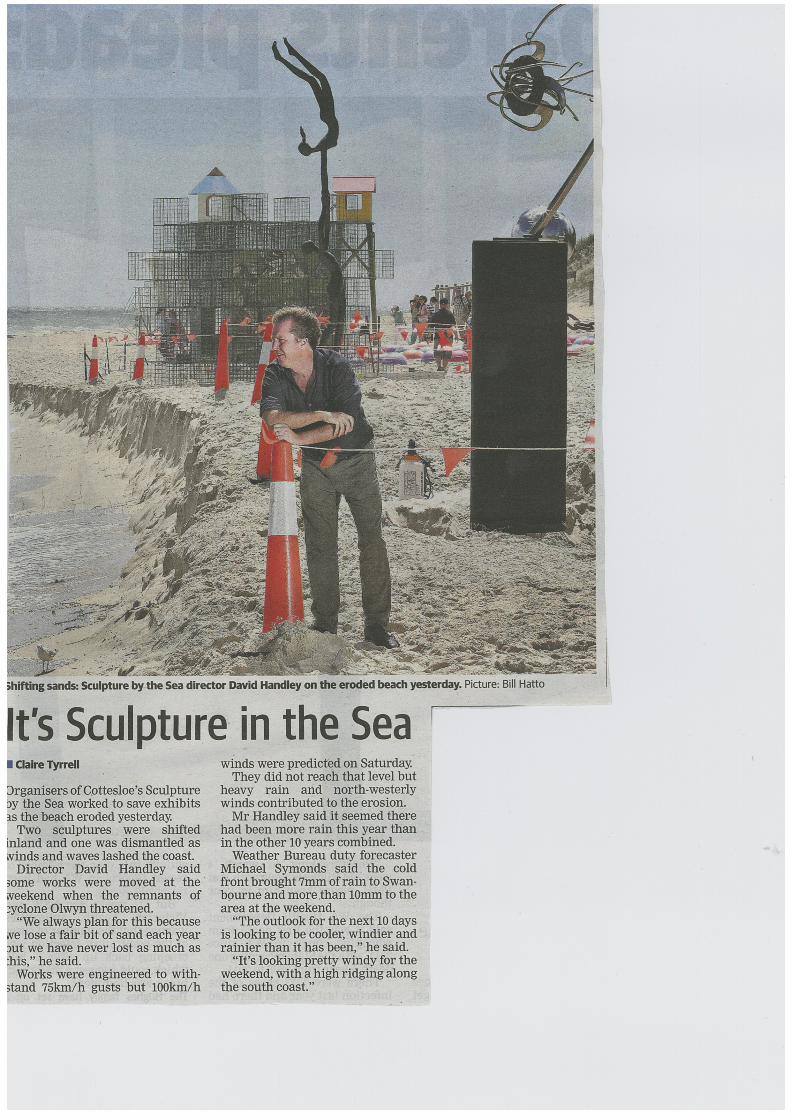

Appendix C
Water Level Data

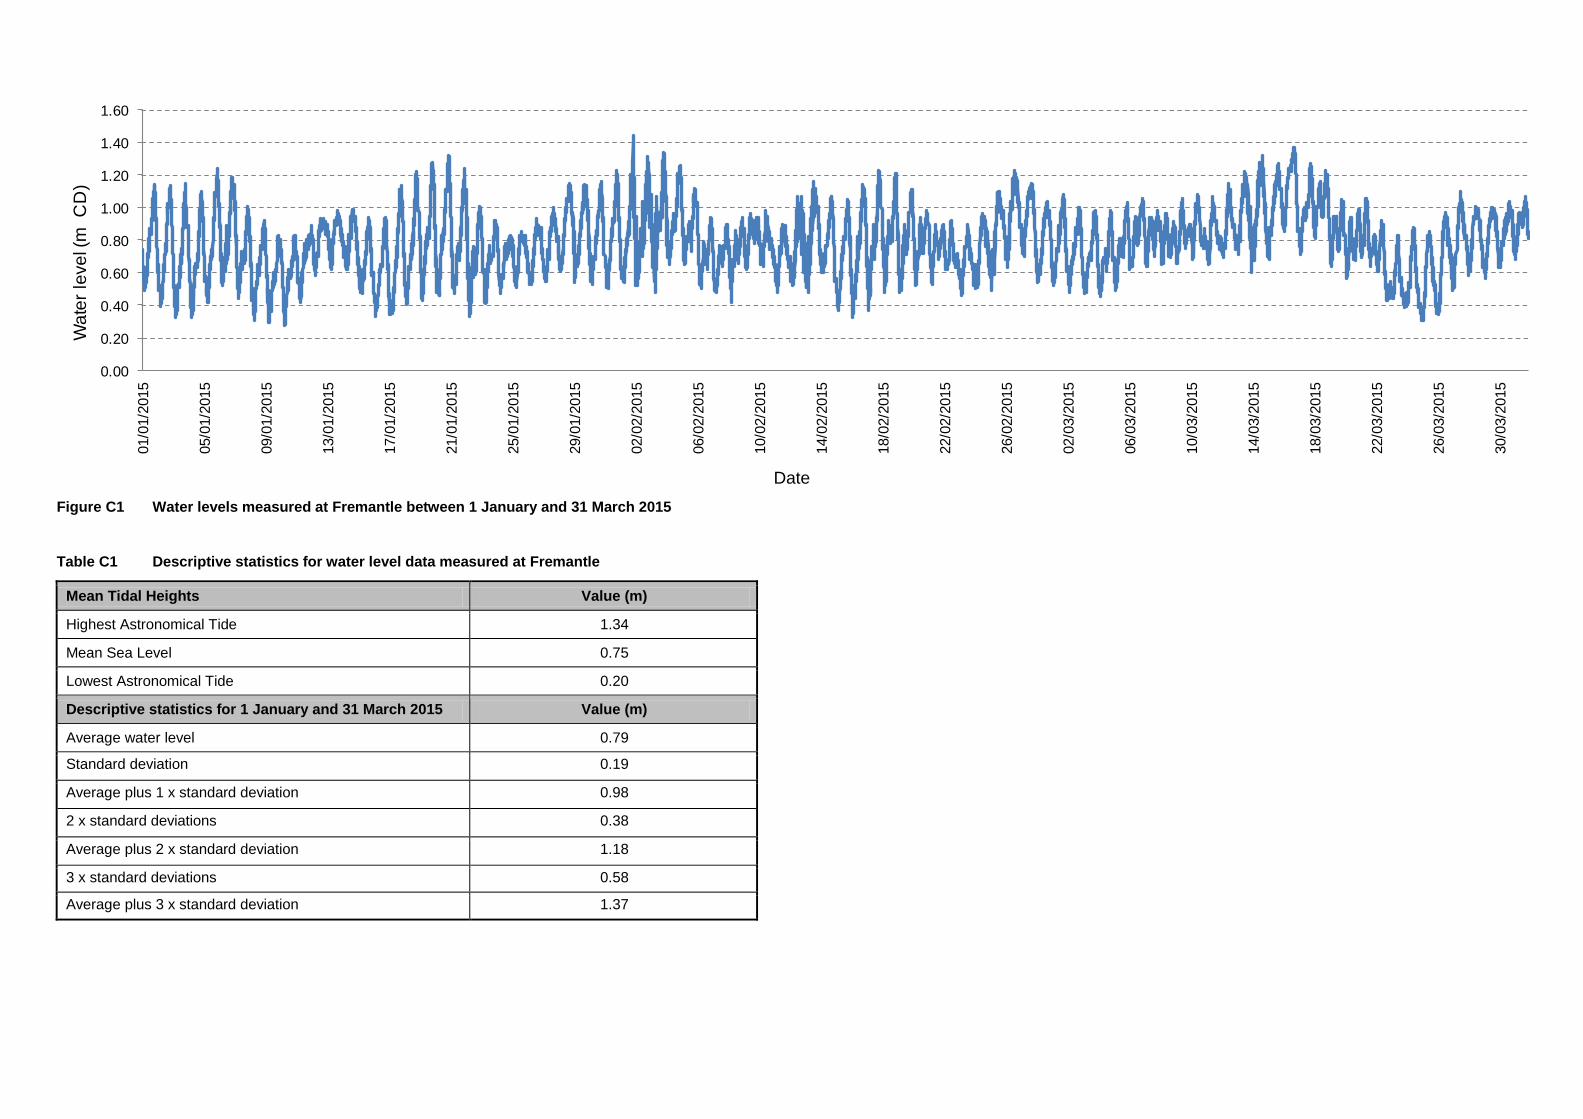
Date
Figure C1 Water levels measured at Fremantle between 1 January and 31 March 2015
Table C1 Descriptive statistics for water level data measured at Fremantle
Mean Tidal Heights Value (m)
Highest Astronomical Tide 1.34
Mean Sea Level 0.75
Lowest Astronomical Tide 0.20
Descriptive statistics for 1 January and 31 March 2015 Value (m)
Average water level 0.79
Standard deviation 0.19
Average plus 1 x standard deviation 0.98
2 x standard deviations 0.38
Average plus 2 x standard deviation 1.18
3 x standard deviations 0.58
Average plus 3 x standard deviation 1.37
0.00
0.20
0.40
0.60
0.80
1.00
1.20
1.40
1.60
01/0
1/2
015
05/0
1/2
015
09/0
1/2
015
13/0
1/2
015
17/0
1/2
015
21/0
1/2
015
25/0
1/2
015
29/0
1/2
015
02/0
2/2
015
06/0
2/2
015
10/0
2/2
015
14/0
2/2
015
18/0
2/2
015
22/0
2/2
015
26/0
2/2
015
02/0
3/2
015
06/0
3/2
015
10/0
3/2
015
14/0
3/2
015
18/0
3/2
015
22/0
3/2
015
26/0
3/2
015
30/0
3/2
015
Wa
ter
leve
l (m
C
D)


Appendix D
Beach profile data

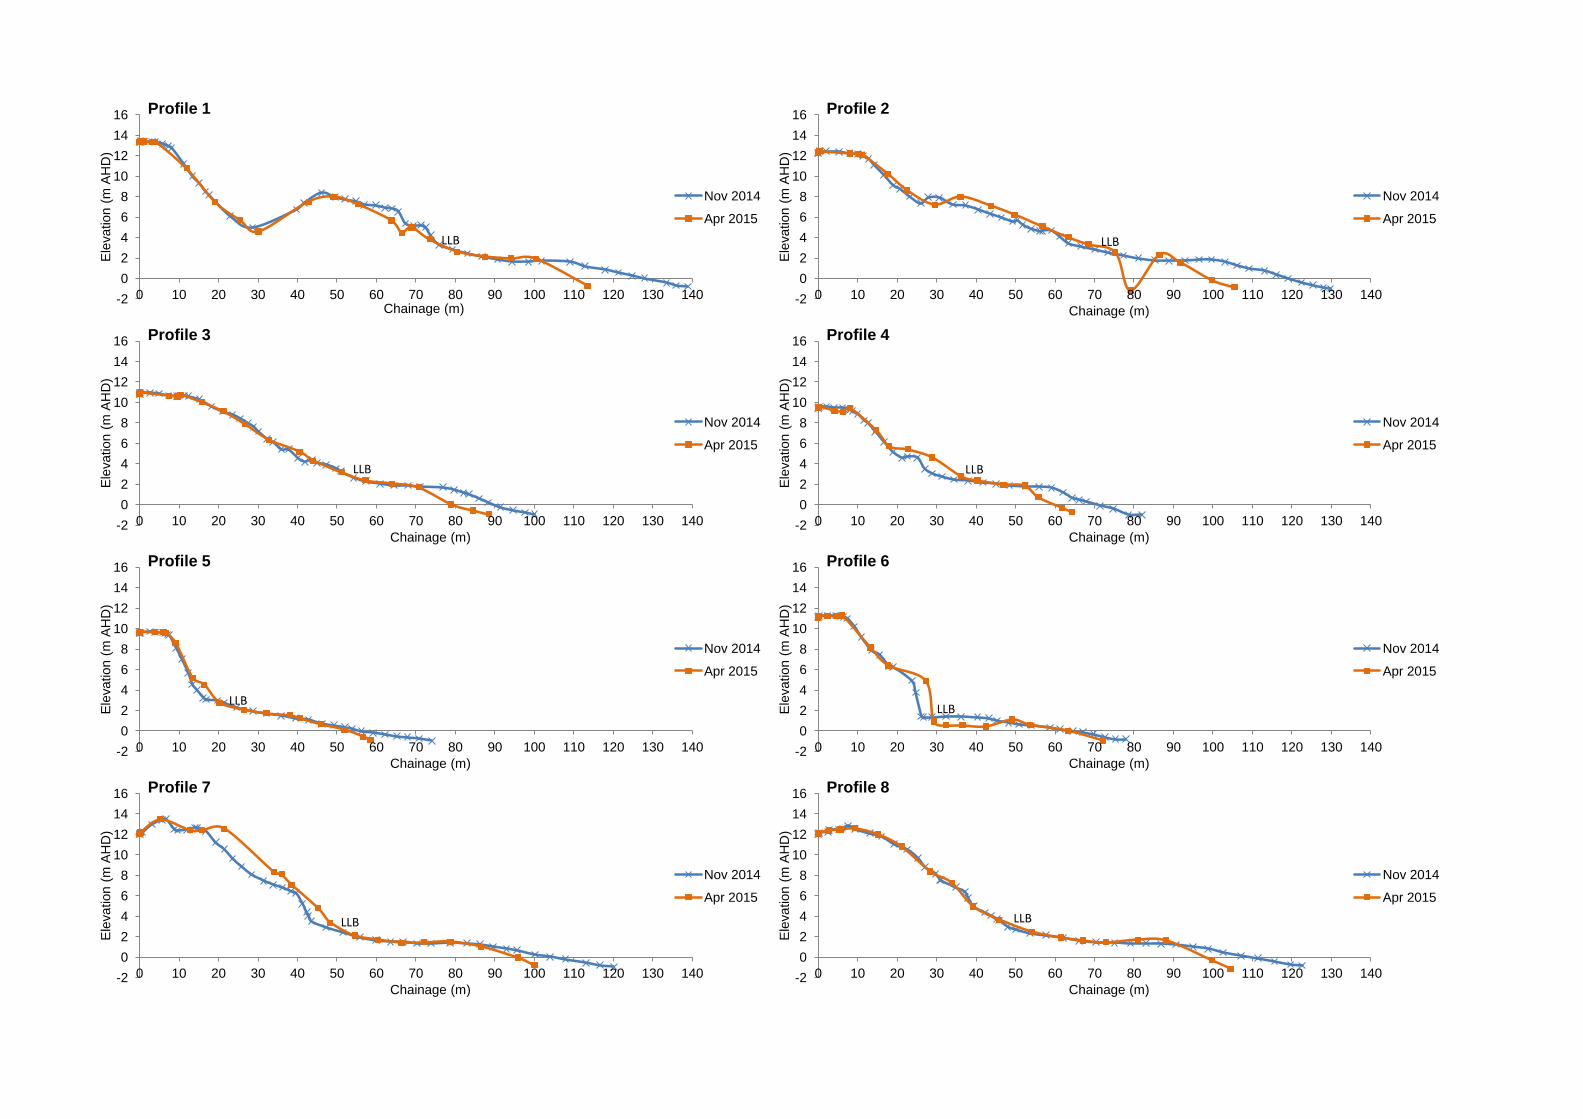
LLB
-2
0
2
4
6
8
10
12
14
16
0 10 20 30 40 50 60 70 80 90 100 110 120 130 140
Ele
vation (
m A
HD
)
Chainage (m)
Nov 2014
Apr 2015
Profile 1
LLB
-2
0
2
4
6
8
10
12
14
16
0 10 20 30 40 50 60 70 80 90 100 110 120 130 140
Ele
vation (
m A
HD
)
Chainage (m)
Nov 2014
Apr 2015
Profile 2
LLB
-2
0
2
4
6
8
10
12
14
16
0 10 20 30 40 50 60 70 80 90 100 110 120 130 140
Ele
vation (
m A
HD
)
Chainage (m)
Nov 2014
Apr 2015
Profile 3
LLB
-2
0
2
4
6
8
10
12
14
16
0 10 20 30 40 50 60 70 80 90 100 110 120 130 140
Ele
vation (
m A
HD
)
Chainage (m)
Nov 2014
Apr 2015
Profile 4
LLB
-2
0
2
4
6
8
10
12
14
16
0 10 20 30 40 50 60 70 80 90 100 110 120 130 140
Ele
vation (
m A
HD
)
Chainage (m)
Nov 2014
Apr 2015
Profile 5
LLB
-2
0
2
4
6
8
10
12
14
16
0 10 20 30 40 50 60 70 80 90 100 110 120 130 140
Ele
vation (
m A
HD
)
Chainage (m)
Nov 2014
Apr 2015
Profile 6
LLB
-2
0
2
4
6
8
10
12
14
16
0 10 20 30 40 50 60 70 80 90 100 110 120 130 140
Ele
vation (
m A
HD
)
Chainage (m)
Nov 2014
Apr 2015
Profile 7
LLB
-2
0
2
4
6
8
10
12
14
16
0 10 20 30 40 50 60 70 80 90 100 110 120 130 140
Ele
vation (
m A
HD
)
Chainage (m)
Nov 2014
Apr 2015
Profile 8
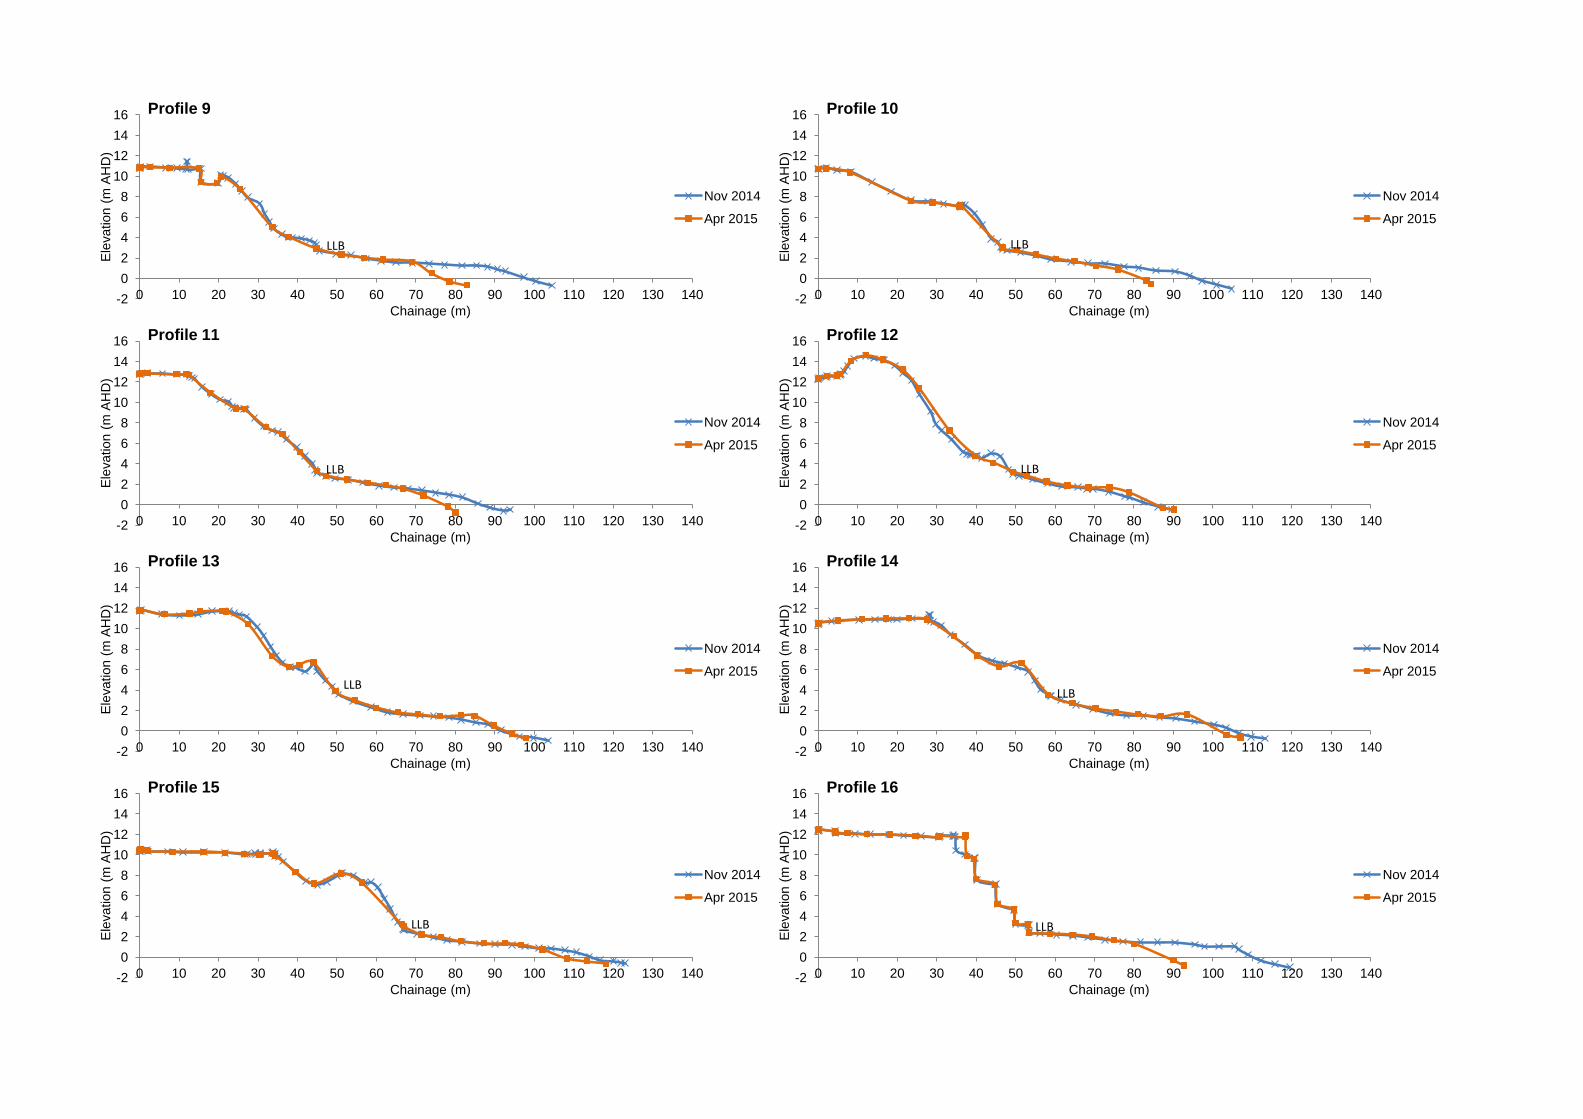
LLB
-2
0
2
4
6
8
10
12
14
16
0 10 20 30 40 50 60 70 80 90 100 110 120 130 140
Ele
vation (
m A
HD
)
Chainage (m)
Nov 2014
Apr 2015
Profile 9
LLB
-2
0
2
4
6
8
10
12
14
16
0 10 20 30 40 50 60 70 80 90 100 110 120 130 140
Ele
vation (
m A
HD
)
Chainage (m)
Nov 2014
Apr 2015
Profile 10
LLB
-2
0
2
4
6
8
10
12
14
16
0 10 20 30 40 50 60 70 80 90 100 110 120 130 140
Ele
vation (
m A
HD
)
Chainage (m)
Nov 2014
Apr 2015
Profile 11
LLB
-2
0
2
4
6
8
10
12
14
16
0 10 20 30 40 50 60 70 80 90 100 110 120 130 140
Ele
vation (
m A
HD
)
Chainage (m)
Nov 2014
Apr 2015
Profile 12
LLB
-2
0
2
4
6
8
10
12
14
16
0 10 20 30 40 50 60 70 80 90 100 110 120 130 140
Ele
vation (
m A
HD
)
Chainage (m)
Nov 2014
Apr 2015
Profile 13
LLB
-2
0
2
4
6
8
10
12
14
16
0 10 20 30 40 50 60 70 80 90 100 110 120 130 140
Ele
vation (
m A
HD
)
Chainage (m)
Nov 2014
Apr 2015
Profile 14
LLB
-2
0
2
4
6
8
10
12
14
16
0 10 20 30 40 50 60 70 80 90 100 110 120 130 140
Ele
vation (
m A
HD
)
Chainage (m)
Nov 2014
Apr 2015
Profile 15
LLB
-2
0
2
4
6
8
10
12
14
16
0 10 20 30 40 50 60 70 80 90 100 110 120 130 140
Ele
vation (
m A
HD
)
Chainage (m)
Nov 2014
Apr 2015
Profile 16
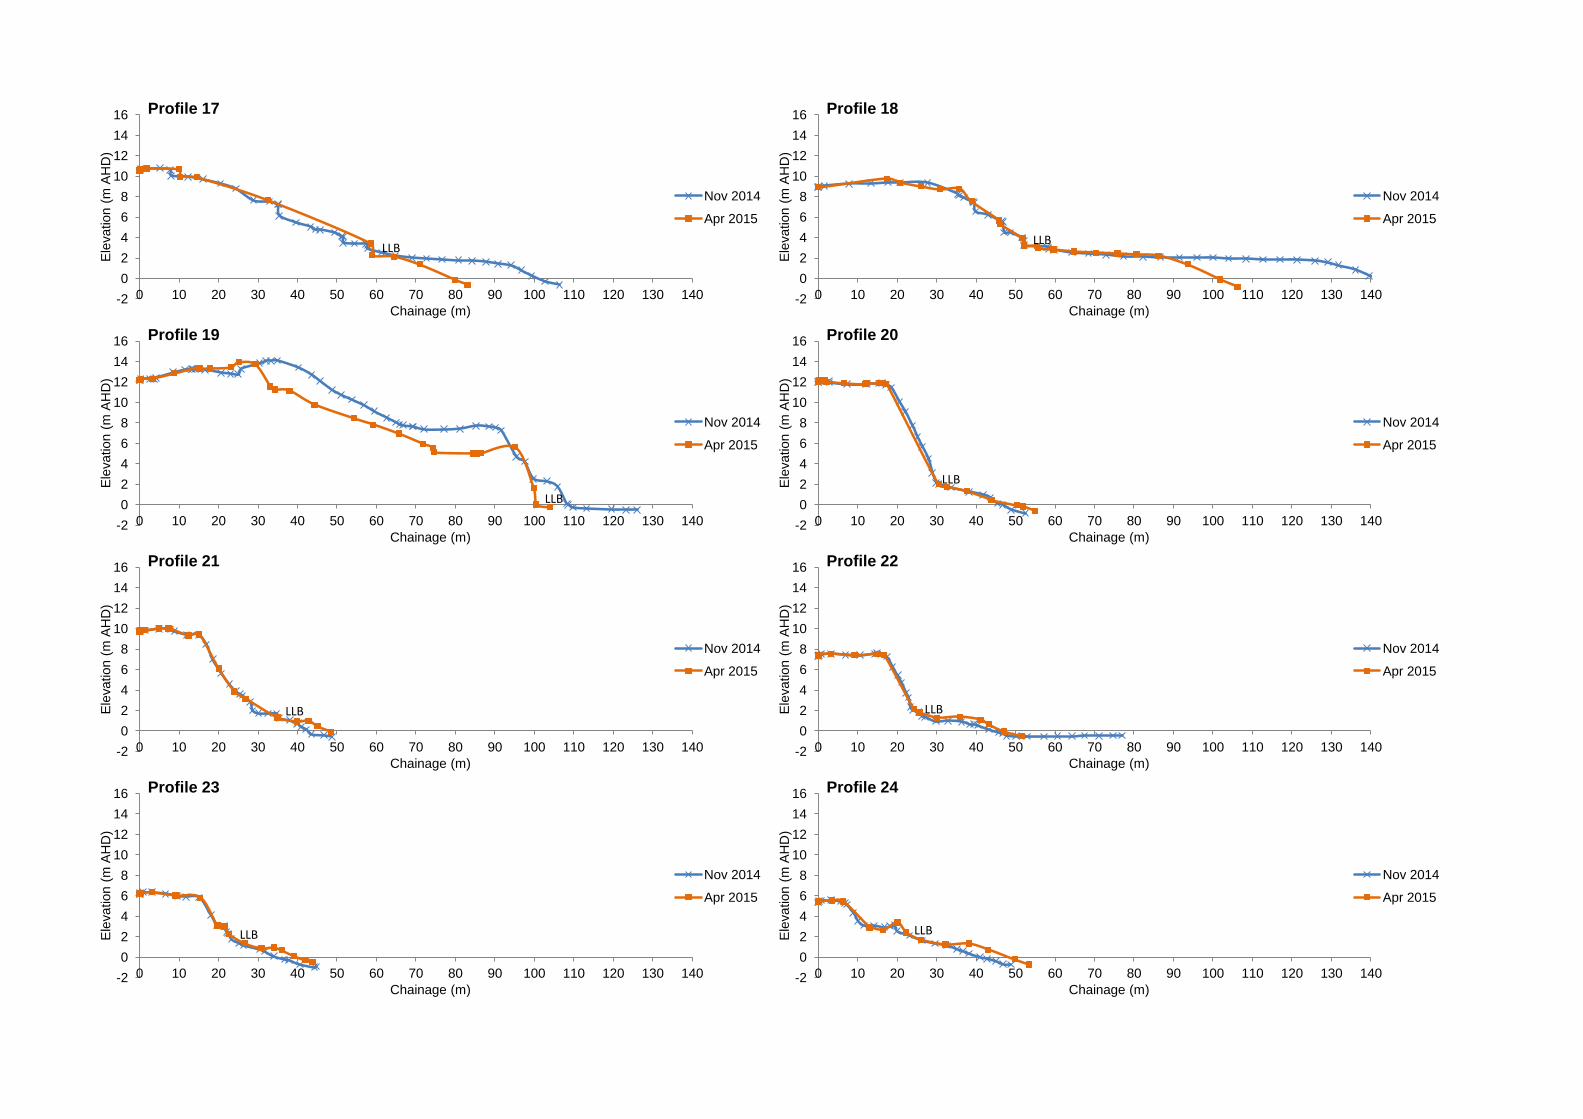
LLB
-2
0
2
4
6
8
10
12
14
16
0 10 20 30 40 50 60 70 80 90 100 110 120 130 140
Ele
vation (
m A
HD
)
Chainage (m)
Nov 2014
Apr 2015
Profile 17
LLB
-2
0
2
4
6
8
10
12
14
16
0 10 20 30 40 50 60 70 80 90 100 110 120 130 140
Ele
vation (
m A
HD
)
Chainage (m)
Nov 2014
Apr 2015
Profile 18
LLB
-2
0
2
4
6
8
10
12
14
16
0 10 20 30 40 50 60 70 80 90 100 110 120 130 140
Ele
vation (
m A
HD
)
Chainage (m)
Nov 2014
Apr 2015
Profile 19
LLB
-2
0
2
4
6
8
10
12
14
16
0 10 20 30 40 50 60 70 80 90 100 110 120 130 140
Ele
vation (
m A
HD
)
Chainage (m)
Nov 2014
Apr 2015
Profile 20
LLB
-2
0
2
4
6
8
10
12
14
16
0 10 20 30 40 50 60 70 80 90 100 110 120 130 140
Ele
vation (
m A
HD
)
Chainage (m)
Nov 2014
Apr 2015
Profile 21
LLB
-2
0
2
4
6
8
10
12
14
16
0 10 20 30 40 50 60 70 80 90 100 110 120 130 140
Ele
vation (
m A
HD
)
Chainage (m)
Nov 2014
Apr 2015
Profile 22
LLB
-2
0
2
4
6
8
10
12
14
16
0 10 20 30 40 50 60 70 80 90 100 110 120 130 140
Ele
vation (
m A
HD
)
Chainage (m)
Nov 2014
Apr 2015
Profile 23
LLB
-2
0
2
4
6
8
10
12
14
16
0 10 20 30 40 50 60 70 80 90 100 110 120 130 140
Ele
vation (
m A
HD
)
Chainage (m)
Nov 2014
Apr 2015
Profile 24
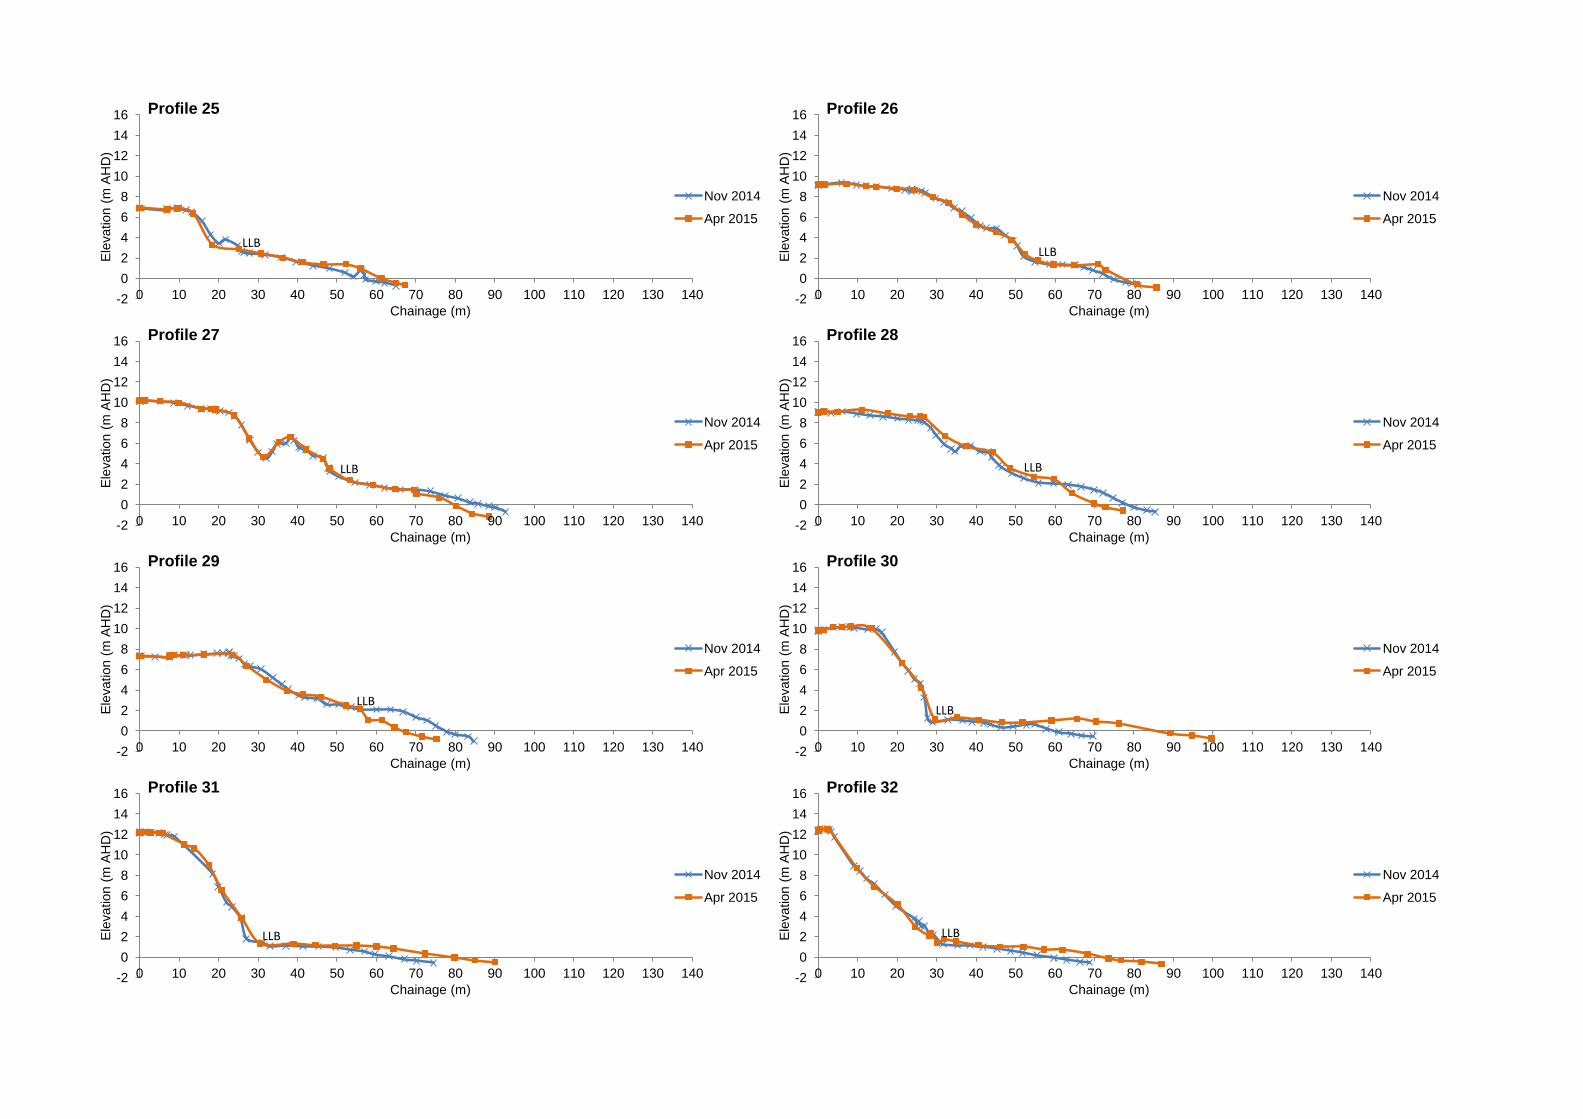
LLB
-2
0
2
4
6
8
10
12
14
16
0 10 20 30 40 50 60 70 80 90 100 110 120 130 140
Ele
vation (
m A
HD
)
Chainage (m)
Nov 2014
Apr 2015
Profile 25
LLB
-2
0
2
4
6
8
10
12
14
16
0 10 20 30 40 50 60 70 80 90 100 110 120 130 140
Ele
vation (
m A
HD
)
Chainage (m)
Nov 2014
Apr 2015
Profile 26
LLB
-2
0
2
4
6
8
10
12
14
16
0 10 20 30 40 50 60 70 80 90 100 110 120 130 140
Ele
vation (
m A
HD
)
Chainage (m)
Nov 2014
Apr 2015
Profile 27
LLB
-2
0
2
4
6
8
10
12
14
16
0 10 20 30 40 50 60 70 80 90 100 110 120 130 140
Ele
vation (
m A
HD
)
Chainage (m)
Nov 2014
Apr 2015
Profile 28
LLB
-2
0
2
4
6
8
10
12
14
16
0 10 20 30 40 50 60 70 80 90 100 110 120 130 140
Ele
vation (
m A
HD
)
Chainage (m)
Nov 2014
Apr 2015
Profile 29
LLB
-2
0
2
4
6
8
10
12
14
16
0 10 20 30 40 50 60 70 80 90 100 110 120 130 140
Ele
vation (
m A
HD
)
Chainage (m)
Nov 2014
Apr 2015
Profile 30
LLB
-2
0
2
4
6
8
10
12
14
16
0 10 20 30 40 50 60 70 80 90 100 110 120 130 140
Ele
vation (
m A
HD
)
Chainage (m)
Nov 2014
Apr 2015
Profile 31
LLB
-2
0
2
4
6
8
10
12
14
16
0 10 20 30 40 50 60 70 80 90 100 110 120 130 140
Ele
vation (
m A
HD
)
Chainage (m)
Nov 2014
Apr 2015
Profile 32
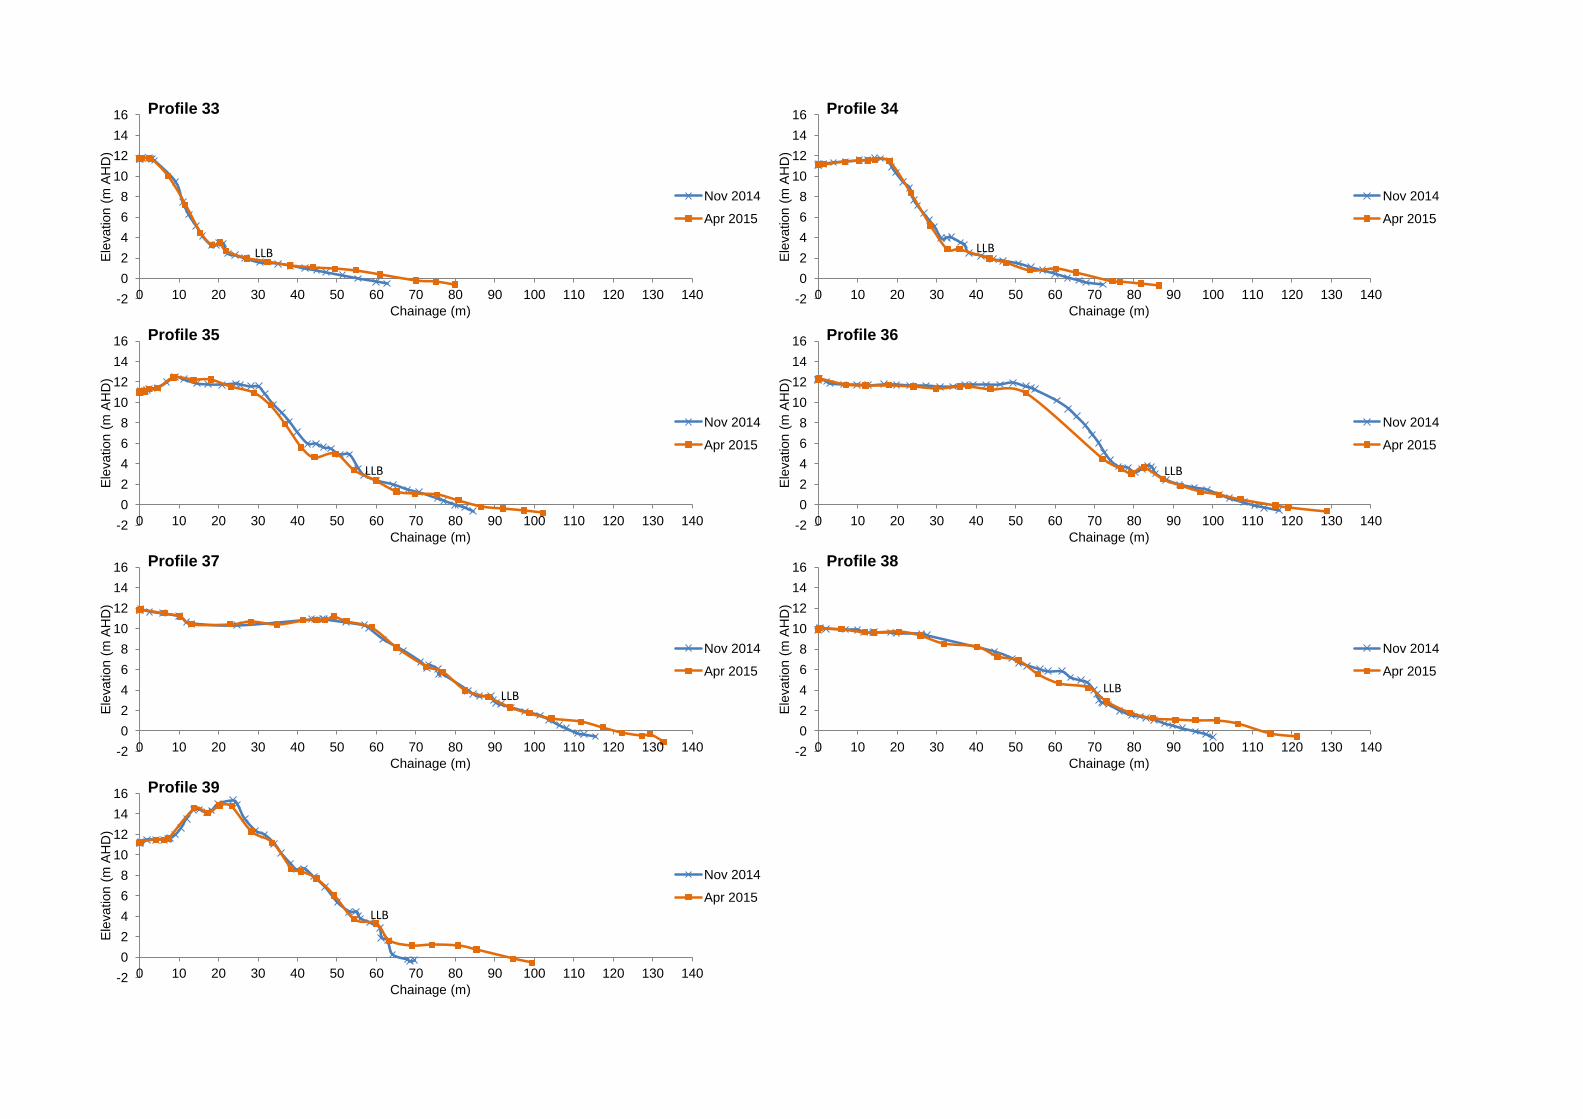
LLB
-2
0
2
4
6
8
10
12
14
16
0 10 20 30 40 50 60 70 80 90 100 110 120 130 140
Ele
vation (
m A
HD
)
Chainage (m)
Nov 2014
Apr 2015
Profile 33
LLB
-2
0
2
4
6
8
10
12
14
16
0 10 20 30 40 50 60 70 80 90 100 110 120 130 140
Ele
vation (
m A
HD
)
Chainage (m)
Nov 2014
Apr 2015
Profile 34
LLB
-2
0
2
4
6
8
10
12
14
16
0 10 20 30 40 50 60 70 80 90 100 110 120 130 140
Ele
vation (
m A
HD
)
Chainage (m)
Nov 2014
Apr 2015
Profile 35
LLB
-2
0
2
4
6
8
10
12
14
16
0 10 20 30 40 50 60 70 80 90 100 110 120 130 140
Ele
vation (
m A
HD
)
Chainage (m)
Nov 2014
Apr 2015
Profile 36
LLB
-2
0
2
4
6
8
10
12
14
16
0 10 20 30 40 50 60 70 80 90 100 110 120 130 140
Ele
vation (
m A
HD
)
Chainage (m)
Nov 2014
Apr 2015
Profile 37
LLB
-2
0
2
4
6
8
10
12
14
16
0 10 20 30 40 50 60 70 80 90 100 110 120 130 140
Ele
vation (
m A
HD
)
Chainage (m)
Nov 2014
Apr 2015
Profile 38
LLB
-2
0
2
4
6
8
10
12
14
16
0 10 20 30 40 50 60 70 80 90 100 110 120 130 140
Ele
vation (
m A
HD
)
Chainage (m)
Nov 2014
Apr 2015
Profile 39


BMT Oceanica Pty Ltd
PO Box 462 Wembley
WA 6913 Australia
Tel: +61 8 6272 0000
Fax: +61 8 6272 0099
www.bmtoceanica.com.au