costs of materials usage
TRANSCRIPT
Costs of Materials Usage
Professor Randolph Kirchain Department of Materials Science & Engineering and
Engineering Systems Division
Massachusetts Institute of Technology Cambridge, Massachusetts Materials Systems Laboratory
Materials & Sustainability: Slide 1
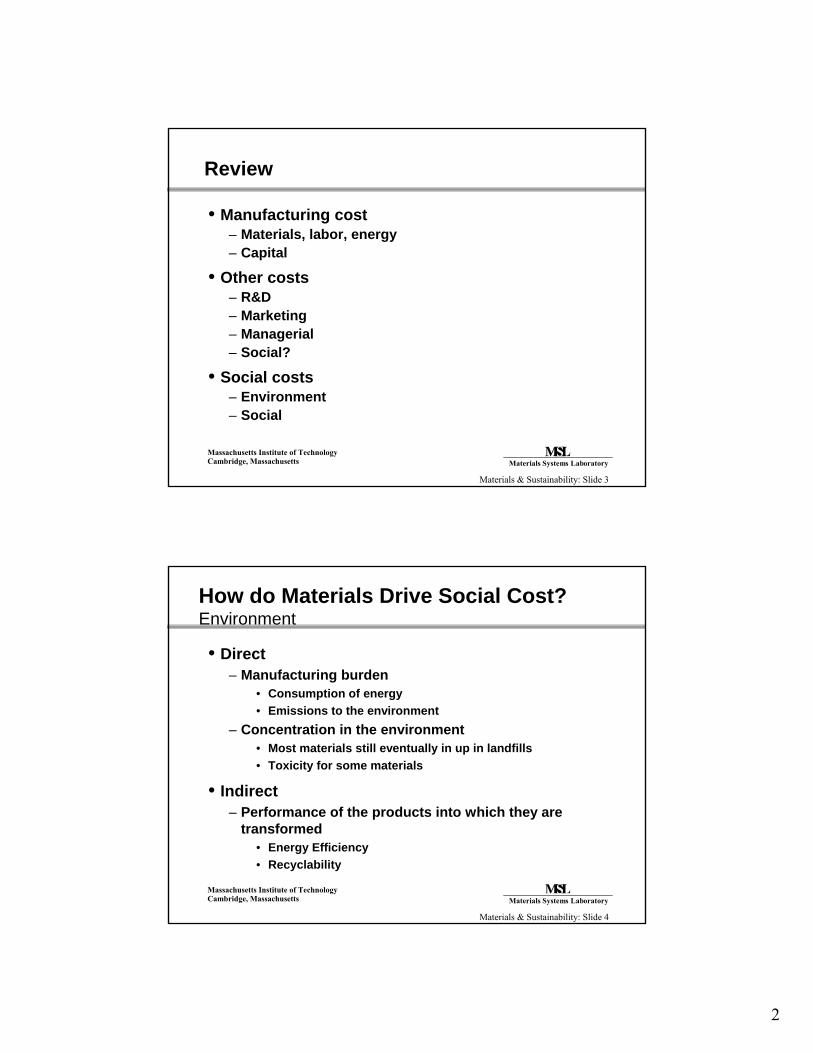
Overview
• Context – Indirect Costs • The role of materials in the environment
– Direct – Indirect
• Is this really a problem? – How much do we consume?
• What can be done – Changing the rules of the game
• Research at MIT – Enabling materials substitution – Improving materials reuse
Massachusetts Institute of Technology Cambridge, Massachusetts Materials Systems Laboratory
Materials & Sustainability: Slide 2
1
Review
• Manufacturing cost – Materials, labor, energy – Capital
• Other costs – R&D – Marketing – Managerial – Social?
• Social costs – Environment – Social
Massachusetts Institute of Technology Cambridge, Massachusetts Materials Systems Laboratory
Materials & Sustainability: Slide 3
How do Materials Drive Social Cost? Environment
• Direct – Manufacturing burden
• Consumption of energy • Emissions to the environment
– Concentration in the environment • Most materials still eventually in up in landfills • Toxicity for some materials
• Indirect – Performance of the products into which they are
transformed • Energy Efficiency • Recyclability
Massachusetts Institute of Technology Cambridge, Massachusetts Materials Systems Laboratory
Materials & Sustainability: Slide 4
2

Is this really a problem?
How much do
YOU
consume per day?
Massachusetts Institute of Technology Cambridge, Massachusetts Materials Systems Laboratory
Materials & Sustainability: Slide 5
/ /
2 3 3 7
2 6
Massachusetts Institute of Technology Cambridge, Massachusetts Materials Systems Laboratory
Materials & Sustainability: Slide 6
How much do YOU use per day (kilograms)?
Inputs 3 Recycled
> 50 kg person day
21 21
Metals Minerals Forestry products Agriculture Energy materials Construction
Outputs
19 21
Dissipated Wastes Air emissions In use
Figure by MIT OCW.
3

Courtesy of Annual Review, Inc. Used with permission.Source: Figure 3 in Matos, G., and L. Wagner. "Consumption of Materials in the United States, 1900-1995." Annu Rev Energy Environ 23 (1998): 107–22.

Steel
Steel
Materials Substitution:
Which Material would you Choose?
CO2 11 kg / kg
SO2 0.4
NOx 0.3
CO2 2 kg / kg
SO2 0.008
NOx 0.007
Massachusetts Institute of Technology Cambridge, Massachusetts Materials Systems Laboratory
Materials & Sustainability: Slide 9
Making Better Material Choices
Material B Material A
CO2 SO2 NOx NM VOC Dust 1e-05
0.0001
0.001
0.01
0.1
1
10
100 Aluminum
Emissions from Production
Aluminum 0
2
4
6
8
10
12
kg
Emissions from Production CO2
A B
A B
Massachusetts Institute of Technology Cambridge, Massachusetts Materials Systems Laboratory
Materials & Sustainability: Slide 10
Which would you choose?
kg R
elea
sed
per k
g Pr
oduc
ed
Why does A advertise itself as Environmental?
5
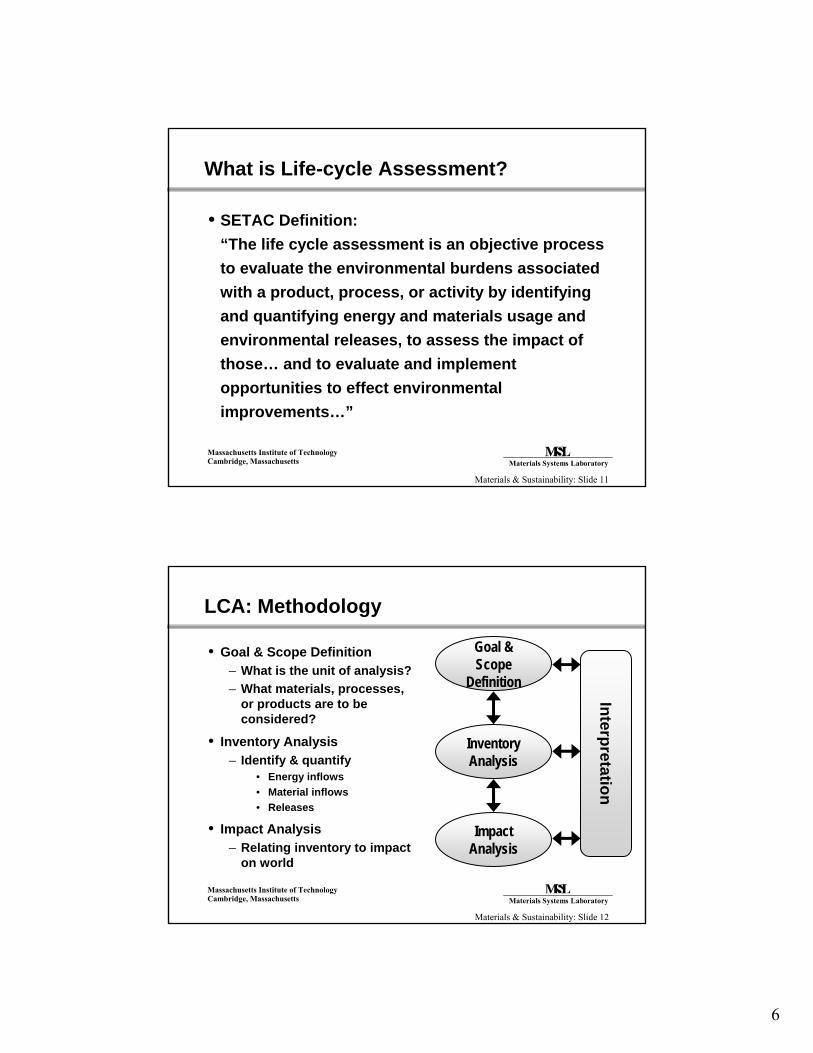
What is Life-cycle Assessment?
• SETAC Definition: “The life cycle assessment is an objective process to evaluate the environmental burdens associated with a product, process, or activity by identifying and quantifying energy and materials usage and environmental releases, to assess the impact of those… and to evaluate and implement opportunities to effect environmental improvements…”
Massachusetts Institute of Technology Cambridge, Massachusetts Materials Systems Laboratory
Materials & Sustainability: Slide 11
LCA: Methodology
• Goal & Scope Definition – What is the unit of analysis? – What materials, processes,
or products are to be considered?
• Inventory Analysis – Identify & quantify
• Energy inflows • Material inflows • Releases
• Impact Analysis – Relating inventory to impact
on world
Massachusetts Institute of TechnologyCambridge, Massachusetts Materials Systems Laboratory
Goal & Scope
Definition
Inventory Analysis
Impact Analysis
Interpretation
Materials & Sustainability: Slide 12
6

Example:
Comparing Beverage Packages
Massachusetts Institute of Technology Cambridge, Massachusetts Materials Systems Laboratory
Materials & Sustainability: Slide 13
Goal & Scope Definition
• Purpose • Scope of study: – Identify preferred material – Various container
• Target group – materials • Steel
– Package manufacturers • Aluminum – Policy makers • Polyethylene
• Unit of analysis • Glass • Polystyrene – One beverage package • Paper
• Time period – life cycle of one package
Massachusetts Institute of Technology Cambridge, Massachusetts Materials Systems Laboratory
Materials & Sustainability: Slide 14
7
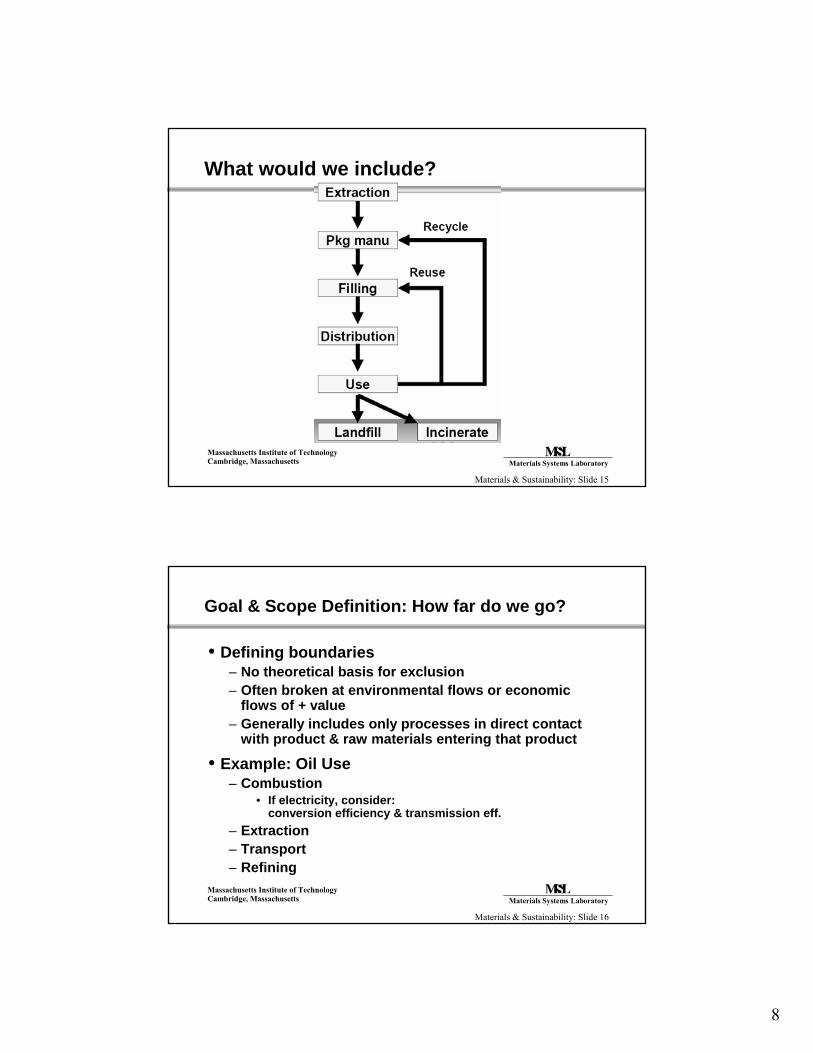
What would we include?
Massachusetts Institute of Technology Cambridge, Massachusetts Materials Systems Laboratory
Materials & Sustainability: Slide 15
Goal & Scope Definition: How far do we go?
• Defining boundaries – No theoretical basis for exclusion – Often broken at environmental flows or economic
flows of + value – Generally includes only processes in direct contact
with product & raw materials entering that product
• Example: Oil Use – Combustion
• If electricity, consider:conversion efficiency & transmission eff.
– Extraction – Transport – Refining
Massachusetts Institute of Technology Cambridge, Massachusetts Materials Systems Laboratory
Materials & Sustainability: Slide 16
8

Inventory Analysis
• Data collection – Inflows of materials – Inflows of energy – Releases to land, water and air
• Typically the most time consuming stage
• Data sources – Scientific literature, Published studies – Industry & government records – Industry associations – Private consultants
Massachusetts Institute of Technology Cambridge, Massachusetts Materials Systems Laboratory
Materials & Sustainability: Slide 17
Massachusetts Institute of Technology Cambridge, Massachusetts Materials Systems Laboratory
Materials & Sustainability: Slide 18
Inventory Analysis: Glass
9
Massachusetts Institute of Technology Cambridge, Massachusetts Materials Systems Laboratory
Materials & Sustainability: Slide 19
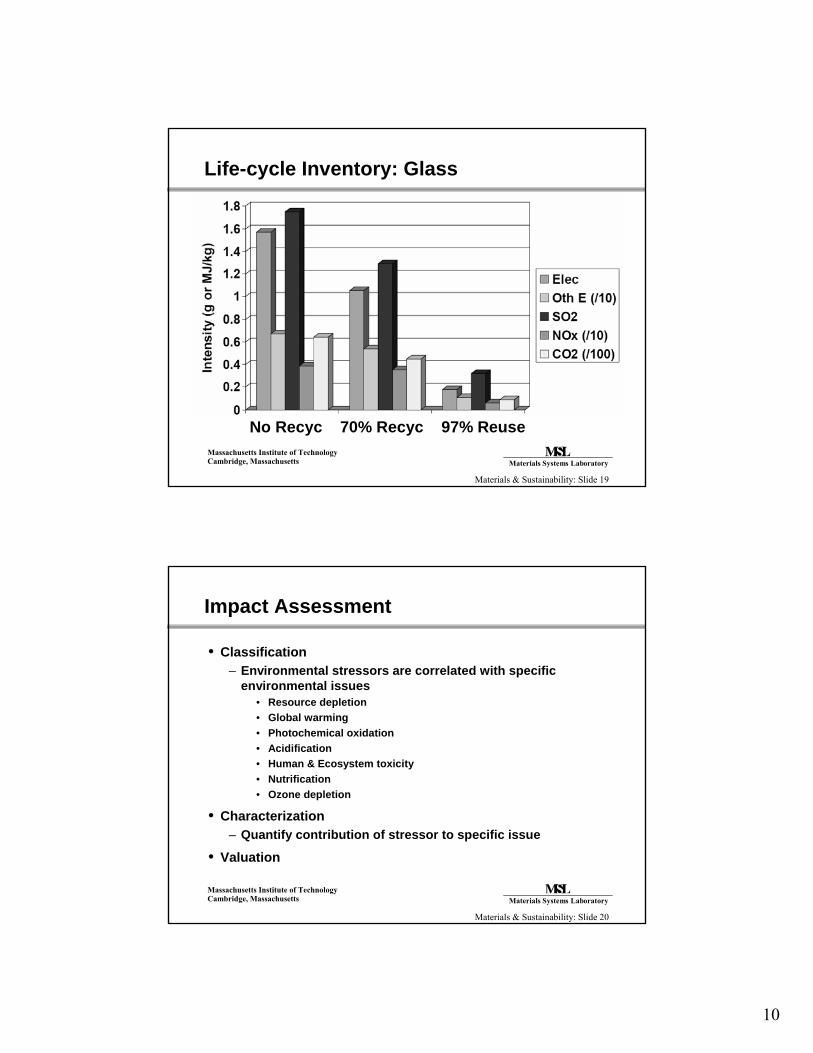
Life-cycle Inventory: Glass
No Recyc 70% Recyc 97% Reuse
Impact Assessment
• Classification – Environmental stressors are correlated with specific
environmental issues• Resource depletion • Global warming • Photochemical oxidation • Acidification • Human & Ecosystem toxicity • Nutrification • Ozone depletion
• Characterization – Quantify contribution of stressor to specific issue
• Valuation
Massachusetts Institute of Technology Cambridge, Massachusetts Materials Systems Laboratory
Materials & Sustainability: Slide 20
10

Use
List of Top Process Concerns
• Toxics – Can I reduce the use of toxic feedstocks or products?
• Waste – Can I improve material usage efficiency? – Can I utilize waste streams of other processes?
• Energy (Water) Efficiency – Can I drive down energy (water) usage?
• Supply Chain Awareness – Can I select environmentally conscious suppliers?
Massachusetts Institute of Technology Cambridge, Massachusetts Materials Systems Laboratory
Materials & Sustainability: Slide 21
Massachusetts Institute of Technology Cambridge, Massachusetts Materials Systems Laboratory
Materials & Sustainability: Slide 22
Environmental Burdens of Microelectronics
0
500
1000
1500
2000
2500
Cum
ulat
ive
Ener
gy (k
Wh
/ kg
chi
p)
1 kg of Si chips10 - 50
kg Si Materials Use
EnergyEnergyUse
Æ Si Die Production Æ
0
400
800
1200
1600
Inflo
ws
(g /
chip
)
Fossil Fuel Chemicals
Inflows per 2g RAM Chip
11