costs of largemouth bass fingerlings · bass forsupplementalstocking and the increase...
TRANSCRIPT

ETB260
Largemouth Bass Fingerlings
Costs of Raising
Aqua
culture / Fisheries Center
University of Arkansas at Pine Bluff
COOPERATIVE EXTENSION PROGRAM University of Arkansas at Pine Bluff, United States Department of Agriculture, and County Governments Cooperating

Blank – Inside front cover
2
Authors
Carole Engle and Brent Southworth
Aquaculture/Fisheries Center Mail Slot 4912
University of Arkansas at Pine Bluff 1200 N. University Drive Pine Bluff, AR 71601
Table of Contents
Introduction . . . . . . . . . . . . . . . . . . . . . . . . . . . . . . . . . . . . . . . . . . . . . . . . . . . . . . . . . .
Survey of Largemouth Bass Fingerling Growers in Southern States . . . . . . . . . . .
Survey Design . . . . . . . . . . . . . . . . . . . . . . . . . . . . . . . . . . . . . . . . . . . . . . . . . . . . Survey Results . . . . . . . . . . . . . . . . . . . . . . . . . . . . . . . . . . . . . . . . . . . . . . . . . . .
Cost Analysis . . . . . . . . . . . . . . . . . . . . . . . . . . . . . . . . . . . . . . . . . . . . . . . . . . . . . . . . .
Broodfish Management . . . . . . . . . . . . . . . . . . . . . . . . . . . . . . . . . . . . . . . . . . . . Pond Spawning . . . . . . . . . . . . . . . . . . . . . . . . . . . . . . . . . . . . . . . . . . . . . . . . . . . Raceway/Vat Spawning . . . . . . . . . . . . . . . . . . . . . . . . . . . . . . . . . . . . . . . . . . . Rearing Fry to 2 Inches Following Transfer From Spawning Pond . . . . . . . Feed Training Costs . . . . . . . . . . . . . . . . . . . . . . . . . . . . . . . . . . . . . . . . . . . . . . . Rearing Fingerlings to 4 Inches on Forage . . . . . . . . . . . . . . . . . . . . . . . . . . . . Rearing FeedTrained Fingerlings to 4 Inches on Feed . . . . . . . . . . . . . . . . . . Rearing FeedTrained Fingerlings to 6 Inches on Feed . . . . . . . . . . . . . . . . . . Effect on Fingerling Costs of Raceway Spawning . . . . . . . . . . . . . . . . . . . . . . Effect on Fingerling Costs of Using Forage Instead of Feed for Broodfish . . . . . . . . . . . . . . . . . . . . . . . . . . . . . . . . . . . .
Summary and Conclusions . . . . . . . . . . . . . . . . . . . . . . . . . . . . . . . . . . . . . . . . . . . . .
References . . . . . . . . . . . . . . . . . . . . . . . . . . . . . . . . . . . . . . . . . . . . . . . . . . . . . . . . . . . .
5
6
6 7
12
12 14 14 14 18 18 18 18 23
23
25
26
Acknowledgments: The authors thank the private farmers and public hatcherymanagers for taking time to respond to the survey. Anita Kelly, George Selden and JustinGrimmGreenblatt provided helpful comments on an earlier draft of this bulletin.
3
List of Tables
Table 1. Estimates of replacement values for largemouth bass fingerlings by size . . . . . . . . . . . . . . . . . . . . . 6
Table 2. Response rate on survey of largemouth bass fingerling producers, private and public,in southern U.S., 2007 . . . . . . . . . . . . . . . . . . . . . . . . . . . . . . . . . . . . . . . . . . . . . . . . . . . . . . . . . . . . . . . . . 7
Table 3. Strain of largemouth bass raised on private farms and public hatcheries,survey of largemouth bass fingerling producers in southern U.S., 2007 . . . . . . . . . . . . . . . . . . . . . . . 8
Table 4. Mean area of facilities used for production of largemouth bass fingerlings on private farms andpublic hatcheries, survey of largemouth bass fingerling producers in southern U.S., 2007 . . . . . . . 8
Table 5. Average sizes of ponds (acres) used for largemouth bass fingerling production,survey of largemouth bass fingerling producers in southern U.S., 2007 . . . . . . . . . . . . . . . . . . . . . . . 8
Table 6. Spawning methods used by private farms and public hatcheries for largemouth bass,survey of largemouth bass fingerling producers in southern U.S., 2007 . . . . . . . . . . . . . . . . . . . . . . . 9
Table 7. Types of feed fed to largemouth bass, survey of largemouth bass fingerling producersin southern U.S., 2007 . . . . . . . . . . . . . . . . . . . . . . . . . . . . . . . . . . . . . . . . . . . . . . . . . . . . . . . . . . . . . . . . . 9
Table 8. Protein percentages of feeds used by private farms and public hatcheries,survey of largemouth bass fingerling producers in southern U.S., 2007 . . . . . . . . . . . . . . . . . . . . . . . 9
Table 9. Sizes of largemouth bass fingerlings produced, survey of largemouth bass fingerlingproducers in southern U.S., 2007 . . . . . . . . . . . . . . . . . . . . . . . . . . . . . . . . . . . . . . . . . . . . . . . . . . . . . . . . 10
Table 10. Mean yields, number harvested and survival of fingerling largemouth basson private farms and public hatcheries, by size of fingerling harvested andmanagement practice, survey of largemouth bass fingerling producers insouthern U.S., 2007 . . . . . . . . . . . . . . . . . . . . . . . . . . . . . . . . . . . . . . . . . . . . . . . . . . . . . . . . . . . . . . . . . . . . 11
Table 11. Broodfish holding costs for ponds of 1 acre, 5 acres, 10 acres and 15 acres . . . . . . . . . . . . . . . . . . . . . 13
Table 12. Pond spawning annual costs for ponds of 1 acre, 5 acres, 10 acres and 15 acres . . . . . . . . . . . . . . . . 15
Table 13. Vat/raceway annual costs of spawning . . . . . . . . . . . . . . . . . . . . . . . . . . . . . . . . . . . . . . . . . . . . . . . . . . 16
Table 14. Fry rearing to 2 inches, annual costs in ponds of 1 acre, 5 acres, 10 acres and 15 acres . . . . . . . . . . . 17
Table 15. Feed training annual costs . . . . . . . . . . . . . . . . . . . . . . . . . . . . . . . . . . . . . . . . . . . . . . . . . . . . . . . . . . . . . 19
Table 16. Rearing fingerlings to 4 inches with forage, annual costs in ponds of 1 acre,5 acres, 10 acres and 15 acres . . . . . . . . . . . . . . . . . . . . . . . . . . . . . . . . . . . . . . . . . . . . . . . . . . . . . . . . . . . 20
Table 17. Rearing feedtrained fingerlings to 4 inches, annual costs in ponds of 1 acre,5 acres, 10 acres and 15 acres . . . . . . . . . . . . . . . . . . . . . . . . . . . . . . . . . . . . . . . . . . . . . . . . . . . . . . . . . . . 21
Table 18. Rearing feedtrained fingerlings to 6 inches, annual costs in ponds of 1 acre,5 acres, 10 acres and 15 acres . . . . . . . . . . . . . . . . . . . . . . . . . . . . . . . . . . . . . . . . . . . . . . . . . . . . . . . . . . . 22
Table 19. Costs per largemouth bass fingerling when broodfish were spawned in racewaysinstead of ponds for various management strategies and pond sizes . . . . . . . . . . . . . . . . . . . . . . . . . 23
Table 20. Costs per largemouth bass fingerling when broodfish were fed forage,purchased for various management strategies and pond sizes . . . . . . . . . . . . . . . . . . . . . . . . . . . . . . 24
Table 21. Costs per largemouth bass fingerling when broodfish were fedforage fish available at no cost . . . . . . . . . . . . . . . . . . . . . . . . . . . . . . . . . . . . . . . . . . . . . . . . . . . . . . . . . . 24
4

Costs of Raising Largemouth Bass Fingerlings
Introduction
Black bass are the most popular sportfish among freshwater anglers outside the Great Lakes area (USFWS 2006). In response to its popularity as a sportfish, management of bass populations has included supplemental stocking programs. Propagation of largemouth bass fingerlings for stock enhancement was reported in the U.S. as early as 1893 (Worth 1895) and is a priority program in a number of states. Overall, however, the number of noncommercial (public, state, federal or tribal) facilities producing largemouth bass for recreation, restoration or conservation purposes decreased by 21% from 119 in 1997 (USDA 2000) to 94 in 2005 (USDA 2006), according to the most recent aquaculture census data available. Fortyeight percent of the noncommercial facilities for bass were in the north central region while 37% were in the southeast region of the U.S. Arkansas led the nation in numbers of largemouth bass produced by state hatcheries, followed by Oklahoma (USDA 2006).
In addition to public hatcheries, private fish farms also raise largemouth bass in the U.S. The majority of these farmers sell bass to pay lake and farm pond owners for recreational fishing. In contrast to the decreasing trend in the number of public hatcheries raising largemouth bass, the number of private fish farms raising largemouth bass in the U.S. increased from 136 farms with sales of $4.45 million in 1997 (USDA 1998) to 192 farms with sales of $10.63 million in 2002 (USDA 2006). The north central (37%) and southern (32%) regions had the highest numbers of largemouth bass farms. Although Ohio had the largest number of private farms raising largemouth bass, Arkansas led the nation in volume of largemouth bass sales from private farms, followed by California.
There have been few comprehensive economic analyses on the costs of producing largemouth bass fingerlings. Robinette (1999) showed that fingerling costs constituted 39% of the total costs of raising largemouth bass and 48%51% of variable costs. By contrast, the cost of catfish fingerlings composed only 7% of the total cost and 9% of the variable costs for raising catfish (Engle 2007). Thus, the cost of fingerlings contributed proportionately more to the cost of raising bass than it does for the cost of fingerlings in catfish production. Identification of ways to reduce the cost of producing largemouth bass fingerlings would be a clear benefit to state and federal hatcheries as well as to public and private largemouth bass producers.
When natural resource agencies need estimates of production costs, they have tended to rely on the replacement values reported by Southwick and Loftus (2003) from selfreporting surveys. However, these surveys have not itemized costs or otherwise provided a detailed standardized cost analysis. Thus, it is difficult to reconcile differences such as the reported cost of $1.22 to $2.03 for 68 inch largemouth bass reported in Southwick and Loftus (2003) (Table 1) with the estimated $1.01 to $1.04 cost per 68 inch bass reported by Robinette (1999).
In spite of the importance of largemouth bass for supplemental stocking and the increase in privatefarm production of largemouth bass fingerlings, we have not found a comprehensive economic analysis of fingerling bass production that compares costs across production technologies. The objectives of this study were (1) to characterize production practices for largemouth bass fingerling production on both private farms and public hatcheries; and (2) to estimate and
5

compare production costs for largemouth bass fingerlings of different sizes raised with either forage or pelleted feed. Results of this analysis should provide guidance for managers of both
private farms and public hatcheries. It should also point to lines of research with the greatest potential to reduce costs of producing largemouth bass fingerlings.
Table 1. Estimates of replacement values for largemouth bass fingerlings by size. Fingerling Size Cost in Southeast Region Costs Across Nation
Inches $/fish $/inch $/lba $/fish $/inch $/lb
1
2
3
4
5
6
7
8
$0.35 $0.35
$0.46 $0.23
$0.64 $0.21
$0.81 $0.20
$0.98 $0.20
$1.22 $0.20
$1.66 $0.24
$2.03 $0.25
$778
$225
$52
$28
$18
$12
$10
$8
$0.38
$0.44
$0.79
$0.89
$1.20
$1.68
$2.32
$2.57
$0.38
$0.22
$0.26
$0.22
$0.24
$0.28
$0.33
$0.32
$844
$121
$65
$30
$22
$17
$14
$10
aLengthweight relationships of largemouth bass (Piper et al. 1982) were used to convert costs per fish to costs per pound. SOURCE: Southwick and Loftus (2003).
Survey of Largemouth Bass Fingerling Growersin Southern States
Survey Design
Two surveys were conducted, one of managers of public hatcheries and the second of private farmers that raise largemouth bass fingerlings. Given that the production goals and objectives are distinct for public facilities as compared to private farms, differences in production practices may also differ. Both surveys were conducted only in southern states1 because climate variation would likely affect production performance. The list frame for private farms that raise largemouth bass was developed by contacting extension specialists in all southern states to request names and addresses of private producers of largemouth bass fingerlings. For the public hatchery survey, the state chiefs of fisheries were contacted to identify public hatcheries in each
state in the study area. Questionnaires were developed, pretested with both public hatcheries and private farms, revised and then mailed to all those identified in the study area.
Of the 114 private farms in the list frame, 20 did not raise largemouth bass and seven were returned to sender with incorrect addresses, for a sampling universe of 87 (Table 2). Of these, 19 completed questionnaires were returned for a response rate of 22%. Of the 40 public hatcheries identified in the list frame, two did not raise largemouth bass and one had an incorrect address, resulting in a sampling universe of 37. Of these, 28 completed questionnaires were returned, for a response rate of 76%. Overall, responses were received from private farms in 11 states and from public hatcheries in 14 states.
1Alabama, Arkansas, Florida, Georgia, Kentucky, Louisiana, Maryland, Mississippi, Missouri, Oklahoma, North Carolina, South Carolina, Tennessee, Texas and Virginia.
6
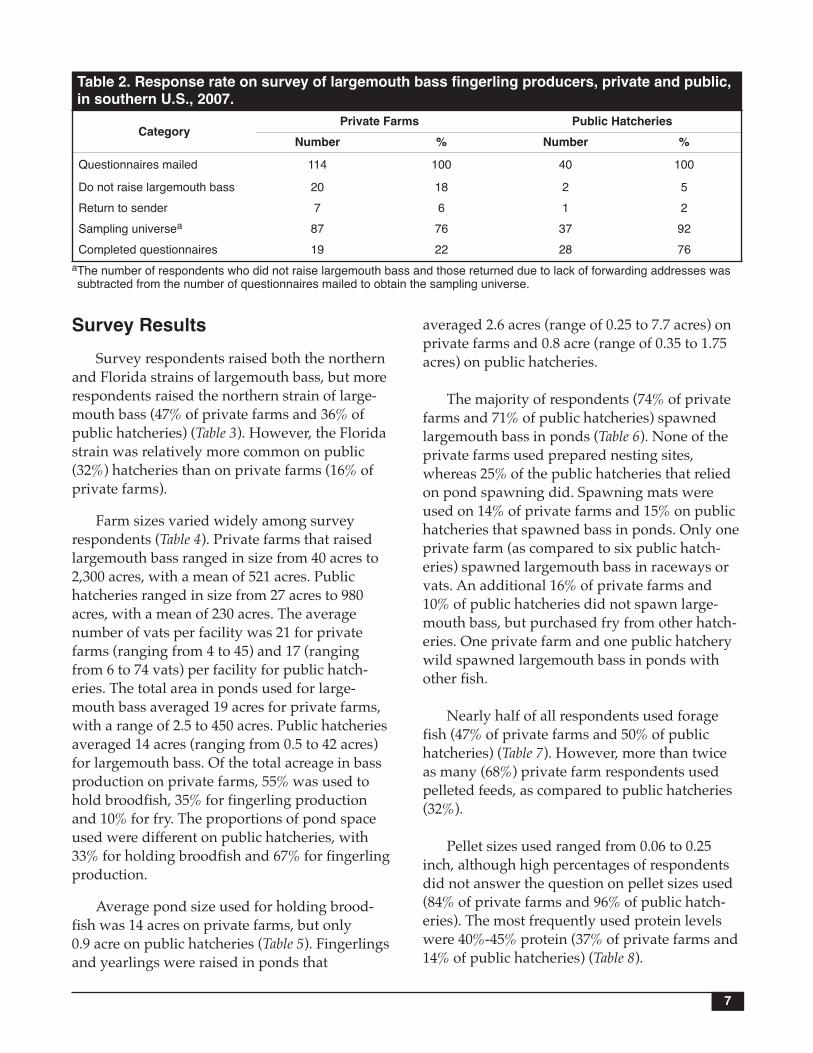
Table 2. Response rate on survey of largemouth bass fingerling producers, private and public,in southern U.S., 2007.
Category Private Farms
Number %
Public Hatcheries
Number %
Questionnaires mailed 114 100 40 100
Do not raise largemouth bass 20 18 2 5
Return to sender 7 6 1 2
Sampling universea 87 76 37 92
Completed questionnaires 19 22 28 76
aThe number of respondents who did not raise largemouth bass and those returned due to lack of forwarding addresses was subtracted from the number of questionnaires mailed to obtain the sampling universe.
Survey Results
Survey respondents raised both the northern and Florida strains of largemouth bass, but more respondents raised the northern strain of largemouth bass (47% of private farms and 36% of public hatcheries) (Table 3). However, the Florida strain was relatively more common on public (32%) hatcheries than on private farms (16% of private farms).
Farm sizes varied widely among survey respondents (Table 4). Private farms that raised largemouth bass ranged in size from 40 acres to 2,300 acres, with a mean of 521 acres. Public hatcheries ranged in size from 27 acres to 980 acres, with a mean of 230 acres. The average number of vats per facility was 21 for private farms (ranging from 4 to 45) and 17 (ranging from 6 to 74 vats) per facility for public hatcheries. The total area in ponds used for largemouth bass averaged 19 acres for private farms, with a range of 2.5 to 450 acres. Public hatcheries averaged 14 acres (ranging from 0.5 to 42 acres) for largemouth bass. Of the total acreage in bass production on private farms, 55% was used to hold broodfish, 35% for fingerling production and 10% for fry. The proportions of pond space used were different on public hatcheries, with 33% for holding broodfish and 67% for fingerling production.
Average pond size used for holding broodfish was 14 acres on private farms, but only 0.9 acre on public hatcheries (Table 5). Fingerlings and yearlings were raised in ponds that
averaged 2.6 acres (range of 0.25 to 7.7 acres) on private farms and 0.8 acre (range of 0.35 to 1.75 acres) on public hatcheries.
The majority of respondents (74% of private farms and 71% of public hatcheries) spawned largemouth bass in ponds (Table 6). None of the private farms used prepared nesting sites, whereas 25% of the public hatcheries that relied on pond spawning did. Spawning mats were used on 14% of private farms and 15% on public hatcheries that spawned bass in ponds. Only one private farm (as compared to six public hatcheries) spawned largemouth bass in raceways or vats. An additional 16% of private farms and 10% of public hatcheries did not spawn largemouth bass, but purchased fry from other hatcheries. One private farm and one public hatchery wild spawned largemouth bass in ponds with other fish.
Nearly half of all respondents used forage fish (47% of private farms and 50% of public hatcheries) (Table 7). However, more than twice as many (68%) private farm respondents used pelleted feeds, as compared to public hatcheries (32%).
Pellet sizes used ranged from 0.06 to 0.25 inch, although high percentages of respondents did not answer the question on pellet sizes used (84% of private farms and 96% of public hatcheries). The most frequently used protein levels were 40%45% protein (37% of private farms and 14% of public hatcheries) (Table 8).
7

Table 3. Strain of largemouth bass raised on private farms and public hatcheries, survey oflargemouth bass fingerling producers in southern U.S., 2007.
Strain Private Farms
Number %
Public Hatcheries
Number % Number Total
%
Northern 9 47 10 36 19 40
Florida 3 16 9 32 12 26
Both 2 10.5 7 25 9 19
Cross 2 10.5 1 4 3 6
No answer 3 16 1 4 4 9
Total 19 100 28 101a 47 100
aPercentages do not add to 100 due to rounding.
Table 4. Mean area of facilities used for production of largemouth bass fingerlings on privatefarms and public hatcheries, survey of largemouth bass fingerling producers in southern U.S.,2007.
Private Farms Public Hatcheries Facilities Unit
Value Range Value Range
Total farm areaa acre 521 402,300 230 27980
Water area acre 214 4942 45 12165
Land area acre 337 31,500 193 30912
Vats
Number no. 21 445 17 674
Volume ft3 748 1346,000 374 1,600
Ponds used for bass
Total area acre 19b 2.5450 14 0.542
Proportion for broodfish % 55 7100 33 069
Proportion for fingerlings % 35 8100 67 31100
aOne farm reported using a recirculating system (RAS) instead of ponds. bThe farm with the RAS used one vat for bass and one other farm bought fry and raised them in vats.
Table 5. Average sizes of ponds (acres) used for largemouth bass fingerling production, surveyof largemouth bass fingerling producers in southern U.S., 2007.
Use n
Private Farms
Mean Range
Public Hatcheries
n Mean Range
Broodstock 5 14 0.550 5 0.9 0.51.25
Fingerling/yearling rearing 6 2.6 0.257.7 6 0.8 0.351.75
8
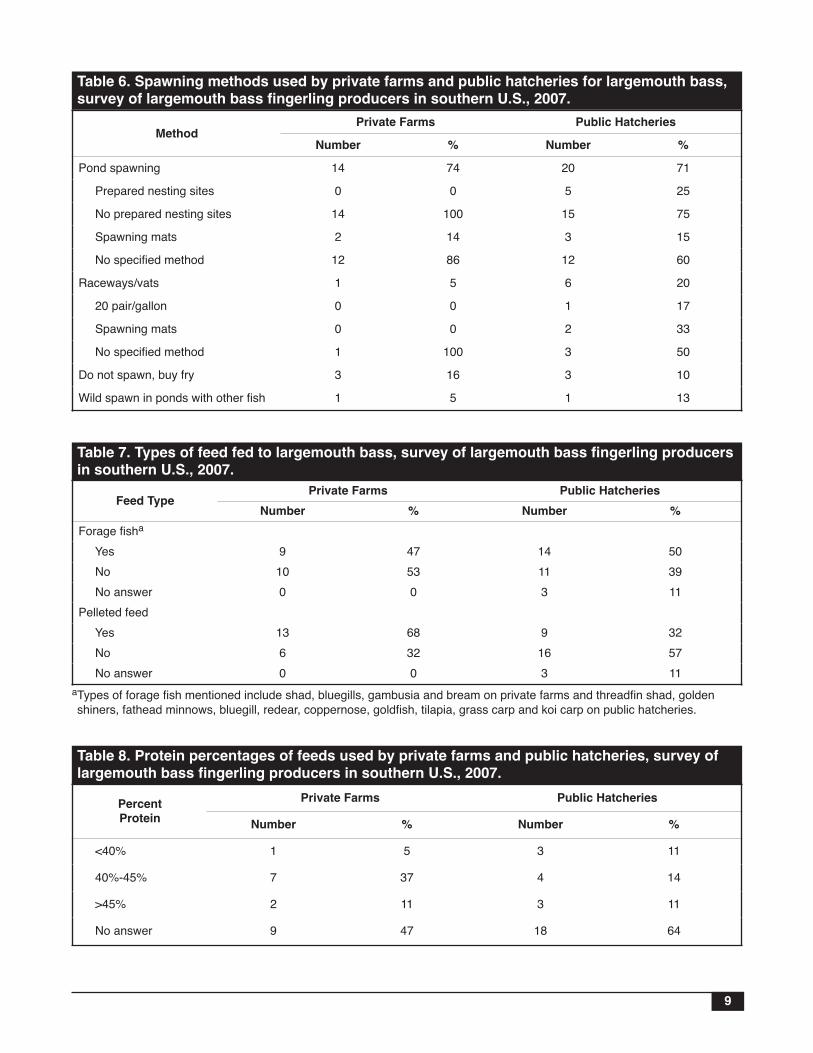
Table 6. Spawning methods used by private farms and public hatcheries for largemouth bass,survey of largemouth bass fingerling producers in southern U.S., 2007.
Private Farms Public Hatcheries Method
Number % Number %
Pond spawning 14 74 20 71
Prepared nesting sites 0 0 5 25
No prepared nesting sites 14 100 15 75
Spawning mats 2 14 3 15
No specified method 12 86 12 60
Raceways/vats 1 5 6 20
20 pair/gallon 0 0 1 17
Spawning mats 0 0 2 33
No specified method 1 100 3 50
Do not spawn, buy fry 3 16 3 10
Wild spawn in ponds with other fish 1 5 1 13
Table 7. Types of feed fed to largemouth bass, survey of largemouth bass fingerling producersin southern U.S., 2007.
Feed Type Private Farms
Number %
Public Hatcheries
Number %
Forage fisha
Yes 9 47 14 50
No 10 53 11 39
No answer 0 0 3 11
Pelleted feed
Yes 13 68 9 32
No 6 32 16 57
No answer 0 0 3 11
aTypes of forage fish mentioned include shad, bluegills, gambusia and bream on private farms and threadfin shad, golden shiners, fathead minnows, bluegill, redear, coppernose, goldfish, tilapia, grass carp and koi carp on public hatcheries.
Table 8. Protein percentages of feeds used by private farms and public hatcheries, survey oflargemouth bass fingerling producers in southern U.S., 2007.
Percent Private Farms Public Hatcheries
Protein Number % Number %
<40% 1 5 3 11
40%45% 7 37 4 14
>45% 2 11 3 11
No answer 9 47 18 64
9

The most common size of largemouth bass fingerling produced was 12 inches (26% of private farms and 62% of public hatcheries) (Table 9). The secondmost frequent size produced was 23 inches on private farms and 35 inches on public hatcheries. Both private farms and public hatcheries produced sizes of bass that ranged from fry to greater than 10 inches.
The survey showed wide disparity in rearing practices, such as stocking and harvesting rates, fertilization, feeding, yields and survival rates (Table 10). Those hatcheries (both private and public) that produced 2inch fingerlings from fry did so primarily in fertilized ponds. Anecdotal comments mentioned that survival and yield were due directly to the quality of the zooplankton bloom achieved with fertilization practices. Yields of fry to 2 inches averaged 142 lb/acre on private farms and 179 lb/acre on public hatcheries (Table 10). Survival rates reported for fry to 2 inches averaged 71% on private farms and 70% on public hatcheries, resulting in average numbers of 2inch bass harvested of 37,116 fish/acre on private farms and 57,828 fish/acre from public hatcheries. Overall, survival rates of fry to 2inch fingerlings ranged from 0% to 123%.
Fingerlings of 4 inches were produced with forage only, or primarily with feed. Yields of 4inch bass fed on forage were higher (300 lb/acre) on private farms than on public hatcheries (160 lb/acre). Feedtrained fingerling yields averaged 200 lb/acre on private farms and 71 lb/acre on public hatcheries. Average reported survival rates of 4inch fingerlings produced averaged 74% to 85% and were similar for private farms and public hatcheries with forage or with feed. Numbers harvested of 4inch bass raised on forage were 8,000/acre on private farms and 7,900/acre on public hatcheries. Feedtrained fish harvested per acre averaged 17,500 fish/acre on private farms and 3,000 fish/acre on public hatcheries.
The majority of larger bass stockers (68 inches) were raised on feed. Reported yields were 2,000 to 2,140 lb/acre on private farms and 403 to 1,058 lb/acre on public hatcheries. Average survival rates of 6inch bass ranged from 78% to 80%, with numbers of fish harvested ranging from 4,744 to 20,000 fingerlings per acre. However, average survivals reported for 8inch bass raised on forage were 28% as compared to 74% to 84% on feed.
Table 9. Sizes of largemouth bass fingerlings pproducers in southern U.S., 2007.
roduced, survey of largemouth bass fingerling
Size Private Farms Public Hatcheries
Inches Number % Number %
Fry 1
12 6
23 4
35 3
68 1
810 2
>10 2
Unknown/no answer 4
4
26
17
13
4
9
9
17
1
28
2
7
4
1
1
1
2
62
4
16
9
2
2
2
10
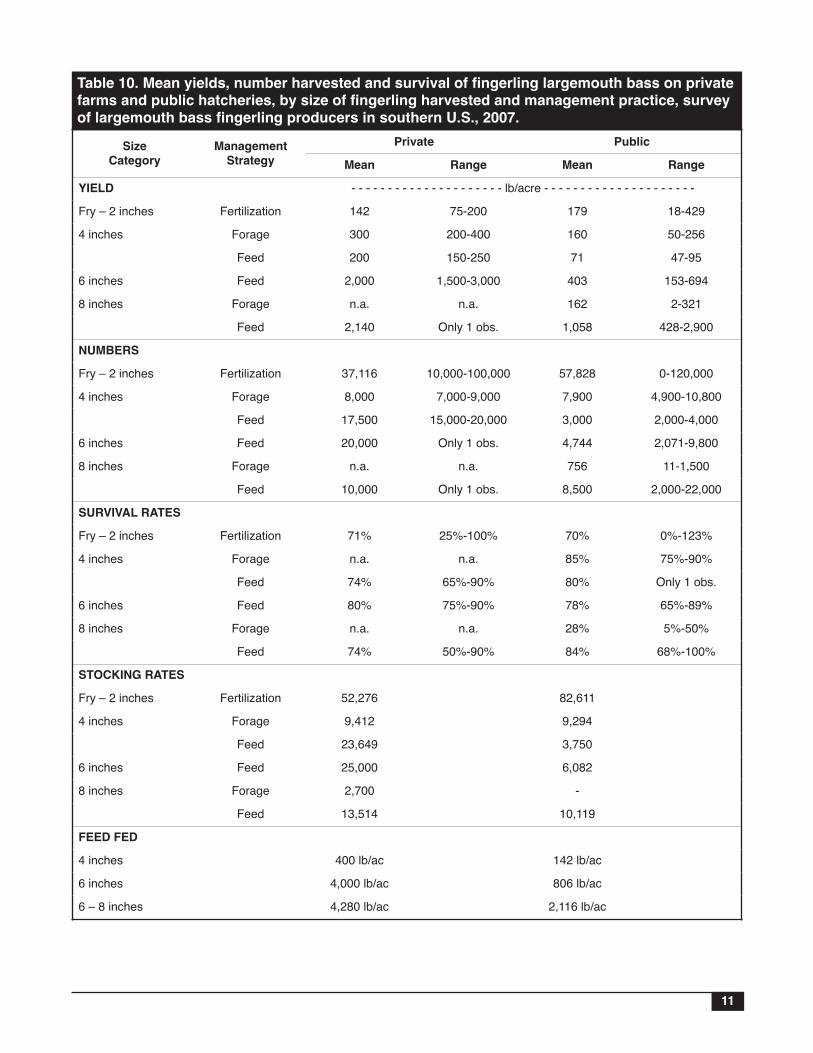
Table 10. Mean yields, number harvested and survival of fingerling largemouth bass on privatefarms and public hatcheries, by size of fingerling harvested and management practice, surveyof largemouth bass fingerling producers in southern U.S., 2007.
Size Category
YIELD
Fry – 2 inches
4 inches
ManagementStrategy
Fertilization
Forage
Feed
Private Public
Mean Range Mean Range
lb/acre 142 75200 179 18429
300 200400 160 50256
200 150250 71 4795
6 inches Feed 2,000 1,5003,000 403 153694
8 inches
NUMBERS
Forage
Feed
n.a. 2,140
n.a. Only 1 obs.
162
1,058
2321
4282,900
Fry – 2 inches
4 inches
Fertilization
Forage
Feed
37,116
8,000
17,500
10,000100,000
7,0009,000
15,00020,000
57,828
7,900
3,000
0120,000
4,90010,800
2,0004,000
6 inches
8 inches
SURVIVAL RATES
Feed
Forage
Feed
20,000
n.a. 10,000
Only 1 obs. n.a.
Only 1 obs.
4,744
756
8,500
2,0719,800
111,500
2,00022,000
Fry – 2 inches
4 inches
6 inches
Fertilization
Forage
Feed
Feed
71%
n.a. 74%
80%
25%100%
n.a. 65%90%
75%90%
70%
85%
80%
78%
0%123%
75%90%
Only 1 obs. 65%89%
8 inches Forage
Feed
n.a. 74%
n.a. 50%90%
28%
84%
5%50%
68%100%
STOCKING RATES
Fry – 2 inches
4 inches
Fertilization
Forage
Feed
52,276
9,412
23,649
82,611
9,294
3,750
6 inches Feed 25,000 6,082
8 inches Forage
Feed
2,700
13,514
10,119
FEED FED
4 inches
6 inches
6 – 8 inches
400 lb/ac
4,000 lb/ac
4,280 lb/ac
142 lb/ac
806 lb/ac
2,116 lb/ac
11

Cost Analysis
Economic engineering techniques were used to develop bioeconomic spreadsheet models of largemouth bass fingerling production. Survey results documented considerable variation in production techniques from farm to farm and between private farms and public hatcheries. Standard enterprise budgeting techniques (Engle 2010; Kay et al. 2011) were used to develop spreadsheet cost analyses for each of the following production phases/management scenarios: (1) broodstock holding; (2) pond spawning; (3) raceway spawning; (4) rearing fry to 2 inches following transfer of fry from spawning pond; (5) feed training; (6) rearing fingerlings to 4 inches on forage fish; (7) rearing feedtrained fingerlings to 4 inches on pelleted feed; and (8) rearing feedtrained fingerlings to 6 inches on pelleted feed. Four pond sizes (1 acre, 5 acre, 10 acre and 15 acre) were modeled for each production phase/management scenario based on the range of pond sizes identified in the survey.
Cost analyses were developed separately for private farms and public hatcheries due to the differences in production parameter values identified in the survey. Costs and relevant assumptions are presented for each production phase/management scenario under separate subheadings. Survey results were used where possible and secondary data used as necessary to complete the analyses.
Broodfish Management
Costs to hold broodfish were estimated based on holding broodfish throughout the nonspawning months of the year (10 months) at a stocking rate of 666 fish/acre, based on survey results. With an average size of 3 lb each, the resulting biomass of broodfish was 2,000 lb/acre.
Broodfish were fed a pelleted feed at 2% of body weight a day for 285 days per year. According to survey results, public hatcheries held broodfish at a much lower density (150 fish/acre; 450 lb/acre) on forage alone with no feeding. This results in a much higher cost to hold broodfish ($92 to $94 per broodfish). However, some hatcheries reduced their costs of holding broodfish by using “extra” fish produced as forage while still others harvested broodfish from the wild without incurring the costs of holding them on the hatchery. The costs vary substantially with these various options, and sensitivity analyses were used to explore these effects.
Both organic (cottonseed meal) and inorganic fertilizer were applied three times a year (twice in spring and once in the fall) at 50 lb/acre/ application of cottonseed meal and 25 lb/acre/ application of inorganic fertilizer. Copper sulfate was assumed to be used for control of filamentous algae. Costs associated with labor, utilities, repairs and maintenance, bird depredation, office supplies and fixed costs were adapted from Stone et al. (2008).
Total variable costs accounted for 88% to 90% of the total costs of holding broodfish (Table 11). The single largest cost of broodfish maintenance was the cost of feed (87% of total variable cost). Annual depreciation of broodfish was the second largest cost. The cost was based on a purchase price of $7 per broodfish and a useful spawning life of three years each. The cost of holding broodfish decreased from $13,478/acre to $13,178/acre as the size of the holding pond increased from 1 to 15 acres, largely due to the lower fixed costs per acre of larger pond sizes. The annual costs of holding broodfish averaged $20 per 3lb broodfish.
12

Table 11. Broodfish holding costs for ponds of 1 acre, 5 acres, 10 acres and 15 acres.
Item Description Unit Cost/unit
Quantity/ acre 1 acre
Pond Size
5 acres 10 acres 15 acres
Variable Costs
Fertilizer Cottonseed meal Inorganic
Feed
Shipping feed
Plankton control Labor Electricity
Fuel Pumping
Repairs and maintenance
Bird depredation
Office supplies
Interest on operatingcapital Total Variable Costs
3 applications/yr 3 applications/yr 1/8 inch pellet
copper sulfate
$165/acre/yr $96/ac/yr
$130/ac/yr $211/ac/yr $97/ac/yr
lb/acre/application
lb/acre/application
lb/ac/yr lb
lb/ac/application
$/acre/month
$/ac/month
$/ac/month
$/ac/month
$/ac/month
acre/month
acre/month
0.212
0.54
0.6
0.3
1.54
$13.75
$8.00
$10.83
$17.58
$8.08
0.52
0.92
0.0083b
150
75
11,400a
11,400a
10.8
10
10
10
10
10
10
10
32
41
6,840
3,420
17
138
80
108
176
81
5
9
908
11,854
159
203
34,200
17,100
83
688
400
542
879
404
26
46
4,542
59,271
318
405
68,400
34,200
166
1,375
800
800
1,758
808
52
92
9,085
118,542
477
608
102,600
51,300
249
2,063
1,200
1,200
2,637
1,212
78
138
13,627
177,813
Fixed Costs
Telephone
Farm insurance
Legal/accounting
Broodstockc
acre/month
acre/month
acre/month
1.42
3.63
1.57
10
10
10
14
36
15
71
181
78
142
363
157
213
544
235
Annual depreciation
Interest on averageinvestment
Ponds
$/pond
$/pond
1.00
1.00
777
116.55
777
117
3,885
583
7,770
1,166
11,655
1,748
Annual depreciation
Interest on averageinvestment
322
161
1,068
534
1,499
750
1,830
915
Equipment Annual depreciation 184 922 1,842 2,764
Interest on averageinvestment 63 314 627 941
Total Fixed Costs 1,624 7,305 13,653 19,853
Total Costs 13,478 66,577 132,195 197,667
Total Costs Per Acre
Cost Per Lb of Broodstock
13,478
6.74
13,315
6.66
13,220
6.61
13,178
6.59
Cost Per Brood Fish 20.24 19.99 19.85 19.79
aBroodstock were fed 2% of body weight (based on survey results of private farms) for 285 days per year. Public hatcheries held broodfish at 450 lb/ac on forage alone, for a much higher cost per fish unless forage was “free.” Others harvested broodfish from the wild at “no cost.”
bMonthly rate, based on 10% Annual Percentage Rate. cBroodstock were assumed to be held at 2,000 lb/ac.
13

Pond Spawning
Pond spawning was assumed to occur for two months of the year, in March and April. For spawning, broodfish were assumed to be stocked at 50 pairs per acre, or 100 fish/acre. The cost per broodfish was taken from Table 11 and entered into the cost spreadsheet as a variable cost because the number of broodfish needed would vary directly with the amount of production. Broodfish holding costs for 10acre ponds were used for private farm costs and for 1acre ponds for public hatcheries due to the different pond sizes used to hold broodfish in the survey. Additional sensitivities were run to assess the effects of varying costs of holding broodfish. Nesting boxes were included in the cost analysis. Other types of costs (fertilizer, labor, utilities, repairs and maintenance) were similar to those used for holding broodfish in ponds. At the end of the spawning period, broodfish were assumed to be moved back to the holding ponds.
The cost of spawning largemouth bass in ponds ranged from $2,790 to $2,740/acre on private farms and from $2,830/acre to $2,780/acre on public hatcheries as the pond size increased from 1 acre to 15 acres each (Table 12). The cost of fry produced ranged from $0.055 to $0.057 per fry. There was little difference in the cost per fry between private farms and public hatcheries. The greatest cost was that of the broodfish, composing 71% to 73% of total costs. This was followed by the cost of nesting boxes. Total variable costs composed 96% to 97% of total costs.
Raceway/Vat Spawning
Survey results showed that some hatcheries have begun to spawn largemouth bass in either vats or raceways. Isaac and Staats (1994) concluded that raceway spawning can produce more fry from the same number of broodfish than pond spawning. Vat spawning techniques were adapted from survey results and from
recommendations reported by Mayes et al. (1993) and Isaac et al. (1998). A twoweek spawning period per pair of broodfish was used, with broodfish rotated every two weeks. Broodfish were also assumed to be injected with human chorionic gonadotropin (HCG). Spawning mats were placed in each raceway. Other variable and fixed costs were adapted from Hinshaw et al. (in preparation).
Overall, the cost of spawning fry produced in raceways was estimated to be $0.00054/fry (Table 13). The greatest cost was that of holding the broodfish (47% of total costs) followed by feed (24% of total costs) and then depreciation on equipment (13% of total costs).
Rearing Fry to 2 Inches FollowingTransfer From Spawning Pond
Fry transfer to nursery ponds was a common practice on both private farms and public hatcheries and was the most common management scenario for public hatcheries. Tidwell et al. (2000) recommended transferring fry to nursery ponds when large numbers could be seen in spawning ponds. Nursery ponds were assumed to be fertilized with cottonseed meal and inorganic fertilizer, with fry reaching 2 inches in 2 months. Yield values were taken from Table 10.
On private farms, the costs per acre were $3,464 to $3,414 with perfingerling costs of $0.09 each. On public hatcheries, total costs per acre to rear fry in ponds were higher and ranged from $5,281 to $5,231/acre, with costs per 2inch fingerling of $0.09 each (Table 14). The difference in cost per acre was due to the higher stocking rate of fry on public hatcheries. However, since the yield of fingerlings on public hatcheries was higher than on private farms, the overall cost per fingerling produced was similar. The greatest cost item was that of the fry stocked (83% to 89% of total costs), followed by fertilizer costs (5% to 8% of total costs).
14

Table 12. Pond spawning annual costs for ponds of 1 acre, 5 acres, 10 acres and 15 acres.
Item Description Unit Cost/unit
Quantity/ acre 1 acre
Total Cost 5 acres 10 acres 15 acres
Variable Costs
Fertilizer, every other week
Cottonseed meal Inorganic fertilizer
Feed
Shipping feed
Algae control Nesting boxes
Labor Electricity
Fuel Pumping
Repairs and maintenance
Bird depredation
Office supplies
Interest on operating capital Total Variable Costs
4 applications/yr 4 applications/yr
1/8 inch
copper sulfate
165/ac/yr $96/ac/yr
$130/ac/yr $211/ac/yr $97/ac/yr
lb/acre/application
lb/acre/application
lb
lb
lb
box
$/ac/month
$/ac/month
$/ac/month
$/ac/month
$/ac/month
$/ac/month
$/ac/month
0.212
0.54
0.6
0.3
1.54
5
13.75
$8.00
$10.83
$17.58
$8.08
0.52
0.92
0.0083a
200
100
13.5
13.5
10.8
85
2
2
2
2
2
2
2
2
42.4
54
8
4
17
425
27
16
22
6
16
1
2
11
651
212
270
40
20
83
2,125
137
80
108
29
81
5
9
53
3,254
424
540
81
40
166
4,250
275
160
217
59
162
10
18
106
6,509
636
810
121
61
249
6,375
412
240
325
88
242
16
28
159
9,763
Fixed Costs
Telephone
Farm insurance
Legal/accounting
Ponds
$/ac/month
$/ac/month
$/ac/month
1.42
3.63
1.57
2
2
2
3
7
3
14
36
16
28
73
31
43
109
47
Annual depreciation 2 months 54 178 250 305
Interest on averageinvestment 2 months 27 89 125 153
Pond Equipment Annual depreciation 31 154 307 461
Interest on averageinvestment 11 52 105 157
Total Fixed Costs 122 473 786 1,075
Private Farms
Broodfish costsc $/broodfish 19.85 100 1,985 9,925 19,849 29,774
Additional interest on operating capital Total costs
Total costs per acre
Cost per fry
0.0083a 33
2,790
2,790
0.056
165
13,817
2,763
0.055
329
27,474
2,747
0.055
494
41,106
2,740
0.055
Public Hatcheries
Broodfish costsb $/broodfish 20.24 100 2,024 10,119 20,237 30,356
Additional interest on operating capital Total costs
Total costs per acre
Cost per fry
0.0083a 34
2,830
2,830
0.057
168
14,014
2,803
0.056
336
27,868
2,787
0.056
504
41,698
2,780
0.056
aMonthly rate, based on 10% Annual Percentage Rate.bBroodstock were held in smaller ponds on public hatcheries. Costs per broodfish for 1acre ponds were used for public hatcheries. cBroodstock were held in larger ponds on private farms. Costs per broodfish for 10acre ponds were used for private farms.
15
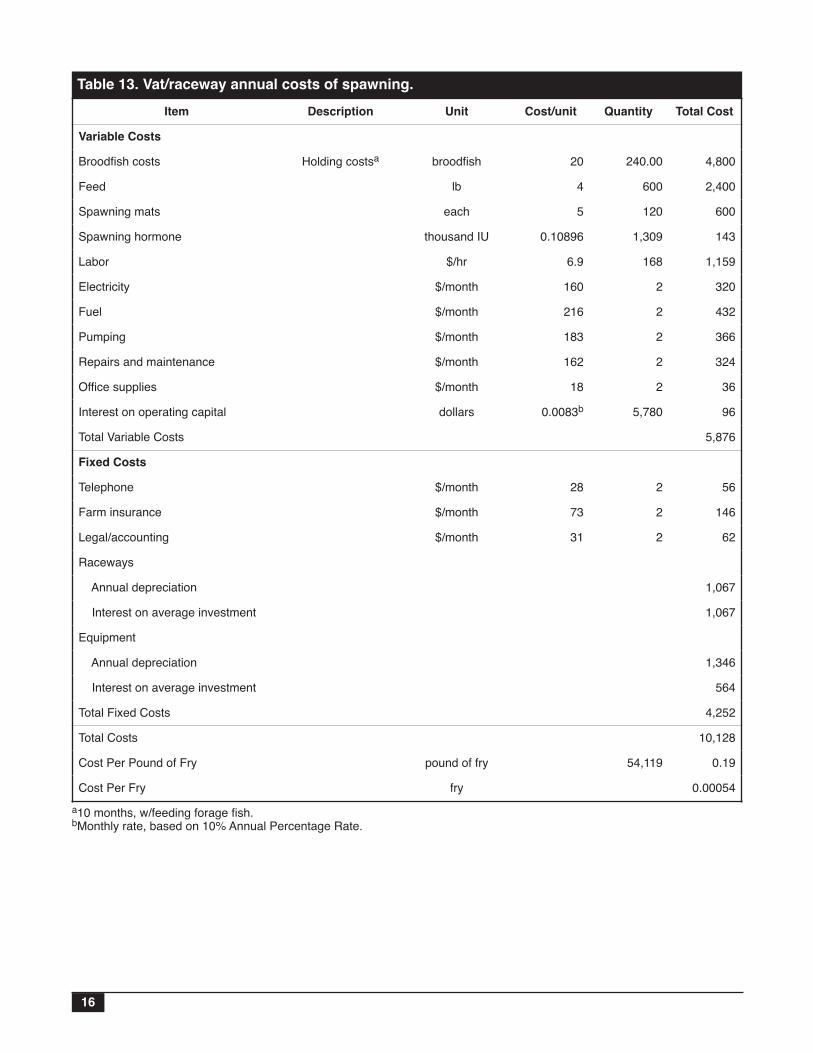
Table 13. Vat/raceway annual costs of spawning. Item Description Unit Cost/unit Quantity Total Cost
Variable Costs
Broodfish costs
Feed
Spawning mats
Spawning hormone
Labor
Electricity
Fuel
Pumping
Repairs and maintenance
Office supplies
Interest on operating capital
Total Variable Costs
Holding costsa broodfish
lb
each
thousand IU
$/hr
$/month
$/month
$/month
$/month
$/month
dollars
20
4
5
0.10896
6.9
160
216
183
162
18
0.0083b
240.00
600
120
1,309
168
2
2
2
2
2
5,780
4,800
2,400
600
143
1,159
320
432
366
324
36
96
5,876
Fixed Costs
Telephone
Farm insurance
Legal/accounting
Raceways
Annual depreciation
Interest on average investment
Equipment
Annual depreciation
Interest on average investment
Total Fixed Costs
$/month
$/month
$/month
28
73
31
2
2
2
56
146
62
1,067
1,067
1,346
564
4,252
Total Costs
Cost Per Pound of Fry
Cost Per Fry
pound of fry
fry
54,119
10,128
0.19
0.00054
a10 months, w/feeding forage fish. bMonthly rate, based on 10% Annual Percentage Rate.
16

Table 14. Fry rearing to 2 inches, annual costs in ponds of 1 acre, 5 acres, 10 acres and 15 acres. Pond Size Item Description Unit Cost/ Quantity/
unit acre 1 acre 5 acres 10 acres 15 acres
Fertilizer, twice a week for 3 weeks, then 1/week
Cottonseed meal 11 applications/yr 0.212 550 117 583 1,166 1,749
Inorganic fertilizer 11 applications/yr 0.54 275 148 742 1,485 2,227
Labor $165/ac/yr $/ac/month 13.75 2 27 137 275 412
Electricity $96/ac/yr $/ac/month $8.00 2 16 80 160 240
Fuel $130/ac/yr $/ac/month $10.83 2 22 108 217 325
Pumping $211/ac/yr $/ac/month $17.58 2 35 176 352 527
Repairs and maintenance $97/ac/yr $/ac/month $8.08 2 17 81 162 242
Bird depredation $/ac/month 0.52 2 1 5 10 16
Oxygen cylinder $/ac/month 25 0.0313 2 8 16 23
Bags to move fry box $/ac/month 60 0.0003 0.04 0.18 0.36 0.54
Office supplies $/ac/month 0.92 2 2 9 18 28
Interest on operating capital 0.0083a 6 32 64 96
Total Variable Costs, excludingfry costs 392 1,962 3,925 5,887
Fixed Costs
Telephone acre/month 1.42 2 3 14 28 43
Farm insurance acre/month 3.63 2 7 36 73 109
Legal/accounting acre/month 1.57 2 3 16 31 47
Ponds
Annual depreciation 2 months 54 178 250 305
Interest on average investment 2 months 27 89 125 153
Equipment Annual depreciation 2 months 31 154 307 461
Interest on average investment 2 months 11 52 105 157
Total Fixed Costs 135 539 919 1,274
Private Farms
Fry 0.055 52,276 2,889 14,446 28,891 43,337
Additional interest on operating capital 0.0083a 48 240 480 719
Total costs 3,464 17,187 34,214 51,217
Total costs per acre 3,464 3,437 3,421 3,414
Cost per lbb 24 24 24 24
Cost per fishb 0.093 0.093 0.092 0.092
Public Hatcheries
Fry
Additional interest on operating capital Total costs
0.057
0.0083a
82,611 4,676
78
5,281
23,378
388
26,268
46,756
776
52,376
70,134
1,164
78,459
Total costs per acre
Cost per lbb
Cost per fishb
5,281
29
0.091
5,254
29
0.091
5,238
29
0.091
5,231
29
0.090
aMonthly rate, based on 10% Annual Percentage Rate.bAverage yields reported in the survey were 179 lb/ac (57,828 fingerlings/ac) on public hatcheries and 142 lb/ac (37,116 fingerlings/ac) on private farms.
17
Feed Training Costs
Survey results showed that 68% of private hatcheries and 32% of public hatcheries raised feedtrained bass. Feedtraining costs were developed from information from Tidwell et al. (2000), Davis and Locke (1997) and Robinette (1999) because the survey did not provide sufficient detail from which to estimate costs. Fingerlings were assumed to be transferred to vats for feed training. Feed used during training included krill, krill meal, crumbles and pelleted feeds increasing up to a 0.1inch pellet. Labor was estimated based on feeding three times a day and frequent grading and transfer of larger fingerling sizes.
Total costs per vat to feedtrain bass were $1,052 for 1,500gallon vats (Table 15). Feed training added $0.0187/fingerling to the cost of producing fingerlings. The costs of krill and krill meal were the greatest costs (77% of total costs) followed by labor.
Rearing Fingerlings to 4 Incheson Forage
Costs to rear fingerlings on forage fish were estimated separately for private farms and for public hatcheries because private farms obtained higher yields. On private farms (that averaged high yields), the costs/acre were decreased slightly with pond size ($13,071/acre to $13,021/acre) and the cost/fingerling was $1.63 each (Table 16). Hatcheries that have access to supplies of forage fish at no cost would reduce their costs of production by 92%. Total costs per acre to rear largemouth bass to 4 inches on forage on public hatcheries were $13,077/acre to $13,027/acre across the various pond sizes. Ninetytwo percent of the cost was the cost of the forage itself; thus, there were few economies of scale and the cost/acre did not decrease greatly
with larger pond sizes. The cost per fingerling on public hatcheries was $1.58 to $1.59 each. Farms and hatcheries that have a source of forage fish at no cost could reduce the cost per fingerling to $0.11 for private farms and $0.04 on public hatcheries.
Rearing FeedTrained Fingerlings to4 Inches on Feed
Feedtrained fingerlings were fed on pellets that began at 0.1 inch and increased up to 0.14inch pellets. On private farms, total costs per acre were $2,433/acre to $2,383/acre, with a perfingerling cost of $0.14 per fish. Feed accounted for 16% to 17% of total costs. On public hatcheries, total costs decreased from $778/acre to $728/acre as pond size increased from 1 acre to 15 acres (Table 17). Public hatchery total cost/acre was lower than on private farms due to the lower feeding rates. Feed costs accounted for 18% to 20% of total costs. The cost per fingerling ranged from $0.26 to $0.24 each, higher than on private farms due to the lower yields.
Rearing FeedTrained Fingerlings to6 Inches on Feed
The final cost analysis estimated the costs of raising bass fingerlings to a market size of 6 inches (Table 18). This required 6 months of growout, with higher amounts of feed used. Assumptions were based on yield values taken from survey responses (Table 10) and other literature (Robinette 1999). Private farm costs were $5,447/acre to $5,597/acre with fingerling costs of from $0.27 to $0.28 per fingerling. Public hatchery costs were $3,214 to $3,364/acre, lower than on private farms due to lower quantities of feed fed. Costs per fingerling on public hatcheries ranged from $0.68 per fingerling to $0.71 per fingerling.
18

Table 15. Feed training annual costs. Item Description Unit Cost/unit Quantity Total Cost
Variable Costs
Feed
Shipping feed
Labor Electricity
Fuel Pumping
Repairs and maintenance
Oxygen
Bags to move fry
Office supplies
Interest on operating capital Total Variable Costs
krill krill meal crumbles
3/32 inch pellet
1/18 inch pellet
lb
lb
lb
lb
lb
lb
$/hr $/month
$/month
$/month
$/month
$/month
$/month
$/month
dollars
19.09
9
0.68
0.68
0.65
0.3
6.9
160
216
183
162
25
60
18
0.0083a
187
3,345
322
56
56
96
0.5
0.5
0.5
0.5
0.5
0.5
0.5
3,467
3,014
219
38
36
0
662
80
108
92
81
13
30
9
33
7,881
Fixed Costs
Telephone
Farm insurance
Legal/accounting
Vats
Annual depreciation
Interest on average investment Holding shed
Annual depreciation
Interest on average investment Equipment
Annual depreciation
Interest on average investment Total Fixed Costs
$/month
$/month
$/month
28
73
31
0.5
0.5
0.5
14
36
15
13
13
62
62
223
96
537
Total Costs
Total Costs Per Vat Cost Per Lb
Cost Per Fish
8,418
1,052
6.54
0.0187
aMonthly rate, based on 10% Annual Percentage Rate.
19
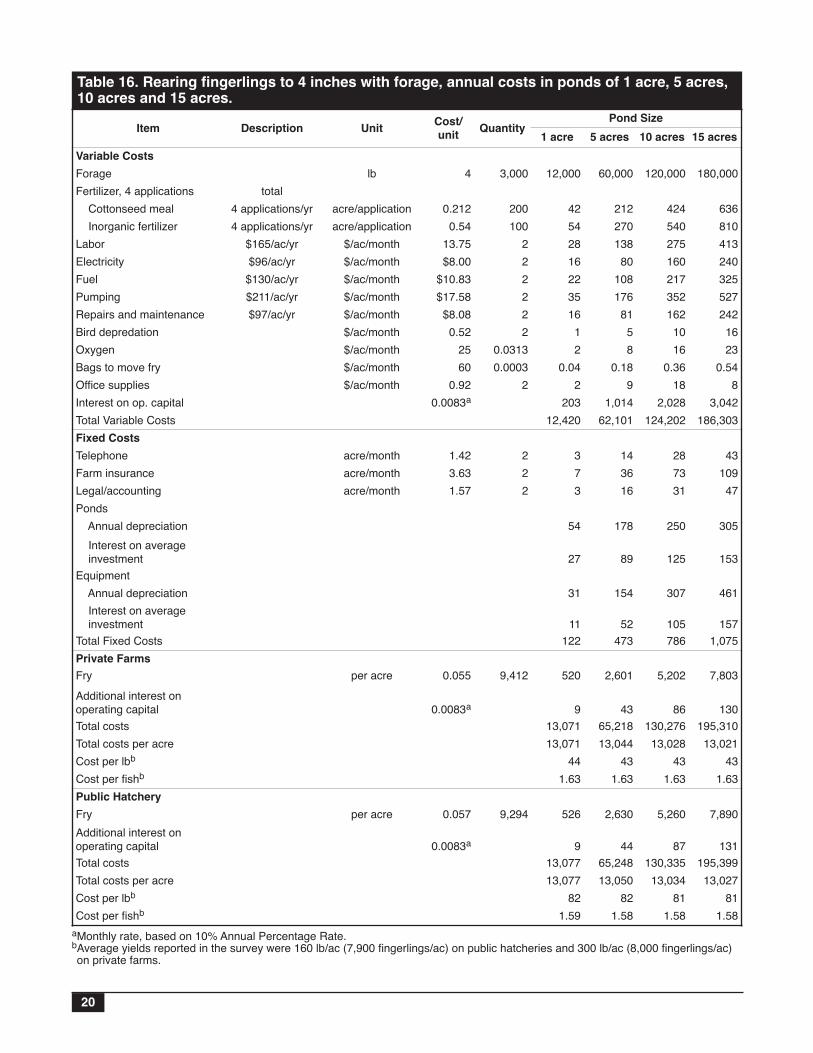
Table 16. Rearing fingerlings to 4 inches with forage, annual costs in ponds of 1 acre, 5 acres,10 acres and 15 acres.
Item Description Unit Cost/unit Quantity 1 acre
Pond
5 acres
Size
10 acres 15 acres
Variable Costs
Forage lb 4 3,000 12,000 60,000 120,000 180,000
Fertilizer, 4 applications total Cottonseed meal 4 applications/yr acre/application 0.212 200 42 212 424 636
Inorganic fertilizer 4 applications/yr acre/application 0.54 100 54 270 540 810
Labor $165/ac/yr $/ac/month 13.75 2 28 138 275 413
Electricity $96/ac/yr $/ac/month $8.00 2 16 80 160 240
Fuel $130/ac/yr $/ac/month $10.83 2 22 108 217 325
Pumping $211/ac/yr $/ac/month $17.58 2 35 176 352 527
Repairs and maintenance $97/ac/yr $/ac/month $8.08 2 16 81 162 242
Bird depredation $/ac/month 0.52 2 1 5 10 16
Oxygen $/ac/month 25 0.0313 2 8 16 23
Bags to move fry $/ac/month 60 0.0003 0.04 0.18 0.36 0.54
Office supplies $/ac/month 0.92 2 2 9 18 8
Interest on op. capital 0.0083a 203 1,014 2,028 3,042
Total Variable Costs 12,420 62,101 124,202 186,303
Fixed Costs
Telephone acre/month 1.42 2 3 14 28 43
Farm insurance acre/month 3.63 2 7 36 73 109
Legal/accounting acre/month 1.57 2 3 16 31 47
Ponds
Annual depreciation 54 178 250 305
Interest on averageinvestment 27 89 125 153
Equipment Annual depreciation 31 154 307 461
Interest on averageinvestment 11 52 105 157
Total Fixed Costs 122 473 786 1,075
Private Farms
Fry per acre 0.055 9,412 520 2,601 5,202 7,803
Additional interest on operating capital 0.0083a 9 43 86 130
Total costs 13,071 65,218 130,276 195,310
Total costs per acre 13,071 13,044 13,028 13,021
Cost per lbb 44 43 43 43
Cost per fishb 1.63 1.63 1.63 1.63
Public Hatchery
Fry per acre 0.057 9,294 526 2,630 5,260 7,890
Additional interest on operating capital 0.0083a 9 44 87 131
Total costs 13,077 65,248 130,335 195,399
Total costs per acre 13,077 13,050 13,034 13,027
Cost per lbb 82 82 81 81
Cost per fishb 1.59 1.58 1.58 1.58
aMonthly rate, based on 10% Annual Percentage Rate.bAverage yields reported in the survey were 160 lb/ac (7,900 fingerlings/ac) on public hatcheries and 300 lb/ac (8,000 fingerlings/ac) on private farms.
20

Table 17. Rearing feedtrained fingerlings to 4 inches, annual costs in ponds of 1 acre, 5 acres,10 acres and 15 acres.
Item Description Unit Cost/unit Quantity 1 acre
Pond Size 5 acres 10 acres 15 acres
Variable Costs Fertilizer
Cottonseed meal Inorganic fertilizer
Labor Electricity Fuel Pumping Repairs and maintenance Bird depredation Oxygen Bags to move fry Office supplies Interest on operating capital Total Variable Costs
1 1
$165/ac/yr $96/ac/yr
$130/ac/yr $211/ac/yr $97/ac/yr
cylinder box
acre/application acre/application
$/ac/month $/ac/month $/ac/month $/ac/month $/ac/month $/ac/month
acre/month $/ac/month
dollars
0.212 0.54
13.75 $8.00
$10.83 $17.58
$8.08 0.52
25 60
0.92 0.0083a
50 25
2 2 2 2 2 2
0.0313 0.0003
2
10.6 13 27 16 22 35 17
1 2
0.036 2 2
147
53 67
137 80
108 176
81 5
78 0.18
9 12
737
106 135 275 160 217 352 162
10 16
0.36 18 24
1,475
159 202 412 240 325 527 242
16 23
0.54 28 36
2,212 Fixed Costs Telephone Farm insurance Legal/accounting Ponds
$/ac/month $/ac/month $/ac/month
1.42 3.63 1.57
2 2 2
3 7 3
14 36 16
28 73 31
43 109
47
Annual depreciation 54 178 250 305
Interest on averageinvestment 27 89 125 152
EquipmentAnnual depreciation 31 154 307 461
Interest on averageinvestment 11 52 4 157
Total Fixed Costs Private Farms
135 539 818 1,274
Fry Feed training Feed
Shipping feed
3/32 inch 1/8 inch
per acre
lb lb lb
0.055 0.0187
0.65 0.6 0.3
23,649
133.33 266.67
400
1,307 442 160 120 120
6,535 2,211
800 600 600
13,070 4,422 1,600 1,200 1,200
19,605 6,633 2,400 1,800 1,800
Additional interest on operating capital Total costs
0.0083a 35 2,433
176 12,031
351 23,895
527 35,750
Total costs per acre Cost per lbb
Cost per fishb
Public Hatcheries
2,433 12.17
0.14
2,406 12.03
0.14
2,390 11.95
0.14
2,383 11.92
0.14
Fry Feed training Feed
Shipping feed Additional interest on
3/32 inch 1/8 inch
per acre
lb lb lb
0.057 0.0187
0.65 0.6 0.3
4,750
47.33 94.67
142
269 89 57 43 43
1,344 444 284 213 213
2,688 888 568 426 426
4,033 1,332
852 639 639
operating capital Total costs
0.0083a 8 778
40 3,756
81 7,345
121 10,924
Total costs per acre Cost per lbb
Cost per fishb
778 11
0.26
751 11
0.25
734 10
0.24
728 10
0.24 aMonthly rate, based on 10% Annual Percentage Rate. bAverage yields reported in the survey were 71 lb/ac (3,000 fingerlings/ac) on public hatcheries and 200 lb/ac (17,500 fingerlings/ac) on private farms.
21
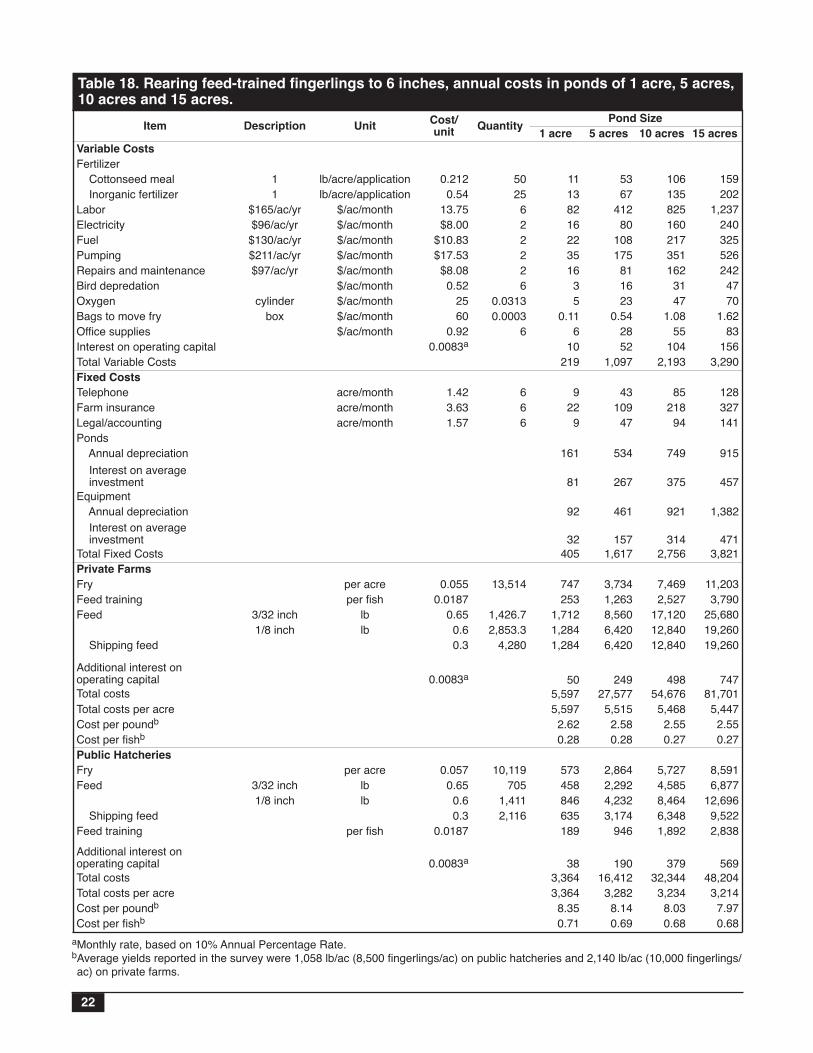
Table 18. Rearing feedtrained fingerlings to 6 inches, annual costs in ponds of 1 acre, 5 acres,10 acres and 15 acres.
Item Description Unit Cost/unit Quantity 1 acre
Pond Size 5 acres 10 acres 15 acres
Variable Costs Fertilizer
Cottonseed meal Inorganic fertilizer
Labor Electricity Fuel Pumping Repairs and maintenance Bird depredation Oxygen Bags to move fry Office supplies Interest on operating capital Total Variable Costs Fixed Costs
1 1
$165/ac/yr $96/ac/yr
$130/ac/yr $211/ac/yr $97/ac/yr
cylinder box
lb/acre/application lb/acre/application
$/ac/month $/ac/month $/ac/month $/ac/month $/ac/month $/ac/month $/ac/month $/ac/month $/ac/month
0.212 0.54
13.75 $8.00
$10.83 $17.53
$8.08 0.52
25 60
0.92 0.0083a
50 25
6 2 2 2 2 6
0.0313 0.0003
6
11 13 82 16 22 35 16
3 5
0.11 6
10 219
53 67
412 80
108 175
81 16 23
0.54 28 52
1,097
106 135 825 160 217 351 162
31 47
1.08 55
104 2,193
159 202
1,237 240 325 526 242
47 70
1.62 83
156 3,290
Telephone Farm insurance Legal/accounting Ponds
acre/month acre/month acre/month
1.42 3.63 1.57
6 6 6
9 22
9
43 109
47
85 218
94
128 327 141
Annual depreciation 161 534 749 915
Interest on averageinvestment 81 267 375 457
Equipment Annual depreciation
Interest on averageinvestment
92
32
461
157
921
314
1,382
471 Total Fixed Costs Private Farms
405 1,617 2,756 3,821
Fry Feed training Feed
Shipping feed
3/32 inch 1/8 inch
per acre per fish
lb lb
0.055 0.0187
0.65 0.6 0.3
13,514
1,426.7 2,853.3
4,280
747 253
1,712 1,284 1,284
3,734 1,263 8,560 6,420 6,420
7,469 2,527
17,120 12,840 12,840
11,203 3,790
25,680 19,260 19,260
Additional interest on operating capital Total costs
0.0083a 50 5,597
249 27,577
498 54,676
747 81,701
Total costs per acre Cost per poundb
Cost per fishb
Public Hatcheries
5,597 2.62 0.28
5,515 2.58 0.28
5,468 2.55 0.27
5,447 2.55 0.27
Fry Feed
Shipping feed Feed training
3/32 inch 1/8 inch
per acre lb lb
per fish
0.057 0.65
0.6 0.3
0.0187
10,119 705
1,411 2,116
573 458 846 635 189
2,864 2,292 4,232 3,174
946
5,727 4,585 8,464 6,348 1,892
8,591 6,877
12,696 9,522 2,838
Additional interest on operating capital Total costs
0.0083a 38 3,364
190 16,412
379 32,344
569 48,204
Total costs per acre Cost per poundb
Cost per fishb
3,364 8.35 0.71
3,282 8.14 0.69
3,234 8.03 0.68
3,214 7.97 0.68
aMonthly rate, based on 10% Annual Percentage Rate.bAverage yields reported in the survey were 1,058 lb/ac (8,500 fingerlings/ac) on public hatcheries and 2,140 lb/ac (10,000 fingerlings/ ac) on private farms.
22
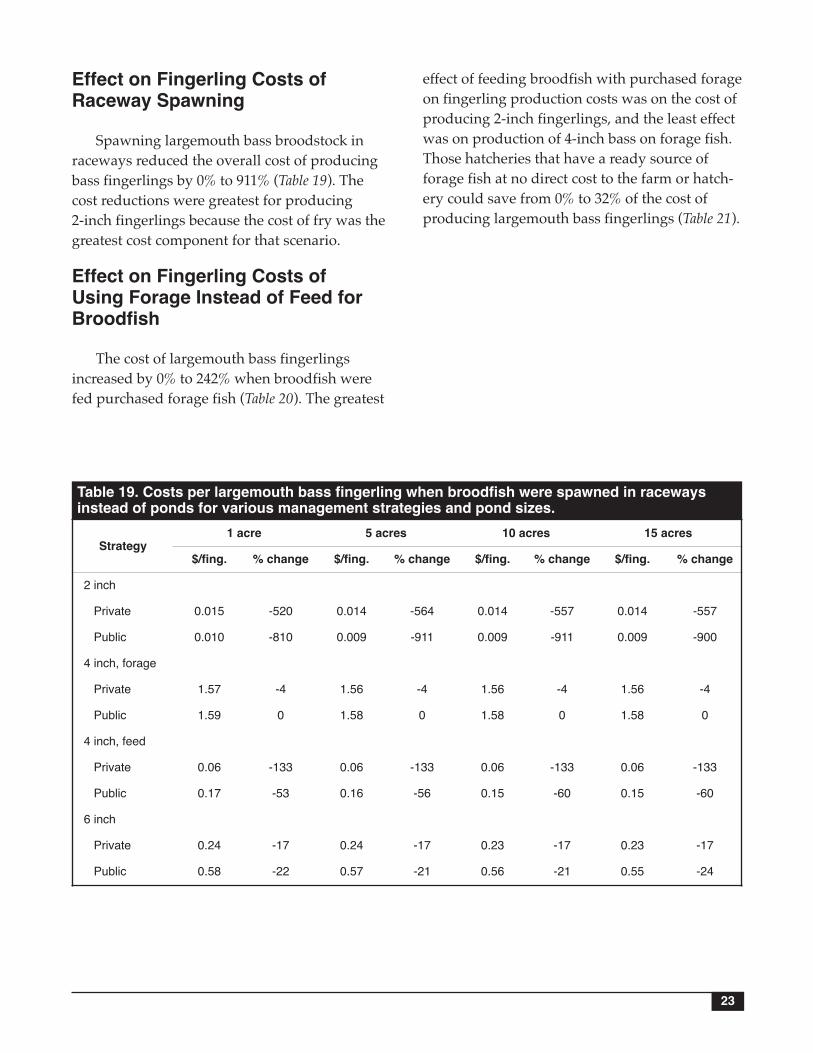
Effect on Fingerling Costs ofRaceway Spawning
Spawning largemouth bass broodstock in raceways reduced the overall cost of producing bass fingerlings by 0% to 911% (Table 19). The cost reductions were greatest for producing 2inch fingerlings because the cost of fry was the greatest cost component for that scenario.
Effect on Fingerling Costs ofUsing Forage Instead of Feed forBroodfish
The cost of largemouth bass fingerlings increased by 0% to 242% when broodfish were fed purchased forage fish (Table 20). The greatest
effect of feeding broodfish with purchased forage on fingerling production costs was on the cost of producing 2inch fingerlings, and the least effect was on production of 4inch bass on forage fish. Those hatcheries that have a ready source of forage fish at no direct cost to the farm or hatchery could save from 0% to 32% of the cost of producing largemouth bass fingerlings (Table 21).
Table 19. Costs per largemouth bass fingerling when broodfish were spawned in racewaysinstead of ponds for various management strategies and pond sizes.
1 acre 5 acres 10 acres 15 acres Strategy
$/fing. % change $/fing. % change $/fing. % change $/fing. % change
2 inch
Private 0.015 520 0.014 564 0.014 557 0.014 557
Public 0.010 810 0.009 911 0.009 911 0.009 900
4 inch, forage
Private 1.57 4 1.56 4 1.56 4 1.56 4
Public 1.59 0 1.58 0 1.58 0 1.58 0
4 inch, feed
Private 0.06 133 0.06 133 0.06 133 0.06 133
Public 0.17 53 0.16 56 0.15 60 0.15 60
6 inch
Private 0.24 17 0.24 17 0.23 17 0.23 17
Public 0.58 22 0.57 21 0.56 21 0.55 24
23

Table 20. Costs per largemouth bass fingerling when broodfish were fed forage, purchased forvarious management strategies and pond sizes.
1 acre 5 acres 10 acres 15 acres Strategy
$/fing. % change $/fing. % change $/fing. % change $/fing. % change
2 inch
Private 0.304 +227 0.303 +226 0.303 +228 0.303 +228
Public 0.308 +238 0.308 +238 0.308 +238 0.308 +242
4 inch, forage
Private 1.81 +10 1.81 +10 1.80 +10 1.80 +10
Public 1.59 0 1.58 0 1.58 0 1.58 0
4 inch, feed
Private 0.34 +143 0.34 +143 0.34 +143 0.34 +143
Public 0.50 +92 0.49 +96 0.48 +100 0.48 +100
6 inch
Private 0.38 +36 0.38 +36 0.38 +41 0.38 +41
Public 1.04 +46 1.03 +49 1.02 +50 1.01 +49
Table 21. Costs per largemouth bass fingerling when broodfish were fed forage fish availableat no cost.
1 acre 5 acres 10 acres 15 acres Strategy
$/fing. % change $/fing. % change $/fing. % change $/fing. % change
2 inch
Private 0.065 30 0.064 31 0.064 30 0.063 32
Public 0.066 27 0.065 29 0.065 29 0.065 28
4 inch, forage
Private 1.61 1 1.61 1 1.60 2 1.60 2
Public 1.59 0 1.58 0 1.58 0 1.58 0
4 inch, feed
Private 0.11 21 0.11 21 0.11 21 0.11 21
Public 0.23 12 0.22 12 0.22 8 0.21 12
6 inch
Private 0.27 4 0.26 7 0.26 4 0.26 4
Public 0.67 6 0.65 6 0.64 6 0.64 6
24
Summary and Conclusions
The costs of producing largemouth bass fingerlings varied greatly across the management scenarios, as follows:
• Pondspawned fry cost $0.055 to $0.057 per fry
• Racewayspawned fry cost $0.0054 per fry
• 2inch bass fingerlings cost $0.09 per fingerling
• Feed training cost $0.0187 per fingerling
• 4inch fingerlings raised on forage cost $1.58 to $1.63 per fingerling
• 4inch fingerlings raised on feed cost $0.14 per fingerling on private farms and $0.24 to $0.26 on public hatcheries
• 6inch fingerlings cost $0.27 to $0.28 per fingerling on private farms and $0.68 to $0.71 on public hatcheries
The production costs were similar for private farms and public hatcheries where management practices were similar. However, private farms that raised feedtrained fingerlings stocked at higher rates and obtained greater yields than did public hatcheries. The greater yields resulted in reductions in the cost per fingerling.
The leastcost fingerling was 2inch fingerlings raised primarily in fertilized ponds. However, the cost per fingerling of 4inch feedtrained fingerlings was only $0.05 per fingerling more when raised at the densities and feeding rates used on private farms. Raising 4inch fingerlings on forage resulted in a more than 100fold increase in the cost per 4inch fingerling.
The costs estimated in this analysis are substantially lower than those reported by Southwick and Loftus (2003). It should be noted that the Southwick and Loftus (2003) values are intended for use as replacement values following fish kills and were not developed with standardized cost budgeting methods. It should also be noted that different facilities will likely have differing costs. It would be best for facilities to attempt to track costs annually at their facilities using the cost analysis framework developed in this analysis. However, it can be difficult to apportion costs across various species and sizes raised on facilities that produce a large number of species and sizes of fish.
This analysis is the first to present a comprehensive comparison of production costs of largemouth bass fingerling production. Given the variation in management practices and in production parameter values such as yield and survival, there appears to be substantial need for additional research on optimizing largemouth bass fingerling production strategies. Reducing the variability of yields and survival, particularly in the early production stages, would have a substantial effect on reducing costs of producing 2inch fingerlings. Raceway spawning methods also appear to have the potential to reduce costs of producing largemouth bass fingerlings. Results of this analysis should be of value to farmers and hatchery managers to make decisions on the most costeffective production methods for their farms and hatcheries.
25
References
Davis, J. T., and J. T. Locke. 1997. Culture of largemouth bass fingerlings. Southern Regional Aquaculture Center Publication No. 201, Southern Regional Aquaculture Center, Mississippi State, Mississippi.
Engle, C. R. 2007. Arkansas Catfish Production Budgets. MP466, Arkansas Cooperative Extension Program, University at Pine Bluff, Pine Bluff, Arkansas.
Isaac, J., Jr., T. M. Kimmel, R. W. Bagley and V. H. Staats. 1998. Spawning behavior of Florida largemouth bass in an indoor raceway. The Progressive FishCulturist 60:5962.
Isaac, J., and V. H. Staats. 1994. Florida largemouth bass raceway spawning substrate evaluation. Proceedings of the Annual Conference, Southeastern Association of Fish and Wildlife Agency 46(1992):453457.
Kay, R. D., W. M. Edwards and P. A. Duffy. 2011. Farm Management, 7th Edition. McGrawHill, New York.
Mayes, K. B., P. M. Rosenbloom and T. M. Brandt. 1993. Raceway spawning of Florida largemouth bass: effects of acclimation time and hormone treatment on spawning success. The Progressive FishCulturist 55:18.
Piper, R. G., I. B. McElwain, L. E. Orme, J. P. McCraren, L. G. Fowler and J. R. Leonard. 1982. Fish hatchery management. United States Department of the Interior, Fish and Wildlife Service, Washington, D.C.
Robinette, J. M. 1999. Production and enterprise budgets for largemouth bass fed three commercial diets. Master ’s thesis. Auburn University, Auburn, Alabama.
Southwick, R. I., and A. J. Loftus. 2003. Investigation and monetary values of fish and freshwater mussel kills. American Fisheries Society Special Publication 30, American Fisheries Society, Bethesda, Maryland.
Stone, N., C. R. Engle and E. Park. 2008. Production enterprise budget for golden shiners. SRAC Publication No. 122, Southern Regional Aquaculture Center, Mississippi State University, Mississippi.
Tidwell, J. H., S. D. Coyle and T. A. Woods. 2000. Species profile: largemouth bass. SRAC Publication No. 722, Southern Regional Aquaculture Center, Mississippi State University, Mississippi.
United States Department of Agriculture. 2000. Census of Aquaculture (1998). National Agricultural Statistics Service, United States Department of Agriculture, Washington, D.C.
United States Department of Agriculture. 2006. Census of Aquaculture (2005). National Agricultural Statistics Service, United States Department of Agriculture, Washington, D.C.
United States Fish and Wildlife Service. 2006. 2006 national survey of fishing, hunting and wildlifeassociated recreation. United States Fish and Wildlife Service, Washington, D.C.
Worth, S. 1895. Report on the propagation and distribution of foodfishes. Pages 78139 in Report of the Commissioner for the Year Ending June 30, 1893. United States Commission of Fisheries, Washington D.C. Government Printing Office.
26

Blank – Inside back cover
27
Accredited by North Central Association of Colleges and Schools Commission on Institutions of Higher Education, 30 N. LaSalle, Suite 2400, Chicago, Illinois 606022504, 18006217440/FAX: 3122637462.
Printed by University of Arkansas Cooperative Extension Service Printing Services.
Issued in furtherance of Extension work, Act of September 29, 1977, in cooperation with the U.S. Department of Agriculture, Dr. James O. GarnerJr., Dean/Director, 1890 Research and Extension Programs, Cooperative Extension Program, University of Arkansas at Pine Bluff. The University of Arkansas at Pine Bluff School of Agriculture, Fisheries and Human Sciences offers its programs to all eligible persons regardless of race, color, national origin, religion, gender, age, disability, marital or veteran status, or any other legally protected status, and is an Affirmative Action/Equal Opportunity Employer.
ETB260PD413N