costs of control exercise carfi salvatore 37th conference of directors of eu paying agencies riga 7...
TRANSCRIPT
1
Costs of Control Exercise
Carfi Salvatore
37th Conference of Directors of EU Paying AgenciesRiga
7 May 2015
2
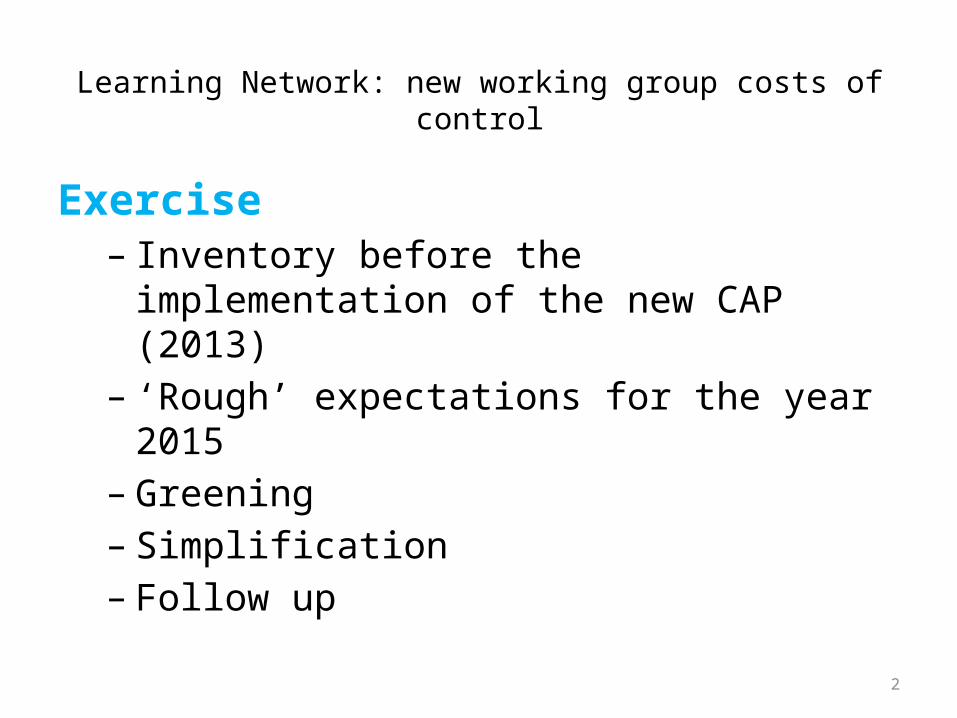
Learning Network: new working group costs of control
Exercise– Inventory before the implementation of the new
CAP (2013)– ‘Rough’ expectations for the year 2015– Greening – Simplification– Follow up

3
Results
• Responses from participants 23 MS• But… not all questions filled in• Rough indications, first impression, first step• No statistical valid exercise

4
Some statistics
Number of reference parcels (2015 compared to 2013) -10%
Percentage greening parcels 2015 (compared to all parcels) 35%
Average number of reference parcels in 2015 1,760,000

5
2015 and beyond• Do you expect an increase in the costs of control? yes: 18 out of
23 respondents• Biggest categories of increase being expected in:
– OTSC, crosschecks, travelling, CWRS– Administrative controls– Greening controls– EFA Layer– LPIS requirements– IT– Wages– Operational Costs– Delegated body Costs– Direct payments in general

6
Comparison 2015 to 2013
Market Measures
• Administrative & other controls– FTE: -4% – Number of controls: -7%
• OTSC– FTE: +14%– Number of controls: +16%Remark: rough estimates, based on partly filled in questionnaires

7
Comparison 2015 to 2013
Direct Payments• Administrative & other controls– FTE: +25% – Number of controls: +31%
• OTSC– FTE: +22%– Number of controls: +31%Remark: rough estimates, based on partly filled in questionnaires

8
Comparison 2015 to 2013
Rural Development Programme
• Administrative & other controls– FTE: +11% – Number of controls: +16%
• OTSC– FTE: +45%– Number of controls: +16%Remark: rough estimates, based on partly filled in questionnaires

9
Some examples impact greening
Average yearly costs of maintenance EFA layer per parcel: 4,25 €7,5 million € per MS: 210 milion euro (extrapolated to all 28 MS : 210 million € )
Average yearly costs photo interpretation per parcel: 4 €7,1 million € per MS(extrapolated to all 28 MS: 210 million €)
Remark: rough estimates, based on partly filled in questionnaires
10
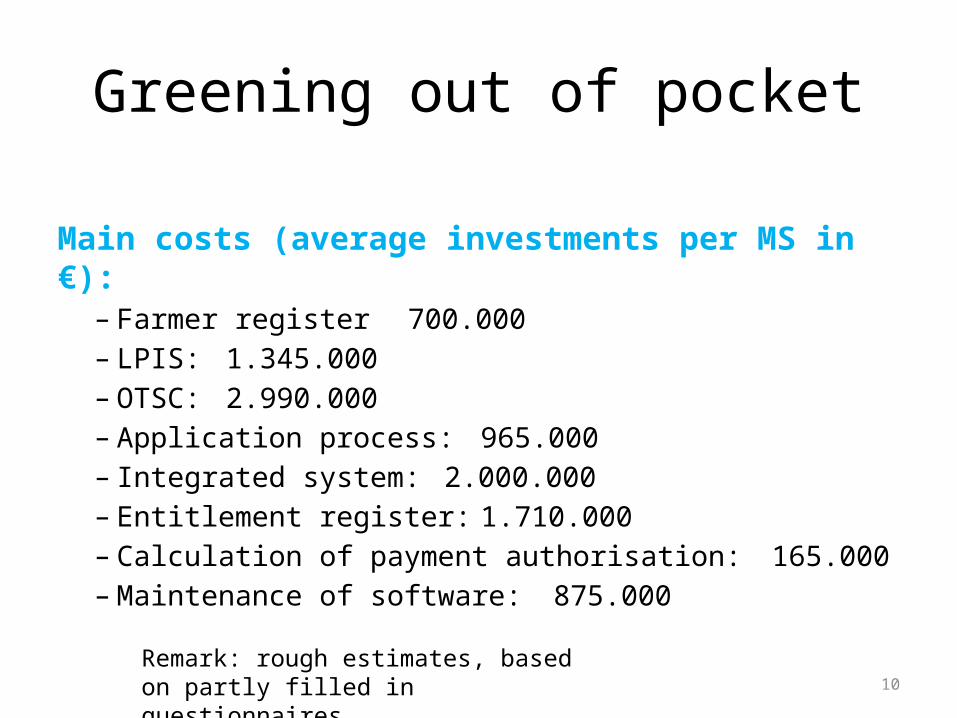
Greening out of pocket
Main costs (average investments per MS in €):– Farmer register 700.000– LPIS: 1.345.000– OTSC: 2.990.000– Application process: 965.000– Integrated system: 2.000.000– Entitlement register: 1.710.000– Calculation of payment authorisation: 165.000– Maintenance of software: 875.000
Remark: rough estimates, based on partly filled in questionnaires

11
Greening out of pocket Averages per MS (€)
Farm
er regis
terLP
IS
On the sp
ot contro
ls
Applicati
on proce
ss
Integrated sy
stem
Entitlement r
egister
Calculati
on of pay
ment auth
orisati
on
Main
tenance
of software
0
1000000
2000000
3000000

12
Simplification proposals and impact
21% decrease in expected costs of control if:• Lowering % OTSC, avoid 100% (market measures)• Lowering control rate in general, including greening and
small farmers• Combine samples Direct Payments and RDP• Simplify procedures crop diversification, EFA’s,
certification schemes• No double controls, 1 farm visit• Wider use remote sensing• Reduction administrative controls

13
Main conclusions
The bad news:• Most PA’s expect an increase in the costs of control in 2015 and
beyond (18 Yes, 2 No)• Expected raise of the yearly number of controls and FTE involved of
11-45% for Direct Payments and RDP (compared to 2013)• Main triggers: greening, LPIS, wages, controls, especially OTSC• Apparently small control elements (e.g. EFA layer maintenanc and
photo interpretation) are costing hundreds millions of euro’sThe good news:• Potential simplification proposals: 21% reduction in costs (control
procedures, greening procedures)• In the interest of farmer, PA’s and EC

14
Follow up
• First step in Riga• Second half 2015: – completion missing data of this excercise– further exploration main cost drivers,
• First half 2016: simplification proposals costs of control
• Looking forward to co-operate with EC

15