costs and profitability analysis for cabbage production … · costs and profitability analysis for...
TRANSCRIPT
0 Sample Cabbage Production Costs and Profitability Analysis, Oxnard Plain, Ventura County, 2013
COSTS AND PROFITABILITY ANALYSIS FOR CABBAGE PRODUCTION IN THE OXNARD PLAIN,
VENTURA COUNTY, 2012-13
Etaferahu Takele, Area Farm Advisor, Agricultural Economics/Farm Management, University of California Cooperative Extension (UCCE) Southern California
Oleg Daugovish, Farm Advisor, Vegetable Crops and Strawberries, UCCE Ventura County MaoVue, Staff Research Associate, UCCE Southern California
1 Costs and Profitability Analysis for Cabbage Production, Ventura County, 2012-13
UNIVERSITY OF CALIFORNIA COOPERATIVE EXTENSION COSTS AND PROFITABILITY ANALYSIS
FOR CABBAGE PRODUCTION IN THE OXNARD PLAIN, VENTURA COUNTY
Based on data collected in 2012/2013
TABLE OF CONTENTS
ABSTRACT 1 INTRODUCTION 1 PRODUCTION PRACTICES 1
Land Preparation 1 Stand Establishment 1 - 2 Fertilization 2 Irrigation System and Applications 2 Pest Management 3 Weed Management 3 Food Safety Program 3 - 4 Conditional Waiver Program 4
HARVESTING AND MARKETING 4 - 5 INTEREST ON OPERATING CAPITAL 5 LABOR 5 EQUIPMENT OPERATING COSTS 5 CASH OVERHEAD COSTS 5 - 6 NON-CASH OVERHEAD COSTS 6 SUMMARY OF PRODUCTION COSTS 6 - 7 PROFITABILITY ANALYSIS 7 REFERENCE 8 TABLES 9 - 15 The authors wish to express their appreciation to those cooperators who provided data and review in the development of this study. To simplify information, trade names of some products have been used in this report. No endorsement of name product is intended, nor did criticism imply of similar products that are not mentioned. Funding for this project was provided in part by the University of California Thelma Hansen Research and Education Fund.
1 Costs and Profitability Analysis for Cabbage Production, Ventura County, 2012-13
ABSTRACT
Ventura County has 28.62% of cabbage production in 2011 and ranks second in California. Production costs and profitability evaluations have been the fundamental tools for growers and investors to do investment analyses and make decisions, conduct business transactions, and develop risk management strategies. In this study, we provide up to date benchmark costs and profitability indicators for evaluating the viability and sustainability of cabbage production. This study is based on assumptions of cabbage production practices including fees for regulatory requirements in the county. Data regarding production practices, inputs and prices were collected from cooperating growers, the University of California Cooperative Extension (UCCE) farm advisors, agricultural institutions, and supply and equipment dealers. While this study makes every effort to model cabbage production based on real world practices, it cannot fully represent financial, agronomic, and market risks, which affect the profitability and economic viability of all producers. We suggest that growers use the model as a guide to estimate costs and evaluate their profitability.
INTRODUCTION
Cabbage is a multi-million dollar commodity in California. In 2011, Ventura County had approximately 3,230 acres, or 28.62% of California’s total cabbage acreage with crop value of $19.4 million. The growing period for cabbage depends on the time of transplanting. We based this study on one warm season crop in the Oxnard Plain, Ventura County with approximate growing period from land preparation to harvesting being four months. We based the study on 500 acres operation with 2.5 cropping (1,250 acres farmed per year). This study serves as a guideline for production practices and costs of production and profitability to be used by growers, prospective growers, agricultural lenders, educators and all who are involved or have interest with cabbage production in Ventura County.
PRODUCTION PRACTICES
The discussions in these sections include production practices: inputs, rates, operational frequency, and methods of operation. Input costs, contract fees and service expenses are based on 2012/2013 prices. We present this study on a per acre basis for one warm crop taking four months from land preparation to harvest. Land Preparation. Land preparation and the type of tillage system used vary between fields and management preferences. In this study, we used traditional tillage which is the typical practice used for vegetable crop production in Ventura County. Traditional tillage incorporates most crop residues and leaving less than 30 percent of the surface covered by residues and uses an average of 15 to 18 land preparation operations (Mitchell, et al., 2009). The sequence and frequency of land preparation operations will vary among growers. In this study, we assumed four discing, two subsoiling, five rolling, three leveling, and then broadcast fertilizing and chisel plowing once before beds are listed and shaped. Depending on speed and width of implements (disc, subsoiler, roller, landplane, fertilizer spreader, chisel, lister, and bed shaper) used for land preparation; equipment field time will vary among growers. Based on the equipment complement we developed from our growers’ interview, we estimate average tillage field time takes approximately 2.83 hours per acre per crop. Stand Establishment. Growers develop transplanting schedule in order to let crop mature at different times for harvest. In this study, we estimated costs based on one acre transplanted once in August to be harvested twice in October. The commonly grown cabbage varieties in Ventura County for green hybrids include Supreme Vantage, Headstart, Pacifica, Discovery, Grenadier, Charmant, and Grandslam; and red hybrids include Rubyball, Primero, Sombrero, and Red Rookie. All varieties have similar cultural, harvesting, and marketing requirements.
2 Costs and Profitability Analysis for Cabbage Production, Ventura County, 2012-13
Transplanting rates vary depending on spacing. In this study, we used an approximate rate of 28,500 transplants per acre on 40” beds with two rows of transplants 14” apart, and transplants 12”-14” apart within rows. Custom transplanting costs about $335 per acre and plants cost about $0.012 each based on bulk purchase price in 2013. Fertilization. Cabbage fertilization in the Oxnard Plain includes approximately 250 pounds of nitrogen (N) per acre. Fertilizer is applied to provide N at about 100 pounds at pre-plant and 150 pounds post-plant. An application of 625 pounds per acre of ammonium phosphate 16-20-0 (100 lbs. N) is broadcasted once during land preparation. Depending on the speed and width of implement used, field time may vary among growers. Based on the equipment complement used, the tractor and fertilizer spreader takes about 20 minutes per acre per crop to broadcast ammonium phosphate. Two to three weeks after transplanting, CAN17% at 34.88 gallons (75 lbs. of N) per acre is applied through the irrigation system. Then a second application of CAN17% at 34.88 gallons (75 lbs. of N) per acre is applied six to seven weeks after the first application through the irrigation system to help mature cabbages for harvest. Fertilizer prices may vary between regions and supply companies. In this study, fertilizer prices are based on bulk purchases from local suppliers in Ventura County. Ammonium phosphate 16-20-0 costs about $0.49 per pound and CAN17% costs about $3.80 per gallon. Irrigation System. Cabbage irrigation in Ventura County uses the drip system. The cost of developed wells and permanent irrigation system are part of the land rental. However, we assumed that growers purchase drip tapes. The drip tapes cost $320 per acre based on one line for 40” bed centers and can be used for approximately 2 crops. We allocated $160 per acre for one cabbage crop. Drip tapes are installed after bed preparation. We assumed that a single line of drip tape is used per bed and is placed between two rows of plants. Drip tapes are anchored by a farm worker at the beginning of each row, followed by the drip layer implement installing the drip tapes on the surface, and then the worker cut the drip tapes at the end of the rows in order to connect the drip tapes to the water supply line. Machine and manual labor for anchoring, installing, cutting, and connecting the drip tapes are estimated to take about 25-30 minutes per acre (Zhu, Butts, Lam & Blankenship, 2004). In cabbage production, the drip tapes are removed before final harvest (the second harvest in this study). Drip tapes are removed by disconnecting the couplers from the water supply line and then the lifter with winder implement coils the drip tapes onto the spools. Machine and manual labor hours to disconnect, lift and coil drip tapes, and secure and replace-filled spools are estimated to take about 30-35 minutes per acre (Zhu, Butts, Lam & Blankenship, 2004). Irrigation Applications. Water cost for irrigation varies in Ventura County and depends on whether district or well water is used. During our data collection, we were told that growers may use well and district water. However, we did not get sufficient information on the number of wells available for use or the depth of the well for pumping calculation. Therefore, we used the price of district water at $170 per acre-foot ($14.17 per acre-inch) to estimate water costs. Water extraction fees from the district and state were also factored into the costs of water. Based on interview data, irrigations are done 5 times for a total of 1 acre-foot of water for one cabbage crop. Five acre-inches (3ac-in early-August and 2ac-in late-August) of water is applied to set the plants and seven acre-inches (2 ac-in early-September, 3ac-in later-September, and 2ac-in October) is applied in the remaining growing periods through harvest. Labor hours to switch the water on and off, inspections, and maintenance is estimated to take about 30 minutes per irrigation for a total of 2.5 hours per acre per crop.

3 Costs and Profitability Analysis for Cabbage Production, Ventura County, 2012-13
Pest Management. The most harmful insect pests include crickets, cutworms, flea beetles, saltmarsh caterpillars, aphids, silverleaf whitefly’s, beet armyworms, diamondback moths, cabbage loopers, and Bagrada bug (new stink bug). The Bagrada bug is a new invasive insect pest that has infested Brassica crops throughout the southwestern desert growing areas of Arizona and California and has moved to the southern coastal area of Ventura County. Based on known research studies done by the University of California Cooperative Extension (UCCE) Desert Research and Extension and the Yuma Agriculture centers, pyrethroid insecticides and other conventional insecticides provide good control (Natwick, Palumbo, Henderson, Lopez, & Dara, 2010). Cabbage is not marketable once insect damage cause malformation of the cabbage head. Therefore pest management is done early for stand establishment and during head development to prevent damage. There are very few diseases of cabbage in California however, downy mildew, wirestem, and white mold may require control if wet and moist cooler conditions persist (Daugovish, et al., 2008). A contract pest control advisor (PCA) monitors and scouts the fields throughout the crop season for insect pests, diseases, beneficial insects, and agronomic problems to determine if control measures are necessary. The PCA consultation fee for cabbage crop may vary by location; however, we used an average of $43 per acre per crop in this study based on interview data from growers and PCAs. Pesticides applications may vary depending on types of insect pests and diseases infestation and recommendations from the PCA. Typically a mixed pesticide spray is applied to prevent and control insect pests and diseases. Pesticide materials are rotated after each application to slow and prevent resistance development. Depending on the production season and infestation level in the field, the PCA may recommend anywhere from four to five pesticide applications per acre per crop. Each application consists of a mixture of materials. Some of the materials used in the mixture would be Coragen (Chlorantraniliprole), Movento (Spinotetramat), Forum (Dimethomorph), and Brigade (Bifenthrin-pyrethroid) to control insect pests including the Bagrada bug. In this study, the first pesticide application is done 3 weeks before transplant; the second about 4 days after transplant; the third about 10 days after the second application and the fourth application about 10 days after the third application. If necessary and depending on infestation level, a fifth application may be applied about 10 days after the fourth application. We used custom pesticide treatment which cost approximately $120 per acre per application for application and material. Written recommendations are required for commercially applied pesticides by licensed pest control advisors. Pest control materials and label rates mentioned in this study are listed on the UCIPM website at http://www.ipm.ucdavis.edu/PMG/selectnewpest.cole-crops.html. For information on pesticide use permits, contact your County Agricultural Commissioner’s office. Weed Management. Growers in Ventura County use selective herbicides that can be applied either pre-plant or post-plant to control a wide range of grass and broadleaf weeds. Cultivation and hand weeding are also done during the growing season. In this study, herbicide is sprayed once after land preparation. One-pint ($25.37 per pint) of Goaltender (oxyfluorfen) herbicide is sprayed (using tractor and sprayer) and takes about 10 minutes per acre. Goaltender costs about $203 per gallon. Custom mechanical cultivation for weed control costs about $15 per acre (typically controls about 80% of weeds) and is done once during mid-growing period. Custom hand weeding costs about $85 per acre (typically controls about 20% of weeds) and is done once before harvesting. Food Safety Program. Many growers of fresh market commodities like cabbage incorporate and implement a food safety program. According to the United States Department of Agriculture – Agriculture Marketing Service (USDA-AMS), Good Agriculture Practice (GAP) guidelines were developed to educate and help growers reduce food safety hazards on farm operations for minimizing microbial contamination during the growing and harvesting seasons (2011). In this study, we assumed
4 Costs and Profitability Analysis for Cabbage Production, Ventura County, 2012-13
growers participate in annual GAP audit and certification. Growers also conduct two (one test for farm, one test for water reservoir) microbial water tests per month (total of 8 water tests per acre from land preparation to harvest for one cabbage crop) as part of their Food Safety program. There are many GAP certification programs in California. Each farm operation will be different; therefore growers should decide on the GAP certification program that best fit their needs. The cost of most third party GAP audit and certification programs are not public information. However, the United Fresh Produce Association pre-farm-gate matrix provided average fees for GAP certification. From the matrix, we chose to use in this study the fees charged by Primus Lab for GAP certification. Two types of audits are done for GAP certification through Primus Lab: farm and harvest crew audits. The farm audit costs about $550 per farm operation per year ($0.37 per acre for 4 months based on 500-acre farm). Two harvest crew audit costs about $390 per crop season ($0.78 per acre). Microbial water test costs about $34 per 250-milliliter sample. Two water samples are collected per month per farm operation. Therefore for the 4-month (land preparation to harvest) cabbage crop, the total costs of microbial water test will be $272 for the entire operation ($0.54 per acre). Conditional Waiver Program. The Federal Clean Water Act (CWA) and the Porter-Cologne Water Quality Control Act, authorize regulators (Regional Water Quality Control Boards) to control discharges into surface water and ground water. Historically, the regional water quality control boards waived the waste discharge requirements for irrigated farmlands. However, the 1999 Senate Bill 390 banned the waiver and set the waiver expiration date to 2003. The regional boards had to come up with an alternate method to regulate discharges from irrigated farmlands. According to the Farm Bureau of Ventura County, the Los Angeles regional board, which overseas Ventura County, adopted its first conditional waiver program to regulate discharges from irrigated farmlands in November 2005 and was renewed in October 2010. The conditional waiver program requires dischargers to submit Notice of Intent (NOI) to comply with the program, annual site monitoring reports, assessment and mitigation plans, and fulfillment of a minimum of eight credit hours education for each group member and or individual non-member. Ventura County Agricultural Irrigated Land Group (VCAILG) was formed in March 2006 and approved in December 2006 to be a group discharger in order to comply with the conditional waiver program set by the Los Angeles regional board. VCAILG membership is voluntary. However, non-members must be in compliance with the conditional waiver program individually and follow the same requirements. The program is administered by the Ventura County Farm Bureau. The Farm Bureau provides staff support, maintain records, and oversee consultants, and handles correspondences between members and the Los Angeles regional board. The program cost varies by year, watershed, and depends on the scope of work performed. Generally, the program cost covers monitoring, reporting, mitigation, state board fees and the farm Bureau administrative fee. There are four watersheds in Ventura County: Ventura River, Santa Clara River, Calleguas Creek, and Oxnard Plain watersheds. Based on interview data, the majority of the cabbage production falls within the Calleguas Creek watershed. The average cost for this watershed was $23 per acre per year in 2012 (Farm Bureau). Therefore, we used $7.67 per acre (for 4 months) to reflect cost for one crop in this study.
HARVESTING AND MARKETING
Cabbage is hand-harvested and field packed into 45 pounds or 50 pounds cartons (depending on market and handler requirement) by contract harvesters twice per acre per crop. In this study, we based harvesting costs on 45-pound carton. Cabbage is picked and packed in the fields then hauled, cooled, and
5 Costs and Profitability Analysis for Cabbage Production, Ventura County, 2012-13
sold under the California Leafy Greens Marketing Agreement (LGMA) program. Based on interview data, harvesting costs estimate is about $3.99 per 45-pound carton.
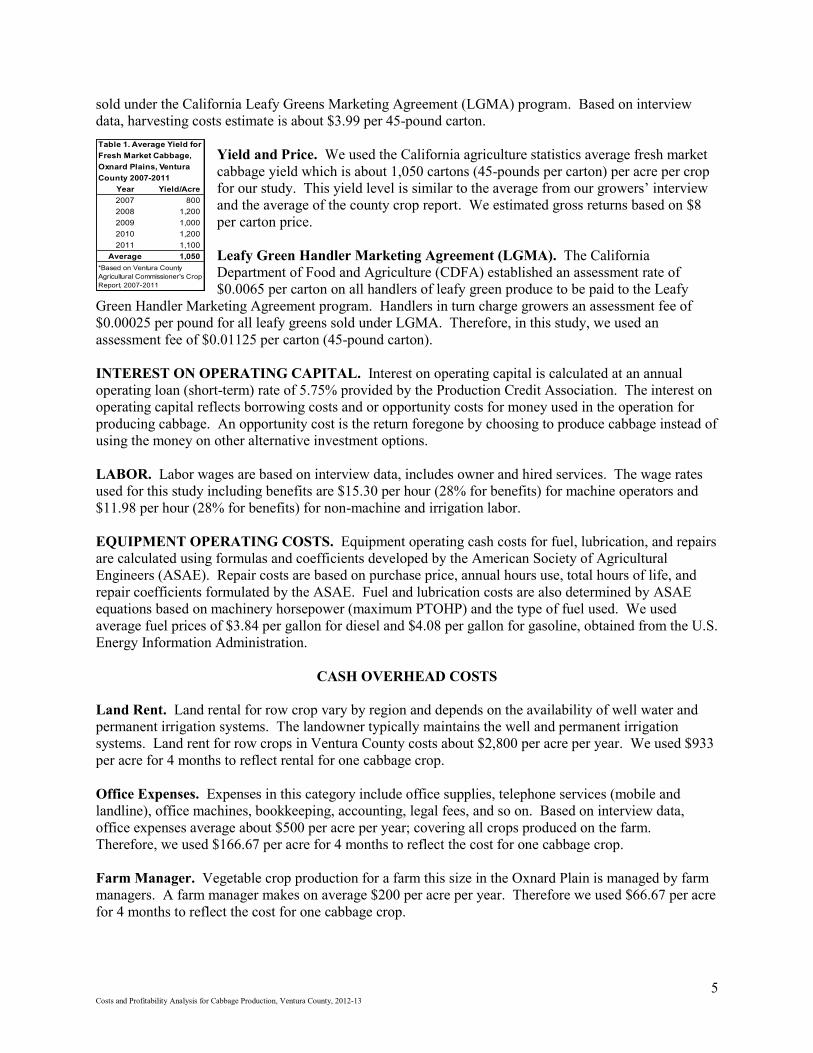
Yield and Price. We used the California agriculture statistics average fresh market cabbage yield which is about 1,050 cartons (45-pounds per carton) per acre per crop for our study. This yield level is similar to the average from our growers’ interview and the average of the county crop report. We estimated gross returns based on $8 per carton price. Leafy Green Handler Marketing Agreement (LGMA). The California Department of Food and Agriculture (CDFA) established an assessment rate of $0.0065 per carton on all handlers of leafy green produce to be paid to the Leafy
Green Handler Marketing Agreement program. Handlers in turn charge growers an assessment fee of $0.00025 per pound for all leafy greens sold under LGMA. Therefore, in this study, we used an assessment fee of $0.01125 per carton (45-pound carton). INTEREST ON OPERATING CAPITAL. Interest on operating capital is calculated at an annual operating loan (short-term) rate of 5.75% provided by the Production Credit Association. The interest on operating capital reflects borrowing costs and or opportunity costs for money used in the operation for producing cabbage. An opportunity cost is the return foregone by choosing to produce cabbage instead of using the money on other alternative investment options. LABOR. Labor wages are based on interview data, includes owner and hired services. The wage rates used for this study including benefits are $15.30 per hour (28% for benefits) for machine operators and $11.98 per hour (28% for benefits) for non-machine and irrigation labor. EQUIPMENT OPERATING COSTS. Equipment operating cash costs for fuel, lubrication, and repairs are calculated using formulas and coefficients developed by the American Society of Agricultural Engineers (ASAE). Repair costs are based on purchase price, annual hours use, total hours of life, and repair coefficients formulated by the ASAE. Fuel and lubrication costs are also determined by ASAE equations based on machinery horsepower (maximum PTOHP) and the type of fuel used. We used average fuel prices of $3.84 per gallon for diesel and $4.08 per gallon for gasoline, obtained from the U.S. Energy Information Administration.
CASH OVERHEAD COSTS Land Rent. Land rental for row crop vary by region and depends on the availability of well water and permanent irrigation systems. The landowner typically maintains the well and permanent irrigation systems. Land rent for row crops in Ventura County costs about $2,800 per acre per year. We used $933 per acre for 4 months to reflect rental for one cabbage crop. Office Expenses. Expenses in this category include office supplies, telephone services (mobile and landline), office machines, bookkeeping, accounting, legal fees, and so on. Based on interview data, office expenses average about $500 per acre per year; covering all crops produced on the farm. Therefore, we used $166.67 per acre for 4 months to reflect the cost for one cabbage crop. Farm Manager. Vegetable crop production for a farm this size in the Oxnard Plain is managed by farm managers. A farm manager makes on average $200 per acre per year. Therefore we used $66.67 per acre for 4 months to reflect the cost for one cabbage crop.
Year Yield/Acre
2007 800
2008 1,200
2009 1,000
2010 1,200
2011 1,100
Average 1,050
Table 1. Average Yield for
Fresh Market Cabbage,
Oxnard Plains, Ventura
County 2007-2011
*Based on Ventura County
Agricultural Commissioner's Crop
Report, 2007-2011
6 Costs and Profitability Analysis for Cabbage Production, Ventura County, 2012-13
Sanitation Facility. Sanitation facilities are required during transplanting, hand weeding, and harvesting for field workers. These operations are done by contractors who provide their own sanitation facilities therefore growers do not incur the costs. Liability and Property Insurance. Liability insurance (to cover accidents on the entire farm) for a farm size specified in this study is about $1,188 per year. Therefore, the cost to cover one crop is $396 ($0.79 per acre for 4 months). In addition, property insurance is calculated at $8.17 per $1,000 valuation. Property Taxes. Counties charge a base property tax rate of 1 percent on the assessed value of the property, including equipment, building, and improvements. Special assessment districts in some counties charge additional taxes on property. In this study, we calculated property taxes at the county base tax rate of 1 percent of the property value. Investment Repairs. Repair costs are the annual maintenance costs for investments in non-cash overhead. The repairs are calculated as a percentage of the new cost distributed over the investment life. Annual repairs in this study are calculated as 2% of the new cost.
NON-CASH OVERHEAD COSTS
Farm Building. We assumed that a steel farm building about 2,600 square-feet is used for this size farm. The value is estimated based on current market price per square-foot. Tools. The farm shop includes various kinds of tools necessary for quick repair of farm machinery. The value of tools is estimated based on used and new prices. Fuel Tank. We assumed a farm this size will own at least one fuel tank, sizing 550 gallons. Ownership Cost of Equipment and Farm Investments. We used the capital recovery method to calculate ownership costs of farm equipment and investments. This method allows growers to calculate an annual amount of money to charge the enterprise so that the value of assets will be recovered within a specific period at the designated interest rate. The interest we used to calculate ownership cost is 4.75%, which is California’s long-term rate of return on agricultural production assets from current income. We valued the equipment complement at 60% of new prices to reflect the mix of old and new equipment complement.
SUMMARY OF PRODUCTION COSTS
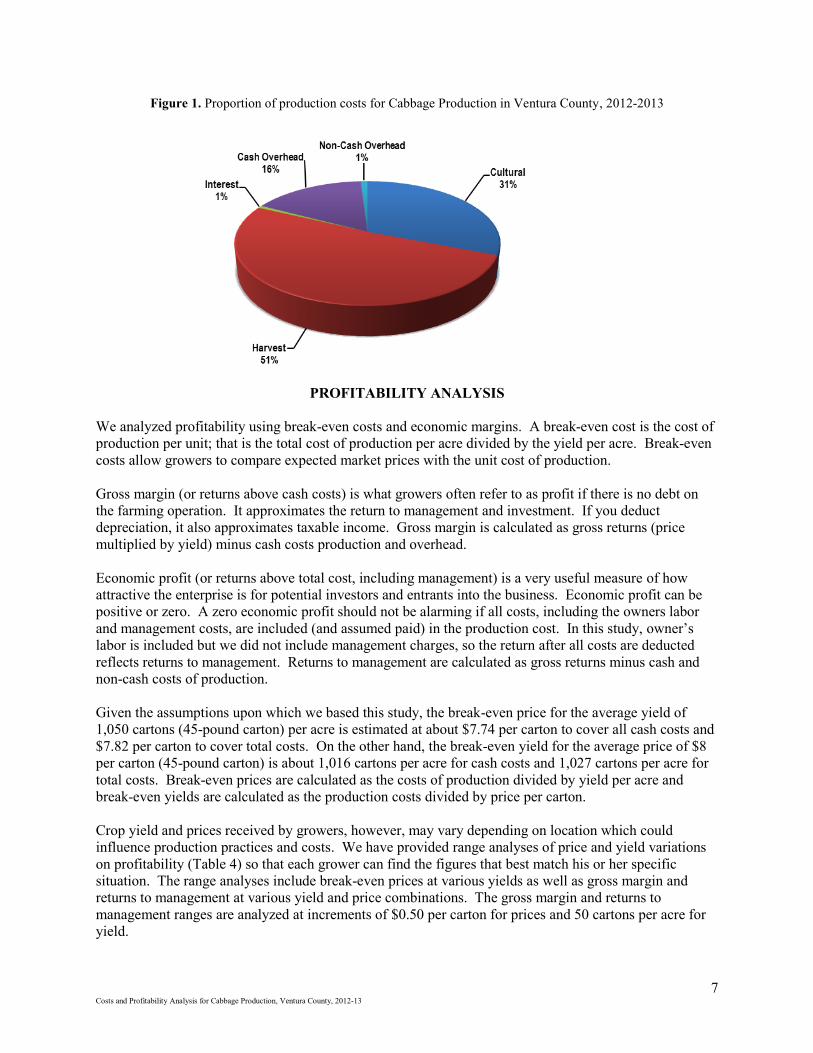
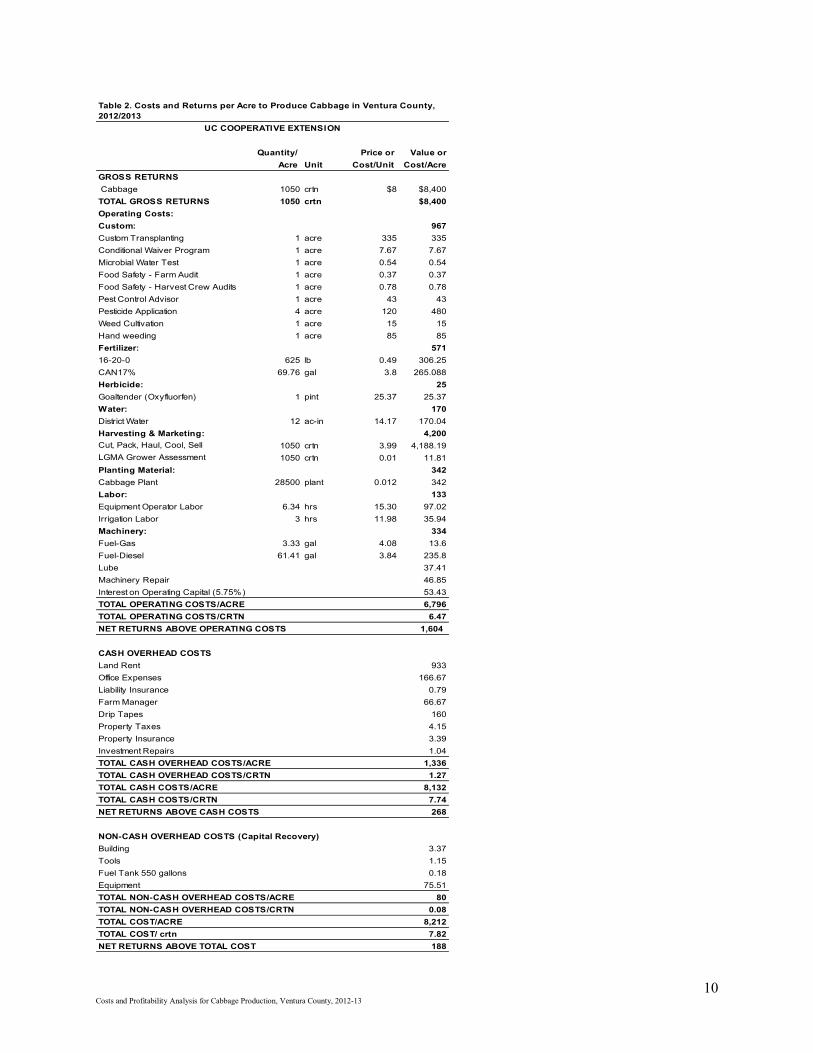
Production costs given our assumptions of farm size, production practices and 2012/2013 prices are presented in tables 1 and 2 by type of activity and by type of inputs, respectively. Our estimate of production costs for cabbage is $8,212 per acre. Figure 1 shows the breakdown of costs. It includes 31% ($2,543) accounted for by cultural practices (consisting of land preparation, transplanting, irrigation, fertilization, pest and weed control, equipment, and conditional waiver and food safety programs); 51% ($4,200) by harvesting (picking, packing, hauling, cooling, selling, and LGMA grower assessment); 1% ($53.43) by interest on operating capital; 16 % ($1,336) by cash overhead (land rent, office expenses, farm manager, drip tapes, insurances, taxes and investment repairs); and 1% ($80) by non-cash overhead (capital recovery of building, tools, fuel tank, and equipment).
7 Costs and Profitability Analysis for Cabbage Production, Ventura County, 2012-13
Figure 1. Proportion of production costs for Cabbage Production in Ventura County, 2012-2013
PROFITABILITY ANALYSIS
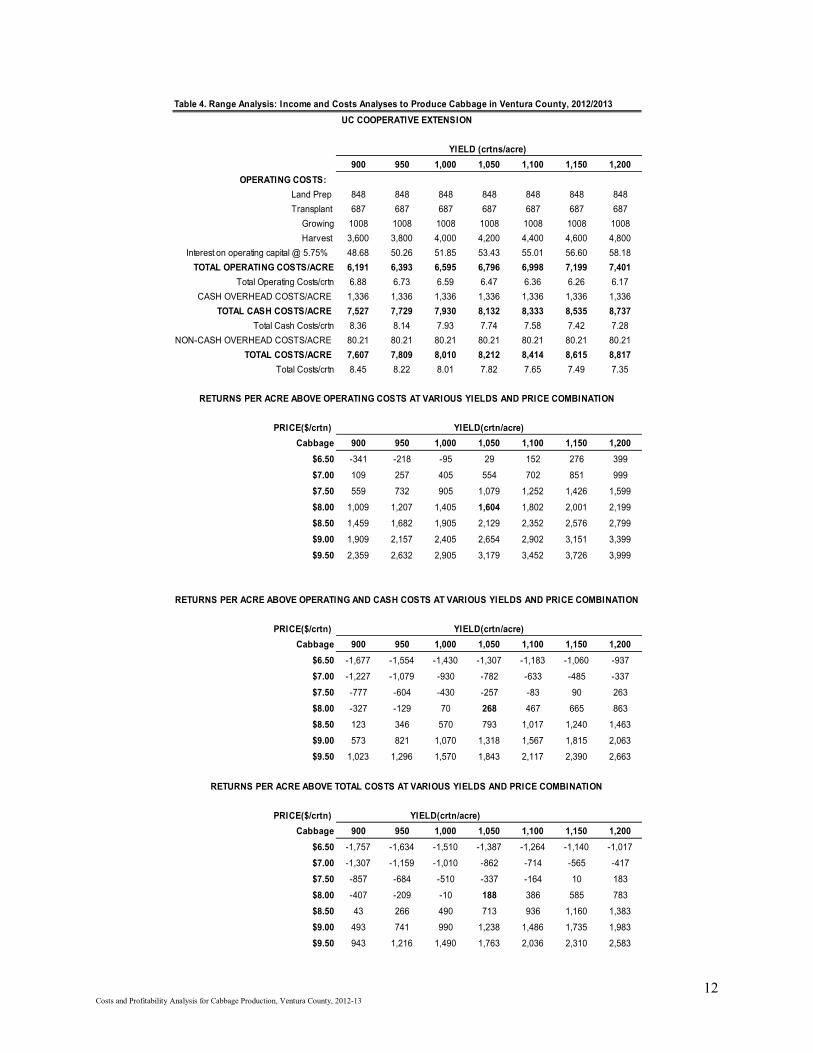
We analyzed profitability using break-even costs and economic margins. A break-even cost is the cost of production per unit; that is the total cost of production per acre divided by the yield per acre. Break-even costs allow growers to compare expected market prices with the unit cost of production. Gross margin (or returns above cash costs) is what growers often refer to as profit if there is no debt on the farming operation. It approximates the return to management and investment. If you deduct depreciation, it also approximates taxable income. Gross margin is calculated as gross returns (price multiplied by yield) minus cash costs production and overhead. Economic profit (or returns above total cost, including management) is a very useful measure of how attractive the enterprise is for potential investors and entrants into the business. Economic profit can be positive or zero. A zero economic profit should not be alarming if all costs, including the owners labor and management costs, are included (and assumed paid) in the production cost. In this study, owner’s labor is included but we did not include management charges, so the return after all costs are deducted reflects returns to management. Returns to management are calculated as gross returns minus cash and non-cash costs of production. Given the assumptions upon which we based this study, the break-even price for the average yield of 1,050 cartons (45-pound carton) per acre is estimated at about $7.74 per carton to cover all cash costs and $7.82 per carton to cover total costs. On the other hand, the break-even yield for the average price of $8 per carton (45-pound carton) is about 1,016 cartons per acre for cash costs and 1,027 cartons per acre for total costs. Break-even prices are calculated as the costs of production divided by yield per acre and break-even yields are calculated as the production costs divided by price per carton. Crop yield and prices received by growers, however, may vary depending on location which could influence production practices and costs. We have provided range analyses of price and yield variations on profitability (Table 4) so that each grower can find the figures that best match his or her specific situation. The range analyses include break-even prices at various yields as well as gross margin and returns to management at various yield and price combinations. The gross margin and returns to management ranges are analyzed at increments of $0.50 per carton for prices and 50 cartons per acre for yield.

8 Costs and Profitability Analysis for Cabbage Production, Ventura County, 2012-13
REFERENCE
American Society of Agricultural Engineers. (1992). American Society of Agricultural Engineers Standard Yearbook. St. Joseph, MI: ASAE. Boelje, M. D., & Eidman, V. R. (1984). Farm Management. New York: John Wiley and Sons. California's Office of USDA's NASS, (2011). California National Agriculture Statistics Service. Publications. Retrieved from website: http://www.nass.usda.gov/Statistics_by_State/California/Publications/ Daugovish, O., Smith, R., Cahn, M., Koike, S., Smith, H., Aguiar, J., Quiros, C., Cantwell, M., & Takele, E. (2008). Cabbage Production California. Vegetable Production Series, 7220. Retrieved from http://anrcatalog.ucdavis.edu/pdf/7208.pdf Farm Bureau. (2013). Farm Bureau of Ventura County, Water Issues. Retrieved from http://www.farmbureauvc.com/water_quality.html Krist, J. (2012) Farm Bureau of Ventura County, the Independent Voice of Agriculture, Vol. XLIV, No. 7. Retrieved from: http://www.farmbureauvc.com/pdf_forms/newsletters/FB_News_July12.pdf Mitchell, J. P., Pettygrove, G. S., Upadhyaya, S., Shrestha, A., Fry, R., Roy, R., Hogan, P., Vargas, R., & Hembree, K. (2009). Classification of Conversation Tillage Practices in California Irrigated Row Crop Systems. Retrieved from http://anrcatalog.ucdavis.edu/pdf/8364.pdf Natwick, E.T., Palumbo, J.C., Henderson, D.R., Lopez, M.I., & Dara, S. (2010). New Invasive Stink Bug in California and Arizona, Bagrada Hilaris (Burmeister) [PowerPoint presentation]. Retrieved from http://ceventura.ucanr.edu/files/66969.swf United Fresh Produce Association. (2011). Pre-Farm Gate Matrix - United Fresh Produce Association. Retrieved from http://www.unitedfresh.org/matrix2011/prefarmgate.html University of California Statewide IPM Project. (2009). Cole Crop, UC IPM Pest Management Guidelines. University of California, Davis, CA, Retrieved from http://www.ipm.ucdavis.edu/PMG/selectnewpest.cole-crops.html United States Department of Agriculture, Agriculture Marketing Service (2011). Good Agricultural Practices and Good Handling Practices Audit Verification Program, User’s Guide. Retrieved from http://www.ams.usda.gov/AMSv1.0/getfile?dDocName=stelprdc5097151 U.S. Energy Information Administration, (2012). Weekly Retail Gasoline and Diesel Prices. Retrieved from website: http://www.eia.gov/dnav/pet/pet_pri_gnd_dcus_nus_m.htm Ventura County Agricultural Commissioner. (2007-2011). Ventura County Agricultural Commissioner Crop Reports. Retrieved from http://portal.countyofventura.org/portal/page/portal/AgComm/resources/cropreports Zhu, H., Butts, C. L., Lam, M. C., & Blankenship, P. D. (2004). An Implement to Install and Retrieve Surface Drip Irrigation Laterals. Applied Engineering in Agriculture, 20(1), 17-23. Retrieved from http://naldc.nal.usda.gov/download/10034/PDF

9 Costs and Profitability Analysis for Cabbage Production, Ventura County, 2012-13
Table 1. Costs per Acre to Produce Cabbage in Ventura County, 2012/2013
Operation
Time Labor Fuel Lube Material Custom/ Total Your
Operation (Hrs/A) Cost & Repairs Cost Rent Cost Cost
Land Prep:
Disc (4x) 0.41 7.54 33.32 11.22 0 0 52.09
Subsoil (2x) 0.65 11.88 52.52 17.22 0 0 81.62
Roller (5x) 0.37 6.75 29.83 8.53 0 0 45.11
Land Level (3x) 0.46 8.36 36.94 12.56 0 0 57.85
Broadcast fertilizer 0.34 6.18 27.32 8.09 306.25 0 347.84
Chisel 0.12 2.23 9.85 3.27 0 0 15.34
List Beds 0.08 1.41 6.25 1.98 0 0 9.64
Shape Beds 0.28 5.09 22.48 7.05 0 0 34.62
Herbicide Treatment 0.12 2.26 10.01 2.97 25.37 0 40.61
Pest Control Advisor 0 0 0 0 0 43 43
Pesticide Treatment Application 0 0 0 0 0 120 120
TOTAL Land Prep COSTS 2.83 52 229 73 332 163 848
Transplanting:
Drip Irrigation Setup (Machine) 0.17 3.18 2.7 1.22 0 0 7.1
Drip Irrigation Setup (Labor) 0.25 3 0 0 0 0 3
Transplant 0 0 0 0 342 335 677
TOTAL Transplant COSTS 0.42 6 3 1 342 335 687
Growing:
Irrigation & System Inspection (5x) 2.5 29.95 0 0 170.04 0 199.99
Conditional Waiver Program 0 0 0 0 0 7.67 7.67
Microbial Water Test 0 0 0 0 0 0.54 0.54
Food Safety Program 0 0 0 0 0 1.15 1.15
Fertilizer - CAN17% (2x) 0 0 0 0 265.09 0 265.09
Pesticide Treatment Application (3x) 0 0 0 0 0 360 360
Weed Cultivation 0 0 0 0 0 15 15
Hand Weeding 0 0 0 0 0 85 85
Drip Irrigation Removal (Machine) 0.29 5.42 4.59 2.11 0 0 12.12
Drip Irrigation Removal (Labor) 0.25 3 0 0 0 0 3
Pickup Truck 2 36.72 13.6 8.03 0 0 58.35
TOTAL Growing COSTS 5.04 75 18 10 435 469 1,008
Harvesting and Marketing:
Cut, Pack, Haul, Cool, Sell 0 0 0 0 0 4,188.19 4,188.19
LGMA Grower Assessment 0 0 0 0 0 11.81 11.81
TOTAL Harvesting and Marketing COSTS 0 0 0 0 0 4,200 4,200
Interest on Operating Capital @ 5.75% 53.43
TOTAL OPERATING COSTS/ACRE 8.29 133 249 84 1109 5167 6,796
CASH OVERHEAD:
Land Rent 933
Office Expenses 166.67
Liability Insurance 0.79
Farm Manager 66.67
Drip Tapes 160
Property Taxes 4.15
Property Insurance 3.39
Investment Repairs 1.04
TOTAL CASH OVERHEAD COSTS/ACRE 1,336
TOTAL CASH COSTS/ACRE 8,132
NON-CASH OVERHEAD:
Acre Capital Recovery
Building 37.44 3.37 3.37
Tools 12.8 1.15 1.15
Fuel Tank 550 gallons 2.00 0.18 0.18
Equipment 577.56 75.51 75.51
TOTAL NON-CASH OVERHEAD COSTS 630 80 80
TOTAL COSTS/ACRE 8,212
UC COOPERATIVE EXTENSION
Cash and Labor Costs per Acre
Per producing Annual Cost
10 Costs and Profitability Analysis for Cabbage Production, Ventura County, 2012-13
Quantity/ Price or Value or
Acre Unit Cost/Unit Cost/Acre
GROSS RETURNS
Cabbage 1050 crtn $8 $8,400
TOTAL GROSS RETURNS 1050 crtn $8,400
Operating Costs:
Custom: 967
Custom Transplanting 1 acre 335 335
Conditional Waiver Program 1 acre 7.67 7.67
Microbial Water Test 1 acre 0.54 0.54
Food Safety - Farm Audit 1 acre 0.37 0.37
Food Safety - Harvest Crew Audits 1 acre 0.78 0.78
Pest Control Advisor 1 acre 43 43
Pesticide Application 4 acre 120 480
Weed Cultivation 1 acre 15 15
Hand weeding 1 acre 85 85
Fertilizer: 571
16-20-0 625 lb 0.49 306.25
CAN17% 69.76 gal 3.8 265.088
Herbicide: 25
Goaltender (Oxyfluorfen) 1 pint 25.37 25.37
Water: 170
District Water 12 ac-in 14.17 170.04
Harvesting & Marketing: 4,200
Cut, Pack, Haul, Cool, Sell 1050 crtn 3.99 4,188.19
LGMA Grower Assessment 1050 crtn 0.01 11.81
Planting Material: 342
Cabbage Plant 28500 plant 0.012 342
Labor: 133
Equipment Operator Labor 6.34 hrs 15.30 97.02
Irrigation Labor 3 hrs 11.98 35.94
Machinery: 334
Fuel-Gas 3.33 gal 4.08 13.6
Fuel-Diesel 61.41 gal 3.84 235.8
Lube 37.41
Machinery Repair 46.85
Interest on Operating Capital (5.75% ) 53.43
TOTAL OPERATING COSTS/ACRE 6,796
TOTAL OPERATING COSTS/CRTN 6.47
NET RETURNS ABOVE OPERATING COSTS 1,604
CASH OVERHEAD COSTS
Land Rent 933
Office Expenses 166.67
Liability Insurance 0.79
Farm Manager 66.67
Drip Tapes 160
Property Taxes 4.15
Property Insurance 3.39
Investment Repairs 1.04
TOTAL CASH OVERHEAD COSTS/ACRE 1,336
TOTAL CASH OVERHEAD COSTS/CRTN 1.27
TOTAL CASH COSTS/ACRE 8,132
TOTAL CASH COSTS/CRTN 7.74
NET RETURNS ABOVE CASH COSTS 268
NON-CASH OVERHEAD COSTS (Capital Recovery)
Building 3.37
Tools 1.15
Fuel Tank 550 gallons 0.18
Equipment 75.51
TOTAL NON-CASH OVERHEAD COSTS/ACRE 80
TOTAL NON-CASH OVERHEAD COSTS/CRTN 0.08
TOTAL COST/ACRE 8,212
TOTAL COST/ crtn 7.82
NET RETURNS ABOVE TOTAL COST 188
UC COOPERATIVE EXTENSION
Table 2. Costs and Returns per Acre to Produce Cabbage in Ventura County,
2012/2013
11 Costs and Profitability Analysis for Cabbage Production, Ventura County, 2012-13
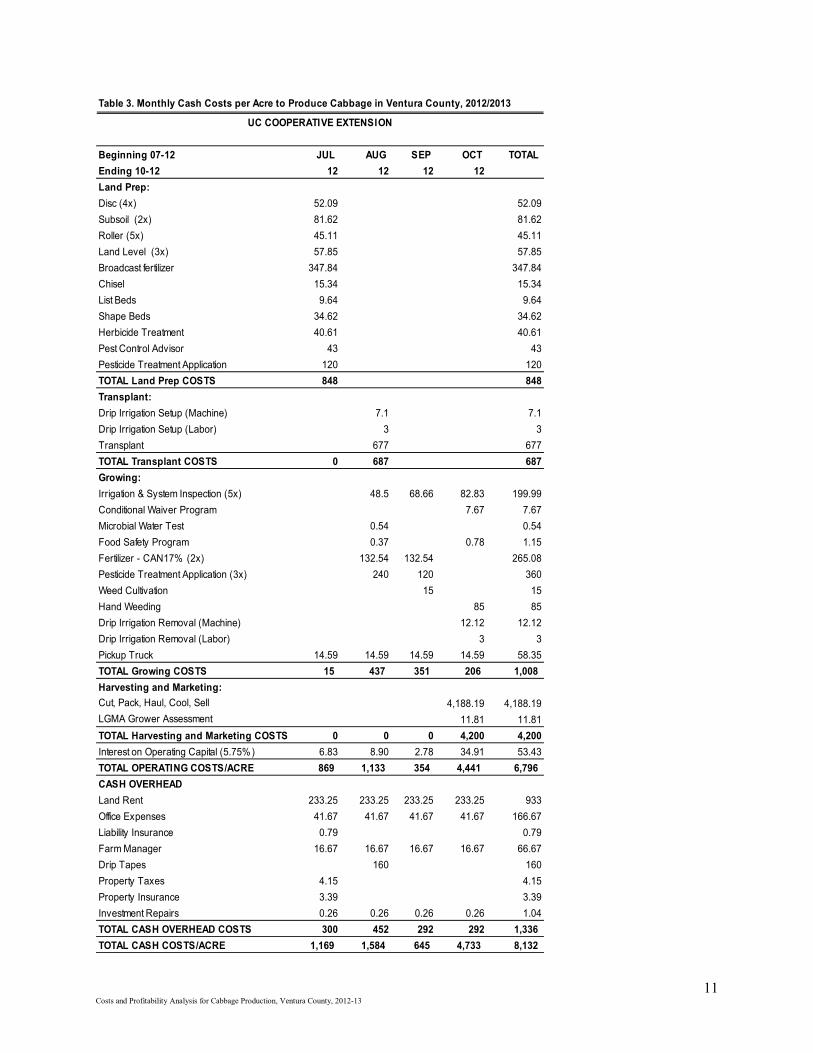
Beginning 07-12 JUL AUG SEP OCT TOTAL
Ending 10-12 12 12 12 12
Land Prep:
Disc (4x) 52.09 52.09
Subsoil (2x) 81.62 81.62
Roller (5x) 45.11 45.11
Land Level (3x) 57.85 57.85
Broadcast fertilizer 347.84 347.84
Chisel 15.34 15.34
List Beds 9.64 9.64
Shape Beds 34.62 34.62
Herbicide Treatment 40.61 40.61
Pest Control Advisor 43 43
Pesticide Treatment Application 120 120
TOTAL Land Prep COSTS 848 848
Transplant:
Drip Irrigation Setup (Machine) 7.1 7.1
Drip Irrigation Setup (Labor) 3 3
Transplant 677 677
TOTAL Transplant COSTS 0 687 687
Growing:
Irrigation & System Inspection (5x) 48.5 68.66 82.83 199.99
Conditional Waiver Program 7.67 7.67
Microbial Water Test 0.54 0.54
Food Safety Program 0.37 0.78 1.15
Fertilizer - CAN17% (2x) 132.54 132.54 265.08
Pesticide Treatment Application (3x) 240 120 360
Weed Cultivation 15 15
Hand Weeding 85 85
Drip Irrigation Removal (Machine) 12.12 12.12
Drip Irrigation Removal (Labor) 3 3
Pickup Truck 14.59 14.59 14.59 14.59 58.35
TOTAL Growing COSTS 15 437 351 206 1,008
Harvesting and Marketing:
Cut, Pack, Haul, Cool, Sell 4,188.19 4,188.19
LGMA Grower Assessment 11.81 11.81
TOTAL Harvesting and Marketing COSTS 0 0 0 4,200 4,200
Interest on Operating Capital (5.75% ) 6.83 8.90 2.78 34.91 53.43
TOTAL OPERATING COSTS/ACRE 869 1,133 354 4,441 6,796
CASH OVERHEAD
Land Rent 233.25 233.25 233.25 233.25 933
Office Expenses 41.67 41.67 41.67 41.67 166.67
Liability Insurance 0.79 0.79
Farm Manager 16.67 16.67 16.67 16.67 66.67
Drip Tapes 160 160
Property Taxes 4.15 4.15
Property Insurance 3.39 3.39
Investment Repairs 0.26 0.26 0.26 0.26 1.04
TOTAL CASH OVERHEAD COSTS 300 452 292 292 1,336
TOTAL CASH COSTS/ACRE 1,169 1,584 645 4,733 8,132
UC COOPERATIVE EXTENSION
Table 3. Monthly Cash Costs per Acre to Produce Cabbage in Ventura County, 2012/2013
12 Costs and Profitability Analysis for Cabbage Production, Ventura County, 2012-13
Table 4. Range Analysis: Income and Costs Analyses to Produce Cabbage in Ventura County, 2012/2013
900 950 1,000 1,050 1,100 1,150 1,200
OPERATING COSTS:
Land Prep 848 848 848 848 848 848 848
Transplant 687 687 687 687 687 687 687
Growing 1008 1008 1008 1008 1008 1008 1008
Harvest 3,600 3,800 4,000 4,200 4,400 4,600 4,800
Interest on operating capital @ 5.75% 48.68 50.26 51.85 53.43 55.01 56.60 58.18
TOTAL OPERATING COSTS/ACRE 6,191 6,393 6,595 6,796 6,998 7,199 7,401
Total Operating Costs/crtn 6.88 6.73 6.59 6.47 6.36 6.26 6.17
CASH OVERHEAD COSTS/ACRE 1,336 1,336 1,336 1,336 1,336 1,336 1,336
TOTAL CASH COSTS/ACRE 7,527 7,729 7,930 8,132 8,333 8,535 8,737
Total Cash Costs/crtn 8.36 8.14 7.93 7.74 7.58 7.42 7.28
NON-CASH OVERHEAD COSTS/ACRE 80.21 80.21 80.21 80.21 80.21 80.21 80.21
TOTAL COSTS/ACRE 7,607 7,809 8,010 8,212 8,414 8,615 8,817
Total Costs/crtn 8.45 8.22 8.01 7.82 7.65 7.49 7.35
PRICE($/crtn)
Cabbage 900 950 1,000 1,050 1,100 1,150 1,200
$6.50 -341 -218 -95 29 152 276 399
$7.00 109 257 405 554 702 851 999
$7.50 559 732 905 1,079 1,252 1,426 1,599
$8.00 1,009 1,207 1,405 1,604 1,802 2,001 2,199
$8.50 1,459 1,682 1,905 2,129 2,352 2,576 2,799
$9.00 1,909 2,157 2,405 2,654 2,902 3,151 3,399
$9.50 2,359 2,632 2,905 3,179 3,452 3,726 3,999
PRICE($/crtn)
Cabbage 900 950 1,000 1,050 1,100 1,150 1,200
$6.50 -1,677 -1,554 -1,430 -1,307 -1,183 -1,060 -937
$7.00 -1,227 -1,079 -930 -782 -633 -485 -337
$7.50 -777 -604 -430 -257 -83 90 263
$8.00 -327 -129 70 268 467 665 863
$8.50 123 346 570 793 1,017 1,240 1,463
$9.00 573 821 1,070 1,318 1,567 1,815 2,063
$9.50 1,023 1,296 1,570 1,843 2,117 2,390 2,663
PRICE($/crtn) YIELD(crtn/acre)
Cabbage 900 950 1,000 1,050 1,100 1,150 1,200
$6.50 -1,757 -1,634 -1,510 -1,387 -1,264 -1,140 -1,017
$7.00 -1,307 -1,159 -1,010 -862 -714 -565 -417
$7.50 -857 -684 -510 -337 -164 10 183
$8.00 -407 -209 -10 188 386 585 783
$8.50 43 266 490 713 936 1,160 1,383
$9.00 493 741 990 1,238 1,486 1,735 1,983
$9.50 943 1,216 1,490 1,763 2,036 2,310 2,583
RETURNS PER ACRE ABOVE TOTAL COSTS AT VARIOUS YIELDS AND PRICE COMBINATION
UC COOPERATIVE EXTENSION
YIELD (crtns/acre)
YIELD(crtn/acre)
YIELD(crtn/acre)
RETURNS PER ACRE ABOVE OPERATING COSTS AT VARIOUS YIELDS AND PRICE COMBINATION
RETURNS PER ACRE ABOVE OPERATING AND CASH COSTS AT VARIOUS YIELDS AND PRICE COMBINATION

13 Costs and Profitability Analysis for Cabbage Production, Ventura County, 2012-13
Yrs Salvage Capital
Description Price Life Value Recovery Insurance Taxes Total
350 HP Tractor #1 207,300 8 72,345.40 24,106.32 1,142.35 1,398.23 26,646.90
350 HP Tractor #2 207,300 8 72,345.40 24,106.32 1,142.35 1,398.23 26,646.90
90 HP Tractor 49,500 18 7,504.04 3,879.21 232.86 285.02 4,397.09
Disc - 21ft #1 19,950 7 5,089.76 2,786.69 102.29 125.20 3,014.18
Disc - 21ft #2 19,950 7 5,089.76 2,786.69 102.29 125.20 3,014.18
Subsoiler - 12ft #1 12,500 4 4,600.81 2,433.28 69.86 85.50 2,588.64
Subsoiler - 12ft #2 12,500 4 4,600.81 2,433.28 69.86 85.50 2,588.64
Roller - 22ft 6,000 4 2,208.39 1,167.97 33.53 41.04 1,242.55
Land plane #1 22,000 15 2,112.14 1,984.13 98.50 120.56 2,203.19
Land plane #2 22,000 7 5,612.76 3,073.04 112.80 138.06 3,323.90
Fertilizer spreader #1 3,100 2 1,456.80 949.79 18.61 22.78 991.19
Chisel plow 13,500 13 1,654.81 1,320.68 61.91 75.77 1,458.37
Lister - 28ft 8,300 20 432.61 638.54 35.67 43.66 717.87
Bed Shaper 7,500 5 2,443.03 1,276.02 40.62 49.72 1,366.35
Boom-type sprayer 4,600 9 919.18 555.77 22.55 27.60 605.91
Drip Layer 2,500 9 499.55 302.05 12.25 15.00 329.30
Tape Lifter & Winder 5,445 3 2,264.53 1,269.99 31.49 38.55 1,340.03
Pickup Truck #1 24,500 3 12,972.94 4,829.24 153.08 187.36 5,169.68
Pickup Truck #2 24,500 3 12,972.94 4,829.24 153.08 187.36 5,169.68
Pickup Truck #3 24,500 3 12,972.94 4,829.24 153.08 187.36 5,169.68
Pickup Truck #4 24,500 3 12,972.94 4,829.24 153.08 187.36 5,169.68
TOTAL 721,945 243,072 94,387 3,942 4,825 103,154
60% of new cost* 433,167 145,843 56,632 2,365 2,895 61,892
*Used to reflect a mix of new and used equipment
Yrs Salvage Capital
Description Price Life Value Recovery Insurance Taxes Repairs Total
INVESTMENT
Building 46,800 15 4,680 4,211.95 210.3 257.4 936 5,615.65
Tools 16,000 15 1,600 1,439.98 71.9 88 320 1,919.88
Fuel Tank 550 gallons 2,500 15 250 225 11.23 13.75 50 299.98
TOTAL INVESTMENT 65,300 6,530 5,877 293 359 1,306 7,836
Units/ Price/ Total
Description Farm Unit Unit Cost
Land Rent 500 acre 933 466,500
Office Expenses 500 acre 166.67 83,335
Liability Insurance 500 acre 0.79 395
Farm Manager 500 acre 66.67 33,335
Drip Tapes 500 acre 160 80,000
Table 5. Farm Investment for Producing Cabbage: Values and Annual Costs based on 1,250-Farmed Acres in Ventura County,
2012/2013
ANNUAL BUSINESS OVERHEAD COSTS FOR 1 CABBAGE CROP
UC COOPERATIVE EXTENSION
Annual Investment Costs
Annual Investment Costs

14 Costs and Profitability Analysis for Cabbage Production, Ventura County, 2012-13
Table 6. Hourly Costs for Equipment used in Cabbage Production in Ventura County, 2012/2013
Total Cash Overhead Operating
Cabbage Annual
Hours Hours Capital Lube & Total Total
Description Used Used Recovery Insurance Taxes Repairs Fuel Oper. Costs/Hr.
350 HP Tractor #1 779 1948 12.37 0.59 0.72 20.17 73.77 93.93 107.61
350 HP Tractor #2 770 1925 12.52 0.59 0.73 20.06 73.77 93.83 107.67
90 HP Tractor 258 645 6.01 0.36 0.44 5.59 14.14 19.74 26.55
Disc - 21ft #1 103 258 10.80 0.4 0.49 5.21 0 5.21 16.89
Disc - 21ft #2 103 258 10.80 0.4 0.49 5.21 0 5.21 16.89
Subsoiler - 12ft #1 162 405 6.01 0.17 0.21 4.48 0 4.48 10.87
Subsoiler - 12ft #2 162 405 6.01 0.17 0.21 4.48 0 4.48 10.87
Roller - 22ft 184 460 2.54 0.07 0.09 1.14 0 1.14 3.84
Land plane #1 76 190 10.44 0.52 0.63 5.46 0 5.46 17.06
Land plane #2 152 380 8.09 0.3 0.36 5.49 0 5.49 14.24
Fertilizer spreader #1 168 420 2.26 0.04 0.05 1.85 0 1.85 4.21
Chisel plow 61 153 8.63 0.4 0.5 4.73 0 4.73 14.26
Lister - 28ft 39 98 6.52 0.36 0.45 3.58 0 3.58 10.91
Bed Shaper 139 348 3.67 0.12 0.14 3.28 0 3.28 7.21
Boom-type sprayer 62 155 3.59 0.15 0.18 2.03 0 2.03 5.94
Drip Layer 87 218 1.39 0.06 0.07 0.88 0 0.88 2.40
Tape Lifter & Winder 147 368 3.45 0.09 0.10 1.02 0 1.02 4.66
Pickup Truck #1 250 625 7.73 0.24 0.3 4.01 6.80 10.81 19.09
Pickup Truck #2 250 625 7.73 0.24 0.3 4.01 6.80 10.81 19.09
Pickup Truck #3 250 625 7.73 0.24 0.3 4.01 6.80 10.81 19.09
Pickup Truck #4 250 625 7.73 0.24 0.3 4.01 6.80 10.81 19.09
UC COOPERATIVE EXTENSION
COSTS PER HOUR
15 Costs and Profitability Analysis for Cabbage Production, Ventura County, 2012-13
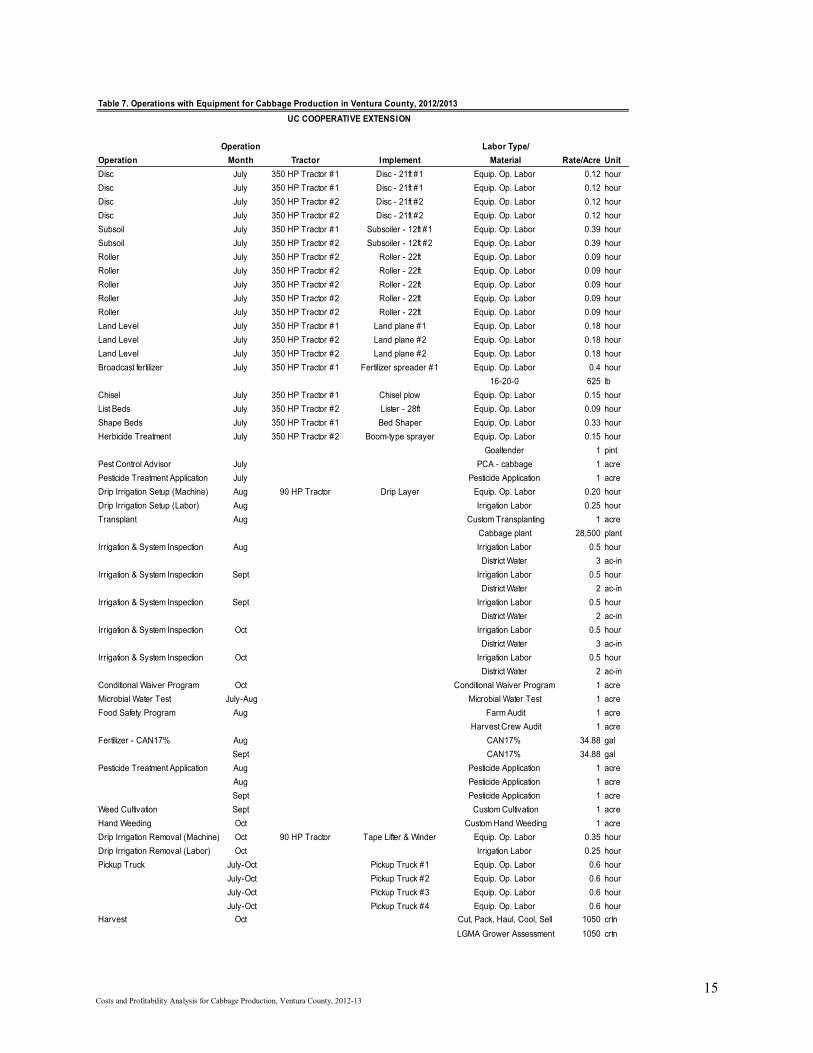
Table 7. Operations with Equipment for Cabbage Production in Ventura County, 2012/2013
Operation Labor Type/
Operation Month Tractor Implement Material Rate/Acre Unit
Disc July 350 HP Tractor #1 Disc - 21ft #1 Equip. Op. Labor 0.12 hour
Disc July 350 HP Tractor #1 Disc - 21ft #1 Equip. Op. Labor 0.12 hour
Disc July 350 HP Tractor #2 Disc - 21ft #2 Equip. Op. Labor 0.12 hour
Disc July 350 HP Tractor #2 Disc - 21ft #2 Equip. Op. Labor 0.12 hour
Subsoil July 350 HP Tractor #1 Subsoiler - 12ft #1 Equip. Op. Labor 0.39 hour
Subsoil July 350 HP Tractor #2 Subsoiler - 12ft #2 Equip. Op. Labor 0.39 hour
Roller July 350 HP Tractor #2 Roller - 22ft Equip. Op. Labor 0.09 hour
Roller July 350 HP Tractor #2 Roller - 22ft Equip. Op. Labor 0.09 hour
Roller July 350 HP Tractor #2 Roller - 22ft Equip. Op. Labor 0.09 hour
Roller July 350 HP Tractor #2 Roller - 22ft Equip. Op. Labor 0.09 hour
Roller July 350 HP Tractor #2 Roller - 22ft Equip. Op. Labor 0.09 hour
Land Level July 350 HP Tractor #1 Land plane #1 Equip. Op. Labor 0.18 hour
Land Level July 350 HP Tractor #2 Land plane #2 Equip. Op. Labor 0.18 hour
Land Level July 350 HP Tractor #2 Land plane #2 Equip. Op. Labor 0.18 hour
Broadcast fertilizer July 350 HP Tractor #1 Fertilizer spreader #1 Equip. Op. Labor 0.4 hour
16-20-0 625 lb
Chisel July 350 HP Tractor #1 Chisel plow Equip. Op. Labor 0.15 hour
List Beds July 350 HP Tractor #2 Lister - 28ft Equip. Op. Labor 0.09 hour
Shape Beds July 350 HP Tractor #1 Bed Shaper Equip. Op. Labor 0.33 hour
Herbicide Treatment July 350 HP Tractor #2 Boom-type sprayer Equip. Op. Labor 0.15 hour
Goaltender 1 pint
Pest Control Advisor July PCA - cabbage 1 acre
Pesticide Treatment Application July Pesticide Application 1 acre
Drip Irrigation Setup (Machine) Aug 90 HP Tractor Drip Layer Equip. Op. Labor 0.20 hour
Drip Irrigation Setup (Labor) Aug Irrigation Labor 0.25 hour
Transplant Aug Custom Transplanting 1 acre
Cabbage plant 28,500 plant
Irrigation & System Inspection Aug Irrigation Labor 0.5 hour
District Water 3 ac-in
Irrigation & System Inspection Sept Irrigation Labor 0.5 hour
District Water 2 ac-in
Irrigation & System Inspection Sept Irrigation Labor 0.5 hour
District Water 2 ac-in
Irrigation & System Inspection Oct Irrigation Labor 0.5 hour
District Water 3 ac-in
Irrigation & System Inspection Oct Irrigation Labor 0.5 hour
District Water 2 ac-in
Conditional Waiver Program Oct Conditional Waiver Program 1 acre
Microbial Water Test July-Aug Microbial Water Test 1 acre
Food Safety Program Aug Farm Audit 1 acre
Harvest Crew Audit 1 acre
Fertilizer - CAN17% Aug CAN17% 34.88 gal
Sept CAN17% 34.88 gal
Pesticide Treatment Application Aug Pesticide Application 1 acre
Aug Pesticide Application 1 acre
Sept Pesticide Application 1 acre
Weed Cultivation Sept Custom Cultivation 1 acre
Hand Weeding Oct Custom Hand Weeding 1 acre
Drip Irrigation Removal (Machine) Oct 90 HP Tractor Tape Lifter & Winder Equip. Op. Labor 0.35 hour
Drip Irrigation Removal (Labor) Oct Irrigation Labor 0.25 hour
Pickup Truck July-Oct Pickup Truck #1 Equip. Op. Labor 0.6 hour
July-Oct Pickup Truck #2 Equip. Op. Labor 0.6 hour
July-Oct Pickup Truck #3 Equip. Op. Labor 0.6 hour
July-Oct Pickup Truck #4 Equip. Op. Labor 0.6 hour
Harvest Oct Cut, Pack, Haul, Cool, Sell 1050 crtn
LGMA Grower Assessment 1050 crtn
UC COOPERATIVE EXTENSION
16 Costs and Profitability Analysis for Cabbage Production, Ventura County, 2012-13
Etaferahu Takele Area Farm Advisor, Agricultural Economics
UCCE - Southern Region 21150 Box Springs Road
Moreno Valley, CA 92557-8718 Phone: (951) 683-6491 x 221
Fax: (951) 788-2615 E-mail: [email protected]
Oleg Daugovish Farm Advisor, Vegetable Crops and Strawberries
UCCE –Ventura County 669 County Square Drive, #100
Ventura, CA 93003-5401 Phone: (805) 645-1454 Fax: (805) 645-1474
E-mail: [email protected]
Published: December 31, 2013.
The University of California prohibits discrimination against or harassment of any person employed by or seeking employment with the University on the basis of race, color, national origin, religion, sex, physical or mental disability, medical condition (cancer related or genetic
characteristics), ancestry, marital status, age, sexual orientation, citizenship, or status as a covered veteran (special disabled veteran, Vietnam-era veteran, or any other veteran who served on active duty during a war or in a campaign or expedition for which a campaign badge has been authorized). University Policy is intended to be consistent with the provisions of applicable State and Federal laws. Inquiries regarding the
University’s nondiscrimination policies may be directed to the Affirmative Action/Staff Personnel Services Director, University of California, Agriculture and Natural Resources, 1111 Franklin Street, 6th Floor, Oakland, CA 94607-5200, (510) 987-0096.