costandbenefitsofthenationalriverlinkingproject: an ...publications.iwmi.org/pdf/h042685.pdf ·...
TRANSCRIPT
29
Cost and Benefits of the National River Linking Project:
An Analysis of Peninsular LinksUpali A. Amarasinghe1 and R. Srinivasulu2
1Senior Researcher, International Water Management Institute, New Delhi2PhD student, Jawaharlal Nehru University, New Delhi
Abstract
Water, a critical component of food, livelihood and economic security, has always received
a central place in India’s investment portfolios. The investment in water transfers of the
National River Linking Project (NRLP) is one of the biggest proposed in recent times. When
and if completed, the NRLP forms a gigantic water grid covering most of South Asia. It
envisages transferring 174 billion cubic meters (Bm3) of water across 34 river links and will
cost about US$120 billion (2000 prices). The proposed plan has aroused a large interest in
recent public discourses. Hydrological feasibility, financial viability and social cost are the
issues that dominate these public dalogues. This paper analyzes the cost and benefits of eight
river links in the peninsular component, which include the main subcomponent of linking
rivers of Mahanadi, Godavari, Pennar and Cauvery. Irrigation is the main beneficiary in this
component and, en route, these links or canals account for 85% of the total water transfers to
irrigation and domestic and industrial sectors in the command areas. However, our analyses
show mixed results of financial viability of individual links. The main reason for this is low net
value-added benefits from additional irrigation over and above the existing level of cropping
and irrigation patterns. The proposed cropping patterns of these links generate much less net
value-added benefits than the existing cropping and irrigation patterns. To make these links
financially viable, they need to include high-value cropping patterns that, at least, generate as
much benefit per unit area as fruits and vegetables.
Although some individual links show less than desirable net benefits, taken together the
Mahanadi-Godavari-Pennar-Cauvery subcomponent gives a higher internal rate of return of
14% compared to a discount rate of 12%, and a high benefit-cost ratio of 1.3. However, many
unknown factors or unavailable information in this analysis can alter the estimates of financial
benefits and costs.
Introduction
The importance of access to water in India’s national food security is well recognized.
Access to irrigation was a critical determinant for the success of the green revolution, which
transformed India’s chronic food deficits in the 1960s to a state of food self-sufficiency in the
1970s. The effect of irrigation on productivity growth, as a direct input and as catalyst for other
30
Upali A. Amarasinghe and R. Srinivasulu
high-value agronomic inputs, continued and spread to vast rural landscapes. High productivity
growth was indeed a major reason for livelihood security that decreased poverty in rural areas.
Today, access to water is a vital component of national economic growth. However, with
increasing population and urbanization with expanding industrial and service-sector economic
activities, many regions in India are facing extreme physical to economic water scarcities
(Amarasinghe et al. 2005). Water is physically scarce in southern and western India, where
available resources are not adequate for further development without deleterious consequences
to the environment. But, water is plenty in the east and northeast India, where floods damage
agriculture and infrastructure, causing human misery year after year. The negative impact, due
both to droughts and floods, will likely increase with climatic change (Gosain et al. 2008).
Indeed, India is facing a water crisis. It is a crisis comprising scarcity, on the one hand, and
plenty, on the other. The crisis needs to be urgently managed, and India is facing the dilemma
of how to face this water crisis.
India’s proposed NRLP is claimed to be a part of a solution to the pending water crisis
(NWDA 2008). It envisaged diverting surplus floodwater from the northeastern and eastern
rivers to water-scarce south and west. The Brahmaputra, Mahanadi and Godavari are primarily
the donors in the NRLP, while Krishna, Pennar and Cauvery in the south and Sabramati and
Mahi in the west are the main recipients. Once completed, the project will impound water in
reservoirs both in and outside India, transfer and distribute water through an extensive network
of canals to irrigate more than 34 million ha, generate 34 GW of hydropower, meet domestic
and industrial demands in many cities, recharge groundwater to relieve overexploitation,
reduce flood damage, and create direct and indirect employment to many people in the water-
recipient regions.
The NRLP has two major components: the Himalayan and the peninsular. The
Himalayan component, with 16 river links, primarily facilitates the transfers of the surplus
water in the east to the Ganga Basin and water-scarce basins in the west of Peninsular India.
The peninsular component with 14 river links, mainly transport and distribute the surplus
water to the water-scarce regions within the peninsular river basins. Both components will
have about 3,000 storages to connect 37 rivers, and they will form a gigantic water grid, which
South Asia has never witnessed in the history of water development. Yet, the NRLP plan
drew wide criticism from a wide range of stakeholders, including the civil society, academia,
environmental community, policy planners and politicians. The criticisms are partly due to
its gigantism, in which the project costs colossal amounts of money when India badly needs
investments for developing social and physical infrastructure and which brings enormous
environmental damages by transporting water long distances displacing a large number of
people and submerging large swaths of productive agricultural land, homesteads, forests, etc.
Many people also argue that the economic benefits that NRLP generates will not be sufficiently
high vis-à-vis the social and environmental costs that it creates. But, many of the arguments
for and against the NRLP lack sufficient analytical rigor.
The research project, “The Strategic Analyses of National River Linking of India,” of
the Challenge Program on Water and Food (CPWF) and the International Water Management
Institute (IWMI) is trying to fill the void created by the lack of analytical rigor and informs the

31
Cost and Benefits of the National River Linking Project: An Analysis of Peninsular Links
public better of the discourse on NRLP (CPWF 2005). The project also raises many strategic
issues regarding the state of the water sector that India needs addressing for preventing a
pending water crisis with or without the NRLP.
A water development project generally originates from a water futures assessment.
The major source for NRLP was the scenario’s assessment of the National Commission of
Integrated Water Resources Assessment (NCIWRD 1999). But, the drivers, both exogenous
and endogenous, of water demand and supply are changing rapidly. The publication “India’s
Water Futures: Scenarios and Issues” (Amarasinghe et al. 2009), discusses scenarios and
issues that emanate from this fast-changing status of drivers. India has a large rural population
with agriculture-dependent livelihoods. Meeting livelihood security of the rural masses and
food security at the national level is the foremost priority of policy planners. As a result, many
large water development projects have been proposed and implemented to date. However, the
proposed NRLP is such a gigantic water grid that India and, for that matter, the whole of South
Asia have never dreamt of implementing before. Thus, issues embedded in the NRLP are
many, requiring more attention than previous water development projects. In the proceedings
of the national workshop “Social, Hydrological and Environmental Issues of the National
River Linking Project” (Amarasinghe and Sharma 2008) many issues related to the NRLP
project are discussed.
This paper assesses the financial benefits and costs of some of the proposed peninsular
links. The primary focus of the assessment is on irrigation benefits. Of all water transfers of
the NRLP, irrigation is the major beneficiary. The benefit analysis in this paper focuses on
the changes of India’s irrigation landscape since the project proposal came into existence.
Thus, we develop scenarios of benefit streams on the level of irrigation that could already be
in the proposed command areas. After a brief introduction of the domain of analysis in the
next section, we explain the methodology in detail in the section on methodology of benefit
assessment. Then follows the section on the benefit and cost scenarios of the links in the
study. Lasr, we conclude the paper with a discussion of issues arising out of this analysis for
consideration for further analyses.
Links in the Study
This study assesses financial benefits of eight links in the peninsular component (Figure 1)
that connect Mahanadi, Godavari, Pennar and Cauvery river basins. These include Link 1
connecting Mahanadi and Godavari, Links 2, 3 and 4 connecting Godavari and Krishna,
Link 7 connecting Krishna and Pennar1, Link 8 connecting Pennar-Palar-Cauvery and Link 9
connecting Cauvery to Vaigai and Gundai subbasins in Tamil Nadu. The full implementation
of these links is largely dependent on water transfers between one another. Water transfer
from Mahanadi to Godavari facilitates water transfer from Godavari to Krishna that, in turn,
facilitates water transfer to Pennar, and then to Cauvery. Additionally, we include the link
connecting Pamba to Achankvoil-Vaipar, transferring surplus water from Kerala to Tamil
Nadu.
1Links 5 and 6 were not considered for this analysis. Water transfers through these links from Krishna
to Pennar are only substitutes for the water transfers from Krishna to Pennar from the Nagarjunasagr-
Pennar links.

32
Upali A. Amarasinghe and R. Srinivasulu
Figure 1. River links in the peninsular component.
PROPOSED INTERBASIN WA TER TRANSFER LINKS,
PENINSULAR COMPONENT
ANDAMAN AND NICOBAR
1. Mahanadi (Manibhadra) - Gadavari (Dowlaiswaram)*2. Godavari (Inchampalli) - Krishna (Nagarjunasarar)*3.4.
6.
Godavari (Inchampalli) - Krishna (Pulichintala)*Godavari (Polavaram) - Krishna (Vijayawada)*
5. Krishna (Almatti) - Pennar*Krishna (Srisailam) - Pennar*
7. Krishna (Nagarjunasagar) - Pennar (Somasila)*8. Pennar (Somasila - Palar - Couvery (Grand Anicut)*
9. Cauvery (Kattalai) - Vaigai - Gundar*10. Ken - Betwa*11. Parbati - Kalisindh - Chambal*12. Par - Tapi - Narmada*13. Damanganga - Pinjal*
16. Pamba - Achankovil - Vaippar* * Feasibility reports completed
14. Bedti - Varda 15. Netravati - Hemavati
Links in the analysis include:
• The uppermost link of the peninsular component links Mahanadi (Manibhadra) and
Godavari (Dowlaiswaram) rivers. The primary objective of this link is to transfer
surplus water of the Mahanadi Basin. While doing so, en route, this link provides water
for irrigation, domestic purposes and industries and meets the water demands of the
downstream from Dowlaiswaram in the Godavari Basin. The latter is only a substitute
for the water transfers from Godavari to the Krishna Basin via three links upstream of
Dowlaiswaram.
• Godavari (Inchampalli)-Krishna (Nagarjunasagar) is the uppermost link originating from
the Godavari Basin and, en route, this link also supplies water for irrigation, domestic
and industrial purposes, and then transfers water from Krishna to the Pennar Basin at
Nagarjunasagar.

33
Cost and Benefits of the National River Linking Project: An Analysis of Peninsular Links
• Godavari (Inchampalli)-Krishna (Pulichintala) is the middle link originating from the
Godavari Basin and, en route, this water provides only for irrigation and domestic and
industrial purposes.
• Godavari (Polavaram)-Krishna (Vijayawada) is the lowermost link from the Godavari
Basin. The primary objective of this link is to facilitate water transfer from Krishna to
Pennar by way of substituting the water demand of Krishna below Vijayawada. This link
also has major provisions for irrigation, and domestic and industrial purposes en route
from the canal command.
• Krishna (Nagarjunasagar)-Pennar (Somasila) Link, one among the three links originating
from Krishna to Pennar, provides water en route for irrigation and domestic and industrial
purposes, and facilitates water transfer from the Pennar to the Cauvery Basin.
• Pennar (Somasila)-Palar-Cauvery Link, facilitating transfer of water received from
Krishna to the Cauvery Basin,
• Cauvery (Kattalai)-Vaigai-Gundai Link, which transfers water from smaller basins of
Cauvery. This link also provides water for irrigation and the domestic and industrial
sectors.
• The last link in the study transfers water from Pamba to Achankvoil-Vaipar subbasins for
irrigation, which is an independent component in the peninsular basins.
The eight links considered in this analysis transfer 61 Bm3 of water, accounting for 35%
of the total water transfers in NRLP and, en route, these canals provide 18.3 Bm3 irrigation to
2.9 million ha (Mha) of culturable land and meet 3 Bm3 of domestic and industrial needs.
En route, the command areas cut across 33 districts and include 0.256 Mha of croplands
in six districts in Orissa, 1.4 Mha of nine districts in Andhra Pradesh, and 0.823 Mha of 17
districts in Tamil Nadu (Table 1).
According to feasibility reports prepared by the National Water Development Agency
(NWDA 2008a-f), the total cost of supplying water to en-route commands of eight links is
US$6,257 million (Table 2), which is 41% of the total cost. This is only the apportioned cost
of water supply to en-route commands. For example, Mahanadi-Godavari diverts water not
only for the en-route command but also for Godavari Delta. The latter is a substitution for
the diversions from the upstream location in Godavari to the Krishna Basin. It also generates
hydropower to be used outside the en-route canal. The total cost of the project is US$3.9
billion, of which the en-route command accounts for only 35%.
The total cost estimate of the eight links is US$15 billion, which is only 12% of the cost
estimate of the whole NRLP project.

34
Upali A
. Am
arasinghe an
d R
. Srin
ivasu
lu
Table 1. Details of river links in the study.
Name of link Water transfers from the canals
Total Down-
stream
diversion
En-route water distribution En-route irrigated area distribution
Irrigation Domestic
and
industrial
Losses CCA1 Area of water
receipts
Share of
CCA
Districts in
CCA
Share of CCA
in districts
Mm3 Mm3 Mm3 Mm3 Mm3 ha ha ha
1 Mahanadi
(Manibhadra)-Godavari
(Dowlaiswaram)
12,165 6,500 3,790 802 1,073 363,959 Orissa 256,770 Nayagarh 28,057
Khurda 106,317
Cuttack 20,448
Puri 9,714
Ganjam 92,091
Gajapati 143
Andhra Pradesh 88,578 Srikakulam 73,499
Vizianagara 15,079
Vishakapatnam 18,611
2 Godavari
(Inchampalli)-Krishna
(Nagarjunasagar)
16,426 14,200 1,427 237 562 255,264 Andhra Pradesh 255,264 Warangal 70,021
Nalgonda 147,651
Khammam 37,592
3 Godavari (Inchampalli)-
Krishna (Pulichintala)
4,370 3,665 290 467,589 IRBC- AP 48,230 Warangal 24,115
Khammam 24,115
NSLBC-AP 6,900 Krishna 4,600
Khammam 2,300
NSLBC-LIFT-AP 203,369 Krishna 101,685
Khammam 101,684
NSLBC b.Tammi 137,975 West Godavari 137,975
NSRBC -AP 71,115 Guntur 4,600
Prakasam 66,515
4 Godavari (Polavaram)-
Krishna (Vijayawada)
5,325 3,501 1,402 162 260 139,740 Andhra Pradesh 139,740 West Godavari 69,870
Krishna 69,870

35
Cost an
d B
enefits o
f the N
ation
al Riv
er Lin
kin
g P
roject: A
n A
naly
sis of P
enin
sular L
ink
s
Table 1 (continued)
Name of link Water transfers from the canals
Total Down-
stream
diversion
En-route water distribution En-route irrigated area distribution
IrrigationDomestic and
industries Trans-mission
losses
CCA Area of water
receipts
Share of
CCA
Districts in the
CCA
Share of CCA
in districts
Mm3 Mm3 Mm3 Mm3 Mm3 (ha) (ha) (ha)
7 Krishna
(Nagarjunasagar)-
Pennar (Somasila)
12,146 8,426 3,264 124 332 581,017 Andhra
Pradesh
168,017 Prakasam 84,008
Nellore 84,008
Andhra
Pradesh
413,000 Nagarjunsagar
RBC 413,00
8 Pennar (Somasila)-
Palar-Cauvery
(Grand Anicut)
8,565 3,855 3,048 1,105 557 599,000 Andhra
Pradesh
283,553 Nellore 132,569
Chittoor 150,984
Tamil Nadu 315,447 Tiruvallur 34,492
Vellore 61,218
Kancheepur 44,657
Tiruvannama 62,366
Villupuram 72,702
Cuddalore 37,052
Pondicherry 2,962
9 Cauvery
(Kattalai)- Vaigai-
Gundar
2,252 - 1,067 185 115 452,000 Tamil Nadu 452,000 Karur 45,020
Tiruchchirap 68,462
Pudukkottai 72,489
Sivaganga 65,120
Ramanathapu 63,581
Virudhunaga 65,959
Thoothukudi 71,369
16 Pamba-Achankvoil-
Vaipar
635 - 635 - - 56,233 Tamil Nadu 56,233 Tirunelveli 30,765
Tuticorin 386
Virudhunaga 25,082
Note: CCA stands for cultivable command area
Sources: NWDA 2008a-h.

36
Upali A. Amarasinghe and R. Srinivasulu
Table 2. Total cost of supplying water to en-route commands of the eight links.
Name and no. of link in the
peninsular component
(see Figure 1)
Total
cost1
(Rs
million)
Year of
cost level
assessment
Financial
exchange
rate of
US$1 in
Rs
Capital cost
in million
US$ (in
2003-04
constant
prices)
1 Mahanadi (Manibhadra)-
Godavari (Dowlaiswaram)
63,018 2003-04 46.0 1,370
2 Godavari (Inchampalli)-Krishna
(Nagarjunasagar)
27,540 2003-04 46.0 599
3 Godavari (Inchampalli)-Krishna
(Pulichintala)
50,460 2003-04 46.0 1,097
4 Godavari (Polavaram)-Krishna
(Vijayawada)
14,839 1994-95 31.4 473
7 Krishna (Nagarjunasagar)-Pennar
(Somasila)
8,806 1998-99 42.1 209
8 Pennar (Somasila)-Palar-Cauvery
(Grand Anicut)
4,170 2003-04 46.0 1,472
9 Cauvery (Kattalai)-Vaigai-Gundar
Link
26,730 2003-04 46.0 581
16 Pamba-Achankvoil-Vaipar 139,79 1992-93 30.6 457
Total 242,597 334.1 6,257
1 This cost estimate is based on the feasibility reports prepared by the NWDA (NWDA 2008a-h). These costs are assessed in
constant prices of various years. The last column shows the cost estimates in constant 2003 prices.
Methodology of Benefit Assessment
We estimate financial benefit-cost ratio (BCR) and internal rate of return (IRR) of water
supply to en-route commands of the eight links. The financial benefit-cost analysis indicates
long-term financial viability of the proposed links. This is different from an analysis of social
benefits and costs that assesses how a project affects the society in total. The incremental net
benefits and costs to the participants, whom the project directly affects, is the basis for the
financial analysis. The analysis of social and economic benefits and costs assesses the effect
of the project on the national or regional economy and society. Indeed, for a project to be
economically and socially viable, first it must be financially sustainable, and second the social
and economic benefits should exceed the cost over the life span of the project.

37
Cost and Benefits of the National River Linking Project: An Analysis of Peninsular Links
The primary reason for focusing on a financial benefit-cost analysis in the study is data
availability. We have a sufficiently accurate long-term secondary database for the assessment of
net financial benefits of the en-route command. However, only limited information is available
for estimating the social and environmental costs. In our analysis, first we estimate the net
present value (NPV) of each link, which is the present value of net incremental value-added
benefit that the project will accrue over its lifetime. Discounting the net incremental benefits of
a base year over the project life span with an appropriate discount rate gives the NPV:
∑+
= +
−=
0
0 )1(
)(NN
tt
tt
r
CBNPV
where, Bt is the net value-added benefits in period t; C
t is the project cost in period t; r is the
appropriate financial discount rate; N0
is the number of years before the project providing
intended benefits, and N is the effective life of the project. A positive NPV indicates that
the investment is worthwhile for generating positive financial returns. We also estimate the
Internal Rate of Return (IRR) to assess the discount rate at which the project is a financially
viable venture. The IRR is the discount rate at which the NPV equals zero.
A major part of the water transfers of the links is for irrigation. Of the eight links, 76% of
the water transfers to en-route command areas is for irrigation, and 10% for meeting domestic
and industrial water needs (Table 1). Further, 14% is accounted for as transmission losses. Thus,
a primary focus of this analysis is to estimate the net value-added benefits of crop production
(crops
tB ). We estimate the net benefit of crop production of a link by aggregating the benefits
over districts that intersect the link command area. Benefits of new irrigation on a district
include net value-added crop output (NVACOUP) and the indirect benefits are generated
through forward and backward linkages with increased irrigation. This paper mainly deals
with estimation of direct benefits. However, we draw from the results of other benefit-cost
studies of water transfers to estimate the indirect effects. Bhatia and Malik (2007) estimated a
multiplier value of 1.9 for the Bhakra irrigation project in Haryana. This means that for every
$100 of direct benefits that new transfers generate, another $90 is generated, for the region
where the project is located as a multiplier effect. For smaller projects, the multiplier effect has
a smaller value, ranging from 1.1 to 1.4. Since the proposed command areas of the links are
relatively smaller than the Bhakra irrigation project, we assumed 1.4 as the multiplier effect
for estimating indirect benefits. So,
NVACOUPB crops ×= 4.1
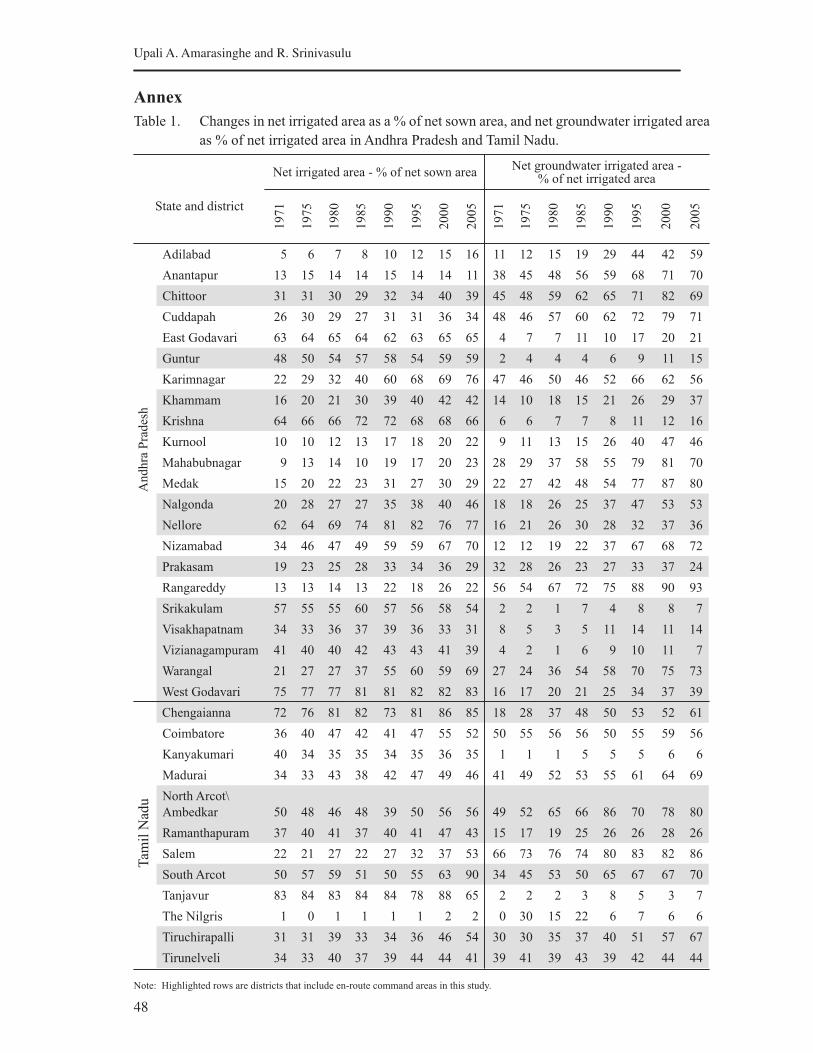
The feasibility reports (NWDA 2008 a-h) indicate that parts of the proposed command
areas of many links do already receive irrigation from small surface water schemes. Given
the recent trends of land use patterns, it is likely that groundwater irrigation has also spread
to many parts of the proposed command area (Annex Table 1 for changes in land use patterns
of 33 districts). For example, Bhaduri et al. (2008) estimated that more than 90% of some
districts in the en-route command area of the Godavari (Polavaram)-Krishna (Vijayawada)
Link at present use groundwater irrigation. In the Ken-Betwa, another smaller link in the
peninsular component, groundwater irrigation could have expanded to 35% of the command
area (Amarasinghe et al. 2008). Of the 33 districts in the eight links, groundwater-irrigated
area has increased significantly between 1985 and 2005. Groundwater irrigation varies from 7
to 73% of the net irrigated area in Andhra Pradesh, and 20 to 86% in Tamil Nadu.

38
Upali A. Amarasinghe and R. Srinivasulu
Thus, water transfers of new links contribute to increase NVACOUP in the command
areas in two ways. They change, (a) cropping intensity and cropping patterns and increase crop
output on the already irrigated portion inside the proposed command areas and, (b) the yield,
cropping intensity and cropping patterns in the rain-fed areas of the proposed command.
The total net value-added output (NVACOUPcrops) in each link is:
where, i varies over districts in the command area and j varies over 11 crops or crop categories,
including rice, wheat, maize, other cereals, pulses, oilseed, sugar, fruits, vegetables, cotton and
other crops including fodder, etc. Also,
Ai - culturable command area of the link in the ith district,
Ai0 - culturable command area of the link in the ith district irrigated in 2000,
CPj - share of the area of crop j in the proposed cropping patterns,
- share of the irrigated area of crop j in district i in 2000,
- share of the rain-fed area of crop j in district i in 2000,
- irrigated yield of crop j in district i in 2000,
- rain-fed yield of crop j in district i in 2000,
- cost of cultivation of crop j in district i in 2000 under irrigation conditions,
- cost of cultivation of crop j in district i in 2000 under rain-fed conditions, and
pj
- average export price of crop j in 1999-2001.
The secondary data for this analysis were available from various sources. This includes the
Directorate of Economics and Statistics (GOI 2008) for the trends of cropping and irrigation
patterns at the district level and cost of production data at the state level: IWMI PODIUMSIM
model (Amarasinghe and Sharma 2008) for irrigated and rain-fed crop yields at the district
level; and the FAOSTAT database (FAO 2008) for the world export prices.
In addition to the increases in crop production, water transfers also generate other benefits
in the form of hydropower generation, and water transfers to domestic and industrial sectors.
For these benefits, we rely on the estimates in the feasibility reports (NWDA 2008a-h). They
also give the capital costs of construction of the links.
Scenarios of NVACOUP
This study estimates net value-added benefits of crop production in en-route command areas
under different scenarios of increases in cropping intensity. The main reason for this is the
available information on current cropping or irrigation intensity in the proposed command
areas. Feasibility reports do not show what part of the proposed command area is new, or
already irrigated, or under rain-fed conditions. Therefore, we consider four scenarios of
assessing NVACOUP.
districtsi
cropsjRF
ijoj
RF
ij
RF
ijo
IR
ijoj
IR
ijj
ii
cropsj
IR
ijj
IR
ij
IR
ijojio
crops
CpYCP
CpYCPAA
CpYCPCPA
NVACOUP
)(
)()(
)()(
0
0
39
Cost and Benefits of the National River Linking Project: An Analysis of Peninsular Links
Scenario I assumes that the proposed command area is a completely new addition to
the crop production base. Essentially, this means no crop production exists at present on the
proposed command area, and hence Aio=0, and
=0. Obviously, this scenario would give
the highest crop production benefits with new water transfers.
Scenario II assumes that the proposed command area is completely under rain-fed
cultivation at present, indicating only Aio=0. Additionally, we assume that the share of crop
area in the command area at present is the same as the share of crop area in the respective
districts under rain-fed condition.
Scenario III assumes that maximum cropping intensity in the command areas at present
is the minimum of the existing and the proposed command areas. This scenario assumes that
maximum annual cropped area at present within the proposed command area is the cropped
area proposed under full irrigation.
• For example, the current cropping intensity in districts covering the Mahanadi-Godavari
en-route command area is 152% (Table 3). But we assume the current cropping intensity
as only 131%, which is the same as the proposed cropping intensity under full irrigation.
Only, 57% of that area is irrigated at present.
• In the districts covering Godavari (Inchampalli)-Krishna (Pulichintala) Link command,
the current cropping intensity is 140%. But the proposed irrigation intensity is only
110%. So, in Scenario III we assume only 110% existing cropping intensity for Godavari
(Inchampalli)-Krishna (Pulichintala) Link command.
Scenario IV assumes that irrigation is already available for a part of the command area.
Also, the share of crop area in the command area under irrigated and rain-fed conditions at
present is the same as that of the districts intersecting the command (Table 3). For example, the
current cropping and irrigation intensities in the command area of Mahanadi-Godavari Link
are assumed to be the same as those of the districts covering the command areas. In this case,
the current cropping and irrigation intensities are 157 and 47%, respectively. However, the
proposed irrigation intensity in the command area is 137%. This allows a part of the command
area to be rain-fed even after water transfers; and the irrigation intensity in the Mahanadi-
Godavari Link is 20% of the culturable command.
In all these scenarios, we assume the following in NVACOUP estimation:
• Feasibility reports show that a significant part of the command area is allocated for crops
other than the 10 crops or crop categories mentioned above. We use the maximum of net
value-added in the 10 crops to estimate the net benefits of other crops. In most links, this
is the net value-added benefits of fruits and vegetables (Annex Table 2).
• The secondary data of cost of crop production under irrigation and rain-fed conditions
at the district level are not available for this analysis. Depending on the availability of
data and estimation constraints, we use a regression analysis of the state-level data from
2001 to 2004 to estimate the cost of production. The dependent variable of the regression
analysis is the cost of production per ha and the independent variable is the percentage of
irrigated area of crops. Additionally, a dummy variable captures other differences between
states. In sugarcane, the total area is almost completely irrigated in most states. Therefore,
we use the cost of production of irrigated sugarcane in Andhra Pradesh for the current
analysis (these items of information are given in Annex Table 2).
40
Upali A. Amarasinghe and R. Srinivasulu
Benefits and Costs
As expected, Scenario I, with no crop production before water transfers, has the highest
NVACOUP, generating $1,898/ha of gross crop area (GCA) of all links (Table 4). Scenario II,
with only one-season of rain-fed crop before water transfers, has the next highest NVACOUP,
i.e., $1,040/ha.
• In Scenario II, all canals, except those in the Godavari (Inchampalli)-Krishna
(Nagarjunasagar) Link, have positive net benefits. The negative benefits in these canals
are mainly due to small differences in yields under irrigated and rain-fed areas at present
and changes in proposed cropping patterns. The proposed cropping patterns in the
Godavari (Inchampalli)-Krishna (Nagarjunasagar) Link do not have rice or other crops,
which dominate the cropping patterns at present. Thus, in spite of increase in area under
fruits and vegetables, with the highest net benefit/ha of different crops at present, the
decreases in rice and other crops in the proposed cropping patterns have decreased the
total NVACOUP.
• If the proposed cropping pattern is the same as that existing at present, then the NVACOUP
increases from a negative 262/ha to a positive 2,093/ha.
Scenario III has the next best NVACOUP, i.e., $613/ha. This scenario still generates
negative benefits in the Godavari (Inchampalli)-Krishna (Nagarjunasagar) Link, due to changes
in cropping patterns. If the proposed cropping pattern is similar to that existing at present, then
NVACOUP in this link changes from a negative $719/ha to a positive $411 /ha.
Scenario IV has the lowest benefits, i.e., $279/ha. Three out of the eight links under
this scenario have negative value-added benefits. This is again mainly due to differences in
cropping patterns. If the proposed cropping pattern is similar to that existing at present, then
NVACOUP of the Godavari (Inchampalli)-Krishna (Nagarjunasagar) Link will increase from
a negative $860/ha to a positive $134/ha.
This shows that the selection of a proper high-value cropping pattern, even after
irrigation transfers, should be a necessary condition for the links to generate positive net
benefits. Any drastic changes from the present cropping patterns, especially from fruits/
vegetables and other high-value crops would not yield any crop production benefits in the
proposed command areas. At present, fruits, vegetables, rice and sugarcane provide the highest
value-added net benefit per ha of all crops (Table 2). For crop production to generate positive
net benefits, the proposed cropping patterns should include a higher percentage of high-value
crops. This is more important in the command areas, where yields of irrigated crops are not
significantly higher than those of rain-fed crops.

41
Cost an
d B
enefits o
f the N
ation
al Riv
er Lin
kin
g P
roject: A
n A
naly
sis of P
enin
sular L
ink
s
Table 3. Existing and proposed cropping and irrigation patterns.
Cropping and irrigation patterns (%).
No. and name of link. (Figure 1) Net command
area
Ric
e
Mai
ze
Wh
eat
Oth
er
cere
als
Pu
lses
Oil
see
ds
Su
gar
can
e
Fru
its
and
veg
etab
les
Cott
on
Oth
er
To
tal
1 Mahanadi (Manibhadra)
Godavari (Dowlaiswaram)
363,959 %CA-20001 74 2 0 4 35 15 3 8 4 8 152
%IA-20001 47 0 0 1 2 1 3 3 1 0 57
%CA (= %IA) - proposed 73 1 0 1 17 21 0 7 1 11 131
2 Godavari (Inchampalli)-Krishna
(Nagarjunasagar)
255,264 %CA-20001 42 4 0 6 17 12 0 5 12 21 119
%IA-20001 41 1 0 0 0 3 0 2 2 0 50
%CA (= %IA) - proposed 0 15 0 28 17 22 0 10 8 0 100
3 Godavari (Inchampalli)-Krishna
(Pulichintala)
467,589 %CA-20001 66 4 0 2 20 4 6 5 12 21 140
%IA-20001 64 1 0 1 0 2 5 2 2 0 77
%CA (= %IA) - proposed 0 0 0 0 15 45 0 30 10 0 100
4 Godavari (Polavaram)-Krishna (Vijayawada) 139,740 %CA-20001 91 2 0 0 21 2 9 5 10 14 155
%IA-20001 91 2 0 0 0 1 8 2 2 0 106
%CA (= %IA) - proposed 48 6 12 12 15 18 6 21 6 6 150
7 Krishna (Nagarjunasagar)-Pennar (Somasila)
Link
168,017 %CA-20001 54 2 0 3 28 6 3 5 13 23 135
%IA-20001 54 0 0 2 1 3 2 2 1 0 66
%CA (= %IA) - proposed 25 0 0 24 10 15 0 4 9 13 100
8 Pennar (Somasila)-Palar-Cauvery (Grand
Anicut)
599,000 %CA-20001 46 0 0 5 10 31 10 4 4 7 118
%IA-20001 45 0 0 1 1 11 10 2 1 0 72
%CA (= %IA) - proposed 18 4 0 10 14 15 0 5 13 20 100
9 Cauvery (Kattalai)-Vaigai-Gundar 452,000 %CA-20001 54 1 0 7 4 14 3 4 4 12 103
%IA-20001 36 0 0 0 1 4 2 2 1 0 46
%CA (= %IA) - proposed 15 5 0 10 10 20 0 20 20 0 100
16 Pamba-Achankvoil-Vaipar 56,233 %CA-20001 61 2 0 3 7 13 3 5 4 15 113
%IA-20001 43 1 0 1 2 5 2 3 3 0 59
%CA (= %IA) - proposed 15 0 0 13 12 15 0 20 15 0 90
1 - CA-2000 and IA-2000 mean cropped and irrigated areas in 2000.

42
Upali A
. Am
arasinghe an
d R
. Srin
ivasu
lu
Table 4. Net value of crop output before and after water transfers.
Name and no. of link (Figure 1)
Net value of crop output per ha of gross cropped area ($/ha in 2000 prices)
Scenario I Scenario II Scenario III Scenario IV
Before After Change Before After Change Before After Change Before After Change
1 Mahanadi-Godavari 0 948 948 622 948 326 668 948 280 703 864 161
2 Godavari–Krishna
(Nagarjunasagar)
0 972 972 1,233 972 -261 1,681 972 -709 1,677 870 -807
3 Godavari-Krishna (Pulichintala) 0 2,792 2,792 1,125 2,792 1,667 1,672 2,792 1,120 1,651 2,114 463
4 Godavari-Krishna (Vijayawada) 0 1,874 1,874 697 1,874 1,177 1,357 1,874 517 1,360 1,834 474
7 Krishna (Nagar.)-Pennar (Somasila) 0 1,748 1,748 1,069 1,748 678 1,662 1,748 85 1,764 1,399 -365
8 Pennar (Somasila)-Palar-Cauvery 0 2,398 2,398 518 2,398 1,880 1,094 2,398 1,304 1,097 2,085 988
9 Cauvery (Kattalai)-Vaigai-Gundar 0 1,895 1,895 1,026 1,895 869 1,416 1,895 479 1,421 1,851 429
16 Pamba-Achankvoil-Vaipar 0 1,943 1,943 944 1,943 999 1,567 1,943 375 1,600 1,624 24
All links 0 1,898 1,898 869 1,898 1,028 1,297 1,898 601 1,320 1,654 335

43
Cost and Benefits of the National River Linking Project: An Analysis of Peninsular Links
Net Present Value (NPV) and Internal Rate of Return (IRR)
In estimating NPV and IRR, we assumed a 12% annual discount rate, a 10-year construction
period, project life span of 50 years and 10% of the capital cost as operation and maintenance
costs. Total net value-added benefits of water transfers include:
• Net value-added benefits of crop production due to irrigation water transfers.
• Benefits of domestic and industrial2 water transfers.
• Hydropower generation.3
• Indirect benefits of water supply assessed through a multiplier value, which we have taken
as 1.4.
The net value-added benefit of a link is 1.4 times the net value-added crop output and
domestic, industrial and hydropower benefits. The data show the percentage share of water
supply and contribution to net value-added benefits by the irrigation, domestic and industrial
sectors (Table 5). Clearly, a major part of the water deliveries is for irrigation. Of the eight
links in this study, 85% of the water deliveries is for the irrigation sector, and 8 and 7%
for domestic and industrial sectors, respectively. The contribution to net value-added benefits
varies with existing extent of cropped and irrigated area. Scenario I has the highest contribution
of irrigation to net value-added benefits. This contribution decreases from 88 to 62% from
Scenarios I and IV.
The NPV, IRR and BCR of different links are given in Table 5. The results indicate the
following:
• Under Scenario 1, all links except the Pamba-Achankvoil-Vaipar Link, have a significantly
high IRR (16-39%) and BCR (1.3-6.9), showing that investments in the en-route canal
command are financially viable. However, financial viability decreases with the assumption
on existing cropped and irrigated areas in the proposed commands.
• If the en-route command at present has only rain-fed cropping (Scenario 2), then all links,
except the Godavari (Inchampalli)-Krishna (Nagarjunasagar) and Pamba-Achankvoil-
Vaipar links are financially viable. The proposed cropping pattern is the major reason for
financial nonviability. If this link also has a high-value cropping pattern it can also be a
financially viable option. If the proposed cropping patters are similar to those existing
now, the BCR and IRR of the Godavari (Inchampalli)-Krishna (Nagarjunasagar) Link
under Scenario 2 increase between 2.0 and 20%.
• A major part of the proposed command areas in all links already has some cropped area,
and within that some irrigation. Scenarios III and IV correspond to these conditions.
Under these scenarios, the IRR of all links, except the Godavari (Inchampalli)-Krishna
(Nagarjunasagar), Krishna (Nagarjunasagar)-Pennar (Somasila) and Pamba-Achankvoil-
Vaipar links, are more than the discount rate and BCR is more than 1, indicating that they
will be financially viable investments with the projected benefit streams.
2Benefits of domestic and industrial supply of all links are assessed at 5.00 and 14.50 Rs/m3, respectively,
of water deliveries, the rate used for assessing Godavari (Inchampalli)-Krishna (Nagarjunsagar) Links. 3Hydropower benefit is assessed at 1.67 per unit of kWh, the prevailing average rate per unit in Andhra
Pradesh (NCAER 2009).

44
Upali A. Amarasinghe and R. Srinivasulu
• These links whose proposed cropping patterns are quite different from those existing now
have low irrigation benefits, low NPV and lower IRR and BCR. If the proposed cropping
patters are similar to those existing now, the IRR and BCR of the Godavari (Inchampalli)-
Krishna (Nagarjunasagar) Link under Scenario III increases to 14 and 1.1%, respectively.
But the net benefits under Scenario IV still do not exceed the cost (BCR=0.7). With high-
value cropping patterns, the Krishna (Nagarjunasagar)-Pennar (Somasila) Link can also
generate large net benefits, high IRR and BCR.
Thus, it is clear from the analysis that projected benefits of individual links depend on
the extents of cropping and irrigation that exist at present and the proposed cropping patterns
in en-route command areas. If the proposed cropping patterns have substantial high-value crop
areas, which at least give the net benefits as in fruits and vegetables, new investments on water
supply in individual link commands are financially viable.
However, water transfers between links in the Mahanadi-Godavari-Pennar-Cauvery
subcomponent are dependent on one another. Thus, it is more appropriate to assess benefits
and costs for the whole component than for the individual links. When all links are considered
together, the net value-added benefits still exceed the cost. The IRR and BCR are significantly
higher than the discount rate (12 %) and 1 respectively, under Scenarios I and II; 19 and
1.7%, respectively, under Scenario III, and 15 and 1.3%, respectively, under Scenario IV. This
shows that with proper cropping patterns, the aggregate net benefits of en-route commands in
the Mahanadi-Godavari-Pennar-Cauvery component exceed the cost, and the investments are
financially viable.
Does this mean that the subcomponent of linking Mahanadi, Godavari, Pennar and
Krishna as a whole, is a financially viable investment? This is a difficult question to answer
from the above results due to many reasons. We discuss these issues next.

45
Cost an
d B
enefits o
f the N
ation
al Riv
er Lin
kin
g P
roject: A
n A
naly
sis of P
enin
sular L
ink
s
Table 5. Share of water deliveries and contribution to net value-added benefits from domestic (DOM), industrial (IND), hydropower generation
(HYP) and irrigation (IRR) sectors and net present value (NPV), benefit-cost ratio (BCR) and internal rate of return (IRR).
No. and name of link in
Figure 1
Share of water
deliveries (%)
Contribution to net value-added benefits (%).
Scenario 1 Scenario 2 Scenario 3
DOM IND IRR DOM IND HYP IRR DOM IND HYP IRR DOM IND HYP IRR
1 Mahanadi-Godavari 8 9 83 6 22 1 70 10 33 2 55 13 43 2 42
2 Godavari-Krishna (Nagarjunasagar) 6 8 86 4 14 0 82 na na na na na na na na
3 Godavari-Krishna (Pulichintala) 4 6 90 1 5 0 93 2 9 0 89 3 12 1 84
4 Godavari-Krishna (Vijayawada) 10 0 90 4 0 0 96 6 0 0 94 14 0 0 86
7 Krishna (Nagar.)-Pennar (Somasila) 4 0 96 5 0 0 95 11 0 0 89 49 0 0 51
8 Pennar (Somasila)- Palar-Cauvery 15 12 73 4 10 0 86 5 12 0 83 7 16 0 77
9 Cauvery (Kattalai)-Vaigai-Gundar 5 10 85 1 4 0 95 2 9 0 89 3 15 0 82
16 Pamba-Achankvoil-Vaipar 0 0 100 0 0 30 70 0 0 45 55 0 0 69 31
All links 8 7 85 3 8 0 88 5 13 0 81 8 21 1 71
Table 5 (continued)
Name and no.
of link
Contribution (%) NPV (US$), BCR (number) and IRR (%)
Scenario 4 Scenario 1 Scenario 2 Scenario 3 Scenario 4
DOM IND HYP IRR NPV BCR IRR NPV BCR IRR NPV BCR IRR NPV BCR IRR
Link 1 15 51 3 32 1,404 2.0 21 446 1.3 16 20 1.0 12 -201 0.9 10
Link 2 na na na na 721 2.2 22 -674 na na -1,180 na na -1,464 na na
Link 3 5 19 1 75 5,090 5.6 35 2,760 3.5 29 1,627 2.5 24 654 1.6 18
Link 4 15 0 0 85 1,348 3.9 30 917 3.0 26 88 1.2 14 64 1.1 14
Link 6 na na na na 1,152 6.6 38 356 2.7 25 -85 0.6 5 -516 na na
Link 7 7 17 0 75 5,867 5.0 34 4,491 4.1 31 2,964 3.0 27 2,605 2.8 25
Link 8 3 16 0 81 3,414 6.9 39 1,360 3.4 28 579 2.0 21 505 1.9 20
Link 10 0 0 96 4 156 1.3 16 -56 0.9 10 -195 0.6 5 -273 0.4 na
All links 10 27 1 62 19,360 4.3 32 9,844 2.7 25 4,084 1.7 19 1,653 1.3 15
Note: 1, “na” indicates values are negative or not defined; aggregate based on all links except Pamba-Achankvoil-Vaipar.
Sour ce: Authors’ estimates.

46
Upali A. Amarasinghe and R. Srinivasulu
Discussion and Conclusion
We discuss a few issues here that arise from our analysis of benefits and costs or from lack of
detailed information on the proposed links.
• According to the NRLP plan, a substantial part of the proposed water transfers in the
Mahanadi-Godavari-Pennar-Cauvery subcomponent is only a substitute for the water
transfers out of the upstream of river basins. For example, 6,500 Mm3 of water transfers
in the Mahanadi-Godavari Link are allocated to meet the demand downstream of the
Godavari River. If not for water transfers to Krishna from the upstream of Godavari, the
above quantity for downstream use would anyway be available from the surplus water of
Godavari. Since this quantity is only a substitution, what additional net output would this
generate and account for the project benefits? A similar situation is applicable for the water
transfers to the Krishna Delta through the Godavari (Polavaram)-Krishna (Vijayawada)
Link, which amounts to another 3,500 Mm3.
The water transfers of these two links as substitution is 10,000 Mm3, and this
volume would be more than half the water delivered to en-route command areas. An
important question here is whether the net value-added benefits from the water transfers
as substitution are more than the value transfers can generate if they are new transfers to
a region. Theoretically, this cannot generate any net value-added benefits in Godavari as
it is a water-surplus basin. However, the water transfers to the Krishna Delta could add
value as it is a water-scarce basin. However, it is not clear from the feasibility reports how
this allocation would be used in the Krishna Delta.
If the total capital cost of the Mahanadi-Godavari Link is added to the cost
component, the IRR of all links under Scenarios III and IV will decrease to 13 and 10%,
respectively.
• It is not completely clear whether the water transfers from Brahmaputra to Mahanadi
basins through the Himalayan Links are necessary for the fully operational Mahanadi-
Godavari-Krishna-Pennar subcomponent. If they are, then a part of the capital cost of the
Himalayan Links should also be included in the peninsular subcomponent in this analysis.
Therefore, the capital cost estimates of the links used in this study could be substantially
lower, and hence the estimates of IRR and BCR could be higher. For instance, the Manas-
Sankosch-Tista-Ganga, Ganga-Damodar-Subernarekha, and Subernarekha-Mahandi links
in the Himalayan component facilitating water transfers from Brahmaputra to Mahanadi
cost about US$19 billion. In fact, the total cost of these three links is 30% more than the
total cost of the eight links in this study, and 200% more than the cost of water transfers
to eight en-route link commands. Thus, adding a portion of the Himalayan component
capital cost could very much escalate the total cost used in this analysis. Under such a
scenario, the BCR and ICR will decrease drastically.
• A substantial part of the irrigation deliveries and the transmission losses in canals
contribute to groundwater recharge. This recharge could help expand groundwater below
the command areas and links. In this study, the extent of groundwater irrigation that will
originate from this groundwater recharge and the resulting benefits are not clear. If these
are known, it is certainly an indirect contribution for the benefit streams, and with regional
multipliers the net value-added could be much higher. If we include these benefits, the
BCR and IRR of the subcomponent could increase.

47
Cost and Benefits of the National River Linking Project: An Analysis of Peninsular Links
• The new reservoirs and canals will submerge large parts of forest and agricultural land
and displace populations. Forests contribute to livelihoods of many people, especially the
tribal population living there. They are the majority who will be displaced due to water
transfers. The flora and fauna of the submerged lands were means of income for many
people. This analysis has not considered the financial losses due to the submergence of
lands, displacement of people and environmental impacts on the riverine environment.
Such financial losses can decrease the net value-added benefits, reducing IRR and BCR.
• New reservoirs impound large quantities of water and affect the river flows downstream.
Vladimir et al. (2008) show that many peninsular river basins could be perceived to have
more surpluses than what they actually have. If these perceived surpluses are impounded
and transferred out of the basin, they could badly affect river flows downstream. River
flows in the downstream support the livelihoods of many people, especially in terms of
inland navigation, fishing, tourism, etc. Thus, impounding could financially affect riverine
populations directly and others indirectly. If these financial losses are included, IRR and
BCR could decrease.
Our analysis indicates that if new water transfers only bring new lands into cultivation,
the benefits are immense. Also, if water transfers are only used for irrigating the existing rain-
fed lands, the net value-added benefits could still exceed costs by several factors. However,
in reality this is not the case. The proposed command areas for irrigation in many river links
already have some cropped areas and, in some cases, irrigated areas too. The financial viability
of these links depends on the proposed cropping patterns. They require irrigating substantially
high-value crops such as vegetables and fruits. The IRR and BCRs of links depend on many
factors other than net value-added benefits of irrigation, domestic and industrial sectors in
the en-route command areas and hydropower generation. These include hydrological factors
related to groundwater recharge and benefits; environmental factors due to area submergence
and loss of river flows, and social factors due to displacement, resettlement and rehabilitation
of project-affected people. They need to be considered for a proper financial and social benefit-
cost analysis framework.
48
Upali A. Amarasinghe and R. Srinivasulu
Annex
Table 1. Changes in net irrigated area as a % of net sown area, and net groundwater irrigated area
as % of net irrigated area in Andhra Pradesh and Tamil Nadu.
State and district
Net irrigated area - % of net sown areaNet groundwater irrigated area -
% of net irrigated area
19
71
19
75
19
80
19
85
19
90
19
95
20
00
20
05
19
71
19
75
19
80
19
85
19
90
19
95
20
00
20
05
Adilabad 5 6 7 8 10 12 15 16 11 12 15 19 29 44 42 59
Anantapur 13 15 14 14 15 14 14 11 38 45 48 56 59 68 71 70
Chittoor 31 31 30 29 32 34 40 39 45 48 59 62 65 71 82 69
Cuddapah 26 30 29 27 31 31 36 34 48 46 57 60 62 72 79 71
East Godavari 63 64 65 64 62 63 65 65 4 7 7 11 10 17 20 21
Guntur 48 50 54 57 58 54 59 59 2 4 4 4 6 9 11 15
Karimnagar 22 29 32 40 60 68 69 76 47 46 50 46 52 66 62 56
Khammam 16 20 21 30 39 40 42 42 14 10 18 15 21 26 29 37
Krishna 64 66 66 72 72 68 68 66 6 6 7 7 8 11 12 16
Kurnool 10 10 12 13 17 18 20 22 9 11 13 15 26 40 47 46
Mahabubnagar 9 13 14 10 19 17 20 23 28 29 37 58 55 79 81 70
Medak 15 20 22 23 31 27 30 29 22 27 42 48 54 77 87 80
Nalgonda 20 28 27 27 35 38 40 46 18 18 26 25 37 47 53 53
Nellore 62 64 69 74 81 82 76 77 16 21 26 30 28 32 37 36
Nizamabad 34 46 47 49 59 59 67 70 12 12 19 22 37 67 68 72
Prakasam 19 23 25 28 33 34 36 29 32 28 26 23 27 33 37 24
Rangareddy 13 13 14 13 22 18 26 22 56 54 67 72 75 88 90 93
Srikakulam 57 55 55 60 57 56 58 54 2 2 1 7 4 8 8 7
Visakhapatnam 34 33 36 37 39 36 33 31 8 5 3 5 11 14 11 14
Vizianagampuram 41 40 40 42 43 43 41 39 4 2 1 6 9 10 11 7
Warangal 21 27 27 37 55 60 59 69 27 24 36 54 58 70 75 73
West Godavari 75 77 77 81 81 82 82 83 16 17 20 21 25 34 37 39
Chengaianna 72 76 81 82 73 81 86 85 18 28 37 48 50 53 52 61
Coimbatore 36 40 47 42 41 47 55 52 50 55 56 56 50 55 59 56
Kanyakumari 40 34 35 35 34 35 36 35 1 1 1 5 5 5 6 6
Madurai 34 33 43 38 42 47 49 46 41 49 52 53 55 61 64 69
North Arcot\
Ambedkar 50 48 46 48 39 50 56 56 49 52 65 66 86 70 78 80
Ramanthapuram 37 40 41 37 40 41 47 43 15 17 19 25 26 26 28 26
Salem 22 21 27 22 27 32 37 53 66 73 76 74 80 83 82 86
South Arcot 50 57 59 51 50 55 63 90 34 45 53 50 65 67 67 70
Tanjavur 83 84 83 84 84 78 88 65 2 2 2 3 8 5 3 7
The Nilgris 1 0 1 1 1 1 2 2 0 30 15 22 6 7 6 6
Tiruchirapalli 31 31 39 33 34 36 46 54 30 30 35 37 40 51 57 67
Tirunelveli 34 33 40 37 39 44 44 41 39 41 39 43 39 42 44 44
Note: Highlighted rows are districts that include en-route command areas in this study.
An
dh
ra P
rad
esh
Tam
il N
adu

49
Cost and Benefits of the National River Linking Project: An Analysis of Peninsular Links
Table 2. Cost of cultivation, crop yields and net value-added benefits/ha for different crops.
Factor and link name Irrigated
(IR) or
rain-fed
(RF)
conditions
Crops
Ric
e
Mai
ze
Oth
er
cere
als
Pu
lses
Oil
cro
ps
Su
gar
can
e
Fru
its
and
veg
etab
les
Co
tto
n
Cost of cultivation ($/ha) IR 439 268 257 337 329 628 748 381
RF 195 183 227 81 310 628 505 77
Crop yield (tonnes/ha)
Mahanadi-Godavari IR 1.36 2.01 0.49 0.23 0.77 3.79 16.81 0.34
RF 0.71 0.57 0.27 0.21 0.32 2.56 11.30 0.26
Godavari-Krishna IR 2.60 4.00 1.36 0.57 1.21 4.85 17.30 0.34
RF 1.50 2.43 0.44 0.39 0.56 3.15 11.49 0.28
Godavari (Inchampalli)-
Krishna (Pulichintala)
IR 3.14 5.24 0.79 0.61 1.46 5.39 17.30 0.37
RF 1.50 2.82 0.77 0.70 0.67 3.49 11.49 0.27
Polavaram-Vijayawada IR 3.14 5.55 1.11 1.81 5.48 17.30 0.37
RF 3.20 1.80 0.92 1.04 3.55 11.49 0.27
Krishna (Nagarjunasagar)-
Pennar (Somasila)
IR 3.19 6.76 0.92 0.70 1.72 5.04 17.30 0.35
RF 4.12 0.27 0.59 0.80 3.27 11.49 0.28
Pennar (Somasila)-Palar-
Cauvery (Grand Anicut)
IR 3.27 1.87 3.06 0.54 1.71 7.52 16.56 0.38
RF 1.98 2.55 1.68 0.61 0.85 2.80 8.43 0.27
Cauvery (Kattalai)
-Vaigai-Gundar Link
IR 3.09 1.40 2.62 0.37 1.57 9.86 16.06 0.41
RF 1.06 0.97 1.08 0.49 0.97 3.14 11.05 0.28
Pamba-Achankvoil-Vaipar
Link
IR 3.55 1.31 3.07 0.37 1.44 10.57 15.54 0.38
RF 1.00 0.80 1.61 0.51 0.95 3.14 10.68 0.23
Export price ($/tonne) 375 176 203 499 559 267 530 1,100
Net value-added benefits ($/ha)
Mahanadi (Manibhadra)-
Godavari (Dowlaiswaram) 1 170 14 -245 228 329 2,676 -214
Godavari (Inchampalli)-
Krishna (Nagarjunasagar) 170 192 155 -166 346 455 2,838 -238
Godavari (Inchampalli)-
Krishna (Pulichintala) 370 343 -26 -305 423 507 2,838 -199
Godavari (Polavaram)-
Krishna (Vijayawada) 933 328 -396 -161 409 516 2,838 -196
Krishna (Nagarjunasagar)-
Pennar (Somasila) 951 380 102 -201 499 473 2,838 -230
Pennar (Somasila)-Palar-
Cauvery (Grand Anicut) 241 -204 249 -291 466 1,263 4,071 -191
Cauvery (Kattalai)-Vaigai-
Gundar 515 -10 281 -316 321 2,009 2,418 -164
Pamba-Achankvoil-Vaipar 714 6 266 -328 257 2,198 2,332

50
Upali A. Amarasinghe and R. Srinivasulu
References
Amarasinghe, U.A.; Sharma, B.R. (Eds). 2008. Strategic Analyses of the National River Linking Project (NRLP)
of India, Series 2. Proceedings of the Workshop on Analyses of Hydrological, Social and Ecological Issues
of the NRLP. Colombo, Sri Lanka: International Water Management Institute, 500p.
Amarasinghe, U.A.; Sharma, B.R.; Aloysius, N.; Scott, C.; Smakhtin, V.; de Fraiture, C. 2005. Spatial variation
of water supply and demand across river basins of India. Research Report 83. Colombo, Sri Lanka:
International Water Management Institute.
Amarasinghe, U.A.; Singh, O.P.; Shah, T.; Chauhan, R.S. 2008. Benefits of irrigation water transfers in the
National River Linking Project: A case study of the Ken-Betwa link. In: Strategic Analyses of the National
River Linking Project (NRLP) of India, Series 2. Proceedings of the Workshop on Analyses of Hydrological,
Social and Ecological Issues of the NRLP, ed. Amarasinghe, Upali A.; Sharma, B.R. , Colombo, Sri Lanka:
International Water Management Institute.
Amarasinghe, U. A.; Shah, T.; Malik, R. P. S. (Eds). 2009. India’s water future: scenarios and issues. Colombo,
Sri Lanka: International Water Management Institute, 417p.
Bhaduri, A.; Amarasinghe, U.A.; Shah, T. 2008. Benefits of irrigation water transfers in the National River
Linking Project: A case study of Godavari (Polavaram)-Krishna link in Andhra Pradesh. In: Strategic
Analyses of the National River Linking Project (NRLP) of India, Series 2. Proceedings of the Workshop on
Analyses of Hydrological, Social and Ecological Issues of the NRLP, ed. Amarasinghe, Upali A.; Sharma,
B.R. Colombo, Sri Lanka: International Water Management Institute.
Bhatia, R.; Malik, R.P.S. 2007. Indirect economic impacts of Bhakra Multipurpose Dam, India (duplicated).
CPWF (Challenge Program on Water and Food) 2005. Strategic Analyses of India’s River Iinking Project. The
Project Proposal. www.cpwf.org
FAO (Food and Agriculture Organization of the United Nations) 2008. FAOSTAT database. www.fao.org
GOI (Government of India). 2008. Agriculture statistics at a glance 2007. New, Delhi: Ministry of
Agriculture.
NCAER (National Council of Applied Economic Research). 2009. Economic impact of interlinking of rivers
program Accessible at ttp://nwda.gov.in/writereaddata/linkimages/99.pdf
NCIWRD (National Commission of Integrated Water Resources Assessment). 1999. Integrated water resources
development. A plan for action. Report of the Commission for Integrated Water Resource Development,
Volume I. New Delhi: Ministry of Water Resources.
NWDA (National Water Development Agency). 2008. The inter basin water transfers: The need. Accessible at
http://nwda.gov.in/
NWDA. 2008a. Feasibility report of Mahanadi Godavari link. Accessible at nwda.gov.in/index3.
asp?sublink2id=35&langid=1
NWDA. 2008b. Feasibility report of Inchampalli Nagarjunasagar link. Accessible at nwda.gov.in/index3.
asp?sublink2id=39&langid=1
NWDA. 2008c. Feasibility report of Inchampalli Pulichintala link. Accessible at nwda.gov.in/index3.
asp?sublink2id=36&langid=1
NWDA. 2008d. Feasibility report of Godavari Krishna link. Accessible at nwda.gov.in/index3.
asp?sublink2id=33&langid=1

51
Cost and Benefits of the National River Linking Project: An Analysis of Peninsular Links
NWDA. 2008e. Feasibility report of Nagarjunasagar Somasila link. Accessible at nwda.gov.in/index3.
asp?sublink2id=44&langid=1
NWDA. 2008f. Feasibility report of Pennar Palar Cauvery link. Accessible at nwda.gov.in/index3.
asp?sublink2id=45&langid=1
NWDA. 2008g. Feasibility report of Cauvery Vaigi Gundar link. Accessible at nwda.gov.in/index3.
asp?sublink2id=46&langid=1
NWDA. 2008h. Feasibility report of Pamba Achankovil Vaippar link. Accessible at nwda.gov.in/index3.
asp?sublink2id=47&langid=1
Smakhtin, Vladimir; Gamage, N.; Bharati, L. 2007. Hydrological and environmental issues of interbasin water
transfers in India: A case of the Krishna River Basin. IWMI Research Report 120. Colombo, Sri Lanka:
International Water Management Institute.