costa rica - home: observatory for renewable...
TRANSCRIPT

COSTA RICA
Observatory of Renewable Energy
in Latin America and �e Caribbean
AUGUST 2011
Final ReportProduct 1: Renewable Technological Base Line
Product 2: State of Art
Final ReportProduct 1: Renewable Technological Base Line
Product 2: State of Art
4.bp.blogspot.comC
This document was prepared by the following consultants:
CEGESTI
The opinions expressed in this document are those of the author and do not necessarily reflect the views of the sponsoring organizations: the Latin American Energy Organization (OLADE) and the United Nations Industrial Development Organization (UNIDO).
Accurate reproduction of information contained in this documentation is authorized, provi-ded the source is acknowledged.

1
Case of Costa Rica – Part I and II
CASE OF COSTA RICA Product 1: base Line of Energy Technologies
Product 2: State of Art

2
Case of Costa Rica – Part I and II
INDEX
1. Executive Summary: ......................................................................................................... 4 2. Energy Technologies Baseline: ......................................................................................... 5
2.1. Introduction ................................................................................................................ 5 2.2. Methodology ............................................................................................................... 5 2.3. Country’s General Energy Information ...................................................................... 6 2.4. Legal and Institutional Framework for Renewable Energy in the Country ............. 22 2.5. Information about the Most Relevant Renewable Energy Facilities by Technology Type ................................................................................................................................. 31 2.6. Lessons Learned: ...................................................................................................... 34
3. State of the Art (Case Studies) ........................................................................................ 35 3.1. Introduction .............................................................................................................. 35 3.2 Methodology .............................................................................................................. 37 3.3 Case 1: Electricity Generation from Biogas Obtained from Pig Excreta. Ujarras, Cartago. ........................................................................................................................... 40
3.3.1. General description of the Project ..................................................................... 40 3.3.2. Objectives of the project .................................................................................... 46 3.3.3. Stakeholder analysis .......................................................................................... 46 3.3.4. Legal aspects...................................................................................................... 49 3.3.5. Economic aspects. ............................................................................................. 51 3.3.6. Technological aspects ........................................................................................ 56 3.3.7. Environmental Aspects ...................................................................................... 61 3.3.8. Social aspects ..................................................................................................... 61 3.3.9. Repeatability ...................................................................................................... 62 3.3.10. Interview with the farm owner .................................................................... 62 3.3.11. Interview with the Director of the Subsectorial Energy Planification Department of Costa Rica (DSE) ................................................................................ 63 3.3.12. Project selection. .............................................................................................. 63
3.4 Case 2: Micro Hydropower In Chirripo National Park ............................................. 64 3.4.1 Overview of Project ............................................................................................ 64 3.4.2 Project Objectives ............................................................................................... 66 3.4.3. Stakeholder analysis ......................................................................................... 66 3.4.4 Legal aspects....................................................................................................... 66 3.4.5 Economical aspects............................................................................................. 68 3.4.6 Technological Aspects ........................................................................................ 70 3.4.7 Environmental Aspects ....................................................................................... 74 3.4.8. Social Aspects ................................................................................................... 74 3.4.9. Repeatability ...................................................................................................... 74 3.4.10. Interview with the developers of the Project ................................................... 75 3.4.11. Interview with the Director of the Subsectorial Energy Planification Department of Costa Rica (DSE) ................................................................................ 76 3.4.12. Project selection ............................................................................................... 76 3.4.13. Photography ..................................................................................................... 77

3
Case of Costa Rica – Part I and II
3.5 Case 3: Self-Sufficient House INBIOparque – Compañía Nacional De Fuerza Y Luz ......................................................................................................................................... 80
3.5.1. Project Description ............................................................................................ 80 3.5.2. Project Objectives .............................................................................................. 89 3.5.3. Stakeholder analysis .......................................................................................... 89 3.5.4. Legal aspects...................................................................................................... 90 3.5.5. Economical aspects ........................................................................................... 92 3.5.6. Technological aspects ........................................................................................ 92 3.5.7. Environmental aspects ....................................................................................... 93 3.5.8. Social aspects ..................................................................................................... 94 3.5.9. Repeatability ...................................................................................................... 94 3.5.10. Interview with the entrepreneurs of the project. .............................................. 95 3.5.11. Interview with the Director of the Subsectorial Energy Planification Department of Costa Rica (DSE) ................................................................................ 95 3.5.12. Project selection ............................................................................................... 96
3.6 Lessons Learned ........................................................................................................ 96 3.6.1 Power generation with biogas in SERMIDE farm ............................................. 96 3.6.2 Hydropower generation in Chirripó National Park ............................................ 96 3.6.3 Self-Sufficient House in INBioparque ............................................................... 97
Sources of Information: ....................................................................................................... 98 Annex 1: ............................................................................................................................ 102 Annex 2: ............................................................................................................................ 103
Acronyms and Abbreviations List
AAM: Autoridad Administradora del Mercado ARESEP: Autoridad Reguladora de Servicios Públicos CEGESTI: Fundación Centro de Gestión Tecnológica e Informática Industrial CEPAL: Comisión Económica para América Latina y el Caribe CNFL: Compañía Nacional de Fuerza y Luz DSE: Dirección Sectorial de Energía GEI: Gases de Efecto Invernadero ICE: Instituto Costarricense de Electricidad IMN: Instituto Meteorológico Nacional MDL: Mecanismos de Desarrollo Limpio MINAET: Ministerio de Ambiente, Energía y Telecomunicaciones OLADE: Organización Latinoamericana de Energía ONUDI: Organización de las Naciones Unidas para el Desarrollo Industrial PIB: Producto Interno Bruto SEN: Sistema Eléctrico Nacional SETENA: Secretaria Técnica Nacional

4
Case of Costa Rica – Part I and II
1. EXECUTIVE SUMMARY: Costa Rica has high electricity coverage (99%) and a significant share of renewable sources of energy for its electricity production. Hydroelectric generation accounts for more than 78% of the country, while geothermal represents 12%, wind 2.1%, and biomass 0.25%. This makes the generation of electricity in Costa Rica very clean, where almost 93% of electricity comes from renewable sources, and only 7.19% from thermal sources. Among other features of the country, we can mention the low level of private production of electricity (given the institutional and legal complexity of the sector) and low performance of the transport sector in terms of the extensive use of fossil fuels and the lack of a better public transport service. The following reports relate to the baseline and the state of the art of renewable energy in Costa Rica. The first one includes the country's overall energy information, as well as an explanation of the legal and institutional framework for renewable energy in the country, and information on relevant installations of renewable energy by type of technology. The second report consists of case studies, each one with its proper description of the project, objectives, stakeholder analysis, legal, economic, technological, environmental, and social aspects, and replicability. The cases described are: 1. Electricity generation from biogas obtained from pig feces (Ujarrás, Cartago), 2. Micro-hydropower plant (Chirripó), and 3. self-sufficient house (INBioparque).

5
Case of Costa Rica – Part I and II
2. ENERGY TECHNOLOGIES BASELINE:
2.1. INTRODUCTION Costa Rica is a Central American nation with a territory of 51,100 km2 and an estimated population of 4,516,220 inhabitants by the year 2010. The country is known for its high percentage of electricity supply and its high proportion of electricity that is produced from renewable sources. However, its potential of renewable resources is even greater, and thus the country should maintain or even increase the use of such energy. Moreover, despite its good performance in terms of electricity, Costa Rica has enormous challenges in terms of overall energy situation, with problems related to the transportation sector. This sector depends almost exclusively on fossil fuels purchased in other countries, which makes the nation highly vulnerable to market fluctuations, and represents a large amount of greenhouse gas (GHG) emissions.
2.2. METHODOLOGY For the preparation of this document, a first approach with the Dirección Sectorial de Energía (DSE) was carried, where the nature of the report was presented and the latest national energy information was requested. In addition to information provided by the DSE, the report compiled data from multiple reliable secondary sources, among which stand ECLAC, ICE, ARESEP, IMN, MINAET, Programa Estado de la Nación, and articles published in various newspapers. The bibliography section, located at the end of the document, presents the full list. To obtain information concerning Annex 2, two companies engaged in electricity generation in the country were contacted, which are ICE and Compañía de Fuerza y Luz. Both institutions have been implementing renewable energy projects in recent years. Others sources included the Internet and a biomass cogeneration project in Ingenio el Viejo. In order to collect the information needed for these annexes, people responsible for such projects at both institutions were contacted. Some interviews with project managers were carried out as well. This process helped us identify major challenges, strengths, weaknesses, and lessons learned for future projects.

6
Case of Costa Rica – Part I and II
2.3. COUNTRY’S GENERAL ENERGY INFORMATION The following section of the report covers general energy information of Costa Rica, legal framework and institutions relevant to the energy sector, and information on the types and key installations of representative renewable energy by type of technology. Costa Rica is a nation with a territory of 51,100 km2, and an estimated population of 4,516,220 inhabitants in 2010, where approximately 63% live in urban areas and 37% in rural areas. Figure 1 shows the estimated population growth in the country until 2015.
Figure 1. Estimated population growth in Costa Rica. Source: Estado de la Nación, 2010. This estimation should be complemented with the analysis of real GDP growth (Figure 2), and GDP per capita (Figure 2 and 3).

7
Case of Costa Rica – Part I and II
Figure 2. Evolution of real GDP in Costa Rica. Source: Estado de la Nación, 2010.
Figure 3. Evolution of GDP per capita in Costa Rica. Source: Estado de la Nación, 2010.
Although the global crisis of recent years has slowed down economic growth of the country, it generally shows an upward trend. However, the 15th Report of the State of the Nation in Sustainable Human Development (Estado de la Nación, 2009) notes that in 2008 Costa Rica began a general contractionary trend. GDP, after rising an averaged 6.6% during the previous five years, grew by only 2.6% in 2008, although in early months of 2009 it fell even more. On the other hand, the contraction had a heterogeneous behavior across different economic sectors. Some have been hit harder, as the industry and agricultural
0
500
1,000
1,500
2,000
2,500
1991 1992 1993 1994 1995 1996 1997 1998 1999 2000 2001 2002 2003 2004 2005 2006 2007 2008
Bil
lio
ns
of
19
91
co
lon
es
0
1,000
2,000
3,000
4,000
5,000
6,000
7,000
1991 1992 1993 1994 1995 1996 1997 1998 1999 2000 2001 2002 2003 2004 2005 2006 2007 2008
Do
lla
rs (
US
$)

8
Case of Costa Rica – Part I and II
activities. Moderately affected sectors in 2008 were construction and trade. Better luck ran between the financial and transportation sectors. The sectors that contribute the most to the country's real GDP are manufacturing (23.12%); commerce, restaurants and hotels (17.19%); and transport, storage and communications (15.49%). Figure 4 presents the rest of the composition of real GDP of Costa Rica.
Figure 4. Composition of real GDP in Costa Rica, by sector for 2008. Source: Estado de la Nación, 2010.
Mining and quarrying
0.10%
Manufacturing
23.12%
Construction
5.07%
Electricity and water
2.82%Trade, restaurants and hotels
17.19%
Transport, storage and
communication
15.49%
Finance and insurance
services
5.50%
Real estate
4.60%
Other business services
4.72%
Public administration
services
1.98%
Community, social and
personal services
9.49%
Agriculture, forestry and
fishing
9.91%

9
Case of Costa Rica – Part I and II
It is interesting to compare the graph above with Figures 5 and 6, which displays the compositions of energy and electricity consumption.
Figure 5. Final energy consumption in Costa Rica in 2009, by sector. Source: MINAET – DSE, 2010.
10
Case of Costa Rica – Part I and II
Residential
39.91%
Services
12.47%
Commercial
9.91%
Public
12.12%
Industry
21.35%
Unidentified
consumption (other)
0.57%
Agricultural
3.67%
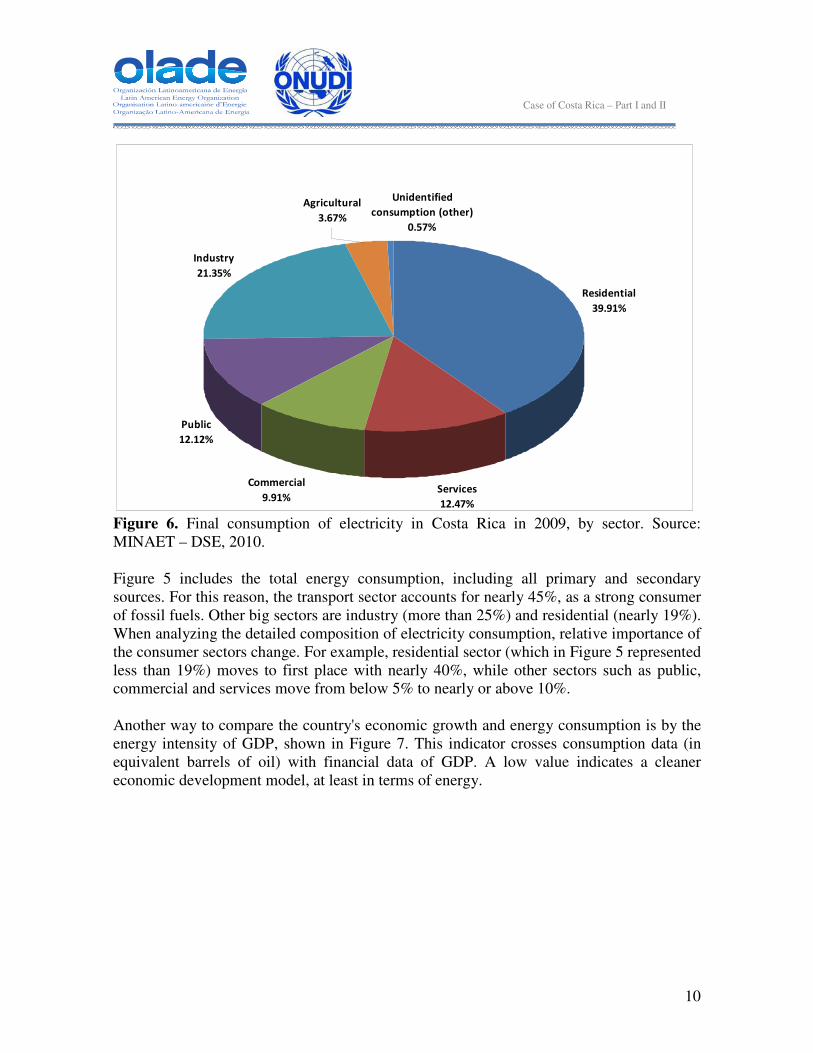
Figure 6. Final consumption of electricity in Costa Rica in 2009, by sector. Source: MINAET – DSE, 2010. Figure 5 includes the total energy consumption, including all primary and secondary sources. For this reason, the transport sector accounts for nearly 45%, as a strong consumer of fossil fuels. Other big sectors are industry (more than 25%) and residential (nearly 19%). When analyzing the detailed composition of electricity consumption, relative importance of the consumer sectors change. For example, residential sector (which in Figure 5 represented less than 19%) moves to first place with nearly 40%, while other sectors such as public, commercial and services move from below 5% to nearly or above 10%. Another way to compare the country's economic growth and energy consumption is by the energy intensity of GDP, shown in Figure 7. This indicator crosses consumption data (in equivalent barrels of oil) with financial data of GDP. A low value indicates a cleaner economic development model, at least in terms of energy.

11
Case of Costa Rica – Part I and II
Figure 7. Energy intensity of GDP in Costa Rica. Source: CEPAL, 2010. Analyzing the data series, there can be seen a historical downward trend, which is shown most clearly from 1970 to 1992. This trend reflects several improvements in energy efficiency, changes in economic structure and in consumption habits. However, since 1992, the indicator remains at a constant rate and appears to slightly increase in the last 5 years, which certainly poses new challenges for the country's energy policies. On the other hand, national greenhouse gases (GHG) inventories (conducted by the National Meteorological Institute, IMN) argue that the country issued 7,940 Gg CO2e during the year 2000. For 2005 reported emissions went up to 8,779 Gg CO2e. Figure 8 shows total GHG emissions in the country for the years 2000 and 2005, distributed among major sectors. Notably, land use changes activities sequestrate carbon, so its sum is actually negative in terms of GHG inventory.
0.00
0.20
0.40
0.60
0.80
1.00
1.20
1.40
1.60
1.801970
1971
1972
1973
1974
1975
1976
1977
1978
1979
1980
1981
1982
1983
1984
1985
1986
1987
1988
1989
1990
1991
1992
1993
1994
1995
1996
1997
1998
1999
2000
2001
2002
2003
2004
2005
2006
2007
Th
ou
san
ds o
f b
arr
els
of
oil e
qu
ivale
nt
per
millio
n d
ollars
of
GD
P (
at
co
nsta
nt
pri
ces o
f 2000)

12
Case of Costa Rica – Part I and II
-4
-2
0
2
4
6
8
10
Energy
Indust
rial P
roce
sses
Agricultu
re
Land U
se C
hanges
Was
te M
anage
ment
Total E
miss
ions
Tg
CO
2e
Year 2000 Year 2005
Figure 8. Total GHG emissions in Costa Rica, for the years 2000 and 2005. Source: IMN, 2009. For a better understanding of the energy situation in Costa Rica, the country's energy matrix (Figure 9) should be reviewed. The matrix shows the sources of energy which supplies the country, as well as the uses and final consumptions made by each sector. This figure will be analyzed throughout the document, complemented with additional graphics.

13
Case of Costa Rica – Part I and II
Figure 9. Costa Rica’s energy matrix, 2008. Source: El Financiero, 2010.

14
Case of Costa Rica – Part I and II
Moreover, the current situation of electricity in Costa Rica is summarized in Figure 10.
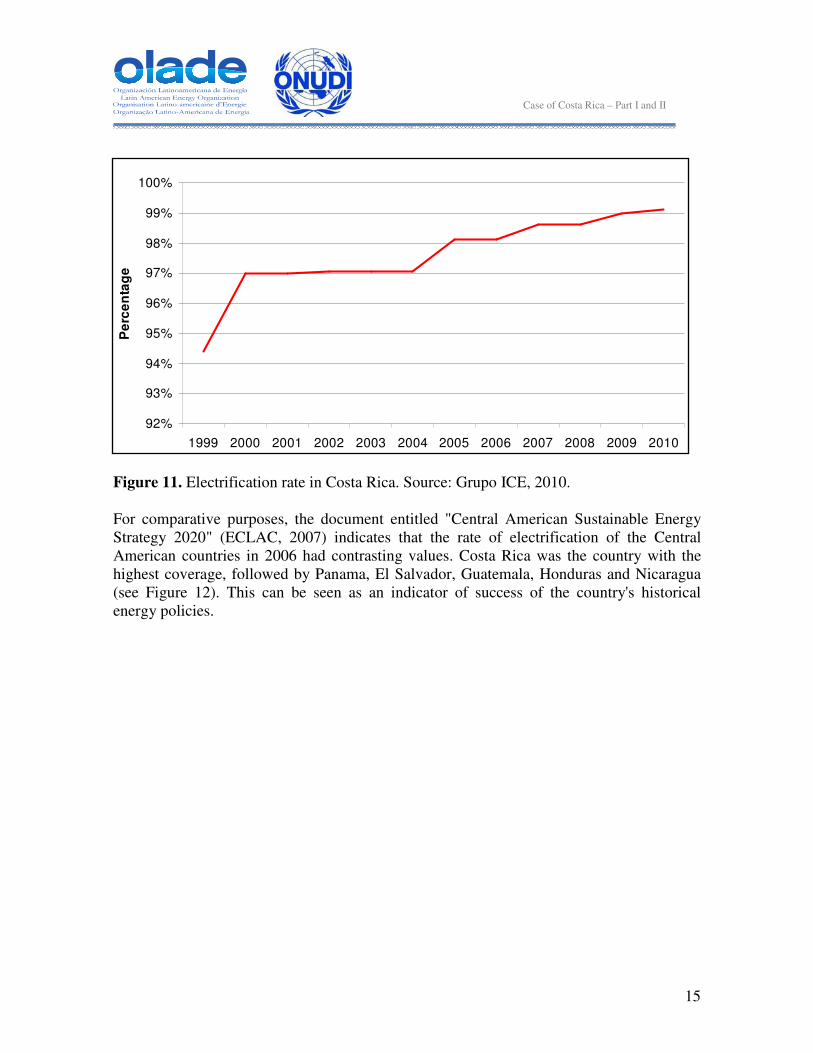
Figure 10. Current situation of the electricity sector in Costa Rica, for June 30th, 2009. Source: Grupo ICE, 2009. Several details stand out from this figure. First, the electrification rate is about 99% for 2009. In fact, the most recent data (ICE Group, 2010) show that by 2010 this rate was 99.11%, which makes Costa Rica a country internationally recognized for its high level of electricity coverage. The evolution that has had this coverage in recent years is shown in Figure 11.
15
Case of Costa Rica – Part I and II
Figure 11. Electrification rate in Costa Rica. Source: Grupo ICE, 2010. For comparative purposes, the document entitled "Central American Sustainable Energy Strategy 2020" (ECLAC, 2007) indicates that the rate of electrification of the Central American countries in 2006 had contrasting values. Costa Rica was the country with the highest coverage, followed by Panama, El Salvador, Guatemala, Honduras and Nicaragua (see Figure 12). This can be seen as an indicator of success of the country's historical energy policies.
92%
93%
94%
95%
96%
97%
98%
99%
100%
1999 2000 2001 2002 2003 2004 2005 2006 2007 2008 2009 2010
Pe
rce
nta
ge
16
Case of Costa Rica – Part I and II
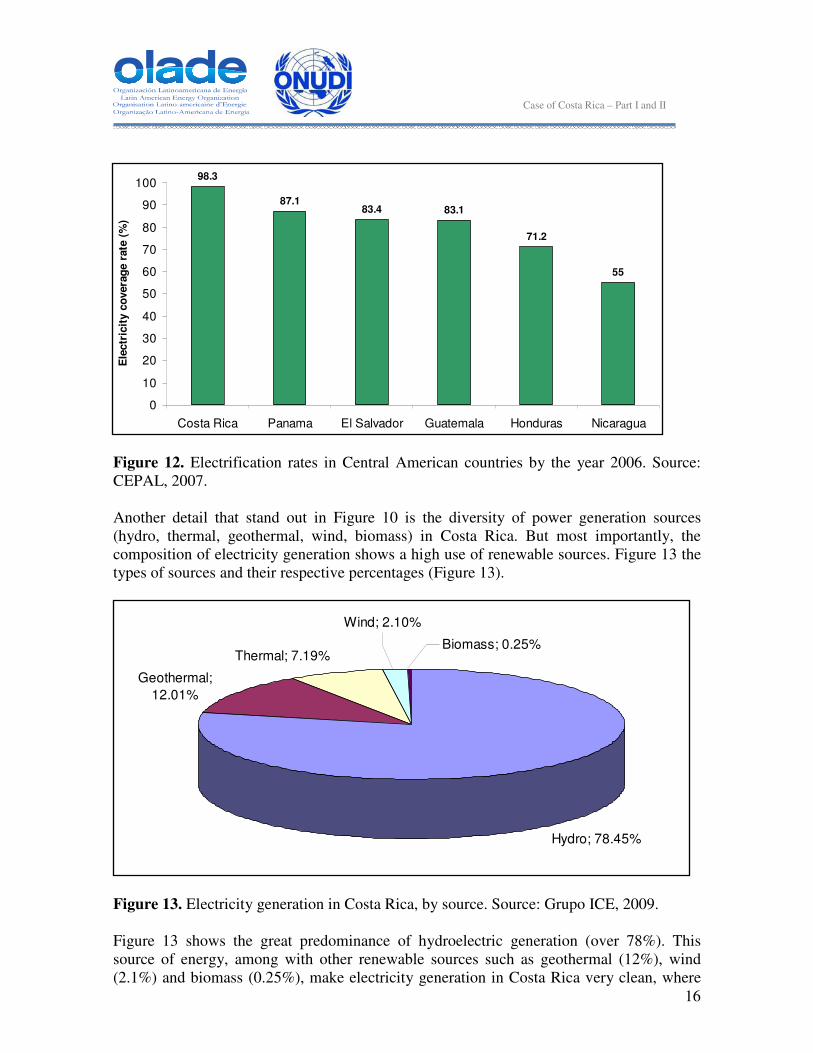
Figure 12. Electrification rates in Central American countries by the year 2006. Source: CEPAL, 2007. Another detail that stand out in Figure 10 is the diversity of power generation sources (hydro, thermal, geothermal, wind, biomass) in Costa Rica. But most importantly, the composition of electricity generation shows a high use of renewable sources. Figure 13 the types of sources and their respective percentages (Figure 13).
Figure 13. Electricity generation in Costa Rica, by source. Source: Grupo ICE, 2009. Figure 13 shows the great predominance of hydroelectric generation (over 78%). This source of energy, among with other renewable sources such as geothermal (12%), wind (2.1%) and biomass (0.25%), make electricity generation in Costa Rica very clean, where
98.3
87.183.4 83.1
71.2
55
0
10
20
30
40
50
60
70
80
90
100
Costa Rica Panama El Salvador Guatemala Honduras Nicaragua
Ele
ctr
icit
y c
overa
ge r
ate
(%
)
Hydro; 78.45%
Thermal; 7.19%
Geothermal;
12.01%
Wind; 2.10%
Biomass; 0.25%
17
Case of Costa Rica – Part I and II
about 93% of the electricity is produced from renewable sources, and only 7.19% from thermal sources. The percentage of electricity from thermal sources look even lower if we compare the national situation with other countries in the region (see Figure 14).
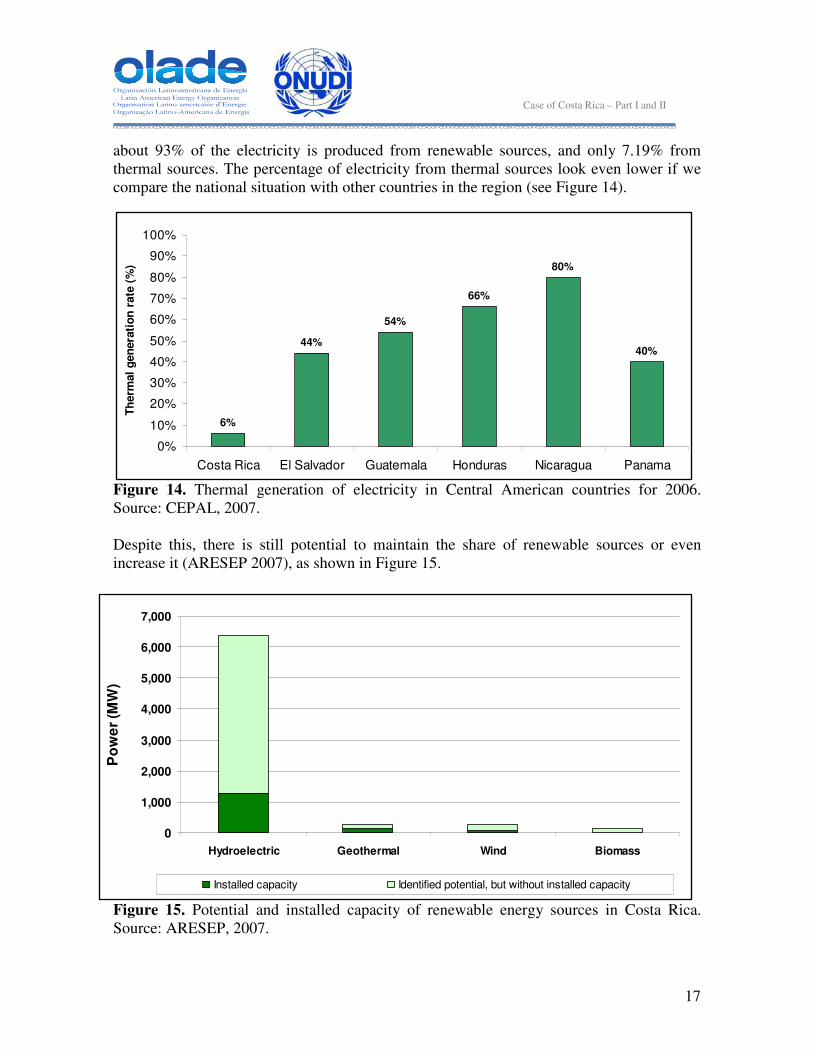
Figure 14. Thermal generation of electricity in Central American countries for 2006. Source: CEPAL, 2007. Despite this, there is still potential to maintain the share of renewable sources or even increase it (ARESEP 2007), as shown in Figure 15.
Figure 15. Potential and installed capacity of renewable energy sources in Costa Rica. Source: ARESEP, 2007.
6%
44%
54%
66%
80%
40%
0%
10%
20%
30%
40%
50%
60%
70%
80%
90%
100%
Costa Rica El Salvador Guatemala Honduras Nicaragua Panama
Th
erm
al
gen
era
tio
n r
ate
(%
)
0
1,000
2,000
3,000
4,000
5,000
6,000
7,000
Hydroelectric Geothermal Wind Biomass
Po
we
r (M
W)
Installed capacity Identified potential, but without installed capacity

18
Case of Costa Rica – Part I and II
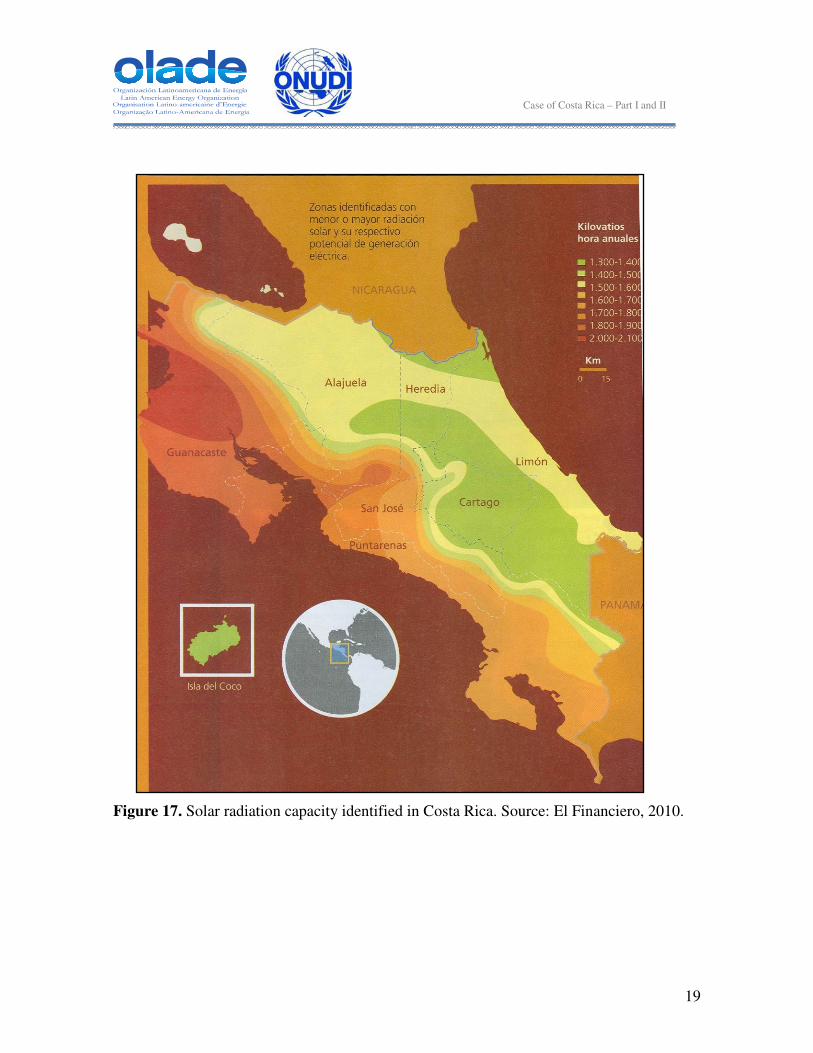
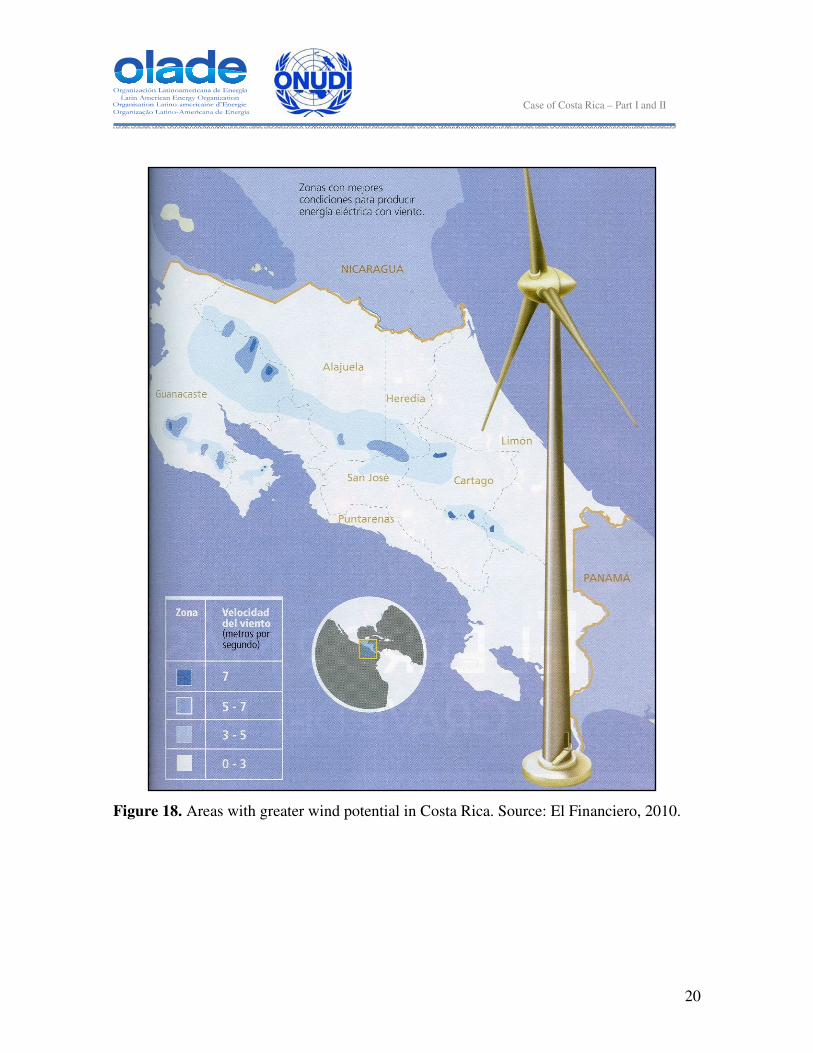
Regarding the geothermal potential, ICE plans to build additional projects that would add to the installed capacity 140MV. Two of the main constraints to build these projects are their high cost and the locations. Most potential sites are near volcanoes, which are national parks, areas where it is impossible to make such developments according to current legislation. In any case, this technology is always used as a basis for national power supply, because it provides a constant generation. The peak demand is usually met through thermal plants. Figures 16, 17 and 18 present maps showing the hydroelectric, solar and wind potentials of the country. Figure 16. Major hydroelectric plants and projects under consideration. Source: El Financiero, 2010.
19
Case of Costa Rica – Part I and II
Figure 17. Solar radiation capacity identified in Costa Rica. Source: El Financiero, 2010.
20
Case of Costa Rica – Part I and II
Figure 18. Areas with greater wind potential in Costa Rica. Source: El Financiero, 2010.

21
Case of Costa Rica – Part I and II
Under the Rural Electrification with Renewable Sources National Program, ICE has tried to reduce GHG emissions, promoting the use of decentralized renewable energy systems in areas that are isolated from the National Interconnected System. The removal of barriers that limit the installation of autonomous systems based on renewable energy sources would electrify virtually 100% of the population, while achieving a reduction of more than 210,000 tons of CO2 (UNDP, 2005). The project justified that extending the conventional distribution network to some of those rural areas without access to electrification was not cost effective due to low consumption levels and the dispersal of houses. It was concluded that less expensive alternatives exist, taking advantage of local renewable energy sources such as small hydroelectric power generation and photovoltaic power, primarily to meet electricity demand and to ensure electricity supply in public facilities and private nature reserves located in areas where it is legally prohibited to make business. The Expansion Plan of Electricity Generation 2010-2021 (2009) states that between 1998 and 2009 the program gave electricity to more than 1,000 homes, 346 community centers and 82 wilderness areas with a total of 1,500 panels, reaching a peak capacity of 140 KW. Moreover, ICE recently has promoted a "Pilot Plan for Subsistence Distributed Generation", which consists of a pilot program aimed at encouraging the installation of small distributed generation systems based on renewable sources. This plan has the dual purpose of studying new technologies and the effect of distributed generation on networks. Furthermore, it is limited exclusively to generation for self-consumption. The cost of the generating systems is assumed entirely by the electric customer who participated in the pilot program. The customer will also own the generation system infrastructure and the carbon credits that it can generate (ICE, 2010). A third aspect to note in Figure 9 is the low participation of the private sector in the generation of electricity. By June 2009, this represented only 8.9% of the total generation in the country. To explain this situation, we must understand that in Costa Rica the electricity market is governed by ICE, who is the only institution authorized by law to generate. Therefore, all private production must be sold to ICE, according to prices established by ARESEP (BUNCA, 2001).

22
Case of Costa Rica – Part I and II
2.4. LEGAL AND INSTITUTIONAL FRAMEWORK FOR RENEWABLE ENERGY IN
THE COUNTRY The country has a complex institutional framework that includes the following public companies:
� Instituto Costarricense de Electricidad (ICE): Created by Special Act No. 449 of April 8, 1949 as an autonomous institution responsible for the development of electrical energy in the country. This law has been amended by Acts No. 2749 of May 24, 1961, No. 3003 of July 11, 1962, No. 3154 of July 31, 1963 and No. 5507 of April 19, 1974. The state owns 98.6% of the shares of ICE and the rest remains in the hands of private individuals. One function of ICE is to rationally manage energy producing sources of Costa Rica, especially water resources, and encourage the good use of electricity for industrial development and population. In 1963, ICE took the responsibility to establish and operate telecommunications services in Costa Rica.
� Compañía Nacional de Fuerza y Luz (CNFL): Founded on April 8, 1941 as a
corporation in which ICE has a majority of shares. Its mission is to contribute to economic and social development through the provision of a competitive electricity market. CNFL has been established as a distributor and marketer of dominant power in the Costa Rican market, covering an area of 900 km2 of the Greater Metropolitan Area, including the capital, San José.
� Empresa de Servicios Públicos de Heredia (ESPH): Created by Law No. 767 of
October 25, 1949 under the name of Heredia Administrative Board of Electric Municipal Service. Law No. 5889 of April 1, 1976 established the now called ESPH. ESPH also supplies the population with potable water, street lighting and sewerage.
� Junta Administrativa del Servicio Eléctrico de Cartago (JASEC): Created by Law
No. 3300 of July 23, 1964, JASEC is a utility that supplies electricity to five districts of the province of Cartago.
In addition to public companies, the country has:
� Asociación Costarricense de Productores de Energía (ACOPE): Founded in 1989, ACOPE represents more than 40 private hydro, wind and biomass units generating in the country. It is important to note that the vast majority of private companies and cooperatives are limited to generating power for sale to ICE or CNFL.
The national energy sector is complemented by the following agencies of relevance:
� COOPESANTOS, R.L.: Founded in January 1965 with the aim of supplying electricity in the region of Los Santos and Caraigres, which includes the districts of

23
Case of Costa Rica – Part I and II
Dota, Tarrazú, León Cortés, Acosta and partially the south and west of the cantons of El Guarco, Cartago, Desamparados, Aserrí and Mora. This cooperative covers a territory of 1,500 km2, with about 1,200 km of distribution lines, serving 125 communities and more than 100,000 people.
� COOPEGUANACASTE, R. L.: Founded in January 1965, covers an area of 1500-
2000 km2, with about 2,000 km of distribution lines, serving the cantons of Guardia, Santa Cruz, Liberia, Hojancha, Carmona, Puntarenas, where 33,200 people benefit directly. In recent years, this cooperative has installed over 150 photovoltaic panels, thus benefiting about 153 low-income families.
� COOPE ALFARO RUIZ, R. L.: Founded in November 1972, covers an area of
about 250 km of distribution lines, serving the cantons of Alfaro Ruiz, Naranjo, Valverde Vega and San Ramon, where around 5,000 people benefit directly.
� COOPELESCA, R.L.: Founded in January 1965, covers an area of 4956 km2, with
2200 km of distribution lines, serving the cantons of Sarapiqui, San Carlos, San Ramon, Alajuela, Chiles, and some districts of Grecia, where it benefits approximately 32,500 associates directly.
� Consorcio Nacional de Empresas de Electrificación de Costa Rica
(CONELECTRICAS), R.L.: Formed in 1989 by the four rural electric cooperatives in Costa Rica, mentioned above. One of the main objectives of this union is to develop hydroelectric projects. The four cooperatives together provide the electric service to a population of around 500.000 people in an area of 11.500 km2, with approximately 22% of the country.
At the legal and regulatory framework, it is worth to mention the following:
� Constitution and Water Law: They are the legislative basis for all matters relating to private generation of electricity and water resource concessions.
� Constitutional Court: Issues related resolutions to unconstitutional criteria.
� Attorney General's Office: has issued several opinions about the exploitation for
electricity generation using water sources.
� Autoridad Reguladora de Servicios Públicos (ARESEP): Fixes prices and rates, also enforces standards of quality, quantity, reliability, continuity, timing and optimal provision of public services, including electricity supply in stages of generation, transmission, distribution and marketing. ARESEP regulates both public institutions such as rural electrification cooperatives and other private generators.
� Energy Sector Direction: Develops, implements and consolidates the development,
implementation and control of a permanent system of energy planning, obtains the necessary elements for making decisions regarding specific energy options,
24
Case of Costa Rica – Part I and II
develops a comprehensive model of planning for the energy area, and researches alternative sources for non renewable energies.
� Secretaría Técnica Nacional (SETENA): Analyzes the environmental impact
assessment, recommends actions to minimize the impact on the environment, as well as technically suitable to retrieve it, and sets environmental obligations.
� Distribution Companies: These are authorized by public concessions for the
distribution and marketing of electricity, being ICE the only institution authorized to generate electricity.
Moreover, private generation projects developers must meet a series of pre-feasibility and feasibility permits, resource use and building permits, and to establish contracts for the purchase and sale of electricity (ICE being the only possible buyer.) This institutional complexity creates significant barriers for the inclusion of stronger private sector. Another problem that exists is related to the establishment of rates, because at present the country lacks a precise methodology to set them, considering the various sources of energy. The costs, standards and tariffs were established in 2002, and stipulated specifically for hydroelectric plants. Therefore, any technology must adjust to this reality. Both private developers and the different government authorities seem to be aware of this situation, however, they has not yet reached a consensus on the best way to solve it (see Box 4). The law authorizing private generation of electricity is 7,200. Along with its reforms, sets up two models of power to ICE sales:
� Chapter 1: are the contracts with prices fixed by the ARESEP. Projects can be up to 20MW of capacity each. One detail is that some contracts under this system expire, which has generated new challenges for the authorities. This is because the rate established in the first contract included the payment of the initial investment. A new rate should exclude this amount, and focus on operating costs, administrative costs and profit of the project developer.
� Chapter 2: public tenders which the rate is not fixed by the ARESEP, but is
established in the contract itself. Under this scheme, projects are allowed up to 50MW each.
On the other hand, the Jorge Manuel Dengo Obregón National Development Plan aims to reduce dependence on imported fuels, make better use of renewable energy sources in the country and eventually produce 100% of the country's electricity from renewable energy sources. The plan also proposes to improve and restore the levels of reliability, quality and security of energy supply and reduce oil use in electricity production, laying the groundwork for Costa Rica to become the first country in the world producing 100% of the electricity consumed from renewable sources of energy by 2021.
25
Case of Costa Rica – Part I and II
Similarly, it proposes the creation of sectorial and industrial synergies to reduce dependence on fossil fuels and develop a sustainable biomass for energy. The present energy policy in the National Energy Plan from 2007 to 2021 calls for "promoting the development and use of new alternative energy sources through the implementation of projects using sources such as biomass." It also proposes the increased participation of renewable sources and the use of biomass for energy production more efficiently. The 2021 Vision is a comprehensive planning effort aimed at determining the set of actions and projects that the ICE’s Electricity Sector must undertake at strategic and organizational level to ensure the satisfaction of the national electricity demand through the "predominant use of renewable energy sources”. The National Climate Change Plan proposes, through concrete actions to reverse or prevent the increasing trends of GHG in the atmosphere, to develop strong technical and scientific bases that allow management tools reconfiguration (policies, plans, programs, projects) in order to prevent, mitigate or adapt to extreme climate changes. This plan also aims to create a culture with greater knowledge and public environmental awareness through an understanding of current environmental problems and their relationship to health, economy and development of the human species. It also seeks to improve understanding of actions that can help prevent disasters and better understand the ecological and social systems. In terms of energy and power sector policies governing are:
• The Guideline No. 22 of April 23, 2003, the Executive asks the members of Electric Power Sub Sector to encourage the use of new technologies using new and renewable sources for electricity generation, which are technical, environmental and economically viable
• The Business Plan of the National Electrical Planning proposes power generation
options that are technically, economically, environmentally and socially viable. ICE environmental guidelines aim:
• To promote research, development and use of other sources of renewable generation, witch are technologically and economically feasible, such as solar, wind, biomass, hydrogen.
• To manage demand for electricity, in a program that includes as a priority the
creation of a culture of efficient energy use in the population.
26
Case of Costa Rica – Part I and II
The Sub-commission on Non-conventional Renewable Sources in its final report established the following recommendations:
• Introduce in Costa Rican society the use of non-conventional renewable energies. Develop pilot projects that would not only demonstrate the use of these renewable energy sources but that the facilities provide data to specify in greater detail the contributions of these energies: advantages and disadvantages, more discretion to decide on future projects.
• Among the most important pilot projects are: installation of photovoltaic cells connected to the network and installing a gas engine that produces electricity from biogas, using the manure from a dairy or piggery.
• It should be encouraged through technical assistance to public and private entities interested in developing non-traditional renewable technologies. Private investment in this area would alleviate part of required public investment.
• The disclosure about the benefits and challenges of power generation using non-
conventional sources should be done systematically and clearly. The population must have reliable data to not incur in misunderstandings about the real possibilities of using these energies.
• For energies such as solar, thermal and biomass, their biggest contribution is
expressed as a reduction in electricity demand of the system. Solar energy for water heating and biomass for cooking are more efficient uses than the transformation of the energy into electricity. Therefore, the promotion of such uses is reducing the total power consumption, with is very convenient for country.
The project is being prepared in accordance with the policies and general guidelines of the National Development Plan, the National Energy Plan, Power Sector Vision 2021 and the National Strategy on Climate Change (ENCC). With regard to future energy demand in the country, the various scenarios presented by ICE confirmed that it will continue to grow in coming years (see Figure 19).

27
Case of Costa Rica – Part I and II
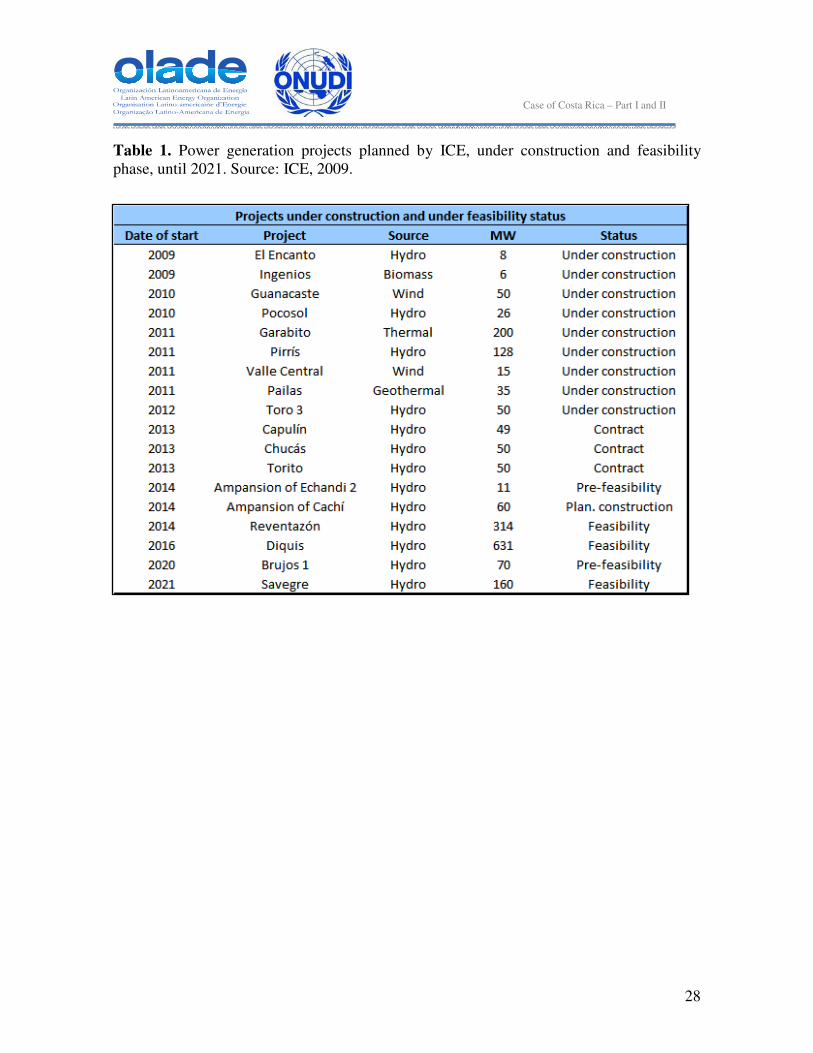
Figure 19. Projections of energy demand in Costa Rica in the coming years. Source: Grupo ICE, 2009. Between 2008 and 2010 there was a downward trend (or at least less pronounced growth in the higher scenario). This is due to the effect of global economic crisis that occurred in that period of time. However, ICE (2009) states that this effect is temporary, and then is expected to grow sharper. For this reason, the country's estimated investment is $5,580 million, between 2009 and 2021. This is only considering public investment in facilities. However, given the low private sector participation in the electricity market, it is anticipated that public investments far outweigh private ones. Table 1 and Figure 20 detail the estimated public investment by ICE until 2021.
28
Case of Costa Rica – Part I and II
Table 1. Power generation projects planned by ICE, under construction and feasibility phase, until 2021. Source: ICE, 2009.

29
Case of Costa Rica – Part I and II
Figure 20. Investment in electricity, provided by ICE in the period 2009 to 2021. Source: ICE, 2009. While there are challenges that remain to improve the national electricity situation, the scenario described above suggests that the country enjoys generally favorable conditions: high participation of renewable sources, major construction projects to meet growth in energy demand, high percentage of electricity coverage, among others. Although this report has focused on describing the situation of national power, one can not ignore the energy landscape as a whole. And, as noted in Figure 5 above, the transport sector is the largest consumer of energy in the country (nearly 45% of total). And in this sector, the outlook is hardly encouraging. The transportation in private cars, freight movement and public transport are responsible for making the transport sector the one that put more pressure on the country's energy capacity, as the almost exclusive source of that power are fossil fuels that are purchased abroad and whose prices sometimes can be very high due to fluctuations in the market. In addition to this economic problem, the burning of fossil fuels accounts for most of the carbon dioxide emissions and other GHG. Improving the economic status of many families, coupled with factors such as lack of planning, an old and inefficient public transportation system, and poor road infrastructure, has meant that Costa Ricans prefer to mobilize in private cars, with all the negative consequences that this entails. On the other hand, the lack of a rail for the transportation of cargo, coupled with the large volumes of exports and less imports from the country, makes inevitable the intensive use of trucks and highways. Thus, the challenge is twofold in this sector. On one hand, the economy is completely vulnerable and dependent on macroeconomic conditions difficult to control and predict. Furthermore, the green image of the country and meeting international challenges as declaring by 2021 carbon neutral the country, are seriously threatened. Unfortunately, the
30
Case of Costa Rica – Part I and II
transport sector has been left out of the successful energy planning that characterizes the national electricity production. As for the Clean Development Mechanisms (CDM), although these are considered by many as one of the key instruments to provide incentives in the country and formulate strategies in both the public and private sector to contribute to lower emissions carbon, the country has recorded only six of such projects. These projects are described below:
1. CEMEX Costa Rica: Use of biomass in Colorado cement plant. The project activity consists in the partial substitution of fossil fuels with biomass in cement manufacturing. The greater part of energy consumption or CO2 emissions in the production of cement is the burning of the clinker. In this pyro-process a substantial amount of heat is required to achieve the necessary chemical reactions in the oil. In Costa Rica the main fuels used in clinker kilns are fossil fuels like coal and petroleum coke. The project aims to maximize the alternative fuels in this industry.
2. Compañía Nacional de Fuerza y Luz: small-scale hydroelectric plant
The project is located in the provinces of Guanacaste and Alajuela, in the Arenal Conservation Area. The project's goal is to generate renewable energy to supply the National Grid. The project's installed capacity and annual average generation are 6.786MW and 13.2GWh respectively. The project is expected to displace 47,017 tons of CO2e in the first 7 years, generating an equivalent amount of Certified Emission Reductions. The project builds on existing infrastructure to divert water from the Cote River to the Rugada stream which flows into the ICE’s Arenal reserve.
3. “La Joya” Hydroelectric Project
La Joya Hydroelectric Project is a 50 MW project that uses the turbine flow that goes out from the House of the Machines of the Cachí Hydroelectric Project that are right now being poured to the Reventazón River. The project is located in the central part of Costa Rica. The project uses the existing hydroelectric infrastructures at its highest capacity without the need of constructing a new dam, because it turbinate the waters of the Reventazón River.
4. Rio Azul landfill gas and utilization project in Costa Rica The Grupo Corporativo SARET (Corporate Group SARET), a private Costa Rican company, proposed the Río Azul Biothermal Energy project, a landfill gas power capacity of 3.7 MW as a Clean Development Mechanism (CDM) project activity.

31
Case of Costa Rica – Part I and II
The project will involve investing in a landfill gas recovery system, a flaring equipment and an electricity generation plant at the site. The energy conversion engines will combust the collected methane at the site to generate electricity to the national interconnected grid. Excess, or all the landfill gas collected when electricity is not produced, will be flared.
5. INOLASA: Fuel switching from coal to biomass residues from palm oil The project involves the installation of a boiler using biomass as fuel to provide steam for production processes, putting aside the coal-fired boiler. The coal will be replaced by palm kernel shells, fruit bunches and other types of biomass available in the area, saving coal consumption and consequently reducing GHG emissions. The project is developed in INOLASA, a company established in 1986 in Costa Rica in order to provide soy products to the country and the region. The company is located in the province of Puntarenas, in the district of Barranca.
6. Tejona Wind Power Project (TWPP) TWPP is a 19.8 MW wind power project which is fully operational since the beginning of 2003. This project has increased the amount of wind power in Costa Rica to 66.4 MW, or 6% of wind penetration to the national electric grid in the year 2001. The Tejona wind farm, made up of thirty VESTAS V47-660 kW wind turbines, which generated 81.6 GWh in 2003, 81.3 GWh in 2004 and is expected to generate about 61.4 GWh in 2005. An average annual production of 70GWh is used as a conservative estimate of the annual power production of the Tejona wind farm. The annual avoided emissions are estimated to amount to 12,600 tons of CO2e.
2.5. INFORMATION ABOUT THE MOST RELEVANT RENEWABLE ENERGY
FACILITIES BY TECHNOLOGY TYPE To illustrate this study with specific examples, a research about the renewable energy projects being implemented in Costa Rica was conducted, focusing in the following technologies: photovoltaic, wind, small scale hydro, geothermal, biogas and biomass cogeneration. All these projects have the inherent benefit of reducing GHG emissions. Below is a brief description of each of the projects included in this report. Annex 2 presents more details of each case.
1. Photovoltaic Solar power at the thermal Plant in San Antonio.
It is a solar photovoltaic system located on the roof of the Thermal Power Plant in San Antonio, whose energy is used in the plant. There are 54 panels of 175 watts each and three inverters of 3.3 kW.

32
Case of Costa Rica – Part I and II
2. Micro-hydropower station on Cocos Island.
This micro-hydropower in the Cocos Island National Park uses the water from the Genio River to supply electricity to the volunteers and staff facility.
3. “El Paramo” Hybrid System (Chirripó National Park).
ICE implemented in this national park a micro-hydroelectric power station that takes water from the Talari River for the power generation that is used by the staff, volunteers and tourists that visit this protected area. The project has improved the park officials’ quality of life and the service provided to tourists. The system’s nominal power is 21.12 kW.
4. Miravalles Geothermal Project. On the Miravalles Volcano slopes, ICE has an electricity generation project to harness geothermal energy. This project generates 142.5 MW with steam extracted from over 60 wells. In this project there are four geothermal plants, which together have produced on average over the first decade of the century, 15% of all electricity consumed in the country.
5. Cogeneration with biomass at the “Azucarera el Viejo”. This farm is dedicated to the production and processing of sugarcane. It uses the bagasse as fuel to produce high pressure steam that is used in the turbines of the mills to make them move and in turbine generators to produce electric power required by the factory. This project has the great benefit of using an own resource of the farm for power generation.
6. Electricity generation project from biogas at the SERMIDE farm. This project located in Ujarrás of Cartago, and funded by ICE and the Finland´s Ministry of Interior Matters, is in the process of generating electricity. The farm has 2000 pigs and is capable of generating 4282 kWh / month, but the project has met with a financial barrier because they have not found in the market an affordable filter for hydrogen sulfide. However, the project has generated a series of social, agricultural and environmental benefits.
7. Tejona wind power generation plant. In the Cerro Montecristo in Tilarán, Guanacaste, ICE has 30 turbines of 660 kW each, generating a total of 20,000 kilowatts. This project generates 1.3% of the total energy generated in the country, which complements hydropower, geothermal and thermal.
8. Hybrid system: wind-solar photovoltaic at the Iztarú National School Field. This system consists of a wind turbine with the capacity of 1.6 kW and a pair of photovoltaic modules with a capacity of 120 W. The system is interconnected with the network, where the excess energy is injected. All the power generated is mainly intended

33
Case of Costa Rica – Part I and II
for applications found in the offices of the School. This system has a battery bank that serves as backup of power network.
9. Self-sufficient house at the INBIO Park - Compañía Nacional de Fuerza y Luz. It is a solar and wind energy system connected in a house for demonstration at the INBio facilities in Santo Domingo, Heredia. It also shows energy saving measures and other environmental practices related to water conservation and waste generation. The site receives an average of 15,000 visitors per year.
10. “Los Anonos” photovoltaic power plant This system is composed of 88 photovoltaic modules with a capacity of 80W each. It is interconnected with one of the load centers of the CNFL Anonos Store. It has no battery backup, so that the energy generated is consumed in the store or is fed into the electricity network.
11. Garabito thermal plant.
With an investment of approximately $340 million, Garabito thermal project has a nominal potency of 200MW. Annually it will burn about 137 million liters of bunker and deliver nearly 2,728 tons of CO2 emissions.
12. “Peñas Blancas” Hydroelectric Plant. The Peñas Blancas hydroelectric plant began operations in 2002, with a nominal potency of more than 37,000 KW. The initial investment was $66 million. This plant is part of the power generation project "Minimum-cost Generation Expansion Plan" sponsored by ICE. The main source of recruitment is the Peñas Blancas River. This flow has a high annual rainfall of 4,600 mm and is protected by the Monteverde Biological Reserve.

34
Case of Costa Rica – Part I and II
2.6. LESSONS LEARNED:
� Costa Rica stands out in the region for its high rate of electricity coverage (over 99%) and its also high proportion of electricity that is produced from renewable sources (almost 93%), predominantly water resources.
� This situation is encouraging, but this does not mean that there are no new
challenges. One of them is to decentralize the electricity production, gradually increasing the role of geothermal, wind and solar, and not rely in such a high way in water generation, highly dependent on climate change. Another goal to look for is to go from a centralized generation to a more distributed one, house by house, or neighborhood by neighborhood. All these changes require extensive planning and can not be made in the short term.
� The country has a great potential to maintain and even increase the participation of
renewable energy sources. Only in the water sector, the potential identified is almost 6 times the installed capacity. The use of such potential face environmental, social and economic dilemmas that must be analyzed in depth. In the case of geothermal energy, for example, most potential sites are near volcanoes, which in turn are national parks, areas in which and according to current legislation, it is impossible to make such developments.
� Private participation in electricity generation is currently very limited due to a
number of existing barriers and due to a historical model of supplying this service from the public offering. Today, the situation is in full discussion within the current parliament, where the Government has submitted a draft Electricity Law.
� In environmental terms, although Costa Rica represents a tiny percentage in the
reduction of global environmental impact, especially in reducing GHG emissions, the actions taken are certainly good tools to deal with climate change in the international context and strengthen the country's green image.
� Although the outlook is generally positive in terms of electricity, the country has
enormous challenges related to its national energy situation. The greatest of all seems to be in the transportation sector, which relies almost exclusively on fossil fuels purchased abroad and whose prices sometimes can be very high due to fluctuations in the market. In addition to this economic problem, the burning of fossil fuels represents the majority of GHG emissions in the country. Unfortunately, the transportation sector has been left out of the successful energy planning that characterizes the national electricity production.
35
Case of Costa Rica – Part I and II
3. STATE OF THE ART (CASE STUDIES)
3.1. INTRODUCTION This section describes three projects of renewable energy in Costa Rica. The first one describes how a swine farm is on the process of using methane to generate electricity. Since this is an ongoing project, the economical benefits from this technology have not been perceived by the owner. The second case is a small-scale hydropower unit located in Chirripó National Park, and the third one is a self-sustaining home in INBioparque, with different types of technologies such as photovoltaic panels, thermal panels and wind energy. This project also includes cheaper alternatives for houses. The three cases are examples of national efforts being carried out between the public and private sector, with the main objective to promote renewable energy in the country. A brief description of each project is described below.
1. Electricity generation with biogas at SERMIDE farm: The farm SERMIDE, dedicated to pork breeding, implemented an anaerobic fermentation plant to produce electricity from swine feces. This project was coordinated by ICE and with the support of COMCURE, the Energy and Environment Alliance for Central America and the Finnish Cooperation. The farm is located in Ujarrás, Cartago, and the project began in June 2009. It has a power plant to produce electricity, but so far is not working, since it requires a special filter for the sulfuric acid, that is available in the market but at very high price. This part is essential in the process to protect the engine from corrosion. Currently the owner of the project and ICE are searching for affordable filters. Since the biogas is not been used in the engine, it’s been burned. Even though the project is not generating electricity, it has produced several benefits, such us:
• Elimination of waste water discharge into bodies of water.
• Elimination of odors and the proliferation of pathogens.
• It has managed to replace synthetic fertilizers with organic ones, which is a big saving for the farm.
• It has prevented the emission of greenhouse gases.
• The project has become a model to train other pork farmers to improve their environmental practices.
36
Case of Costa Rica – Part I and II
This project, although not currently generating electricity is a great example that can be reproduced in other swine farms, as well as in poultry and livestock farms.
2. Small hydropower generation in Chirripó: The Instituto Costarricense de Electricidad (ICE) has had the objective of providing electricity services to all corners of the country, in order to promote and enhance socio-economic development in different production sectors. Isolated communities in the National Interconnected System are being promoted to be covered with electricity by harnessing the potential of renewable resource of the country, which also helps to reduce the emission problems caused by the common practices in remote populations that do not have electrical service. In order to comply with this initiative, in 1998 ICE established in Chirripó National Park, 18 solar panels to meet part of the energy needs of the park. This system was used only for illumination during two hours per day. Then ICE discussed the possibility to increase the number of panels to meet the total energy demand, but the cost was unaffordable, so it was decided to implement a micro hydroelectric plant to supply the energy needs of the park. This project began operating in 2007, with a capacity rate of 13.9 kW. The micro hydro plant was the best alternative for several reasons, including:
• The implementation cost of the two turbines was much more affordable than the solar photovoltaic system.
• Availability of water resources in the park. The Talari River has the appropriate characteristics for turbine generators.
• Easy access to equipment (turbines, valves, etc.)
• The equipment requires little maintenance, and with a little training, park staff is able to perform the required maintenance
• Plants have a long lifetime (up to 60 years) due to the reliability of the components used in power plants.
• Plants do not require constant monitoring and its operation is fully automatic and adjusts to the demand for electricity.
• The cost of installed capacity (Watts) is low compared to other alternative systems.
• Access to energy 24 hours a day, and usually energy availability throughout the year, due to the high rainfall of the area.
• The turbines used are flexible and can operate under different conditions (e.g. water flow), which is very useful to have a continuous supply of energy in both dry and rainy season.
• Reduce CO2 emissions.

37
Case of Costa Rica – Part I and II
3. Self-Sufficient House INBioparque-Compañía Nacional de Fuerza y Luz: The Compania Nacional de Fuerza y Luz (CNFL) developed a project together with INBio to establish a demonstration house with environmentally sustainable practices in order to show visitors of the INBioparque, that a house can be totally self-sufficient using alternative and renewable energy, and can implement environmental practices such us recycling wastes and waste water. This demonstration system of wind and solar power is connected to the network, so the surplus of energy is sold to ICE. The site receives about 15,000 visitors a year, so it is considered a very important project for environmental education in the country. This is currently the only national project that shows sustainable practices at home. Applied technologies have different costs, so that visitors can make a decision regarding which technology they can afford for their homes. The technologies can be costly as photovoltaic or solar system or more accessible such as skylight and water heaters made with plastic bottles.
3.2. METHODOLOGY In order to obtain the information for each case, interviews were held with the people responsible of each project (primary sources). There was also searched of information in documents and on internet (secondary sources). Below are the primary and secondary sources for each project
1. Electricity generation with biogas at SERMIDE farm. Primary sources:
• Giancarlo Coghi. Farm owner and manager
• Irene Cañas. Project coordinator. Generation Process Technologies. National Electrical Planning Center. Position: Civil Engineer – Renewable sources
Secondary sources: The following documents were consulted:
• Cañas, I. 2008. Electricity generation from biogas obtained from pig excreta. Energy and Environment Partnership with Central America. Costa Rica, ICE-COMCURE.
• Cañas, I. 2009. Production of electricity with biogas. Instituto Costarricense de Electricidad.

38
Case of Costa Rica – Part I and II
This project was considered for a case of study for the following reasons:
• There are a lot of swine farms in the country and its inadequate sewage disposal has a negative impact on aquatic ecosystems.
• It has several benefits, apart from generating electricity, for example, decontamination of wastewater, eliminate odors, generation of an excellent bio-fertilizer that can replace synthetic fertilizers.
• Represents a saving of money by avoiding the payment of fines related to the discharge of untreated wastewater into bodies of water.
• It’s a replicable technology, not only to other swine farms, but also for livestock and poultry industry, as well as other activities that can generate methane.
2. Small hydropower generation in Chirripó:
The information was obtained through the following sources: Primary sources:
• Bernal Valderramos. Chirripó National Park Manager.
• Jesús Sánchez Ruíz. Director. UEN Costumer Service. ICE.
• Alberto Ramírez Quiros. General Director. UEN Production. ICE.
• Luis Diego Ramírez Rodríguez. Rural Electrification Program with Renewable Energies. Costumer Service. ICE.
• José Antonio Conejo Badilla. Technical Support. UEN Production. ICE.
• Alexandra Arias Alvarado. Client Service Unit, Energy Conservation Area. ICE. Secondary sources: The following documents were used:
• Programa de electrificación nacional con energías renovables en áreas no cubiertas por la red COS/02/G31 00034921. Ministerio de Ambiente y Energía (MINAE), Programa de Naciones Unidas para el Desarrollo (PNUD), Fondo para le Medio Ambiente Mundial (FMAM)
• Informe de factibilidad para la instalación de una central micro hidroeléctrica. Centro Ambientalista el Páramo. Parque Nacional Chirripó. Programa nacional de electrificación con base en fuentes de energía renovable en áreas no cubiertas por la red (Febrero 2003).
• Villareal, J.D., 2008 Chirripó se conecta al mundo. Al Día, [en línea] Disponible en: http://www.aldia.cr/ad_ee/2008/febrero/24/nacionales1437258.html [Accesado el 15 de Julio 2010]

39
Case of Costa Rica – Part I and II
3. Self-Sufficient House INBioparque-Compañía Nacional de Fuerza y Luz. The information was obtained through the following sources: Primary sources:
• Alfonso Herrera Herrera. Energy Efficiency Department. Compañía Nacional de Fuerza y Luz.
• Ingrid Redondo. Costumer Service, Self-sufficient House INBioparque. Compañía Nacional de Fuerza y Luz
• Henry Solís Bolaños. Director, Energy Conservation Direction. Compañía Nacional de Fuerza y Luz
Secondary sources:
• Nieto A. La Nación. (2009) INBio y CNFL exhiben la vivienda sostenible del futuro. [En línea]. Disponible en http://wvw.nacion.com/ln_ee/2009/febrero/04/aldea1863192.html [Accesado el 24 de Agosto, 2011]
4. Parameters of selection of the projects:
These projects were chosen principally because of the large amount of information it was available. In the case of the SERMIDE project, this initiative was selected considering that it was one of the largest projects of biofuel at the national level. The hydroelectric power plant of Chirripó was chosen considering that it was located in the national park where a special attention should be taken into consideration for the generation of electricity considering that these types of locations it has been common to have diesel power plants. In the case of the self-sufficient house of INBiopark, it was selected considering its facility to visit the installations, and it also has a great variety of renewable energies that can be implemented in residences.

40
Case of Costa Rica – Part I and II
3.3 CASE 1: ELECTRICITY GENERATION FROM BIOGAS OBTAINED FROM PIG
EXCRETA. UJARRAS, CARTAGO.
3.3.1. General description of the Project SERMIDE is an agricultural family farm dedicated to growing and fattening pigs and the production of sugarcane. The farm was established in 1937 and provides employment for 10 people, who feeds and manage the pigs, and maintain 10 hectares of sugar cane plantation. The owner of the property serves as general manager and is dedicated full time to these activities. The piggery has 2,000 pigs, which produce 6400 kilograms solid excrement daily. In the past the farm had a treatment system that used to separate liquids and solids. Part of the organic matter was composted and the other part was send to two aerobic lagoons. Finally, sewage was dumped into a ravine. The project at SERMIDE farm is about the biogas production from swine excrement (swine manure), which is extracted from methane gas that will eventually be used to generate electricity and meet the demand of different production processes of the farm. This project implies the incorporation of a new technology that allows a sustainable use of swine excreta. The significant generation of manure per day, represents an environmental hazard, due to the potential pollution of water bodies and the generation and release into the atmosphere of greenhouse gases (GHGs) such as methane (CH4). With the application of this technology it is possible not only to generate electricity to meet part of the farm needs, but also contributes to the mitigation of global warming by capturing methane (CH4). In addition, economic and environmental benefits are obtained with the production of bio-fertilizers which are used as substitutes for conventional chemical fertilizers. Project Location The project "Electricity generation from biogas obtained from pig manure" in SERMIDE farm, is located in the district of Santiago, Paraíso canton, Cartago Province, Costa Rica. (See Figure 20)

41
Case of Costa Rica – Part I and II
Figure 20. SERMIDE farm location. Source: Electricity generation from biogas obtained from pig manure, 2008 Activities: The following table shows the activities implemented in the project. Table 2. Project activities in finca SERMIDE
No Activity Resources Responsible Time
1 Signing of agreement
Terms of reference
Technical Committee
2 weeks
2 Final project design Engineers
Technical Committee
4 weeks
3 Specifications, blueprints Administration
Technical Committee
4 weeks
4 Updated budget Administration
Administration - coordination
2 weeks
5 Development and management of environmental permit
Administration Coordination 4 weeks
6 Work budget Administration
Administration - coordination
4 weeks

42
Case of Costa Rica – Part I and II
7 Hiring for construction work Offers Administration 2 weeks
8 Construction work Contractors Coordination 12 weeks
9 Purchase of equipment AMANCO Administration 2 weeks
10 Mechanical and electrical installation
FONT Technical
Committee 4 weeks
11 Training for operation and maintenance
Training Program
ICE - COMCURE
2 weeks
12 Initial load of digester Design
Technical Committee
1 weeks
13 Tracking and monitoring of the operation
Digester and generator
SERMIDE 16 weeks
14 Operational tests Plant
Technical Committee
1 weeks
15 Sludge production Digester SERMIDE 4 weeks
Source: Electricity generation from biogas obtained from pig manure, 2008. The duration of the project was 14 months, which included the final project design, construction, staff training, commissioning and 4 months follow up and monitoring. The following tables show the work program during the project planning and design phase, and during the construction and operation phase. Table 3. Work program in planning and design phase
Activities
Month 1
Month 2 Month 3 Month 4
1 2 3 4 5 6 7 8 9 10
11
12
13
14
15
16
Signing of agreement
Final project design
Specifications, blueprints
Updated budget
Development and management of environmental permit
Work budget
Hiring for construction work
Source: Electricity generation from biogas obtained from pig manure, 2008

43
Case of Costa Rica – Part I and II
Table 4. Construction and monitoring program
Month 1 Month 2 Month 3 Month 4 Month 5 Month 6
1 2 3 4 1 2 3 4 1 2 3 4 1 2 3 4 1 2 3 4 1 2 3 4
Membrane order
Equipment order (pump and plant)
Excavation
Embankment construction
Agitation pipe system
Membrane placing
Placing suction pipe system
Pump installation
Changes in the electrical system
Effluent pipe
Digester fill up
Agitation system test
Cover Membrane placing
Installation of engine
Engine test
Training of personnel
Sludge quality assessment
Tracking and monitoring operations
Source: Electricity generation from biogas obtained from pig manure, 2008

44
Case of Costa Rica – Part I and II
Advice: The project was conceived jointly by ICE, the company AMANCO and the Corporation FONT. Each actor complied with its own role according to specialties and stages of the project, as follows: Planning phase: Includes aspects related to the type and design of the digester, a task that was executed between ICE and AMANCO. The aspects of electromechanical design and production of electricity were produced by ICE and FONT Corporation. Construction phase and commissioning: This phase includes digester construction aspects, agitation system, electricity generation and monitoring, among others. This phase was conducted by AMANCO and FONT Corporation. The installation of the generating plant and the agitation system was implemented by Corporation FONT, while commissioning and training of the farm was the work of ICE. Tracking and monitoring phase: During this phase technical advice was given to SERMIDE in order to ensure proper operation. This phase was the responsibility of ICE, which was assessed by certain technical and environmental indicators in order to document the experience for application in other projects. ICE is currently looking for alternatives to use filters affordable for producers. Dissemination and training phase: This phase was undertaken by ICE and COMCURE and consisted on conducting field working days, demonstration lectures, preparation of training materials, attention to producers and training to technicians. The following table shows the activities of the project, the experts per activity and the time required.

45
Case of Costa Rica – Part I and II
Table 5. Requirements of the project
Actividad Expertos Tiempo requerido
1. Final Project Design 2 2 weeks (ICE- AMANCO)
2. Specifications, plans, price list 2 4 weeks (ICE – AMANCO)
3. Construction 2 8 weeks (ICE- AMANCO)
4. Mechanical and Electrical installation
2 2 weeks (ICE- FONT)
5. Training and initial loading of digester
1 2 weeks (ICE)
6. Operational tests 2 1 week (ICE – FONT)
7. Dissemination, training and monitoring
2 12 months (ICE – COMCURE)
Source: Electricity generation from biogas obtained from pig manure, 2008 Currently there has been no generation of electricity, due to the economic limitation to purchase a filter for hydrogen sulfide. Hence, this stage of the project is still pending. The following table details the design requirements. Table 6. Project design requirements
N Design Consideration Estimate
1 Number of animals Developing swine: 1430 fattening pigs: 2 570
4 000 pigs in the future
2 Daily production of excreta
Excreta production: 4% by weight of the animal. Average animal weight: 60 kg. Percentage excreted solid: 55%
10 079 kg. Daily swine manure
3 Wash water volume Daily consumption: 20 m3 on the farm
28 m3 of water per day
4 Average temperature 25 °C 25 °C
5 Water table 2 meters
6 Production m3 biogas / Kg. Manure
0.040 – 0.059
0.049
Source: Electricity generation from biogas obtained from pig manure, 2008

46
Case of Costa Rica – Part I and II
3.3.2. Objectives of the project The main objective of this project was to develop and implement a renewable energy project to produce electricity with biogas generated from the anaerobic decomposition of swine fasces. The specific objectives were:
1. Ensure that the producer is partially or completely self-sufficient in energy consumption by implementing clean technology.
2. Properly treat and dispose of excreta obtained on the farm, thus improving environmental indicators.
3. Transfer the knowledge gained from this experience to other pig farmers. 4. Helping to reduce fossil fuel use and prevent the emission of greenhouse gases.
The project has not been able to meet the first specific objective because it hasn’t been possible to find filters of sulfuric acid at a competitive cost. The project has a large amount of biogas that is currently burned, but has the potential to supply electricity to various farm activities.
3.3.3. Stakeholder analysis Project Beneficiaries: Among the beneficiaries of the project are the following stakeholders: SERMIDE farm: With this project, SERMIDE farm will generate its own power and thereby significantly decrease energy consumption, as well as reducing the electric bill (currently paying approximately 450,000 colones of electricity per month). In addition, the farm treats the solids and liquids generated in the pig production, used as organic fertilizer and avoiding the purchase of synthetic chemical fertilizers. Swime farmers: The project has had a demonstration and dissemination effect, aimed at pig farmers nationwide. It has established a direct and permanent communication with the national swine camera, to ensure wide dissemination of the project. COMCURE: The project has expanded the level of influence of this organization at basin level, and contributes to its ability to manage and respond to the demands of the inhabitants of the basin. ICE: The project has helped to establish and strengthen regional cooperation with the private sector for the design, implementation and monitoring of such initiatives. It also has

47
Case of Costa Rica – Part I and II
strengthened the technical capabilities of the team for the dissemination of such technologies and their application. Project Structure: The project was implemented with the participation of the following institutional and private actors:
Institutional
• ICE: Instituto Costarricense de Electricidad.
• COMCURE: Committee on Land Use and Management of the upper basin of the Reventazón River.
Private
• SERMIDE Farm
• AMANCO Agricultural Solutions
• FONT corporation
Project Organization: The following diagram shows the organization of the project

48
Case of Costa Rica – Part I and II
Figure 22. Project organization chart Source: Electricity generation from biogas obtained from pig manure, 2008
Technical Committee: Composed of representatives of COMCURE, ICE, SERMIDE, AMANCO and FONT, which was responsible for deciding, delegate, outsource and monitor the progress of works and budget Project Manager: Project management was in charge of COMCURE, who was responsible for the management and administration of resources. This institution prepared and submitted their respective reports to the funding agency. Project coordination: This activity was undertaken by Irene Cañas Díaz, who works in the Strategic Business Unit (UEN) of ICE Electrical Planning. Her task was to ensure compliance with targets, timetables and project cost, as well as the generation of progress and final reports. She also had a close relationship with the project manager (COMCURE)
Technical committee ICE, COMCURE, AMANCO, FONT
Contractor (Constrution and
assembly)
AMANCO-FONT
ICE Testing and monitoring
SERMIDE farm Testing and monitoring
COMCURE Budget administrator
Project coordinator ICE, Irene Cañas

49
Case of Costa Rica – Part I and II
to schedule tasks and disbursements. She coordinated the diffusion and training related to the project.
Contractors: Undertook the construction and installation of equipment where AMANCO and FONT participated as project partners. SERMIDE: in charge of the operation and maintenance of the digester and power plant. ICE and COMCURE: were responsible for publicizing and promoting the project in order to achieve a multiplier effect on local and regional level. Local Authorities The authorities involved in this project were: SETENA, MINAET, Ministry of Health, Municipality of Paraiso, ICE, COMCURE and SENASA (National Animal Health Service).
3.3.4. Legal aspects Due to the environmental impacts caused by pig farming, the Ministry of Health in 2005 issued the Decree No. 32312-S, which establishes the Regulation of pig farms, in order to regulate, monitor and control the various aspects related with swine production and thereby comply with the provisions in Articles 331 and 336 of the General Health Law. This regulation establishes that the pig farms must have an adequate system for the treatment of waste (liquid and solid) and thereby avoid or reduce possible pollution in air, soil or water. Similarly, the Decree No. 33601-S MINAE, issued in 2007, regulates the minimum technical aspects for the discharge of wastewater from any productive activity (including swine farms) into a body of water, thereby seeking to protect water resources and public health. Other strategies for the promotion of renewable energy sources The National Development Plan Jorge Manuel Dengo Obregón, aims to reduce dependence on imported fuels, better use of renewable energy sources in the country and eventually produce 100% of the country's electricity from renewable energy sources (MIDEPLAN, 2007) The plan proposes to improve and restore the levels of reliability, quality and security of energy supply and reduce oil use in electricity production, laying the groundwork so that Costa Rica can become the first country to produce 100% of the electricity from renewable sources of energy for the year 2021.

50
Case of Costa Rica – Part I and II
The plan proposes the creation of industrial synergies to reduce dependence on fossil fuels, as well as developing sustainable biomass to produce energy.
The energy policy included in 2007-2021 PNE poses to promote the development and use of new alternative energy sources through the implementation of projects using sources such as biomass. It also proposes the growing share of renewable sources and the use of biomass for a more efficient energy production. The Vision 2021 is a comprehensive planning effort aimed at determining the set of actions and projects that the Electricity Sector of ICE must undertake, at the strategic and organizational level to ensure the satisfaction of the national electricity demand by the predominant use of renewable sources of energy. The National Climate Change Plan, propose by concrete actions, to reverse or prevent the increasing trends of GHGs in the atmosphere, developing strong technical and scientific bases that allow reconfiguration management tools (policies, plans, programs, projects) in order to prevent, mitigate or adapt to extreme climate changes. This plan also aims to create a culture with greater knowledge and public environmental awareness through an understanding of current environmental problems and their relationship to health, economy and development of the human species. It also seeks to improve understanding of actions that can help prevent disasters and better understand the ecological and social systems. In terms of energy and power, the policies governing the sector are the following:
• In the Guideline No. 22 of April 23rd, 2003, the Executive Power requests to the members of the Electric Power Sub Sector to encourage the use of new technologies using new and renewable sources for electricity generation, which are technical, environmental and economically viable.
• The Business Plan of the National Electrical Planning (PDEN) proposes options for power generation that are technically, economically, environmentally and socially viable.
The environmental guidelines of ICE are the following:
• To promote research, development and use of other sources of renewable generation, as technologically and economically feasible, such as solar, wind, biomass, hydrogen, etc.
• To manage the electricity demand, in a program that includes the priority to create a culture of efficient energy use in the population.
The Sub-Commission of non conventional renewable sources, in its final report established the following recommendations:
51
Case of Costa Rica – Part I and II
• To introduce in the Costa Rican society the use of non-conventional renewable energies. Develop pilot projects that would not only demonstrate the use of these renewable energy sources but that the facilities provide data to specify in greater detail the contributions of these energies: advantages and disadvantages, in order to find more discretion to decide on future projects.
• Among the most important pilot projects are: installation of photovoltaic cells
connected to the network and installing a gas engine that produces electricity from biogas, using the manure from a dairy or piggery.
• Public and private entities interested in developing non-traditional renewable technologies, must be encouraged through technical assistance. The private investment in this area would alleviate part of the required public investment.
• The disclosure about the benefits and challenges of power generation using non-
conventional sources should be done systematically and clearly. The public must have reliable data to not incur misunderstandings about the real possibilities of using these energies.
• For energies such as solar, thermal and biomass, its biggest contribution is
expressed as a reduction in electricity demand of the system. Solar energy for water heating and biomass for cooking are more efficient uses than the transformation of the energy into electricity. Therefore, the promotion of such uses is reducing the total power consumption, which is convenient for the country.
The project in question is being prepared in accordance with the policies and general guidelines of the National Development Plan (NDP), the National Energy Plan (NEP), Power Sector Vision 2021 and the National Strategy on Climate Change (ENCC) On the other hand, the wastewater treatment system in SERMIDE farm meets the environmental parameters set by the Ministry of Health for this type of activities (CIUU 2010).
3.3.5. Economic aspects. The total investment was € 68,924, which was funded by the Energy and Environment Alliance for Central America, the Finnish Cooperation, the ICE-COMCUREE and SERMIDE. Some of the inputs / activities that were funded from this amount were the following:
• Earthworks • Placement of geo-membranes (lower deck) • Agitation system (pipes and fittings)

52
Case of Costa Rica – Part I and II
• Pump agitation system • Changes in the electrical system • Power Plant • Technical advice and monitoring • Contingencies
Technical supervision and advice were provided by the ICE counterpart. Financing: The funds to finance this project were provided by AEA, ICE (formulator of the project) and SERMIDE farm. Earthworks, placement of geo-membranes, agitation system (pipes, valves and pump), power plant and filter, had a cost of 38000 Euros. The owner of the farm had to make an investment of $ 10 000.00 more to cover the costs of building the pump house of the agitation system and changes in the electrical system to connect the biogas plant. The rest was contributed by ICE in consultancy. Costs: This project received non-refundable funds (for a 55.13% of the cost) from the Energy and Environmental Alliance with Central America. The formulator partner (ICE) also provided a non-refundable amount of 43.41%, which means an investment for the owner of the estate of 1.46%. The following table shows the assumptions used for financial analysis. Table 7. Assumptions of financial analysis.
Variable Value Discount rate (%) donated funds to be free 3%
Project life (years) 15
Handling (Total in 15 years) € 58.642,7
Operating Expenses (Total in 15 years) € 26 419.4
Revenue growth per year 4.5 %
Euro exchange rate against the dollar $1.55
Euro exchange rate of the colon ¢ 770.0
Source: Electricity generation from biogas obtained from pig manure, 2008

53
Case of Costa Rica – Part I and II
Annual Income: The benefits of a digester should consider the production of biogas, waste management and organic fertilizer production. The following table shows the annual revenue. Table 8. Annual project revenues 1 Investment US ($) € Digester construction 18 291,55 11 801, 00
Buy Power Plant and pump 23 299,6 15 032,00
Agitation system (pipes and fittings) 10 563,25 6 815,00
Earthworks 4 526 2 920,00
Changes in the electrical system 1 550 1 000
Supervision and coordination 46 382,2 29 924,00
Contingencies 2 219,6 1 432,00
Net Investment 106 832,2 68 924,00
2 PRODUCTION Gas production (m 3 / y)
Production of manure (m 3 / y)
Electricity production (kWh / year)
3 REVENUE
Electricity savings ($ US / year) 8 886,77 5 733,4
Credit value ($ US / year) 4 619,96 2 980,6
Total Revenue 13 506,7 8 714,1
4 COSTS
Depreciation of investment in 20 years ($ US / year)
Maintenance (annual) 6 059,73 3 909,5
Labor (annual) 2 730,02 1 761.3
Total costs per year 8 789,74 3 909,5
Earnings Excluding depreciation (annual) 4 716,96 3 043,20
Source: Electricity generation from biogas obtained from pig manure, 2008 The values associated with the generation of electricity will be checked once the filter gets hydrogen sulfide and can operate the plant. The financial analysis takes into account the manure as income because it is used in the sugar cane fields of the farm. The table above shows that the utilities of the project are € 3 043. The analysis does not take into account depreciation, since the funds are non-refundable.
54
Case of Costa Rica – Part I and II
Financial Assessment: For this project there was a micro economic assessment consisted of a financial analysis that determines the benefits for the owner of the digester at farm-SERMIDE, in order to determine the feasibility of the project. The following table shows the cash flow of project.

55
Case of Costa Rica – Part I and II
Table 9. Flow project financing
Description Year
0 1 2 3 4 5 6 7 8 9 10 11 12 13 14 15 Income
Electricity 0 5733 5991 6261 6543 6837 7145 7466 7802 8153 8520 8904 9304 9723 10161 10618 Manure 0 2981 3115 3255 3401 3554 3714 3882 4056 4239 4430 4629 4837 5055 5282 5520 Expenses
Operation 0 -1761 -1761
-1761
-1761 -1761 -1761 -
1761 -1761 -1761
-1761
-1761
-1761 -1761 -1761 -1761
Maitenance 0 -3910 -3910
-3910
-3910 -3910 -3910 -
3910 -3910 -3910
-3910
-3910
-3910 -3910 -3910 -3910
Operational Flow
0 3043 3435 3845 4273 4720 5188 5677 6187 6721 7279 7862 8470 9106 9772 10467
Initial investment
-68924
Residual value -68924
2255
Capital flows -68924
2255
Cash flow -68924
3043 3435 3845 4273 4720 5188 5677 6187 6721 7279 7862 8470 9106 9772 12722
Discounted cash flow
-68924
2955 3238 3519 3797 4072 4345 4616 4885 5151 5415 5680 5941 6202 6461 8166
Source: Electricity generation from biogas obtained from pig manure, 2008∗
Electricity generation from biogas obtained from the excreta of pigs, 1985. Cited by Irene Cañas, 2008, p. 30

56
Case of Costa Rica – Part I and II
NPV = 5519 IRR= 4% Discount rate = 3% The project began in 2009 but so far has not generated electricity. The chart above shows that the project has a NPV of € 5519 and an IRR of 4%. In this case, the contribution of ICE (€ 29,924) is an amount that in another project would be much less because they have included the salaries of all professionals involved in the project and their living expenses. The timing of these professionals was 6 months of the project, plus the time of scheduled visits for schools and other local producers who visit the farm. For another project, this cost would be only the project design and the construction inspection of the work. Taking into account a cost to this area of 15% of the total work would be € 5,850.00 for design services and advice in the construction phase and commissioning. This decrease represents an increase in the NPV € 29 593 and 9% IRR. Economic impact of the project: From the energy point of view it has not been possible to perceive an economic benefit, since no electricity is being generated. However, the benefits are perceived by the savings in fines and fertilizers. With regard to the fines, it is estimated that the fines would be $ 7414/year for disposal (€ 4,783). In this way the project would have a NPV of € 82 051 and an IRR of 18%. Another perceived savings are the bio-fertilizers, which save $ 308/ha for purchases of nitrogen fertilizer, which means $ 4,620 per year. In addition, the effluent improves the microbiological chemical and physical quality of the soil.
3.3.6. Technological aspects The project involves the production of biogas from swine excrement (swine manure), which will generate electricity for use in various production processes at SERMIDE farm. The effluent is currently used as bio-fertilizer and thus synthetic chemical fertilizers have been replaced. The figure below outlines the process of on-farm biogas generation.
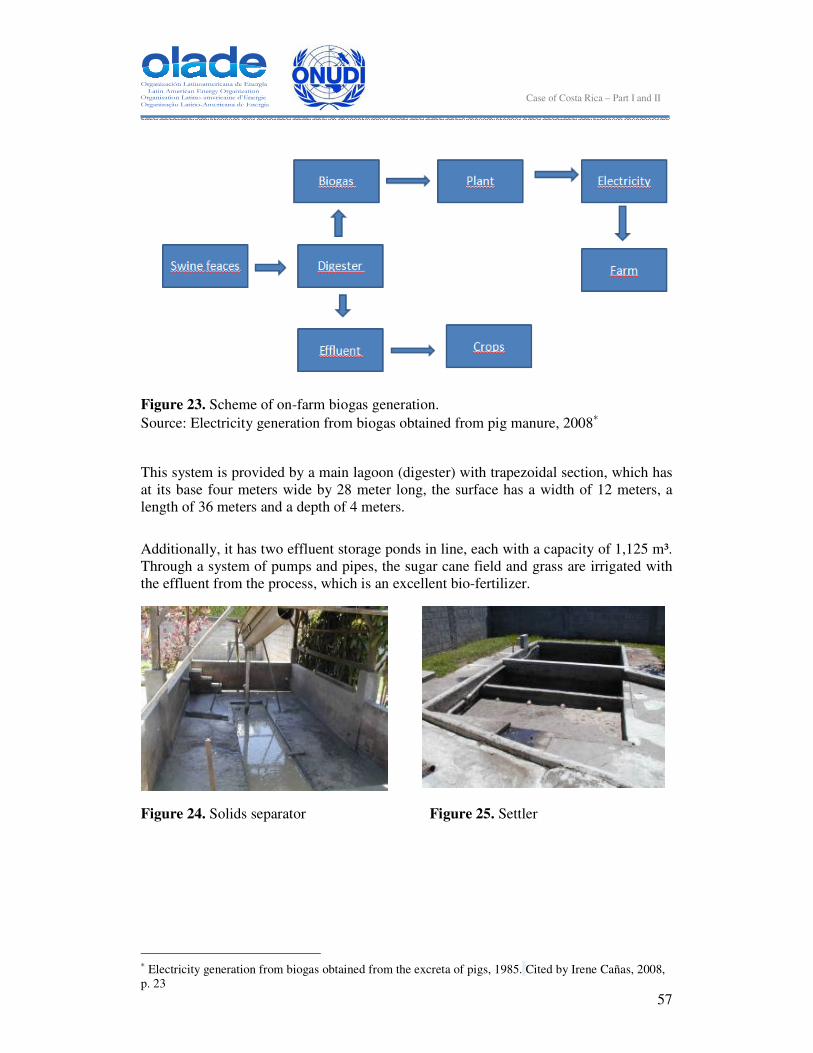
57
Case of Costa Rica – Part I and II
Figure 23. Scheme of on-farm biogas generation.
Source: Electricity generation from biogas obtained from pig manure, 2008∗
This system is provided by a main lagoon (digester) with trapezoidal section, which has at its base four meters wide by 28 meter long, the surface has a width of 12 meters, a length of 36 meters and a depth of 4 meters.
Additionally, it has two effluent storage ponds in line, each with a capacity of 1,125 m³. Through a system of pumps and pipes, the sugar cane field and grass are irrigated with the effluent from the process, which is an excellent bio-fertilizer.
Figure 24. Solids separator Figure 25. Settler
∗ Electricity generation from biogas obtained from the excreta of pigs, 1985. Cited by Irene Cañas, 2008, p. 23
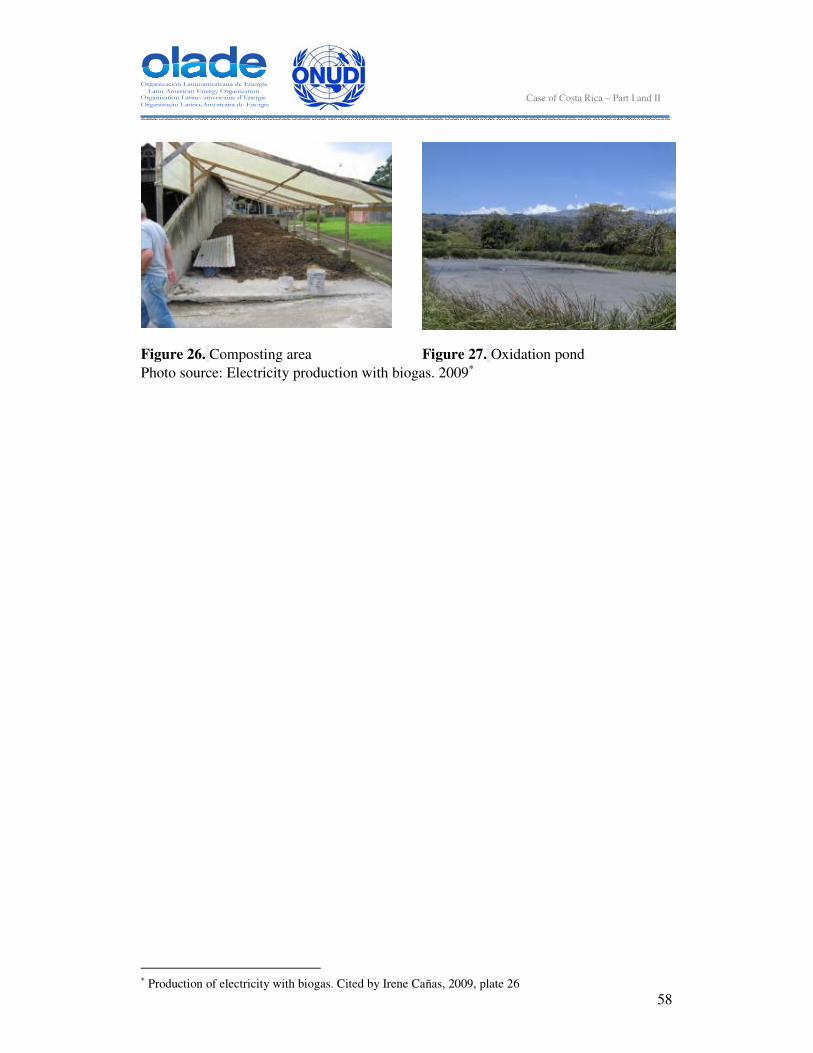
58
Case of Costa Rica – Part I and II
Figure 26. Composting area Figure 27. Oxidation pond
Photo source: Electricity production with biogas. 2009∗
∗ Production of electricity with biogas. Cited by Irene Cañas, 2009, plate 26

59
Case of Costa Rica – Part I and II
Figure 28. Digester
Figure 29. Power plant
Figure 30. Biogas burner
Source: Francisco Naranjo. Consultant. CEGESTI
The floor and slopes of the digestion pond are lined with a waterproof geo-membrane. To store the gas a cover made of PVC of 1.2 mm thick covers an area of 600 m². This deposit can store up to 500 m³ of biogas. The digester has a piping system to transfer the gas capture to the generation plant. Similarly, it has a manual agitation system to ensure a homogeneous mixture within the lagoon.
The pig farm has a herd of 2000 pigs, with an estimated average of solid manure per pig per day of 3.2 kg, resulting in a daily load (plus sewage water) of 37.92 m³. This allows to dispose up to 6400 kg of solids daily. The excreta are driven by gravity to the load cell, using water as a vehicle; the hydraulic retention time is 25 days. These values define the dimensions of the digester, which are 1010 cubic meters of volume.

60
Case of Costa Rica – Part I and II
Through a pumping system the mixture is stirred and injected into the digestion lagoon. This is done once a day, since the supply to the digester is continuous.
Biogas production is 498 m³ / day (60 - 64% methane), with a yield of 0,049 m³ biogas / kg of swine manure. This volume of biogas is enough for the power plant (50 kW) to operate up to 13 hours at full load to a daily average of 270 kWh and 88 MWh annual output.
With this power it’s possible to supply the energy demanded by the swine farm, which has equipment such as mixers, conveyor belts, pumps and a mill. The total demand of all these machinery is not greater than 39.9 kW, since most of these equipments operate in series, which implies less demand than the sum of all charges. It is estimated that the ratio of energy produced and the use of biogas power plant may be about 1.38 kWh/m3. But this value, as well as others will be checked when the system is working.
Additionally, this technology can remove between 80 to 85% of the total solids of the swine manure, reducing significantly the risks of pollution discharged to receiving bodies of water; and it also prevent odors.
On the other hand, with the effluent obtained daily (39 m3), the requirements for nitrogen (150 kgN / ha / year) for a hectare of sugar cane are covered, improving the microbiological, chemical and physical conditions in the soil. Additionally there are two effluent storage ponds in line with a capacity of 1,125 cubic meters each, with a pump and irrigation system to use the effluent as bio-fertilizer in the areas of sugar cane and pasture. The amount of water used depends on the amount of total solids required, therefore a ratio of 1: 2.72, its been used. In other words, 2.72 parts water are mixed with one part of pig feces, looking for a solid concentration in the mixture of 8%, which is ideal for this type of digesters. In total 20 m³ of water are used daily, which are supplied from natural sources existing in the property, thereby seeking an efficient and sustainable use of water compared to the traditional ones. Operating Parameters: The digester operating parameters are:
Hydraulic retention time: 25 days. Daily load: 37.92 m3 Production of biogas: 498 m3/day Storage of mixing volume: 1010 m3 Biogas storage volume: 500 m3 Rated power plant: 50 kW (not working for lack of filter)
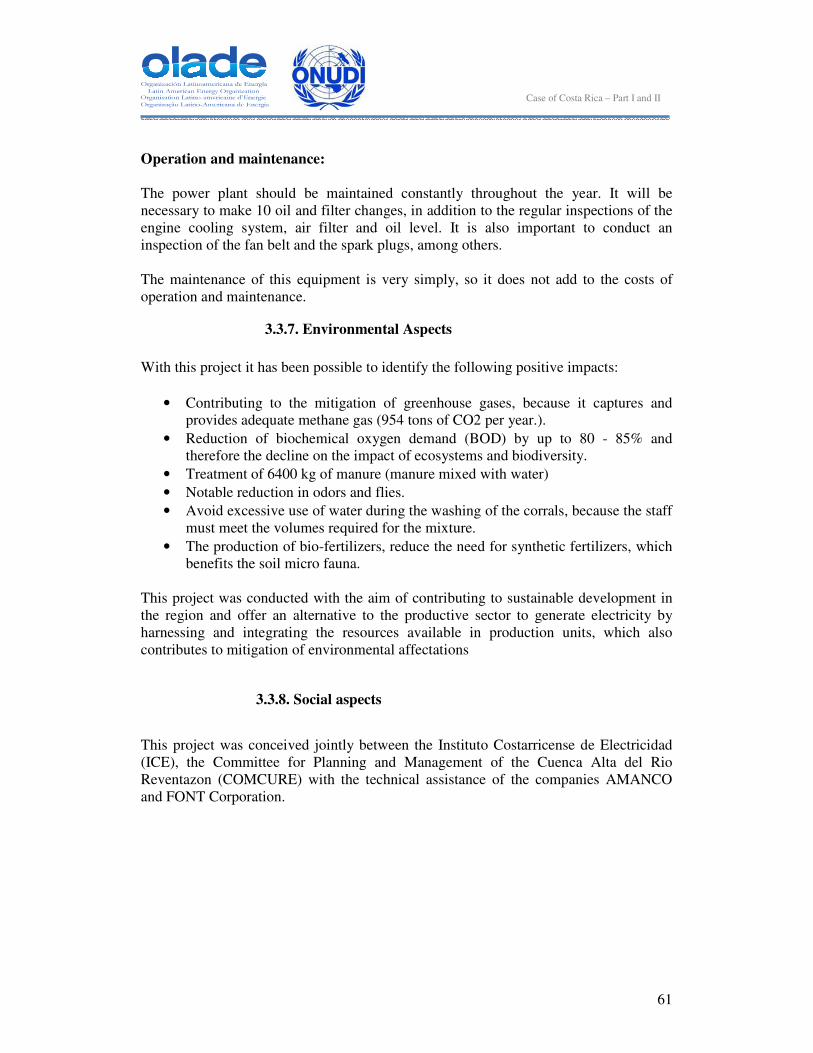
61
Case of Costa Rica – Part I and II
Operation and maintenance: The power plant should be maintained constantly throughout the year. It will be necessary to make 10 oil and filter changes, in addition to the regular inspections of the engine cooling system, air filter and oil level. It is also important to conduct an inspection of the fan belt and the spark plugs, among others. The maintenance of this equipment is very simply, so it does not add to the costs of operation and maintenance.
3.3.7. Environmental Aspects With this project it has been possible to identify the following positive impacts:
• Contributing to the mitigation of greenhouse gases, because it captures and provides adequate methane gas (954 tons of CO2 per year.).
• Reduction of biochemical oxygen demand (BOD) by up to 80 - 85% and therefore the decline on the impact of ecosystems and biodiversity.
• Treatment of 6400 kg of manure (manure mixed with water)
• Notable reduction in odors and flies.
• Avoid excessive use of water during the washing of the corrals, because the staff must meet the volumes required for the mixture.
• The production of bio-fertilizers, reduce the need for synthetic fertilizers, which benefits the soil micro fauna.
This project was conducted with the aim of contributing to sustainable development in the region and offer an alternative to the productive sector to generate electricity by harnessing and integrating the resources available in production units, which also contributes to mitigation of environmental affectations
3.3.8. Social aspects
This project was conceived jointly between the Instituto Costarricense de Electricidad (ICE), the Committee for Planning and Management of the Cuenca Alta del Rio Reventazon (COMCURE) with the technical assistance of the companies AMANCO and FONT Corporation.

62
Case of Costa Rica – Part I and II
This project has the following positive social impacts:
• Production of educational materials for groups of pig farmers, as well as field days to the project with technicians, students and state institutions (MAG - MS - MINAE) to disseminate the results and give details of the technology used.
• The project has served as a demonstration model for technology transfer and training center for pig farmers near the project area.
• Established of working partnerships between private companies, organizations, independent producers and the public sector for the design, implementation and monitoring of projects related to the use of biomass for power generation.
• Control of odors, which has improved the environment for the surrounding communities.
• Treatment and use of wastewater, which implies that the bodies of water no longer receive these pollutants. This practice has reduced the risk of pathogen proliferation.
3.3.9. Replicability The project is easy to repeat considering its easy installation and affordable cost, especially considering other technologies such as wind and solar photovoltaic. The main barrier of this project is the difficulty of finding a hydrogen sulfide filter that protects the engine from corrosion. These filters are priced at $ 9000 a year. Currently the owner of the property pays approximately 450 thousand colones a month of electricity to ICE, resulting in about 10 thousand dollars a year. But according to the owner, the cumulative cost of maintenance doesn’t make this technology more economical than buying electricity to ICE. In order for the technology to be competitive it’s necessary to find a less expensive filter.
3.3.10. Interview with the farm owner In the interview with Giancarlo Coghi, who is the owner and manager of SERMIDE farm, the following aspects were identified: Positive aspects of the project: One of the social benefits is the treatment of wastewater, because the neighbors have stopped complaining about odors emanating from the piggery to the surroundings. Bio-fertilizer also extracted from the digester is excellent and has allowed operating an organic farm. The soil of the farm has been greatly enriched, to the point that production have increased from 75 tons to 90 tons per hectare per year.

63
Case of Costa Rica – Part I and II
Negative aspects of the project: It wasn’t identified previously to the project that the filter had such a high price. This filter has a cost of $ 9000 and has a lifespan of one year. Although the electricity bill per month is 450,000 colones, (5,400,000 colones per year) the combined costs of maintenance and operation, plus the cost of the filter is more expensive than to buy electricity to ICE. Currently the farm owner and the ICE counterpart are looking for cheaper alternatives. Nationally there is little experience in the field of biogas power generation at industrial level and are now taking the first steps, which is good, but if is not possible to find an affordable filter, the technology is not going to be competitive.
3.3.11. Interview with the Director of the Subsectorial Energy Planification Department of Costa Rica (DSE1)
In the interview with Gloria Villa, who is in charge of the DSE, emphasized the following points for this project:
• The project has great environmental and social benefits, mainly the wastewater treatment and odor reduction.
• Although the system still is not generating energy, it is important to move forward with this project since the generation of electricity using biogas, is a great support for distributed power generation.
• It is very important to inform farmers, who adopt these projects, that the benefits of these technologies are many and not just about saving money on energy. As in this particular case, to avoid fines for discharges of wastewater into bodies of water.
• The mission with these pilot projects in renewable energy is to educate people on global benefits related to these practices.
3.3.12. Project selection. This project was selected for the following reasons:
• This project of biogas power generation is one of the biggest in country.
• There is extensive and detailed information about the project, generated by the ICE, which facilitated obtaining the information requested for this project.
• The project site is not far from San Jose (1 hour drive approximately), which facilitated the site visit and interview with the owner of the property.
1 Acronym for Dirección Sectorial de Energía

64
Case of Costa Rica – Part I and II
3.4 CASE 2: MICRO HYDROPOWER IN CHIRRIPO NATIONAL PARK
3.4.1 Overview of Project The National Program for Rural Electrification with Renewable Energy in areas not covered by the Network (CONACE UNDP-GEF), implemented in Chirripó National Park, a micro hydroelectric power unit and solar panels to supply the energy needs to facilitate good housing conditions for rangers and tourists. The facilities for rangers and tourist, known as Centro Ambientalista el Paramo, has 15 rooms, 10 showers, 3 additional rooms for rangers and volunteers, 2 kitchen areas and a dining room. The current way of cooking is using propane gas for tourists and rangers. Previously, the illumination was performed using a PV system that lasted for two hours daily. The peak of visits to the hostel is 60 tourists daily. The transportation of goods (food, clothes, construction materials, etc) to the park is done by horses, but only from December to April. The micro hydropower plant allows the use of multiple appliances to a maximum daily consumption of 13.9 kW. Some of the appliances used are the following: a computer, a printer, an overhead projector or slides, a TV and VCR. For personal hygiene the rangers use a water heater and two thermal showers. In addition, there is a "coffee maker, blender, rice cooker, and refrigerator, kitchen with three disks, a washing machine and a dryer. The energy generated also supplies a telephone, a radio base, and the lighting of the facility which has 68 fluorescent lamps. Location: The tourist facilities are located in Chirripó National Park between coordinates south latitude 378 600 - 378 700 and west 517 450 - 517 650 (south Lambert coordinates) according to the San Isidro map sheet of the National Geographic Institute (IGN). The lodge is located at the right bank of Talari river, that belongs to the Rio Grande de Terraba basin on the South Pacific slope.

65
Case of Costa Rica – Part I and II
Figure 31. Chirripó National Park location. Source: http://www.maptak.com/cresp/pn/pn/5chri.html General Description: The tourist facilities of the park, are located at 16.5 km from the community of San Gerardo de Rivas, in San Isidro del General. Access to the lodge is by mountain trails which are exclusive for walkers throughout the year. During the summer, is possible to transport baggage by horses. The lodge has 15 rooms with two cabins and ten showers, three additional bedrooms for rangers and volunteers, and two kitchen areas, a dining room and an office. The maximum daily accommodation capacity is 60 tourists, who usually stay in the park for an average of two nights. Previous energy consumption: Before the construction of the micro hydroelectric power, a solar photovoltaic system provided the energy for 15 fluorescent lamps for two hours daily, and the use of a communication radio, a telephone, a TV and a radio cassette recorder, for a maximum of 8 hours per day. The food for the administrative staff was prepared using a propane gas stove. Topography: The information of the topographic features is based on the map San Isidro (3444 II), published by the National Geographic Institute of Costa Rica (IGN), scale 1: 50 000, with contour lines every 20 m.

66
Case of Costa Rica – Part I and II
3.4.2 Project Objectives The general objective of the project was to satisfy the energy needs of the park for lighting, cooking and food preparation, communication, laundry, entertainment, education, and other tasks. The specific objectives were:
• Find a place to develop a micro power plant that supplies the park lodge and determine the technical and economic feasibility of it.
• Submit the alternative of Photovoltaic System as an option of energy source and determine the respective investment costs for comparison with the previous point.
3.4.3. Stakeholder analysis Beneficiaries: In this case the beneficiaries of the project are Chirripó National Park staff, volunteers and tourists. The visitation to the park is close to 7000 people per year, according to the park manager, Bernal Valderrivas. Financiers: The investment for this project was provided by ICE Local Authorities: The authorities involved in this project were SETENA and MINAET
3.4.4 Legal aspects The National Development Plan Jorge Manuel Dengo Obregón, aims to reduce dependence on imported fuels, better use of renewable energy sources in the country and eventually produce 100% of the country's electricity from renewable energy sources (MIDEPLAN, 2007) The plan proposes to improve and restore the levels of reliability, quality and security of energy supply and reduce oil use in electricity production, laying the groundwork so that Costa Rica can become the first country to produce 100% of the electricity from renewable sources of energy for the year 2021. The plan proposes the creation of industrial synergies to reduce dependence on fossil fuels, as well as developing sustainable biomass to produce energy.

67
Case of Costa Rica – Part I and II
The energy policy included in 2007-2021 PNE poses to promote the development and use of new alternative energy sources through the implementation of projects using sources such as biomass. It also proposes the growing share of renewable sources and the use of biomass for a more efficient energy production. The Vision 2021 is a comprehensive planning effort aimed at determining the set of actions and projects that the Electricity Sector of ICE must undertake, at the strategic and organizational level to ensure the satisfaction of the national electricity demand by the predominant use of sources renewable energy. The National Climate Change Plan, propose by concrete actions, to reverse or prevent the increasing trends of GHGs in the atmosphere, developing strong technical and scientific bases that allow reconfiguration management tools (policies, plans, programs, projects) in order to prevent, mitigate or adapt to extreme climate changes This plan also aims to create a culture with greater knowledge and public environmental awareness through an understanding of current environmental problems and their relationship to health, economy and development of the human species. It also seeks to improve understanding of actions that can help prevent disasters and better understand the ecological and social systems. In terms of energy and power, the policies governing the sector are the following:
• In the Guideline No. 22 of April 23rd, 2003, the Executive Power requests to the members of the Electric Power Sub Sector to encourage the use of new technologies using new and renewable sources for electricity generation, which are technical, environmental and economically viable.
• The Business Plan of the National Electrical Planning (PDEN) proposes options for power generation that are technically, economically, environmentally and socially viable.
The environmental guidelines of ICE are the following:
• To promote research, development and use of other sources of renewable generation, as technologically and economically feasible, such as solar, wind, biomass, hydrogen, etc.
• To manage the electricity demand, in a program that includes the priority to create a culture of efficient energy use in the population.
The Sub-Commission of non conventional renewable sources, in its final report established the following recommendations:
• To introduce in the Costa Rican society the use of non-conventional renewable energies. Develop pilot projects that would not only demonstrate the use of these renewable energy sources but that the facilities provide data to specify in greater detail the contributions of these energies: advantages and disadvantages, in order to find more discretion to decide on future projects.

68
Case of Costa Rica – Part I and II
• Among the most important pilot projects are: installation of photovoltaic cells connected to the network and installing a gas engine that produces electricity from biogas, using the manure from a dairy or piggery.
• Public and private entities interested in developing non-traditional renewable technologies, must be encouraged through technical assistance. The private investment in this area would alleviate part of the required public investment.
• The disclosure about the benefits and challenges of power generation using
non-conventional sources should be done systematically and clearly. The public must have reliable data to not incur misunderstandings about the real possibilities of using these energies.
• For energies such as solar, thermal and biomass, its biggest contribution is
expressed as a reduction in electricity demand of the system. Solar energy for water heating and biomass for cooking are more efficient uses than the transformation of the energy into electricity. Therefore, the promotion of such uses is reducing the total power consumption, which is convenient for the country.
The project in question is being prepared in accordance with the policies and general guidelines of the National Development Plan (NDP), the National Energy Plan (NEP), Power Sector Vision 2021 and the National Strategy on Climate Change (ENCC)
3.4.5 Economical aspects The project has a cost of U.S. $ 228,000, which was funded by ICE. Maintenance costs are approximately $ 2,000 per year and are covered by the ICE. Maintenance is performed by a technician of ICE from Perez Zeledon, and is done once a year during the dry season, when no electricity is generated. With the supply of electricity in the lodge its possible to have access to computers with Internet, this service is free but eventually will be charged, which will generate additional revenue for the park. Work and project costs: The direct costs of the work involved: labor (wages, social charges and expenses), materials, transportation and construction equipment. Skilled workers from ICE were included in the project for the supervision and direction of each of the activities during the construction period. In addition, the administration of the park provided volunteers who helped with the construction. The working time was 26 days, and the work had a cost of $ 228,000.

69
Case of Costa Rica – Part I and II
PV system cost: A comparative analysis was conducted by ICE in order to define the most feasible alternative for the park. Therefore the cost of the solar photovoltaic system as well as the cost of the hydropower were calculated and compared. Considering 5 hours of sun per day to ensure the supply of energy, it would be necessary to have 1022 photovoltaic panels of 100 W of power each, 465 batteries with a capacity of 165 Ah/20 hours, 6 inversors and 122 drivers. This amount of material represents an investment cost of U.S. $ 897 728. This cost does not consider relocation expenses for materials and metallic structures for protection and support of the photovoltaic panels as well as warehouses and land for an equivalent area of 1600 m2. Comparatively, the results proved that the best option is the implementation of the micro hydroelectric power as renewable energy source. With this project it has been possible to obtain better quality and quantity of electricity that meets most of the needs required by the park management. Operating and maintenance costs: Expenditures for operation and maintenance for the hydropower unit is $ 2000 per year. For the maintenance of the photovoltaic system, is necessary to replace the equipment with the following frequencies: battery, 3 year, controllers, 4 years and inversors every 4 years. An influential point of the investment cost was the issue of transportation of materials and generation equipment to the lodge. In this respect, the National Park Administration financed the activity, helping to maintain the profitability of the project. The participation of volunteers during the construction of the project allowed maintaining the economic benefits of the project. Table 10. Schedule of activities for the development of the hydraulic power unit
Activity Runtime (days) Preliminary activities 1 Clean Access 1
Dam and water intakes 21
Dam excavation MD 3
Placement of gabions 6
Dam excavation MI 2
Placement of gabions 4
Intake construction 6 Conduction 11
Channel cleaning 2
Trench digging 6
Pipe Installation 3
Powerhouse 10

70
Case of Costa Rica – Part I and II
General Cleaning 1
Excavation of foundations 1
Concrete foundations 3
Construction of walls and ceilings 2
Generating equipment installation 3 Tailrace 4
Cleaning 2
Channel Excavation 2
Source: Own elaboration according to the documents of the project. The total time of these works were 24.5 days. Economic Impacts: For Chirripó National Park there is no economic impact since there is not a substitution of an energy source. Before the hydropower unit was installed, the lodge used solar panels that provided energy for two hours per day.
3.4.6 Technological Aspects The preliminary survey of both the flowing profile and the cross section of the dam site was performed with a Garmin GPS 12XL, topography scope and hand level, locally referenced to sea level. Hydrology: The Department of Hydrology of the Center for Basic Research Department, UEN Projects and Services Associates (PSA) of ICE, supplied the hydrological information of the Talari river. The information was gathered upstream from the proposed dam site area. These data include daily average flow for a total period of 32 years (from 1971 to 2002), based on the station fluviográfica Rivas (98-31-08) located on the river Chirripó Pacific. Design Flow: For the design of the different components of the dam, the minimum flow, which is 0.10 m3 / s (100 lt / s), was considered. Power and energy demand: Before the implementation of the micro hydropower station, the energy was supplied by 18 photovoltaic panels, thus giving energy to 15 fluorescents, radio communication, a telephone, a TV and a radio cassette. To replace this source, a micro hydropower station was implemented , which can meet the current electricity demand, which was calculated by the use of the following

71
Case of Costa Rica – Part I and II
appliances:
• TV,
• VCR
• Radio cassette,
• Overhead projector,
• Projector,
• Coffee maker
• Washing machine
• Clothes dryer,
• Three-disc kitchen,
• 68 fluorescent lamps
• Computer and its corresponding printer
• Radio communication
• Refrigerator of 10 cubic feet of capacity,
• Telephone,
• Blender,
• Mixer,
• Two heat showers
• Water heater
• Electric griddle and
• Rice pot The following table presents the distribution of daily consumption of electrical appliances in the lodge. The maximum demand of these appliances is 13.9 kW per day.

72
Case of Costa Rica – Part I and II
Table 11. Distribution of daily consumption of electrical appliances in the park lodge. (Source: own elaboration according to the documents of the project).
Appliance Quantity Watts Hour distribution for a day of consumption
1 2 3 4 5 6 7 8 9 10 11 12 13 14 15 16 17 18 19 20 21 22 23 24
Coffee maker 1 1100 1100 1100
Washing machine 1 1200 1200 1200 1200
Drier 1 6240 6240 6240 6240
TV, 1 90 90 90 90 90 90 90 90 90 90 90 90
VCR 1 60 60 60 60 60 60 60
3-disc kitchen, 1 3600 3600 3600 3600 3600
fluorescent lamps 68 20 1360 1360 1360 1360 1360 1360 1360 1360
Desktop 1 350 350 350 350 350 350 350 350 350 350 350
Laptop 1 60 60 60 60 60 60 60 60 60 60 60
Projector, 1 540 540 540 540 540 540 540
Water heater 1 3000 3000 3000
Radio 1 45 45 45 45 45 45 45 45 45 45 45 45 45 45 45 45 45 45 45 45 45 45 45 45 45
Refrigerator 1 506 506 506 506 506 506 506 506 506 506 506 506 506 506 506 506 506 506 506 506 506 506 506 506 506
Telephone, 1 2500 2500 2500 2500 2500 2500 2500 2500 2500 2500 2500
Printer 1 48 48 48 48 48 48 48 48 48 48 48
Blender, 1 1500 1500 1500
Mixer, 1 170 170 170
Heat showers 2 4000 8000 8000 8000 8000 8000
Radio 1 20 340 340 340 340 340 340 340 340
Iron 1 1100 1100 1100 1100 1100
Rice pot 1 800 800 800 800 800

73
Case of Costa Rica – Part I and II
Of the above table:
• Maximum power required (W): 13941
• Minimum power demand (W): 551 The maximum capacity of the installation is 15.5 kW, for which water is taken from the Talari River, whose basin is close to the park lodge. The dimensions of the dam are 2.5 m high by 8 m long at the crest. The powerhouse, has two generators Banki with cross flow of 7.9 kW, designed for a gross fall of 23 m and a flow design of 100 lt / s. The energy transfer to the lodge, was done by laying underground three-wire single phase 240 V, for a total length of approximately 100 m of wiring. The dam was built with baskets stuffed with river rough stone, similar to Maccferri gabion with galvanized wire and coated with PVC. Each gabion is 1 x 1 x 2 m and these are supported on the base with Maccaferri mattresses with PVC galvanized wire. The preliminary dimensions of the dam were 2.5 m high by 8 m long at the crest. In the upstream face of the dam, a particular type of waterproof plaster coating was placed to protect the gull of flooding. At the bottom of the dam, a pipe was placed with a discharge gate. At the right bank of the river, the water intake was placed, which has an entry grid. The intake is a chamber of 1.32 x 1.32 x 2 m. Conduction is done by means of two PVC pipes. A first section is 152 m long (gravity flow); with a pipe of 20 cm of inner diameter that meets ASTM D3034, with quick coupling and double neoprene gasket. The second one is a high pressure pipe with 25 cm in diameter and a length of 54 m. The pipe is protected with synthetic fabric similar to the type GeoMatrix to prevent deterioration by the action of sunlight and has anchor blocks of concrete with steel rods in a "U" shape every 20 m in the direction changes. The water is transported up to the powerhouse, which has two generating units (Banki, cross flow) of 7.9 kW, designed for a gross fall of 23 m and 100 lt / s design flow. The total design capacity of the micro is 15.8 kW. The dimensions of the powerhouse are 4 x 5 m, with cement walls mounted on a reinforced concrete structure.

74
Case of Costa Rica – Part I and II
3.4.7 Environmental Aspects Positive environmental impacts: With this technology is possible to avoid the generation of atmosphere pollutants. With this project the Chirripo National Park avoid the generation of 74.25 tons of carbon dioxide per year. Negative environmental impacts: No negative environmental impacts have been identified related with the project.
3.4.8. Social Aspects The social stakeholders involved in this project were:
• The Instituto Costarricense de Electricidad.
• Chirripo National Park.
• Horsemen's Association of San Gerardo de Rivas The social benefits obtained are:
• There is access to energy 24 hours a day.
• Improves attention for tourists, since there is light in each room at night and acces to internet.
• Improved working conditions for park rangers.
3.4.9. Replicability This project is considered to be replicable for the following reasons.
• Micro hydropower is cheaper than other renewable energy alternatives.
• Nationally there are conditions for this type of technology such as high rainfall and rugged topography.
• Systems require little maintenance and little training for people who are in charge of these facilities.
• Nationally there is easy access to equipment for micro hydro power plant construction.
• It’s very important to replicate this project in protected areas, since the technology doesn’t make noise. Fuel plants on the other hand affects biodiversity for the loud noises that it makes.
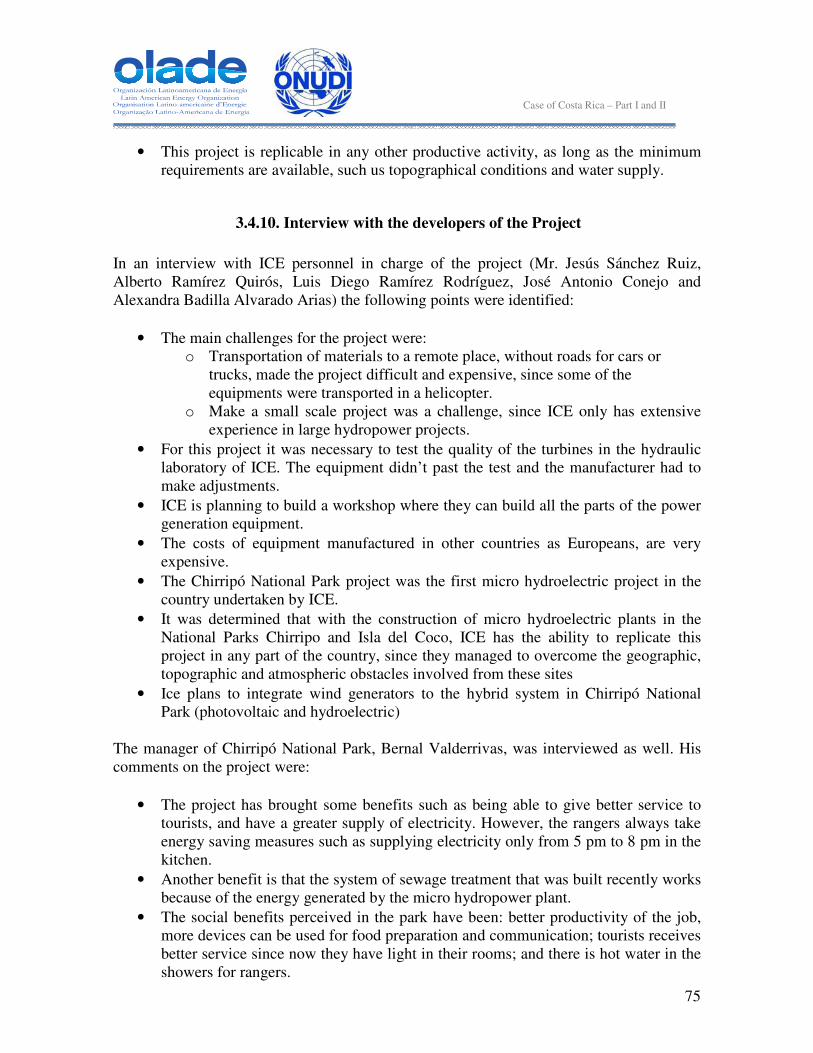
75
Case of Costa Rica – Part I and II
• This project is replicable in any other productive activity, as long as the minimum requirements are available, such us topographical conditions and water supply.
3.4.10. Interview with the developers of the Project In an interview with ICE personnel in charge of the project (Mr. Jesús Sánchez Ruiz, Alberto Ramírez Quirós, Luis Diego Ramírez Rodríguez, José Antonio Conejo and Alexandra Badilla Alvarado Arias) the following points were identified:
• The main challenges for the project were: o Transportation of materials to a remote place, without roads for cars or
trucks, made the project difficult and expensive, since some of the equipments were transported in a helicopter.
o Make a small scale project was a challenge, since ICE only has extensive experience in large hydropower projects.
• For this project it was necessary to test the quality of the turbines in the hydraulic laboratory of ICE. The equipment didn’t past the test and the manufacturer had to make adjustments.
• ICE is planning to build a workshop where they can build all the parts of the power generation equipment.
• The costs of equipment manufactured in other countries as Europeans, are very expensive.
• The Chirripó National Park project was the first micro hydroelectric project in the country undertaken by ICE.
• It was determined that with the construction of micro hydroelectric plants in the National Parks Chirripo and Isla del Coco, ICE has the ability to replicate this project in any part of the country, since they managed to overcome the geographic, topographic and atmospheric obstacles involved from these sites
• Ice plans to integrate wind generators to the hybrid system in Chirripó National Park (photovoltaic and hydroelectric)
The manager of Chirripó National Park, Bernal Valderrivas, was interviewed as well. His comments on the project were:
• The project has brought some benefits such as being able to give better service to tourists, and have a greater supply of electricity. However, the rangers always take energy saving measures such as supplying electricity only from 5 pm to 8 pm in the kitchen.
• Another benefit is that the system of sewage treatment that was built recently works because of the energy generated by the micro hydropower plant.
• The social benefits perceived in the park have been: better productivity of the job, more devices can be used for food preparation and communication; tourists receives better service since now they have light in their rooms; and there is hot water in the showers for rangers.

76
Case of Costa Rica – Part I and II
• The plant has been used to educate tourists, since rangers sometimes take tourists to the plant to give an explanation of the project and the environmental benefits it brings to the park.
The only negative aspect perceived by the administrator of the park is in summer, from January to March or April, when the water flow in the river decreases and hence is not possible to generate electricity. For this time of the year the park uses a diesel plant. Solar panels help to generate a limited amount of energy that must be supplemented with the fuel plant.
3.4.11. Interview with the Director of the Subsectorial Energy Planification Department of Costa Rica (DSE)
In the interview with Gloria Villa, who is in charge of the DSE, emphasized the following points for this project:
• Currently there are no other proposals for similar projects in other national parks. This type of project has only been implemented in the national parks Coco Island and Chirripó.
• Projects on national parks can only make use of energy within the park and can not connect to the network.
• The power generation projects in national parks are delicate issues and each case must be analyzed separately and in detail.
• It is an excellent example of how local resources can be used to generate energy without adverse environmental impacts.
• The national policy is to support small and large hydro developments.
3.4.12. Project selection This project was selected for the following reasons:
• The project is installed in a national park, which is an excellent example to follow in other protected areas, since these sites must be particularly careful with regard to prevention of pollution of the environment. There is a similar project in Coco Island National Park.
• There is sufficient and accessible information to meet the requirements of this project. In Costa Rica there are many similar projects in the private sector but the access to the information is difficult. Information was sought on for a project in a hotel in the south of Costa Rica, where two turbines were installed to generate electricity in a local stream, but both the owner and the company that installed the system were not willing to share information.

77
Case of Costa Rica – Part I and II
3.4.13. Photography
Figure 32. Centro Ambientalista el Páramo. Lodge for 60 visitors, with 15 rooms, 10 showers, 3 additional rooms for staff and volunteers, kitchen area and living room.
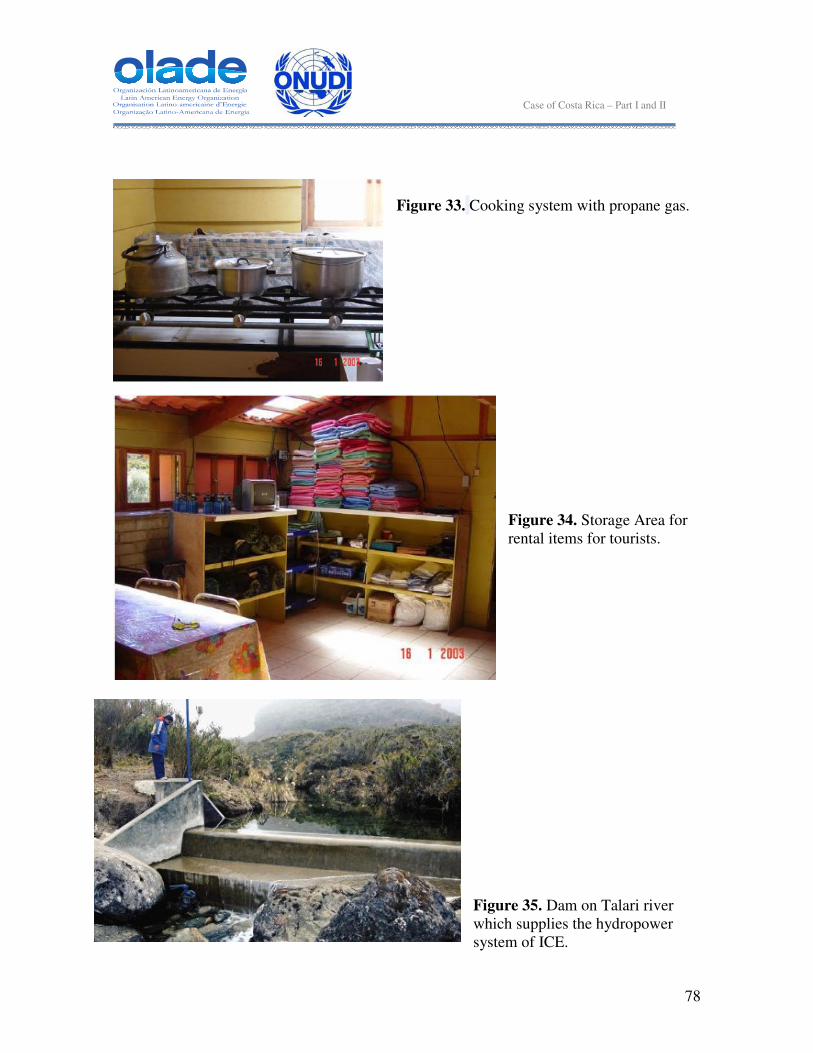
78
Case of Costa Rica – Part I and II
Figure 33. Cooking system with propane gas.
Figure 34. Storage Area for rental items for tourists.
Figure 35. Dam on Talari river which supplies the hydropower system of ICE.

79
Case of Costa Rica – Part I and II
Figure 36. Micro hydroelectric power at Chirripó National Park
Figure 37. Internet access for staff and visitors from the park lodge
Source: Consultant of CEGESTI, Francisco Naranjo

80
Case of Costa Rica – Part I and II
3.5 CASE 3: SELF-SUFFICIENT HOUSE INBIOPARQUE – COMPAÑÍA NACIONAL DE
FUERZA Y LUZ
3.5.1. Project Description Location: The project was developed in INBioparque, specifically in the facilities of the room El Jícaro, which is located in the northwest of the park, near area called Finca. Figure 1 shows the self-sufficient house.
Figure 38. Self-sufficient house in INBopark. (Source: Consultant of CEGESTI, Francisco Naranjo) General description: This project was created in order to demonstrate the use of small wind and solar systems integrated into the network, as well as the energy savings that allows sustainable development without sacrificing the well-being or normal activities in a house. The house shows other environmental practices such as recycling, use of wastes generated in the house and collection of rain water. The main sources of energy in the home are:
• A vertical axis wind turbine that transforms wind energy into electricity. • Photovoltaic modules that convert sunlight into electricity.

81
Case of Costa Rica – Part I and II
• A digester that generates electricity and uses organic waste to create biogas for cooking.
The electricity generated by these systems is stored in batteries that last for up to two days, so if during a day there is not enough solar radiation or wind, the stored energy is sufficient to operate the appliances. For light during the day, the house was designed to not use any bulb, but provided enough light from the sun, for which large windows were installed throughout the house, several skylights were installed, some more sophisticated, such as diffusing or insulating sheets, and more economic, such as plastic bottles with water and chlorine in the ceiling. Furthermore, to avoid the excessive heat generated in the home because the abundant entry of light, there are fans placed on the roof that keeps the air fresh. For evenings, the house is equipped with various compact fluorescent lamps that are less energy demanding than conventional incandescent bulbs, and the house also has switches which have the ability to be connected with an automatic sensor mode, so the light will stay on as long as the sensor detects motion. This model home also has technology to make efficient use of water such as: the collection of rainwater, a water recycler that treats the water from laundry and dish washing, and that is subsequently used in toilets. The house water is heated by two systems, one more expensive than the other. The first one cost between $1800 and $2500, while the other was made with plastic bottles. The electricity generated in the house is used to charge an electric vehicle that can be used for 40 km without fossil fuels. Description of the self sufficient house: Rooms of the house The self sufficient house has quarters of an average house which is inhabited by 3 or 4 members, 2 adults and one or 2 children. The following figures show the rooms of the self sufficient house
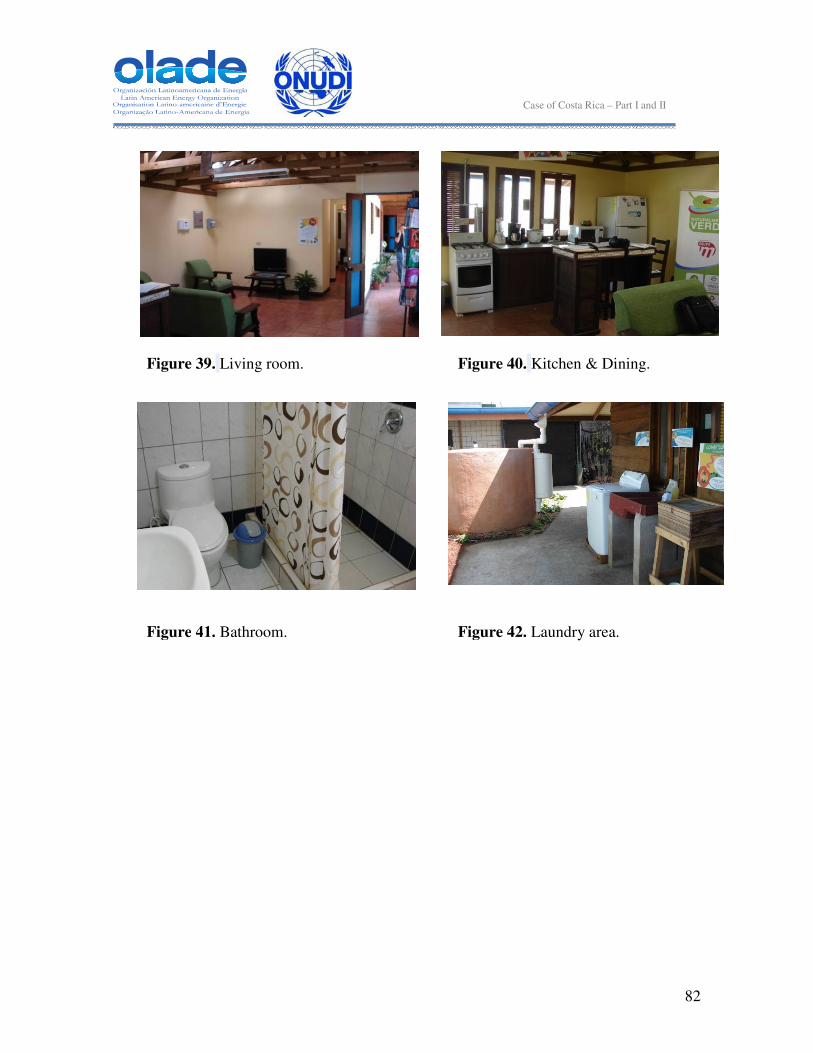
82
Case of Costa Rica – Part I and II
Figure 40. Kitchen & Dining.
Figure 41. Bathroom. Figure 42. Laundry area.
Figure 39. Living room.

83
Case of Costa Rica – Part I and II
Source: Consultant of CEGESTI, Francisco Naranjo.
Figure 43. Main room.
Figure 44. Children room.
Figure 45. Electric-car garage.
Figure 46. Area for power generation
technologies and water filtration.
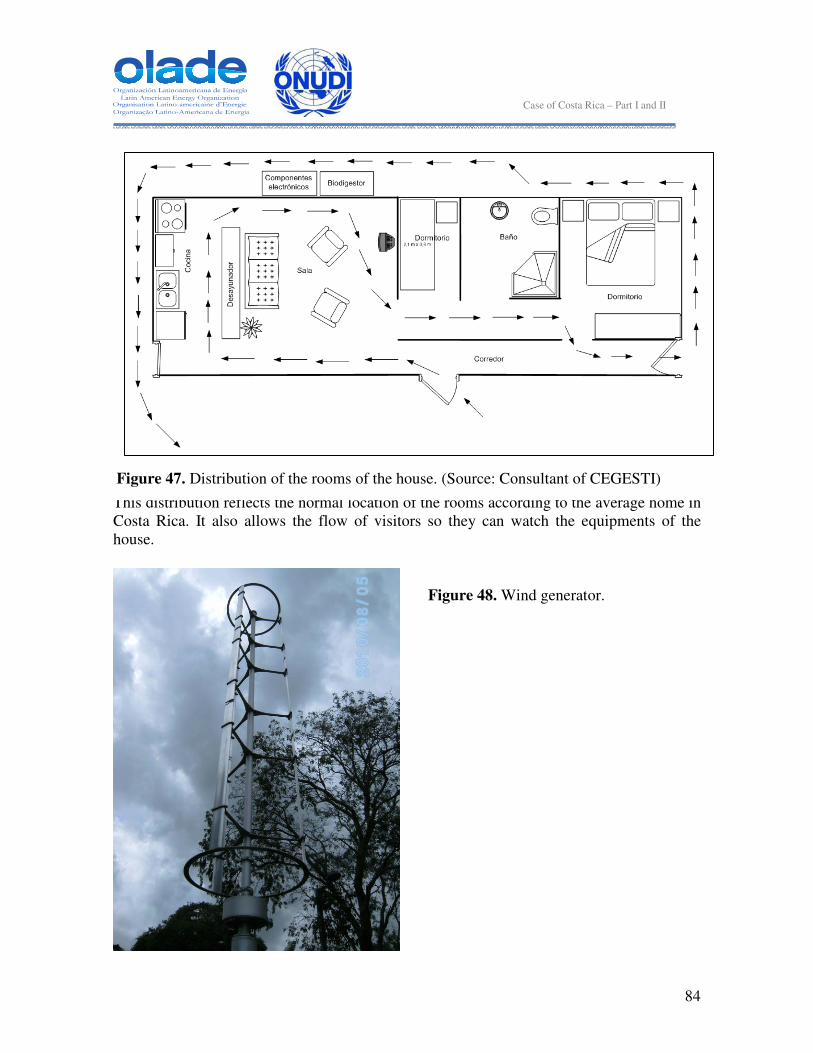
84
Case of Costa Rica – Part I and II
This distribution reflects the normal location of the rooms according to the average home in Costa Rica. It also allows the flow of visitors so they can watch the equipments of the house.
Figure 47. Distribution of the rooms of the house. (Source: Consultant of CEGESTI)
Figure 48. Wind generator.

85
Case of Costa Rica – Part I and II
Figure 49. Economic water heater,
constructed with plastic bottles.
Figure 50. High tech water heater.
Figure 51. Solar kitchen.

86
Case of Costa Rica – Part I and II
Figure 52. Digester, which is fed with organic waste from the
house.
Figure 53. Kitchen works with biogas
from the digester.

87
Case of Costa Rica – Part I and II
Figure 54. Appliances used at the
self-sufficient home.
Figure55. Clothes dryer.
Figure 56. Economic skylight made from plastic bottles, which contain chlorinated water.

88
Case of Costa Rica – Part I and II
Source: Consultant of CEGESTI, Francisco Naranjo.
Figure 57. Skylight brand Solatube
Figure 58. Skylight sheet.
Figure 59. Solar panels

89
Case of Costa Rica – Part I and II
3.5.2. Project Objectives General objective: Promote projects on renewable energy and recycling waste in order to collaborate with sustainable development. Specific objectives:
A. Create a prototype house in harmony with nature with educational purposes. B. Make a comfortable environment for visitors. C. Explore and utilize the latest technologies for power generation and energy saving. D. Give talks on alternative energy and energy saving. E. Keep track of the performance of each of the technologies used in self-sufficient home. F. Provide advice to clients who wish to use these types of technologies in their homes. G. Analyze the possibility to supply excess of electricity to the network, creating a small business for those interested.
3.5.3. Stakeholder analysis Beneficiaries of the project: Because of the nature of the project, the main beneficiary is the general population, specifically, those who visit INBioparque, which usually come from universities, technical colleges, schools, businesses and tourists. The house is interconnected to the national grid, thus contributing, at least symbolically, to meet the energy needs of Costa Ricans. Financiers of the project:
• INBio - infrastructure (the house already existed), ground maintenance (cleaning, maintenance of vermicompost and digester).

90
Case of Costa Rica – Part I and II
• CNFL - investment in the house to adapt new technologies, labor, equipment, placement of a person to serve the public.
• Private Providers - Equipment for the house: i.e.: solar panels, appliances, etc..
3.5.4. Legal aspects The National Development Plan Jorge Manuel Dengo Obregón, aims to reduce dependence on imported fuels, better use of renewable energy sources in the country and eventually produce 100% of the country's electricity from renewable energy sources (MIDEPLAN, 2007) The plan proposes to improve and restore the levels of reliability, quality and security of energy supply and reduce oil use in electricity production, laying the groundwork so that Costa Rica can become the first country to produce 100% of the electricity from renewable sources of energy for the year 2021. The plan proposes the creation of industrial synergies to reduce dependence on fossil fuels, as well as developing sustainable biomass to produce energy.
The energy policy included in 2007-2021 PNE poses to promote the development and use of new alternative energy sources through the implementation of projects using sources such as biomass. It also proposes the growing share of renewable sources and the use of biomass for a more efficient energy production. The Vision 2021 is a comprehensive planning effort aimed at determining the set of actions and projects that the Electricity Sector of ICE must undertake, at the strategic and organizational level to ensure the satisfaction of the national electricity demand by the predominant use of sources renewable energy. The National Climate Change Plan, propose by concrete actions, to reverse or prevent the increasing trends of GHGs in the atmosphere, developing strong technical and scientific bases that allow reconfiguration management tools (policies, plans, programs, projects) in order to prevent, mitigate or adapt to extreme climate changes This plan also aims to create a culture with greater knowledge and public environmental awareness through an understanding of current environmental problems and their relationship to health, economy and development of the human species. It also seeks to improve understanding of actions that can help prevent disasters and better understand the ecological and social systems. In terms of energy and power, the policies governing the sector are the following:

91
Case of Costa Rica – Part I and II
• In the Guideline No. 22 of April 23rd, 2003, the Executive Power requests to the members of the Electric Power Sub Sector to encourage the use of new technologies using new and renewable sources for electricity generation, which are technical, environmental and economically viable.
• The Business Plan of the National Electrical Planning (PDEN) proposes options for power generation that are technically, economically, environmentally and socially viable.
The environmental guidelines of ICE are the following:
• To promote research, development and use of other sources of renewable generation, as technologically and economically feasible, such as solar, wind, biomass, hydrogen, etc.
• To manage the electricity demand, in a program that includes the priority to create a culture of efficient energy use in the population.
The Sub-commission of non conventional renewable sources, in its final report established the following recommendations:
• To introduce in the Costa Rican society the use of non-conventional renewable energies. Develop pilot projects that would not only demonstrate the use of these renewable energy sources but that the facilities provide data to specify in greater detail the contributions of these energies: advantages and disadvantages, in order to find more discretion to decide on future projects.
• Among the most important pilot projects are: installation of photovoltaic cells connected to the network and installing a gas engine that produces electricity from biogas, using the manure from a dairy or piggery.
• Public and private entities interested in developing non-traditional renewable technologies, must be encouraged through technical assistance. The private investment in this area would alleviate part of the required public investment.
• The disclosure about the benefits and challenges of power generation using non-
conventional sources should be done systematically and clearly. The public must have reliable data to not incur misunderstandings about the real possibilities of using these energies.
• For energies such as solar, thermal and biomass, its biggest contribution is expressed as a reduction in electricity demand of the system. Solar energy for water heating and biomass for cooking are more efficient uses than the transformation of the energy into electricity. Therefore, the promotion of such uses is reducing the total power consumption, which is convenient for the country.

92
Case of Costa Rica – Part I and II
The project in question is being prepared in accordance with the policies and general guidelines of the National Development Plan (NDP), the National Energy Plan (NEP), Power Sector Vision 2021 and the National Strategy on Climate Change (ENCC)
3.5.5. Economical aspects The investment of this project was provided by the INBioparque and Compañía Nacional de Fuerza y Luz (CNFL). The house was built before the project started. Therefore, the investment was mostly in making the necessary changes to convert the house into a self-sustaining one. The investment was approximately 35 million colones, which was designated for repairs, equipment, furniture, electrical, water treatment, among others. As explained above, many of the tools available in the house (energy-efficient appliances, water purification equipment, etc.) were given by private providers in exchange for marketing through visual signs in the house. The cost of renewable energy equipment was 29 million colones. Maintenance (cleaning) of the house is done by the staff of INBio twice a day. Apart from this, maintenance in technical terms is given by two engineers of CNFL (Leonardo Chavarria and Max Gaston). On the other hand, most of the appliances installed by providers have warranties, and these companies offer maintenance as well. Economic impact: Since the main purpose of the self-sustainable home is education, there is no economic benefit from using these alternatives. The economic benefit is given by the visitation to the site.
3.5.6. Technological aspects
Electricity generation: To make the house self-sufficient in electricity, it was assumed that two adults and two children live in the house, which in total consumes about 300 kWh per month (not counting the hot water, cooking and using energy efficient lighting). For this demand the following equipments were required:
• A photovoltaic system with capacity to generate approximately 5 kWh per day, which means 150 kWh per month. For this reason a photovoltaic system of 1 kW was installed.

93
Case of Costa Rica – Part I and II
• A wind generation system capable of generating 3 kWh per day, ie 100 kWh per month. For this reason a generator with a capacity of 1.2 kW was installed.
One aspect to consider with respect to self-generation, is that when there is excess of electricity due to the lack of domestic consumption in the house, the electricity is injected into the network, thus the house becomes a small generator. On the other hand, when there is no electricity on the grid and there is not sun or wind, the house has a backup power with a battery bank, which has the ability to keep the applications that require electricity useful for up to two days. Powered appliances: The electricity for the house is generated by two systems:
• 1 wind turbine - generates 1200W • 8 solar panels (solar photovoltaic) - generates 1.080W (135W each)
These equipments feed all appliances (refrigerator, coffeemaker, rice cooker, blender, television, computer), outlets, lighting system, security system (alarm), water pumps and electric truck load. The kitchen has two discs that are fed with gas cylinders and two that are fed with the biogas from the digester. The amount of biogas generated is sufficient to use the kitchen for two hours daily. Balance supply - demand of energy: The house is interconnected to the national grid. When there is a surplus is sold to ICE.
3.5.7. Environmental aspects This project has been designed in order to comply with the Code of Good Practices of the CNFL, as well as other legislation in the country (health and safety, legal, environmental, economic and financial management)

94
Case of Costa Rica – Part I and II
Environmental considerations for the battery bank of hybrid system (Wind-PV) Since the battery bank is a sensitive component from the environmental point of view because of the possibility of acid spills and to a lesser extent, the emission of gases, a metal cabinet was placed in the bottom, with closed-roof and with ventilation. This system was placed outside the house, over cemented floor. For contingencies purposes, the cabinet has a metal base where batteries were placed, also the floor is 2 inches above of soil. This would allow to retain an eventual spill and prevent soil contamination. Among the positive environmental impacts achieved with the project are the education and promotion of good practices such as energy conservation, renewable energy, recycling and reuse of wastes.
3.5.8. Social aspects Visitors are the most benefited with this project, since they receive education about renewable energy and other issues related to sustainable practices with the environment. Averages of 15000 people visit this project per year. The stakeholders involved in this project were:
• INBioparque • Compañía Nacional de Fuerza y Luz
3.5.9. Replicability Since this project has renewable energy technologies of various costs, the capacity to replicate it will depend on the purchasing power of individuals or companies. Some renewable energy technologies like solar panels and wind generators are expensive, and from the economic point of view do not compete with conventional technologies. In many cases, these technologies are implemented because of environmental commitment or lack of access to the power grid. The project as such, is considered replicable because of its great educational importance, so it is necessary to establish this type of models in different countries of the region to raise awareness of alternative friendly energy.

95
Case of Costa Rica – Part I and II
3.5.10. Interview with the entrepreneurs of the project. In an interview with Ingrid Redondo (Customer service Self-Sufficient house INBioparque) mentioned that the biggest challenge is to sell the idea to others. As a small-scale demonstration project the challenges are to change the mentality of people, demonstrating the benefits of these technologies and make the project replicable. Another interview was held with Alfonso Herrera from CNFL, who pointed out the following aspects of project:
• The wind generator was placed for demonstration purposes, but does not give very good results at the site where there is not enough wind.
• There were no difficulties in developing the project.
• INBio was a great support that showed great commitment and enthusiasm to the idea for the self-sustainable home.
• The house shows to visitors that not all renewable energy alternatives are expensive. For example: water heater with plastic bottles and lighting during the day with different type of skylights.
• The support of the private and public sector is necessary in order to finance the more expensive alternatives such as solar panels and wind generators.
3.5.11. Interview with the Director of the Subsectorial Energy Planification Department of Costa Rica (DSE2)
In the interview with Gloria Villa, who is in charge of the DSE, emphasized the following points for this project:
• It is a very important demonstration project that shows that one can maintain a sustainable house with economic alternatives
• The problem is the cost of the more expensive technologies such as photovoltaic and wind systems, for which subsidies are needed, but also a greater demand to lower the prices.
• Currently there is a similar project that its being set up at the Marine Park in Puntarenas.
• The self-sustaining house at INBio has been visited by representatives of the ministries of energy of other countries and by international agencies such as the Latin American Energy Organization.
• The repeatability of this project in the region is of paramount importance to educate people about the different alternatives that exist to use technology more environmentally friendly at home.
2 Acronym for Dirección Sectorial de Energía

96
Case of Costa Rica – Part I and II
3.5.12. Project selection This project was selected for the following reasons:
� The project includes several renewable energy alternatives, which gives much value to select it for this document.
� There are other projects that are hybrids like INBioparque, however, since this is an educational project conducted by CNFL, there is enough information available to comply with the requirements of this investigation.
� The project is located near San José, which facilitated the site visit and interviews with personnel in charge of it.
3.6 LESSONS LEARNED Here are the lessons learned from the three projects
3.6.1 Power generation with biogas in SERMIDE farm This project has the potential to make big profits in the area of electricity generation, but there is still an economic obstacle which does not permit the completion of the project. This aspect was not analyzed at the beginning of the project, which demonstrates the need for further advice on the technology with institutions or companies in other countries that have extensive experience in the field. Digester technology brings significant environmental, agricultural and social benefits, so its replication is important. Electricity generation with biogas in Costa Rica is a pending issue for the economic barrier that has to overcome. But the point is that the resource is at hand and it is an alternative for generating electricity, not only for the swine sector, but also poultry and livestock.
3.6.2 Hydropower generation in Chirripó National Park Hydroelectric generation project in Chirripó is a great way to meet national strategies to provide electricity in areas that are not connected to the network with renewable sources. This project is an excellent example of how to generate electricity in protected areas, because with this technology there is not a negative impact, as there is when fuel plants are used. Also the risk related with fuel transportation is eliminated or reduced. This example shows the importance of using the resources and advantages of Costa Rica and other areas of the region for hydroelectric generation, not only in protected areas, but

97
Case of Costa Rica – Part I and II
also other industries such as hotels, farms, factories, houses, and any other activity that is located near sources of water with sufficient flow and with the topographic conditions necessary. According to interviews conducted to ICE personnel in charge of the project, one of the lessons learned is to produce the turbines in the workshops of ICE, since equipment from other countries are quite expensive. On the other hand, there aren’t hydraulic laboratories in the country to test the quality of these equipments.
3.6.3 Self-Sufficient House in INBioparque This information was not provided by the entrepreneurs of the project. Project managers at CNFL request the questions for the project in writing and then sent the most of the answers needed via email. But did not include aspects related to the lessons learned.

98
Case of Costa Rica – Part I and II
SOURCES OF INFORMATION:
� BUNCA, 2001. Guía para desarrolladores de proyectos de generación de energía
eléctrica utilizando recursos renovables en Costa Rica. Available at: http://www.bun-ca.org/publicaciones/CR.pdf (accessed on July 5th, 2010).
� Cañas, I. 2008. Generación de energía eléctrica a partir del biogás obtenido de las
excretas del cerdo. Alianza en Energía y Ambiente con Centroamérica. Costa Rica, ICE-COMCURE.
� Cañas, I. 2009. Producción de electricidad con biogas. Instituto Costarricense de
Electricidad.
� Camacho, A., 2010. Empresas ticas se apuntan a plataforma de energías renovables. Diario El Financiero. 06 de julio. Available at: http://www.elfinancierocr.com/ef_archivo/2010/julio/11/negocios2437442.html (accessed on July 8th, 2010).
� Castro, J., 2010. Sector eléctrico ocupa $9 mil millones. Diario Extra. 08 de julio.
Available at: http://www.diarioextra.com/2010/julio/08/nacionales10.php (accessed on July 8th, 2010).
� CEPAL, 2007. Estrategia Energética Sustentable Centroamericana 2020. Available
at: http://www.enee.hn/PDFS/EstrategiaCentroamericana2020.pdf (accessed on July 1st, 2010).
� CEPAL, 2007. Istmo Centroamericano: Estadísticas del Subsector Eléctrico (Datos
actualizados a 2007). Available at: http://www.eclac.org/publicaciones/xml/0/34230/L883.pdf (accessed on June 15th, 2010).
� CEPAL, 2010. CEPALSTAT. Available at: http://www.eclac.org/estadisticas/
(accessed on June 18th, 2010).
� Chinchilla, L., 2010. El futuro energético de Costa Rica. Diario La Nación, Costa Rica. Diario La Nación. July 4th, 2010. Available at: http://www.nacion.com/2010-07-04/Opinion/Foro/Opinion2433870.aspx (accessed on July 7th, 2010).
� CIA, 2010. The World Factbook. Available at:
https://www.cia.gov/library/publications/the-world-factbook/ (accessed on June 6th, 2010).
� El Financiero, 2010. Costa Rica se Apaga. San José, Costa Rica: Grupo Nación.

99
Case of Costa Rica – Part I and II
� Grupo ICE, 2003. Informe de factibilidad para la instalación de una central micro hidroeléctrica. Centro Ambientalista el Páramo. Parque Nacional Chirripó. Programa nacional de electrificación con base en fuentes de energía renovable en áreas no cubiertas por la red.
� Grupo ICE, 2009. Plan de Expansión de la Generación Eléctrica Período 2010-
2021. Available at: http://www.grupoice.com/esp/ele/planinf/docum/plan_ expansion_generacion_09.pdf (accessed on July 1st, 2010).
� Grupo ICE, 2009. Sistema Eléctrico Nacional, Costa Rica. Available at:
http://www.oc.org.do/download/Presentacion_Sector_Electrico_Costa_Rica_2009.ppt (accessed on July 1st, 2010).
� Grupo ICE, 2010. Costa Rica: Porcentaje de Cobertura Eléctrica. San José, Costa
Rica: Grupo ICE.
� Grupo ICE, 2010. Plan Piloto de Generación Distribuida para Autoconsumo. Available at: http://www.grupoice.com/esp/temas/so_plan_piloto/so_plan_piloto _generacion_distribuida.html (accessed on November 16th, 2010).
� Herrero, F., 2007. Energía Renovable en Costa Rica: Los Retos de Hoy. ARESEP.
� La Gaceta. 2010. Modificación del artículo 38 de la ley no. 7447, para incentivar el
desarrollo y la utilización de fuentes renovables de energía. Diario La Gaceta. July 6th, 2010. Available at: http://www.gaceta.go.cr/pub/2010/06/30/COMP_30_ 06_2010.pdf (accessed on July 8th, 2010).
� Loaiza, V.; Agüero, M., 2010. País procura elevar generación energética con viento,
gas y sol. Diario La Nación. June 12th, 2010. Available at: http://www.nacion.com/2010-06-12/ElPais/NotaPrincipal/ElPais2375287.aspx (accessed on July 1st, 2010).
� Mata, E. 2009. Gobierno impulsa ley para abrir mercado eléctrico. Diario La
Nación. August 27th, 2010. Available at: http://wvw.nacion.com/ln_ee/2009/agosto/ 27/pais2066378.html (accessed on June 15th, 2010).
� MICIT, 2008. Indicadores Nacionales 2006 – 2007. Ciencia, Tecnología e
Innovación: Costa Rica. Available at: http://www.micit.go.cr/index.php/docman/ doc_details/77-indicadores-nacionales-2006-2007-ciencia-tecnologia-e-innovacion-costa-rica.html (accessed on July 1st, 2010).
� MINAE, PNUD, FMAM. (without date). Programa de electrificación nacional con energías renovables en áreas no cubiertas por la red COS/02/G31 00034921. Available at: http://www.dse.go.cr/es/05UsoRacEnerg/04FNRE/ProyectoElectrificacionRural.pdf, (accessed on August 1st, 2010).

100
Case of Costa Rica – Part I and II
� Molina, A., 2009. Balance Energético Nacional 2008. San José, Costa Rica:
MINAET – DSE.
� Molina, A., 2010. Balance Energético Nacional 2009. San José, Costa Rica: MINAET – DSE. (not published).
� MINAET – IMN, 2009. Segunda Comunicación Nacional a la Convención Marco
de las Naciones Unidas sobre Cambio Climático, Costa Rica 2009. Available at: http://cglobal.imn.ac.cr/Pdf/comunicacion/Segunda%20Comunicaci%C3%B 3n%20Nacional%20de%20Costa%20Rica.pdf (accessed on July 1st, 2010).
� Nieto, A. 2009. INBio y CNFL exhiben la vivienda sostenible del futuro. Diario La Nación. Available at: http://wvw.nacion.com/ln_ee/2009/febrero/04/aldea1863192.html (accessed on August 24th, 2010).
� OLADE, 2010. Mercados Energéticos en América y el Caribe. Available at:
http://www.fiesp.com.br/publicacoes/pdf/energia/panorama-de-energia-2010-espanhol-internet.pdf (accessed on November 23rd, 2010).
� OLADE, 2010. SIEE: Sistema de Información Económica – Energética. Updated:
10/09/2010. Available at: http://siee.olade.org (accessed on November 23rd, 2010).
� PNUD, 2005. Programa Nacional de Electrificación Rural con Fuentes de Energía
Renovables. Available at: http://www.pnud.or.cr/index.php ?option=com_content&view=article&id=142:programa-nacional-de-electrificaciural-con-fuentes-de-energrenovables&catid=28:ambiente-energia-y-gestion-de-riesgo (accessed on July 1st, 2010).
� Programa Estado de la Nación, 2009. XV Informe del Estado de la Nación en
Desarrollo Humano Sostenible. San José, Costa Rica: Programa Estado de la Nación.
� Programa Estado de la Nación, 2010. Estadísticas. Available at:
http://www.estadonacion.or.cr/index.php/estadisticas (accessed on June 18th, 2010).
� Villareal, J.D., 2008. Chirripó se conecta al mundo. Diario Al Día. Available at: http://www.aldia.cr/ad_ee/2008/febrero/24/nacionales1437258.html (accessed on July 15th, 2010)
Interviews3
• Alberto Ramírez Quiros. General Director. UEN – ICE.
3 Interviewer: Francisco Naranjo Aguilar. CEGESTI Consultant.

101
Case of Costa Rica – Part I and II
• Alexandra Arias Alvarado. Customer Service Unit in the Energy Conservation Area, ICE.
• Alfonso Herrera Herrera. Energy Efficiency Department. Compañía Nacional de Fuerza y Luz.
• Bernal Valderramos. Parque Nacional Chirripó Administrator.
• Giancarlo Coghi. Owner and manager of SERMIDE.
• Gloria Villa. Director, Dirección Sectorial de Energía (DSE).
• Henry Solís Bolaños. Director, Dirección Conservación de la Energía. Compañía Nacional de Fuerza y Luz
• Ingrid Redondo. Customer Service at self-sufficient house at INBioparque. Compañía Nacional de Fuerza y Luz
• Irene Cañas. Project coordinator. Centro Nacional de Planificación Eléctrica.
• Jesús Sánchez Ruíz. Director. Customer Service Unit at UEN – ICE.
• José Antonio Conejo Badilla. Technical Support at UEN – ICE.
• Luis Diego Ramírez Rodríguez. Renewable Energy Rural Electrification Programme. Customer Service. ICE.
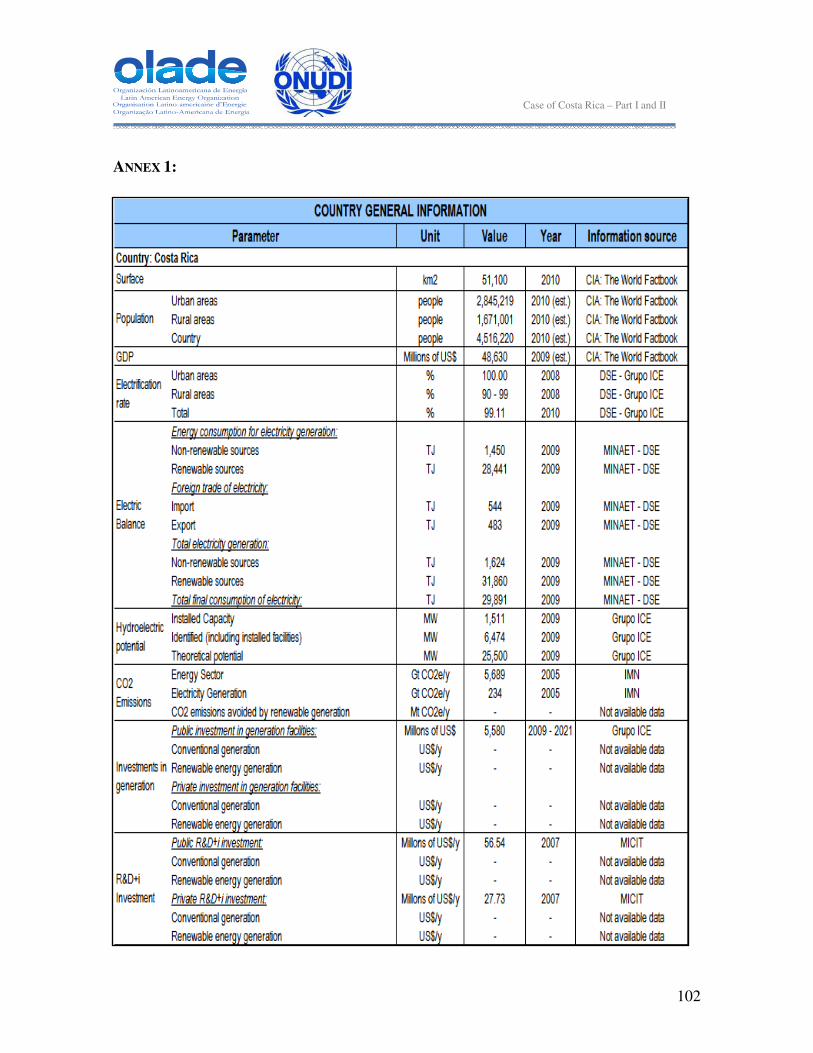
102
Case of Costa Rica – Part I and II
ANNEX 1:

103
Case of Costa Rica – Part I and II
ANNEX 2:
SAN ANTONIO SOLAR PLANT TYPE OF ENERGY: SOLAR PHOTOVOLTAIC
Parameter Units Information Country Costa Rica
Installation Name San Antonio Solar Plant
Location San José
Type of technology Solar Photovoltaic
Date of entry into operation October 2009
Service type (public, private) Public
Legal status Public
Contact person Ing. Jose Antonio Conejo
Reference year Acumulated
Nominal Power kW 9.54 kW
Effective Power MW No available info
Generated electricity MWh 11.23
% of energy sold / delivered to public service 100%
Facility Factor No available info
Efficiency No available info
Source of energy Solar
Source 1 Solar
Source 1 consumption at reference year Not applicable
Source 2 Not applicable
Source 2 consumption at reference year Not applicable
Investment US$ 80.925
Operational costs US$/year No available info
Price of energy sold US$/KWh 0.087
Avoided CO2 emissions tCO2/year No available info
Short description Solar photovoltaic system at the roof of the thermal plant in San Antonio.
Relevant aspects that make the installation relevant for a case study
It is not consider important for a case study
Information sources Adriana Víquez G. ICE. Tel: 2220-7666
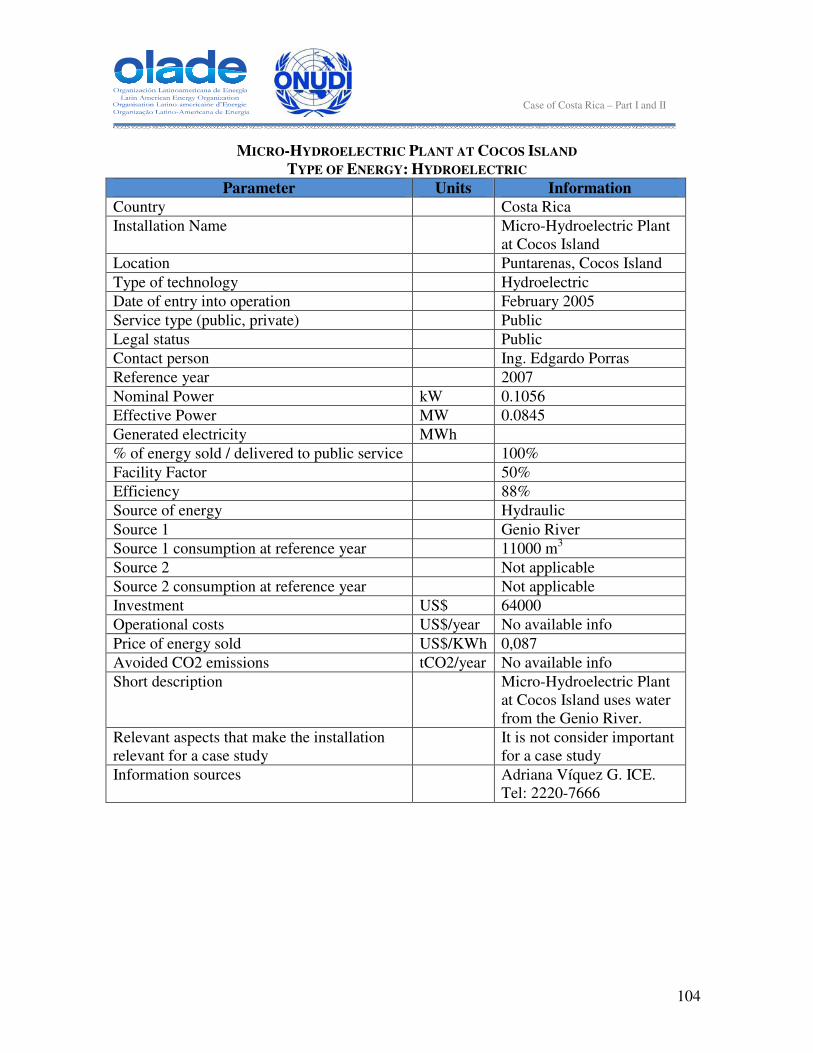
104
Case of Costa Rica – Part I and II
MICRO-HYDROELECTRIC PLANT AT COCOS ISLAND TYPE OF ENERGY: HYDROELECTRIC
Parameter Units Information Country Costa Rica
Installation Name Micro-Hydroelectric Plant at Cocos Island
Location Puntarenas, Cocos Island
Type of technology Hydroelectric
Date of entry into operation February 2005
Service type (public, private) Public
Legal status Public
Contact person Ing. Edgardo Porras
Reference year 2007
Nominal Power kW 0.1056
Effective Power MW 0.0845
Generated electricity MWh
% of energy sold / delivered to public service 100%
Facility Factor 50%
Efficiency 88%
Source of energy Hydraulic
Source 1 Genio River
Source 1 consumption at reference year 11000 m3
Source 2 Not applicable
Source 2 consumption at reference year Not applicable
Investment US$ 64000
Operational costs US$/year No available info
Price of energy sold US$/KWh 0,087
Avoided CO2 emissions tCO2/year No available info
Short description Micro-Hydroelectric Plant at Cocos Island uses water from the Genio River.
Relevant aspects that make the installation relevant for a case study
It is not consider important for a case study
Information sources Adriana Víquez G. ICE. Tel: 2220-7666
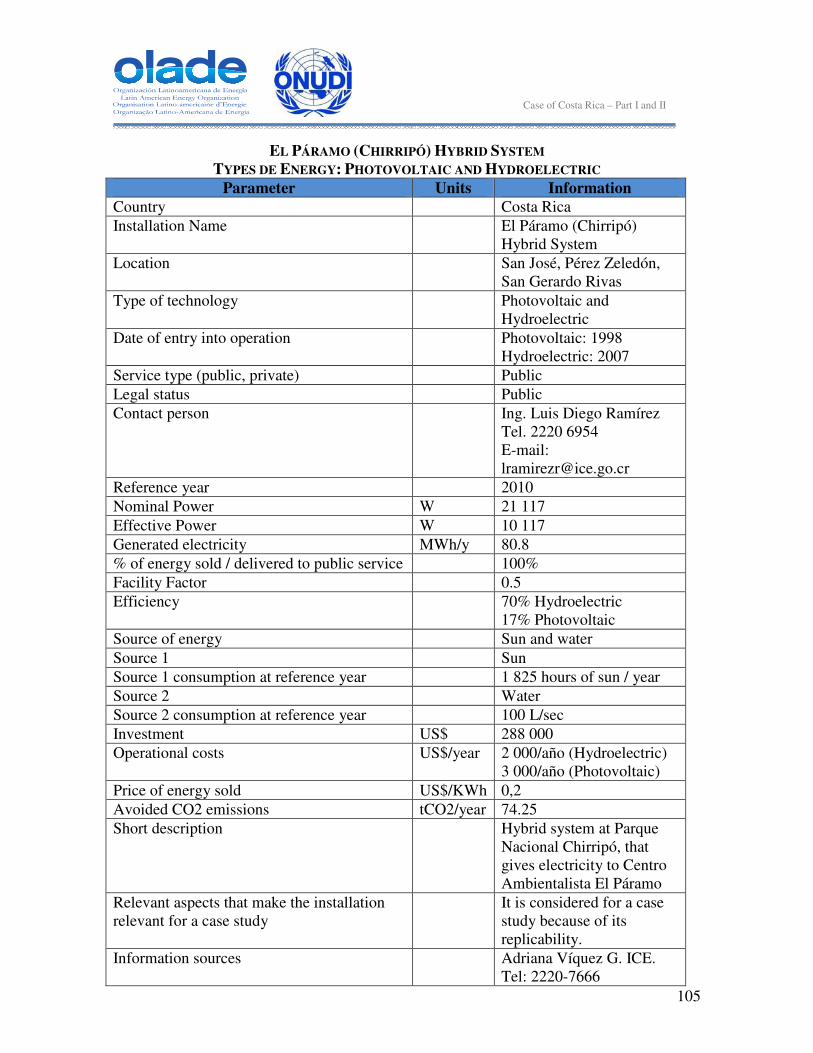
105
Case of Costa Rica – Part I and II
EL PÁRAMO (CHIRRIPÓ) HYBRID SYSTEM TYPES DE ENERGY: PHOTOVOLTAIC AND HYDROELECTRIC
Parameter Units Information Country Costa Rica
Installation Name El Páramo (Chirripó) Hybrid System
Location San José, Pérez Zeledón, San Gerardo Rivas
Type of technology Photovoltaic and Hydroelectric
Date of entry into operation Photovoltaic: 1998 Hydroelectric: 2007
Service type (public, private) Public
Legal status Public
Contact person Ing. Luis Diego Ramírez Tel. 2220 6954 E-mail: [email protected]
Reference year 2010
Nominal Power W 21 117
Effective Power W 10 117
Generated electricity MWh/y 80.8
% of energy sold / delivered to public service 100%
Facility Factor 0.5
Efficiency 70% Hydroelectric 17% Photovoltaic
Source of energy Sun and water
Source 1 Sun
Source 1 consumption at reference year 1 825 hours of sun / year
Source 2 Water
Source 2 consumption at reference year 100 L/sec
Investment US$ 288 000
Operational costs US$/year 2 000/año (Hydroelectric) 3 000/año (Photovoltaic)
Price of energy sold US$/KWh 0,2
Avoided CO2 emissions tCO2/year 74.25
Short description Hybrid system at Parque Nacional Chirripó, that gives electricity to Centro Ambientalista El Páramo
Relevant aspects that make the installation relevant for a case study
It is considered for a case study because of its replicability.
Information sources Adriana Víquez G. ICE. Tel: 2220-7666

106
Case of Costa Rica – Part I and II
MIRAVALLES GEOTHERMAL PLANT TYPO OF ENERGY: GEOTHERMAL
Parameter Units Information Country Costa Rica Installation Name Miravalles Location Guanacaste, Bagases Type of technology Geothermal Date of entry into operation January 2004 Service type (public, private) Public Legal status Public Contact person Ing. Omar Castro Castro
Reference year 2009 Nominal Power kW 18,07 Effective Power MW 15.5 Generated electricity MWh 671.358 (6 years) % of energy sold / delivered to public service 100%
Facility Factor 62.59% Efficiency No available info Source of energy Geothermal Source 1 Geothermal Source 1 consumption at reference year Not applicable Source 2 Not applicable Source 2 consumption at reference year Not applicable Investment US$ 25.000.000 Operational costs US$/year 5 845 300 Price of energy sold US$/KWh 0,087 Avoided CO2 emissions tCO2/year No available info Short description It is a geothermal Project
located at the Miravalles Volcano.
Relevant aspects that make the installation relevant for a case study
It is not considered for a case study. It is too expensive and has high maintenance costs.
Information sources Adriana Víquez G. ICE. Tel: 2220-7666

107
Case of Costa Rica – Part I and II
BIOMASS PROJECT AT EL VIEJO MILL TYPE OF ENERGY: BIOMASS COGENERATION
Parameter Units Information Country Costa Rica
Installation Name El Viejo Sugar Mill
Location Guanacaste
Type of technology Biomass Cogeneration
Date of entry into operation 1990
Service type (public, private) Private
Legal status Corporation
Contact person
Reference year 2009
Nominal Power kW 22
Effective Power MW 22
Generated electricity MWh 55.48
% of energy sold / delivered to public service 57.3 %
Facility Factor No available info
Efficiency No available info
Source of energy Biomass
Source 1
Source 1 consumption at reference year 23134 tons in 121 days
Source 2 Not applicable
Source 2 consumption at reference year Not applicable
Investment US$ 10.000.000
Operational costs US$/year 60.000
Price of energy sold US$/KWh 0.071
Avoided CO2 emissions tCO2/year No available info
Short description Generation of energy by burning bagasse in boilers to produce high pressure steam used in turbines for windmills and turbine generators to produce electrical energy required by the mill. The exhaust steam turbines used in the operations of evaporation and baking sweetened juices. A portion of electricity is sold and another is used in the process.
Relevant aspects that make the installation relevant for a case study
It is not considered for a case study.
Information sources Ing. Xochitl Barboza G.

108
Case of Costa Rica – Part I and II
Tel: (506) 2688-8000 ext 2294. Fax: (506) 2688-7364
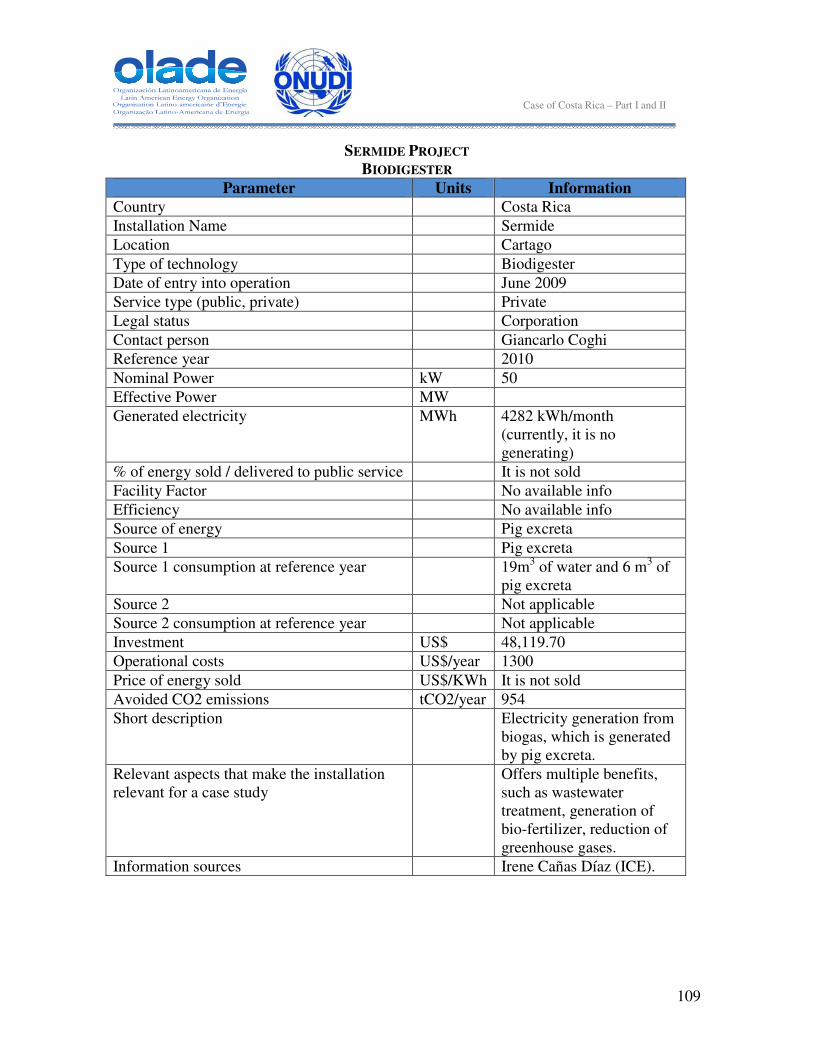
109
Case of Costa Rica – Part I and II
SERMIDE PROJECT BIODIGESTER
Parameter Units Information Country Costa Rica
Installation Name Sermide
Location Cartago
Type of technology Biodigester
Date of entry into operation June 2009
Service type (public, private) Private
Legal status Corporation
Contact person Giancarlo Coghi
Reference year 2010
Nominal Power kW 50
Effective Power MW
Generated electricity MWh 4282 kWh/month (currently, it is no generating)
% of energy sold / delivered to public service It is not sold
Facility Factor No available info
Efficiency No available info
Source of energy Pig excreta
Source 1 Pig excreta
Source 1 consumption at reference year 19m3 of water and 6 m3 of pig excreta
Source 2 Not applicable
Source 2 consumption at reference year Not applicable
Investment US$ 48,119.70
Operational costs US$/year 1300
Price of energy sold US$/KWh It is not sold
Avoided CO2 emissions tCO2/year 954
Short description Electricity generation from biogas, which is generated by pig excreta.
Relevant aspects that make the installation relevant for a case study
Offers multiple benefits, such as wastewater treatment, generation of bio-fertilizer, reduction of greenhouse gases.
Information sources Irene Cañas Díaz (ICE).
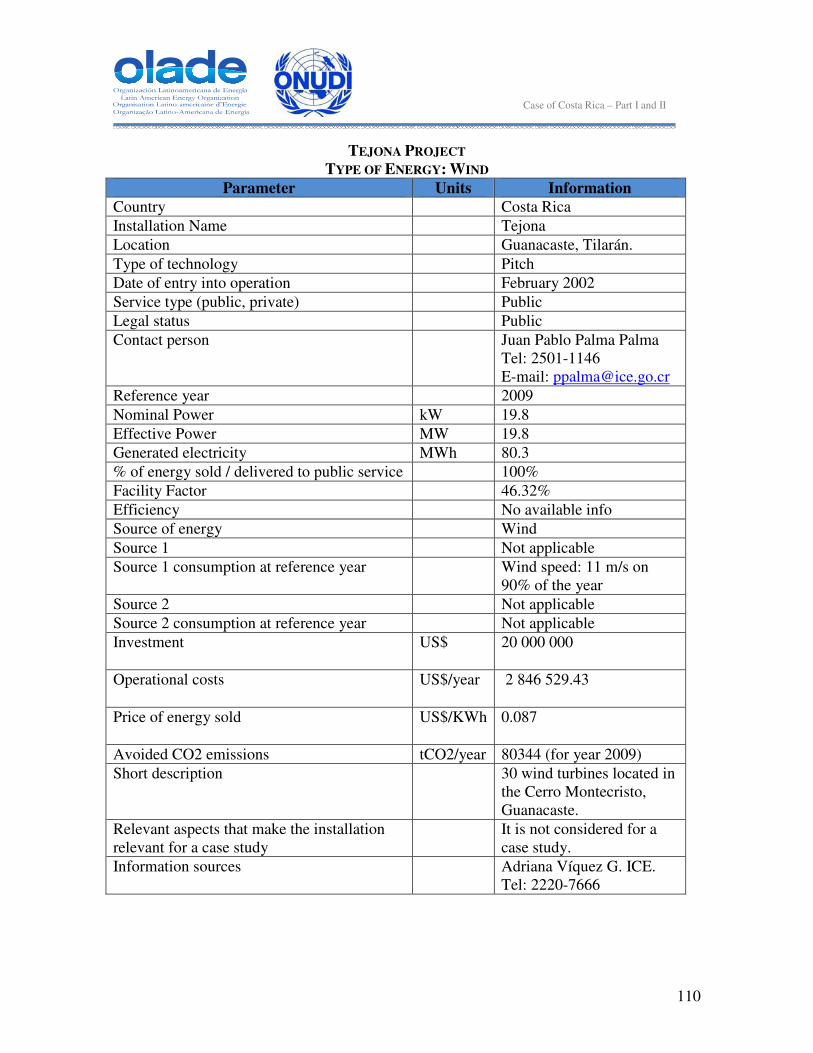
110
Case of Costa Rica – Part I and II
TEJONA PROJECT TYPE OF ENERGY: WIND
Parameter Units Information Country Costa Rica
Installation Name Tejona
Location Guanacaste, Tilarán.
Type of technology Pitch
Date of entry into operation February 2002
Service type (public, private) Public
Legal status Public
Contact person Juan Pablo Palma Palma Tel: 2501-1146 E-mail: [email protected]
Reference year 2009
Nominal Power kW 19.8
Effective Power MW 19.8
Generated electricity MWh 80.3
% of energy sold / delivered to public service 100%
Facility Factor 46.32%
Efficiency No available info
Source of energy Wind
Source 1 Not applicable
Source 1 consumption at reference year Wind speed: 11 m/s on 90% of the year
Source 2 Not applicable
Source 2 consumption at reference year Not applicable
Investment US$ 20 000 000
Operational costs US$/year 2 846 529.43
Price of energy sold US$/KWh 0.087
Avoided CO2 emissions tCO2/year 80344 (for year 2009)
Short description 30 wind turbines located in the Cerro Montecristo, Guanacaste.
Relevant aspects that make the installation relevant for a case study
It is not considered for a case study.
Information sources Adriana Víquez G. ICE. Tel: 2220-7666
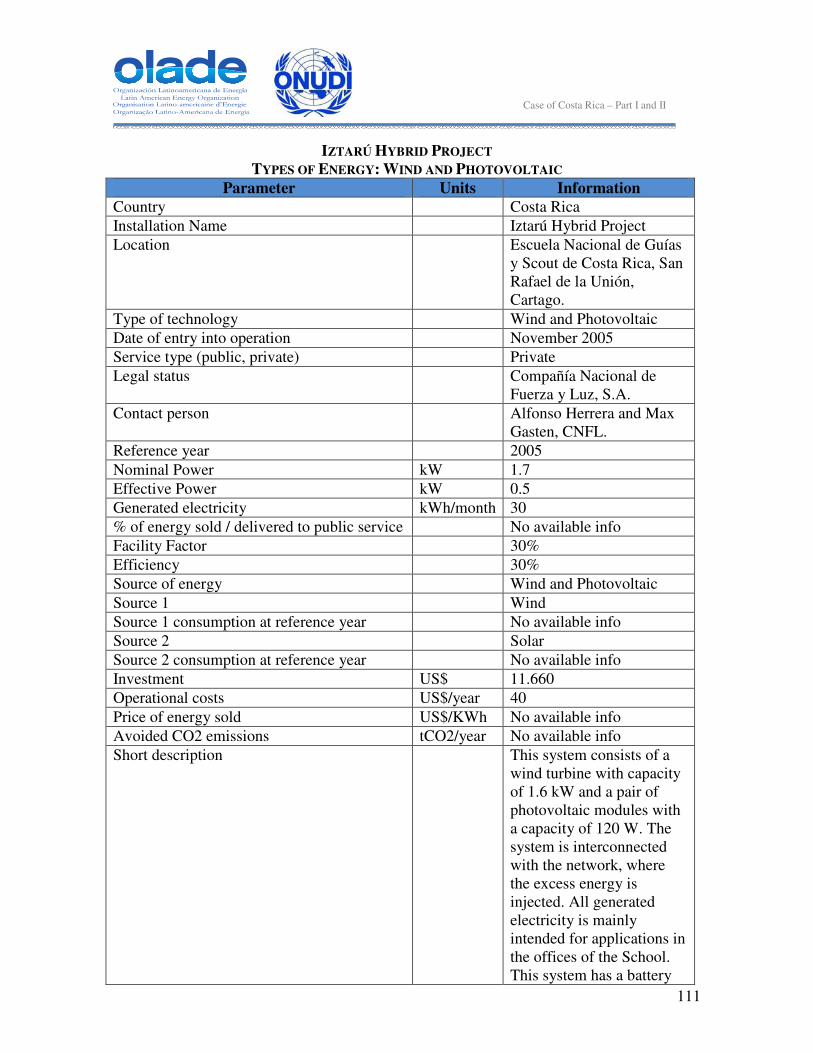
111
Case of Costa Rica – Part I and II
IZTARÚ HYBRID PROJECT TYPES OF ENERGY: WIND AND PHOTOVOLTAIC
Parameter Units Information Country Costa Rica
Installation Name Iztarú Hybrid Project
Location Escuela Nacional de Guías y Scout de Costa Rica, San Rafael de la Unión, Cartago.
Type of technology Wind and Photovoltaic
Date of entry into operation November 2005
Service type (public, private) Private
Legal status Compañía Nacional de Fuerza y Luz, S.A.
Contact person Alfonso Herrera and Max Gasten, CNFL.
Reference year 2005
Nominal Power kW 1.7
Effective Power kW 0.5
Generated electricity kWh/month 30
% of energy sold / delivered to public service No available info
Facility Factor 30%
Efficiency 30%
Source of energy Wind and Photovoltaic
Source 1 Wind
Source 1 consumption at reference year No available info
Source 2 Solar
Source 2 consumption at reference year No available info
Investment US$ 11.660
Operational costs US$/year 40
Price of energy sold US$/KWh No available info
Avoided CO2 emissions tCO2/year No available info
Short description This system consists of a wind turbine with capacity of 1.6 kW and a pair of photovoltaic modules with a capacity of 120 W. The system is interconnected with the network, where the excess energy is injected. All generated electricity is mainly intended for applications in the offices of the School. This system has a battery

112
Case of Costa Rica – Part I and II
bank that serves as backup for the power network.
Relevant aspects that make the installation relevant for a case study
It is not considered for a case study.
Information sources Alfonso Herrera Herrera CNFL
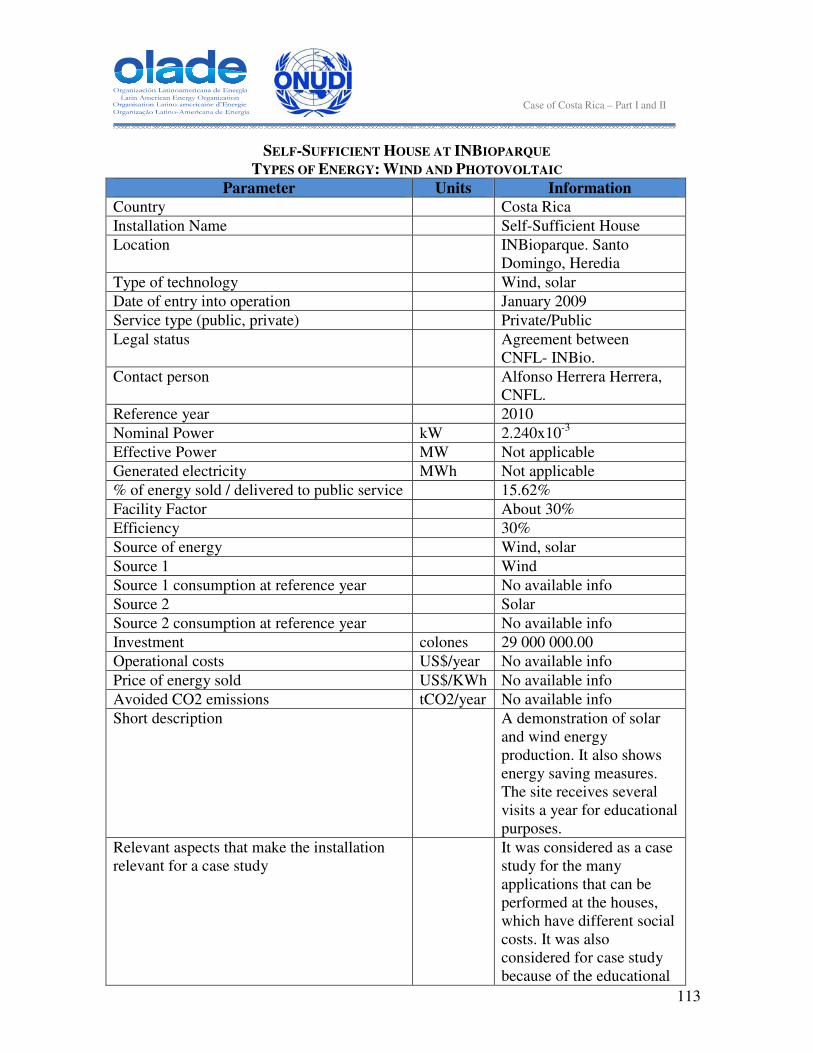
113
Case of Costa Rica – Part I and II
SELF-SUFFICIENT HOUSE AT INBIOPARQUE TYPES OF ENERGY: WIND AND PHOTOVOLTAIC
Parameter Units Information Country Costa Rica
Installation Name Self-Sufficient House
Location INBioparque. Santo Domingo, Heredia
Type of technology Wind, solar
Date of entry into operation January 2009
Service type (public, private) Private/Public
Legal status Agreement between CNFL- INBio.
Contact person Alfonso Herrera Herrera, CNFL.
Reference year 2010
Nominal Power kW 2.240x10⁻³
Effective Power MW Not applicable
Generated electricity MWh Not applicable
% of energy sold / delivered to public service 15.62%
Facility Factor About 30%
Efficiency 30%
Source of energy Wind, solar
Source 1 Wind
Source 1 consumption at reference year No available info
Source 2 Solar
Source 2 consumption at reference year No available info
Investment colones 29 000 000.00
Operational costs US$/year No available info
Price of energy sold US$/KWh No available info
Avoided CO2 emissions tCO2/year No available info
Short description A demonstration of solar and wind energy production. It also shows energy saving measures. The site receives several visits a year for educational purposes.
Relevant aspects that make the installation relevant for a case study
It was considered as a case study for the many applications that can be performed at the houses, which have different social costs. It was also considered for case study because of the educational

114
Case of Costa Rica – Part I and II
importance of the project.
Information sources Alfonso Herrera Herrera and Ingrid Redondo

115
Case of Costa Rica – Part I and II
LOS ANONOS PROJECT TYPE OF ENERGY: PHOTOVOLTAIC
Parameter Units Information Country Costa Rica
Installation Name Los Anonos Project
Location Compañía Nacional de Fuerza y Luz, S.A. Plantel Anonos, San José.
Type of technology Photovoltaic
Date of entry into operation March 2006
Service type (public, private) Private
Legal status Compañía Nacional de Fuerza y Luz, S.A.
Contact person Alfonso Herrera and Max Gasten
Reference year 2006
Nominal Power kW 7
Effective Power kW 3.5
Generated electricity kWh 41060
% of energy sold / delivered to public service 5%
Facility Factor 40%
Efficiency 30%
Source of energy Photovoltaic
Source 1 Solar
Source 1 consumption at reference year No available info
Source 2 51681
Source 2 consumption at reference year No available info
Investment US$ No available info
Operational costs US$/year No available info
Price of energy sold US$/KWh This system is composed of 88 photovoltaic modules with a capacity of 80 W each. Is interconnected with one of the load centers of the CNFL. It does not have backup batteries; the energy generated is consumed in the store or is fed into the electricity network.
Avoided CO2 emissions tCO2/year No available info
Short description Photovoltaic generation system.
Relevant aspects that make the installation relevant for a case study
It is not considered for a case study.

116
Case of Costa Rica – Part I and II
Information sources Alfonso Herrera Herrera

117
Case of Costa Rica – Part I and II
GARABITO THERMAL PLANT TYPE OF ENERGY: THERMAL
Parameter Units Information Country Costa Rica
Installation Name Garabito
Location Garabito de Montes de Oro, Puntarenas
Type of technology Thermal Plant
Date of entry into operation
October 2010
Service type (public, private)
Public
Legal status Grupo ICE
Contact person Adriana Víquez, Grupo ICE.
Reference year 2010
Nominal Power kW 200
Effective Power MW No available info
Generated electricity MWh 33 MW with 3 engines
% of energy sold / delivered to public service
No available info
Facility Factor About 38%
Efficiency 41-48%
Source of energy Bunker
Source 1 Bunker
Source 1 consumption at reference year
137 millions of liters per year
Source 2 Biodiesel
Source 2 consumption at reference year
0 (in the future it may use some biodiesel)
Investment US$ About 340 millions
Operational costs US$/year No available info
Price of energy sold US$/KWh 0,219
CO2 emissions tCO2/year It will emit about 2.728 tonseladas of CO24
Short description Thermal plan with 11 engines and 200 MW of installed capacity.
Relevant aspects that make the installation relevant for a case study
It is not considered for a case study.
Information sources www.grupoice.com, www.scriesgo.com/new_site/files/calif_1000_sp.pdf
4 www.nacion.com/2010-10-03/ElPais/NotaPrincipal/N03-GARA.aspx

118
Case of Costa Rica – Part I and II
PEÑAS BLANCAS HYDROELECTRIC PLANT TYPE OF ENERGY: HYDROELECTRIC
Parameter Units Information Country Costa Rica
Installation Name Peñas Blancas
Location San Ramón, Alajuela.
Type of technology Hydroelectric Plant
Date of entry into operation
August 2002
Service type (public, private)
Public
Legal status ICE
Contact person Adriana Víquez, ICE.
Reference year 2010
Nominal Power kW 37 740
Effective Power MW 35 400
Generated electricity MWh 155
% of energy sold / delivered to public service
100%
Facility Factor No available info
Efficiency No available info
Source of energy Water
Source 1 Río Peñas Blancas
Investment US$ 66 millions
Operational costs US$/year No complete information is available. But it is known that ICE pays $745.000 monthly for renting this plant.
Price of energy sold US$/KWh No available info
Avoided CO2 emissions
tCO2/year No available info
Short description This plant is part of the "Minimum Cost Generation Expansion Plan" sponsored by ICE. The main source of water is the Peñas Blancas river, this flow has a high annual rainfall of 4,600 mm and is protected by the Monteverde Biological Reserve.
Relevant aspects that make the installation relevant for a case study
It is not considered for a case study.
Information sources www.grupoice.com, www.scriesgo.com/new_site/files/calif_1000_sp.pdf